Embed Size (px)
Citation preview

Towards Structured Performance Analysis of Industry 4.0Workflow Automation Resources
Ajay KattepurEmbedded Systems and Robotics
TCS Research & Innovation, Bangalore, [email protected]
ABSTRACTAutomation and the use of robotic components within businessprocesses is in vogue across retail and manufacturing industries.However, a structured way of analyzing performance improve-ments provided by automation in complex workflows is still at anascent stage. In this paper, we consider the common Industry 4.0automation workflow resource patterns and model them withina hybrid queuing network. The queuing stations are replaced byscale up, scale out and hybrid scale automation patterns, to examineimprovements in end-to-end process performance. We exhaustivelysimulate the throughput, response time, utilization and operatingcosts at higher concurrencies using Mean Value Analysis (MVA)algorithms. The queues are analyzed for cases with multiple classes,batch/transactional processing and load dependent service demands.These solutions are demonstrated over an exemplar use case ofautomation in Industry 4.0 warehouse automation workflows. Astructured process of automation workflow performance analysiswill prove valuable across industrial deployments.
CCS CONCEPTS• Mathematics of computing → Queueing theory; • Appliedcomputing→Business processmodeling; Supply chainman-agement; • Computer systems organization→ Robotic com-ponents.
KEYWORDSWorkflow Resource Patterns; Queuing Network; Mean Value Anal-ysis; Industry 4.0 Warehouse Automation.
ACM Reference Format:Ajay Kattepur. 2019. Towards Structured Performance Analysis of Industry4.0 Workflow Automation Resources. In Tenth ACM/SPEC InternationalConference on Performance Engineering (ICPE ’19), April 7–11, 2019, Mumbai,India. ACM, New York, NY, USA, 8 pages. https://doi.org/10.1145/3297663.3309671
Permission to make digital or hard copies of all or part of this work for personal orclassroom use is granted without fee provided that copies are not made or distributedfor profit or commercial advantage and that copies bear this notice and the full citationon the first page. Copyrights for components of this work owned by others than ACMmust be honored. Abstracting with credit is permitted. To copy otherwise, or republish,to post on servers or to redistribute to lists, requires prior specific permission and/or afee. Request permissions from [email protected] ’19, April 7–11, 2019, Mumbai, India© 2019 Association for Computing Machinery.ACM ISBN 978-1-4503-6239-9/19/04. . . $15.00https://doi.org/10.1145/3297663.3309671
1 INTRODUCTIONIndustrial automation [1] has pervaded multiple industries withautonomous robots, Internet of Things (IoT) [2] and software sys-tems replacing human participants in the retail and manufacturingindustries. Industry 4.0 [3] has further emphasized these require-ments, with robotics and process automation systems intended toreplace mundane and repetitive industrial tasks. Integrating Ar-tificial Intelligence [4] into robotic automation is also mandated,which would enable autonomous and smart deployments.
One of these applications is in the warehouse inventory man-agement space [5], where routine tasks of procurement, productpicking and placement may be performed more efficiently by au-tonomous robots. Deployments using the Kiva System [6] by Ama-zon1, is one such example, which has shown to improve pickingefficiency in large warehouses. While these systems are readily inte-grated into traditional business processes [7], overall performanceimprovements are yet to be formally characterized. In addition,models which can handle traditional human participants, softwareautomation and robotics in an integrated framework are needed.
In this paper, we intend to study the end-to-end performanceimprovements provided by automation systems, when integratedinto traditional business processes [7]. We draw inspiration fromworkflow resource patterns [9], that model task creation, assign-ment and execution in workflows. While such models have beenproposed for software processes with human participants, we ex-tend these models for automation resources involving coordinationamong robotic agents, human participants and business processes.
Workflow resource patterns are used in conjunction with queu-ing network models [10] to accurately characterize the end-to-endperformance of complex processes. Using the example of an au-tomation workflow in Industry 4.0 warehouses, scenarios such asFirst-In-First-Out (FIFO) order fulfillment, batch processing, load de-pendency and dynamic variation in resource requirements are mod-eled. This is, in turn, studied with a hybrid queuing network thatcan handle multiple classes, load dependency and scaling up/out ofresource patterns. This queuing network is evaluated using MeanValue Analysis (MVA) [10] algorithms to estimate throughput, la-tency and resource bottlenecks under different conditions. This al-lows us to propose accurate resource patterns to maximize through-put or minimize cost under various operational conditions. Thishas to be extended to cases where automation resources may scaleup, scale out or hybrid scale in order to maintain execution for vary-ing demand rates. The use of MVA and queuing network modelsallows estimation of throughput and utilization levels at higherloads, which can lead to runtime adaptation.
1https://www.amazonrobotics.com/
Session 8: Runtime Adaptation ICPE ’19, April 7–11, 2019, Mumbai, India
189

We demonstrate these approaches on Industry 4.0 warehouseautomation systems, where picking and stowaway tasks may bereplaced with autonomous robotic elements. Using hybrid queu-ing network models, cases when transactional or batch jobs areprocessed by the warehouse are evaluated. Through simulations,it is seen that 100–200% improvements in throughput and 70% re-duction in cost per transaction handled by the warehouse, whenefficient automation workflow patterns are employed. Granularperformance analysis provides a systematic technique to studyautomation workflows.The Principal Contributions of this paper are:
(1) Systematic analysis of workflow resource models using anetwork of queuing centers.
(2) Thorough performance analysis when automation entailsparallel processing, superior service demands or delegationof workload.
(3) Mean Value Analysis for higher concurrency loads withmultiple classes, load dependent service demands and prob-abilistic completion rates considered.
(4) Accurate characterization of automation resource patterns,under various operational environments – leading to sug-gestions on scaling up/out.
(5) An Industry 4.0 warehouse automation case study, demon-strating structured performance improvements.
The rest of this paper is organized as follows: Section 2 provides anoverview of Industry 4.0 warehouse automation resources and au-tonomous robots that operate in them. Resource models using bothqueuing networks and workflow patterns are studied in Section3. The application of performance laws and Mean Value Analysistechniques to evaluate the queuing network models are describedin Section 4. In Section 5, simulations are performed to analyzesingle class and multi class models in warehouse deployments. Thisis followed by related work and conclusions of the paper.
2 INDUSTRY 4.0 AUTOMATIONIn this section, we provide an overview of activities involved inIndustry 4.0 warehouses and various order-fulfillment strategies.An overview of autonomous robots that are deployed in pickingand delivery tasks are also provided.
2.1 Industrial WarehousesMulti-party, multi-supplier warehouses [5] have been used in theretail and manufacturing industries as buffers for varying demands.In addition, they may serve ancillary activities such as packaging,labeling and localized distribution. Fig. 1 provides an overview ofvarious activities taking place in multi supplier warehouses. Stockprocurement deliveries are periodically received that may be put-away in forward or reserve locations. This stock is then consumedby orders that are periodically received. In such warehouses, it isimportant to analyze the end-to-end efficiency and throughput,when subjected to varying demand rates. Use of IoT and automa-tion systems may also be scaled up, depending on performancedeterioration in certain cases.
Receive UnitsReceive Units
Reserve StorageReserve Storage Forward StorageForward Storage
Receive OrderReceive Order ShipmentShipment
Sort / PackSort / Pack
Put-away
Put-away
Replenishment
OrderProcessing
Order Picking
Order Checking
Stock Procurement Orders Delivery
Inbound Operations Outbound Operations
Figure 1: Industrial Warehouse Operation Processes.
In Industry 4.0 warehouses [6][8], there is increased demandto make use of robots such as KUKA KMR 2 to automate taskssuch as put-away and order picking. Such robotic systems mayreplace or work hand-in-hand with human participants to completetasks. While significant work has gone into inventory and supplychain optimization [11], we intend to use the abstraction of roboticautomation components and workflow performance analysis tostudy warehouse operations. This combines both workflow pro-cesses with performance modeling allowing extensions to otherdeployments.
2.2 Robotic Automation AgentsIn order to model the robotic components in warehouses, we makeuse of the Intelligent Agent [4] abstraction. Typical agent actions, forinstance with a order picking robot in an Industry 4.0 warehouse,include:
(1) Goals: Understanding goals of each task and subtask, suchas, placing correct parts into correct bins within the giventime constraints.
(2) Perception: Object identification and obstacle detection usingcamera and odometry sensors that sense the robot’s envi-ronment.
(3) Actions: Identifying granular actionable subtasks, such as,moving to particular location, picking up parts of ordersor sorting objects. Constraints may be placed on the robotcapabilities, motion plans and accuracy in performing suchactions.
(4) Knowledge Base: The knowledge base coordinates the appro-priate action in relation to an individual robot’s perception.The knowledge base should also include descriptions of do-main ontology, task templates, algorithmic implementationsand resource descriptions.
In order to effectively study the effect of introducing such partici-pants on performance measures such as end-to-end throughput orlatency, a structured approach to model resource allocation in com-plex workflows are needed. These are modeled within a queuingnetwork, described next.
2https://www.kuka.com/en-in/products/mobility/mobile-robots/kmr-iiwa
Session 8: Runtime Adaptation ICPE ’19, April 7–11, 2019, Mumbai, India
190

Think Time
Order Checking, Delivery
Automation Queuing Stations
Scale Out Scale Up
S
Hybrid Scale
S
S
Order Processing, Replenishment
Put-away,Order Picking
Automation Candidate
Orders,StockProcurement
CompletionProbability p
1 – p
Figure 2: Queuing Network for Warehouse Automation.
3 RESOURCE MODELINGWe describe hybrid queuing network models that may be usedto model various stations in industrial warehouses. The stationsare mapped to workflow resource patterns, that formally describeworkflow execution tasks in industrial settings.
3.1 Queuing ModelQueuing network models [10] have often been used to model man-ufacturing, enterprise and software performance [12]. While bothopen and closed queues are used in particular domains, a hybridmodeling approach has been proposed in [13], that can handlecombinations of both these systems.
Fig. 2 provides a hybrid queuing networkmodel for activities thatare undertaken in automated warehouses (refer to Fig. 1). Note thatwe unify the order processing and replenishment activities withina singleM/G/1 queuing station, with orders causing reduction ininventory (−n products) and procurement/replenishment causingincrease in inventory (+m products). Further, the hybrid modelintroduces a completion probability p, that may be tuned dependingon warehouse deployments. A low value of p, resembles a closedqueuing network (for instance, when orders and procurements areprocessed as batches). High value of p resembles an open queuingnetwork (for instance, with first-in first-out transactional orders).An additional think time is incorporated into the model, that reflectsthe time spent in the system, without consuming resources.
While optimizing inventory levels to take care of varying de-mand has been well studied [5][11], we concentrate on replacingbottleneck queuing resources by superior queuing stations in Fig.2:
(1) Scale Out: This involves parallelizing tasks to multiple re-sources. For instance, if one human agent is handling tasks,this would mean adding more of similar agents to meet in-creasing demand.
(2) Scale Up: This involves replacing a queuing station with asuperior one (marked S⃝), such as a robotic picking agentwith higher individual throughput.
(3) Hybrid Scale: A hybrid approach that parallelizes tasks andreplaces a few of the agents with superior ones.
Task Created
Task Allocated
Resources Found
Task Started
Resources Bound (Push / Pull)
Task Completed
Completion
Task Failed
Failure
Re-assign Task
Figure 3: Workflow Task Creation, Allocation, Completion.
Such an approach for specifying scaling has been used in elasticcloud based infrastructures [14] to support auto-scaling features.The queuing stations are used for performance and operationalanalysis of the automation workflow resources.
3.2 Workflow Resource PatternsWorkflow resource patterns [9] have been proposed as an exhaus-tive list of patterns seen in task allocation in business processes [7].These patterns are used for task creation, allocation, monitoringand completion involving multiple modular components, typicallyobserved in workflow execution. Fig. 3 provides an overview ofactivities provided in resource modeling. Once a task is created(e.g. locate and pick a carton of cookies from warehouse), it may beallocated to one/many resources that may be humans or automa-tion robotic agents. The task may be allocated (push) or may bebid (pull) by resource agents available. These tasks can be individ-ually allocated to human participants or to robotic agents. Oncethe task is allocated to a robotic agent, it is able to analyze andidentify sub-tasks to complete the goal (using a knowledge base).Non-completed tasks may be re-allocated to other resources. Suchgranular decomposition of workflow tasks using intelligent roboticagents has been studied in [15].
Multiple patterns have been proposed in [9] to formally modelactivities in Fig. 3. To map the queuing stations in Fig. 2 to workflowresource patterns, we provide the analysis in Table 1. The individualtask creation, allocation, push/pull resources and detour patternsare mapped to our queuing stations. We comment on a few casesin Table 1:
(1) Default case: This is mapped toM/G/1 queuing stations inFig. 3. Task creation/allocation patterns in Table 1 that aretypically offered to a single resource are mapped to this case,for instance 1. Direct Allocation and 11. Automatic Execution.Execution and Detour patterns in Table 1 that are treatedin a single queuing station are also mapped here such as 32.Suspension-Resumption and 39. Chained Execution.
(2) Scale out case: This is mapped to multiple parallel queuingstations in Fig. 3 and handles concurrent resources. Table 1maps task creation patterns such as 5. Separation of Duties,push patterns such as 13. Distribution by Offer – Multiple Re-sources and execution/detour patterns such as 43. AdditionalResources.
(3) Scale up case: This is mapped to heterogeneous queuing sta-tions in Fig. 3, which can provide superior service demands.
Session 8: Runtime Adaptation ICPE ’19, April 7–11, 2019, Mumbai, India
191

Table 1: Workflow Resource Patterns [9] Mapped to Queuing Scale Up, Scale Out and Hybrid Scale Stations.QueuingStation
Task Creation, Task AllocationPatterns
Push Patterns Pull Patterns Task Execution, Detour Patterns
Default(M/G/1)
1. Direct Allocation11. Automatic Execution40. Configurable Unallocated WorkItem Visibility41. Configurable Allocated Work ItemVisibility
32. Suspension–Resumption33. Skip36. Commencement on Creation38. Piled Execution39. Chained Execution
Scale out
5. Separation of Duties6. Case Handling
13. Distribution by Offer – Multiple Re-sources16. Round Robin Allocation18. Early Distribution19. Distribution on Enablement20. Late Distribution
24. System-Determined WorkQueue Content
29. Deallocation30. Stateful Reallocation31. Stateless Reallocation37. Commencement on Allocation42. Simultaneous Execution43. Additional Resources
Scale up
3. Deferred Allocation7. Retain Familiar8. Capability-based Allocation9. History-based Allocation10. Organizational Allocation
12. Distribution by Offer – Single Re-source14. Distribution by Allocation – SingleResource15. Random Allocation
21. Resource-Initiated Alloca-tion22. Resource-Initiated Execu-tion – Allocated Work Item23. Resource-Initiated Execu-tion – Offered Work Item
29. Deallocation30. Stateful Reallocation31. Stateless Reallocation27. Delegation28. Escalation34. Redo35. Pre-Do
Hybrid scale 2. Role-Based Allocation4. Authorization
17. Shortest Queue 25. Resource-DeterminedWorkQueue Content26. Selection Autonomy
42. Simultaneous Execution43. Additional Resources27. Delegation28. Escalation34. Redo35. Pre-Do
Table 1 maps task creation patterns such as 8. Capability-based Allocation, push patterns such as 12. Distribution byOffer – Single Resource, pull patterns such as 21. Resource-Initiated Allocation and execution/detour patterns such as28. Escalation.
(4) Hybrid Scale case: This is mapped to a combination of mul-tiple and heterogeneous resources in Fig. 3. Table 1 mapstask creation patterns such as 2. Role-based Allocation, pullpatterns such as 25. Resource-Determined Work Queue Con-tent and execution/detour patterns such as 42. SimultaneousExecution.
Such mapping allows us to analyze the performance of complexworkflows, using the abstraction of our hybrid queuing model.Performance analysis of automation workflows, using the queuingstations, are analyzed next.
4 PERFORMANCE ANALYSISIn this section, we summarize a few of the performance laws thatare of interest in our analysis. This is followed by Mean ValueAnalysis (MVA) that are developed for single class, multi class, loaddependent, load independent and probabilistic completion rates.
4.1 Performance LawsIn order to perform operational analysis of our queuing models, wespecify the notations in Table 2. We briefly review them here; aninterested reader is referred to [10] for further details. Conceptssuch as throughput, service demand, latency and concurrency areincorporated into these metrics. Resources refer to human, roboticor software agents that are assigned tasks to be completed.◦ Utilization Law: Utilization is the fraction of time the re-source is busy.
Ui = Xi · Si (1)
Table 2: Notations for Performance Analysis.Symbol NotationQi Number of jobs in queuing station iUi Utilization of queuing station iXi Throughput of queuing station iRi Response time of queuing station iVi Average number of visits to queuing station iSi Service demand of queuing station iX Throughput of the systemN Average number of tasks in the queuing systemR Average response time of the queuing systemZ Mean think time of a task
◦ Service Demand Law: Total average service time spent atresource i , denoted Si .
Si =UiX
(2)
◦ Little’s Law: If there are N orders in the system, each withthink times Z (time waiting between interactions with thesystem) and the system processes at the throughput rate Xproducing a wait time R, the following relationship applies:
N = X · (R + Z) (3)
We make use of the service demand law and Little’s law in derivingservice demands required in proceeding sections.
4.2 Mean Value AnalysisMean value analysis (MVA) [10] has been applied with considerablesuccess in the case of closed queuing networks in order to predictperformance at higher work loads. We make use of mean valueanalysis models to analyze the performance of the queuing automa-tion models in Fig. 2. The exact MVA algorithm [10] starts with anempty network; it then increases the number of customers by 1 ateach iteration until there are the required number (N ) of customersin the system. For each queuing station k = 1, ...,K , the waitingtime Rk is computed using the static input service demands Sk and
Session 8: Runtime Adaptation ICPE ’19, April 7–11, 2019, Mumbai, India
192

Algorithm 1: Exact Mean Value Analysis (MVA) Algorithm, Single Class,Constant/Load Dependent Service Demand, Probabilistic Completion Rate.
Input: Set of queuing stations k ∈ K ; Corresponding Service demands Sk andVisit counts Vk ; Number of concurrent users N; Think time Z;Probability of task completion p
Output: Throughput Xn with increasing concurrency n ∈ N ; Response timeRn with increasing concurrency n ∈ N ;
1 for k ← 1 to K do2 Initialize queue at each station: Qk ← 03 Initialize utilization at each station: Uk ← 04 for n ← 1 to N do5 for k ← 1 to K do6 Response time at each station:
Rk ={Sk · (1 + Qk ), Load Independent CaseSk · f (U n
k ) · (1 + Qk ), Load Dependent Case
7 Total response times using visit counts: Rn =∑Kk=1 Vk · Rk
8 Throughput with Little’s Law: Xn =n
Rn + Z9 for k ← 1 to K do
10 Update queues at each station: Qk = (1 − p ) · Xn · Vk · Rk11 Update utilization at each station: Unk =
Qk1+Qk
12 return Xn , Rn , Unk
the number of jobs in the queue Qk . The system throughput is thencomputed using the sum of waiting times at each node and Little’slaw (eq. 3). Finally, Little’s law is applied to each queue to computethe updated mean queue lengths.
Algorithm 1 provides an outline of Mean Value Analysis appliedto single class models. This may be mapped to a single categoryof products handled by Industry 4.0 warehouses. Note that wecalculate the response time using two models (Line 6 in Algorithm1):
Rk =
Sk · (1 + Qk ), Load Independent CaseSk · f (U n
k ) · (1 + Qk ), Load Dependent Case(4)
where, the load independent case has constant service demand Sk ,while the load dependent case has service demands that vary asa function of utilization at each concurrent load level Sk · f (U n
k ).Load dependent service demands are particularly realistic whenhuman agents are involved, with superior service times seen withgreater demand loads [16]. We further introduce the probability ofcompletion p, which is used to append queue lengths during eachiteration (Line 10 in Algorithm 1):
Qk = (1 − p) · Xn ·Vk · Rk (5)
This allows us to simulate both closed (low p) and partially open(high p) queuing models (as in Fig. 2).
Algorithm 2 provides the Multi-Class MVA model, which makesuse of c classes of orders. This is crucial when there are multipletypes of orders having different rates and guarantee, while mak-ing use of shared resources. The queue length at each station is acombination of all the flows that are served (Line 12 in Algorithm2):
Qk = (1 − p) ·C∑c=1
Xnc ·Vc,k · Rc,k (6)
Algorithm 2: Exact Mean Value Analysis (MVA) Algorithm, Multi Class,Constant/Load Dependent Service Demand, Probabilistic Completion Rate.
Input: Set of queuing stations k ∈ K ; Corresponding Service demands Sk andVisit counts Vk ; Number of concurrent users N; Think time Z; Numberof classes C with population of each class n1, n2, ..., nC , Probability oftask completion p ;
Output: Throughput Xn with increasing concurrency n ∈ N ; Response timeRn with increasing concurrency n ∈ N ;
1 for k ← 1 to K do2 Initialize queue at each station: Qk ← 03 Initialize utilization at each station: Uk ← 0
4 for n ← 1 to∑Cc=0 Nc do
5 for c ← 1 to C do6 for k ← 1 to K do7 Response time at each station:
Rc,k ={Sc,k · (1 + Qk ), Load Independent CaseSc,k · f (U n
k ) · (1 + Qk ), Load Dependent Case
8 for c ← 1 to C do9 Total response times using visit counts: Rnc =
∑Kk=1 Vc,k · Rc,k
10 Throughput with Little’s Law: Xnc =nc
Rnc + Zc
11 for k ← 1 to K do12 Update queues at each station: Qk = (1 − p ) ·
∑Cc=1 X
nc · Vc,k · Rc,k
13 Update utilization at each station: Unk =Qk
1+Qk
14 return Xnc , Rnc , Unk
We analyze the performance of these systems using simulations inthe next section. We emphasize that these models combine both tra-ditional business process workflows with queuing network analysisand industrial robotic automation.
5 SIMULATION RESULTSIn order to study the performance improvements provided by au-tomation in warehouses, we employ simulation settings taken fromrealistic datasets. Based on the experimental data provided in [5],the following are typical time-frames in warehouse logistic opera-tions: Travel (55%), Item Search (15%), Item Extraction (10%) andAdditional Overheads (20%). Applying the experimental results in[8], which provides 35 seconds as the mean time for a picking robotsearch and extract feature, the mean time for for the end-to-endautomated pickup process is set at 140 seconds. This is an improve-ment over the mean time of 300 seconds taken by human agentsfor warehouse procurement [6]. Using these settings, we simulatethe hybrid queuing model in Fig. 2 with various queuing stations.These settings are used to analyze performance characteristics un-der various environments.
Table 3 provides the service demands that are used in our simu-lation setup, with the Default Order picking/put-away times beingset at 300 seconds. As specified in Fig. 2, Table 3 sets the ScaleUp service demand value to 140 seconds (representing automatedpickers), Scale Out with four (human) agents to 75 seconds andthe Hybrid Scale to a combination of humans and robotic entities.We use these settings to simulate the MVA Algorithms provided inAlgorithms 1 and 2 in Scilab3. We simulate various scenarios thatare typically seen in warehouse automation deployments.
3https://www.scilab.org/
Session 8: Runtime Adaptation ICPE ’19, April 7–11, 2019, Mumbai, India
193

Table 3: Mean Service Demands for Warehouse Activities.Queuing Station Default Scale Out Scale Up Hybrid Scale
Order Processing / Replenishment 60 sec. 60 sec. 60 sec. 60 sec.Put-away / Order Picking 300 sec. 75 sec. (4 agents) 140 sec. 150 sec. (2 agents), 70 sec. (2 agents)
Order Checking / Fulfillment 60 sec. 60 sec. 60 sec. 60 sec.Think Time 60 sec. 60 sec. 60 sec. 60 sec.
(a) Single Class, Load Independent Service Demands, p = 0.2. (b) Single Class, Load Independent Service Demands, p = 0.8.
(c) Load Dependent Service Demands. (d) Single Class, Load Dependent Service Demands, p = 0.2.
(e) Cost per Transaction for Load Dependent/Independent Ser-vice Demands. (f) Multi Class, Load Independent Service Demands, p = 0.2.
Figure 4: Performance Analysis of Warehouse Automation.
5.1 Single Class, Load Independent ServiceDemands
Algorithm 1 is simulated for a single class of items, with load in-dependent service demands. Fig. 4a provides the throughput, re-sponse time and bottleneck utilization for this network. We usep = 0.2, which represents a closed queuing model (orders primarilyprocessed in batches). We notice that while the throughput witha human agent operating order put-away/picking is 15 transac-tions/hour, this doubles with the scale up pattern (replacing witha robot automation framework). The best improvements are seenfour concurrent operators (scale-out), providing peak throughput of58 transactions/hour. While the default configuration can support
around 100 concurrent users, the scale up/hybrid scale patterns canhandle greater than 200 concurrent users.
The set-up is modified to a setting with p = 0.8 in Fig. 4b, rep-resenting a first-in first-out transactional process. We notice thatthe throughput and concurrency levels supported in Fig. 4b aresuperior to that of Fig. 4a. Superior improvements are seen withhybrid scale and scale out stations.
5.2 Single Class, Load Dependent ServiceDemands
In conventional computing systems, the service demands are notconstant, but rather, a function of the workload [16]. This may also
Session 8: Runtime Adaptation ICPE ’19, April 7–11, 2019, Mumbai, India
194

be practically seen in systems involving human agents, wherein,higher rates of work output are noticed with increased workloads.We model the function of service demands using Fig. 4c, with the300 seconds service demands tapering to 100 seconds, with higherconcurrent workloads.Wemust note here that sustained productionat lower service demands may not be feasible with humans agents,due to increased stress/fatigue levels. Robotic automation agents,however, should be able to handle the variations in service demandsfor prolonged periods.
Performance improvements with various resource patterns isseen in Fig. 4d, with the scale out pattern providing the highest im-provements. There are considerable deviations in the performancemeasures seen in Fig. 4a and 4b. So, dependent on the deploymentscenario, it will be crucial to select the best pattern for optimalperformance improvement.
Comparing the cost per transaction in Fig. 4e, (cost being in-versely proportional to service demands), we notice that variableservice demands outperform the traditional constant demand per-formance. This suggests that load dependent service demand gov-ernors may be more advantages in the case of autonomous roboticagents. We acknowledge that capital costs employed in setting upthe automation system has not been considered in this case.
5.3 Multi Class, Load Independent ServiceDemands
To simulate cases where multiple order “types” are processed bythe warehouse stations, we introduce forward orders (processedimmediately) and storage orders (processed in a delayed manner) asalso shown in Fig. 1. The mean service demands for storage ordersare set to double the values reported in Table 3. We notice that insuch multi-class models as well, there are improvements providedby scale out and hybrid scale patterns (Fig. 4f). While there maybe delays in think times that may be integrated into these models,this demonstrates that multi-class orders and suppliers may bestudied in this framework. Due to multi-class interactions, themaximum throughput is limited (half of what is seen in Fig. 4a),which consequently affects the response time.
5.4 Structured Resource Pattern AnalysisThrough our simulations, we can broadly classify the improvementsprovided through various resource patterns. Table 4 summarizesthe improvements provided by various resource patterns, per unitincrease in automation. We see that for single class models withconstant loads, throughput may be improved between 100 − 200%and latency∼ 60%while still reducing cost per transaction by∼ 70%.This improvement is higher in the case of load dependent, speciallywith the Scale Out pattern providing significant improvements inthroughput and cost per transaction. These can be linked to a cen-tral controller that can autoscale and modify patterns, such as thoseseem in elastic cloud deployments [14]. Rules for runtime adap-tation techniques, for instance based on monitored concurrencylevels, are given in the pseudo-code below (refers to the outputsprovided in Fig. 4b):Input Concurrency LevelCase based on Concurrency LevelConcurrency Level >= 100: Automation Resource Scale UpConcurrency Level >= 200: Automation Resource Scale Out
Concurrency Level >= 350: Automation Resource Hybrid ScaleDefault: Automation Resource Default
End Case
Such rules are a starting point to aid in automated runtime adapta-tion in Industry 4.0 deployments.
Mapping this back to Table 1, an efficient set of patterns toconsider in the Scale Out case would be: 5. Separation of Duties(Task allocation)→ 13. Distribution by Offer – Multiple Resources(Push Pattern) → 24. System-Determined Work Queue Content(Execution Pattern)→ 31. Stateless Reallocation (Detour Pattern).Similarly, for the Hybrid Scale case, the patterns to consider are: 2.Role-BasedAllocation (Task allocation)→ 25. Resource-DeterminedWork Queue Content (Pull Pattern)→ 42. Simultaneous Execution(Execution Pattern)→ 43. Additional Resources (Detour Pattern).
In summary, our work demonstrates the following:
(1) Systematic analysis of workflow resource models using map-ping between workflow patterns and queuing stations (Table1 and Fig. 2).
(2) Estimating performance at higher concurrency loads withmultiple classes, load dependent service demands and proba-bilistic completion rates using MVA algorithms (Algorithms1 and 2).
(3) Accurate characterization of automation resource patternsin Industry 4.0 deployments (Fig. 4).
(4) Identifying appropriate workflow resource patterns, that canimprove order delivery throughput, latency and cost pertransaction (Table 4).
Such accuratemodeling of automationworkflowswith performanceanalysis will prove crucial in the case of multiple industrial deploy-ments.
6 RELATEDWORKIndustry 4.0 [3] requires increased automation, autonomy and adap-tation among distributed entities working in factory/warehousingenvironments. A central entity for control and coordination in ware-houses has traditionally been the Warehouse Management System(WMS) [5]. However, with increased warehouse automation suchas those demonstrated with Amazon’s Kiva robots [6], processeswith heterogeneous participants and control flow are in vogue.Robot automation employed in Amazon’s warehouses has drasti-cally reduced procurement times from 60 minutes taken by humanparticipants to around 15 minutes. Automation has increased theinventory capacity/square foot by 50% and reduced operating costby 20% ($225 million/warehouse) [6].
Models for warehouse activities have been typically been fo-cused on inventory management, load balancing and supply chainoptimization [11]. While traditional warehouses only require or-chestration of business processes [7], automated warehouses in-clude intelligent robotic agents and IoT devices [4], requiring accu-rate workflow models. In industrial environments where softwareand (mobile) hardware components have tight interactions, suchworkflow specifications would involve intricate flow control andconcurrency issues. Petri net models of factory workflows are pre-sented in [17], using which properties such as liveness and deadlockfreeness are synthesized. In [18], an integrated database is proposedto analyze performance indicators in warehousing activities.
Session 8: Runtime Adaptation ICPE ’19, April 7–11, 2019, Mumbai, India
195
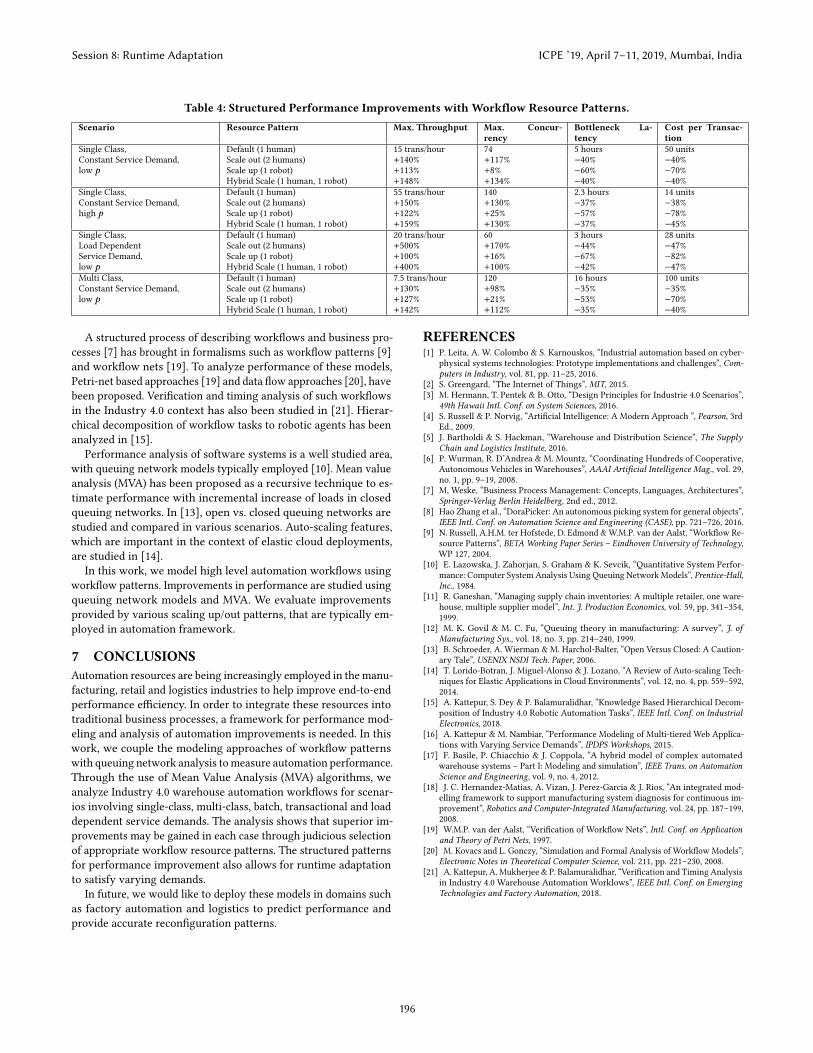
Table 4: Structured Performance Improvements with Workflow Resource Patterns.Scenario Resource Pattern Max. Throughput Max. Concur-
rencyBottleneck La-tency
Cost per Transac-tion
Single Class, Default (1 human) 15 trans/hour 74 5 hours 50 unitsConstant Service Demand, Scale out (2 humans) +140% +117% −40% −40%low p Scale up (1 robot) +113% +8% −60% −70%
Hybrid Scale (1 human, 1 robot) +148% +134% −40% −40%Single Class, Default (1 human) 55 trans/hour 140 2.3 hours 14 unitsConstant Service Demand, Scale out (2 humans) +150% +130% −37% −38%high p Scale up (1 robot) +122% +25% −57% −78%
Hybrid Scale (1 human, 1 robot) +159% +130% −37% −45%Single Class, Default (1 human) 20 trans/hour 60 3 hours 28 unitsLoad Dependent Scale out (2 humans) +500% +170% −44% −47%Service Demand, Scale up (1 robot) +100% +16% −67% −82%low p Hybrid Scale (1 human, 1 robot) +400% +100% −42% −47%Multi Class, Default (1 human) 7.5 trans/hour 120 16 hours 100 unitsConstant Service Demand, Scale out (2 humans) +130% +98% −35% −35%low p Scale up (1 robot) +127% +21% −53% −70%
Hybrid Scale (1 human, 1 robot) +142% +112% −35% −40%
A structured process of describing workflows and business pro-cesses [7] has brought in formalisms such as workflow patterns [9]and workflow nets [19]. To analyze performance of these models,Petri-net based approaches [19] and data flow approaches [20], havebeen proposed. Verification and timing analysis of such workflowsin the Industry 4.0 context has also been studied in [21]. Hierar-chical decomposition of workflow tasks to robotic agents has beenanalyzed in [15].
Performance analysis of software systems is a well studied area,with queuing network models typically employed [10]. Mean valueanalysis (MVA) has been proposed as a recursive technique to es-timate performance with incremental increase of loads in closedqueuing networks. In [13], open vs. closed queuing networks arestudied and compared in various scenarios. Auto-scaling features,which are important in the context of elastic cloud deployments,are studied in [14].
In this work, we model high level automation workflows usingworkflow patterns. Improvements in performance are studied usingqueuing network models and MVA. We evaluate improvementsprovided by various scaling up/out patterns, that are typically em-ployed in automation framework.
7 CONCLUSIONSAutomation resources are being increasingly employed in the manu-facturing, retail and logistics industries to help improve end-to-endperformance efficiency. In order to integrate these resources intotraditional business processes, a framework for performance mod-eling and analysis of automation improvements is needed. In thiswork, we couple the modeling approaches of workflow patternswith queuing network analysis to measure automation performance.Through the use of Mean Value Analysis (MVA) algorithms, weanalyze Industry 4.0 warehouse automation workflows for scenar-ios involving single-class, multi-class, batch, transactional and loaddependent service demands. The analysis shows that superior im-provements may be gained in each case through judicious selectionof appropriate workflow resource patterns. The structured patternsfor performance improvement also allows for runtime adaptationto satisfy varying demands.
In future, we would like to deploy these models in domains suchas factory automation and logistics to predict performance andprovide accurate reconfiguration patterns.
REFERENCES[1] P. Leita, A. W. Colombo & S. Karnouskos, “Industrial automation based on cyber-
physical systems technologies: Prototype implementations and challenges”, Com-puters in Industry, vol. 81, pp. 11–25, 2016.
[2] S. Greengard, “The Internet of Things”, MIT, 2015.[3] M. Hermann, T. Pentek & B. Otto, “Design Principles for Industrie 4.0 Scenarios”,
49th Hawaii Intl. Conf. on System Sciences, 2016.[4] S. Russell & P. Norvig, “Artificial Intelligence: A Modern Approach ”, Pearson, 3rd
Ed., 2009.[5] J. Bartholdi & S. Hackman, “Warehouse and Distribution Science”, The Supply
Chain and Logistics Institute, 2016.[6] P. Wurman, R. D’Andrea & M. Mountz, “Coordinating Hundreds of Cooperative,
Autonomous Vehicles in Warehouses”, AAAI Artificial Intelligence Mag., vol. 29,no. 1, pp. 9–19, 2008.
[7] M, Weske, “Business Process Management: Concepts, Languages, Architectures”,Springer-Verlag Berlin Heidelberg, 2nd ed., 2012.
[8] Hao Zhang et al., “DoraPicker: An autonomous picking system for general objects”,IEEE Intl. Conf. on Automation Science and Engineering (CASE), pp. 721–726, 2016.
[9] N. Russell, A.H.M. ter Hofstede, D. Edmond &W.M.P. van der Aalst, “Workflow Re-source Patterns”, BETA Working Paper Series – Eindhoven University of Technology,WP 127, 2004.
[10] E. Lazowska, J. Zahorjan, S. Graham & K. Sevcik, “Quantitative System Perfor-mance: Computer System Analysis Using Queuing Network Models”, Prentice-Hall,Inc., 1984.
[11] R. Ganeshan, “Managing supply chain inventories: A multiple retailer, one ware-house, multiple supplier model”, Int. J. Production Economics, vol. 59, pp. 341–354,1999.
[12] M. K. Govil & M. C. Fu, “Queuing theory in manufacturing: A survey”, J. ofManufacturing Sys., vol. 18, no. 3, pp. 214–240, 1999.
[13] B. Schroeder, A. Wierman & M. Harchol-Balter, “Open Versus Closed: A Caution-ary Tale”, USENIX NSDI Tech. Paper, 2006.
[14] T. Lorido-Botran, J. Miguel-Alonso & J. Lozano, “A Review of Auto-scaling Tech-niques for Elastic Applications in Cloud Environments”, vol. 12, no. 4, pp. 559–592,2014.
[15] A. Kattepur, S. Dey & P. Balamuralidhar, “Knowledge Based Hierarchical Decom-position of Industry 4.0 Robotic Automation Tasks”, IEEE Intl. Conf. on IndustrialElectronics, 2018.
[16] A. Kattepur & M. Nambiar, “Performance Modeling of Multi-tiered Web Applica-tions with Varying Service Demands”, IPDPS Workshops, 2015.
[17] F. Basile, P. Chiacchio & J. Coppola, “A hybrid model of complex automatedwarehouse systems – Part I: Modeling and simulation”, IEEE Trans. on AutomationScience and Engineering, vol. 9, no. 4, 2012.
[18] J. C. Hernandez-Matias, A. Vizan, J. Perez-Garcia & J. Rios, “An integrated mod-elling framework to support manufacturing system diagnosis for continuous im-provement”, Robotics and Computer-Integrated Manufacturing, vol. 24, pp. 187–199,2008.
[19] W.M.P. van der Aalst, “Verification of Workflow Nets”, Intl. Conf. on Applicationand Theory of Petri Nets, 1997.
[20] M. Kovacs and L. Gonczy, “Simulation and Formal Analysis of Workflow Models”,Electronic Notes in Theoretical Computer Science, vol. 211, pp. 221–230, 2008.
[21] A. Kattepur, A. Mukherjee & P. Balamuralidhar, “Verification and Timing Analysisin Industry 4.0 Warehouse Automation Worklows”, IEEE Intl. Conf. on EmergingTechnologies and Factory Automation, 2018.
Session 8: Runtime Adaptation ICPE ’19, April 7–11, 2019, Mumbai, India
196