Embed Size (px)
Citation preview
Global Partners of the Ellen MacArthur Foundation
2014
CIRCULAR ECONOMYTOWARDS THE
Accelerating the scale-up across global supply chains
3

Prepared in collaboration with the World Economic Forum and McKinsey & Company
Company Support
18 leading companies from the partnership networks of both the World Economic Forum and the Ellen MacArthur Foundation generously provided expert support to this research. They are listed below.
Members of theWorld Economic Forum
Strategic PartnersCisco*The Coca-Cola Company*Leighton Holdings LtdNestlé SAPhilips*Renault-Nissan BV*SAB Miller Plc*
Industry PartnersArup Group LtdB&Q Kingfisher Plc*Brightstar Corp.HeinekenRoyal DSMWesfarmers Limited
Global Growth CompaniesDesso Holding BV*Trina Solar Ltd
Members of the EllenMacArthur Foundation’sCircular Economy 100Hennes & Mauritz ABIKEARicohplus the companies above marked with*
Foreword Ellen MacArthur
Today’s ‘take-make-dispose’ economy has long relied on inputs of cheap and available resources to create conditions for growth and stability. Within the past decade, however,businesses have been hit by an increase in commodity prices that has effectively erased the (average) decline of the entire preceding century. Coupled with this, we expect three billion more middle-class consumers by 2030. This unprecedented rise in demand for a finite supply of resources calls into question our current predominantly linear economic system.
The concept of the circular economy is rapidly capturing attention as a way of decoupling growth from resource constraints. It opens up ways to reconcile the outlook for growth and economic participation with that of environmental prudence and equity. It is inspiring CEOs, politicians, engineers, designers and the next generation of leaders.
Our research highlights immediate and relatively easy-to-implement opportunities, analysing a number of specific examples. It uses current technologies and trends to estimate the materials cost savings of adopting a more restorative approach at over US$ 1 trillion p.a. by 2025, net of materials costs incurred during reverse-cycle activities.
We are now observing the evolution of circular business models as leading companies drive innovation across product design, development of product-to-service approaches and new materials recovery methods. These are demonstrating potential to disrupt the linear economy. A deeper and broader understanding of how to capture commercial value across supply chains from a very practical perspective is needed to accelerate and scale this trend.
The World Economic Forum’s report ‘Accelerating the scale-up across global supply chains’ report plays a crucial role in this market evolution by exploring how businesses can use the circular economy to drive arbitrage opportunities across complex, global supply chains. While examples of circular business models are emerging, significant materials leakages still persist. This report provides practical guidance on how businesses can address these leakage points to capture the value of the circular economy together with their partners—whether suppliers or wholesales/retailers—and consumers. The initiative outlined in this report, aims to make practical steps towards capturing this opportunity through the facilitation of pure materials flows, an important first move in the shift to a new economic model.
The circular economy provides a framework to both challenge and guide us as we rethink and redesign our future. I would like to express my thanks to the thought-leaders and business pioneers who have informed this thinking and helped make this work possible. These include our collaborator, the World Economic Forum and McKinsey & Company, which acted as project adviser and provided the analytics for this report, as well as representatives from leading businesses and experts who have contributed their extensive know-how.
I believe this to be one of the greatest opportunities of our time, and urge you to play your part in making it a reality.
Cowes, Isle of WightAugust 2013

02 | TOWARDS THE CIRCULAR ECONOMY
Global Partners of the Ellen MacArthur Foundation

Foreword by Ellen MacArthur
Acknowledgments
Preface by the World Economic Forum
Executive summary
1. The benefits of a circular economyThe limits of linear consumptionFrom linear to circular—Accelerating a proven conceptHow it works up close—Case examples of circular productsAn economic opportunity worth billions— Charting the new territory
2. Why the time to act is nowMounting pressure on resourcesFavourable alignment of enablers
3. What are the leakage points?Losses due to geographic dispersionLeakages due to materials complexity and proliferationTrapped in the linear lock-in
4. What are the solutions?Set up global reverse networksReorganise and streamline pure materials flowsInnovate demand-focused business modelsFocus on pure materials stock management at the outset
5. Joining forces to make the changeProject charterA clear plan of action
Glossary
Literature
Appendix 1: Returnable bottles—benefits of a local closed loop system
Appendix 2: Power drill—business case for circular business setup
List of figures
About the Ellen MacArthur Foundation
1
4
6
9
11121417
20
232428
353641
44
4748515960
636464
69
71
72
72
73
74
TOWARDS THE CIRCULAR ECONOMY | 03
Contents
04 | TOWARDS THE CIRCULAR ECONOMY
Acknowledgements
CORE PROJECT TEAM
Jamie Butterworth, CEO Ellen MacArthur Foundation
Andrew Morlet, Business Programme Lead, Ellen MacArthur Foundation
Hanh P. Nguyen, Project ManagerCatalysing the circular economy at scale, World Economic Forum (on secondment from McKinsey & Company)
Jeremy Oppenheim, Director, Global Leader Sustainability and Resource Productivity, McKinsey & Company
Martin Stuchtey, Director, Global Leader, Strategic Resources, McKinsey & Company
Elsa Studer, Project AssociateEnvironmental Initiatives, World Economic Forum
Helga Vanthournout, Expert, Waste and Resource Management, McKinsey & Company
Dominic Waughray, Senior Director,Environmental Initiatives, World Economic Forum
Markus Zils, Partner, Global Leader, Logistics and Supply Chain Solutions, McKinsey & Company
CONTRIBUTORS
Arup Group LtdFrancesca Galeazzi, Associate, SustainabilityChris Luebkeman, Director for Global Foresight and Innovation
B&Q/Kingfisher PlcAlex Duff, Corporate Affairs ManagerJames Walker, Head of Innovation
Biomimicry 3.8 InstituteJanine Benyus Co-founder
BrightStar Corp.Jesus Lebena, Vice President, Latin America Supply Chain & OperationsMaria Menacho, Chief of Staff
CiscoNeil Harris, Head of Sustainable Business
The Coca-Cola CompanyApril Crow, Global Sustainability Director, PackagingKatherine Schermerhorn, Communications Manager
Collaborative LabRachel Botsman, Founder
Desso Holding BVAlexander Collot d’Escury, CEOAnette Timmer, Director Marketing
Communications & C2CRudi Daelmans, Director of SustainabilityWillem Stas, Director of Operations
EcovativeSam Harrington, Marketing, Sales & LCA Director
ElectroluxMonica Celotto, Project Leader,Global Technology CenterKarl Edsjö, Project Manager,Environmental & European AffairsDaniele Gallo, Material Engineer,Global Technology Center
Ellen MacArthur FoundationJocelyn Blériot, Head of Editorial –European AffairsElla Jamsin, AnalystEllen MacArthur, FounderJames O’Toole, Global Partnerships ManagerKen Webster, Head of InnovationStuart Whitman, Programme Manager
EPEAMichael Braungart & Douglas Mulhall, Representatives of the Academic Chair, Cradle to Cradle for Innovation and Quality, Rotterdam School of Management, Erasmus University, as well as EPEA Internationale Umweltforschung
HeinekenRoland Verstappen, Global Director,Public Governmental Affairs
Hennes & Mauritz ABMikael Blommé, SustainabilityInnovation Responsible
I:COPaul Doertenbach, Global Account ManagerMax Schwilk, Project ManagerTamara Zwart, Head of I:CO Alliance
IKEASimon Henzell-Thomas, GroupSustainability Policy & StakeholderEngagement Manager
TOWARDS THE CIRCULAR ECONOMY | 05
Leighton HoldingsPatrick Brothers, Executive General Manager, Corporate Strategy
Ralf Dicke, General Manager of Corporate Strategy
Lend LeaseDavid Nieh, Head of China
McKinsey & CompanyZaid Ghazaleh, AssociateVasudha Gupta, Senior Analyst,Waste & Resource ManagementChris Musso, Expert Partner,Operations: Product DevelopmentKrista Ryu, Business AnalystSam Samdani, Senior KnowledgeExpert, Global Chemicals & AgricultureUlrich Weihe, Partner, EMEA Leader,Chemicals & AgricultureJohnson Yeh, Associate Partner,Clean Technologies
Nestlé SAClaus Conzelmann, Vice President,Head of Safety, Health &Environmental SustainabilityHerbert Oberhansli, Vice President,Economics & International Relations
PhilipsMarcel Alberti, Manager Group StrategyEmile Cornelissen, Head of SupplierSustainability & New Venture Integration Manager of Philips Group PurchasingRobert Metzke, Senior DirectorEcoVision Program
Renault-Nissan BVJean-Philippe Hermine, Environmental Director
Ricoh EuropeYasunori Naito, Manager,Environmental ManagementOlivier Vriesendorp, Director of Product Marketing
Ricoh UK Ltd.Philip Hawkins, Assistant General Manager, Business Strategy & Supply Chain Projects
SABMiller PlcAndre Fourie, SAB Head of Sustainable DevelopmentAndy Wales, SVP, Head of Sustainable Development
The University of YorkProf. James Clark, Green Chemistry
Trina Solar LtdJeffrey Fan, Corporate Communications DirectorJodie Roussell, Director of Public Affairs, Europe
VodafoneCasper Jorna, Manager Terminals SustainabilityMichael Just, Principal Manager New Business Development Terminals - Strategy & Business Development
Wesfarmers LimitedKate Chaney, Manager Sustainabilityand Community Partnerships
Worn AgainCyndi Rhoades, Closed LoopExecutive Officer
PRODUCTION
Editors: Gilian Crowther and TerryGilman, McKinsey & Company
Graphic designers: Robert Götzfriedand Karin Malinski, McKinsey & Company
Layout design: Kamal Kimaoui, World Economic Forum
Design: Yoren Geromin, Kissing Kourami
In addition, the project team expressesits gratitude to the following WorldEconomic Forum colleagues for theirsupport throughout the project:
Bosco Astarloa, Senior Community Manager, Head of Renewables Industry
Michelle Barrett, Community Manager, Information Technology Industry
Nathalie Chalmers, Senior Programme Manager, Environment & Sustainability
Marc Cuenod, Senior Strategic Partnership Associate
Tania Cullen, Associate Director, Partnership
Cristina Ferrer, Senior Community Associate, Consumer Industries
Andrew Hagan, Director, Head of Chemicals Industry
Antoine Hirschy, Senior Partnership Manager
Qin He, Associate Director, Telecommunications Industry
Thorsten Jelinek, Associate Director,Europe Membership
Hanseul Kim, Associate Director, Engineering & Construction Industry
Akshay Mohan, Associate Director,Science and Technology
Robin Ried, Associate Director,Infrastructure & UrbanDevelopment Industry
Eric Roland, Associate Director,Young Global Leaders
Sarah Shellaby, Community Manager, Consumer Industries
Elena Smirnova, Associate Director,Partnership
Lisa Sweet, Associate Director,Consumer Industries
Masao Takahashi, AssociateDirector, Head of Japan Membership
Bruce Weinelt, Director, Head of Telecommunication Industry
Tiffany West, Director, Head of Agriculture, Food & Beverage Industry
Chen Xiaochen, Senior CommunityManager, Centre for Global Growth Companies
Cheryl Yip, Associate Director,Partnership
economic impact of this change would be evident for business and consumers in both industrialised markets and fast-growing economies. Cheaper phones and washing machines are just two of a myriad of benefits that could swiftly materialise for tomorrow’s global consumers. For governments, this shift to circular economic activity could helpaddress the global job gap of 600 millionthat the International Trade Union Confederation forecasts by 2030 if business as usual continues.
But how can change be catalysed on such a scale? The economic gain can be realised only if multiple players across business and research communities come together and reconceive key materials flows and manufacturing processes, supported by policy-makers and investors. The transaction costs of shifting the status quo are extremelyhigh: no single entity can make this happen on its own. A large-scale, business-led collaboration is required.
At its Annual Meeting in Davos this year,the World Economic Forum hosted overseventy leaders from industry, government,academia and civil society to discuss exactly this problem: how can the circular economy be scaled up?
Many of the participants at this session were inspired by the work of the Ellen MacArthur Foundation, which has emphatically set out the trillion dollar economic case for a circular economy. Many had also been involved in the World Economic Forum Sustainable Consumption Initiative 2008 - 2012, or in other World Economic Forum communities,initiatives and global agenda councils focused on sustainability and circular economy issues. The Young Global Leaders (YGL) Circular Economy Innovation and New Business Models Taskforce is one example, or the Global Growth Companies SustainabilityChampions, Technology Pioneers, andthe Global Agenda Council for SustainableConsumption. The discussion also covered a wide range of national sustainable growth initiatives—notably the Dutch Sustainable Growth Coalition, and public sector institutions ranging from the European Commission to the Brazilian National Development Bank. A common thread ran through all of these groups: a critical mass of
The past two years have seen a surge in activity among business leaders to forge collaboration and shape new agendas on sustainable growth. The ‘circular economy,’ a term perhaps unfamiliar just a few years ago, has now also caught the imagination of thought-leaders across the world, and is taking shape as a viable, practical alternative to the current linear economic model.
A confluence of various global trends, statistics and fresh economic analysis has accelerated this agenda. Three billion middle-class consumers are expected to enter the global market by 2030, driving unprecedented demand for goods and services. Commodity prices overall rose by almost 150% from 2002 to 2010, erasing the real price declines of the last 100 years. Experts have calculated that without a rethink of how we use materials in our linear ‘take-make-dispose’ economy, elements such as gold, silver, indium, iridium, tungsten and many others vital for industry could be depleted within five to fifty years. If we remain in our ‘business as usual’ mode, price volatility will continue to surge, alongside the probable inflation of key commodities.
Business leaders are in search of a better hedge to avoid these risks, and are moving towards an industrial model that decouples revenues from material input: the circular economy.
The economic case for the circular economy is tangible. The cost of remanufacturing mobile phones could (for example) be reduced by 50% per device if the industry made handsets that were easier to take apart, improved the reverse cycle, and offered incentives to return devices that are no longer needed. High-end washing machines would be accessible for most households if they were leased instead of sold. Customers would save roughly a third per wash cycle, while manufacturers would earn roughly a third more in profits. The economic gain from materials savings alone is estimated at over a trillion US dollars a year. A shift to innovatively reusing, remanufacturing and recycling products could lead to significant job creation. 500,000 jobs have been created by the recycling industry in the EU alone.
In short, the economic case for shiftingto a circular economy is compelling. The
06 | TOWARDS THE CIRCULAR ECONOMY
PrefaceWorld Economic Forum
explosive growth in the coming decade), and carbon dioxide recovery. This latter initiative overturns the concept of CO2 as a pollutant, instead exploring how it could become a valuable economic asset for other businesses, serving as a feedstock for polymers and other materials currently dependent on oil.
We hope that bringing together experts from corporations and research organisations will generate a new wave of collaboration across industries and geographies to develop the blueprint for a large, steady and pure materials stream for each of the materialsselected. The aim is to ensure that all players can capture the value of multiple recycling and remanufacturing easily and quickly. The project will trigger action to implement the rollout, tracking the innovation, jobs, economic value and environmental gain that can be tapped as a result. The practical rolepolicy-makers, the R&D sector and investors can play to help accelerate the process and harness its economic benefits will be explored in parallel.
The initiative will support 24 months of activity across these various issues, involving task forces of senior executives and technicians as well as representatives from government, academia, investors and civil society from multiple geographies and sectors. Success factors at the end of this period will be threefold:
• A new list of pure signature materialstogether with their building blocks, conversion methods and reverse setup, co-designed and agreed informally by enough key parties around the world to change the global economy in that field
• Proof of concept in two or more signature materials categories, demonstrating how to make the change happen by working withleading businesses, their suppliers and customers of that material to anchor the new materials specifications
• A set of practical suggestions from all the stakeholders involved reflecting how they have learned to accelerate and enable the process in their particular field, and how they are benefiting from the resulting innovation.
leaders prepared to voice their desire for action, ready to ‘break pack,’ and eager to become first movers in scaling up the circular economy.
The plea to the World Economic Forum at that meeting was clear: given the compelling economic case for action, could the Forum help architect collaboration to scale up the circular economy?
I am delighted to say that this report andthe proposal for collaborative global action it contains is the response to the challenge set by those leaders who met in Davos in January. Based on extensive new research, this report sets out the business as well as the economic case for action, and identifies where industry leaders’ energy may best be focused to catalyse change. Over 30 business leaders and experts from the networks of the World Economic Forum’s leading companies and the Ellen MacArthur Foundation’s Global Partners and CE100 were interviewed in the course of this work, ensuring that any plan for action would have a sound, practical foundation.
The subsequent chapters in this report set out key areas of the research and its findings, and present a detailed plan of action.
The proposal focuses on materials and some aspects of product design—one of the four building blocks of a circular economy (the other three being new business models, global reverse networks, and enabling conditions). This is an important and practical starting point as it will enable creation of a new palette of materials for building a regenerative economy. Our core proposal is inspired by how a de-facto standard for polyethylene terephthalate (PET) in packaging has emerged across multiple beverage companies since the 1970s, driving the recycling and remanufacturing of PET products to a high degree. This proposal focuses on catalysing a similar outcome for a signature group of materials stocks that permeate our global supply chains: polymers (particularly polypropylene) and paper & cardboard are examples. Three future-focused signature materials will also be examined, noting how the global materials market is likely to change radically in the coming decades. These include bio-based materials (for packaging for example), materials for 3D printing (set for
TOWARDS THE CIRCULAR ECONOMY | 07
08 | TOWARDS THE CIRCULAR ECONOMY
PrefaceContinued
All the outcomes will be captured in a comprehensive report extrapolating the core economic case surrounding this change effort. As with all World Economic Forum initiatives, we will also convene a CEO-led steering board to govern and steer the work at a strategic level.
If successful, the project offers profoundimpact on scaling circular economy benefits. The collaborative waves across four to five materials flows has potential to trigger net benefits of at least US$500 million and 100,000 new jobs, as well as to avoid/valorise 100 million tonnes of materials waste within 5 years.
To realise this ambitious initiative, the World Economic Forum is delighted to have entered into collaboration with the Ellen MacArthur Foundation, and with the global management consulting firm McKinsey & Company, which acted as project adviser and provided the analytics for this report. The high level of input and enthusiasm from both the Ellen MacArthur Foundation and the McKinsey teams to drive the work forward has been exemplary, and lays a strong foundation for the collaboration ahead. Alongside the many to whom we owe our deepest thanks (detailed in the Acknowledgements), we are indebted most of all to Ellen MacArthur herself for championing this initiative, and for driving the circular economy agenda so passionately across and among the global business community.
The Forum would like to acknowledge the leadership and interest shown by so many of its industry members to help shape and drive the development of this work. Fifteen leading World Economic Forum’s Strategic Partners, Industry Partners and Global Growth Companies were interviewed to provide input for the report and help design the focus of the proposal. They are mentioned overleaf: the project team offers their sincerest thanks for the time and efforteach invested to assist this work.
The project team would also like to express its gratitude to the various New Champion communities of the World Economic Forum,
including the Young Global Leaders Circular Economic Initiative. It particularly extends its thanks to Peter Lacy and David Rosenberg, leaders of the YGL Circular Economy Taskforce, the Global Growth Company community, the Technology Pioneers, and the Social Entrepreneurs.
The work ahead will represent a trulycollaborative effort, and we look forwardto drawing on all the combined networksof the World Economic Forum and the Ellen MacArthur Foundation. I can think of no more appropriate stage for presenting the proposal and launching this initiative than the AnnualMeeting of the New Champions—the Forum’s ‘Summer Davos’ in China, which is taking place in Dalian this year.
I hope you enjoy the report and the proposal for action it contains, and we look forward to engaging with you on this pivotal initiative.
Dominic WaughraySenior Director,World Economic ForumGeneva, August 2013
TOWARDS THE CIRCULAR ECONOMY | 09
Executive summary
2. Circular supply chains are up and running— and they’ve gone global. The global secondary fibre stream for paper and cardboard is one example. The economics of such arbitrage opportunities are expected to improve as raw materials prices rise and the costs of establishing reverse cycles decline. Trends favouring lower costs and making it possible to close the reverse loop include urbanisation, which concentrates demand, allowing tighter forward and reverse cycles. Advanced tracking and treatment technologies also boost the efficiency of both forward and reverse logistics. Governments have started to provide stimuli, too: higher charges for landfill increase the competitiveness of circular products, and thus the arbitrage opportunities of setting up reverse cycle options.
3. Supply chains are the key unit of action, and will jointly drive change. In its most extreme manifestation, the global economy is a massive conveyor belt of material and energy from resource-rich countries to the manufacturing powerhouse China, and then on to destination markets in Europe and America where materials are deposited or—to a limited degree—recycled. This is the opposite of a loop. The materials leakage points and barriers to mainstreaming the new model of circular material flows in a globalised economy must now be addressed and overcome. This requires better understanding of the archetypes into which supply chains fall, and the three main barriers to change: geographic dispersion, materials complexity, and linear lock-in. Analysing the most advanced business cases confirms that a supply chain management approach which balances the forward and reverse loops and ensures uniform materials quality is critical to maximising resource productivity globally. The transition can begin once the hinge points are identified and acted upon in a concerted effort—across companies, geographies, and along the supply chain.
4. Defining materials formulations is the key to unlocking change. The materials list is exploding. A wide range of new additives is introduced each year, making post-use valorisation ever more demanding. The key is to tame materials complexity by defining and using a set of pure materials stocks at scale, designing out the leakages that hamper classification from the start. Reorganising and streamlining flows of pure materials will create arbitrage opportunities that generate economic benefits and make investments in reverse cycle setups profitable.
Business leaders and governments alike acknowledge that continued wealth generation requires a new industrial model that is less dependent on primary energy and materials inputs. In its previous reports, the Ellen MacArthur Foundation has focused on the economic and business benefits of such a circular model of development.
A collaboration between the World Economic Forum, the Ellen MacArthur Foundation and McKinsey & Company, this new report aims to reconcile the goal of scaling a circular model with the reality of a global economy and complex multi-tier supply chains. The key objective is to propose a very specific joint plan of action for industry leaders.
The challenge of closing materials loops and regenerating natural assets is an exponential function of product complexity and supply chain length. While more localised production is experiencing a robust renaissance in some economies, we cannot ignore nor fail to tap the power of global division of labour, specialisation and economies of scale. This report sets out to emphasise that the circular economy must hold its promise not merely to the village economy, but also to a globalised economy of nine billion by 2030. It presents the framework of circularity as a tangible driver of industrial innovations and value creation for the 21st century. In addition, it positions the concept for today’s global CEO as a practical business strategy to ‘hedge’ against the complex and interconnected risks of resource competition, commodity price volatility, new materials technologies and changing consumer demands. A number of key messages stand out:
1. The circular concept fosters wealth and employment generation against the backdrop of resource constraints. Circular business models will gain an ever greater competitive edge in the years to come because they create more value from each unit of resource than the traditional linear ‘take-make-dispose’ model. Accelerating the scale-up promises to deliver substantial macroeconomic benefits, as well as open up new opportunities for corporate growth. The materials saving potential alone is estimated at over a trillion dollars a year. The net employment opportunity is hard to estimate, and will largely depend on the labour market design. But even today, the job creation potential of remanufacturing globally and recycling in Europe already exceeds one million.
10 | TOWARDS THE CIRCULAR ECONOMY
Executive summaryContinued
5. Four materials categories are prime candidates for demonstrating viability. The potential building blocks for flagship projects are materials that are already sizeable and well understood, where a concerted effort by a few large players can create markets large enough to surpass the threshold value for viable circular arbitrage models. Each category is at a different stage of maturity in terms of circular setup and development, offering scope for credibly demonstrating viability across a wide spectrum.
• ‘Golden Oldies.’ These are well-established, high-volume recyclates with a remaining purity challenge. Paper and cardboard as a high-volume materials stream has high collection rates, but suffers from quality loss and ink contamination during the reverse cycle, resulting in an estimated US$ 32 billion in value lost annually. PET, glass, and steel also fall into this category.
• ‘High Potentials.’ Materials used in high volumes that currently lack systematic reuse solutions are polymers, for example. Collection rates are limited and separating out the materials/maintaining their quality and purity is hard due to the high fragmentation of formulae, supply chains and treatment technologies.
• ‘Rough Diamonds.’ These are large-volume by-products of many manufacturing processes, such as carbon dioxide and food waste. A broad set of valorisation technologies is emerging, however, that could provide additional value and displace virgin materials intake.
• ‘Future Blockbusters.’ A number of innovative materials have breakthrough potential, either from enabling substantial improvement of materials productivity (e.g. 3D printing), or having usage cycles that are fully restorative by design and intention (bio-based materials that can be returned to the biosphere).
6. Catalysing a series of “Trigger Projects” is the most effective way to reach tipping points for each category faster. Choosing a signature material from each category as an example will facilitate practical collaboration on the study of specific materials by different players across industries and geographies. Findings for one signature material at a systems level will often be highly transferable to other materials
in the same category. With proof of concept and initial flagship successes, stakeholders can roll out the solutions to other materials in that category much faster than trying to cover an entire category in one go. Agreement on their preferred formulations will in itself fast-track the scale-up of the circular economy, as well as open up exciting business opportunities.
7. Tangible outcomes can be achieved through joint action. A group of leading companies drawn from the combined networks of the World Economic Forum and the Ellen MacArthur Foundation acting in this collaborative agenda could speed up transition to the circular economy and achieve tangible outcomes. The initiative would aspire to enable its participants to realise the rewards of becoming first-movers: capturing the value of the circular economy. For example, the four to five waves established in such a project would aim to reap net benefits of at least US$ 500 million and 100,000 new jobs, as well as to avoid/valorise 100 million tonnes of materials waste within 5 years. A further goal would be to form a group of pioneers who would jointly build the ability to tap resource productivity as a new source of 21st century competitiveness. The initiative would require coordination across multiple stakeholders to facilitate systemic change, which is where the Forum and Foundation will have the most impact. The initiative should be able to create a preferred list of pure, high-quality materials with cross-industry applications to aggregate volume and enhance stock valorisation. It should also be possible to arrive at a proof-of-concept result for two or more selected materials. In parallel, the initiative will define methods and systems enablers for achieving sustainable change in the medium- and long-term.
Together, the Forum and the Foundation will provide companies, governments, civil society and academic experts with a multi-stakeholder platform for collaboration across industry, regions and sectors on this crucial global project. Delivering on this agenda will reap huge rewards for businesses, individuals, and our planet. The downside of continuing on our current linear course is daunting, but the upside of making a switch now will be huge, for every one of us.

1The benefits of a circular economy
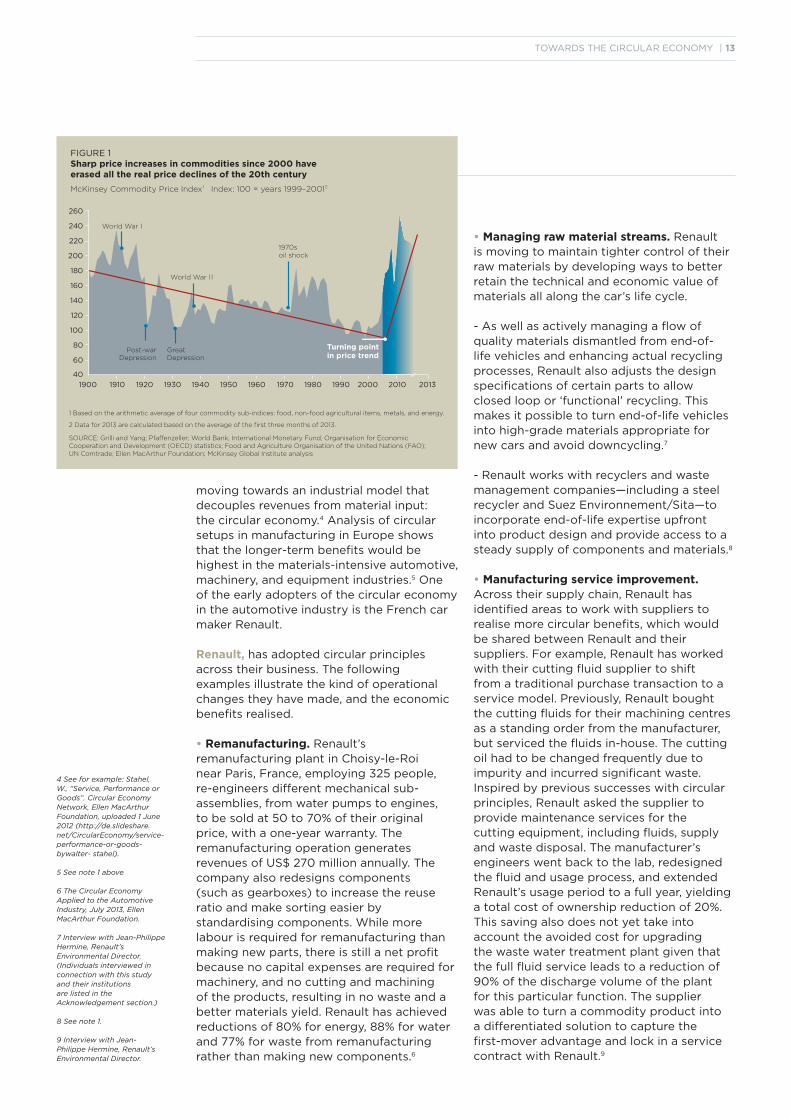
for certain sectors on the other. The turn of the millennium marked the point when real prices of natural resources began to climb upwards, essentially erasing a century’s worth of real price declines (Figure 1).
At the same time, price volatility levels for metals, food and non-food agricultural output in the first decade of the 21st century were higher than in any single decade in the 20th century.2 If no action is taken, high prices and volatility will likely be here to stay if growth is robust, populations grow and urbanise, and resource extraction costs continue to rise. With three billion new middle-class consumers expected to enter the market by 2030, price signals may not be strong or extensive enough to turn the situation around fast enough to meet this growth requirement.
Other trends indicate that the power of the linear model is reaching its limits:
• In modern manufacturing processes, opportunities to increase efficiency still exist, but the gains are largely incremental and insufficient to generate real competitive advantage or differentiation.
• An unintended consequence of eco-efficiency has been accelerating energy use and resource depletion due to the rebound effect which has negative impacts when improvements to energy and resource efficiency drive increases in the real amounts of materials and energy used.3
• Agricultural productivity is growing more slowly than ever before, and soil fertility and even the nutritional value of foods are declining.
• The risk to supply security and safety associated with long, elaborately optimised global supply chains appears to be increasing.
• Many production sites with excessive requirements for virgin resources—water, land or atmosphere—are struggling to renew their licence to operate as they compete in sensitive local resource markets.
Against this backdrop, business leaders are in search of a ‘better hedge’ and many are
Linear consumption is reaching its limits. A circular economy has benefits that areoperational as well as strategic, on both a micro and macroeconomic level. This is a trillion-dollar opportunity, with huge potential for innovation, job creation and economic growth.
The last 150 years of industrial evolution have been dominated by a one-way or linear model of production and consumption in which goods are manufactured from rawmaterials, sold, used and then discarded or incinerated as waste. In the face of sharp volatility increases across the global economy and proliferating signs of resource depletion, the call for a new economic model is getting louder. The quest for a substantial improvement in resource performanceacross the economy has led businesses to explore ways to reuse products or their components and restore more of theirprecious material, energy and labour inputs. A circular economy is an industrial system that is restorative or regenerative by intention and design. The economic benefitof transitioning to this new business model is estimated to be worth more than one trillion dollars in material savings.
The limits of linear consumption
Throughout its evolution and diversification, our industrial economy has hardly moved beyond one fundamental characteristic established in the early days of industrialisation: a linear model of resource consumption that follows a take-make-dispose pattern. Companies harvest and extract materials, use them to manufacture a product, and sell the product to a consumer, who then discards it when it no longer serves its purpose. This is truer now than ever. In terms of volume, some 65 billion tonnes of raw materials entered the economic system in 2010, and this figure is expected to grow to around 82 billion tonnes in 2020.1
Recently, many companies have also begun to notice that this linear system increases their exposure to risks—most notably higher resource prices and supply disruptions. More and more businesses feel squeezed between rising and less predictable prices in resource markets on the one hand and high competition and stagnating demand
12 | TOWARDS THE CIRCULAR ECONOMY
1. The benefits of a circular economy
1 Towards the Circular Economy 1: Economic and Business Rationale for an Accelerated Transition; January 2012, Ellen MacArthur Foundation.
2 Resource Revolution: Meeting the World’s Energy,Materials, Food, and Water Needs, November 2011,McKinsey Global Institute.
3 Lomberg, B., The Paradox of Efficiency, Carnegie Council, 2011.
TOWARDS THE CIRCULAR ECONOMY | 13
FIGURE 1 Sharp price increases in commodities since 2000 have erased all the real price declines of the 20th century
McKinsey Commodity Price Index1 Index: 100 = years 1999–20012
1 Based on the arithmetic average of four commodity sub-indices: food, non-food agricultural items, metals, and energy.
2 Data for 2013 are calculated based on the average of the first three months of 2013.
SOURCE: Grilli and Yang; Pfaffenzeller; World Bank; International Monetary Fund; Organisation for Economic Cooperation and Development (OECD) statistics; Food and Agriculture Organisation of the United Nations (FAO); UN Comtrade; Ellen MacArthur Foundation; McKinsey Global Institute analysis
•
•
•
•
•
260
240
220
200
180
160
140
120
100
80
60
40
1900 1910 1920 1930 1940 1950 1960 1970 1980 1990 2000 2010 2013
Turning pointin price trend
1970s oil shock
World War l
World War l l
Post-warDepression
GreatDepression
moving towards an industrial model that decouples revenues from material input: the circular economy.4 Analysis of circular setups in manufacturing in Europe shows that the longer-term benefits would be highest in the materials-intensive automotive, machinery, and equipment industries.5 One of the early adopters of the circular economy in the automotive industry is the French car maker Renault.
Renault, has adopted circular principles across their business. The following examples illustrate the kind of operational changes they have made, and the economic benefits realised.
• Remanufacturing. Renault’s remanufacturing plant in Choisy-le-Roi near Paris, France, employing 325 people, re-engineers different mechanical sub-assemblies, from water pumps to engines, to be sold at 50 to 70% of their original price, with a one-year warranty. The remanufacturing operation generates revenues of US$ 270 million annually. The company also redesigns components(such as gearboxes) to increase the reuse ratio and make sorting easier by standardising components. While morelabour is required for remanufacturing than making new parts, there is still a net profit because no capital expenses are required for machinery, and no cutting and machiningof the products, resulting in no waste and a better materials yield. Renault has achieved reductions of 80% for energy, 88% for water and 77% for waste from remanufacturing rather than making new components.6
• Managing raw material streams. Renault is moving to maintain tighter control of their raw materials by developing ways to better retain the technical and economic value ofmaterials all along the car’s life cycle.
- As well as actively managing a flow of quality materials dismantled from end-of-life vehicles and enhancing actual recycling processes, Renault also adjusts the design specifications of certain parts to allow closed loop or ‘functional’ recycling. This makes it possible to turn end-of-life vehicles into high-grade materials appropriate for new cars and avoid downcycling.7
- Renault works with recyclers and waste management companies—including a steel recycler and Suez Environnement/Sita—to incorporate end-of-life expertise upfront into product design and provide access to a steady supply of components and materials.8
• Manufacturing service improvement. Across their supply chain, Renault has identified areas to work with suppliers to realise more circular benefits, which would be shared between Renault and their suppliers. For example, Renault has worked with their cutting fluid supplier to shift from a traditional purchase transaction to a service model. Previously, Renault bought the cutting fluids for their machining centres as a standing order from the manufacturer, but serviced the fluids in-house. The cuttingoil had to be changed frequently due to impurity and incurred significant waste. Inspired by previous successes with circular principles, Renault asked the supplier toprovide maintenance services for the cutting equipment, including fluids, supply and waste disposal. The manufacturer’s engineers went back to the lab, redesigned the fluid and usage process, and extended Renault’s usage period to a full year, yielding a total cost of ownership reduction of 20%. This saving also does not yet take into account the avoided cost for upgrading the waste water treatment plant given that the full fluid service leads to a reduction of 90% of the discharge volume of the plant for this particular function. The supplier was able to turn a commodity product into a differentiated solution to capture the first-mover advantage and lock in a service contract with Renault.9
4 See for example: Stahel, W., “Service, Performance or Goods”. Circular Economy Network, Ellen MacArthur Foundation, uploaded 1 June 2012 (http://de.slideshare. net/CircularEconomy/service-performance-or-goods-bywalter- stahel).
5 See note 1 above
6 The Circular Economy Applied to the Automotive Industry, July 2013, Ellen MacArthur Foundation.
7 Interview with Jean-Philippe Hermine, Renault’sEnvironmental Director. (Individuals interviewed inconnection with this study and their institutions are listed in the Acknowledgement section.)
8 See note 1.
9 Interview with Jean-Philippe Hermine, Renault’sEnvironmental Director.
14 | TOWARDS THE CIRCULAR ECONOMY
1. The benefits of a circular economy Continued
• Access-over-ownership business model. Renault became the first car maker to lease batteries for electric cars to help retain the residual value of electric vehicles (to encourage higher consumption) and make batteries fully traceable, ensuring a high collection rate for closed-loop re-engineering or recycling.
From linear to circular — Accelerating a proven concept
A circular economy is an industrial system that is restorative or regenerative by intention and design. It replaces the end-of-life concept with restoration, shifts towards the use of renewable energy, eliminates the use of toxic chemicals, which impair reuse and return to the biosphere, and aims for the elimination of waste through the superior design of materials, products, systems and business models.11
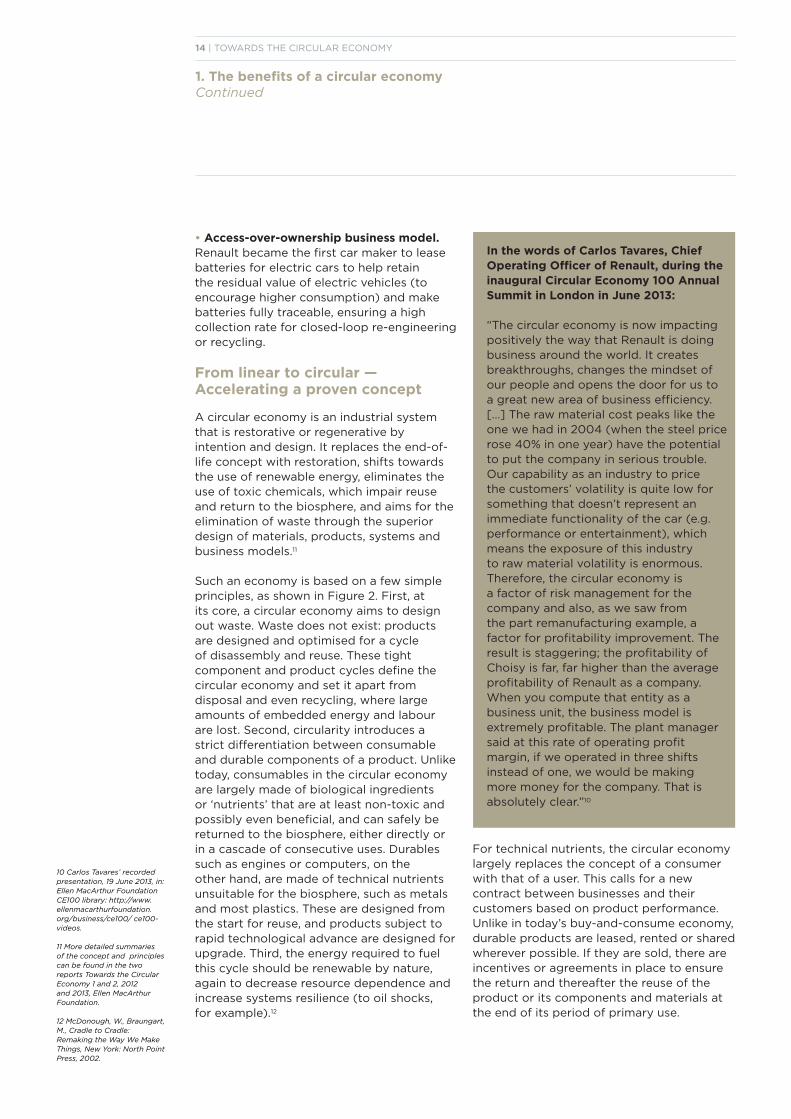
Such an economy is based on a few simple principles, as shown in Figure 2. First, at its core, a circular economy aims to design out waste. Waste does not exist: products are designed and optimised for a cycle of disassembly and reuse. These tight component and product cycles define the circular economy and set it apart from disposal and even recycling, where large amounts of embedded energy and labour are lost. Second, circularity introduces a strict differentiation between consumable and durable components of a product. Unlike today, consumables in the circular economyare largely made of biological ingredients or ‘nutrients’ that are at least non-toxic and possibly even beneficial, and can safely be returned to the biosphere, either directly or in a cascade of consecutive uses. Durablessuch as engines or computers, on the other hand, are made of technical nutrients unsuitable for the biosphere, such as metals and most plastics. These are designed from the start for reuse, and products subject to rapid technological advance are designed forupgrade. Third, the energy required to fuel this cycle should be renewable by nature, again to decrease resource dependence and increase systems resilience (to oil shocks, for example).12
For technical nutrients, the circular economy largely replaces the concept of a consumer with that of a user. This calls for a new contract between businesses and their customers based on product performance. Unlike in today’s buy-and-consume economy,durable products are leased, rented or shared wherever possible. If they are sold, there are incentives or agreements in place to ensure the return and thereafter the reuse of the product or its components and materials at the end of its period of primary use.
In the words of Carlos Tavares, Chief Operating Officer of Renault, during the inaugural Circular Economy 100 AnnualSummit in London in June 2013:
“The circular economy is now impacting positively the way that Renault is doing business around the world. It createsbreakthroughs, changes the mindset of our people and opens the door for us to a great new area of business efficiency. […] The raw material cost peaks like the one we had in 2004 (when the steel price rose 40% in one year) have the potential to put the company in serious trouble. Our capability as an industry to price the customers’ volatility is quite low for something that doesn’t represent an immediate functionality of the car (e.g. performance or entertainment), which means the exposure of this industry to raw material volatility is enormous. Therefore, the circular economy is a factor of risk management for the company and also, as we saw from the part remanufacturing example, a factor for profitability improvement. The result is staggering; the profitability of Choisy is far, far higher than the average profitability of Renault as a company. When you compute that entity as a business unit, the business model is extremely profitable. The plant manager said at this rate of operating profit margin, if we operated in three shifts instead of one, we would be making more money for the company. That is absolutely clear.”10
10 Carlos Tavares’ recorded presentation, 19 June 2013, in: Ellen MacArthur Foundation CE100 library: http://www. ellenmacarthurfoundation.org/business/ce100/ ce100-videos.
11 More detailed summaries of the concept and principles can be found in the two reports Towards the Circular Economy 1 and 2, 2012 and 2013, Ellen MacArthur Foundation.
12 McDonough, W., Braungart, M., Cradle to Cradle: Remaking the Way We Make Things, New York: North Point Press, 2002.
TOWARDS THE CIRCULAR ECONOMY | 15
FIGURE 2 The circular economy—an industrial system that is restorative by design
Farming/collection1
Biochemical feedstock
Restoration
Biogas
Anaerobic digestion/ composting
Extraction of biochemical feedstock2
Cascades
Collection
Energy recovery
Leakage to be minimised
Parts manufacturer
Product manufacturer
Service provider
Landfill
Collection
User
Biosphere
Mining/materials manufacturing
Technical materials
Recycle
Refurbish/remanufacture
Reuse/redistribute
Maintenance
6 2803 0006 9
Consumer
Biological materials
1 Hunting and fishing2 Can take both post-harvest and post-consumer waste as an inputSOURCE: Ellen MacArthur Foundation - Adapted from the Cradle to Cradle Design Protocol by Braungart & McDonough
16 | TOWARDS THE CIRCULAR ECONOMY
1. The benefits of a circular economy Continued
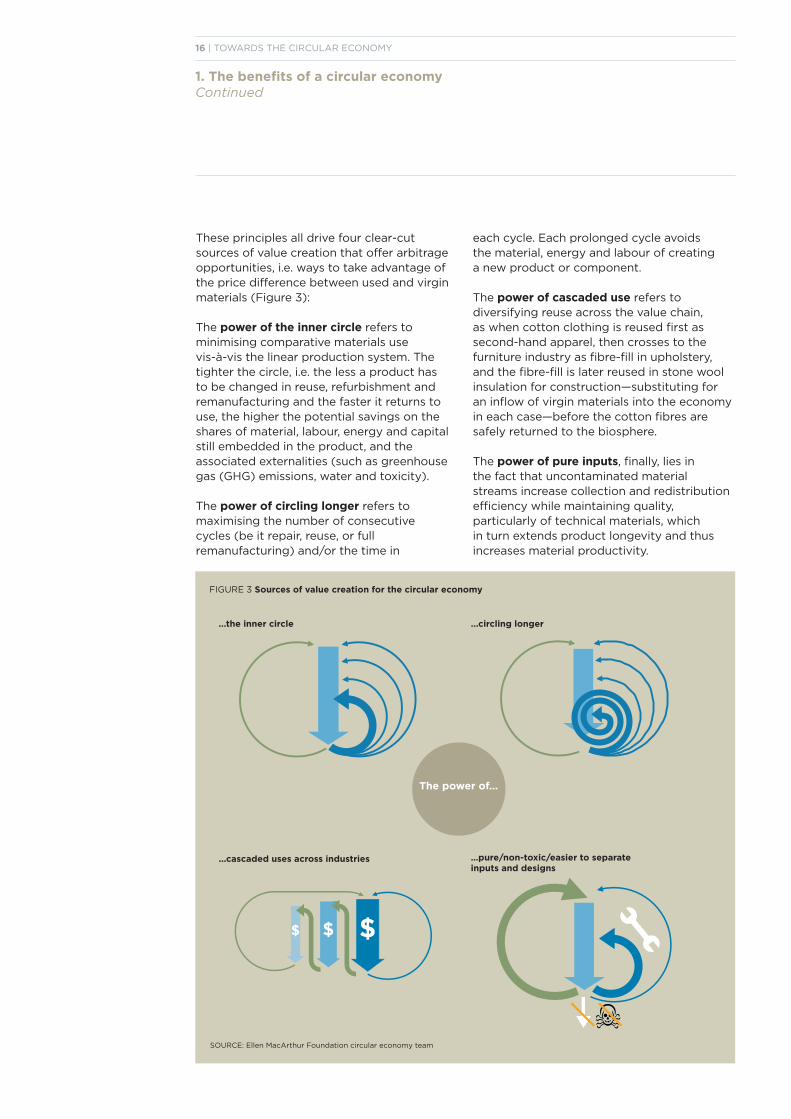
These principles all drive four clear-cutsources of value creation that offer arbitrage opportunities, i.e. ways to take advantage of the price difference between used and virgin materials (Figure 3):
The power of the inner circle refers tominimising comparative materials usevis-à-vis the linear production system. The tighter the circle, i.e. the less a product has to be changed in reuse, refurbishment and remanufacturing and the faster it returns to use, the higher the potential savings on the shares of material, labour, energy and capital still embedded in the product, and theassociated externalities (such as greenhouse gas (GHG) emissions, water and toxicity).
The power of circling longer refers tomaximising the number of consecutivecycles (be it repair, reuse, or full remanufacturing) and/or the time in
each cycle. Each prolonged cycle avoids the material, energy and labour of creating a new product or component.
The power of cascaded use refers todiversifying reuse across the value chain, as when cotton clothing is reused first as second-hand apparel, then crosses to the furniture industry as fibre-fill in upholstery, and the fibre-fill is later reused in stone wool insulation for construction—substituting for an inflow of virgin materials into the economy in each case—before the cotton fibres are safely returned to the biosphere.
The power of pure inputs, finally, lies in the fact that uncontaminated material streams increase collection and redistribution efficiency while maintaining quality, particularly of technical materials, which in turn extends product longevity and thus increases material productivity.
$ $ $
...the inner circle
...cascaded uses across industries
...circling longer
…pure/non-toxic/easier to separate inputs and designs
The power of...
FIGURE 3 Sources of value creation for the circular economy
SOURCE: Ellen MacArthur Foundation circular economy team
TOWARDS THE CIRCULAR ECONOMY | 17
These four ways to increase material productivity are not merely one-off effects that will dent resource demand for a shortperiod of time when these circular setups are introduced. Their lasting power lies in changing the run rate of required material intake. They can therefore add up to substantial cumulative advantages over a classical linear business-as-usual case.
The two Towards the Circular Economy reports published by the Ellen MacArthur Foundation provide ample evidence that circularity has started to make inroads into the linear economy and has moved beyond proof of concept. A number of businesses are already thriving on it. Innovative products and contracts designed for the circular economyare already available in a variety of forms—from innovative designs of daily materials and products (e.g. biodegradable food packaging and easy-to-disassemble office printers) topay-per-use contracts (for tyres for instance). Demonstrably, these examples have in common that they have focused on optimising total systems performance rather than that of a single component.
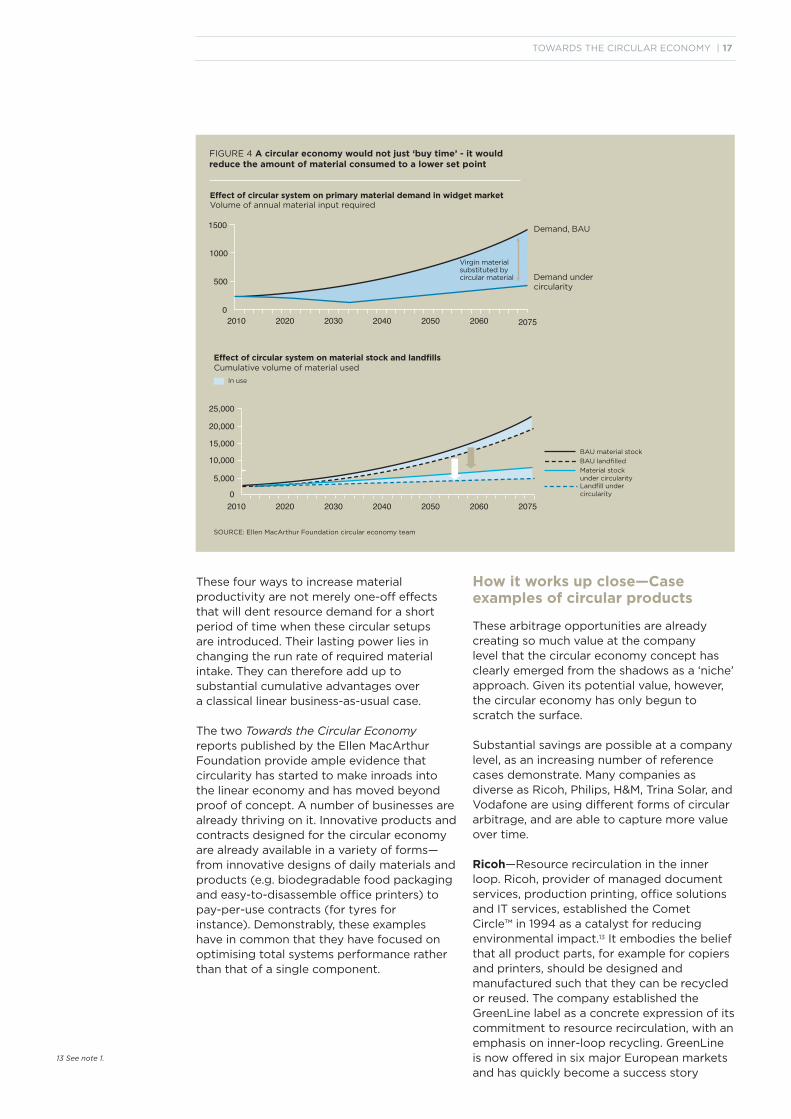
Effect of circular system on primary material demand in widget marketVolume of annual material input required
1500
1000
500
0
25,000
20,000
15,000
10,000
5,000
0
2010 2020 2030 2040 2050 2060 2075
2010 2020 2030 2040 2050 2060 2075
Effect of circular system on material stock and landfillsCumulative volume of material used
Demand, BAU
Demand undercircularity
In use
SOURCE: Ellen MacArthur Foundation circular economy team
BAU material stock
Material stockunder circularity
BAU landfilled
Landfill under circularity
Virgin material substituted by
circular material
FIGURE 4 A circular economy would not just ‘buy time’ - it would reduce the amount of material consumed to a lower set point
How it works up close—Case examples of circular products
These arbitrage opportunities are already creating so much value at the company level that the circular economy concept has clearly emerged from the shadows as a ‘niche’ approach. Given its potential value, however, the circular economy has only begun to scratch the surface.
Substantial savings are possible at a company level, as an increasing number of reference cases demonstrate. Many companies as diverse as Ricoh, Philips, H&M, Trina Solar, and Vodafone are using different forms of circular arbitrage, and are able to capture more value over time.
Ricoh—Resource recirculation in the inner loop. Ricoh, provider of managed document services, production printing, office solutions and IT services, established the CometCircle™ in 1994 as a catalyst for reducing environmental impact.13 It embodies the belief that all product parts, for example for copiers and printers, should be designed andmanufactured such that they can be recycled or reused. The company established the GreenLine label as a concrete expression of its commitment to resource recirculation, with an emphasis on inner-loop recycling. GreenLine is now offered in six major European markets and has quickly become a success story
13 See note 1.
18 | TOWARDS THE CIRCULAR ECONOMY
1. The benefits of a circular economy Continued
because it increases customer choice, while also keeping pace with Ricoh’s new equipment sales. According to Ricoh, GreenLine has grown rapidly (5% from 2012 to 2013), now accounting for 10 to 20% of Ricoh’s unit sales in these markets and earning a margin one-and-a-half to two times higher than Ricoh’s new products. GreenLine products allow Ricoh to reach non-traditional market segments such as smaller businesses, and make Ricoh’s offers more attractive for traditional enterprise customers, which helps stabilise market share in a market with heavy price competition. In addition to remanufacturing, the company refurbishes and upgrades pre-owned machines.14
For products that cannot be remanufactured, refurbished or upgraded, Ricoh harvests the components and recycles materials (at local facilities). Ricoh is starting to explore crushing materials to ship back to manufacturingfacilities in Asia for use in new component production. The company is on track to reach their targets to reduce the input of new resources by 25% by 2020 compared with 2007 levels, and by 87.5% by 2050, and to reduce the use of—or prepare alternative materials for—the major input materials for products that are at high risk of depletion (e.g. crude oil, copper and chromium) by 2050.
Philips—Lighting as a service. Philips has a track record in the collection and recycling of lamps. For example, in the EU, Philips has a stake in 22 collection and service organisations that collect 40% of all mercury-containinglamps put on the market and with a recycling rate greater than 95%. In order to enhance collection of lighting equipment, Philips recently also started to sell lighting as aservice. Philips says they can reach more customers if they retain ownership of the lighting equipment as customers don’t have to pay high upfront costs and Philips ensures the sound environmental management of end-of-life lighting equipment. It’s a new way for customers to achieve their sustainability goals: high lighting performance, high energy efficiency, and a low materials footprint.15
Vodafone—Offering consumers access. Vodafone is one of the first movers in the ICT industry to capture the benefits of the ‘access over ownership’ business model with its Vodafone New Every Year/Red Hot and
Buy Back programmes, which allow the company to strengthen their relationship with customers. Vodafone launched the NewEvery Year/Red Hot programme in 2013 and has been receiving very positive feedback from customers. The Buy Back programme is now being rolled out across all Vodafone markets, while New Every Year is available infour markets currently (UK, Greece, the Netherlands and Ireland). Vodafone works with a business partner to take care of the reverse cycle network, in which most devicescollected are transported to Hong Kong and China for sales in secondary markets.16
H&M—Collecting clothing for reuse and recycling. Starting in early 2013, H&M launched a global in-store clothing collection programme to encourage customers tobring in end-of-use clothes in exchange for a voucher, an initiative also taken by Marks & Spencer with Oxfam in the UK. To manage downstream processing of the clothesH&M collects, they collaborate with I:CO, an apparel reverse logistics service provider, which handles the manual sorting for rewear, reuse, recycling or energy generation. I:CO’s biggest sorting facility in Germany employs 600 people, and the company also has plants in India and the US. Of the total clothing they collect, I:CO estimates the average share that they select for marketing as rewear—second-hand clothes that are sold worldwide—at 40 to 60%. At the next loop level, reuse accounts for another 5 to 10% on average: these aretextiles no longer suitable for wear, which are cascaded into other products, including cleaning cloths, with very limited upcycling of fibres into textile yarns. Textiles that can’t be reused, 30 to 40% of the total on average, get a new chance as textile fibres or are used to manufacture products such as damping and insulating materials in the auto industry. When these three options have been exhausted, textiles are used to produce energy; I:CO estimates the share of clothes collected that go to the outermost loop of thermal utilisation at 1 to 3%. Both H&M and I:CO have been working on increasing upcycling and functional recycling. H&M’s long-term aim is to find a solution for reusing and recycling all textile fibre for new uses and to use yarns made out of collected textiles in their products. The H&M surplus from the collection programme will be donated to the H&M Conscious Foundation17, where they
14 All company-related information is from interviews with Philip Hawkins, Assistant General Manager—Business Strategy SCM1 at Ricoh UK, and Olivier Vriesendorp, Director of Product Marketing at Ricoh Europe.
15 All company-related information is from an interview with Robert Metzke, Senior Director EcoVision Program at Philips, and Emile Cornelissen, Head of Supplier Sustainability and New Venture Integration Manager of Philips Group Purchasing.
16 All company-related information is from interview with Casper Jorna, Manager Terminals Sustainability of Vodafone Group Services GmbH.
17 The Swedish Wire, H&M press release, http://www. swedishwire.com/press-releases/16994-h-m-hennes - mauritz-ab-the-hm-conscious-foundation-receives-adonation- of-sek-500-million-from-the-stefan-perssonfamily, 25 April 2013.
TOWARDS THE CIRCULAR ECONOMY | 19
will fund innovations in reverse capabilities and other areas linked to closing the loop on textiles. The main revenue streams for I:CO come from the resale of clothing, especially the high-value garments (including vintage), and materials cascading. For H&M, thebenefits of the programme could possibly include greater in-store traffic and an increase in customer loyalty. For jeans, H&M partners with a supplier in Pakistan to close the loop on fibres. Collected end-of-use jeans are shipped to partner facilities to be crushed and respun into fibres to use as input to make new jeans (replacing 20 to 25% of virgin materials due to limitations in current mechanical recycling practices).18
Trina Solar, one of the World’s largest solar panel manufacturers and based in China, has started developing technologies and standards for recycling end-of-usephotovoltaic modules in anticipation of the obsolescence of first-generation panels. The reverse logistics operation will mostly be located in end-usage countries. Glass will beextracted from the modules and used for other glass applications, while the electronic control systems will be treated as waste of electrical and electronic equipment (WEEE).This will allow the company to reap the benefits of secondary material value as well as remain compliant with regulations.19
Box 1 Opportunities in transitioning to a circular model
The two Towards the Circular Economy reports published by the Ellen MacArthur Foundation in 2012 and 2013 analysed in full depth the options for several different categories of resource-intensive products. The 2012 analysis—of complex medium-lived products— showed that the use of circular economy approaches would support improvements such as the following:20
The cost of remanufacturing mobile phones could be reduced by 50% per device, if the industry made phones that were easier to take apart, improved the reverse cycle and offered incentives to return phones.
High-end washing machines would be accessible for most households if they were leased instead of sold. Customers would save roughly a third per wash cycle, and the manufacturer would earn roughly a third more in profits. Over a 20-year period, replacing the purchase of five 2,000-cycle machines with leases to one 10,000-cycle machine would also yield almost 180 kg of steel savings and more than 2.5 tonnes of CO2 savings.
In the fast-moving consumer goods sector, analysed in the 2013 report,
circular opportunities were identified all along the value chain: in manufacturing (food and beverages), in the distribution and consumption stages (textiles, packaging) and in post-use processing (food waste). A number of opportunities have been identified, including the following:
The UK could create an income stream of US$ 1.5 billion annually at the municipal level by processing mixed food waste discarded by households and in the hospitality sector.
A profit of US$ 1.90 per hectolitre of beer produced can be captured by selling brewers’ spent grains.
In the UK, each tonne of clothing that is collected and sorted can generate revenues of US$ 1,975, or a gross profit of US$ 1,295 from reuse opportunities. These are the aggregate impact of clothes being worn again, reused by cascading down to other industries to make insulation or upholstery stuffing or simply recycled into yarn to make fabrics that save virgin fibre.
Costs of packaging, processing and distributing beer could be reduced by 20% by shifting to reusable glass bottles.
18 All company-related information is from interviews with Mikael Blommé, Sustainability Innovation Responsible of H&M, Paul Doertenbach, Global Account Manager of I:CO, and an H&M supplier. I:CO data for clothing volumes in reverse cycles as at December 2012.
19 All company-related information is from interview with Jeffrey Fan, Corporate Communications Director at Trina Solar.
20 Towards the Circular Economy 1 and 2, Ellen MacArthur Foundation.
20 | TOWARDS THE CIRCULAR ECONOMY
1. The benefits of a circular economy Continued
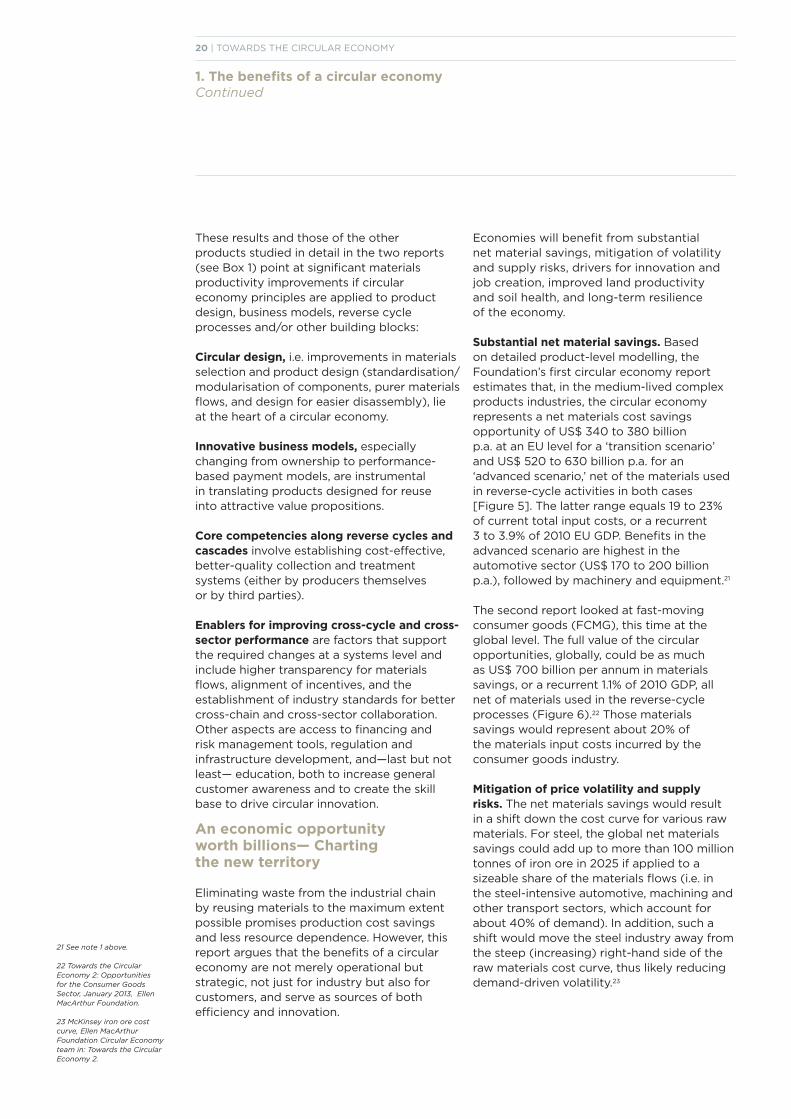
These results and those of the other products studied in detail in the two reports (see Box 1) point at significant materials productivity improvements if circular economy principles are applied to product design, business models, reverse cycle processes and/or other building blocks:
Circular design, i.e. improvements in materials selection and product design (standardisation/modularisation of components, purer materials flows, and design for easier disassembly), lie at the heart of a circular economy.
Innovative business models, especially changing from ownership to performance-based payment models, are instrumental in translating products designed for reuse into attractive value propositions.
Core competencies along reverse cycles and cascades involve establishing cost-effective, better-quality collection and treatment systems (either by producers themselves or by third parties).
Enablers for improving cross-cycle and cross-sector performance are factors that support the required changes at a systems level and include higher transparency for materials flows, alignment of incentives, and the establishment of industry standards for better cross-chain and cross-sector collaboration. Other aspects are access to financing and risk management tools, regulation and infrastructure development, and—last but not least— education, both to increase general customer awareness and to create the skill base to drive circular innovation.
An economic opportunity worth billions— Charting the new territory
Eliminating waste from the industrial chain by reusing materials to the maximum extent possible promises production cost savings and less resource dependence. However, this report argues that the benefits of a circular economy are not merely operational but strategic, not just for industry but also for customers, and serve as sources of both efficiency and innovation.
Economies will benefit from substantial net material savings, mitigation of volatility and supply risks, drivers for innovation and job creation, improved land productivity and soil health, and long-term resilience of the economy.
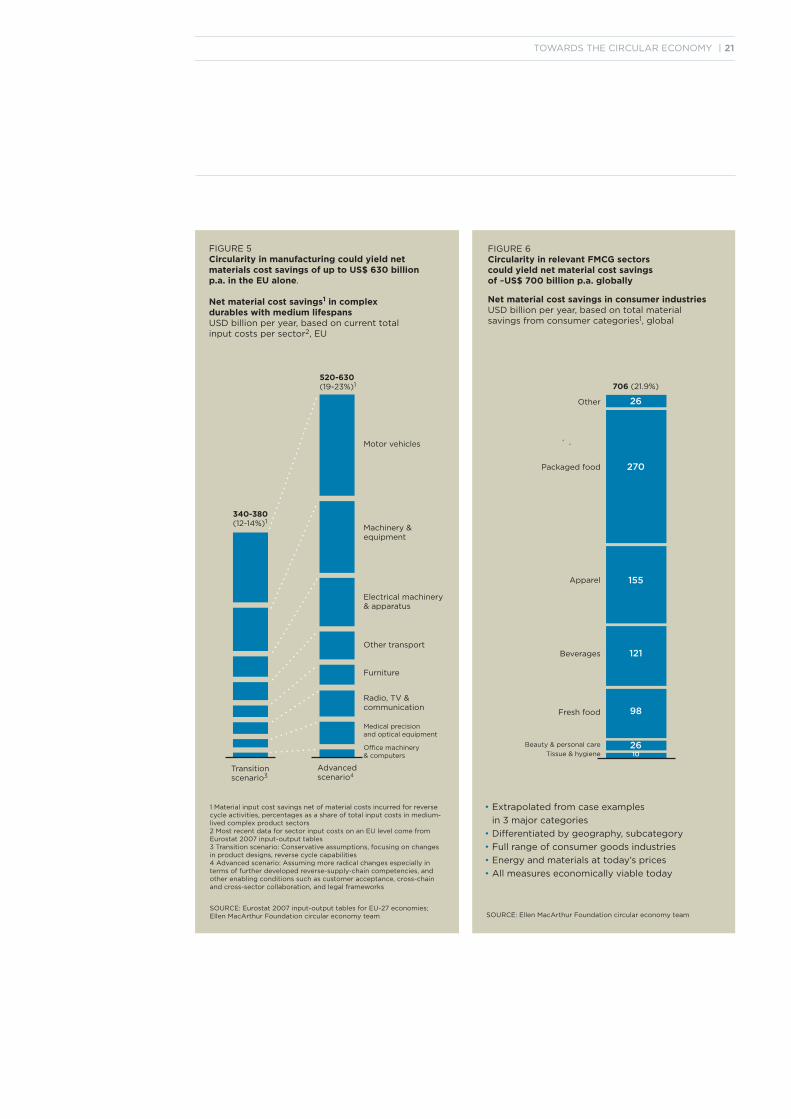
Substantial net material savings. Based on detailed product-level modelling, the Foundation’s first circular economy report estimates that, in the medium-lived complexproducts industries, the circular economy represents a net materials cost savings opportunity of US$ 340 to 380 billionp.a. at an EU level for a ‘transition scenario’ and US$ 520 to 630 billion p.a. for an ‘advanced scenario,’ net of the materials used in reverse-cycle activities in both cases[Figure 5]. The latter range equals 19 to 23% of current total input costs, or a recurrent 3 to 3.9% of 2010 EU GDP. Benefits in the advanced scenario are highest in theautomotive sector (US$ 170 to 200 billion p.a.), followed by machinery and equipment.21
The second report looked at fast-moving consumer goods (FCMG), this time at the global level. The full value of the circular opportunities, globally, could be as much as US$ 700 billion per annum in materials savings, or a recurrent 1.1% of 2010 GDP, all net of materials used in the reverse-cycleprocesses (Figure 6).22 Those materials savings would represent about 20% of the materials input costs incurred by the consumer goods industry.
Mitigation of price volatility and supply risks. The net materials savings would result in a shift down the cost curve for various raw materials. For steel, the global net materialssavings could add up to more than 100 million tonnes of iron ore in 2025 if applied to a sizeable share of the materials flows (i.e. in the steel-intensive automotive, machining and other transport sectors, which account for about 40% of demand). In addition, such a shift would move the steel industry away from the steep (increasing) right-hand side of the raw materials cost curve, thus likely reducing demand-driven volatility.23
21 See note 1 above.
22 Towards the Circular Economy 2: Opportunities for the Consumer Goods Sector, January 2013, Ellen MacArthur Foundation.
23 McKinsey iron ore cost curve, Ellen MacArthur Foundation Circular Economy team in: Towards the Circular Economy 2.
TOWARDS THE CIRCULAR ECONOMY | 21
1 Material input cost savings net of material costs incurred for reverse cycle activities, percentages as a share of total input costs in medium-lived complex product sectors2 Most recent data for sector input costs on an EU level come from Eurostat 2007 input-output tables3 Transition scenario: Conservative assumptions, focusing on changes in product designs, reverse cycle capabilities4 Advanced scenario: Assuming more radical changes especially in terms of further developed reverse-supply-chain competencies, and other enabling conditions such as customer acceptance, cross-chain and cross-sector collaboration, and legal frameworks
SOURCE: Eurostat 2007 input-output tables for EU-27 economies; Ellen MacArthur Foundation circular economy team
Motor vehicles
Machinery & equipment
Electrical machinery& apparatus
Other transport
Furniture
Radio, TV & communication
Medical precisionand optical equipment
Office machinery& computers
Advanced scenario4
520-630(19-23%)1
340-380(12-14%)1
Transitionscenario3
FIGURE 5 Circularity in manufacturing could yield netmaterials cost savings of up to US$ 630 billion p.a. in the EU alone.
Net material cost savings1 in complex durables with medium lifespansUSD billion per year, based on current total input costs per sector2, EU
270
155
121
98
FIGURE 6 Circularity in relevant FMCG sectors could yield net material cost savings of ~US$ 700 billion p.a. globally
Net material cost savings in consumer industriesUSD billion per year, based on total material savings from consumer categories1, global
Other
Packaged food
Apparel
Beverages
Fresh food
Beauty & personal care
Tissue & hygiene
Extrapolated from case examples
in 3 major categories
Differentiated by geography, subcategory
Full range of consumer goods industries
Energy and materials at today’s prices
All measures economically viable today
•
•
•
•
•
706 (21.9%)
SOURCE: Ellen MacArthur Foundation circular economy team
26
2610
1 Components of index include: R&D intensity; patent, trademark and design intensity; organisational/managerial innovation; and productivityNote: Primary sector (extraction), secondary sector (manufacturing) and tertiary sector (services)
SOURCE: Labour intensity calculated using data taken from Eurostat input-output tables for EU-27; innovation data from the IBM/Melbourne Institute Innovation Index (covering Australian industry), 2010
22 | TOWARDS THE CIRCULAR ECONOMY
1. The benefits of a circular economy Continued
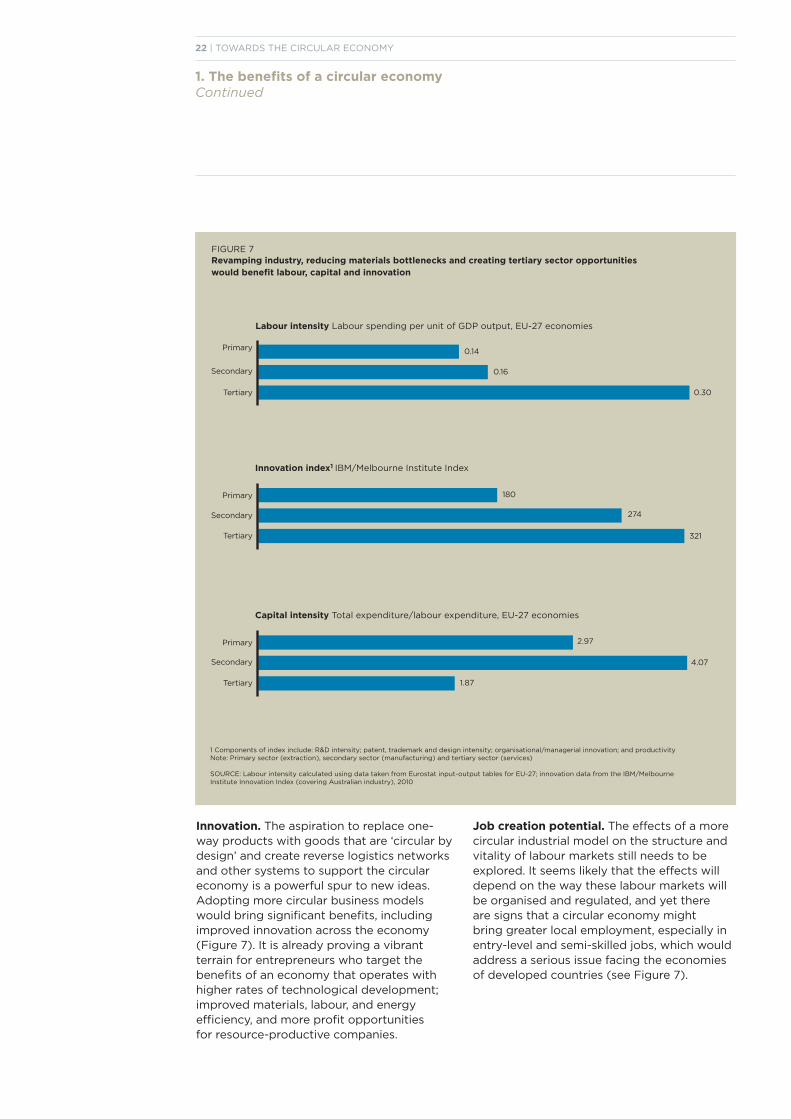
Innovation. The aspiration to replace one-way products with goods that are ‘circular by design’ and create reverse logistics networks and other systems to support the circulareconomy is a powerful spur to new ideas. Adopting more circular business models would bring significant benefits, including improved innovation across the economy (Figure 7). It is already proving a vibrant terrain for entrepreneurs who target the benefits of an economy that operates with higher rates of technological development; improved materials, labour, and energy efficiency, and more profit opportunitiesfor resource-productive companies.
Job creation potential. The effects of a more circular industrial model on the structure and vitality of labour markets still needs to be explored. It seems likely that the effects willdepend on the way these labour markets will be organised and regulated, and yet there are signs that a circular economy might bring greater local employment, especially in entry-level and semi-skilled jobs, which would address a serious issue facing the economies of developed countries (see Figure 7).
FIGURE 7 Revamping industry, reducing materials bottlenecks and creating tertiary sector opportunities would benefit labour, capital and innovation
Labour intensity Labour spending per unit of GDP output, EU-27 economies
Capital intensity Total expenditure/labour expenditure, EU-27 economies
1.87
4.07
2.97
Innovation index1 IBM/Melbourne Institute Index
321
274
180
0.14
0.16
0.30
Primary
Secondary
Tertiary
Primary
Secondary
Tertiary
Primary
Secondary
Tertiary
This total prize is just the beginning of a much bigger set of transformative value-creation plays as the world scales up the new circular technologies and business models. We already see a selective ‘grafting’ of new circular business models and technologies during this period of transition. Initially, these grafts may appear modest in their impact and play into niche markets (e.g. growing greenhouse tomatoes, or hiring out high-end fashion items). But over the next 15 years these new business models will likely gain an increasing competitive advantage because they inherently create much more value from each unit of resource. They are also likely to meet other market requirements associated with a more secure supply, more convenience for consumers and lower environmental costs.
In a world of 9 billion people and fierce competition for resources, market forces are likely to favour those models that best combine specialised knowledge and cross-sector collaboration to create the most value per unit of resource over linear models that simply rely on ever more resource extraction and throughput. Natural selection will likely favour the swift and agile players—able to quickly combine circularity with scale—that are best adapted to a planet transformed by humanity.
Land productivity and soil health. Land degradation costs an estimated US$ 40 billion annually worldwide, without taking into account the hidden costs of increased fertiliser use, loss of biodiversity and loss of unique landscapes. Higher land productivity, less waste in the food value chain and the return of nutrients to the soil will enhance the value of land and soil as assets. The circular economy, by moving much more biological material through the anaerobic digestion or composting process and back into the soil, will reduce the need for replenishment with additional nutrients. This is the principle of regeneration at work.
Lasting benefits for a more resilient economy. Importantly, any increase in materials productivity is likely to have a positive impact on economic development beyond the effects of circularity on specific sectors. Circularity as a ‘rethinking device’ has proved to be a powerful new frame, capable of sparking creative solutions and stimulating innovation.
The circular approach offers developed economies an avenue to resilient growth, a systemic answer to reducing dependency on resource markets, and a means of reducingexposure to resource price shocks as well as societal and environmental ‘externality’ costs that are not picked up by companies. A circular economy would shift the economicbalance away from energy-intensive materials and primary extraction. It would create a new sector dedicated to reverse cycle activities for reuse, refurbishing, remanufacturing or recycling on the technical side, and anaerobic digestion, composting and cascading on the biological side. At the same time, emerging market economies can benefit from the fact that they are not as ‘locked in’ in the linear model as advanced economies are and therefore have the chance to leapfrog straight into establishing circular setups when building up their manufacturing-based sectors. Indeed, many emerging market economies are also more materials intensive than typical advanced economies, and could therefore expect even greater relative savings from circular business models. The circular economy will generate benefits for stakeholders on every level—customers, businesses and society as a whole.
TOWARDS THE CIRCULAR ECONOMY | 23
24 | TOWARDS THE CIRCULAR ECONOMY
1. The benefits of a circular economy Continued
Why intended use and defined use are good for business
Question. How do you get your materials back at high quality ? Answer. Determine the intended use and defined use of the material. The transition to the circular economy can be accelerated by using pure materials based on the Cradle to Cradle (C2C) approach to technological and biological cycles. However, developing ‘pure’ materials is complicated by thousands of additives used to add functionality to products, as well as many ‘pure’ materials being beneficial for one use but toxic for another. In response to this challenge, it is important to know what the product does for the customer, then to define materials and additives for the use. This naturally applies to materials considered by Project MainStream.
Intended use… what the product does for the customer. Describes what the product or service is intended to do for the customer. Example: Carpets are designed as surface coverings usually for indoors where people spend up to 80% of their time. Air quality is an important feature of indoor environments. Desso & EPEA improved the intended use of Desso carpets by redesigning them to actively clean the air. The feature added a new functionality and service as well as improving sales. However it also involved new fiber types using different materials. Knowing those materials is important for the next step.
Define use… how materials get to their next use.Ensures the right materials are in the right place at the right time.The Defined Use Scenario* lets you determine which materials and additives are safe for which use and how they get to their next use. It also shows if materials become biological nutrients or are recovered as technical nutrients for products. After the Intended Use of a product is optimized, the path of its materials can be defined from manufacturing through use, disposal and recovery. In these scenarios, re-use of the materials is one of the main objectives to improve their value for business.
First, know what you have. Surprisingly many manufacturers do not know exactly what is in the materials used to manufacture their products; they only know the functional properties and regulatory hazards to avoid. Profitable re-use of materials in the circular economy involves knowing what is in them.
Source: EPEA *Defined Use Scenario is an EPEA methodology

TOWARDS THE CIRCULAR ECONOMY | 04
Some 37% of the world’s proven oil reserves and 19% of proven gas reserves are in countries with a high level of political risk. Political motives also drive cartels, subsidies, and trade barriers, all of which can trigger or worsen resource scarcity and push up prices and volatility levels. Greater interconnectedness of resources is a related issue. Commodity prices now show significant correlation with oil prices—and this holds true not only for metals and mining products, but for food categories such as maize, wheat, and rice as well as beef. These links increase the risk that shortages and price changes in one resource can rapidly spread to others. The swift integration of financial markets and the increasing ease of transporting resources globally also mean that regional price shocks can quickly become global. As the World Bank’s ‘Turn Down the Heat’ report notes, specialisation in production systems is continuing its unstoppable evolution and has gone international: our dependence on infrastructure to deliver produced goods is therefore growing—and with it, our economic exposure to events across the world. Natural catastrophes with ripple effects are numerous in recent history: Hurricane Sandy (with costs estimated at USD 100 billion) on the U.S. East Coast just last October, and Typhoon Bopha in the Philippines in December 2012 (which according to early estimates caused a GDP loss of 0.3%). This trend is likely to continue and become more acute as emerging markets integrate more thoroughly into global value chains and financial systems. Many up-and-coming economic centres in Asia, such as Kolkata
1
Why the time to act is now
2
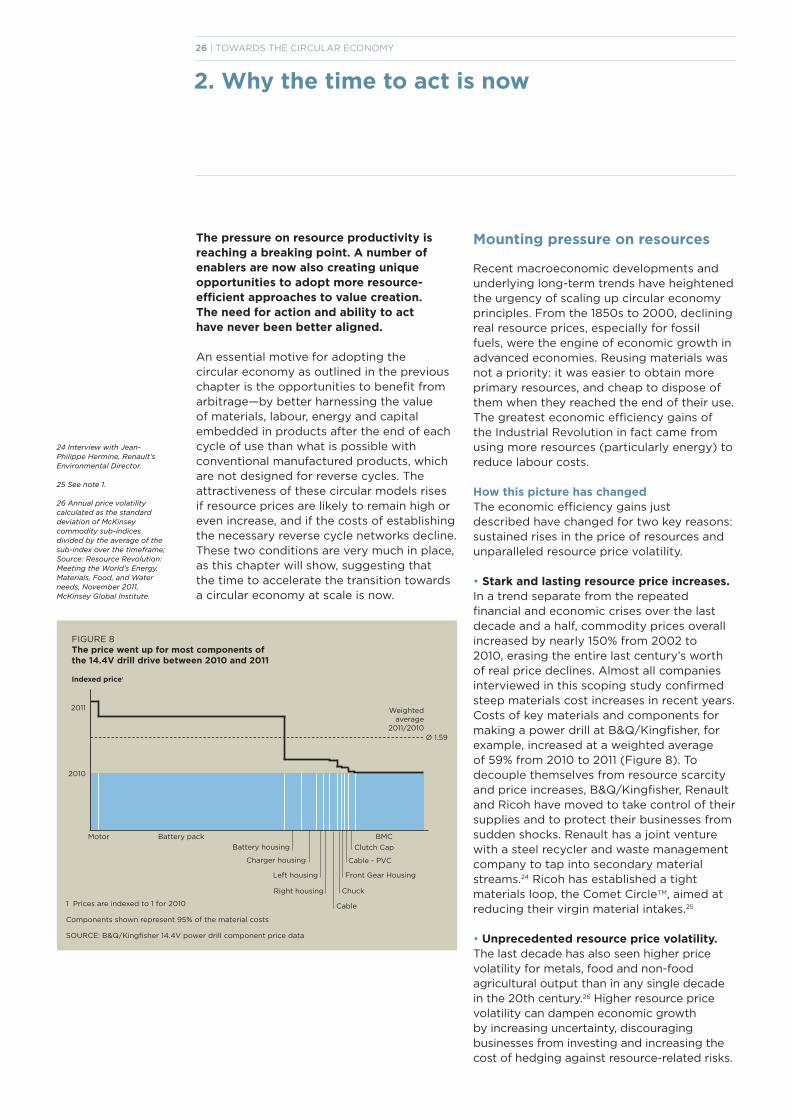
The pressure on resource productivity isreaching a breaking point. A number ofenablers are now also creating uniqueopportunities to adopt more resource-efficient approaches to value creation. The need for action and ability to act have never been better aligned.
An essential motive for adopting the circular economy as outlined in the previous chapter is the opportunities to benefit from arbitrage—by better harnessing the value of materials, labour, energy and capital embedded in products after the end of each cycle of use than what is possible withconventional manufactured products, which are not designed for reverse cycles. The attractiveness of these circular models rises if resource prices are likely to remain high or even increase, and if the costs of establishing the necessary reverse cycle networks decline. These two conditions are very much in place, as this chapter will show, suggesting thatthe time to accelerate the transition towards a circular economy at scale is now.
26 | TOWARDS THE CIRCULAR ECONOMY
2. Why the time to act is now
Mounting pressure on resources
Recent macroeconomic developments and underlying long-term trends have heightened the urgency of scaling up circular economy principles. From the 1850s to 2000, declining real resource prices, especially for fossil fuels, were the engine of economic growth in advanced economies. Reusing materials was not a priority: it was easier to obtain more primary resources, and cheap to dispose of them when they reached the end of their use. The greatest economic efficiency gains of the Industrial Revolution in fact came from using more resources (particularly energy) to reduce labour costs.
How this picture has changed The economic efficiency gains just described have changed for two key reasons: sustained rises in the price of resources and unparalleled resource price volatility.
• Stark and lasting resource price increases. In a trend separate from the repeated financial and economic crises over the last decade and a half, commodity prices overall increased by nearly 150% from 2002 to 2010, erasing the entire last century’s worth of real price declines. Almost all companies interviewed in this scoping study confirmed steep materials cost increases in recent years. Costs of key materials and components for making a power drill at B&Q/Kingfisher, for example, increased at a weighted average of 59% from 2010 to 2011 (Figure 8). To decouple themselves from resource scarcity and price increases, B&Q/Kingfisher, Renault and Ricoh have moved to take control of their supplies and to protect their businesses from sudden shocks. Renault has a joint venture with a steel recycler and waste management company to tap into secondary material streams.24 Ricoh has established a tight materials loop, the Comet CircleTM, aimed at reducing their virgin material intakes.25
• Unprecedented resource price volatility. The last decade has also seen higher price volatility for metals, food and non-food agricultural output than in any single decade in the 20th century.26 Higher resource price volatility can dampen economic growth by increasing uncertainty, discouraging businesses from investing and increasing the cost of hedging against resource-related risks.
FIGURE 8 The price went up for most components of the 14.4V drill drive between 2010 and 2011
Indexed price1
1 Prices are indexed to 1 for 2010
Components shown represent 95% of the material costs
SOURCE: B&Q/Kingfisher 14.4V power drill component price data
2011
2010
Weightedaverage
2011/2010Ø 1.59
Motor Battery pack
Battery housing
Charger housing
Left housing
Right housing
Cable
Chuck
Clutch Cap
Front Gear Housing
Cable - PVC
BMC
24 Interview with Jean-Philippe Hermine, Renault’sEnvironmental Director.
25 See note 1.
26 Annual price volatility calculated as the standard deviation of McKinsey commodity sub-indices divided by the average of the sub-index over the timeframe; Source: Resource Revolution: Meeting the World’s Energy, Materials, Food, and Water needs, November 2011, McKinsey Global Institute.
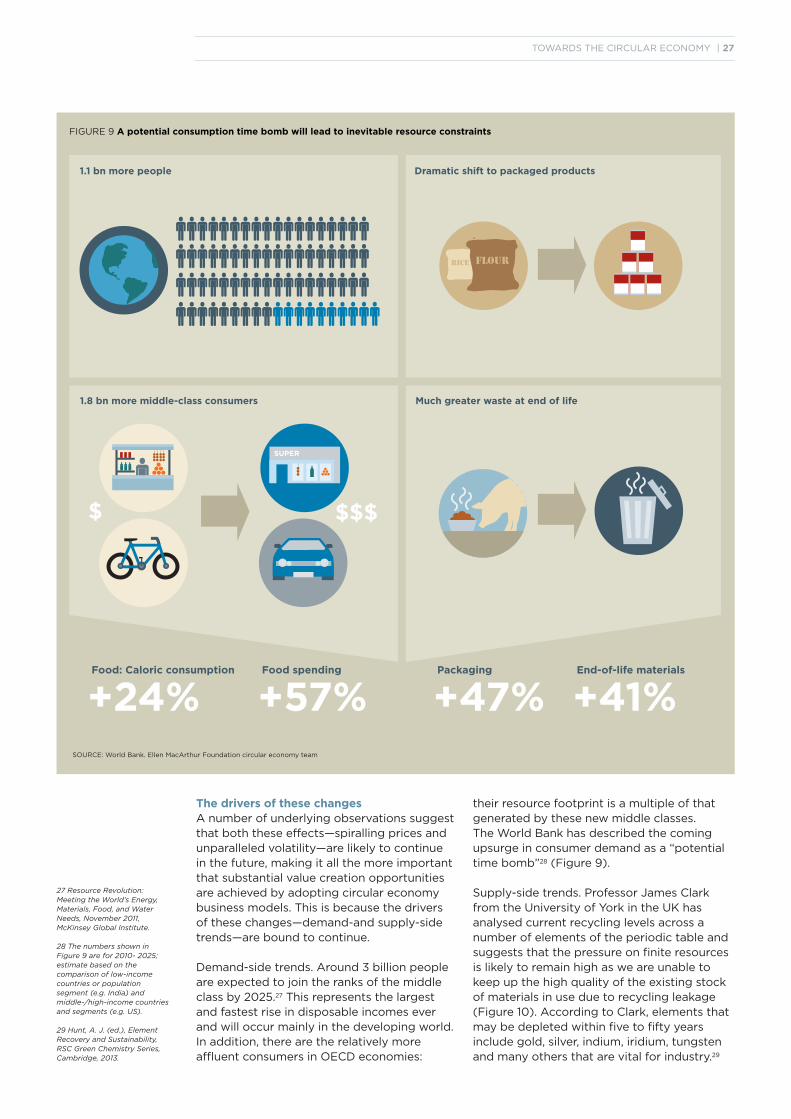
TOWARDS THE CIRCULAR ECONOMY | 27
The drivers of these changesA number of underlying observations suggest that both these effects—spiralling prices and unparalleled volatility—are likely to continue in the future, making it all the more important that substantial value creation opportunities are achieved by adopting circular economy business models. This is because the drivers of these changes—demand-and supply-sidetrends—are bound to continue.
Demand-side trends. Around 3 billion people are expected to join the ranks of the middle class by 2025.27 This represents the largest and fastest rise in disposable incomes ever and will occur mainly in the developing world. In addition, there are the relatively more affluent consumers in OECD economies:
FIGURE 9 A potential consumption time bomb will lead to inevitable resource constraints
SOURCE: World Bank. Ellen MacArthur Foundation circular economy team
+24%Food: Caloric consumption
+57%Food spending
+47%Packaging
+41%End-of-life materials
1.1 bn more people
1.8 bn more middle-class consumers
Dramatic shift to packaged products
Much greater waste at end of life
RICE FLOUR
$$$$
SUPER
their resource footprint is a multiple of thatgenerated by these new middle classes. The World Bank has described the coming upsurge in consumer demand as a “potential time bomb”28 (Figure 9).
Supply-side trends. Professor James Clark from the University of York in the UK has analysed current recycling levels across a number of elements of the periodic table andsuggests that the pressure on finite resources is likely to remain high as we are unable to keep up the high quality of the existing stock of materials in use due to recycling leakage(Figure 10). According to Clark, elements that may be depleted within five to fifty years include gold, silver, indium, iridium, tungsten and many others that are vital for industry.29
27 Resource Revolution: Meeting the World’s Energy, Materials, Food, and Water Needs, November 2011,McKinsey Global Institute.
28 The numbers shown in Figure 9 are for 2010- 2025; estimate based on the comparison of low-income countries or population segment (e.g. India) and middle-/high-income countries and segments (e.g. US).
29 Hunt, A. J. (ed.), Element Recovery and Sustainability, RSC Green Chemistry Series, Cambridge, 2013.
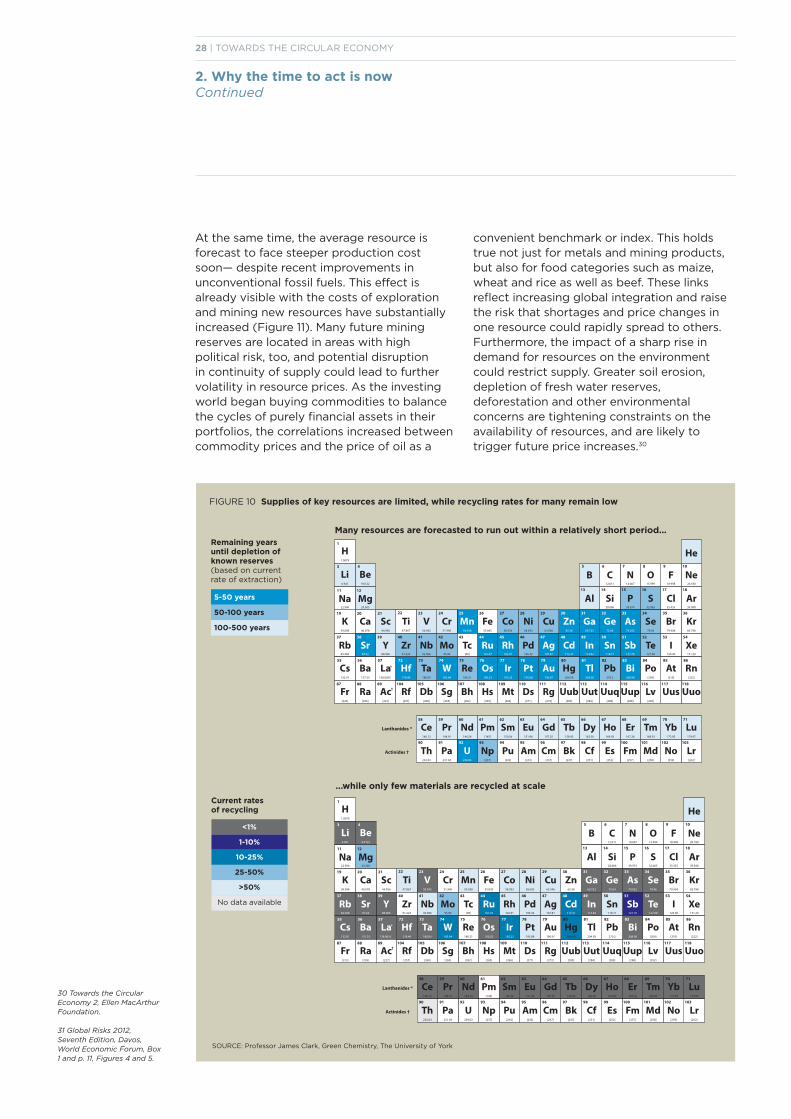
28 | TOWARDS THE CIRCULAR ECONOMY
2. Why the time to act is nowContinued
At the same time, the average resource is forecast to face steeper production cost soon— despite recent improvements in unconventional fossil fuels. This effect isalready visible with the costs of exploration and mining new resources have substantially increased (Figure 11). Many future mining reserves are located in areas with high political risk, too, and potential disruption in continuity of supply could lead to further volatility in resource prices. As the investingworld began buying commodities to balance the cycles of purely financial assets in their portfolios, the correlations increased between commodity prices and the price of oil as a
SOURCE: Professor James Clark, Green Chemistry, The University of York
convenient benchmark or index. This holds true not just for metals and mining products, but also for food categories such as maize, wheat and rice as well as beef. These linksreflect increasing global integration and raise the risk that shortages and price changes in one resource could rapidly spread to others. Furthermore, the impact of a sharp rise indemand for resources on the environment could restrict supply. Greater soil erosion, depletion of fresh water reserves, deforestation and other environmental concerns are tightening constraints on the availability of resources, and are likely to trigger future price increases.30
14.007
N7
He
Ne20.180
10
F18.998
9
O15.999
8
C12.011
6
B5
Ar39.948
18
Cl35.453
17
S32.065
16
P39.974
15
Si28.086
14
Al13
Kr83.798
36
Br79.904
35
Se78.96
34
As74.922
33
Ge72.64
32
Ga69.723
31
Zn65.38
30
Cu63.546
29
Ni58.693
28
Co58.933
27
Fe55.845
26
Mn54.938
25
Cr51.996
24
V50.942
23
Ti47.867
22
Sc44.956
21
Ca40.078
20
K39.098
19
Mg24.305
12
Na22.990
11
Be9.0122
4
Xe131.29
54
I126.90
53
Te127.60
52
Sb121.76
51
Sn118.71
50
In114.82
49
Cd112.41
48
Ag107.87
47
Pd106.42
46
Rh102.91
45
Ru101.07
44
Tc[98]
43
Mo95.96
42
Nb92.906
41
Zr91.224
40
Y88.906
39
La138.9055
57
Ac[227]
89
Sr87.62
38
Rb85.468
37
Rn[222]
86
At[210]
85
Po[209]
84
Bi208.98
83
Pb270.2
82
Dy162.50
66
Tb158.93
65
Gd157.25
64
Eu151.96
63
Sm150.36
62
Pm[145]
61
Nd144.24
60
Pr144.91
59
Ce140.12
58
Lanthanides *
Actinides †
Ba137.33
56
Cs132.91
55
Rg[272]
111
Ds[271]
110
Mt[266]
109
Hs[265]
108
Bh[262]
107
Sg[263]
106
Db[260]
105
Uuo118
Uus117
Lv[292]
116
Uup[288]
115
Uuq[289]
114
Uut[284]
113
Uub[285]
112
Rf[257]
104
Ra[226]
88
Fr[223]
87
Lu174.97
71
Yb173.05
70
Tm168.93
69
Er167.26
68
Ho164.93
67
Tl204.38
81
Hg200.59
80
Au196.97
79
Pt195.08
78
Ir192.22
77
Os190.23
76
Re186.21
75
W183.84
74
Ta180.95
73
Hf178.49
72
Bk[247]
97
Lr[262]
103
No[259]
102
Md[258]
101
Fm[257]
100
Es[252]
99
Cf[251]
98
Cm[247]
96
Am[243]
95
Pu[244]
94
Np[237]
93
U238.03
92
Pa231.04
91
Th232.04
90
H1.0079
1
Li6.941
3
*
†
FIGURE 10 Supplies of key resources are limited, while recycling rates for many remain low
Remaining years until depletion of known reserves(based on current rate of extraction)
5-50 years
50-100 years
100-500 years
Many resources are forecasted to run out within a relatively short period...
...while only few materials are recycled at scale
Current rates of recycling
<1%
1-10%
10-25%
25-50%
>50%
No data available
30 Towards the Circular Economy 2, Ellen MacArthurFoundation.
31 Global Risks 2012, Seventh Edition, Davos, World Economic Forum, Box 1 and p. 11, Figures 4 and 5.
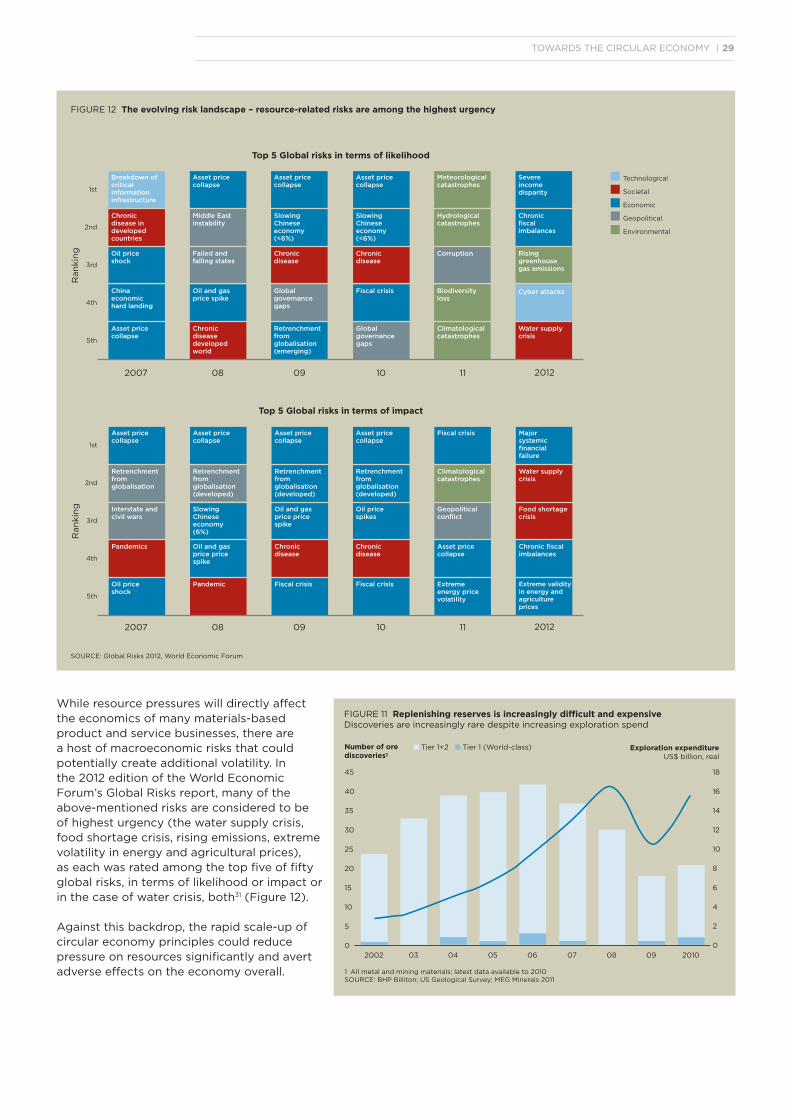
TOWARDS THE CIRCULAR ECONOMY | 29
FIGURE 12 The evolving risk landscape – resource-related risks are among the highest urgency
Top 5 Global risks in terms of likelihood
2007 08 09 10 11 2012
2007 08 09 10 11 2012
1st
2nd
3rd
4th
5th
Ran
kin
g
Top 5 Global risks in terms of impact
1st
2nd
3rd
4th
5th
Ran
kin
g
SOURCE: Global Risks 2012, World Economic Forum
Breakdown ofcritical information infrastructure
Chronicdisease indevelopedcountries
Oil priceshock
Chinaeconomichard landing
Asset pricecollapse
Asset pricecollapse
Middle Eastinstability
Failed and falling states
Oil and gasprice spike
Chronicdiseasedeveloped world
Asset pricecollapse
SlowingChineseeconomy(<6%)
Chronicdisease
Global governancegaps
Retrenchmentfromglobalisation(emerging)
Asset pricecollapse
SlowingChineseeconomy(<6%)
Chronicdisease
Fiscal crisis
Global governancegaps
Meteorologicalcatastrophes
Hydrologicalcatastrophes
Corruption
Biodiversityloss
Climatologicalcatastrophes
Severeincomedisparity
Chronicfiscalimbalances
Risinggreenhousegas emissions
Cyber attacks
Water supplycrisis
Asset pricecollapse
Retrenchmentfromglobalisation
Interstate andcivil wars
Pandemics
Oil priceshock
Asset pricecollapse
Retrenchment from globalisation (developed)
Slowing Chinese economy (6%)
Oil and gas price price spike
Pandemic
Asset pricecollapse
Retrenchment from globalisation (developed)
Oil and gas price price spike
Chronic disease
Fiscal crisis
Asset pricecollapse
Retrenchment from globalisation (developed)
Oil pricespikes
Chronic disease
Fiscal crisis
Fiscal crisis
Climatological catastrophes
Geopoliticalconflict
Asset pricecollapse
Extreme energy price volatility
Major systemic financial failure
Water supplycrisis
Food shortagecrisis
Chronic fiscalimbalances
Extreme validity in energy and agriculture prices
While resource pressures will directly affect the economics of many materials-based product and service businesses, there are a host of macroeconomic risks that could potentially create additional volatility. In the 2012 edition of the World Economic Forum’s Global Risks report, many of the above-mentioned risks are considered to be of highest urgency (the water supply crisis, food shortage crisis, rising emissions, extreme volatility in energy and agricultural prices), as each was rated among the top five of fifty global risks, in terms of likelihood or impact or in the case of water crisis, both31 (Figure 12).
Against this backdrop, the rapid scale-up of circular economy principles could reduce pressure on resources significantly and avert adverse effects on the economy overall.
Technological
Societal
Economic
Geopolitical
Environmental
Number of orediscoveries1
1 All metal and mining materials; latest data available to 2010SOURCE: BHP Billiton; US Geological Survey; MEG Minerals 2011
Exploration expenditure US$ billion, real
45
40
35
30
25
20
15
10
5
0
18
16
14
12
10
8
6
4
2
02002 03 04 05 06 07 08 09 2010
FIGURE 11 Replenishing reserves is increasingly difficult and expensive Discoveries are increasingly rare despite increasing exploration spend
n Tier 1+2 n Tier 1 (World-class)
30 | TOWARDS THE CIRCULAR ECONOMY
2. Why the time to act is nowContinued
Favourable alignment of enablers
Real and (to a lesser extent) financial market prices, price volatility and environmental reports tend to indicate that the pressure on natural resources is intensifying. At the same time, important circular economy enablers are coming into place simultaneously. They belong to different categories but can all accelerate adoption and scale-up of circular economy principles by reducing costs (both for start-up and operations) and increasing customer and market acceptance of more circular business models.
Consumer preferences are shifting away from ownershipToday’s users are displaying a preference for access over ownership, i.e. services over products. This is important because young urban and rural consumers’ lifestyle choicesin this decade have the power to shift the economic model away from the linear system. The new bias may have originated in necessity, driven by the depressed economy and widespread youth under- or unemployment. How pervasive the shift will become remains to be seen, but a new model of consumption seems emergent, in which consumers embrace services that enable them to access products on demand rather than owning them, thus becoming users.
Collaborative use models that provide more interaction between users, retailers and manufacturers are seeing greater uptake (see Box 2). The implications of this shift todifferent business models (performance-for-pay models, rent or leasing schemes, return and reuse, for example) are profound in many ways:
• Higher asset productivity. The use of assets can be increased as most of the sharing models rely on greater utilisation of previously under-used but highly valuedassets, which drives down the associated operating costs per unit of use.
• Higher asset availability and quality. These collaborative use models also allow service providers to reap benefits such as increased longevity and lower maintenance costs, improving their margin or cost-competitiveness. This in turn also drives down unit costs per use.
• Fewer information blind spots. Technologies such as radio-frequency identification (RFID, discussed in the nextsection) enable better tracking of embedded materials and components, which reduces costs and consequently increases the margin for revalorising products at the end of their current use.
Socio-demographic trends make the benefits easier to capture
For the first time in history, over half of the world’s population resides in urban areas. By 2020, urban populations are expected to rise by a further 20% to over 4.2 billion, 80% ofthem in developing countries.36 With this steady increase in urbanisation, the associated costs of many of the asset sharing services (see Box 2) and the costs for collecting and treating end-of-use materials are all able to benefit from much higher drop-off and pick-up density, simpler logistics, and greater appeal and scale for service providers. Centralised use should mean that reverse logistics—like the logistics of new product delivery—become more efficient and morecost-effective. The collection of household waste, as one example, will be cheaper due to shorter collection distances, and more efficient due to more frequent collection (increasing the collection rate and reducing waste leakage). Integrated systems are an ideal solution for recovering materials in urban areas, leveraging short transport distances and high population densities.
An example of this is The Plant, Chicago, a vertical aquaponic farm growing tilapia and vegetables that also serves as an incubator for craft food businesses and operates ananaerobic digester and a combined heat and power plant, with the goal of going off the grid in the next one or two years. It serves as a good example where the discarded materialsfrom one business are used as a resource for another— industrial symbiosis. This vertical farm and food incubator plans to house artisan food businesses, including a beerbrewery, bakery, kombucha (fermented tea) brewery, mushroom farm, and a shared kitchen. The spent grains from the beer brewery are fed to tilapia fish, while solids from the tilapia waste are fed to the mushrooms. The farms are much nearer to urban centres, so they promote local sourcing
32 World Economic Forum’s Young Global Leaders Sharing Economy Working Group: Position paper; 2013. Interview with Rachel Botsman, Founder of Collaborative Lab and author, with Roo Rogers, of What’s Mine is Yours: How Collaborative Consumption is Changing the Way we Live, Harper Business, 2010.
33 Geron, T., “Airbnb And The Unstoppable Rise Of The Share Economy”, Forbes, 23 January 2013 (print version: 11 February 2013), (http://www.forbes.com/sites/tomiogeron/2013/01/23/airbnb-and-the-unstoppable-riseof-the-share-economy/).
34 See note 33 above.
35 Johnson, C., “Is Seoul the Next Great Sharing City?” at Shareable, 16 July 2013 (http://www.shareable.net/blog/ is-seoul-the-next-great-sharing-city).
36 Urban World and the Rise of the Consuming Class, June 2012, McKinsey Global Institute.
TOWARDS THE CIRCULAR ECONOMY | 31
Box 2 The ‘sharing economy’ and its implications for the circular economy
The sharing economy is a reinvention of traditional market behaviours towards collaborative consumption models. Rather than simple consumption, the sharing economy is founded on the principle of maximising the utility of assets via renting, lending, swapping, bartering and giving—facilitated by technology. The sharing economy provides the ability to unlock the untapped social, economic and environmental value of underutilised assets.32
About a decade ago, companies such as Zipcar started to capitalise on the idle capacity of cars (unused in the US for an average of 23 hours a day) by developing platforms that charge for usage. Today there are literally hundreds of ways one can share different kinds of assets: space, skills, stuff and time.
The sharing economy is driven by three primary benefits: economic—more efficient and resilient use of financial resources; environmental—more efficient and sustainable use of resources; and communal—deeper social connections among people. All of these are enabled and scaled by technology platforms. Three principal systems operate within the sharing economy and collaborative consumption:
• Redistribution markets reallocate items or services no longer required to someone or somewhere where they are needed. Examples include eBay (auction site) or Craigslist (local classified ads).
• Product service systems allow members to pay for the benefit of using a product without needing to own it outright. Examples
include Zipcar, RelayRides and City CarShare for mobility services, equipment rental from Getable and peer-to-peer (P2P) high-end household rentals from SnapGoods.
• Collaborative lifestyles platforms allow people to share and exchange less tangible assets such as time, skills, money, experience or space. Examples include Skillshare for P2P learning, Airbnb for offering accommodation, and TaskRabbit for outsourcing small jobs and tasks to others in their neighbourhood.
In addition to these three systems, there are a variety of related models of collaborative production, transaction, investment and marketplace creation. Well-known examples include Wikipedia (crowdsourced online encyclopaedia) and Kickstarter (crowdfunding).
All of these systems are enabled by four key principles: trust between strangers, belief in the effective management of common resources, the existence of idle capacity and the build-up of a critical mass of users, customers, consumers, producers and/or members.
The sharing economy is conceivable in nearly any sector of society and corner of the globe. Sectors that have experienced robust traction include accommodation, transportation, tourism, office space, financial services and retail products. Areas where significant growth is expected include P2P car sharing, errand marketplaces, product rental and P2P and social lending. The sharing economy continues to grow at almost breakneck speed. It is estimated that in 2013, more than US$ 3.5 billion in revenues will be generated from transactions in the sharing economy in the US.33 While the
market size is still small, investors are optimistic about the future growth of these business models (e.g. the P2P financial lending market is estimated to reach US$ 5 billion by the end of 2013, and car-sharing revenues in North America alone could hit US$ 3.3 billion by 2016).34
In September 2012, Seoul’s Metropolitan Government announced a new initiative: “Sharing City Seoul.” This includes 20 sharing programmes and policies for generating or diffusing “sharing city” infrastructure. The government regards “sharing city” as a new alternative for social reform that can resolve many economic, social, and environmental issues of the city simultaneously by creating new business opportunities, recovering trust-based relationships, and minimising wastage of resources, as sharing allows the community to gain more benefits with fewer resources, since it enhances the usefulness of resources. Therefore, the government can provide more services to citizens with a smaller budget. For example, a 492-vehicle car sharing service is being introduced together with selected government parking lots and municipal buildings being open to the public during off-hours and idle days. In addition, students who need a room can be connected to senior citizens who have extra rooms, and more.35
Benefits within the circular economy model stem from increased resource productivity, greater ability to keep track of products, components and materials, which increases the opportunity for profitable revalorisation at the end of the respective use cycle as well as allowing suppliers of products and services to capture the benefits of improved circular designs.
32 | TOWARDS THE CIRCULAR ECONOMY
2. Why the time to act is nowContinued
and the supply of fresher food. The shorter transportation distances reduce costs, energy consumption and carbon footprint.37
Advances in technology create ever greateropportunities to accelerate the transitionInformation and industrial technologies are now coming online or being deployed at scale, which support closing the reverse loops. These advances allow better tracking of materials, more efficient collaboration and knowledge sharing, and improved forward and reverse logistics setups, i.e. initial product design and material innovation seamlessly joined up with subsequent processing of secondary material streams.
• Radio-frequency identification (RFID). It is critical to the success of circular business models to have technology to track the whereabouts and condition of materials,components and products as this reduces processing cost. The use of RFID has great capacity to boost materials reuse. Using RFID technology in sorting apparel and textiles at the end of their lives, for example, will enablethe cascade of each type of textile to more suitable and higher-value applications than is the case today. Wider adoption of RFID could be facilitated by falling technology prices.
• The ‘Internet of everything’. Cisco, the American network equipment company, says there are already more ‘things’ connected to the Internet than people—over 12.5 billiondevices in 2010 alone. This number is predicted to grow to 25 billion by 2015, and 50 billion by 2020. Connections today come in the form of home and office IT devices suchas PCs and laptops, mobile smart devices and new connected business and manufacturing devices. In the future, everything is likely to be connected, from container ships and buildings to needles, books, cows, pens, trees and shoes. This interconnectedness will enable tracking efficiency that was previously inconceivable. In the city of Nice, for instance, Cisco and the Think Global alliance are showcasing an Internet of Everything concept called Connected Boulevard. This initiative has equipped the city with hundreds of different sensors and detecting devices that capture data from daily life through the city’s hybridinfrastructure linked up via a Cisco wi-fi network. The data are processed into real-time information and converted into intelligence
with the help of context-aware locationanalytics before being disseminated to multiple city services. The city can expect improvements in traffic flow, less pollution, and could potentially save 20 to 80 per centin electricity bills by calibrating street light intensity with pedestrian and traffic peaks as well as real-time weather conditions such as fog and rain.
As Neil Harris, Head of Sustainable Business at Cisco EMEA, envisions: “The Internet and the new wave of capabilities that the information and communication technology industry is building will provide a critical set of business capabilities that are essential to the robustexpansion of circular economy-inspired business models. The Internet of everything will expose the digital ‘life-story’ of materials, components and products that will allow seamless/automated reintegration of materials back into economic systems, addressing concerns around transparency, ownership, quality and value. In addition, the data collected and knowledge acquired will pave the way for even greater innovation, essentially further accelerating stakeholder interest in the circular economic opportunity.”Rachel Botsman of Collaborative Lab (and World Economic Forum’s Young Global Leader) said during the Circular Economy 100 Annual Summit: “Technology fundamentally creates two things: it basically creates theefficiency to match millions of haves with millions of wants in ways that have never been possible. And equally important, it creates a social glue of trust, meaning exchanges can happen directly between two strangers,where we used to trade and exchange directly through institutions.”39
• Partners for revalorisation. Technologies that facilitate the identification of potential partners for revalorisation to generate end-of-use benefits from liquid markets are essential to identify the best arbitrage opportunity (e.g. trying to sell a used product versus component harvesting and reintegration into the next product). This makes coststhat were previously fixed scalable. Setting up circular ventures (via cloud computing, for example) is one avenue; another is to avoid premature obsolescence (such as encapsulating the innovation into software rather than hardware via exchangeable printed circuit boards).
37 Edel, J., About [The Plant Chicago], undated (http://www.plantchicago.com/).
38 Interview with Neil Harris, Head of Sustainable Business. Cisco websites (http://investor.cisco.com/releasedetail. cfm?ReleaseID=771884).
39 Rachel Botsman’s recorded presentation, June 2013, in the Ellen MacArthur Foundation CE100 library.
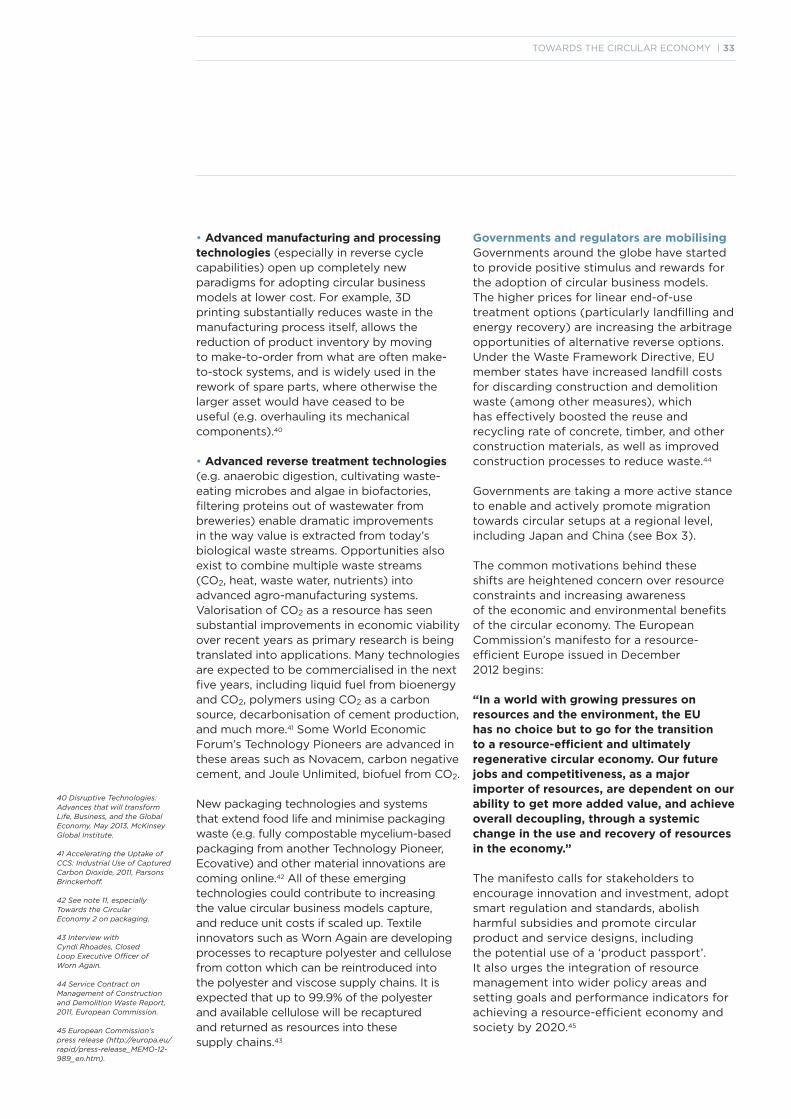
TOWARDS THE CIRCULAR ECONOMY | 33
• Advanced manufacturing and processing technologies (especially in reverse cycle capabilities) open up completely new paradigms for adopting circular business models at lower cost. For example, 3D printing substantially reduces waste in the manufacturing process itself, allows thereduction of product inventory by moving to make-to-order from what are often make-to-stock systems, and is widely used in the rework of spare parts, where otherwise thelarger asset would have ceased to be useful (e.g. overhauling its mechanical components).40
• Advanced reverse treatment technologies (e.g. anaerobic digestion, cultivating waste-eating microbes and algae in biofactories, filtering proteins out of wastewater from breweries) enable dramatic improvements in the way value is extracted from today’s biological waste streams. Opportunities also exist to combine multiple waste streams (CO2, heat, waste water, nutrients) into advanced agro-manufacturing systems. Valorisation of CO2 as a resource has seen substantial improvements in economic viability over recent years as primary research is beingtranslated into applications. Many technologies are expected to be commercialised in the next five years, including liquid fuel from bioenergy and CO2, polymers using CO2 as a carbon source, decarbonisation of cement production, and much more.41 Some World EconomicForum’s Technology Pioneers are advanced in these areas such as Novacem, carbon negative cement, and Joule Unlimited, biofuel from CO2.
New packaging technologies and systems that extend food life and minimise packaging waste (e.g. fully compostable mycelium-based packaging from another Technology Pioneer, Ecovative) and other material innovations are coming online.42 All of these emergingtechnologies could contribute to increasing the value circular business models capture, and reduce unit costs if scaled up. Textile innovators such as Worn Again are developing processes to recapture polyester and cellulosefrom cotton which can be reintroduced into the polyester and viscose supply chains. It is expected that up to 99.9% of the polyester and available cellulose will be recaptured and returned as resources into these supply chains.43
Governments and regulators are mobilisingGovernments around the globe have started to provide positive stimulus and rewards for the adoption of circular business models. The higher prices for linear end-of-use treatment options (particularly landfilling and energy recovery) are increasing the arbitrage opportunities of alternative reverse options. Under the Waste Framework Directive, EUmember states have increased landfill costs for discarding construction and demolition waste (among other measures), which has effectively boosted the reuse and recycling rate of concrete, timber, and other construction materials, as well as improved construction processes to reduce waste.44
Governments are taking a more active stance to enable and actively promote migration towards circular setups at a regional level, including Japan and China (see Box 3).
The common motivations behind these shifts are heightened concern over resource constraints and increasing awarenessof the economic and environmental benefits of the circular economy. The European Commission’s manifesto for a resource-efficient Europe issued in December 2012 begins:
“In a world with growing pressures on resources and the environment, the EU has no choice but to go for the transition to a resource-efficient and ultimately regenerative circular economy. Our future jobs and competitiveness, as a major importer of resources, are dependent on our ability to get more added value, and achieve overall decoupling, through a systemic change in the use and recovery of resources in the economy.”
The manifesto calls for stakeholders to encourage innovation and investment, adopt smart regulation and standards, abolish harmful subsidies and promote circular product and service designs, including the potential use of a ‘product passport’. It also urges the integration of resource management into wider policy areas and setting goals and performance indicators for achieving a resource-efficient economy and society by 2020.45
40 Disruptive Technologies: Advances that will transform Life, Business, and the Global Economy, May 2013, McKinsey Global Institute.
41 Accelerating the Uptake of CCS: Industrial Use of Captured Carbon Dioxide, 2011, Parsons Brinckerhoff.
42 See note 11, especially Towards the CircularEconomy 2 on packaging,
43 Interview with Cyndi Rhoades, Closed Loop Executive Officer of Worn Again.
44 Service Contract on Management of Construction and Demolition Waste Report, 2011, European Commission.
45 European Commission’s press release (http://europa.eu/rapid/press-release_MEMO-12-989_en.htm).
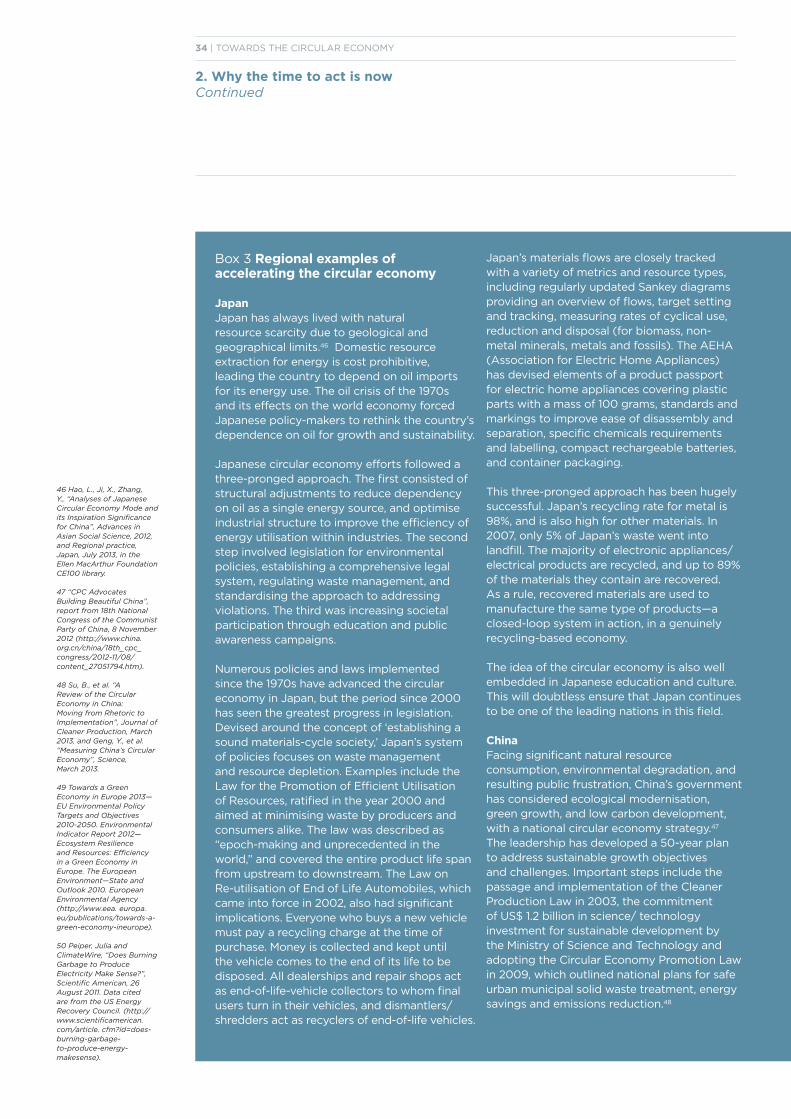
34 | TOWARDS THE CIRCULAR ECONOMY
2. Why the time to act is nowContinued
Box 3 Regional examples of accelerating the circular economy
Japan Japan has always lived with natural resource scarcity due to geological and geographical limits.46 Domestic resource extraction for energy is cost prohibitive, leading the country to depend on oil imports for its energy use. The oil crisis of the 1970s and its effects on the world economy forced Japanese policy-makers to rethink the country’s dependence on oil for growth and sustainability.
Japanese circular economy efforts followed a three-pronged approach. The first consisted of structural adjustments to reduce dependency on oil as a single energy source, and optimise industrial structure to improve the efficiency of energy utilisation within industries. The second step involved legislation for environmental policies, establishing a comprehensive legal system, regulating waste management, and standardising the approach to addressing violations. The third was increasing societal participation through education and public awareness campaigns.
Numerous policies and laws implemented since the 1970s have advanced the circular economy in Japan, but the period since 2000 has seen the greatest progress in legislation. Devised around the concept of ‘establishing a sound materials-cycle society,’ Japan’s system of policies focuses on waste management and resource depletion. Examples include the Law for the Promotion of Efficient Utilisation of Resources, ratified in the year 2000 and aimed at minimising waste by producers and consumers alike. The law was described as “epoch-making and unprecedented in the world,” and covered the entire product life span from upstream to downstream. The Law on Re-utilisation of End of Life Automobiles, which came into force in 2002, also had significant implications. Everyone who buys a new vehicle must pay a recycling charge at the time of purchase. Money is collected and kept until the vehicle comes to the end of its life to be disposed. All dealerships and repair shops act as end-of-life-vehicle collectors to whom final users turn in their vehicles, and dismantlers/ shredders act as recyclers of end-of-life vehicles.
Japan’s materials flows are closely tracked with a variety of metrics and resource types, including regularly updated Sankey diagrams providing an overview of flows, target settingand tracking, measuring rates of cyclical use, reduction and disposal (for biomass, non-metal minerals, metals and fossils). The AEHA (Association for Electric Home Appliances) has devised elements of a product passport for electric home appliances covering plastic parts with a mass of 100 grams, standards and markings to improve ease of disassembly andseparation, specific chemicals requirements and labelling, compact rechargeable batteries, and container packaging.
This three-pronged approach has been hugely successful. Japan’s recycling rate for metal is 98%, and is also high for other materials. In 2007, only 5% of Japan’s waste went intolandfill. The majority of electronic appliances/electrical products are recycled, and up to 89% of the materials they contain are recovered. As a rule, recovered materials are used to manufacture the same type of products—a closed-loop system in action, in a genuinely recycling-based economy.
The idea of the circular economy is also well embedded in Japanese education and culture. This will doubtless ensure that Japan continues to be one of the leading nations in this field.
ChinaFacing significant natural resource consumption, environmental degradation, and resulting public frustration, China’s government has considered ecological modernisation, green growth, and low carbon development, with a national circular economy strategy.47 The leadership has developed a 50-year plan to address sustainable growth objectives and challenges. Important steps include the passage and implementation of the Cleaner Production Law in 2003, the commitment of US$ 1.2 billion in science/ technology investment for sustainable development by the Ministry of Science and Technology and adopting the Circular Economy Promotion Law in 2009, which outlined national plans for safe urban municipal solid waste treatment, energy savings and emissions reduction.48
46 Hao, L., Ji, X., Zhang, Y., “Analyses of Japanese Circular Economy Mode and its Inspiration Significance for China”, Advances in Asian Social Science, 2012, and Regional practice, Japan, July 2013, in the Ellen MacArthur Foundation CE100 library.
47 “CPC Advocates Building Beautiful China”, report from 18th National Congress of the Communist Party of China, 8 November 2012 (http://www.china.org.cn/china/18th_cpc_congress/2012-11/08/content_27051794.htm).
48 Su, B., et al. “A Review of the Circular Economy in China: Moving from Rhetoric to Implementation”, Journal of Cleaner Production, March 2013, and Geng, Y., et al. “Measuring China’s Circular Economy”, Science, March 2013.
49 Towards a Green Economy in Europe 2013—EU Environmental Policy Targets and Objectives 2010-2050. Environmental Indicator Report 2012—Ecosystem Resilience and Resources: Efficiency in a Green Economy in Europe. The European Environment—State and Outlook 2010. European Environmental Agency (http://www.eea. europa.eu/publications/towards-a-green-economy-ineurope).
50 Peiper, Julia and ClimateWire, “Does Burning Garbage to Produce Electricity Make Sense?”, Scientific American, 26 August 2011. Data cited are from the US Energy Recovery Council. (http://www.scientificamerican.com/article. cfm?id=does-burning-garbage-to-produce-energy-makesense).
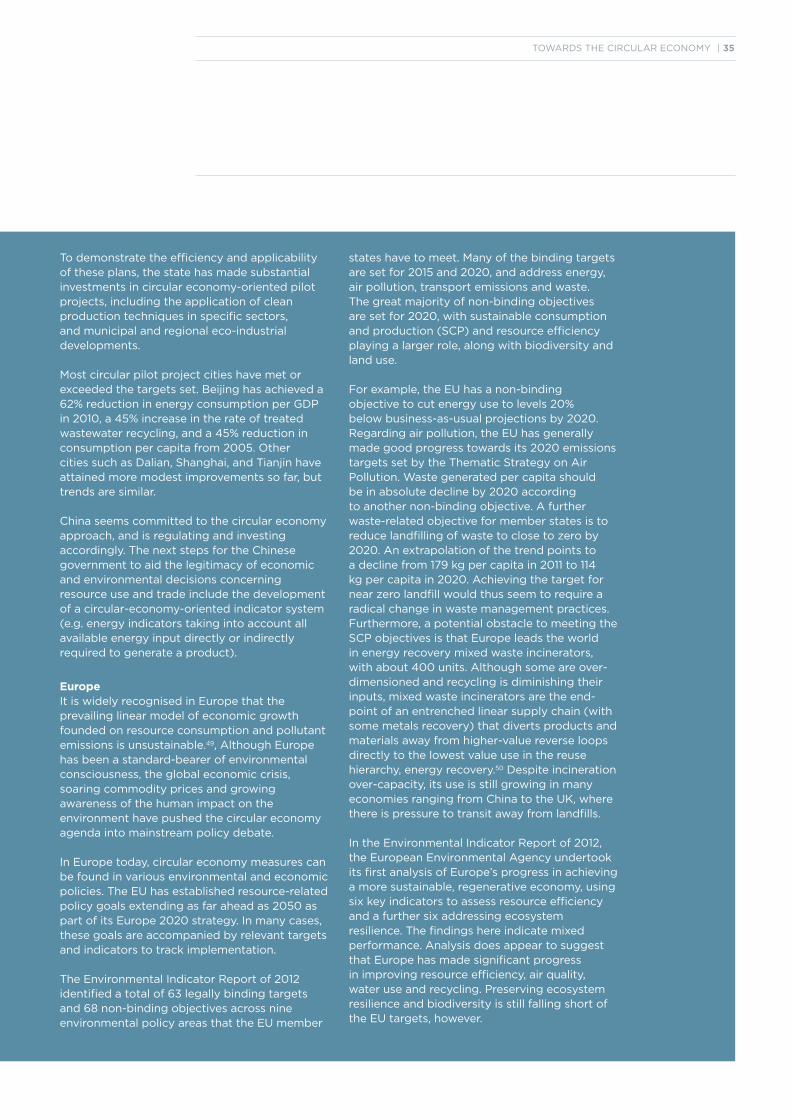
TOWARDS THE CIRCULAR ECONOMY | 35
To demonstrate the efficiency and applicability of these plans, the state has made substantial investments in circular economy-oriented pilot projects, including the application of clean production techniques in specific sectors, and municipal and regional eco-industrial developments.
Most circular pilot project cities have met or exceeded the targets set. Beijing has achieved a 62% reduction in energy consumption per GDP in 2010, a 45% increase in the rate of treated wastewater recycling, and a 45% reduction inconsumption per capita from 2005. Other cities such as Dalian, Shanghai, and Tianjin have attained more modest improvements so far, but trends are similar.
China seems committed to the circular economy approach, and is regulating and investing accordingly. The next steps for the Chinese government to aid the legitimacy of economic and environmental decisions concerning resource use and trade include the development of a circular-economy-oriented indicator system (e.g. energy indicators taking into account all available energy input directly or indirectly required to generate a product).
EuropeIt is widely recognised in Europe that the prevailing linear model of economic growth founded on resource consumption and pollutant emissions is unsustainable.49, Although Europe has been a standard-bearer of environmental consciousness, the global economic crisis, soaring commodity prices and growing awareness of the human impact on the environment have pushed the circular economy agenda into mainstream policy debate.
In Europe today, circular economy measures can be found in various environmental and economic policies. The EU has established resource-related policy goals extending as far ahead as 2050 as part of its Europe 2020 strategy. In many cases, these goals are accompanied by relevant targets and indicators to track implementation.
The Environmental Indicator Report of 2012 identified a total of 63 legally binding targets and 68 non-binding objectives across nine environmental policy areas that the EU member
states have to meet. Many of the binding targets are set for 2015 and 2020, and address energy, air pollution, transport emissions and waste. The great majority of non-binding objectives are set for 2020, with sustainable consumption and production (SCP) and resource efficiency playing a larger role, along with biodiversity and land use.
For example, the EU has a non-binding objective to cut energy use to levels 20% below business-as-usual projections by 2020. Regarding air pollution, the EU has generally made good progress towards its 2020 emissions targets set by the Thematic Strategy on Air Pollution. Waste generated per capita should be in absolute decline by 2020 according to another non-binding objective. A further waste-related objective for member states is to reduce landfilling of waste to close to zero by 2020. An extrapolation of the trend points to a decline from 179 kg per capita in 2011 to 114 kg per capita in 2020. Achieving the target for near zero landfill would thus seem to require a radical change in waste management practices. Furthermore, a potential obstacle to meeting the SCP objectives is that Europe leads the world in energy recovery mixed waste incinerators, with about 400 units. Although some are over-dimensioned and recycling is diminishing their inputs, mixed waste incinerators are the end-point of an entrenched linear supply chain (with some metals recovery) that diverts products and materials away from higher-value reverse loops directly to the lowest value use in the reuse hierarchy, energy recovery.50 Despite incineration over-capacity, its use is still growing in many economies ranging from China to the UK, where there is pressure to transit away from landfills.
In the Environmental Indicator Report of 2012, the European Environmental Agency undertook its first analysis of Europe’s progress in achieving a more sustainable, regenerative economy, using six key indicators to assess resource efficiency and a further six addressing ecosystem resilience. The findings here indicate mixed performance. Analysis does appear to suggest that Europe has made significant progress in improving resource efficiency, air quality, water use and recycling. Preserving ecosystem resilience and biodiversity is still falling short of the EU targets, however.
36 | TOWARDS THE CIRCULAR ECONOMY
2. Why the time to act is nowContinued
Japan focuses its efforts on resource management using a comprehensive set of regulations on waste management. The country has had significant success in reducing waste and improving recycling rates (e.g. 98% of metals are recycled and only 5% of waste goes to landfill). In China, the recently enacted 12th five-year plan (2011 - 2015) for economic and social development suggests continuous implementation and further development of the circular economy with the ‘Circular Economy Promotion Law of the People’s Republic of China’ (see Box 3).
While status quo lock-in is a fact of life during any transition period, the linear economy lock-in is weakening under the pressure of several disruptive trends. As discussed, higherresource prices and volatility are here to stay. Businesses are in search of a ‘better hedge’ against potential problems in obtaining the resources they need. Many innovators andrapid transformers will be able to take advantage of these disruptions as growing profit pools. Enterprises that extract value from resources currently being wasted will likely reap higher rewards, while take-make-dispose businesses will likely find their economies of scale less powerful in the competitive race than in the past.
With pressures mounting and a well-aligned ability to act in many areas, many participants at the circular economy session during the World Economic Forum’s 2013 AnnualMeeting and the Young Global Leaders Taskforce felt strongly that: “Surely the time to act is now”.

13
What are the leakage points?
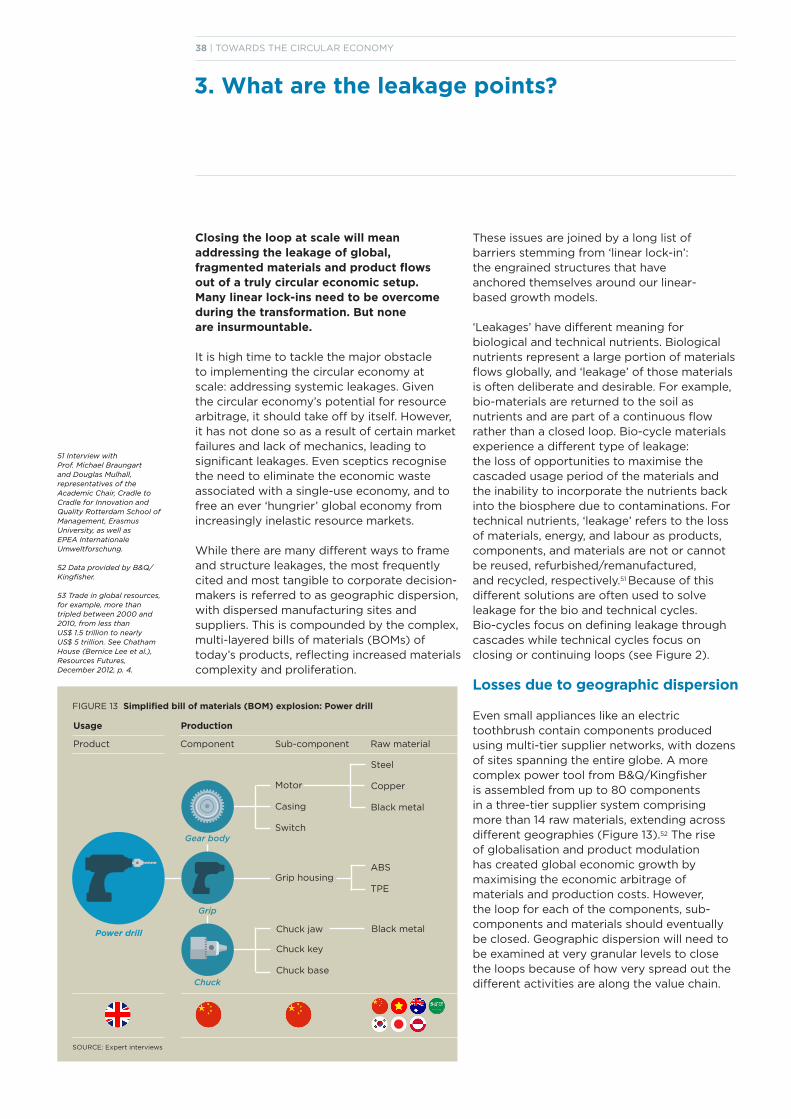
38 | TOWARDS THE CIRCULAR ECONOMY
3. What are the leakage points?
Closing the loop at scale will mean addressing the leakage of global, fragmented materials and product flows out of a truly circular economic setup. Many linear lock-ins need to be overcome during the transformation. But none are insurmountable.
It is high time to tackle the major obstacle to implementing the circular economy at scale: addressing systemic leakages. Given the circular economy’s potential for resource arbitrage, it should take off by itself. However, it has not done so as a result of certain market failures and lack of mechanics, leading to significant leakages. Even sceptics recognise the need to eliminate the economic waste associated with a single-use economy, and to free an ever ‘hungrier’ global economy from increasingly inelastic resource markets.
While there are many different ways to frame and structure leakages, the most frequently cited and most tangible to corporate decision-makers is referred to as geographic dispersion, with dispersed manufacturing sites and suppliers. This is compounded by the complex, multi-layered bills of materials (BOMs) of today’s products, reflecting increased materials complexity and proliferation.
These issues are joined by a long list of barriers stemming from ‘linear lock-in’: the engrained structures that have anchored themselves around our linear-based growth models.
‘Leakages’ have different meaning for biological and technical nutrients. Biological nutrients represent a large portion of materials flows globally, and ‘leakage’ of those materials is often deliberate and desirable. For example, bio-materials are returned to the soil as nutrients and are part of a continuous flow rather than a closed loop. Bio-cycle materials experience a different type of leakage: the loss of opportunities to maximise the cascaded usage period of the materials and the inability to incorporate the nutrients back into the biosphere due to contaminations. For technical nutrients, ‘leakage’ refers to the loss of materials, energy, and labour as products, components, and materials are not or cannot be reused, refurbished/remanufactured, and recycled, respectively.51 Because of this different solutions are often used to solve leakage for the bio and technical cycles. Bio-cycles focus on defining leakage through cascades while technical cycles focus on closing or continuing loops (see Figure 2).
Losses due to geographic dispersion
Even small appliances like an electric toothbrush contain components produced using multi-tier supplier networks, with dozens of sites spanning the entire globe. A more complex power tool from B&Q/Kingfisher is assembled from up to 80 components in a three-tier supplier system comprising more than 14 raw materials, extending across different geographies (Figure 13).52 The rise of globalisation and product modulation has created global economic growth by maximising the economic arbitrage of materials and production costs. However, the loop for each of the components, sub-components and materials should eventually be closed. Geographic dispersion will need to be examined at very granular levels to close the loops because of how very spread out the different activities are along the value chain.
FIGURE 13 Simplified bill of materials (BOM) explosion: Power drill
Motor
Casing
Switch
Grip housing
Chuck jaw
Chuck key
Chuck base
Black metal
ABS
TPE
Steel
Copper
Black metal
SOURCE: Expert interviews
Usage
Product Sub-component Raw material
Gear body
Grip
Chuck
Power drill
51 Interview with Prof. Michael Braungart and Douglas Mulhall, representatives of the Academic Chair, Cradle to Cradle for Innovation and Quality Rotterdam School ofManagement, Erasmus University, as well as EPEA Internationale Umweltforschung.
52 Data provided by B&Q/Kingfisher.
53 Trade in global resources, for example, more than tripled between 2000 and 2010, from less than US$ 1.5 trillion to nearly US$ 5 trillion. See Chatham House (Bernice Lee et al.), Resources Futures, December 2012, p. 4.
Component
Production
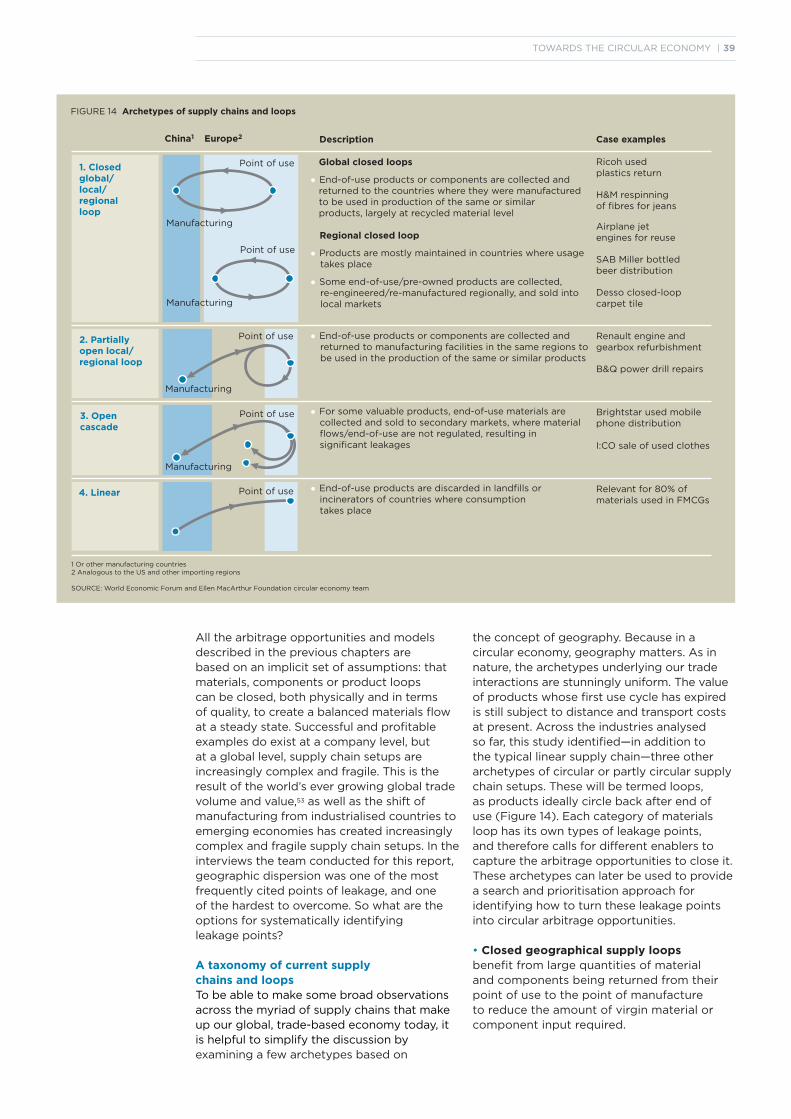
TOWARDS THE CIRCULAR ECONOMY | 39
All the arbitrage opportunities and models described in the previous chapters are based on an implicit set of assumptions: that materials, components or product loopscan be closed, both physically and in terms of quality, to create a balanced materials flow at a steady state. Successful and profitable examples do exist at a company level, but at a global level, supply chain setups are increasingly complex and fragile. This is the result of the world’s ever growing global trade volume and value,53 as well as the shift ofmanufacturing from industrialised countries to emerging economies has created increasingly complex and fragile supply chain setups. In the interviews the team conducted for this report, geographic dispersion was one of the mostfrequently cited points of leakage, and one of the hardest to overcome. So what are the options for systematically identifying leakage points?
A taxonomy of current supply chains and loopsTo be able to make some broad observations across the myriad of supply chains that make up our global, trade-based economy today, it is helpful to simplify the discussion byexamining a few archetypes based on
the concept of geography. Because in a circular economy, geography matters. As in nature, the archetypes underlying our trade interactions are stunningly uniform. The value of products whose first use cycle has expired is still subject to distance and transport costs at present. Across the industries analysed so far, this study identified—in addition to the typical linear supply chain—three other archetypes of circular or partly circular supply chain setups. These will be termed loops, as products ideally circle back after end of use (Figure 14). Each category of materials loop has its own types of leakage points, and therefore calls for different enablers to capture the arbitrage opportunities to close it. These archetypes can later be used to provide a search and prioritisation approach for identifying how to turn these leakage points into circular arbitrage opportunities.
• Closed geographical supply loops benefit from large quantities of material and components being returned from their point of use to the point of manufacture to reduce the amount of virgin material or component input required.
FIGURE 14 Archetypes of supply chains and loops
Description
Global closed loops
• End-of-use products or components are collected and returned to the countries where they were manufactured to be used in production of the same or similar products, largely at recycled material level
Regional closed loop
• Products are mostly maintained in countries where usage takes place
• Some end-of-use/pre-owned products are collected, re-engineered/re-manufactured regionally, and sold into local markets
• End-of-use products or components are collected and returned to manufacturing facilities in the same regions to be used in the production of the same or similar products
• For some valuable products, end-of-use materials are collected and sold to secondary markets, where material flows/end-of-use are not regulated, resulting in significant leakages
• End-of-use products are discarded in landfills or incinerators of countries where consumption takes place
1 Or other manufacturing countries2 Analogous to the US and other importing regions
SOURCE: World Economic Forum and Ellen MacArthur Foundation circular economy team
Point of use
Point of use
Point of use
Point of use
Manufacturing
Manufacturing
Manufacturing
Manufacturing
Point of use
1. Closedglobal/ local/ regional loop
2. Partially open local/regional loop
3. Open cascade
4. Linear
Case examples
Ricoh used plastics return
H&M respinning of fibres for jeans
Airplane jet engines for reuse
SAB Miller bottled beer distribution
Desso closed-loop carpet tile
Renault engine and gearbox refurbishment
B&Q power drill repairs
Brightstar used mobile phone distribution
I:CO sale of used clothes
Relevant for 80% of materials used in FMCGs
China1 Europe2
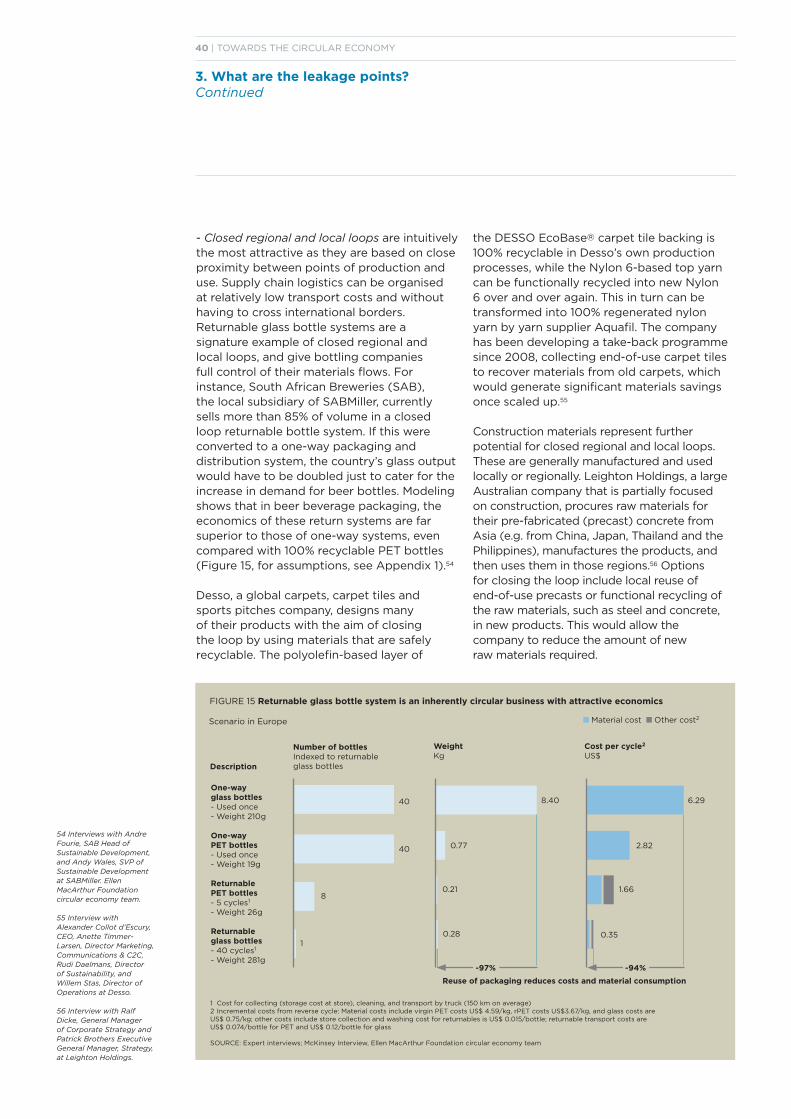
40 | TOWARDS THE CIRCULAR ECONOMY
3. What are the leakage points?Continued
- Closed regional and local loops are intuitively the most attractive as they are based on close proximity between points of production and use. Supply chain logistics can be organised at relatively low transport costs and without having to cross international borders.Returnable glass bottle systems are a signature example of closed regional and local loops, and give bottling companies full control of their materials flows. For instance, South African Breweries (SAB), the local subsidiary of SABMiller, currently sells more than 85% of volume in a closed loop returnable bottle system. If this were converted to a one-way packaging and distribution system, the country’s glass output would have to be doubled just to cater for the increase in demand for beer bottles. Modeling shows that in beer beverage packaging, the economics of these return systems are far superior to those of one-way systems, even compared with 100% recyclable PET bottles (Figure 15, for assumptions, see Appendix 1).54
Desso, a global carpets, carpet tiles and sports pitches company, designs many of their products with the aim of closing the loop by using materials that are safely recyclable. The polyolefin-based layer of
the DESSO EcoBase® carpet tile backing is 100% recyclable in Desso’s own production processes, while the Nylon 6-based top yarn can be functionally recycled into new Nylon 6 over and over again. This in turn can be transformed into 100% regenerated nylon yarn by yarn supplier Aquafil. The company has been developing a take-back programme since 2008, collecting end-of-use carpet tiles to recover materials from old carpets, which would generate significant materials savings once scaled up.55
Construction materials represent further potential for closed regional and local loops. These are generally manufactured and used locally or regionally. Leighton Holdings, a large Australian company that is partially focused on construction, procures raw materials for their pre-fabricated (precast) concrete from Asia (e.g. from China, Japan, Thailand and the Philippines), manufactures the products, and then uses them in those regions.56 Options for closing the loop include local reuse of end-of-use precasts or functional recycling of the raw materials, such as steel and concrete, in new products. This would allow the company to reduce the amount of new raw materials required.
FIGURE 15 Returnable glass bottle system is an inherently circular business with attractive economics
One-way glass bottles- Used once- Weight 210g
One-way PET bottles- Used once- Weight 19g
Returnable PET bottles- 5 cycles1
- Weight 26g
Returnable glass bottles- 40 cycles1
- Weight 281g-97% -94%
1 Cost for collecting (storage cost at store), cleaning, and transport by truck (150 km on average)2 Incremental costs from reverse cycle: Material costs include virgin PET costs US$ 4.59/kg, rPET costs US$3.67/kg, and glass costs are US$ 0.75/kg; other costs include store collection and washing cost for returnables is US$ 0.015/bottle; returnable transport costs are US$ 0.074/bottle for PET and US$ 0.12/bottle for glass SOURCE: Expert interviews; McKinsey Interview, Ellen MacArthur Foundation circular economy team
40
40
8.40 6.29
0.77
0.21
0.281
8
0.35
1.66
2.82
WeightKg
Cost per cycle2
US$Number of bottlesIndexed to returnable glass bottlesDescription
n Material cost n Other cost2Scenario in Europe
Reuse of packaging reduces costs and material consumption
54 Interviews with Andre Fourie, SAB Head of Sustainable Development, and Andy Wales, SVP of Sustainable Development at SABMiller. Ellen MacArthur Foundation circular economy team.
55 Interview with Alexander Collot d’Escury, CEO, Anette Timmer-Larsen, Director Marketing, Communications & C2C, Rudi Daelmans, Director of Sustainability, and Willem Stas, Director of Operations at Desso.
56 Interview with Ralf Dicke, General Manager of Corporate Strategy and Patrick Brothers Executive General Manager, Strategy, at Leighton Holdings.
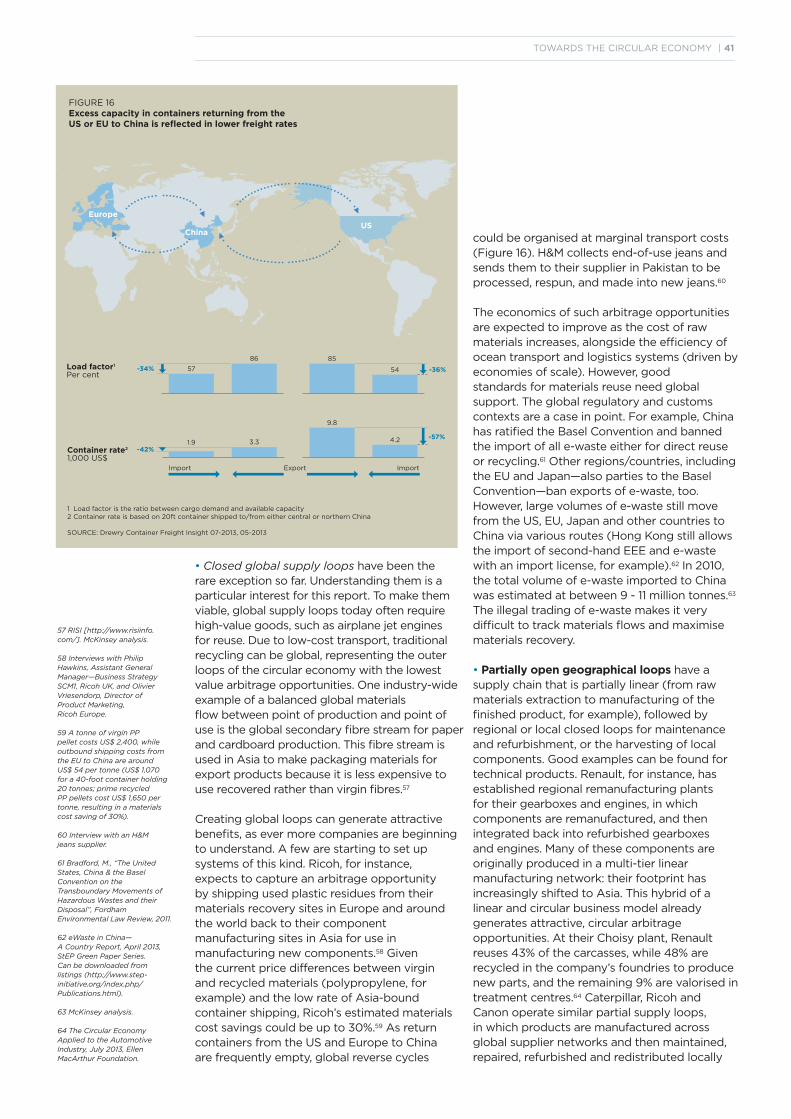
TOWARDS THE CIRCULAR ECONOMY | 41
• Closed global supply loops have been the rare exception so far. Understanding them is a particular interest for this report. To make them viable, global supply loops today often require high-value goods, such as airplane jet engines for reuse. Due to low-cost transport, traditional recycling can be global, representing the outer loops of the circular economy with the lowest value arbitrage opportunities. One industry-wide example of a balanced global materialsflow between point of production and point of use is the global secondary fibre stream for paper and cardboard production. This fibre stream is used in Asia to make packaging materials for export products because it is less expensive to use recovered rather than virgin fibres.57
Creating global loops can generate attractive benefits, as ever more companies are beginning to understand. A few are starting to set up systems of this kind. Ricoh, for instance,expects to capture an arbitrage opportunity by shipping used plastic residues from their materials recovery sites in Europe and around the world back to their component manufacturing sites in Asia for use in manufacturing new components.58 Given the current price differences between virgin and recycled materials (polypropylene, for example) and the low rate of Asia-bound container shipping, Ricoh’s estimated materials cost savings could be up to 30%.59 As return containers from the US and Europe to China are frequently empty, global reverse cycles
could be organised at marginal transport costs (Figure 16). H&M collects end-of-use jeans and sends them to their supplier in Pakistan to be processed, respun, and made into new jeans.60
The economics of such arbitrage opportunities are expected to improve as the cost of raw materials increases, alongside the efficiency of ocean transport and logistics systems (driven by economies of scale). However, goodstandards for materials reuse need global support. The global regulatory and customs contexts are a case in point. For example, China has ratified the Basel Convention and banned the import of all e-waste either for direct reuse or recycling.61 Other regions/countries, including the EU and Japan—also parties to the Basel Convention—ban exports of e-waste, too. However, large volumes of e-waste still move from the US, EU, Japan and other countries to China via various routes (Hong Kong still allows the import of second-hand EEE and e-waste with an import license, for example).62 In 2010, the total volume of e-waste imported to China was estimated at between 9 - 11 million tonnes.63 The illegal trading of e-waste makes it very difficult to track materials flows and maximise materials recovery.
• Partially open geographical loops have a supply chain that is partially linear (from raw materials extraction to manufacturing of the finished product, for example), followed by regional or local closed loops for maintenanceand refurbishment, or the harvesting of local components. Good examples can be found for technical products. Renault, for instance, has established regional remanufacturing plants for their gearboxes and engines, in which components are remanufactured, and then integrated back into refurbished gearboxes and engines. Many of these components are originally produced in a multi-tier linearmanufacturing network: their footprint has increasingly shifted to Asia. This hybrid of a linear and circular business model already generates attractive, circular arbitrageopportunities. At their Choisy plant, Renault reuses 43% of the carcasses, while 48% are recycled in the company’s foundries to produce new parts, and the remaining 9% are valorised in treatment centres.64 Caterpillar, Ricoh andCanon operate similar partial supply loops, in which products are manufactured across global supplier networks and then maintained, repaired, refurbished and redistributed locally
FIGURE 16 Excess capacity in containers returning from the US or EU to China is reflected in lower freight rates
57
86 85
54 -36%
-57%
-34%
Europe
Load factor1
Per cent
Container rate2
1,000 US$-42%
1.9 3.3
Import ImportExport
1 Load factor is the ratio between cargo demand and available capacity2 Container rate is based on 20ft container shipped to/from either central or northern China SOURCE: Drewry Container Freight Insight 07-2013, 05-2013
ChinaUS
9.8
4.2
57 RISI [http://www.risiinfo.com/]. McKinsey analysis.
58 Interviews with Philip Hawkins, Assistant GeneralManager—Business Strategy SCM1, Ricoh UK, and OlivierVriesendorp, Director of Product Marketing, Ricoh Europe.
59 A tonne of virgin PP pellet costs US$ 2,400, while outbound shipping costs from the EU to China are around US$ 54 per tonne (US$ 1,070 for a 40-foot container holding 20 tonnes; prime recycled PP pellets cost US$ 1,650 per tonne, resulting in a materials cost saving of 30%).
60 Interview with an H&M jeans supplier.
61 Bradford, M., “The United States, China & the BaselConvention on the Transboundary Movements ofHazardous Wastes and their Disposal”, FordhamEnvironmental Law Review, 2011.
62 eWaste in China—A Country Report, April 2013, StEP Green Paper Series. Can be downloaded from listings (http://www.step-initiative.org/index.php/Publications.html).
63 McKinsey analysis.
64 The Circular Economy Applied to the Automotive Industry, July 2013, Ellen MacArthur Foundation.
42 | TOWARDS THE CIRCULAR ECONOMY
3. What are the leakage points?Continued
for the respective local markets.65 The circular benefits of this stem from the prolonged use of materials and products and the offsetting of virgin materials input and embedded energy, labour and capital expenditure.
Geographically open cascades move products, components, and materials—after their initial usage cycle(s)—to different markets or market segments, frequently in other regions, for secondary use. Today, some 30 to 40% of worn clothing collected in the US and Europe is sold second-hand overseas.66 The US alone exports worn garments with a total value of over US$ 12 billion p.a., mainly to Central and South America, China and Sub-Saharan Africa.67 Its trade in second-hand mobile devices and other consumer electronic equipment is alsovibrant. The US exported a total value of US$ 1.5 billion in 2011 (or 760,000 tonnes) of used electronic products for refurbishment or recycling, mainly to Mexico, India, Hong Kong, China and other Asia-Pacific markets.68
Companies around the world are waking up to the opportunities of the end-of-use product trade. One example is Brightstar Corporation, a US-based company founded in 1997 that offers specialised global wireless distribution and services, including buy-back and trade-in solutions for mobile devices.69 Their consolidated revenues increased by 11.4% from US$ 5.7 billion in 2011 to US$ 6.3 billion in 2012, outpacing the industry’s growth. Similar cascades across different products—from trousers to furniture fillings to insulation materials, for example—are also organised across geographies, frequently from the northern to the southern hemisphere.
While these cascades prolong product utility at a global level, offsetting the input of virgin materials, they also destabilise materials streams and cause leakages from global or local loops. This is mostly because the net importing regions for cascaded goods—including many developing countries—have not yet fully implemented international conventions or established uniform regulations on the re-entry of products and components into global recycling loops. In many developing countries, including China,
India and Brazil, the collection and recycling of valuable end-of-use materials are often driven by the informal sector. This results in inefficient reprocessing, as well as health and safety hazards for the workers involved.
In China, for instance, the formal sector is well integrated and yet only covers around 20% of the e-waste (WEEE) collected.70 The formal sector could extract more value from the same piece of e-waste than their informal counterparts; this could be improved further if the products themselves were designed with resource recovery in mind. In the garments sector, Switzerland-based I:CO is working on revalorising pre-owned garments by cascading them into Sub-Saharan Africa and building up collection schemes to capture end-of-use streams. However, I:CO faces initial challenges due to the lack of formalised collection schemes.71 Therefore, up to now, a large amount of materials that could serve as feedstock for global recycling loops is still lost.
• Open linear materials take-make-dispose still vastly dominate supply chain logistics. Products are made in a sophisticated multi-tier manufacturing network, used, and then disposed of in landfills. China, Bangladesh, Vietnam, Thailand and Turkey account for 75% of the world’s garment production, whereas use is concentrated in Europe, the US, China and Japan.72 According to I:CO. the global collection rate for clothing is only 20%, while 80% ends up in landfill. Estimates suggest that the figures for all fast-moving consumer goods sectors are similar: only 20% of the total materials value of US$ 3.2 trillion is recovered, while 80% goes to waste.73 Some of today’s highest volume waste streams are open linear flows, including construction and demolition, food and beverages. Rubble produced during the construction and demolition of buildings accounts for 26% of the total non-industrial solid waste produced in the United States—160 million tonnes in 2008. This despite the fact that it includes many recyclable materials, from steel to wood and concrete. Only 20 to 30% of all construction and demolition waste is ultimately recycled or reused.74
65 Towards the Circular Economy 1, January 2012, Ellen MacArthur Foundation. Canon’s website: “Canon responds to customer demand with a new range of remanufactured MFDs”, 8 May 2013 (http://www.canon.co.uk/About_Us/ Press_Centre/Press_Releases/Business_Solutions_ News/1H13/new_range_remanufactured_MFDs.aspx).
66 European Commission’s Recycling Textile project (http:// ec.europa.eu/research/growth/gcc/projects/recyclingtextiles. html); Council for Textile Recycling.
67 WTO Trade database.
68 Used Electronic Products: An Examination of USExports, 2013, United States International TradeCommission.
69 Interviews with Jesus Lebena, Vice President, LatinAmerica Supply Chain & Operations, and Maria Menacho, Chief of Staff, at Brightstar Corp.
70 Euromonitor; expert interviews.
71 Interview with Paul Doertenbach, Global Account Manager of I:CO.
72 Textile & Apparel Compendium, 2012, Technopak.
73 Towards the Circular Economy 2, January 2013, Ellen MacArthur Foundation.
74 Buildings and their Impact on the Environment: AStatistical Summary, revised 22 April 2009, US EPA.
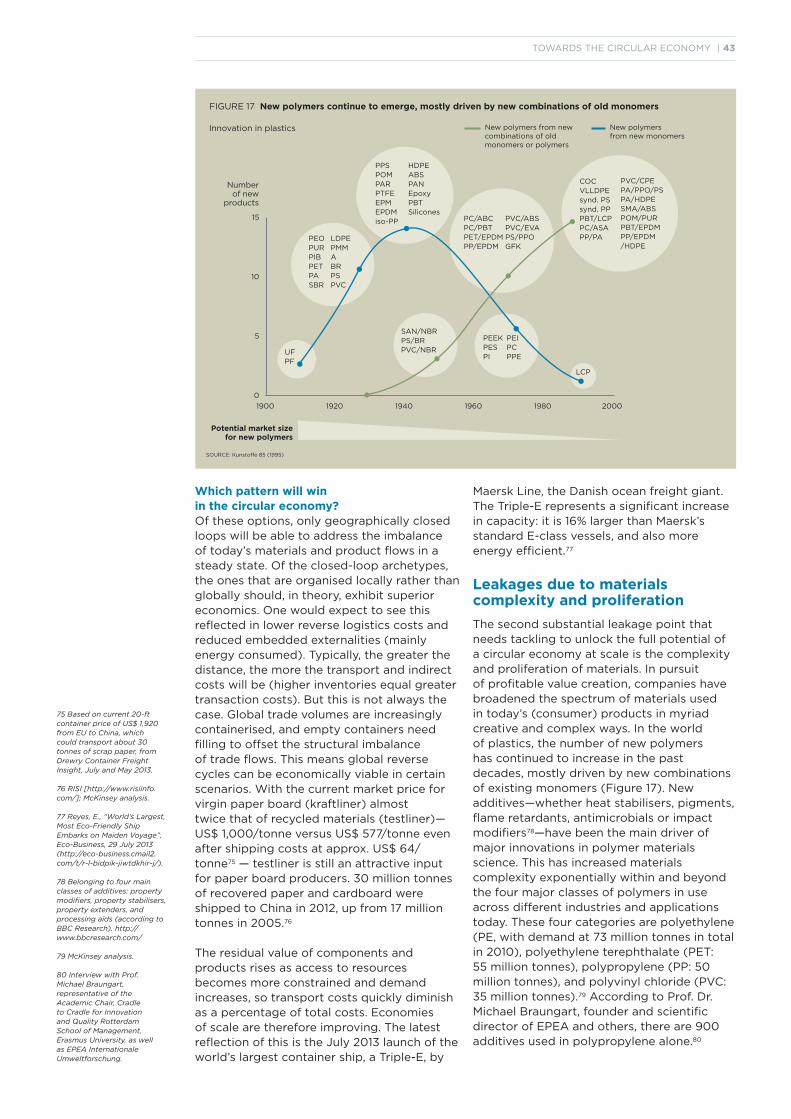
TOWARDS THE CIRCULAR ECONOMY | 43
Which pattern will win in the circular economy?Of these options, only geographically closed loops will be able to address the imbalance of today’s materials and product flows in a steady state. Of the closed-loop archetypes, the ones that are organised locally rather than globally should, in theory, exhibit superior economics. One would expect to see this reflected in lower reverse logistics costs and reduced embedded externalities (mainly energy consumed). Typically, the greater the distance, the more the transport and indirect costs will be (higher inventories equal greater transaction costs). But this is not always the case. Global trade volumes are increasingly containerised, and empty containers need filling to offset the structural imbalance of trade flows. This means global reverse cycles can be economically viable in certain scenarios. With the current market price for virgin paper board (kraftliner) almosttwice that of recycled materials (testliner)—US$ 1,000/tonne versus US$ 577/tonne even after shipping costs at approx. US$ 64/tonne75 — testliner is still an attractive input for paper board producers. 30 million tonnes of recovered paper and cardboard were shipped to China in 2012, up from 17 million tonnes in 2005.76
The residual value of components and products rises as access to resources becomes more constrained and demand increases, so transport costs quickly diminish as a percentage of total costs. Economies of scale are therefore improving. The latest reflection of this is the July 2013 launch of the world’s largest container ship, a Triple-E, by
Maersk Line, the Danish ocean freight giant. The Triple-E represents a significant increase in capacity: it is 16% larger than Maersk’s standard E-class vessels, and also more energy efficient.77
Leakages due to materials complexity and proliferation
The second substantial leakage point that needs tackling to unlock the full potential of a circular economy at scale is the complexity and proliferation of materials. In pursuit of profitable value creation, companies have broadened the spectrum of materials used in today’s (consumer) products in myriad creative and complex ways. In the world of plastics, the number of new polymers has continued to increase in the past decades, mostly driven by new combinations of existing monomers (Figure 17). New additives—whether heat stabilisers, pigments, flame retardants, antimicrobials or impact modifiers78—have been the main driver of major innovations in polymer materials science. This has increased materials complexity exponentially within and beyond the four major classes of polymers in use across different industries and applications today. These four categories are polyethylene (PE, with demand at 73 million tonnes in total in 2010), polyethylene terephthalate (PET: 55 million tonnes), polypropylene (PP: 50 million tonnes), and polyvinyl chloride (PVC: 35 million tonnes).79 According to Prof. Dr. Michael Braungart, founder and scientific director of EPEA and others, there are 900 additives used in polypropylene alone.80
FIGURE 17 New polymers continue to emerge, mostly driven by new combinations of old monomers
1900 1920 1940 1960 1980 2000
15
10
5
0
Number of new
products
Potential market size for new polymers
SOURCE: Kunstoffe 85 (1995)
Innovation in plastics New polymers from new monomers
HDPEABSPANEpoxyPBTSilicones
PPSPOMPARPTFEEPMEPDMiso-PP
PEOPURPIBPETPASBR
LDPEPMMABRPSPVC
UFPF
SAN/NBRPS/BRPVC/NBR
PC/ABCPC/PBTPET/EPDMPP/EPDM
PVC/ABSPVC/EVAPS/PPOGFK
COCVLLDPEsynd. PSsynd. PPPBT/LCPPC/ASAPP/PA
PVC/CPEPA/PPO/PSPA/HDPESMA/ABSPOM/PURPBT/EPDMPP/EPDM/HDPE
New polymers from new combinations of old monomers or polymers
PEEKPESPI
PEIPCPPE
LCP
75 Based on current 20-ft container price of US$ 1,920 from EU to China, which could transport about 30 tonnes of scrap paper, from Drewry Container Freight Insight, July and May 2013.
76 RISI [http://www.risiinfo.com/]; McKinsey analysis.
77 Reyes, E., “World’s Largest, Most Eco-Friendly ShipEmbarks on Maiden Voyage”, Eco-Business, 29 July 2013(http://eco-business.cmail2.com/t/r-l-bidpik-jiwtdkhir-j/).
78 Belonging to four main classes of additives: propertymodifiers, property stabilisers, property extenders, andprocessing aids (according to BBC Research). http://www.bbcresearch.com/
79 McKinsey analysis.
80 Interview with Prof. Michael Braungart, representative of the Academic Chair, Cradle to Cradle for Innovation and Quality Rotterdam School of Management, Erasmus University, as well as EPEA Internationale Umweltforschung.
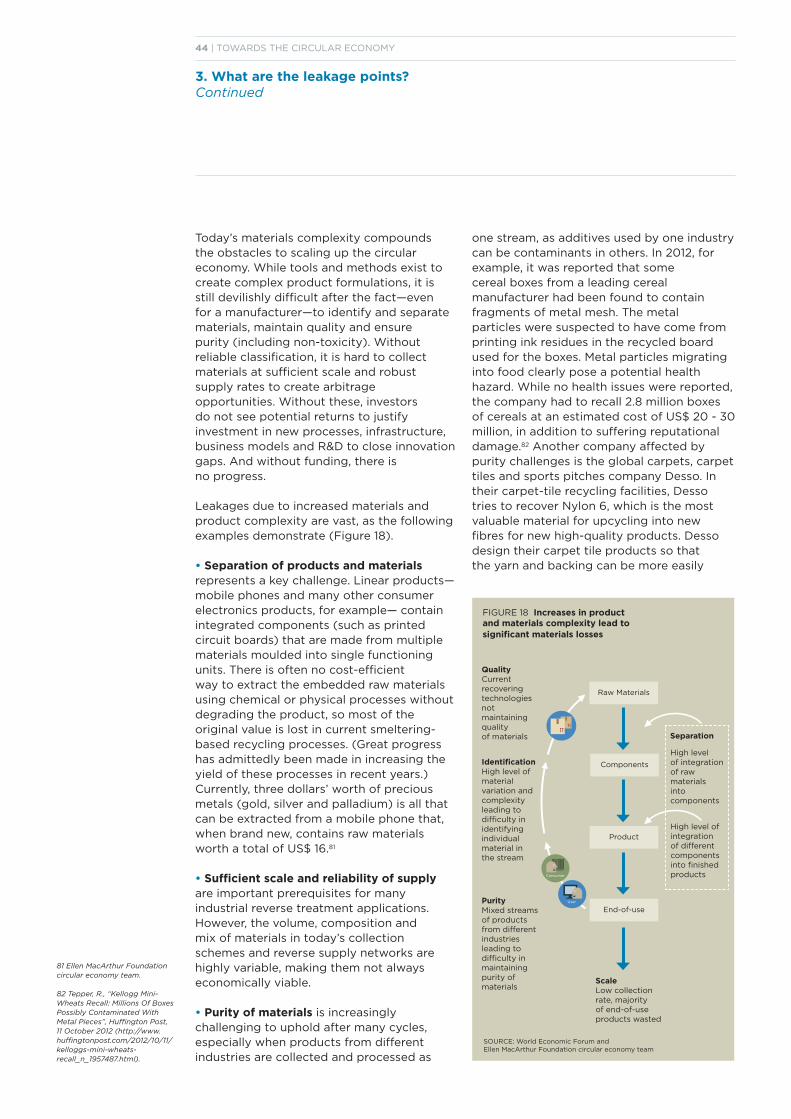
44 | TOWARDS THE CIRCULAR ECONOMY
3. What are the leakage points?Continued
Today’s materials complexity compounds the obstacles to scaling up the circular economy. While tools and methods exist to create complex product formulations, it is still devilishly difficult after the fact—even for a manufacturer—to identify and separate materials, maintain quality and ensurepurity (including non-toxicity). Without reliable classification, it is hard to collect materials at sufficient scale and robustsupply rates to create arbitrage opportunities. Without these, investors do not see potential returns to justify investment in new processes, infrastructure, business models and R&D to close innovation gaps. And without funding, there is no progress.
Leakages due to increased materials and product complexity are vast, as the following examples demonstrate (Figure 18).
• Separation of products and materials represents a key challenge. Linear products—mobile phones and many other consumer electronics products, for example— contain integrated components (such as printed circuit boards) that are made from multiple materials moulded into single functioning units. There is often no cost-efficientway to extract the embedded raw materials using chemical or physical processes without degrading the product, so most of the original value is lost in current smeltering-based recycling processes. (Great progress has admittedly been made in increasing the yield of these processes in recent years.) Currently, three dollars’ worth of precious metals (gold, silver and palladium) is all that can be extracted from a mobile phone that, when brand new, contains raw materials worth a total of US$ 16.81
• Sufficient scale and reliability of supply are important prerequisites for many industrial reverse treatment applications. However, the volume, composition and mix of materials in today’s collection schemes and reverse supply networks are highly variable, making them not always economically viable.
• Purity of materials is increasingly challenging to uphold after many cycles, especially when products from differentindustries are collected and processed as
FIGURE 18 Increases in product and materials complexity lead to significant materials losses
QualityCurrent recovering technologies not maintaining quality of materials
IdentificationHigh level of materialvariation and complexityleading to difficulty inidentifying individualmaterial in the stream
PurityMixed streams of productsfrom different industriesleading to difficulty in maintaining purity of materials
Separation
ScaleLow collection rate, majority of end-of-use products wasted
Raw Materials
Components
Product
End-of-use
SOURCE: World Economic Forum and Ellen MacArthur Foundation circular economy team
High level of integrationof different componentsinto finished products
High level of integrationof raw materials into components
User
6 2803 0006 9
Consumer
one stream, as additives used by one industry can be contaminants in others. In 2012, for example, it was reported that somecereal boxes from a leading cereal manufacturer had been found to contain fragments of metal mesh. The metalparticles were suspected to have come from printing ink residues in the recycled board used for the boxes. Metal particles migrating into food clearly pose a potential healthhazard. While no health issues were reported, the company had to recall 2.8 million boxes of cereals at an estimated cost of US$ 20 - 30 million, in addition to suffering reputational damage.82 Another company affected by purity challenges is the global carpets, carpettiles and sports pitches company Desso. In their carpet-tile recycling facilities, Desso tries to recover Nylon 6, which is the most valuable material for upcycling into new fibres for new high-quality products. Desso design their carpet tile products so that the yarn and backing can be more easily
81 Ellen MacArthur Foundation circular economy team.
82 Tepper, R., “Kellogg Mini-Wheats Recall: Millions Of Boxes Possibly Contaminated With Metal Pieces”, Huffington Post, 11 October 2012 (http://www.huffingtonpost.com/2012/10/11/kelloggs-mini-wheats-recall_n_1957487.html).
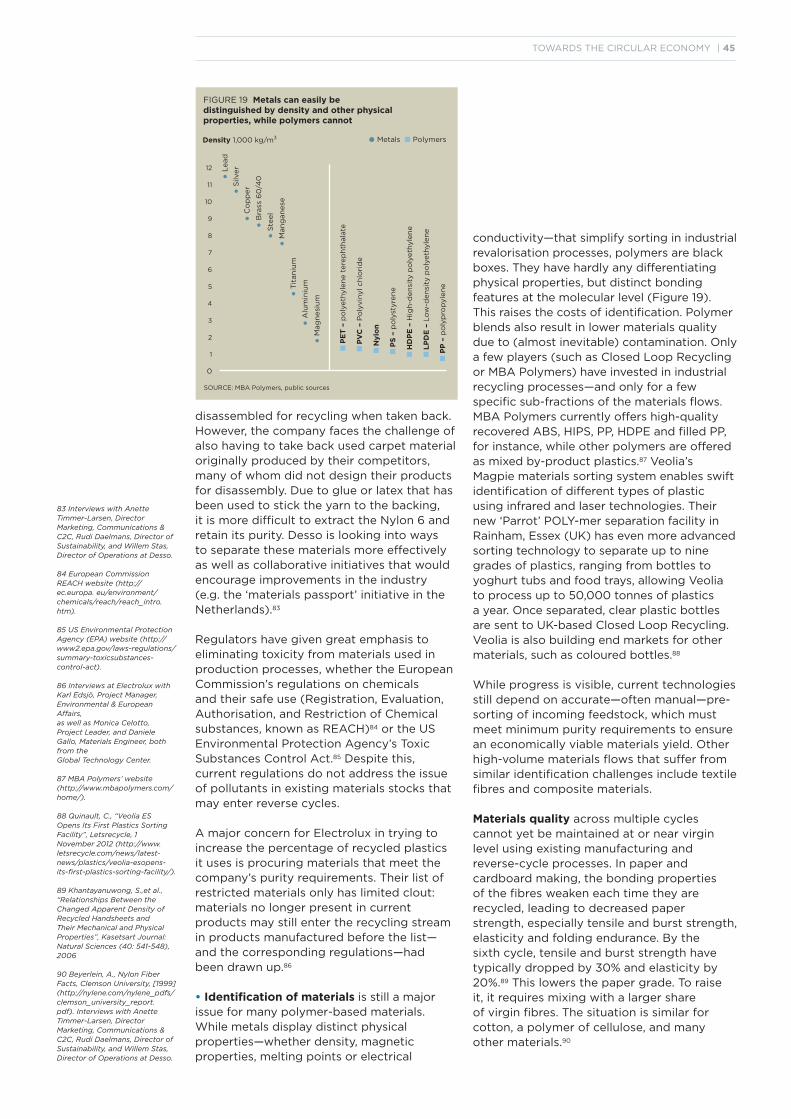
TOWARDS THE CIRCULAR ECONOMY | 45
disassembled for recycling when taken back. However, the company faces the challenge of also having to take back used carpet material originally produced by their competitors, many of whom did not design their products for disassembly. Due to glue or latex that has been used to stick the yarn to the backing, it is more difficult to extract the Nylon 6 and retain its purity. Desso is looking into waysto separate these materials more effectively as well as collaborative initiatives that would encourage improvements in the industry (e.g. the ‘materials passport’ initiative in the Netherlands).83
Regulators have given great emphasis to eliminating toxicity from materials used in production processes, whether the European Commission’s regulations on chemicals and their safe use (Registration, Evaluation, Authorisation, and Restriction of Chemical substances, known as REACH)84 or the US Environmental Protection Agency’s Toxic Substances Control Act.85 Despite this, current regulations do not address the issue of pollutants in existing materials stocks that may enter reverse cycles.
A major concern for Electrolux in trying to increase the percentage of recycled plastics it uses is procuring materials that meet the company’s purity requirements. Their list of restricted materials only has limited clout:materials no longer present in current products may still enter the recycling stream in products manufactured before the list—and the corresponding regulations—had been drawn up.86
• Identification of materials is still a major issue for many polymer-based materials. While metals display distinct physical properties—whether density, magneticproperties, melting points or electrical
conductivity—that simplify sorting in industrial revalorisation processes, polymers are black boxes. They have hardly any differentiating physical properties, but distinct bonding features at the molecular level (Figure 19). This raises the costs of identification. Polymer blends also result in lower materials quality due to (almost inevitable) contamination. Only a few players (such as Closed Loop Recycling or MBA Polymers) have invested in industrial recycling processes—and only for a few specific sub-fractions of the materials flows. MBA Polymers currently offers high-quality recovered ABS, HIPS, PP, HDPE and filled PP, for instance, while other polymers are offered as mixed by-product plastics.87 Veolia’s Magpie materials sorting system enables swift identification of different types of plastic using infrared and laser technologies. Their new ‘Parrot’ POLY-mer separation facility in Rainham, Essex (UK) has even more advanced sorting technology to separate up to nine grades of plastics, ranging from bottles to yoghurt tubs and food trays, allowing Veolia to process up to 50,000 tonnes of plastics a year. Once separated, clear plastic bottles are sent to UK-based Closed Loop Recycling. Veolia is also building end markets for other materials, such as coloured bottles.88
While progress is visible, current technologies still depend on accurate—often manual—pre-sorting of incoming feedstock, which must meet minimum purity requirements to ensure an economically viable materials yield. Other high-volume materials flows that suffer from similar identification challenges include textile fibres and composite materials.
Materials quality across multiple cycles cannot yet be maintained at or near virgin level using existing manufacturing and reverse-cycle processes. In paper andcardboard making, the bonding properties of the fibres weaken each time they are recycled, leading to decreased paper strength, especially tensile and burst strength, elasticity and folding endurance. By the sixth cycle, tensile and burst strength have typically dropped by 30% and elasticity by 20%.89 This lowers the paper grade. To raise it, it requires mixing with a larger share of virgin fibres. The situation is similar for cotton, a polymer of cellulose, and many other materials.90
FIGURE 19 Metals can easily be distinguished by density and other physical properties, while polymers cannot
SOURCE: MBA Polymers, public sources
12
11
10
9
8
7
6
5
4
3
2
1
0
PE
T –
po
lyeth
yle
ne t
ere
ph
thala
te
PV
C –
Po
lyvin
yl ch
lori
de
PS
– p
oly
styre
ne
HD
PE
– H
igh
-den
sity
po
lyeth
yle
ne
LP
DE
– L
ow
-den
sity
po
lyeth
yle
ne
PP
– p
oly
pro
pyle
ne
Nylo
n
• L
ead
• S
ilver
• C
op
per
• B
rass
60
/40
• S
teel
• M
an
gan
ese
• T
itan
ium
• A
lum
iniu
m
• M
ag
nesi
um
•Metals PolymersDensity 1,000 kg/m3
83 Interviews with Anette Timmer-Larsen, Director Marketing, Communications & C2C, Rudi Daelmans, Director of Sustainability, and Willem Stas, Director of Operations at Desso.
84 European Commission REACH website (http://ec.europa. eu/environment/chemicals/reach/reach_intro.htm).
85 US Environmental Protection Agency (EPA) website (http:// www2.epa.gov/laws-regulations/summary-toxicsubstances- control-act).
86 Interviews at Electrolux with Karl Edsjö, Project Manager, Environmental & European Affairs, as well as Monica Celotto, Project Leader, and Daniele Gallo, Materials Engineer, both from the Global Technology Center.
87 MBA Polymers’ website (http://www.mbapolymers.com/ home/).
88 Quinault, C., “Veolia ES Opens Its First Plastics SortingFacility”, Letsrecycle, 1 November 2012 (http://www.letsrecycle.com/news/latest-news/plastics/veolia-esopens- its-first-plastics-sorting-facility/).
89 Khantayanuwong, S.,et al., “Relationships Between theChanged Apparent Density of Recycled Handsheets andTheir Mechanical and Physical Properties”, Kasetsart Journal: Natural Sciences (40: 541-548), 2006
90 Beyerlein, A., Nylon Fiber Facts, Clemson University, [1999] (http://nylene.com/nylene_pdfs/clemson_university_report. pdf). Interviews with Anette Timmer-Larsen, Director Marketing, Communications & C2C, Rudi Daelmans, Director of Sustainability, and Willem Stas, Director of Operations at Desso.
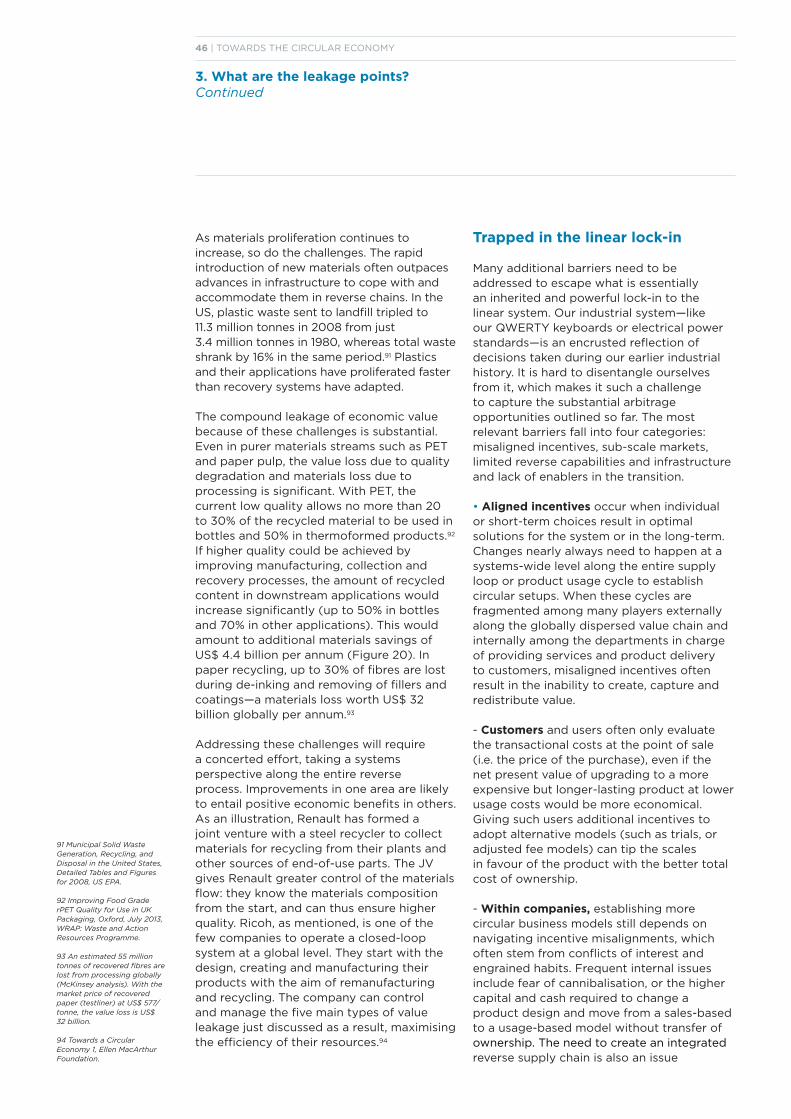
46 | TOWARDS THE CIRCULAR ECONOMY
3. What are the leakage points?Continued
As materials proliferation continues to increase, so do the challenges. The rapid introduction of new materials often outpaces advances in infrastructure to cope with andaccommodate them in reverse chains. In the US, plastic waste sent to landfill tripled to 11.3 million tonnes in 2008 from just 3.4 million tonnes in 1980, whereas total waste shrank by 16% in the same period.91 Plastics and their applications have proliferated faster than recovery systems have adapted.
The compound leakage of economic value because of these challenges is substantial. Even in purer materials streams such as PET and paper pulp, the value loss due to qualitydegradation and materials loss due to processing is significant. With PET, the current low quality allows no more than 20 to 30% of the recycled material to be used in bottles and 50% in thermoformed products.92 If higher quality could be achieved by improving manufacturing, collection and recovery processes, the amount of recycled content in downstream applications would increase significantly (up to 50% in bottles and 70% in other applications). This would amount to additional materials savings of US$ 4.4 billion per annum (Figure 20). In paper recycling, up to 30% of fibres are lost during de-inking and removing of fillers and coatings—a materials loss worth US$ 32 billion globally per annum.93
Addressing these challenges will require a concerted effort, taking a systems perspective along the entire reverseprocess. Improvements in one area are likely to entail positive economic benefits in others. As an illustration, Renault has formed a joint venture with a steel recycler to collect materials for recycling from their plants and other sources of end-of-use parts. The JV gives Renault greater control of the materials flow: they know the materials composition from the start, and can thus ensure higher quality. Ricoh, as mentioned, is one of the few companies to operate a closed-loopsystem at a global level. They start with the design, creating and manufacturing their products with the aim of remanufacturing and recycling. The company can controland manage the five main types of value leakage just discussed as a result, maximising the efficiency of their resources.94
Trapped in the linear lock-in
Many additional barriers need to be addressed to escape what is essentially an inherited and powerful lock-in to the linear system. Our industrial system—like our QWERTY keyboards or electrical power standards—is an encrusted reflection of decisions taken during our earlier industrialhistory. It is hard to disentangle ourselves from it, which makes it such a challenge to capture the substantial arbitrage opportunities outlined so far. The most relevant barriers fall into four categories: misaligned incentives, sub-scale markets, limited reverse capabilities and infrastructure and lack of enablers in the transition.
• Aligned incentives occur when individual or short-term choices result in optimal solutions for the system or in the long-term. Changes nearly always need to happen at asystems-wide level along the entire supply loop or product usage cycle to establish circular setups. When these cycles are fragmented among many players externallyalong the globally dispersed value chain and internally among the departments in charge of providing services and product delivery to customers, misaligned incentives often result in the inability to create, capture and redistribute value.
- Customers and users often only evaluate the transactional costs at the point of sale (i.e. the price of the purchase), even if the net present value of upgrading to a more expensive but longer-lasting product at lower usage costs would be more economical. Giving such users additional incentives to adopt alternative models (such as trials, or adjusted fee models) can tip the scalesin favour of the product with the better total cost of ownership.
- Within companies, establishing more circular business models still depends on navigating incentive misalignments, which often stem from conflicts of interest and engrained habits. Frequent internal issuesinclude fear of cannibalisation, or the higher capital and cash required to change a product design and move from a sales-based to a usage-based model without transfer of ownership. The need to create an integratedreverse supply chain is also an issue
91 Municipal Solid Waste Generation, Recycling, and Disposal in the United States, Detailed Tables and Figures for 2008, US EPA.
92 Improving Food Grade rPET Quality for Use in UKPackaging, Oxford, July 2013, WRAP: Waste and ActionResources Programme.
93 An estimated 55 million tonnes of recovered fibres are lost from processing globally (McKinsey analysis). With themarket price of recovered paper (testliner) at US$ 577/tonne, the value loss is US$ 32 billion.
94 Towards a Circular Economy 1, Ellen MacArthur Foundation.
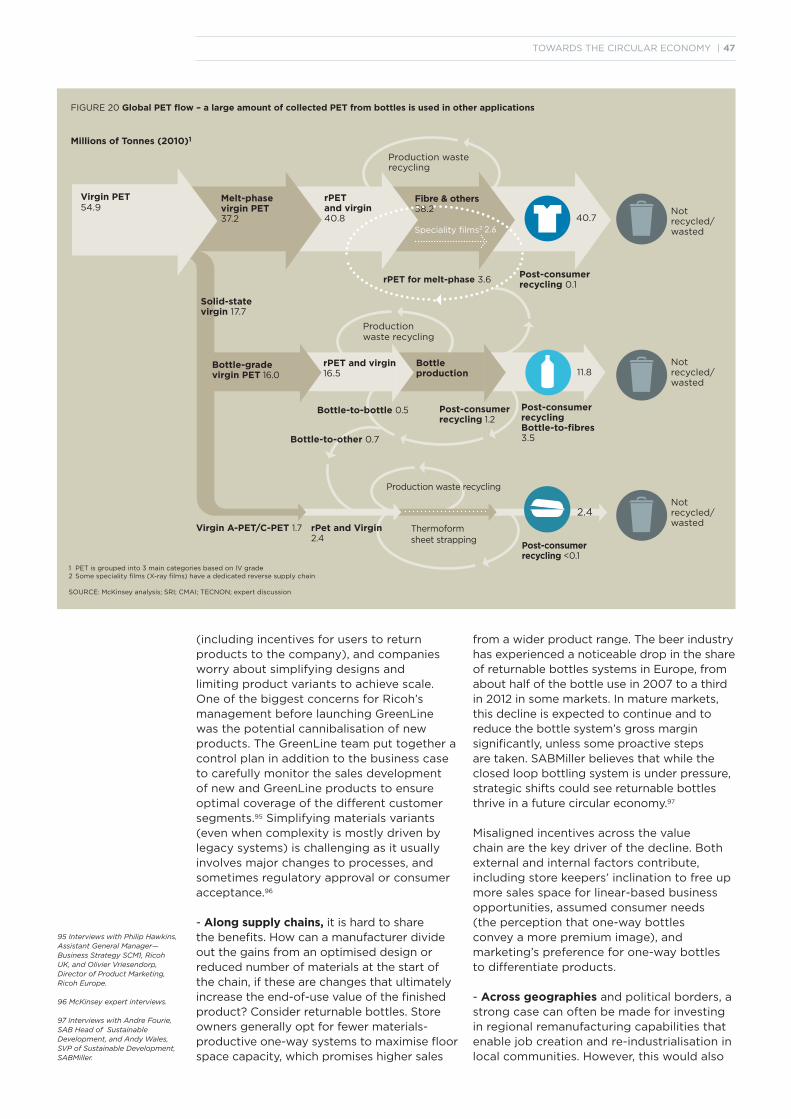
TOWARDS THE CIRCULAR ECONOMY | 47
FIGURE 20 Global PET flow – a large amount of collected PET from bottles is used in other applications
Millions of Tonnes (2010)1
Post-consumerrecycling Bottle-to-fibres3.5
Post-consumerrecycling 0.1
Not recycled/wasted
Not recycled/wasted
Not recycled/wasted
Production wasterecycling
Thermoformsheet strapping
Virgin A-PET/C-PET 1.7
Post-consumerrecycling <0.1
1 PET is grouped into 3 main categories based on IV grade2 Some speciality films (X-ray films) have a dedicated reverse supply chain SOURCE: McKinsey analysis; SRI; CMAI; TECNON; expert discussion
(including incentives for users to return products to the company), and companies worry about simplifying designs andlimiting product variants to achieve scale. One of the biggest concerns for Ricoh’s management before launching GreenLine was the potential cannibalisation of new products. The GreenLine team put together acontrol plan in addition to the business case to carefully monitor the sales development of new and GreenLine products to ensure optimal coverage of the different customer segments.95 Simplifying materials variants (even when complexity is mostly driven by legacy systems) is challenging as it usually involves major changes to processes, and sometimes regulatory approval or consumer acceptance.96
- Along supply chains, it is hard to share the benefits. How can a manufacturer divide out the gains from an optimised design or reduced number of materials at the start of the chain, if these are changes that ultimately increase the end-of-use value of the finished product? Consider returnable bottles. Store owners generally opt for fewer materials-productive one-way systems to maximise floor space capacity, which promises higher sales
from a wider product range. The beer industry has experienced a noticeable drop in the share of returnable bottles systems in Europe, from about half of the bottle use in 2007 to a third in 2012 in some markets. In mature markets, this decline is expected to continue and to reduce the bottle system’s gross margin significantly, unless some proactive steps are taken. SABMiller believes that while the closed loop bottling system is under pressure, strategic shifts could see returnable bottles thrive in a future circular economy.97
Misaligned incentives across the value chain are the key driver of the decline. Both external and internal factors contribute, including store keepers’ inclination to free upmore sales space for linear-based businessopportunities, assumed consumer needs (the perception that one-way bottles convey a more premium image), and marketing’s preference for one-way bottles to differentiate products.
- Across geographies and political borders, a strong case can often be made for investing in regional remanufacturing capabilities that enable job creation and re-industrialisation in local communities. However, this would also
Virgin PET54.9
Melt-phasevirgin PET37.2
rPET and virgin 40.8
Fibre & others38.2
40.7Speciality films2 2.6
rPET for melt-phase 3.6
Solid-statevirgin 17.7
Bottle-grade virgin PET 16.0
Productionwaste recycling
rPET and virgin16.5
Bottleproduction 11.8
2.4
Bottle-to-bottle 0.5 Post-consumerrecycling 1.2
Bottle-to-other 0.7
rPet and Virgin 2.4
Production waste recycling
95 Interviews with Philip Hawkins, Assistant General Manager—Business Strategy SCM1, Ricoh UK, and Olivier Vriesendorp, Director of Product Marketing, Ricoh Europe.
96 McKinsey expert interviews.
97 Interviews with Andre Fourie, SAB Head of Sustainable Development, and Andy Wales, SVP of Sustainable Development, SABMiller.
48 | TOWARDS THE CIRCULAR ECONOMY
3. What are the leakage points?Continued
often lead to lower economic output in the exporting countries that engage in primarymanufacturing. At the macro level, the circular economy setup therefore needs to balance the benefits for different geographies. The number of new units shipped from manufacturing countries will decrease as more remanufacturing takes place in Europe and North America. To offset this, companies can agree that the remanufacturers will send recycled components and raw materials to the manufacturers (taking advantage ofthe low return shipping costs (Figure 16)). This loop creates materials cost savings for the manufacturers. In addition, closing local loops in manufacturing countries such as China and Brazil would generate the economic arbitrage opportunities outlined in the previous section, because these economies have grown into such strongconsuming economies.
• Markets of scale are at the heart of the current inbound production process for products and services, and the continuous reconfiguration of their sophisticated, efficient and responsive multi-tier supplier networks. These markets create value because they are transparent and able to provide robust streams of materials, components and products reliably and respond quickly to fluctuations in demand. However, such ‘industrial-scale’ markets do not yet exist for many materials suitable for reverse cycles, making it hard or impossible for companies to secure quality-controlled and reliable secondary materials andcomponents to complement or replace primary stock.
- Reverse cycle infrastructure and logistics capabilities are essential to close the geographic imbalance between points of (re-)manufacturing and usage. The setup needs to ensure that costs do not eliminate the positive arbitrage opportunities embedded in the difference between recovered and virgin materials, components and products. In the linear take-make-dispose economy, last-mile transport to landfills and incinerators is historically often local, with little or no ability
to sort and handle different types of materials carefully enough to maintain quality and purity at scale. Only a few integrated industrial players such as Veolia and Waste Management have emerged so far with the geographic reach and capabilities to improve reverse cycle flows across multiple product or materials classes.
- Enablers are needed in many areas to pave the way for new circular business models. Boundary conditions are one such example (e.g. regulation), or funding and sufficient transparency on opportunities. Many companies have adopted access-over-ownership business models to appeal to the new consumer mindset and profit from usingidle capacity in the economy. Among the best known are Airbnb, Lyft, Zipcar, Renault’s Twizy battery rental scheme, and Philips’ Pay Per Lux business model. However, current support services and regulations often lag behind. Pioneers of circular business models have faced difficulties in raising sufficient funds as a result, or sometimes run into problems with local authorities. Desso has found it difficult to convince financial institutions to finance their carpet leasing model, as carpet tiles are generally considered to belong to the building materials segment. This has low residual value after five, seven or ten years of use, and does not take into account the materials value after end-of-use.98
The list of leakages and barriers to accelerating the scale-up of the circular economy is long, and some will be tough to resolve. But none are insurmountable, and solutions seem to lie this side of the technology frontier. Aspects of geographic dispersion, materials complexity/proliferation and systems lock-in have all been dealt with successfully, at least in part. International standards for materials have been defined and adopted. Systems transition to supply/delivery and reverse logistics aligned to the principles of the circular economy cancommence once the hinge points have been identified and acted upon. The next chapter describes which hinge points would benefit from a concerted effort—across companies,along the supply chain and across geographies.
98 See note 32 and note 83.

14
What are the solutions?
50 | TOWARDS THE CIRCULAR ECONOMY
4. What are the solutions?
Emphasising cross-border, cross-industry and cross-sector reach is the key. The mostpromising options are managing pure materials stock across global supply chains, closing multi-tier reverse cycle networks, and setting up innovative usage models.
The obstacles to scaling up the circular economy across supply chains at a global level are primarily the difficulties ofclosing the loop geographically and in terms of quality, as already described. Resolving these issues will also mean overcoming the engrained lock-in of the linear system. Sohow can stakeholders best start addressing these obstacles to unlock the value of the circular economy?
As with every major transformation, it is vital to take a systematic approach, unravelling the issues at the point of greatest leverage. This chapter outlines three avenues for action, all with the potential for carrying circularity to a tipping point. They represent three different perspectives on how to turn global supply chains (and open loops) into supply loops—or supply cycles—to surmount the issues just outlined: network design, materials purity, and demand-side business model innovation. After substantial research and analysis, the team behind this report have determined that the second—reorganising and streamlining pure materials flows—would be the best with which to begin. The reasons for this are detailed in the final section of this chapter, but it is vital to see all three as a whole, as they are so intertwined. Accelerating progress on one will automatically trigger progress in the others, too.
• Set up global reverse networks for products and components. This focuses on building out reverse network capabilities, which is essential to address the geographic dispersion challenge. This will ideally takeplace at a product and component level, so it will be industry specific and require collaboration along the incumbent value chain and adjacent/cascaded activities.
• Reorganise and streamline pure materials flows. Materials represent the greatest common denominator, and the most universal assets across industries andgeographies: they will ultimately require closed loops at a global level to achieve full
potential. The key will be to tackle materials complexity and create pure materialsstocks at scale that generate sufficient economic benefits for participants.
• Innovate business models on the demand side. This will be critical to mainstreaming the circular economy. Innovation will be the way ahead for B2B-favourable setups, and wide adoption in B2C. New models will also be key to tapping the growing trend towards collaborative use of physical assets: the ‘sharing economy,’ as well as overcoming linear lock-in.
Set up global reverse networks
The full potential value of the circular economy goes well beyond simply recycling used materials—whether down- or upcycling them. This value is embedded in the reuse,maintenance, refurbishment, and remanufacturing of components and products, so it is equally important tostrengthen these reverse setups and capabilities. Companies have mastered the orchestration of complex, multi-tier inbound supplier networks. Now the same sophistication needs to be applied to orchestrating post-usage value streams across multiple reverse cycle partners.
Map the system for one productCompanies need to carefully evaluate which reverse cycle networks could create the best arbitrage opportunity. Figure 21 depicts a very simplified multi-tier supplier network for a power drill, and sketches out the different options for the reverse cycle. Would it be better to reinstall the power supply into the next drill (as a used component)? Or to use at least the cable and plug, if transformer reliability presents a problem? Or should all the components be sent to the smelter for metal extraction, as this can be done in onesimple shipment instead of organising a more complex operation involving disassembly and remanufacturing? Each of these trade-offs is highly dependent on the scale, reliabilityand transferability of the supply of used components. Equally important is to factor in the relative cost advantage of setting up effective post-usage loops, typically with business partners, versus making new components and using virgin materials.
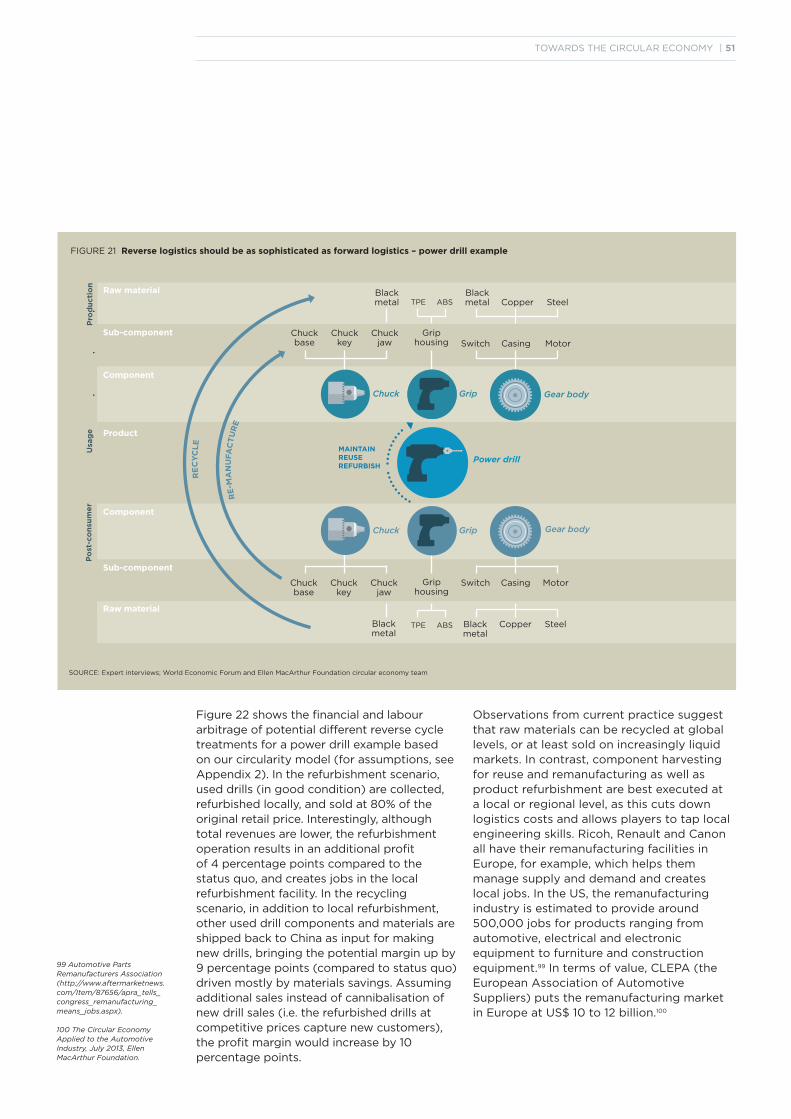
TOWARDS THE CIRCULAR ECONOMY | 51
Figure 22 shows the financial and labour arbitrage of potential different reverse cycle treatments for a power drill example based on our circularity model (for assumptions, see Appendix 2). In the refurbishment scenario, used drills (in good condition) are collected, refurbished locally, and sold at 80% of the original retail price. Interestingly, although total revenues are lower, the refurbishment operation results in an additional profit of 4 percentage points compared to the status quo, and creates jobs in the local refurbishment facility. In the recycling scenario, in addition to local refurbishment, other used drill components and materials are shipped back to China as input for making new drills, bringing the potential margin up by 9 percentage points (compared to status quo) driven mostly by materials savings. Assuming additional sales instead of cannibalisation of new drill sales (i.e. the refurbished drills at competitive prices capture new customers), the profit margin would increase by 10 percentage points.
Observations from current practice suggest that raw materials can be recycled at global levels, or at least sold on increasingly liquid markets. In contrast, component harvesting for reuse and remanufacturing as well as product refurbishment are best executed at a local or regional level, as this cuts down logistics costs and allows players to tap localengineering skills. Ricoh, Renault and Canon all have their remanufacturing facilities in Europe, for example, which helps them manage supply and demand and creates local jobs. In the US, the remanufacturing industry is estimated to provide around 500,000 jobs for products ranging from automotive, electrical and electronic equipment to furniture and construction equipment.99 In terms of value, CLEPA (theEuropean Association of Automotive Suppliers) puts the remanufacturing market in Europe at US$ 10 to 12 billion.100
FIGURE 21 Reverse logistics should be as sophisticated as forward logistics – power drill example
SOURCE: Expert interviews; World Economic Forum and Ellen MacArthur Foundation circular economy team
99 Automotive Parts Remanufacturers Association (http://www.aftermarketnews.com/Item/87656/apra_tells_congress_remanufacturing_means_jobs.aspx).
100 The Circular Economy Applied to the Automotive Industry, July 2013, Ellen MacArthur Foundation.
Raw material
Component
Product
Pro
du
cti
on
Po
st-c
on
sum
er
Usa
ge
Sub-component
Sub-component
Component
Raw material
Chuckbase
Chuckkey
Chuck jaw
Griphousing
TPE ABS
Switch Casing Motor
Chuckbase
Chuckkey
Chuckjaw
Switch Casing Motor
Blackmetal
Copper Steel
Blackmetal Copper Steel
Blackmetal
Blackmetal
Griphousing
TPE ABS
Chuck
Chuck
Power drill
Chuck
Chuck
Grip
Grip
Gear body
Gear body
MAINTAINREUSEREFURBISH
RE
CY
CL
E
RE
-MA
NU
FA
CT
UR
E
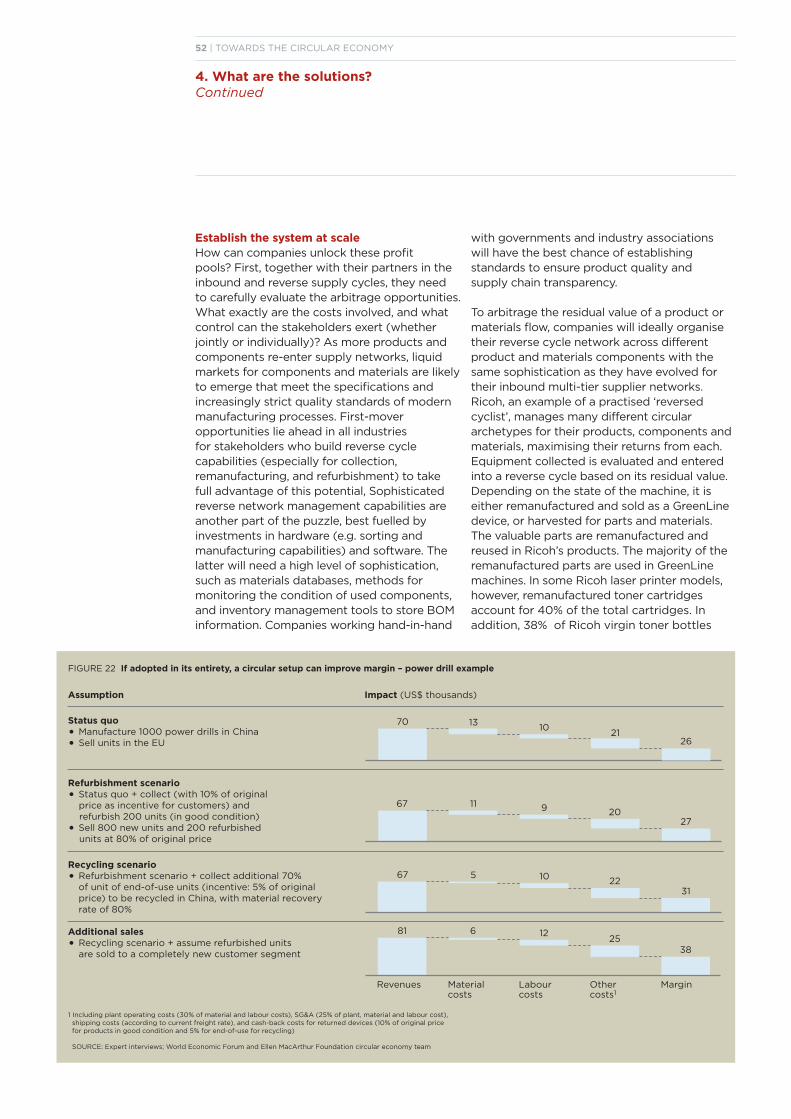
52 | TOWARDS THE CIRCULAR ECONOMY
4. What are the solutions?Continued
Establish the system at scale How can companies unlock these profit pools? First, together with their partners in the inbound and reverse supply cycles, they need to carefully evaluate the arbitrage opportunities. What exactly are the costs involved, and what control can the stakeholders exert (whether jointly or individually)? As more products and components re-enter supply networks, liquidmarkets for components and materials are likely to emerge that meet the specifications and increasingly strict quality standards of modern manufacturing processes. First-moveropportunities lie ahead in all industries for stakeholders who build reverse cycle capabilities (especially for collection,remanufacturing, and refurbishment) to take full advantage of this potential, Sophisticated reverse network management capabilities are another part of the puzzle, best fuelled byinvestments in hardware (e.g. sorting and manufacturing capabilities) and software. The latter will need a high level of sophistication, such as materials databases, methods formonitoring the condition of used components, and inventory management tools to store BOM information. Companies working hand-in-hand
with governments and industry associations will have the best chance of establishing standards to ensure product quality and supply chain transparency.
To arbitrage the residual value of a product or materials flow, companies will ideally organise their reverse cycle network across different product and materials components with thesame sophistication as they have evolved for their inbound multi-tier supplier networks. Ricoh, an example of a practised ‘reversed cyclist’, manages many different circular archetypes for their products, components and materials, maximising their returns from each. Equipment collected is evaluated and entered into a reverse cycle based on its residual value. Depending on the state of the machine, it is either remanufactured and sold as a GreenLine device, or harvested for parts and materials. The valuable parts are remanufactured and reused in Ricoh’s products. The majority of the remanufactured parts are used in GreenLine machines. In some Ricoh laser printer models, however, remanufactured toner cartridges account for 40% of the total cartridges. In addition, 38% of Ricoh virgin toner bottles
FIGURE 22 If adopted in its entirety, a circular setup can improve margin – power drill example
Assumption Impact (US$ thousands)
Status quo
• Manufacture 1000 power drills in China
• Sell units in the EU
Refurbishment scenario
• Status quo + collect (with 10% of original price as incentive for customers) and refurbish 200 units (in good condition)
• Sell 800 new units and 200 refurbished units at 80% of original price
Recycling scenario
• Refurbishment scenario + collect additional 70% of unit of end-of-use units (incentive: 5% of original price) to be recycled in China, with material recovery rate of 80%
Additional sales
• Recycling scenario + assume refurbished units are sold to a completely new customer segment
70 1310
2621
67 11 9
2720
67 5 10
3122
81 6 12
3825
Revenues Materialcosts
Labourcosts
Othercosts1
Margin
1 Including plant operating costs (30% of material and labour costs), SG&A (25% of plant, material and labour cost), shipping costs (according to current freight rate), and cash-back costs for returned devices (10% of original price for products in good condition and 5% for end-of-use for recycling)
SOURCE: Expert interviews; World Economic Forum and Ellen MacArthur Foundation circular economy team
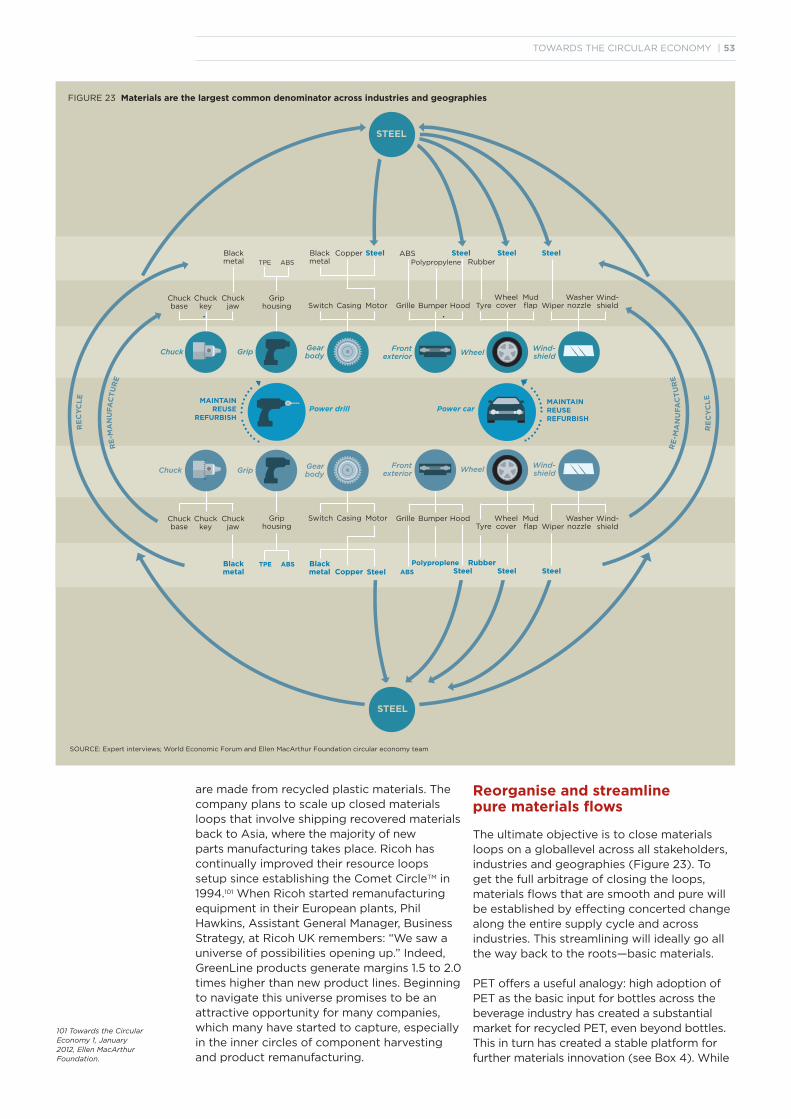
TOWARDS THE CIRCULAR ECONOMY | 53
are made from recycled plastic materials. The company plans to scale up closed materials loops that involve shipping recovered materials back to Asia, where the majority of new parts manufacturing takes place. Ricoh has continually improved their resource loops setup since establishing the Comet CircleTM in 1994.101 When Ricoh started remanufacturing equipment in their European plants, Phil Hawkins, Assistant General Manager, Business Strategy, at Ricoh UK remembers: “We saw a universe of possibilities opening up.” Indeed, GreenLine products generate margins 1.5 to 2.0 times higher than new product lines. Beginning to navigate this universe promises to be an attractive opportunity for many companies, which many have started to capture, especially in the inner circles of component harvesting and product remanufacturing.
Reorganise and streamline pure materials flows
The ultimate objective is to close materials loops on a globallevel across all stakeholders, industries and geographies (Figure 23). To get the full arbitrage of closing the loops, materials flows that are smooth and pure will be established by effecting concerted change along the entire supply cycle and across industries. This streamlining will ideally go all the way back to the roots—basic materials.
PET offers a useful analogy: high adoption of PET as the basic input for bottles across the beverage industry has created a substantial market for recycled PET, even beyond bottles. This in turn has created a stable platform for further materials innovation (see Box 4). While
101 Towards the Circular Economy 1, January 2012, Ellen MacArthur Foundation.
FIGURE 23 Materials are the largest common denominator across industries and geographies
SOURCE: Expert interviews; World Economic Forum and Ellen MacArthur Foundation circular economy team
MAINTAINREUSE
REFURBISH
Griphousing
Griphousing
TPE ABS
TPE ABS
Blackmetal
Blackmetal
MAINTAINREUSEREFURBISH
Chuckbase
Blackmetal
Blackmetal
Chuckkey
Chuckkey
Copper
Copper
Chuckjaw
Chuckjaw
Steel
Steel
Switch
Switch
Casing
Casing
Motor
Motor
Wheel
Wheel
ABSPolypropylene
Steel
Steel
Rubber
Rubber
Steel
Steel
Tyre
Tyre
Wheel cover
Wheel cover
Mud flap
Mud flap
Grille
Grille
Wiper
Wiper
Bumper
Bumper
Washernozzle
Washernozzle
Hood
Hood
Wind-shield
Wind-shield
Front exterior
Front exterior
Wind-shield
Wind-shield
Power car
Steel
Chuck Grip Gear body
Chuck Grip Gear body
Power drill
ABS
PolypropleneSteel
STEEL
STEELR
EC
YC
LE
Chuckbase
RE
CY
CL
E
RE
-MA
NU
FA
CT
UR
E
RE
-MA
NU
FA
CT
UR
E
54 | TOWARDS THE CIRCULAR ECONOMY
4. What are the solutions?Continued
this is not by any means a perfect flow (a large proportion of end-of-use PET still ends up in downcycling cascades or landfills/incinerators), it shares a number of attributes that contribute to establishing a pure materials flow.
Unlocking the full potential of the circular economy for basic materials thus means reorganising and streamlining materials into global flows and loops of standardised purity. An initial step will be to pick and reorganise a few materials streams that are already sizeable and well understood in terms of properties, economics and (emerging) treatment/processing technologies. These would be materials where a concerted effort by a few major players can create markets large enough to surpass the threshold value for circular arbitrage models.
Some traditional materials are prime candidates. Analysing current municipal solid waste composition reveals that the most abundant discarded industrial materials include paper and cardboard, plastics, glass and metals. Their potential is enormous. Strikingly, although metals are already perceived to have high collection rates, a recent UNEP study of 60 common metals has shown that only one-third actually have a global end-of-use recycling rate of 25% or more.103 In addition to traditional basic materials, it will also be important to plan global circular scale-ups for emerging or still largely unfamiliar materials. This means setting up systems for materials that will be used in manufacturing processes of the future (e.g. 3D printing), and that are restorative by choice, even if their volumes are low today.
Design building blocks for flagship projectsA pilot for larger transformation would ideally focus around four types of material that are each at different stages of maturity in terms of circular setup and development (Figure 24):
• Golden Oldies. These are well-established, high-volume recyclates with a remaining purity challenge. Paper and cardboard as a high-volume materials stream has high collection rates, but suffers from quality loss and ink contamination during the reverse cycle, resulting in an estimated US$ 32 billion in value lost annually. PET, glass, and steel also fall into this category.
• High Potentials. Materials used in high volumes that currently lack systematic reuse solutions are polymers, for example. Collection rates are limited, and separating out the materials/maintaining their quality and purity is hard due to the high fragmentation of materials, supply chains and treatment technologies.
• Rough Diamonds. These are large-volume by-products of many manufacturing processes, such as carbon dioxide and food waste, A broad set of valorisation technologies is emerging that could provide additional value and displace virgin materials intake.
• Future Blockbusters. A number of innovative materials have breakthrough potential, either from enabling substantial improvement of materials productivity (such as 3D printing), or having usage cycles that are fully restorative by design and intention.
Go to scale starting with signature materialsBecause the position at the outset is different for each type of material, and each category comprises a large set of materials, a first step would be to pick a signature material from each category as an example. Different players will then find it easier to collaborate on specific materials across industries and geographies. The findings that result at a systems level will often be highly transferable to other materials in the same category. After establishing proof of concept and initial flagship successes for these signature products, the stakeholders can then roll out the solutions to other materials in a given category. This will be much faster than if they tried to cover all the materials in a category at once.
A detailed map of current flows is the first milestone, identifying and quantifying materials leakages at the ‘pain points’ for each material. The next would be developing targeted initiatives to address these leakage points, putting solutions in place (at a systems level) to capture the value quickly. These sets of initiatives would ideally create large, pure and constant materials streams that are economically attractive, catalysing global liquid markets for their reverse cycle networks. Experts around the globe were interviewed for this report, providing unique insights into the potential of circular flows in each of these groupings.
102 Plastics Recyclers Europe. Husky Injection Molding Systems: Quantifying Environmental Impacts of Carbonated Soft Drink (CSD) Packaging, 2009. CEMPRE. Interview with Claus Conzelmann, Vice President, Head of Safety, Health & Environmental Sustainability at Nestle; Interview with April Crow, Global Sustainable Packaging Manager at Coca-Cola; Nestle Waters (http://www. nestle-waters.com/environment/bottled-water-recycling/ pet-bottled-water-usa-europe). Expert interviews. Other public resources. McKinsey analysis.
103 UNEP International Resource Panel Recycling Rates of Metals—A Status Report, 2011, United Nationas Environment Programme (UNEP).
TOWARDS THE CIRCULAR ECONOMY | 55
Box 4 The evolution of PET recycling for beverage bottles
The first polyethylene terephthalate—better known as ‘PET’—bottle was introduced in 1973.102 It quickly gained wide acceptance among bottlers and consumers because it is lightweight, economical and shatterproof. Today, it is estimated that around 40% of all soft drinks packaging around the world is made from PET. It is also used as a packaging material for many other consumer products, not just beverages.
By creating a de-facto standard for plastic bottles based on PET, which is 100% recyclable, an entire system has been organised around maintaining it as a technical nutrient across multiple cycles without quality degradation. PET collection rates vary across different regions in the world. Regions with relatively high collection rates include Europe, with rates as high as 48%, and Brazil at around 55%. Recycling drives value by replacing a share of virgin raw materials (around 20 to 30% of plastic bottles use rPET, for example). It also generates additional revenue streams, as rPET fibres can be used for secondary applications (such as textile manufacturing). This secondary materials stream offers an attractive business case with high volumes and value, too, so a market has also formed for rPET. This has attracted investors to install recycling technology (e.g. Closed Loop Recycling) and collection schemes that create business opportunities for solution providers along the reverse chain. Tomra reverse vending machines are one of the core components of the dual system in Germany, for instance.
Because much of the PET usage is single use, the industry is conscious of public demand for sustainability and recycling. As such, recycling has been high on the agenda of bottlers and consumers since the early days. As April Crow, Global Director of Sustainable Packaging at The Coca-Cola Company, points out, “We (as a consumer goods community) need to make sure that more of the materials we put onto the market have value to encourage the circular economy approach; too many today are difficult to recycle or contaminate existing recycling streams. When we introduced the first PET bottle into the market in the late 1970s, we made a commitment to develop the technology that would allow that material to go back into our packages as a secondary raw material. We supported the development of the technology and end markets to enable this.” Coca-Cola has a design approach that insists that their packaging must be designed to be recyclable. However, the company also recognise there is still a role to play in increasing collection and recycling of the packaging material that they produce.
Meanwhile, innovations have increased PET applications. One of the most visible is the significant reduction in bottle weight and wall thickness. Nestlé Water, for example, continuously reduced their total PET packaging weight from 2005 to 2010. By 2010, they were using an average of 41.7 grams of packaging materials per litre—19% less than in 2005—by making the bottle, caps and labels lighter without compromising quality (covering properties such as resistance during transport, solidity, permeability and softness). It is now even possible to fill PET bottles at elevated temperatures due to innovations in bottle shape, opening them up for new markets, such as sports drinks.
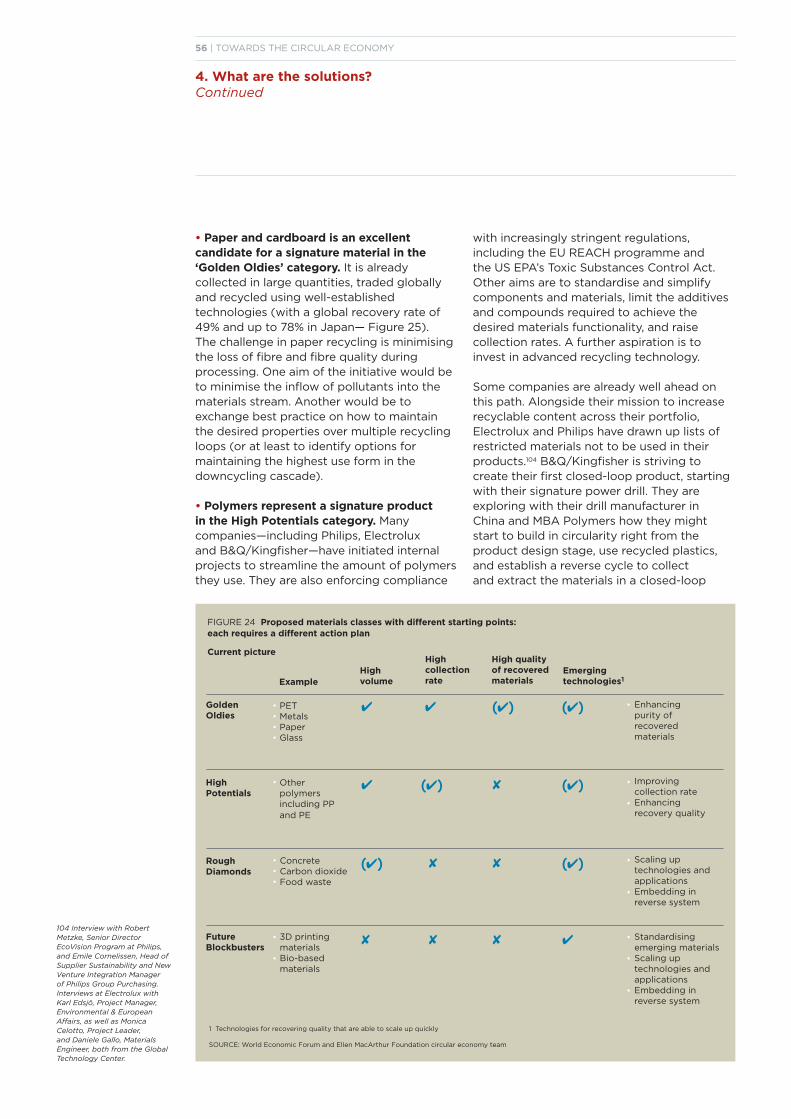
56 | TOWARDS THE CIRCULAR ECONOMY
4. What are the solutions?Continued
• Paper and cardboard is an excellent candidate for a signature material in the ‘Golden Oldies’ category. It is already collected in large quantities, traded globallyand recycled using well-established technologies (with a global recovery rate of 49% and up to 78% in Japan— Figure 25). The challenge in paper recycling is minimising the loss of fibre and fibre quality during processing. One aim of the initiative would be to minimise the inflow of pollutants into the materials stream. Another would be toexchange best practice on how to maintain the desired properties over multiple recycling loops (or at least to identify options for maintaining the highest use form in the downcycling cascade).
• Polymers represent a signature product in the High Potentials category. Many companies—including Philips, Electrolux and B&Q/Kingfisher—have initiated internal projects to streamline the amount of polymers they use. They are also enforcing compliance
FIGURE 24 Proposed materials classes with different starting points: each requires a different action plan
Current picture
Example
Golden Oldies
High Potentials
Rough Diamonds
Future Blockbusters
1 Technologies for recovering quality that are able to scale up quickly
SOURCE: World Economic Forum and Ellen MacArthur Foundation circular economy team
with increasingly stringent regulations, including the EU REACH programme and the US EPA’s Toxic Substances Control Act. Other aims are to standardise and simplify components and materials, limit the additives and compounds required to achieve the desired materials functionality, and raise collection rates. A further aspiration is to invest in advanced recycling technology.
Some companies are already well ahead on this path. Alongside their mission to increase recyclable content across their portfolio, Electrolux and Philips have drawn up lists of restricted materials not to be used in their products.104 B&Q/Kingfisher is striving to create their first closed-loop product, starting with their signature power drill. They are exploring with their drill manufacturer inChina and MBA Polymers how they might start to build in circularity right from the product design stage, use recycled plastics, and establish a reverse cycle to collect and extract the materials in a closed-loop
Enhancing purity of recovered materials
4
4
(4)
8
4
(4)
8
8
(4)
8
8
8
(4)
(4)
(4)
4
Improving collection rateEnhancing recovery quality
Scaling up technologies and applicationsEmbedding in reverse system
Standardising emerging materialsScaling up technologies and applicationsEmbedding inreverse system
Emerging technologies1
High quality of recovered materials
High collection rate
High volume
Other polymersincluding PP and PE
PETMetals PaperGlass
••••
•
•
•
•
•
•
•
•
•••
•
•
•
ConcreteCarbon dioxideFood waste
3D printingmaterialsBio-basedmaterials
104 Interview with Robert Metzke, Senior Director EcoVision Program at Philips, and Emile Cornelissen, Head of Supplier Sustainability and New Venture Integration Manager of Philips Group Purchasing. Interviews at Electrolux with Karl Edsjö, Project Manager, Environmental & European Affairs, as well as Monica Celotto, Project Leader, and Daniele Gallo, Materials Engineer, both from the Global Technology Center.
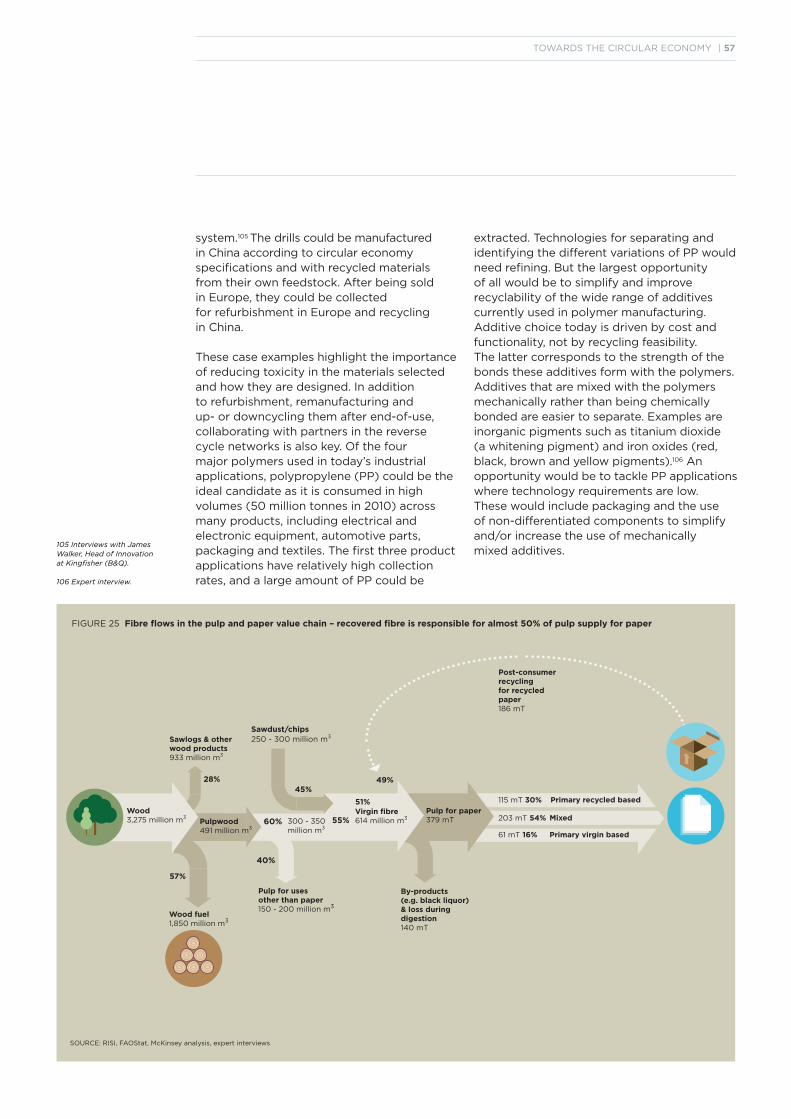
TOWARDS THE CIRCULAR ECONOMY | 57
FIGURE 25 Fibre flows in the pulp and paper value chain – recovered fibre is responsible for almost 50% of pulp supply for paper
SOURCE: RISI, FAOStat, McKinsey analysis, expert interviews
system.105 The drills could be manufactured in China according to circular economy specifications and with recycled materials from their own feedstock. After being sold in Europe, they could be collected for refurbishment in Europe and recycling in China.
These case examples highlight the importance of reducing toxicity in the materials selected and how they are designed. In addition to refurbishment, remanufacturing and up- or downcycling them after end-of-use, collaborating with partners in the reverse cycle networks is also key. Of the four major polymers used in today’s industrial applications, polypropylene (PP) could be theideal candidate as it is consumed in high volumes (50 million tonnes in 2010) across many products, including electrical and electronic equipment, automotive parts,packaging and textiles. The first three product applications have relatively high collection rates, and a large amount of PP could be
extracted. Technologies for separating andidentifying the different variations of PP would need refining. But the largest opportunity of all would be to simplify and improve recyclability of the wide range of additives currently used in polymer manufacturing.Additive choice today is driven by cost and functionality, not by recycling feasibility. The latter corresponds to the strength of the bonds these additives form with the polymers. Additives that are mixed with the polymersmechanically rather than being chemically bonded are easier to separate. Examples are inorganic pigments such as titanium dioxide (a whitening pigment) and iron oxides (red, black, brown and yellow pigments).106 An opportunity would be to tackle PP applications where technology requirements are low. These would include packaging and the use of non-differentiated components to simplify and/or increase the use of mechanically mixed additives.
Primary recycled based
Mixed
Primary virgin based
115 mT 30%
203 mT 54%
61 mT 16%
Sawlogs & otherwood products933 million m3
Sawdust/chips250 - 300 million m3
Wood fuel1,850 million m3
Pulp for usesother than paper150 - 200 million m3
Pulpwood491 million m3
28% 49%
Virgin fibre614 million m3
51%Wood3,275 million m3
57%
Post-consumer recyclingfor recycled paper186 mT
45%
60% 55%
40%
300 - 350million m3
By-products(e.g. black liquor) & loss during digestion140 mT
Pulp for paper379 mT
105 Interviews with James Walker, Head of Innovation at Kingfisher (B&Q).
106 Expert interview.
58 | TOWARDS THE CIRCULAR ECONOMY
4. What are the solutions?Continued
• Carbon dioxide recovery could be a signature material for the Rough Diamonds group. McKinsey & Company has established an initial carbon cost curve for carbonrecovery (especially in the form of CO2) that maps the carbon emissions abatement potential for existing technologies along arbitrage opportunities. This sphere has onlygained niche attention so far (greenhouse products and oil recovery, for example), but a number of promising technologies exist and many more are emerging that can capture and metabolise carbon as an industrial by-product. Many of those would be profitable even without carbon pricing [Figure 26]. Currently, only 16% of the 500 million tonnes of low-cost, concentrated CO2 are tapped in this way. (This is primarily CO2 available from natural sources, as a by-product of fertiliser plants that process natural gas, at a cost of less than US$ 20 per tCO2). However, now Novomer in the US and Bayer in Germany have started pilot plants to transform CO2 into commonly used polymers, including PE, PP, and polyurethane. This opens up the possibility of eventually replacing oil as the feedstock for these materials – a huge opportunity. Commercialisation of the technology is expected by as early as 2015.107 Advances in this area would overturn the concept of CO2 as a pollutant, instead exploring how it could become a valuable economic asset for other businesses, serving as a feedstock for polymers and other materials currently dependent on oil. Through the lens of circularity, the economic justification for Carbon Capture and Storage (CCS) Projects, arguably a key technology we still require at scale to address CO2 pollution from new coal power stations, can be transformed. CCUS projects (Carbon Capture, Use, and - if needed - Storage) become driven by the economics of the revenue stream generated by the potential use of the CO2 in new industrial applications. The economic potential of CCU projects would be worth analysing in this project, especially for non OECD economies.
The central question would be how these technological inventions can be used to innovate the business models around them at systems levels. Large-scale energy producers with chemical feedstock companies wouldideally join forces in converting their CO2 into polymer-based products. Perhaps they could even be encouraged to find uptake for them in their own markets.
• 3D printing materials would be an appropriate product in the Future Blockbusters category. The Biomimicry Institute is working with the Ellen MacArthur Foundation to explore a multi-purpose printing agent that largely originates from bio-based regenerative materials. Harnessing the benefits of materials innovation could improve the underlying economics of materials use as only a few building blocks would be needed (along the lines of Biomimicry’s principles). A significant amount of materials waste could be avoided in the process (see Box 5). 3D printing technology is a fast-growing sector with a wide range of applications, from prototyping and tooling to direct manufacturing. EADS, the manufacturer of Airbus aircraft, managed to achieve a 90% reduction in the materials waste of costly aerospace-grade titanium using 3D printing, several tonnes of which are needed for manufacturing an aircraft. Titanium-made parts are usually machined from solid billets: 90% of the material is cut away. The new 3D printing process uses only 10% of the raw material (in the form of titanium powder) that the traditional process requires, less energy than a conventional factory, and is sometimes faster.108
The objective of a concerted effort focused on 3D printing would be to gain an overview of the materials currently in use. Which have the highest potential for integration into circulareconomy systems, at the lowest cost? The rapidly evolving materials landscape could be screened and potentially guided towards more reusable materials—potentially even those that are fully bio-based and regenerative. A take-back system would also be needed to ensure that products are returned and reconfigured as feedstock.
• Another Future Blockbuster: bio-based, regenerative materials. By applying bio-based and regenerative materials at scale, Lend Lease improved the process for enhancing the use of certified regenerative materials (such as new wood) in the construction of London’s Olympic Village. Scaffolding used for construction was later folded into the furnishing and finishing of the buildings, and is now part of the surrounding landscape design after dismantling the temporary houses. This represents an effort to maximise the use of materials for lasting infrastructure construction, resulting in significant materials savings and reduction
107 McKinsey analysis
108 The Economist: The Printed World; February 2011 (http:// www.economist.com/node/18114221)
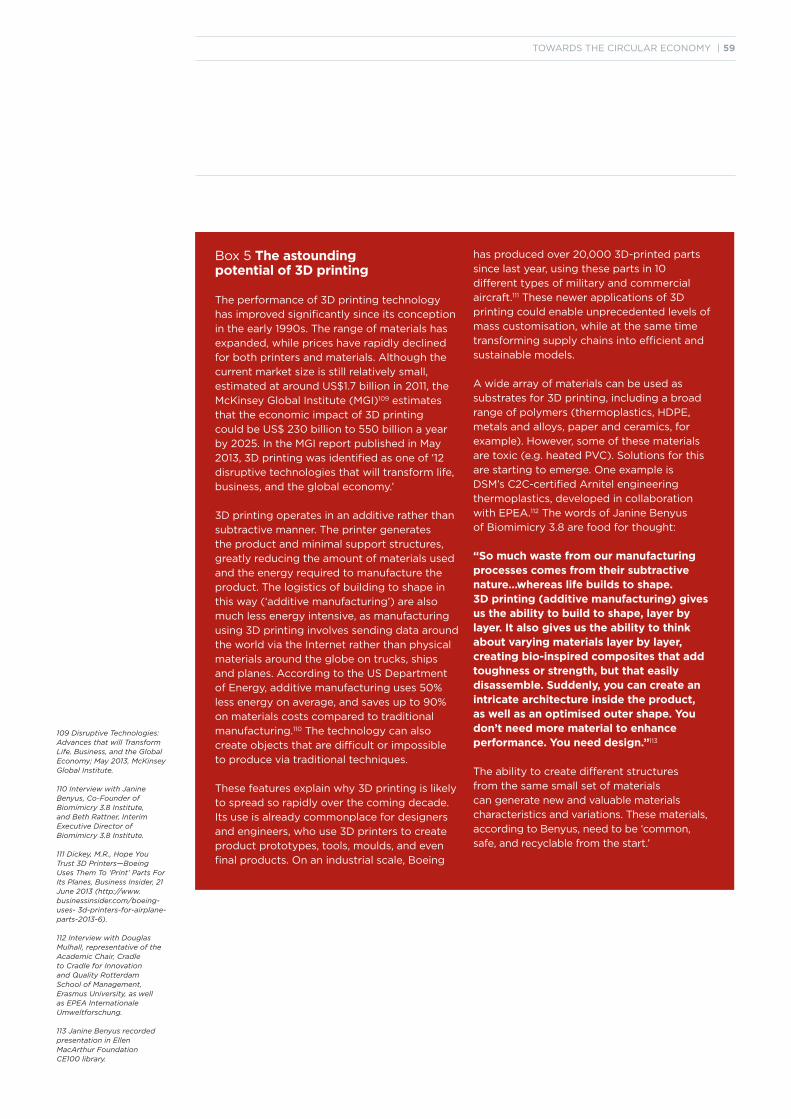
TOWARDS THE CIRCULAR ECONOMY | 59
Box 5 The astounding potential of 3D printing
The performance of 3D printing technology
has improved significantly since its conception
in the early 1990s. The range of materials has
expanded, while prices have rapidly declined
for both printers and materials. Although the
current market size is still relatively small,
estimated at around US$1.7 billion in 2011, the
McKinsey Global Institute (MGI)109 estimates
that the economic impact of 3D printing
could be US$ 230 billion to 550 billion a year
by 2025. In the MGI report published in May
2013, 3D printing was identified as one of ‘12
disruptive technologies that will transform life,
business, and the global economy.’
3D printing operates in an additive rather than
subtractive manner. The printer generates
the product and minimal support structures,
greatly reducing the amount of materials used
and the energy required to manufacture the
product. The logistics of building to shape in
this way (‘additive manufacturing’) are also
much less energy intensive, as manufacturing
using 3D printing involves sending data around
the world via the Internet rather than physical
materials around the globe on trucks, ships
and planes. According to the US Department
of Energy, additive manufacturing uses 50%
less energy on average, and saves up to 90%
on materials costs compared to traditional
manufacturing.110 The technology can also
create objects that are difficult or impossible
to produce via traditional techniques.
These features explain why 3D printing is likely
to spread so rapidly over the coming decade.
Its use is already commonplace for designers
and engineers, who use 3D printers to create
product prototypes, tools, moulds, and even
final products. On an industrial scale, Boeing
has produced over 20,000 3D-printed parts
since last year, using these parts in 10
different types of military and commercial
aircraft.111 These newer applications of 3D
printing could enable unprecedented levels of
mass customisation, while at the same time
transforming supply chains into efficient and
sustainable models.
A wide array of materials can be used as
substrates for 3D printing, including a broad
range of polymers (thermoplastics, HDPE,
metals and alloys, paper and ceramics, for
example). However, some of these materials
are toxic (e.g. heated PVC). Solutions for this
are starting to emerge. One example is
DSM’s C2C-certified Arnitel engineering
thermoplastics, developed in collaboration
with EPEA.112 The words of Janine Benyus
of Biomimicry 3.8 are food for thought:
“So much waste from our manufacturing processes comes from their subtractive nature…whereas life builds to shape.3D printing (additive manufacturing) gives us the ability to build to shape, layer by layer. It also gives us the ability to thinkabout varying materials layer by layer, creating bio-inspired composites that add toughness or strength, but that easilydisassemble. Suddenly, you can create an intricate architecture inside the product, as well as an optimised outer shape. You don’t need more material to enhance performance. You need design.”113
The ability to create different structures
from the same small set of materials
can generate new and valuable materials
characteristics and variations. These materials,
according to Benyus, need to be ‘common,
safe, and recyclable from the start.’
109 Disruptive Technologies: Advances that will Transform Life, Business, and the Global Economy; May 2013, McKinsey Global Institute.
110 Interview with Janine Benyus, Co-Founder of Biomimicry 3.8 Institute, and Beth Rattner, Interim Executive Director of Biomimicry 3.8 Institute.
111 Dickey, M.R., Hope You Trust 3D Printers—Boeing Uses Them To ‘Print’ Parts For Its Planes, Business Insider, 21June 2013 (http://www.businessinsider.com/boeing-uses- 3d-printers-for-airplane-parts-2013-6).
112 Interview with Douglas Mulhall, representative of theAcademic Chair, Cradle to Cradle for Innovation and Quality Rotterdam School of Management, Erasmus University, as well as EPEA Internationale Umweltforschung.
113 Janine Benyus recorded presentation in Ellen MacArthur Foundation CE100 library.
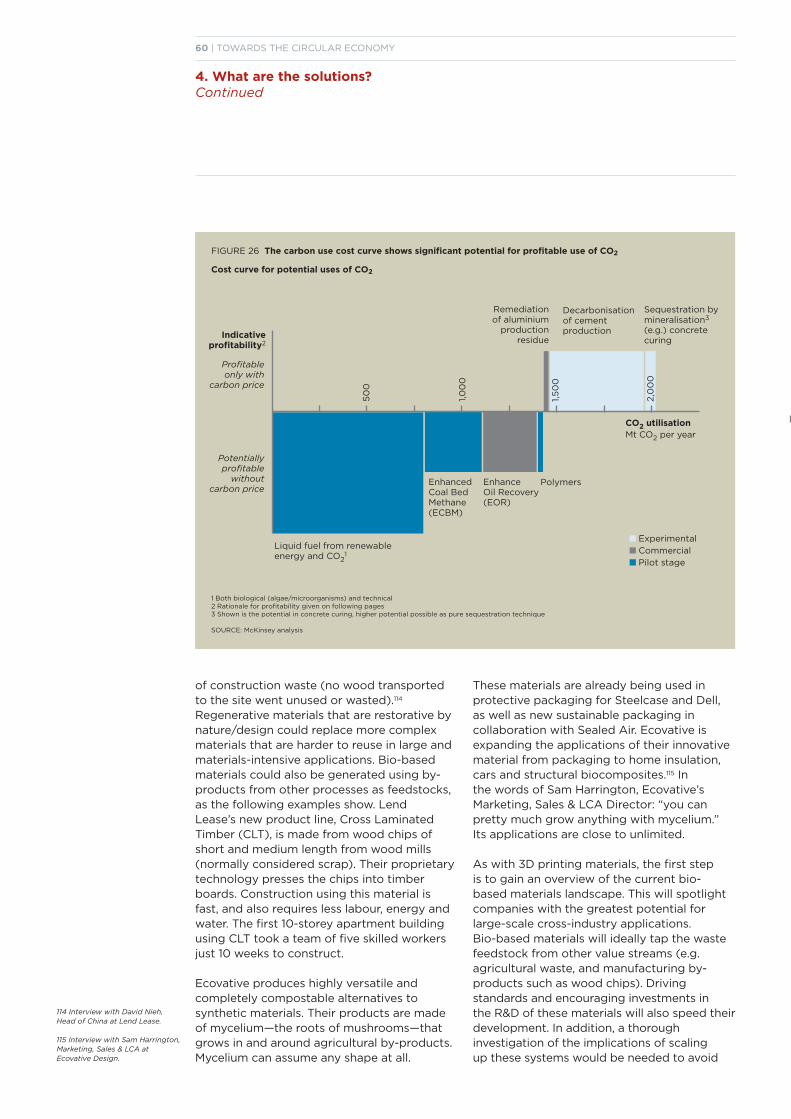
FIGURE 26 The carbon use cost curve shows significant potential for profitable use of CO2
Cost curve for potential uses of CO2
60 | TOWARDS THE CIRCULAR ECONOMY
4. What are the solutions?Continued
of construction waste (no wood transported to the site went unused or wasted).114 Regenerative materials that are restorative by nature/design could replace more complex materials that are harder to reuse in large and materials-intensive applications. Bio-based materials could also be generated using by-products from other processes as feedstocks, as the following examples show. Lend Lease’s new product line, Cross Laminated Timber (CLT), is made from wood chips of short and medium length from wood mills (normally considered scrap). Their proprietary technology presses the chips into timber boards. Construction using this material is fast, and also requires less labour, energy and water. The first 10-storey apartment building using CLT took a team of five skilled workers just 10 weeks to construct.
Ecovative produces highly versatile and completely compostable alternatives to synthetic materials. Their products are made of mycelium—the roots of mushrooms—that grows in and around agricultural by-products. Mycelium can assume any shape at all.
1 Both biological (algae/microorganisms) and technical2 Rationale for profitability given on following pages3 Shown is the potential in concrete curing, higher potential possible as pure sequestration technique
SOURCE: McKinsey analysis
These materials are already being used in protective packaging for Steelcase and Dell, as well as new sustainable packaging in collaboration with Sealed Air. Ecovative is expanding the applications of their innovativematerial from packaging to home insulation, cars and structural biocomposites.115 In the words of Sam Harrington, Ecovative’s Marketing, Sales & LCA Director: “you can pretty much grow anything with mycelium.” Its applications are close to unlimited.
As with 3D printing materials, the first step is to gain an overview of the current bio-based materials landscape. This will spotlight companies with the greatest potential forlarge-scale cross-industry applications. Bio-based materials will ideally tap the waste feedstock from other value streams (e.g. agricultural waste, and manufacturing by-products such as wood chips). Driving standards and encouraging investments in the R&D of these materials will also speed their development. In addition, a thoroughinvestigation of the implications of scaling up these systems would be needed to avoid
Profitable only with
carbon price
Potentiallyprofitable
without carbon price
Indicativeprofitability2
Sequestration by mineralisation3
(e.g.) concrete curing
Decarbonisation of cement production
PolymersEnhanced Coal BedMethane(ECBM)
Enhance Oil Recovery(EOR)
Remediation of aluminium
production residue
Liquid fuel from renewable energy and CO2
1
50
0
1,0
00
1,5
00
2,0
00
CO2 utilisationMt CO2 per year
n Experimental
n Commercial
n Pilot stage
114 Interview with David Nieh, Head of China at Lend Lease.
115 Interview with Sam Harrington, Marketing, Sales & LCA at Ecovative Design.
FIGURE 26 The carbon use cost curve shows significant potential for profitable use of CO2
Cost curve for potential uses of CO2
1 Both biological (algae/microorganisms) and technical2 Rationale for profitability given on following pages3 Shown is the potential in concrete curing, higher potential possible as pure sequestration technique
SOURCE: McKinsey analysis
TOWARDS THE CIRCULAR ECONOMY | 61
along the dimensions of cost of materialsand frequency of usage. Rental models are most applicable for high-cost products with short usage periods (e.g. flooring sander and Rug Doctor for specialised carpet cleaning), while end-of-use take-back for recycling would be best for those with low cost and heavy usage (e.g., clothing)116. The Forum’sYoung Global Leader working group on The Sharing Economy has identified specific criteria for considering collaborative consumption business models. These include high liquidity of assets, significant idle capacity, high cost of ownership, rapid obsolescence, and no demand and supply limitations.117
Transfer business model solutionsCompanies that have already ushered in new business models of this kind have sometimes even found they can transfer what they have learned to other businesses.
- Improving their relationship with customers. I:CO has noted that some of their partners’ stores with clothes collection schemes experienced an increase in foot traffic.In addition, the company noticed that providing incentives (with vouchers) and transparency on what happens to thecollected clothes with in-store programme flyers encourages customers to take end-of-use clothes back to the store.118
- Monetising idle capacity. Office space sharing at LiquidSpace, errand-running services at TaskRabbit and accommodation sharing at Airbnb (among many other examples) provide a platform for customers to trade idle capacity of their assets. Airbnb, launched in 2008, is currently valued at US$ 2 billion. An average New York Airbnb host user earns an estimated US$ 21,000 annually from the application.119
- Having better control of the product life cycle. Ricoh sells 60% of their products with a service contract, which allows it to orchestrate supply and demand planning, as well as set up efficient reverse logistics.120
- Creating stable revenue streams and premium. Companies may be able to achieve further differentiation by moving towards usage-based models. Airlines alreadyextract premium by segmenting their passengers along usage patterns based (for
the unintended consequences of resource depletion. For example, the EU policy of subsidising biomass for biofuel led to shortage of wood in Europe and unsustainable imports of wood from other countries to fill the gap. It also negatively impacted e.g. the furniture industry by mispricing a valuable resource.
Initiatives on purifying materials stocks should include establishing the building blocks and mechanisms to facilitate smooth materials flows. Further detail on how this is planned can be found both in Chapter 5 and Appendix 1.
Innovate demand-focused business models
Modified business models will play a key role in overcoming the geographical dispersion and quality leakage issues described above and in Chapter 3. Business models areneeded that allow better access to products, components and materials during and within the post-usage loops. Business model innovation will be critical to main-streaming the uptake of the circular economy principle in more B2B setups, and in B2C. It will also be important to fully capture the potential of the shift to a sharing economy already discussed.
Advancing new access-over-ownership and take-back models will further accelerate the adoption of circular economy business models because they drive the greater use of existing idle assets. Examples are office sharing asorganised by LiquidSpace, and parking space sharing using the online tool ‘Park At My House.’ Better control over the fleet of products and embedded resources will be another benefit (via take-back schemes, for example, or rental/leasing models). Permitting the monetisation of investment in theinnovation/improvement of more circular designs will also encourage spread (e.g. higher-cost products with increasedlongevity for leasing model can compete with lower-cost products in traditional sale model).
It will also be helpful to segment products and services to identify how best to meet the company’s and consumer requirements when shifting to new business models. B&Q/Kingfisher has started to develop a segmentation approach for their portfolio
116 Interviews with James Walker, Head of Innovation, and Alex Duff, Corporate Affairs Manager, at Kingfisher (B&Q).
117 World Economic Forum’s Young Global Leaders Sharing Economy Working Group, Position paper, 2013.
118 Interview with Paul Doertenbach, Global Account Manager of I:CO.
119 See note 117 above.
120 Interviews with Phil Hawkins, Assistant General Manager - Business Strategy SCM1, Ricoh UK, and Olivier Vriesendorp, Director of Product Marketing, Ricoh Europe.
62 | TOWARDS THE CIRCULAR ECONOMY
4. What are the solutions?Continued
instance) on their flexibility needs. Many companies are now increasingly using loyaltyprogrammes and yield management approaches to maximise return from their fixed-asset base.
Mainstream the sharing economy and collaborative usage models.To scale up the demand-focused business models, success stories and better demonstration of their economic and non-economic benefits are needed to encourage adoption by companies and cities/regions. The former will be able to create or revise related regulation to encourage further growth of the business models.
Focus on pure materials stockmanagement at the outset
This chapter has examined the three most promising approaches, detailing how businesses and other stakeholders could work together to scale up the circular economy. The World Economic Forum and the Ellen MacArthur Foundation aim to catalyse action that can swiftly accelerate transition to the circular economy, achieving tangible outcomes within two years. The approach chosen also needs to have sufficient global reach and cross-industry application. In addition, it will ideally build on the leadership of partner companies drawn from both organisations, and benefit from their mutual synergies.
With these criteria in mind, the analysis shows the materials flow perspective as the most promising to initiate the project. Catalysing “trigger projects” to develop pure materials flows could significantly accelerate scale-up of the circular economy across many sectors.
Why not the first or the third options? The first—reorganising global reverse networks for products and components— provides arbitrage opportunities that are easier for individual companies to realise. First movers can quickly capture the benefits, as the many examples in this report demonstrate. However, this opportunity is most accessible to individual companies, or within specific industry verticals (Figure 27).
Transition is already gradually underway in most sectors on the third option, business model innovation. The critical lever for accelerating the shift is demonstrating its economic benefits and success. Showcasing its non-economic benefits sufficient to drive adoption by large companies and regulatorswould also be important. The Forum’s Young Global Leader Circular Economy Innovation and New Business Models Taskforce has been working towards this goal over the pasttwo years. Collaborative Lab, an innovation consultancy, facilitates a large platform for sharing best practice where businesses and regions can learn from one another’s experience. Work is therefore already under way in this field.

TOWARDS THE CIRCULAR ECONOMY | 63
Materials flows are the largest common denominator, where multiple stakeholders need support to collaborate effectivelyin order to generate benefits for multiple players along the value chain, across sectors and geographies (Figure 26). Relevant pre-work can also be leveraged, yielding substantial improvements in the short to medium term. The analysis in addition to feedback from many companies and experts therefore suggest that the best starting point is to establish pure materials flows for the Golden Oldies (paper and card board), High Potentials (polypropylene), Rough Diamonds(carbon dioxide) and Future Blockbusters (biobased and 3D-printing) on a large scale. This will be the fastest way to scale-up the circular economy.
Pursuing this path will likely entail positive second-order effects, such as job creation and higher value added in the reverse cycle decoupled from resource price volatility, which will create a more robust planning environment. This typically results in superior financial returns, from the overall elimination of waste, and the associated wider economic benefits.
The opportunity is huge. The next chapter lays out a proposal on how a joint initiative could capture the opportunity of option 2 on an unparalleled, global scale—and fast.
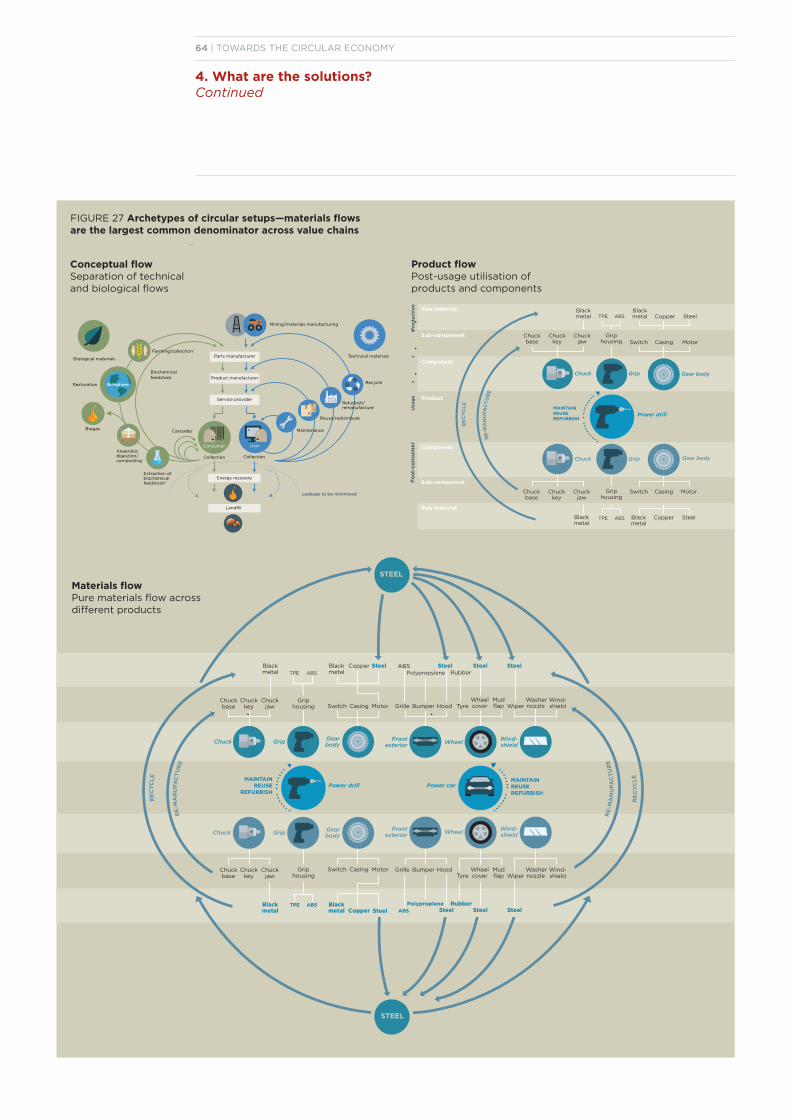
64 | TOWARDS THE CIRCULAR ECONOMY
4. What are the solutions?Continued
FIGURE 27 Archetypes of circular setups—materials flows are the largest common denominator across value chains
Conceptual flowSeparation of technical and biological flows
Materials flowPure materials flow acrossdifferent products
Product flowPost-usage utilisation of products and components
Farming/collection1
Biochemical feedstock
Restoration
Biogas
Anaerobic digestion/ composting
Extraction of biochemical feedstock2
Cascades
Collection
Energy recovery
Leakage to be minimised
Parts manufacturer
Product manufacturer
Service provider
Landfill
Collection
User
Biosphere
Mining/materials manufacturing
Technical materials
Recycle
Refurbish/remanufacture
Reuse/redistribute
Maintenance
6 2803 0006 9
Consumer
Biological materials
MAINTAINREUSE
REFURBISH
Griphousing
Griphousing
TPE ABS
TPE ABS
Blackmetal
Blackmetal
MAINTAINREUSEREFURBISH
Chuckbase
Blackmetal
Blackmetal
Chuckkey
Chuckkey
Copper
Copper
Chuckjaw
Chuckjaw
Steel
Steel
Switch
Switch
Casing
Casing
Motor
Motor
Wheel
Wheel
ABSPolypropylene
Steel
Steel
Rubber
Rubber
Steel
Steel
Tyre
Tyre
Wheel cover
Wheel cover
Mud flap
Mud flap
Grille
Grille
Wiper
Wiper
Bumper
Bumper
Washernozzle
Washernozzle
Hood
Hood
Wind-shield
Wind-shield
Front exterior
Front exterior
Wind-shield
Wind-shield
Power car
Steel
Chuck Grip Gear body
Chuck Grip Gear body
Power drill
ABS
PolypropleneSteel
STEEL
STEEL
RE
CY
CL
E
Chuckbase
RE
CY
CL
E
RE
-MA
NU
FA
CT
UR
E
RE
-MA
NU
FA
CT
UR
E
Raw material
Component
Product
Pro
du
cti
on
Po
st-c
on
sum
er
Usa
ge
Sub-component
Sub-component
Component
Raw material
Chuckbase
Chuckkey
Chuck jaw
Griphousing
TPE ABS
Switch Casing Motor
Chuckbase
Chuckkey
Chuckjaw
Switch Casing Motor
Blackmetal
Copper Steel
Blackmetal Copper Steel
Blackmetal
Blackmetal
Griphousing
TPE ABS
Chuck
Chuck
Power drill
Chuck
Chuck
Grip
Grip
Gear body
Gear body
MAINTAINREUSEREFURBISH
RE
CY
CL
E
RE
-MA
NU
FA
CT
UR
E

TOWARDS THE CIRCULAR ECONOMY | 75
15
Joining forces to make the change
66 | TOWARDS THE CIRCULAR ECONOMY
5. Joining forces to make the change
A multi-stakeholder community of CircularEconomy Champions needs to take the lead.The World Economic Forum and the EllenMacArthur Foundation invite their members to join forces to rapidly scale up the circulareconomy on a global level.
Accelerating the scale-up of the circular economy promises to deliver substantial macroeconomic benefits. New opportunities for corporate growth will also be myriad. Thereduction in materials price volatility alone is estimated at over a trillion dollars a year. The job creation potential of remanufacturing globally and recycling in Europe is predictedto exceed 1 million.121 Worldwide, the figure will far exceed this over time.
Concerted action is key. The challenges are not insurmountable, but addressing the leakage points described will require cooperation from players across differentindustries. In the words of Rudi Daelmans, Desso’s Director of Sustainability, “We cannot do it alone”.122 Collaboration across different stakeholders, industries and geographies will be needed to devise standards and mechanisms for materials use, conversion methods, and reverse setups.
With their mutually reinforcing comparative advantages in both catalysing global public and private collaboration and driving insight and action on the circular economy, the World Economic Forum and the Ellen MacArthur Foundation will provide a unique project platform to help usher in this change at scale quickly. The Forum as a catalyst of global, regional and industry transformation will draw upon its members to convene a multi-stakeholder community of global leaders to shape this agenda. The Foundation’s charitable purpose is to accelerate transition towards the circular economy, making it ideally suited to this task. It will act as a knowledge partner, ensuring quality control of the conceptual framework. Together, the Forum and Foundation will provide companies, governments, civil society and academic experts with a platform for collaboration at a pre-competitive stage across industry, regions and sectors, co-designing a process to enable systemic change. They will take charge of ensuring programme management, execution and delivery within this cross-institutional setup.
Project charter
Together, the Forum and the Foundation pledge to accelerate the transition time from the usual 30 - 35 years that could beexpected for a global undertaking of this kind to 5 - 10 years for major materials. The Collaboration will convene and commit players that control 5 - 10 per cent of global volume in the four selected materials categories to participate from the outset. These will reap the rewards of becoming first-movers, as well as being flagships that demonstrate excellence to their peers, with the available platforms of the Forum and theFoundation to promote their leadership and the project. The initiative aspires to realise the economic and non-economic value of the circular economy. For example, the four to five waves established in this project would aim to reap net benefits of at least US$ 500 million and 100,000 new jobs, as well as to avoid/valorise 100 million tonnes of materials waste within five years. The concrete goal will be defined during the initial phase of the project. Progress will be quantified on aregular basis using the circularity calculator, along the dimensions of materials, labour and energy inputs, as well as carbon emissions and balance of trade.
A clear plan of action
Creating a preferred list of pure, high-quality materials with cross-industry applications is the central concept. This will aggregate volume and enhance stock valorisation. Proof of concept with a few materials will also be crucial. The second key objective is to catalyse enabling mechanisms to facilitate efficient materials flows. These actions together will trigger a self-reinforcing cycle. Replicating the process for further materials will also be much easier, as the learnings will be transferable.
1. Create a preferred list and achieve proof of concept Detailed specifications will make the difference. Business leaders and other stakeholders will specify precise criteria forassembling building blocks for four to five different materials. Sub-groups will focus on each of these materials flows, and then take at least two – possibly three – ‘live’.
121 Based on the Automotive Parts RemanufacturersAssociation’s estimate that 500,000 jobs have beencreated in the remanufacturing industry for products, ranging from automotive components and electrical and electronic equipment to furniture and construction equipment, and Sita Group’s estimate that some 500,000 jobs have been created by the recycling industry in the EU.
122 Interviews with Rudi Daelmans, Director of Sustainability at Desso.
TOWARDS THE CIRCULAR ECONOMY | 67
Create a preferred list of pure, high-quality materials as the building blocks of tomorrow. The first stage will involve outlining solutions (or mechanisms)—together with initiative participants—that can address the leakage points quickly, covering the following analyses:
• Select materials to focus on and confirm the rationale for selecting these signature materials with participants. The materials fall into two general groupings. The first covers current high-volume, high-value materials stocks: products such as paper and cardboard for the Golden Oldies and polypropylene for High Potentials. The second encompasses materials relevant for future manufacturing processes, such as bio-based materials/materials for 3D printing in the Future Blockbusters category, and carbon dioxide in the Rough Diamonds category. These materials have different starting points in terms of current volume, collection rate, quality of materials recovered, and technologies to improve scale-up (both available and upcoming). Once a firm decision on these materials has been made, subgroups are set up for each material, and carry throughthe actions with that material specifically.
• For the first material class, understand the current materials flows for these selected materials, leveraging existing knowledge to identify and quantify leakage points, whichwill give an indication of the potential benefits of closing the gaps for all parties involved. For the second class of materials, the technological landscape will be mapped outto identify the most promising areas (with a wide range of applications and high potential volume) to scale up and understand what is required to get there. While the details will differ by the material in question, the main barriers will be technical, infrastructural, commercial, or regulatory in nature. Some technical and regulatory barriers should beanalysed from a cross materials flow perspective, as these will ideally be addressed at a systemic level.
• Define the intended use and defined use123 for each material and related products. These are important because the preferred list of materials and their building blocks, oradditives, depends on what they are intended to do and where they are intended to go.
- Intended use describes what the product is practically intended to do for the user. For example, Desso working with EPEA identified a new value-added intended use for carpets; cleaning the air. By focusing on intendeduse Desso was able to generate new markets and revenues.
- Defined use describes the pathway of products or materials as technical nutrients and biological nutrients (see Figure 2). As part of this, the defined use period describes how long the product or material is used beforebeing discarded, to facilitate replacement and recovery. Defined use and defined use periods are optimised after intended use is clarified.
• Derive approaches for addressing the leakage points or scaling up, including how to design building blocks and conversion methods for each flow. A list of non-toxicpolymer additives that are easy to separate during recovery—only mechanical mixed additives, perhaps— would be one such example, or changes in product design to allow easy disassembly. Another aspect to cover will be how to set up the reverse loop to ensure quality of the materials recovered (including potential changes to the business model). Also, what other applications can thematerials be used for? The approaches will be prioritised by impact and feasibility.
A number of existing initiatives already make inroads into this space including EPEA in Hamburg, Germany with a catalogue of defined usage scenarios for products and materials with description of building blocks that are safe and/or recyclable to be used in production.124 Such a database can be leveraged and scaled up across the materials in focus.
• Jointly develop an action plan to implement the most impactful and feasible approaches with relevant internal and external stakeholders, ensuring cross-functional involvement from departments such as R&D, Procurement, and Marketing & Sales. Players will be involved from the entire cross-supply cycle, including suppliers, contractors, recyclers and logistics suppliers, as well as cross-industry players. In addition, a road map to phase out toxic materials across the supply cycle is needed as the pure material toolbox scales up.
123 Intended Use, Defined Use, and Defined Use Periods are described further in the optimisation protocol developed by EPEA Internationale Umweltforschung.
124 Interview with Douglas Mulhall, representative of theAcademic Chair, Cradle to Cradle for Innovation and Quality Rotterdam School of Management, Erasmus University, as well as EPEA Internationale Umweltforschung.
68 | TOWARDS THE CIRCULAR ECONOMY
5. Joining forces to make the changeContinued
• Define mechanisms for continuous improvement of value creation and cost reduction. The former will focus on seeking higher-value applications for the same materials flows, and valorising a broader set of material flows. Cost reduction will concentrate on improving scale, logistics, and processes—both how the waste stream is created, and how waste/by-products are best processed to recover value.
• If solutions are not available today, identify who else in the system can provide support in the short-, medium-, and long-term. This may include local, regional or national authorities, universities and research institutions, or industry associations.
Mobilising multiple stakeholders is always a challenge. Actions need to rely on a commonly agreed fact base around which the business case is built, with the benefits shared among everyone involved. Capability building for all stakeholders involved would also be required to ensure that all parties are up to speed with the circular economy concepts and applications. This would include:
• Initial education/training on the circular model• Provision of a series of sector-relevant case studies• Provision of a series of tools for identifying and capturing opportunity (e.g. hotspot tools)
The Foundation’s CE100 programme already has the capability to provide many elements of a practitioner platform to support the Forum’s executive-level platform to bringtogether a range of participants and showcase real-world case studies.
Provide proof of concept. Two or more materials flows will be selected to demonstrate proof of concept. This phase is critical to understand the feasibility of the approach taken, not just for the materials flows tested, but also for others in thebroader context, and would entail the following actions:
• Have a few leading companies commit to applying the mechanism identified to one (or several) of their products using only materials from the preferred list. This wouldmean changing their product design to
allow better reuse and recycling of the components, and setting up a reverse loop
• Estimate the potential economic impact once the end goal is reached, and the costs of getting there
• Identify the partners required to organise the supply cycle from forward to reverse loops, and obtain commitments from these partners
• Jointly agree on business models to allow benefit sharing across the supply cycle
• Jointly set up a roadmap to achieve the end goal with partners
The flagship players can showcase their success stories for global and regional policy-makers as well as investors to encourage them to participate and motivate systemic change. Learnings from the proof-of-concept phase will provide valuable input for the full rollout of all materials flows.
2. Identify benefits and catalyse enabling mechanismsThe second key objective (covered by a different working group) will be to quantify economic impact/secondary benefits from the materials focus workstreams and catalyse cross-cutting enablers to address the leakage points and sustain change.
• Quantify economic impact and secondary benefits. The significant potential benefits that the circular economy could yield for each of the stakeholders involved were highlighted in the two ‘Towards the Circular Economy’ reports. The research for the first report, looking only at the sectors of medium-lived complex goods (such as motor vehicles or consumer electronics) revealed estimated cost savings of up to US$ 630 billion in Europe after 2020. The second report considered fast-moving consumer goods (e.g. food and beverages, apparel, and packaging) on a global scale, and extrapolated an economic opportunity worth more than US$ 700 billion per year, or materials savings of roughly 20%.125
Quantifying these benefits specifically for the materials selected in the pilots will provide targets and extra impetus.125 See note 1 and note 22.
TOWARDS THE CIRCULAR ECONOMY | 69
• Size the economic benefits of achieving pure materials flows. The ‘circularity calculator’ described in the first ‘Towards the Circular Economy’ report can be used, with amaterials rather than a product focus. The calculator compares the inputs needed to make a new product in today’s linear system with those required to make the same product using pure materials flows. The analysis focuses on five key areas of economic and environmental impact:
- Materials inputs. The materials intensity of a ‘linear’ version is compared with the materials intensity of a ‘circular’ version, calculated in terms of various circular options (reuse, refurbishing, remanufacturing, recycling).
- Labour inputs. The labour required to make a new product is compared with that required to make a circular loop, by geography.
- Energy inputs. The difference in energy needed to make a new product is quantified versus a circular product.
- Carbon emissions. The carbon footprint of the process of manufacturing a new product is compared with the emissions generated to make a circular loop.
- Balance of trade. The exports and imports of input and finished goods across trade routes (including all geographies involved) are quantified for both the linear and circular versions.
The analysis will be conducted for one specific product in each industry. Informed assumptions will then be used to project the result to determine the total savings onmaterials, labour, energy, and carbon emissions as well as the trade balance effect at a market level. The premise will be that producers across a specific product industry (e.g. the mobile phone market) adopt the pure materials flows approach. The combined effect of all relevant industries for each materials flow will yield the total economic impact (for that materials flow).
- Assess the economic benefits from enhanced innovation. Innovation will also flourish as a result. The transition towards pure materials flows will lead to more blue skies thinking across the economy. The
benefits of this include higher rates of technological development, improvedmaterials, labour, and energy efficiency, more new business models, and more profit opportunities for companies. Indicators will be developed to quantify these benefits.
- Measure the potential for reducing waste. In the steady state, the volume of products and components associated with the materials flows examined that would otherwise end up in landfills will be significantly reduced. The waste elimination potential can be estimated by understanding the leakage points in the materials flows.
Mobilising the public sector and other stakeholders. Enablers will be required to accelerate the transition, addressing both common leakage points across the materials and specific issues highlighted by the proof-of-concept activities. The momentum and findings from the commitment of key players in the private sector will be leveraged to draw in policy-makers and other key stakeholders (such as investors and thought-leaders). These will be encouraged to examine the systems enablers needed to scale up the circular economy, including regulatory change, investment focus, and R&D effort, and advances in information technology. The public sector and other stakeholders are critical to the transition towards an economywith pure materials flows, and would have at least two important roles to play in the transition period:
• Drive regulatory change. Changes in regulation are required to quickly scale up pure flows and sustain the new economy. Government and public sector entities canhelp to foster cross-industry collaboration by establishing appropriate regulations, standards and guidelines. Governments could re-examine certification programmes to enable new ways of confirming the viability or safety of circular products; optimise and control the use of incinerators to avoid negative effect on materials recycling; andrevisit current trade barriers and regulatory gray zones to facilitate transboundary materials flows. This would require standards and transparency of materials content. Product passports could help to address this issue as they would provide information about the components and materials a
70 | TOWARDS THE CIRCULAR ECONOMY
5. Joining forces to make the changeContinued
product contains, and how they can be disassembled and recycled at the end of the product’s useful life.126 In July 2013, the European Resource Efficiency Platform recommended ‘product passports’ in its interim set of recommendations, among other measures.
In addition, full transparency on materials pricing, that reflects the real costs of materials (including externalities) needs to be established to drive the efficient use of resources.
Access to finance and risk management tools will support capital investment and R&D for all players across value chains. Governments can create further funding stimuli byunderwriting some of the risks associated. In Brazil, for instance, the Ministry of Agriculture’s ABC program provides access to preferred credit conditions to companies that undertake innovative initiatives.
• Catalyse investment in new business models and innovations. Businesses and entrepreneurs often cannot mobilise the capital required, however ripe for scale-uptheir technologies and business models look. Solutions range from brokering traditional investment through public-private partnerships to using more innovativesolutions, including crowdfunding.
In parallel to this initiative, the Forum is launching a multi-stakeholder platform to facilitate a global agenda on science, technology and innovation. The goal is to bring together business, policy and scientific leaders and institutions to collaboratively drive the innovations needed to address global challenges. One of the proposed areasof this platform is to broker a fund to help address complex global issues, with the circular economy as one of the pilot topics. The timeline for this platform fits well with this proposal, creating synergies especially on the innovation front.
Over 450 crowdfunding platforms127 now exist, including some well-known examples such as Kickstarter and Indiegogo. These platforms have provided many artists,charities, and start-ups with access to financing. Title II of the JOBS Act legislation in the US in July 2013 has now made it permissible for companies—for the first
time in over 80 years—to raise investment via equity crowdfunding.128 This shift will encourage companies of all sizes to tap into a large pool of finance from small investors. The greater use of digital technology has made iteasier for investors to identify and compare investment options. Transparency on the economic benefits of new business models and innovations in materials science willencourage the advance of these investment approaches to support transition to the circular economy.
• Mobilise advances in information technology. Information technologies (IT) play a key role in enabling the transition towards circular business models. This role ranges from tracing materials and products, organising reverse logistics and accelerating innovation (with crowdsourcing and information sharing) to mining big data (for mapping resource and value flows and tracking indicators to measure progress). While some of these technologies are already advanced (such as sensors, the cloud, and social networks), there are enormous opportunities for the IT industry to work with businesses and other stakeholders on identifying critical areas for further improvement. The difficulty of ensuring theavailability, quality and consistency of resource-related data remains a significant obstacle, especially at national and global levels. The enhanced mining of big data willhelp address this issue.
All stakeholders are aware that today’s model of wealth creation is built on excessive material and energy waste, and cannot be maintained indefinitely. As the shift towards a more circular model assumes clearer contours, the value of its design paradigm cannot be overrated. The time to act is now. Substantial scale-up will require the concerted effort of a few powerful leading institutions. We hope this initiative will create sufficient appeal for leaders to step forward and advance the joint agenda, not just for the common good, but also to reap first-mover advantage. Delivering on this agenda will enable us all to be better stewards of our supply flows and— eventually—of our planet.
126 European Commission, Eco-innovation Action Plan news, “European Resource Efficiency Platform pushes for ‘product passports’”, 8 July 2013 (http://ec.europa.eu/environment/ecoap/about-eco-innovation/policiesmatters/ eu/20130708_european-resource efficiencyplatform- pushes-for-product-passports_en.htm). McDounough, W. and Braungart, M., “Towards a sustaining architecture for the 21st century: the promise of cradle-to-cradle design” in UNEP Industry and Environment April-September 2003.
127 Crowdfunding Industry Report: Market Trends,Composition and Crowdfunding Platforms, May 2012, Crowdsourcing.org.
128 Barnett, C.,”SEC Finally Moves on Equity Crowdfunding, Phase 1”, Forbes, 19 July 2013 (http://www.forbes.com/ sites/chancebarnett/2013/07/19/sec-finally-moves-onequity- crowdfunding-phase-1/)
TOWARDS THE CIRCULAR ECONOMY | 71
Glossary
Transition and advanced scenarios• Transition scenario. Assumes only changes in product design and reverse supply chain skills. Analyses in the two Towards the Circular Economy reports typically assumedimprovements in the underlying economics, with collection rates increasing by 20 to 30 percentage points, and a shift of approx. 30 percentage points from recycling to refurbishing or remanufacturing activities.
• Advanced scenario. Demonstrates potential repercussions in a world that has undergone more radical change and has further developed reverse technologies and infrastructure and other enabling conditions, such as customer acceptance, cross-chain and cross-sector collaboration, and legal frameworks. Analyses in the two Towards the Circular Economy reports assumed collection rates increasing by 30 to 40 percentage points and an additional shift of 5 to 10 percentage points to refurbishing or remanufacturing.
Arbitrage opportunities. Opportunities to take advantage of a price difference between two or more scenarios. In the circular economy, an arbitrage opportunity entails the benefits in terms of material costs, labour and energy that circular setups provide over linear models.
Bill of materials (BOM). A list of raw materials, sub-assemblies, intermediate assemblies, sub-components and parts, and the quantities of each needed to manufacture a specificend-product
Bio-based vs. biodegradable Many bio-based products such as, for example, biopolymers are not necessarily safely biodegradable because they contain additives such as heavy metals or are combined with non-biodegradable materials. As well, petroleum-based products that are not bio-based can be biodegradable. Bio-based materials are derived from biological source, belonging to the biosphere. The definition of biodegradable includes that the material is shown to degrade completely in an industrial composting facility within a prescribed timeframe.
Cascading of components and materials. Putting materials and components into different uses after end-of-life across different value streams and extracting, over time, stored energy and material ‘coherence.’ Along the
cascade, this material order declines (in other words, entropy increases).129
Electrical and electronic equipment (EEE). Comprising both electrical equipment and electronic equipment. Electrical equipment includes any machine powered by electricity, such as major appliances and power tools.Electronic equipment encompasses equipment that involves the controlled conduction of electrons (using a semi-conductor), allowing the amplification of weak signals for use in information processing, telecommunications, and signal processing, as for example in computers, mobile phones, television sets, refrigerators, and office equipment.
End-of use. Materials/products at the end of their primary use, that are collected and returned to the same usage, or cascaded to a new one.
Materials recycling• Functional recycling. Recovering materials for their original purpose or for other purposes, excluding energy recovery• Downcycling. Converting materials into new materials of lesser quality and reduced functionality• Upcycling. Converting materials into new materials of higher quality and increased functionality, also by improving on a downcycling process.
Plastics. Synthetic polymers consisting of thermoplastics, polymers that become pliable or mouldable above a specific temperature, and return to a solid state upon cooling.Alternatively, these may be thermoset plastics, which are polymers that irreversibly cure either via heat, chemicals, or radiation. Thermoplastics are more widely used (have the highest volumes), including the four most common polymers:• Polyethylene (PE). High-density polyethylene (HDPE) is used to make milk jugs, margarine tubs and water pipes.Low-density polyethylene (LDPE) is soft and flexible, and is used in the manufacture of squeeze bottles, sacks and sheets• Polypropylene (PP). Used in reusable plastic containers, diapers, sanitary pads, ropes, carpets, plastic moldings, piping systems, car batteries, insulation for electrical cables, etc.
129 Hansen, K., Braungart, M., Mulhall, D., “ResourceRepletion”, in Meyers, Robert A. (ed.), The SpringerEncyclopedia of Sustainability Science and Technology,Springer Reference, Berlin, Heidelberg, July 2012.
72 | TOWARDS THE CIRCULAR ECONOMY
GlossaryContinued
• Polyvinyl chloride (PVC). Used in the construction industry, such as vinyl sidings, drainpipes, gutters and roofing sheets (as it is resistant to acids and bases).
• Polyethylene terephathalate (PET): Used in beverage bottles, textiles, specialty films, etc.
Polymers. Large molecules composed of many repeated sub-units (monomers). Polymers can be synthetic (plastics) ornatural biopolymers (such as polysaccharides, DNA, or proteins).
Rebound effect. The behavioural or other systemic responses to the introduction of new technologies that increase the efficiency of resource use. These responses, including energy consumption, usage of natural resources or other inputs (i.e. labour), tend to offset the beneficial effects of the new technology or other measures taken.
Refurbishment. A process of returning a product to good working condition by replacing or repairing major components that are faulty or close to failure, and making‘cosmetic’ changes to update the appearance of a product, such as cleaning, changing its fabric, painting or refinishing it. Any subsequent warranty is generally less than issued for a new or a remanufactured product, but the warranty is likely to cover the whole product (unlike repair). Accordingly, the performance may be less than as-new.
Remanufacturing. A process of disassembly and recovery at the sub-assembly or component level. Functioning, reusable parts are taken out of a used product and rebuiltinto a new one. This process includes quality assurance and potential enhancements or changes to the components.
Reuse of goods. The use of a product again for the same purpose in its original form or with little enhancement or change. This can also apply to what Walter Stahel calls‘catalytic goods,’ e.g., water used as a cooling medium, or in process technology.
Supply loops. Forward and reverse logistics setup to facilitate materials/product flows through the system from inputs/raw materials, production, finished goods, andend-of-use products back to raw materials, together with intermediate steps to prolong the product life cycle.
Waste electrical and electronic equipment (WEEE). Discarded electrical and electronic devices that still contain significant valuable materials, including metals (e.g. steel,copper, rare minerals) and plastics.

TOWARDS THE CIRCULAR ECONOMY | 73
Literature
Benyus, J., Biomimicry: Innovation Inspired by Nature, William Morrow Paperbacks; 2nd edition (September 17, 2002).
Benyus, J. “Biomimicry in Action”, posted 6 April 2009, at: Ted. Thoughts Worth Spreading. (http://blog.ted. com/2009/08/06/biomimicry_in_a/).
Botsman, R, Rogers, R. What’s Mine Is Yours: How Collaborative Consumption is Changing the Way We Live. 2010. Harper Business.
Chapman, A. et al., Remanufacturing in the U.K. – A Snapshot of the U.K. Remanufacturing Industry; Centre forRemanufacturing & Reuse report, August 2010.
Disruptive technologies: Advances that will Transform Life, Business, and the Global Economy, May 2013, McKinsey Global Institute.
Geng, Y., et al. “Measuring China’s Circular Economy”; Science; March 2013.
Global Risks 2012, Seventh Edition, Davos, World Economic Forum.
Hansen, K., Braungart, M., and Mulhall, D., “Resource Repletion”, The Springer Encyclopedia of Sustainability Science and Technology, Meyers, Robert A. (ed.), July 2012
Hunt, A. J., ed., Element Recovery and Sustainability, RSC Green Chemistry Series, Cambridge, 2013.
Lee, B., et al. Resources Futures. A Chatham House Report, London, 2012.
McDonough, W, Braungart, M. Cradle to Cradle: Remaking the Way We Make Things, New York: North Point Press, 2002.
McDonough, W, Braungart, M., Clinton, W., The Upcycle: Beyond Sustainability—Designing for Abundance, North Point Press, 2013.
Parsons Brinckerhoff: Accelerating the uptake of CCS: Industrial use of captured carbon dioxide, 2011.
Sharing Economy Position Paper, World Economic Forum’s Young Global Leaders Sharing Economy Working Group, 2013.
Stahel, W., “Service, Performance or Goods,” Circular Economy Network, uploaded 1 June 2012 (http://de. slideshare.net/CircularEconomy/service-performance-orgoods- by-walter-stahel).
Towards the Circular Economy 1: Economic and business rationale for an accelerated transition; January 2012 Ellen MacArthur Foundation.
Towards the Circular Economy 2: Opportunities for the consumer goods sector; January 2013 Ellen MacArthur Foundation.
Urban world and the rise of the consuming class; June 2012, McKinsey Global Institute.
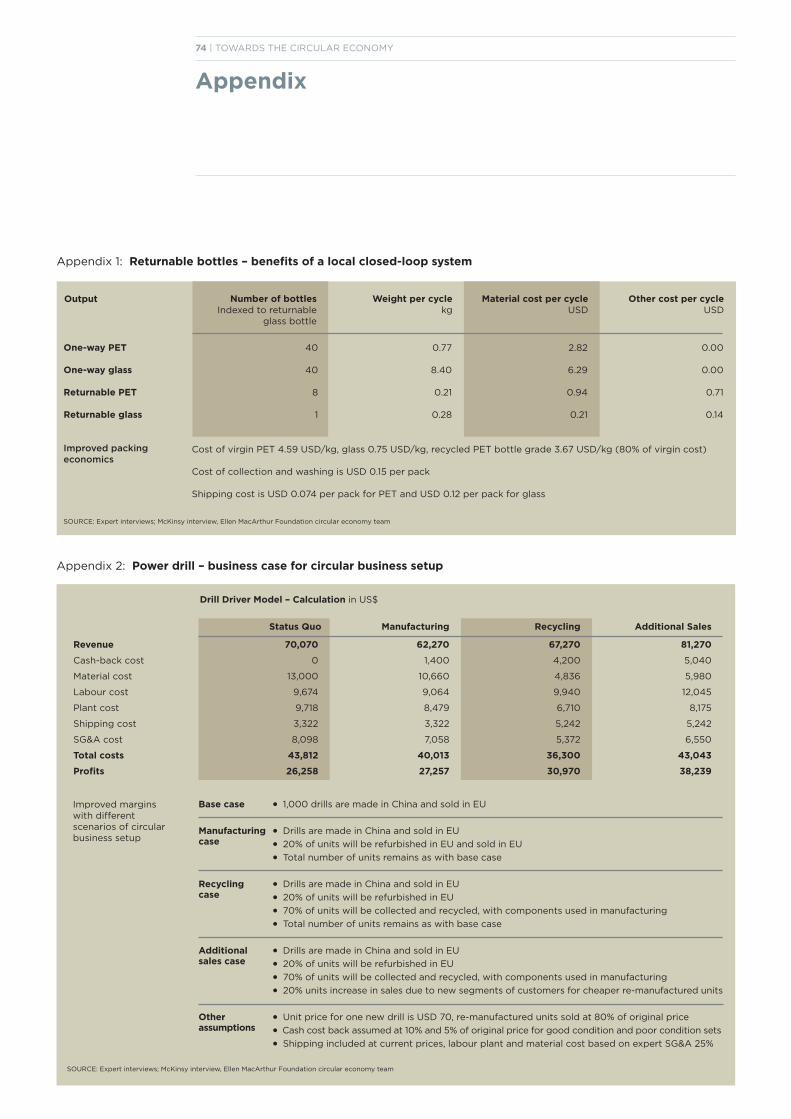
74 | TOWARDS THE CIRCULAR ECONOMY
Appendix
Appendix 1: Returnable bottles – benefits of a local closed-loop system
Output Number of bottles Indexed to returnable
glass bottle
Weight per cycle kg
Material cost per cycle USD
Other cost per cycle USD
One-way PET
One-way glass
Returnable PET
Returnable glass
Improved packing economics
40
40
8
1
0.77
8.40
0.21
0.28
2.82
6.29
0.94
0.21
0.00
0.00
0.71
0.14
Cost of virgin PET 4.59 USD/kg, glass 0.75 USD/kg, recycled PET bottle grade 3.67 USD/kg (80% of virgin cost)
Cost of collection and washing is USD 0.15 per pack
Shipping cost is USD 0.074 per pack for PET and USD 0.12 per pack for glass
SOURCE: Expert interviews; McKinsy interview, Ellen MacArthur Foundation circular economy team
Status Quo
70,070
0
13,000
9,674
9,718
3,322
8,098
43,812
26,258
Manufacturing
62,270
1,400
10,660
9,064
8,479
3,322
7,058
40,013
27,257
Recycling
67,270
4,200
4,836
9,940
6,710
5,242
5,372
36,300
30,970
Additional Sales
81,270
5,040
5,980
12,045
8,175
5,242
6,550
43,043
38,239
Appendix 2: Power drill – business case for circular business setup
Revenue
Cash-back cost
Material cost
Labour cost
Plant cost
Shipping cost
SG&A cost
Total costs
Profits
Improved margins with different scenarios of circular business setup
Base case • 1,000 drills are made in China and sold in EU
Manufacturing • Drills are made in China and sold in EUcase • 20% of units will be refurbished in EU and sold in EU
• Total number of units remains as with base case
Recycling • Drills are made in China and sold in EUcase • 20% of units will be refurbished in EU
• 70% of units will be collected and recycled, with components used in manufacturing
• Total number of units remains as with base case
Additional • Drills are made in China and sold in EUsales case • 20% of units will be refurbished in EU
• 70% of units will be collected and recycled, with components used in manufacturing
• 20% units increase in sales due to new segments of customers for cheaper re-manufactured units
Other • Unit price for one new drill is USD 70, re-manufactured units sold at 80% of original priceassumptions • Cash cost back assumed at 10% and 5% of original price for good condition and poor condition sets
• Shipping included at current prices, labour plant and material cost based on expert SG&A 25%
SOURCE: Expert interviews; McKinsy interview, Ellen MacArthur Foundation circular economy team
Drill Driver Model – Calculation in US$
TOWARDS THE CIRCULAR ECONOMY | 75
List of figures
1 Sharp price increases in commodities since 2000 have erased all the real price declines
of the 20th century
2 The circular economy—an industrial system that is restorative by design
3 Sources of value creation for the circular economy
4 A circular economy would not just ‘buy time’—it would reduce the amount of material
consumed to a lower set point
5 Circularity in manufacturing could yield net materials cost savings of up to
US$ 630 billion p.a. in the EU alone
6 Circularity in relevant FMCG sectors could yield net materials cost savings of
US$ 700 billion p.a. globally
7 Revamping industry, reducing materials bottlenecks and creating tertiary sector
opportunities would benefit labour, capital and innovation
8 The price went up for most components of the 14.4V drill drive between 2010 and 2011
9 A potential consumption time bomb will lead to inevitable resource constraints
10 Supplies of key resources are limited, while recycling rates for many remain low
11 Replenishing reserves is increasingly difficult and expensive
12 The evolving risk landscape—resources-related risks are among the most urgent
13 Simplified bill of materials (BOM) explosion: Power drill
14 Archetypes of supply chains and loops
15 The returnable glass bottle system is an inherently circular business with attractive economics
16 Excess capacity in containers returning from the US or EU to China is reflected in lower freight rates
17 New polymers continue to emerge, mostly driven by new combinations of old monomers
18 Increases in product and materials complexity lead to significant materials losses
19 Metals can easily be distinguished by density and other physical properties, while polymers cannot
20 Global PET flow—a large amount of PET collected from bottles is used in other applications
21 Reverse logistics should be as sophisticated as forward logistics—power drill example
22 If adopted in its entirety, a circular setup can improve margin—power drill example
23 Materials are the greatest common denominator across industries and geographies
24 Proposed materials classes with different starting points: each require a different action plan
25 Fibre flows in the pulp and paper value chain—recovered fibre is responsible for almost
50% of pulp supply for paper
26 The cost curve has significant potential for profitable use of CO2
27 Archetypes of circular setups—materials flows are the largest common denominator across
value chains
List of text boxes
Box 1 Opportunities in transitioning to a circular model
Box 2 The ‘sharing economy’ and its
implications for the circular economy
Box 3 Regional examples of accelerating the circular economy
Box 4 The evolution of PET recycling for beverage bottles
Box 5 The growth of 3D printing
76 | TOWARDS THE CIRCULAR ECONOMY
About the Ellen MacArthur Foundation
The Ellen MacArthur Foundation was established in 2010 with the aim of inspiring a generation to re-think, re-design, and build a positive future through the vision of a circular economy, and focuses on three interlinking areas to help accelerate the transition towards it.
Analysis - Providing robust evidence about the benefits of the transitionThe Foundation works to quantify the economic potential of the circular model and develop approaches for capturing this value. Working together with its Knowledge Partner, McKinsey & Company, the Foundation has created a series of economic reports highlighting the rationale for an accelerated transition towards the circular economy. The Foundation believes the circular economy is an evolving framework and continues to widen its understanding by working with a network of international experts including key circular economy thinkers and leading academics. These external experts feed into the key programmes that we run as well as contributing to our growing body of reports, resources, case studies and publications.
Business - Catalysing circular innovation across the economySince its launch in September 2010, the Foundation has placed an emphasis on the real-world relevance of its activities. The Foundation understands that business innovation sits at the heart of any transition to the circular economy. The Foundation works with its Global Partners (Cisco, Philips, Renault and Kingfisher) to address major challenges in accelerating the transition to the circular economy. In February 2013, with the support of its Global Partners, the Foundation created the world’s first dedicated circular economy innovation programme. The Circular Economy 100 comprises a group of industry leading corporations, emerging innovators (SMEs) and regions. The programme provides a unique forum for businesses to build circular capabilities, address common barriers to progress and pilot circular practices in a collaborative environment.
Education - Inspiring a generation to re-think the futureInspiring and enabling learners to apply contemporary science (systems thinking) to the challenge of building a circular economy and reflecting this opportunity to their lives, skills and futures. By leveraging the power of online learning to connect people and break down educational barriers across the world, the Foundation is creating a global teaching and learning platform built around the circular economy framework. With an emphasis on online learning we aim to provide cutting edge insight and content to support circular economy education. This work runs alongside a Pioneer University Network and Fellowship Programme, focusing on fostering academic research and teaching with partners in Europe, the US, India, China and South America.