Embed Size (px)
Citation preview
1
The state of sustainable development in 2020
in light of indicators and comparative studies
we want by 2050 The Finland
Towards
OF SUSTAINABLEDEVELOPMENT
STAT E
2
means human wellbeing within the Earth’s carrying capacity
The safe and just space for humanity
SOCIAL FOUNDATION
Inclusive and sustainable economic development
climate change
income
voice
food
resilience
social equity
gender equality
health
jobs
education
energywater
freshwater use
nitrogen and
phosphorus cycles
ocea
n
acid
ifica
tion
chemical
pollutionatmospheric
aerosol loading
ozone depletion
bio
div
ersi
ty lo
ss
land use
change ENVIRONMENTAL CEILING
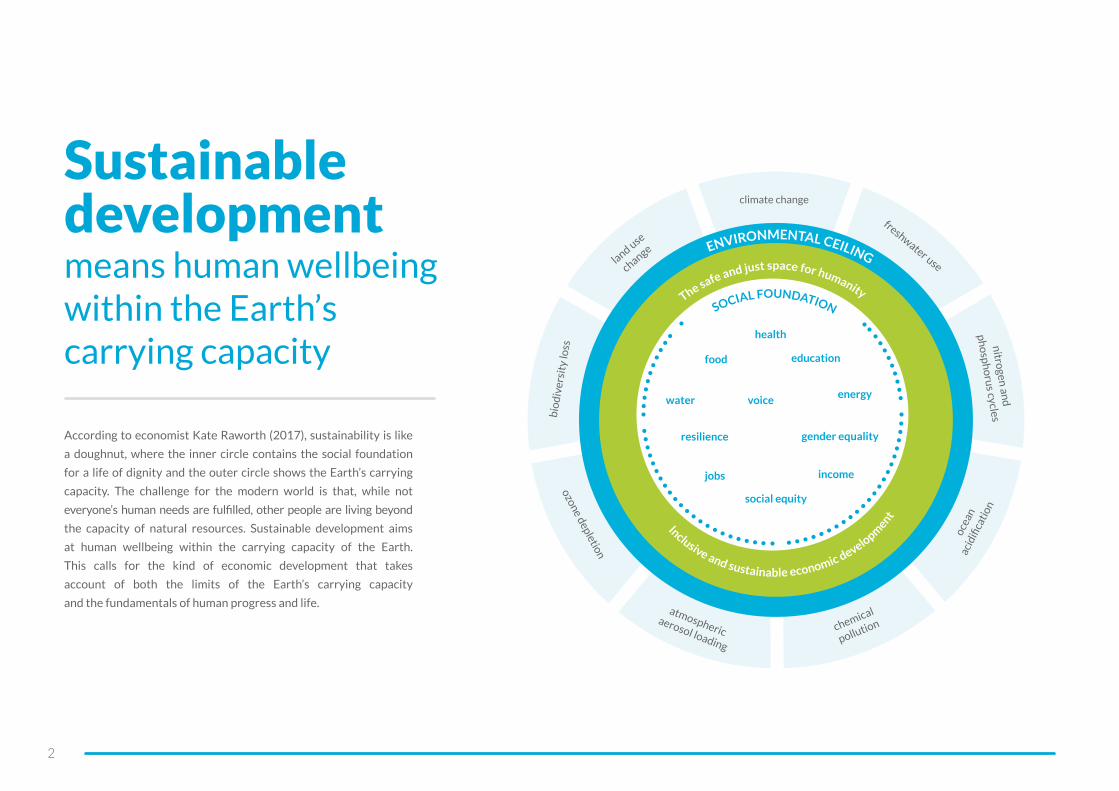
Sustainable development
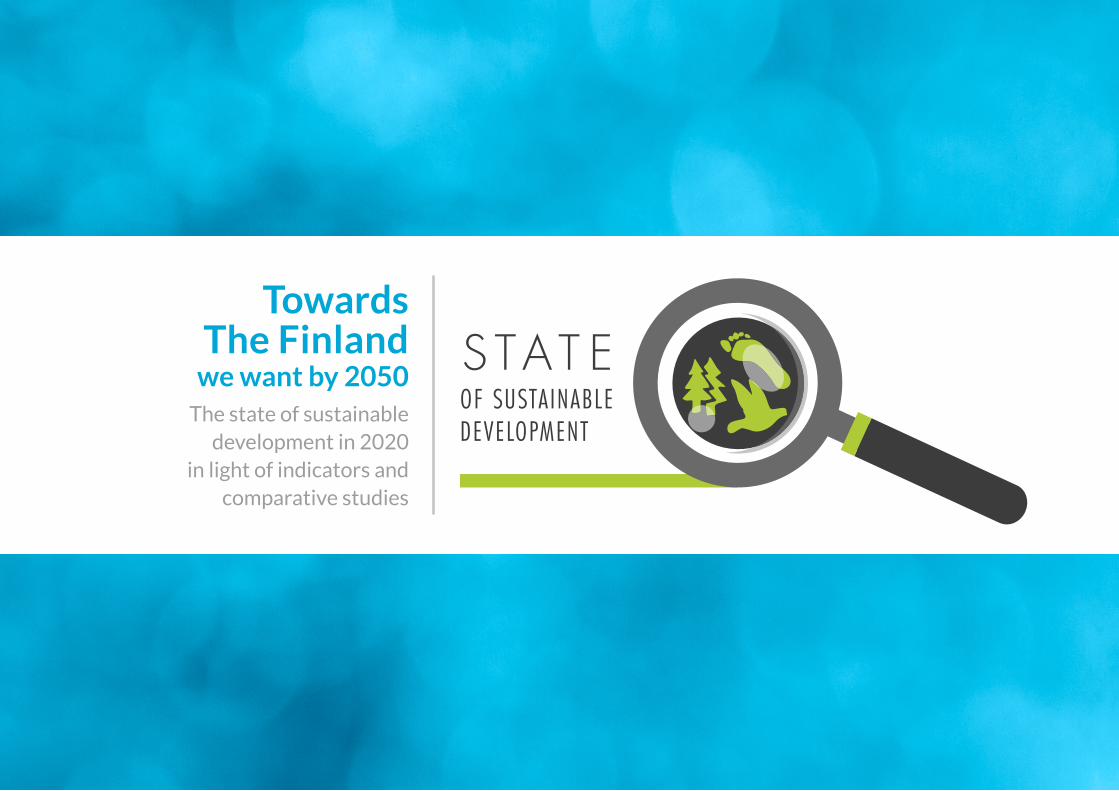
According to economist Kate Raworth (2017), sustainability is like
a doughnut, where the inner circle contains the social foundation
for a life of dignity and the outer circle shows the Earth’s carrying
capacity. The challenge for the modern world is that, while not
everyone’s human needs are fulfilled, other people are living beyond
the capacity of natural resources. Sustainable development aims
at human wellbeing within the carrying capacity of the Earth.
This calls for the kind of economic development that takes
account of both the limits of the Earth’s carrying capacity
and the fundamentals of human progress and life.
3
Contents
How Finland is implementing the goals of the 2030 Agenda for Sustainable Development 4
Summary 6
1 State of nature and the environment 8
2 Resource-wise economy and carbon-neutral society 10
3 Consumption and public procurement 12
4 Housing and communities 14
5 Prerequisites for health 16
6 Social inequality 18
7 Social exclusion and inclusivity 20
8 Working life, quality and change 22
9 Education and development of competence 24
10 Global responsibility and policy coherence 26
Finnish Expert Panel’s Six Paths Towards Sustainability 28
The view of the Citizen’s Panel on the state of sustainable development in Finland 30
Acknowledgements and sources 31
4
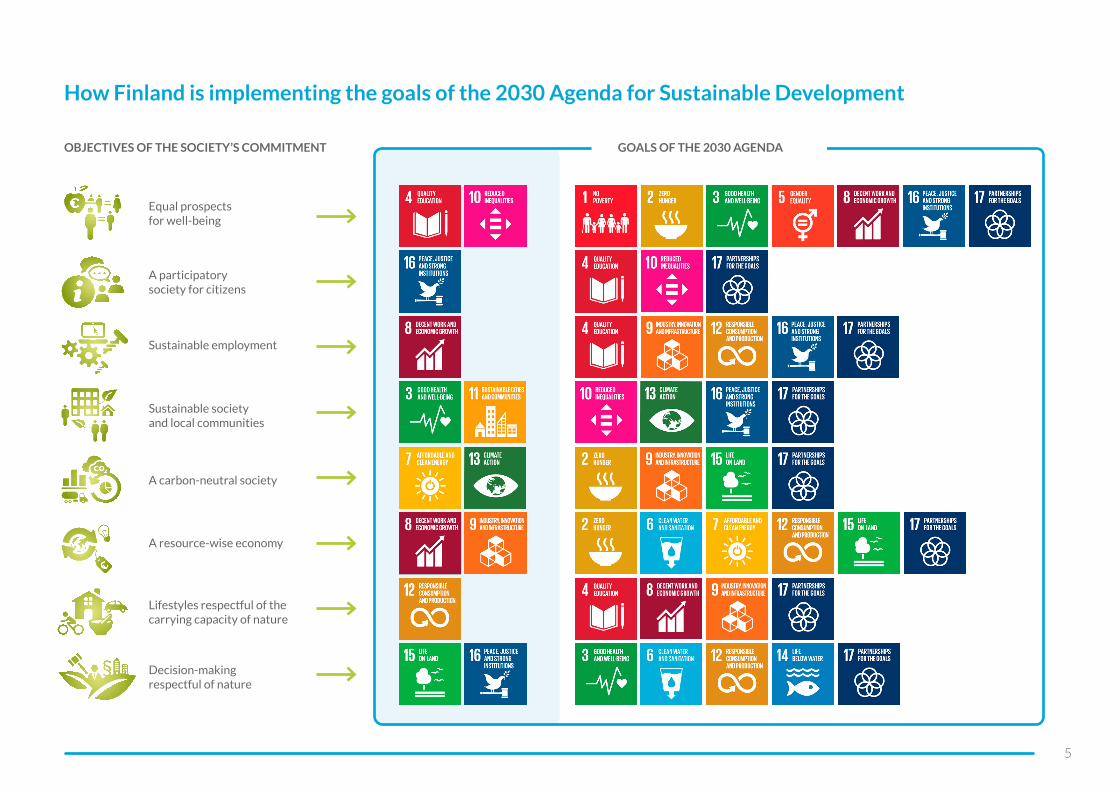
Finland is implementing this global Agenda for Sustainable Devel-
opment by means such as the national Society’s Commitment
to Sustainable Development. The 8 objectives of the Society’s
Commitment carry out the 17 goals of the 2030 Agenda.
Finland wants to make decisions that support the achievement
of the global goals and national objectives for sustainable devel-
opment. A monitoring system has been created to support deci-
sion-making processes, containing expert analyses on the state
of sustainable development in Finland. These analyses – i.e. inter-
pretations – have been divided into ten equally important themes,
functioning as monitoring baskets, which are presented in more
detail on the following pages. This publication is largely based on
information from these baskets.
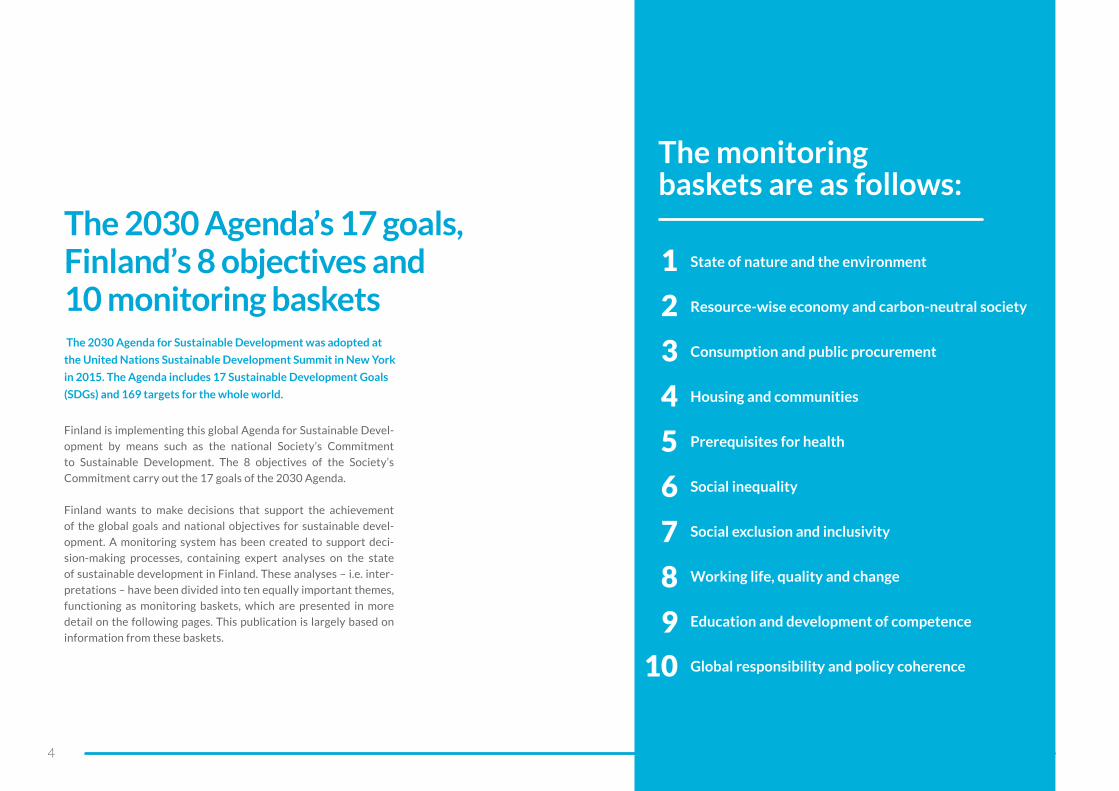
The 2030 Agenda’s 17 goals, Finland’s 8 objectives and 10 monitoring baskets The 2030 Agenda for Sustainable Development was adopted at
the United Nations Sustainable Development Summit in New York
in 2015. The Agenda includes 17 Sustainable Development Goals
(SDGs) and 169 targets for the whole world.
State of nature and the environment
Resource-wise economy and carbon-neutral society
Consumption and public procurement
Housing and communities
Prerequisites for health
Social inequality
Social exclusion and inclusivity
Working life, quality and change
Education and development of competence
Global responsibility and policy coherence
The monitoring baskets are as follows:
1
2
3
4
5
6
7
8
9
10
5
Equal prospects for well-being
A participatory society for citizens
Sustainable employment
Sustainable society and local communities
A carbon-neutral society
A resource-wise economy
Lifestyles respectful of the carrying capacity of nature
Decision-making respectful of nature
OBJECTIVES OF THE SOCIETY’S COMMITMENT
How Finland is implementing the goals of the 2030 Agenda for Sustainable Development
GOALS OF THE 2030 AGENDA
6
Studies have identified high-quality education and the resulting
competence, as well as the overall stability of social systems, as
Finland’s key strengths in sustainable development. Its key chal-
lenges include the fight against climate change and excessive con-
sumption of natural resources.
This report outlines the state of sustainable development in Fin-
land in 2020. The report is largely based on information from the
national indicators for sustainable development and it is struc-
tured in keeping with the ten baskets of the monitoring system.
1 State of nature and the environmentThe state of the environment has been improving as a result of
successful efforts to cut down emissions from major individual
sources of pollution. Air quality in Finland is good by internation-
al standards. However, the loss of biodiversity continues. While
emissions into waters have decreased, the Baltic Sea is still suffer-
ing from eutrophication.
Summary2 Resource-wise economy and carbon-neutral societyFinland is among the top countries in the European Union in the use
of renewable energy. Nevertheless, Finland’s greenhouse gas emis-
sions slightly increased from the previous year. Most of Finland’s
greenhouse gas emissions originate from the energy sector and
traffic. Forests form Finland’s most important carbon sinks.
3 Consumption and public procurementAn average Finn’s carbon footprint is about 10.3 tonnes per year.
The carbon footprint of housing has decreased while the footprints
of food products, other goods and services and transport have
remained unchanged or have increased. A road map for fossil-free
transport is being prepared to achieve carbon-free transport by
2045. Between EUR 30 and 35 billion is spent on public procure-
ment every year, but there is no quantitative follow-up data on the
impacts of procurement.
4 Housing and communitiesHousing and communities are changing as a result of the ageing
population, urbanisation and climate change. Most construction
activities in Finland are focused on larger cities, which means that
their population density is increasing. This will further improve the
conditions for well-functioning public transport. Access to services
is declining in smaller urban centres and rural areas, but new service
models are developed. Households in rented housing are burdened
with high housing costs. An increasing proportion of older people
live in their own homes. Living at home is supported by home ser-
vices and improving accessibility of homes.
5 Prerequisites for healthFinns’ perceived quality of life has improved. Perceived wellbeing is
linked to socio-economic status so that those who are better off also
tend to enjoy a higher quality of life. Finns living in the south and west
are healthier than their peers in the east and north. Intimate part-
ner violence is a threat to women in particular. Finland is the second
most violent country for women within the European Union.
6 Social inequalityThe standard of living and quality of life have improved for a large
proportion of Finns over the last few decades. The growth in in-
come disparities and low-income rates seems to have come to a
halt, but the differences are still high. Nevertheless, income dis-
parities in Finland are among the lowest in the European Union.
Differences in wealth have increased during this millennium. The
number of recipients of basic social assistance has decreased
from the previous year.
Finland and other Nordic countries have performed well in international studies on sustainable development. Nevertheless, there is still some distance to cover to achieve the jointly agreed goals. Finland is committed to achieving the goals of the 2030 Agenda by 2030. Finland’s national strategy, i.e., the national Society’s Commitment to Sustainable Development defines the Finland we want by 2050.
90%of Finnsaged 75 or overlive at home.
Over
7.2%of the population receives basic social assistance.
0
2
4
6
8
10
12
2010 20192000
2000
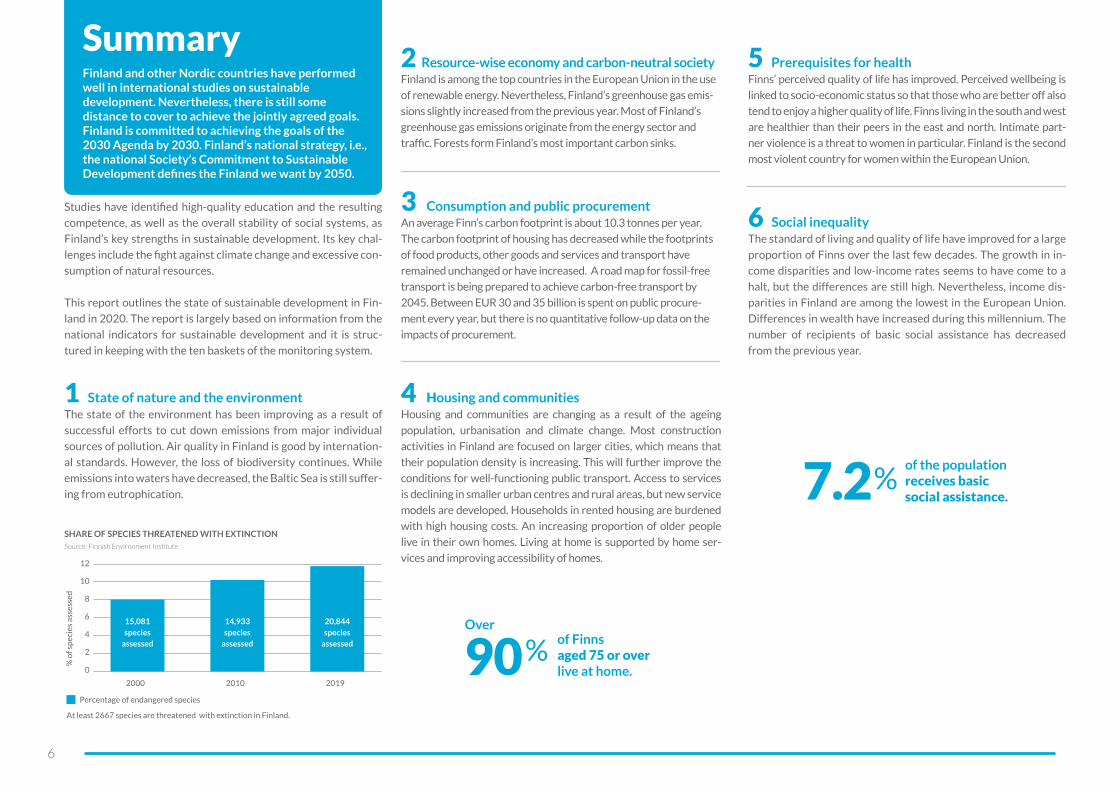
SHARE OF SPECIES THREATENED WITH EXTINCTION
Percentage of endangered species
Source: Finnish Environment Institute
At least 2667 species are threatened with extinction in Finland.
% o
f sp
ecie
s as
sess
ed
15,081 species
assessed
14,933species
assessed
20,844species
assessed
7
7 Social exclusion and inclusivityThe number of young people not in employment, education or training
has decreased slightly in Finland in recent years. One out of ten school-
children feels lonely. The proportion of young people with no close
friends, boys in particular, has declined over the last ten years. Finland
is performing well in rankings on corruption and press freedom.
8 Working life, quality and changeThe world of work is changing rapidly. The employment rate has
improved, but the labour productivity growth is slowing down.
Fewer and fewer working people earn a low income, however,
the share of the underemployed workers of all in employment has
increased. Although by international standards there is a sustain-
able basis to many aspects of the Finnish working life, inequalities
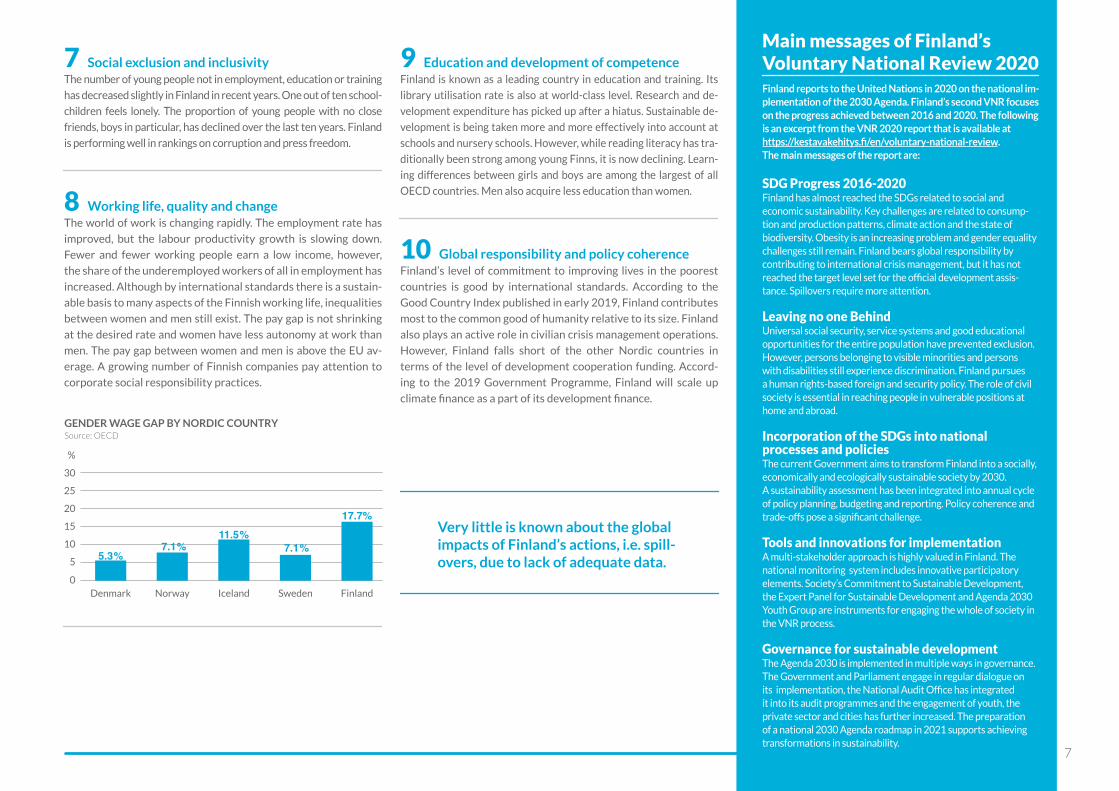
between women and men still exist. The pay gap is not shrinking
at the desired rate and women have less autonomy at work than
men. The pay gap between women and men is above the EU av-
erage. A growing number of Finnish companies pay attention to
corporate social responsibility practices.
9 Education and development of competenceFinland is known as a leading country in education and training. Its
library utilisation rate is also at world-class level. Research and de-
velopment expenditure has picked up after a hiatus. Sustainable de-
velopment is being taken more and more effectively into account at
schools and nursery schools. However, while reading literacy has tra-
ditionally been strong among young Finns, it is now declining. Learn-
ing differences between girls and boys are among the largest of all
OECD countries. Men also acquire less education than women.
10 Global responsibility and policy coherenceFinland’s level of commitment to improving lives in the poorest
countries is good by international standards. According to the
Good Country Index published in early 2019, Finland contributes
most to the common good of humanity relative to its size. Finland
also plays an active role in civilian crisis management operations.
However, Finland falls short of the other Nordic countries in
terms of the level of development cooperation funding. Accord-
ing to the 2019 Government Programme, Finland will scale up
climate finance as a part of its development finance.
Main messages of Finland’s Voluntary National Review 2020Finland reports to the United Nations in 2020 on the national im-plementation of the 2030 Agenda. Finland’s second VNR focuses on the progress achieved between 2016 and 2020. The following is an excerpt from the VNR 2020 report that is available athttps://kestavakehitys.fi/en/voluntary-national-review.The main messages of the report are:
SDG Progress 2016-2020Finland has almost reached the SDGs related to social and economic sustainability. Key challenges are related to consump-tion and production patterns, climate action and the state of biodiversity. Obesity is an increasing problem and gender equality challenges still remain. Finland bears global responsibility by contributing to international crisis management, but it has not reached the target level set for the official development assis-tance. Spillovers require more attention.
Leaving no one BehindUniversal social security, service systems and good educational opportunities for the entire population have prevented exclusion. However, persons belonging to visible minorities and persons with disabilities still experience discrimination. Finland pursues a human rights-based foreign and security policy. The role of civil society is essential in reaching people in vulnerable positions at home and abroad.
Incorporation of the SDGs into national processes and policiesThe current Government aims to transform Finland into a socially, economically and ecologically sustainable society by 2030.A sustainability assessment has been integrated into annual cycle of policy planning, budgeting and reporting. Policy coherence and trade-offs pose a significant challenge.
Tools and innovations for implementationA multi-stakeholder approach is highly valued in Finland. The national monitoring system includes innovative participatory elements. Society’s Commitment to Sustainable Development, the Expert Panel for Sustainable Development and Agenda 2030 Youth Group are instruments for engaging the whole of society in the VNR process.
Governance for sustainable developmentThe Agenda 2030 is implemented in multiple ways in governance. The Government and Parliament engage in regular dialogue on its implementation, the National Audit Office has integrated it into its audit programmes and the engagement of youth, the private sector and cities has further increased. The preparation of a national 2030 Agenda roadmap in 2021 supports achieving transformations in sustainability.
Very little is known about the global impacts of Finland’s actions, i.e. spill-overs, due to lack of adequate data.
0
5
10
15
20
25
30
%
Denmark SwedenIcelandNorway Finland
GENDER WAGE GAP BY NORDIC COUNTRYSource: OECD
5.3 %7.1 %
11.5 %7.1 %
17.7%
8
The 2018 report by the Intergovernmental Science-Policy Plat-
form on Biodiversity and Ecosystem Services (IPBES) suggests
that global land and habitat degradation has reached a critical
level, affecting 3.2 billion people. The report estimates that, by
2050, habitat degradation will be the single most significant rea-
son for species extinction. Combined with climate change, it will
force an estimated 50–700 million people to migrate from their
home territories. The report indicates that less than approxi-
mately one quarter of the Earth’s land surface remains in its natu-
ral condition, free from substantial human impacts. IPBES experts
estimate that, by 2050, the figure will have dropped to less than
10%, which will also include deserts, mountainous areas, tundra
and polar areas unsuitable for human settlement.
According to the WWF Living Planet 2018 report, the size of the
entire Earth’s vertebrate wildlife populations declined by an aver-
age of 60% between 1970 and 2014. Finland was one of the first
countries to sign the key convention aiming to safeguard biodi-
versity, i.e. the Convention on Biological Diversity (CBD). The goal
of the Convention is, by 2050, to safeguard biodiversity and en-
sure that natural resources are used so as to maintain the viability
of ecosystems while not exceeding the Earth’s carrying capacity.
The actions taken by Finns have a bearing on the state of the en-
vironment the world over. A growing proportion of the environ-
mental impacts caused by Finns is generated outside the country
through international trade, transport and travel. Alongside our
own actions, the state of the Finnish environment is affected by
factors such as global climate change, the potential spread of alien
species into its land and waters, and long-range transport of air pol-
lution. The use of fossil fuels is one of the leading causes of climate
change. The means of combating climate change include interna-
tional cooperation and changing social structures and approaches.
Economic steering is a key instrument in reducing the environ-
mental damage. In Finland, environmentally harmful subsidies are
primarily granted to the energy sector, the transport sector and
the agricultural sector. Their total sum has been estimated to be
around EUR 3.5 billion. The majority of these subsidies are re-
duced tax rates and other indirect subsidies aimed at, for example,
maintaining employment in a particular sector or region. In princi-
ple, the objective of ecologically sustainable development is for no
environmentally harmful subsidies to be granted at all. However,
the definition of environmentally harmful subsidies is difficult as
subsidies have many different direct and indirect impacts.
Continuing loss of biodiversity in FinlandOne of the indicators used to measure the status of ecosystems is
biodiversity. According to a comprehensive national assessment,
11.9% of Finnish species are threatened. Besides climate change,
our native species are threatened by alien species. The rate at which
the species in forests and rural areas are becoming threatened has
slightly decreased over the last few decades, whereas more and
more species found in mires, aquatic habitats, fields and fell habitats
have become threatened. The biggest individual reasons for them
being threatened are a decline in biodiversity, the fragmentation
of nature and the increasing intensiveness of agriculture. Further-
more, changes in forests are the primary cause for 733 species
becoming threatened. The majority of threatened species live in
Southern Finland. In the last decade, the situation of 461 species
has deteriorated and that of 263 species has improved. The biggest
change in a negative direction has taken place on the shores.
According to a study coordinated by the Finnish Environment Insti-
tute (SYKE), 48% of just under 400 Finnish habitat types were es-
timated to be threatened throughout the country. The proportions
of threatened habitat types in Southern and Northern Finland were
59% and 32%, respectively. Those determined to be critically en-
dangered included meadows, grasslands, wooded pastures and rich
fens. The habitat groups with the highest numbers of endangered
and vulnerable habitat types included mires, forests and shores of
the Baltic Sea. The study assessed that the primary causes of habitat
types becoming threatened include forest management activities,
drainage, clearing of areas for arable land, construction, and eutro-
phication of waters.
State of nature and the environment
1Ecological sustainability is the foundation of sustainable development. In Finland, the focus of environmental protection is shifting
from reducing emissions to preventing them, especially in terms of promoting the circular economy. The state of the Finnish
environment has been improving as a result of successful efforts to cut down emissions from major individual sources of pollution.
A major concern in the state of nature is the continuing loss of biodiversity, which has not been stopped. Environmentally harmful
subsidies have various direct and indirect impacts.
9
Forests are exploited in Finland to a large extent, which is reflected in
their species composition. The amount of dead and decaying wood is re-
garded as an indicator of the diversity of forest species. Decaying wood
increases the biological diversity of a forest because, as it decomposes
on the ground, it provides nourishment and nesting places for thousands
of different organisms, such as fungi, insects and polypores. Most Finnish
forests are production forests where trees are cultivated and harvested
for useful purposes. As a result, the amount of decaying wood in for-
ests has decreased and many organisms dependent on it have become
threatened. There are efforts to increase the amount of decaying wood
in production forests by leaving some trees in logged forests to decay
naturally. During the 21st century, the amount of deadwood in forests
has increased in Southern Finland but decreased in Northern Finland.
Moreover, there are fewer and fewer farmland areas of high nature
value. The numbers of small-scale livestock farms, rough grazing areas
and permanent pastures have declined, particularly in Southern Finland.
Finland is committed to halting biodiversity loss by 2020. If the current
trend continues, achieving this objective is unlikely.
The state of the Archipelago Sea and the Gulf of Finland is worrying, but lakes and rivers are generally in good conditionEmissions into water bodies have been clearly reduced in Finland
over the past few decades as a result of new pollution abatement
technologies and prohibiting the use of the most harmful sub-
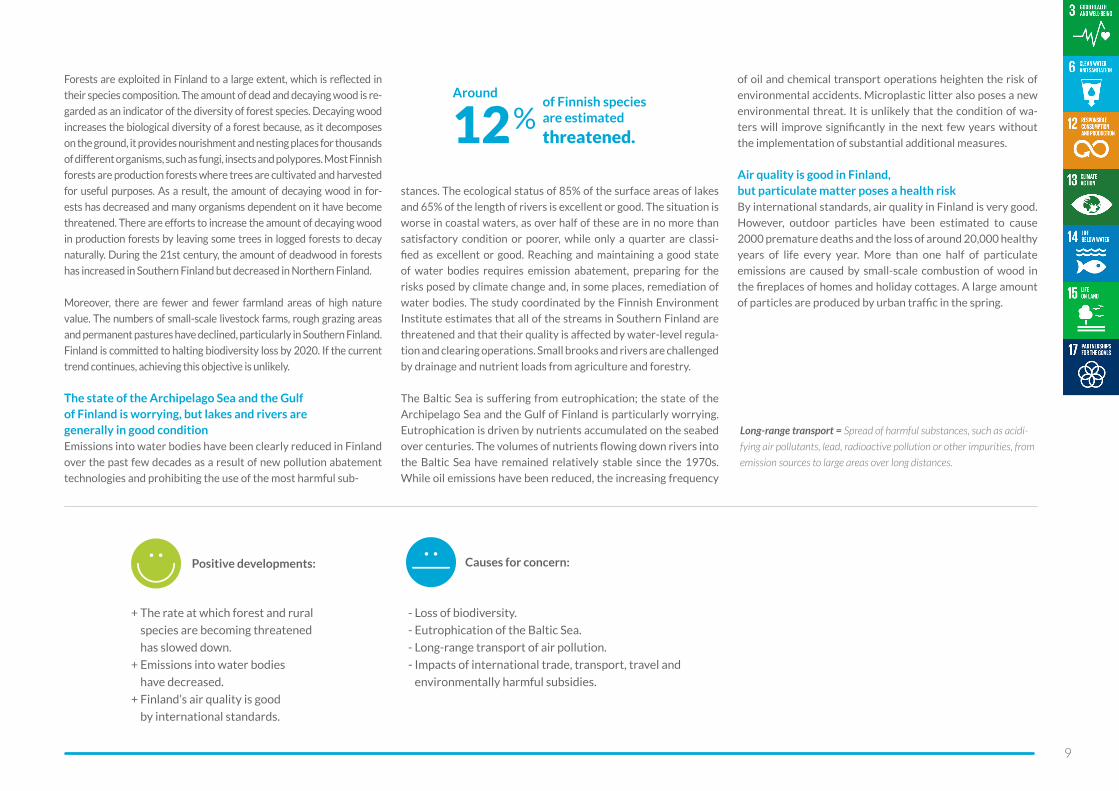
Long-range transport = Spread of harmful substances, such as acidi-
fying air pollutants, lead, radioactive pollution or other impurities, from
emission sources to large areas over long distances.
+ The rate at which forest and rural
species are becoming threatened
has slowed down.
+ Emissions into water bodies
have decreased.
+ Finland’s air quality is good
by international standards.
- Loss of biodiversity.
- Eutrophication of the Baltic Sea.
- Long-range transport of air pollution.
- Impacts of international trade, transport, travel and
environmentally harmful subsidies.
Causes for concern:Positive developments:
stances. The ecological status of 85% of the surface areas of lakes
and 65% of the length of rivers is excellent or good. The situation is
worse in coastal waters, as over half of these are in no more than
satisfactory condition or poorer, while only a quarter are classi-
fied as excellent or good. Reaching and maintaining a good state
of water bodies requires emission abatement, preparing for the
risks posed by climate change and, in some places, remediation of
water bodies. The study coordinated by the Finnish Environment
Institute estimates that all of the streams in Southern Finland are
threatened and that their quality is affected by water-level regula-
tion and clearing operations. Small brooks and rivers are challenged
by drainage and nutrient loads from agriculture and forestry.
The Baltic Sea is suffering from eutrophication; the state of the
Archipelago Sea and the Gulf of Finland is particularly worrying.
Eutrophication is driven by nutrients accumulated on the seabed
over centuries. The volumes of nutrients flowing down rivers into
the Baltic Sea have remained relatively stable since the 1970s.
While oil emissions have been reduced, the increasing frequency
of oil and chemical transport operations heighten the risk of
environmental accidents. Microplastic litter also poses a new
environmental threat. It is unlikely that the condition of wa-
ters will improve significantly in the next few years without
the implementation of substantial additional measures.
Air quality is good in Finland, but particulate matter poses a health riskBy international standards, air quality in Finland is very good.
However, outdoor particles have been estimated to cause
2000 premature deaths and the loss of around 20,000 healthy
years of life every year. More than one half of particulate
emissions are caused by small-scale combustion of wood in
the fireplaces of homes and holiday cottages. A large amount
of particles are produced by urban traffic in the spring.
12%of Finnish speciesare estimated
threatened.
Around
10
Resource-wise economy and carbon-neutral society
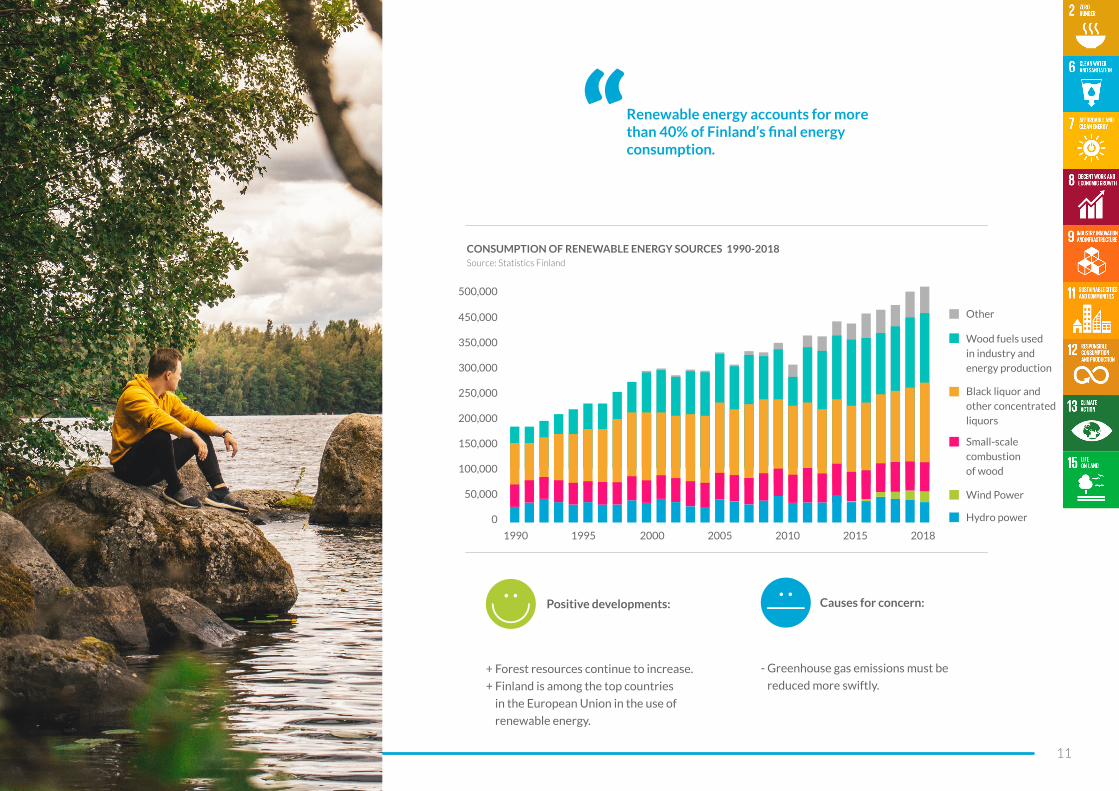
For a long time now, Finland has aimed to increase the proportion
of renewable energy while cutting that of fossil energy sources.
Finland’s renewable sources of energy are hydro and wind power,
solar energy, geothermal heat, biogas, recovered and waste fuels,
wood-based fuels as well as other biofuels derived from vegetable
oils or animal fats. Finland’s cold climate, long distances and fairly en-
ergy-intensive industry have a bearing on energy consumption. The
final consumption of renewable energy sources increased by 2% in
2018, thus rising to a new record level. These accounted for just over
40% of all energy end use. The National Energy and Climate Strategy
estimates that renewable energy will account for 47% of final energy
consumption in 2030, while the target is 50%.
Most of Finland’s greenhouse gas emissions originate from the energy sector and trafficIn 2018, the total amount of Finland’s greenhouse gas emissions
was 56.5 million tonnes in carbon dioxide equivalents. Emissions
increased by 2% from the previous year. Finland has cut its emis-
sions by approximately 21% compared to the 1990s. Domestic
traffic accounts for about one fifth of total greenhouse gas emis-
sions in Finland.
In 2018, 75% of total emissions were generated in the energy
sector through fuel combustion and evaporative emissions.
According to rapid advance data, emissions from the energy
sector amounted to 42.4 million tonnes of CO2 equivalent and
increased by 3% compared to 2017. An increase in the consump-
tion of peat and natural gas in the energy sector accounted for
most of the increase in its emissions. Industrial processes and
product use accounted for 10% of total emissions, while the
figures for agriculture and waste treatment stood at 11% and
3%, respectively. Emissions from agriculture have decreased by
almost 16% since 1990. This reduction is mostly due to the de-
clining use of industrial fertilisers, but the structural change in
agriculture has also played a role, as it has resulted in fewer and
larger farms.
Forests form Finland’s most significant carbon sinksForests constitute one of Finland’s key natural resources and its
most significant carbon sinks. Carbon sequestration is strongly
contingent on a tree’s growing phase and growth rate, which is
slower in the north of Finland than in the south. The increment
of growing stock has continued at a good level ever since the
1970s. This is due to improved forest management, the age class
structures of forests and global warming. The annual increment
amounts to 108 million cubic metres. This is nearly double the
growth from 50 years ago.
Although the use of wood has increased among Finns, over one
fifth of the growth will remain in the forest to increase timber
resources and carbon sequestration. In 2018, the volume of
trees in our forests increased by about 14 million cubic metres.
Retaining forest biodiversity will also require active and sustain-
able forest management measures as well as forest conserva-
tion and protection efforts in the future. Forests are increasing-
ly vulnerable to weather and climate risks. Preventing risks of
tree damage and disease as well as growing forests with multiple
species promote stock growth.
The Finnish Ministry of Agriculture and Forestry and the Nat-
ural Resources Institute Finland (Luke) has submitted to the
European Union an estimate of the carbon sink levels of Finnish
forests for 2021–2025. The estimate submitted in 2019
was -27.64 million tonnes in carbon dioxide equivalents per
year, with harvested wood products included in the calculation.
If harvested food products are excluded, the estimated level is
-21.16 million tonnes per year.
Carbon neutral = Carbon neutral refers to a situation
where an activity has a zero carbon footprint.
Carbon dioxide equivalent = Quantity used in climate science,
describing the climate impact of greenhouse gases from human activity.
Carbon sink = A carbon sink absorbs and stores carbon.
Examples of natural carbon sinks include seas, mires, forests and plants.
2
The resource wisdom of an economy stems from efficient production and energy-efficient solutions. Finland is among the top coun-
tries in the European Union in the use of renewable energy. In 2018, the total amount of Finland’s greenhouse gas emissions was
56.5 million tonnes in carbon dioxide equivalents. Emissions increased by 2% from the previous year.
11
Renewable energy accounts for more than 40% of Finland’s final energy consumption.“
- Greenhouse gas emissions must be
reduced more swiftly.
Causes for concern:Positive developments:
+ Forest resources continue to increase.
+ Finland is among the top countries
in the European Union in the use of
renewable energy.
CONSUMPTION OF RENEWABLE ENERGY SOURCES 1990-2018
1990 1995 2000 2005 2010 2015 2018
500,000
350,000
300,000
250,000
200,000
150,000
100,000
50,000
0
450,000
Source: Statistics Finland
Black liquor and other concentrated liquors
Wood fuels used in industry and energy production
Wind Power
Hydro power
Other
Small-scale combustion of wood
12
Consumption and public procurement
The carbon footprint of an average Finn amounts to a total of
10.3% tonnes per year. It has varied from 10 tonnes to more than
12 tonnes in recent years. The footprint is made up of living (33%),
transport and tourism (22%), nutrition (20%), and other consump-
tion (25%), such as goods and free time. Greenhouse gas emis-
sions that are the result of household consumption expenditure
account for about 70% of all consumption-based greenhouse gas
emissions in Finland, which also include emissions from invest-
ments and public consumption.
In 2015, the carbon footprint of public procurement was around
1.5 tonnes per capita. Municipalities accounted for about 57% of
the carbon footprint of public procurement. State procurements
accounted for just over 20%, as did those of joint municipal au-
thorities. Individuals can influence their own carbon footprint
through their consumer choices. The Prime Minister’s Office runs
a web-based Commitment2050 service (Sitoumus2050), where
individuals can calculate their own carbon footprint and make a
plan to reduce it based on the suggestions provided.
Finnish enterprises have paid attention to their carbon footprint
and today’s investors are increasingly mindful of the climate when
deciding what to include in their portfolios. It is also possible to
influence the carbon footprint through new technologies and
low-emission products and services. Furthermore, consumption
can be steered by means of energy and fuel prices, regulations
concerning construction and renovation, transport infrastruc-
ture, and transport pricing.
Everyone can make a difference on climate through food choicesThrough their food choices, individuals can make a difference
concerning global warming, environmental eutrophication, in-
creasing pollution loads and biodiversity loss. Food production
and consumption account for about one fifth of the carbon foot-
print of all consumption. Most of the climate impacts of food are
created in primary production. Animal-based products have more
adverse effects on climate than plant-based goods.
Meat consumption has been growing slightly in Finland; in recent
years, Finns have consumed about 80 kg of meat each year. Wom-
en and young people favour poultry meat over beef or pork. The
consumption of fish has declined slightly. Vegetable and fruit con-
sumption is steadily growing, but there is still some way to go to
reach the recommended daily portion of half a kilo.
Decline in CO2 emissions from cars registered for the first timeOne of the objectives of the National Energy and Climate Strategy is to
cut traffic emissions by half from 2005 levels by 2030. Domestic traffic
accounts for around one fifth of total greenhouse gas emissions in Fin-
land. As electric and gas-powered vehicles are becoming increasingly
popular in Finland, the CO2 emissions of vehicles registered for the
first time have declined. However, total emissions from road transport
have not decreased notably, as there are many old cars in traffic and
the total number of kilometers driven has also increased.
A road map for fossil-free transport is under preparation. The aim of
the road map is to set out means for halving emissions from transport
by 2030 and achieving carbon-free transport by 2045. The road map
will cover the emissions reduction commitments made in the different
fields of the transport sector.
Aiming to promote the circular economy and reduce the amount of waste destined for landfills or incineratorsThe amount of municipal waste generated annually in Finland
amounts to about 510 kg per person, while the recycling rate has
increased from about 30% to over 40%. During the 21st century,
the per capita amount of municipal waste generated in Finland
has stayed below the EU average. It is possible to increase waste
recycling by measures such as promoting ecological product
3In the autumn of 2018, the Intergovernmental Panel on Climate Change (IPCC) published a report revealing new information on the impor-
tance of limiting global warming to 1.5 degrees Celsius. Slowing down global warming requires everyone to take rapid action. Changes to
consumption volumes and priorities are key. Accordingly, Finland is paying more and more attention to the environmental impacts of both
public and private consumption. Finland is aiming for an 80% reduction in greenhouse gas emissions from 1990 levels by 2050. The Finnish
Innovation Fund Sitra estimates that all Finns need to halve their carbon footprint in order to avoid over-consumption of natural resources.
10.3tonnes
An average Finn’s
carbon footprint is
and make a commitment at
www.sitoumus2050.fi/lifestyles
Test your carbon footprint

13
design, developing producer responsibility schemes and business
models as well as encouraging people to change their consumer
habits. The European Union has revised its waste legislation in
order to move towards a circular economy. According to the new
rules for waste management and legally binding recycling targets,
the member states have to recycle 55% of their municipal waste
by 2025 and 60% by 2030.
Sustainable development is poorly considered in public procurementsMunicipal and regional authorities can contribute to the sustain-
ability of production and consumption through their procure-
ment decisions. Public procurement accounts for about 16% of
Finland’s national economy every year. If selection is made sole-
ly on the basis of price, it may ignore supply chain issues such as
work-related, human rights and environmental aspects.
The Public Procurement Act (1397/2016) was reformed in 2017,
improving the opportunities of public bodies to take responsible
production into account in their procurement processes. An esti-
mate by the Finnish Environment Institute (SYKE) indicates that
about half of Finnish municipalities are considering sustainability
goals as part of their procurement strategies or other guidance
on procurement. Based on the report, about a quarter of mu-
nicipalities had defined more detailed sustainability criteria for
their procurements, such as requiring that devices have the best
energy ratings. According to a study conducted by Finnwatch, a
non-governmental organisation focused on global corporate so-
cial responsibility, only a few Finnish municipalities include crite-
ria to guarantee social responsibility in their invitations to tender.
Carbon footprint = The climate impact of a product, activity or service, i.e.,
the amount of greenhouse gases generated during the life cycle of a product
or activity.
The influence of imports on the evolution of greenhouse gas emissions is significant. There
should be more information available on the carbon footprints of products. This would help
consumers and businesses to make choices and to advance the development process of societal
steering instruments.
- Carbon footprint and raw material requirement of public procurement and household consumption in Finland -report (SYKE 2019)
+ A road map for fossil-free transport is
being prepared.
+ The CO2 emissions of cars registered for
the first time have declined.
- Finns’ diets do not follow recommendations.
- The total amount of municipal waste has increased.
- The Finns have a relatively large per capita carbon footprint.
The overshoot day marks the date by which people have used up all the renewable natural resources that the Earth can generate. For the rest of the year, we are living on credit. The Global Footprint Network has worked out the dates on which different countries have used up their respective shares of the Earth’s natural resources for the year. In this comparison, Finland’s overshoot day for 2019 was 5 April. The average overshoot day for the entire world was not until until 29 July. In other words, Finns used up their fair share of the Earth’s natural resources well in advance. Today, the world’s population as a whole consumes the equivalent of 1.75 Earths’ natural resources.
Finns use up their fair share of the Earth’s yearly natural resources as early as in April
– Global Footprint Network, www.overshootday.org/
4
Causes for concern:Positive developments:
14
Housing and communities
A solid community structure ensures demand for public transport ser-
vices. As a result of urbanisation, population density has been growing
in recent years, particularly in large urban areas. They are therefore best
positioned to develop well-functioning public transport systems. Suffi-
cient density and inhabitant base guarantee demand for frequently op-
erating public transport services. The minimum population density that
supports organising profitable public transport is considered to be 20
inhabitants per hectare. An increasing number of Finns live in such areas.
In medium-sized and small urban areas, population density is generally
highest in the central area and its peripheral zones. In medium-sized ur-
ban areas, goal-oriented infill development helps retain public transport
services in housing estates. New transport services may also introduce
smaller-scale public transport solutions to small and medium-sized ur-
ban areas. The transportation carbon footprint of Finnish people living
in city centers is about 40% lower than that of those living in rural areas
close to cities.
Rising inequality between residential areasInequalities between residential areas have been rising at least in
the Turku, Tampere and Helsinki areas during the 21st century. Ac-
cording to research carried out by the National Institute for Health
and Welfare (THL), the poor and wealthy, as well as Finnish and for-
eign-born people, are becoming concentrated in separate areas in
Finland’s largest cities. The research indicates that this segregation
affects children the most.
Differences between regions are growing throughout the country as
new construction activities are solely focused on larger urban areas,
which, in turn, have the best opportunities to influence the devel-
opment of community structures. Correctly located and sufficient
housing production will restrain home prices and rents.
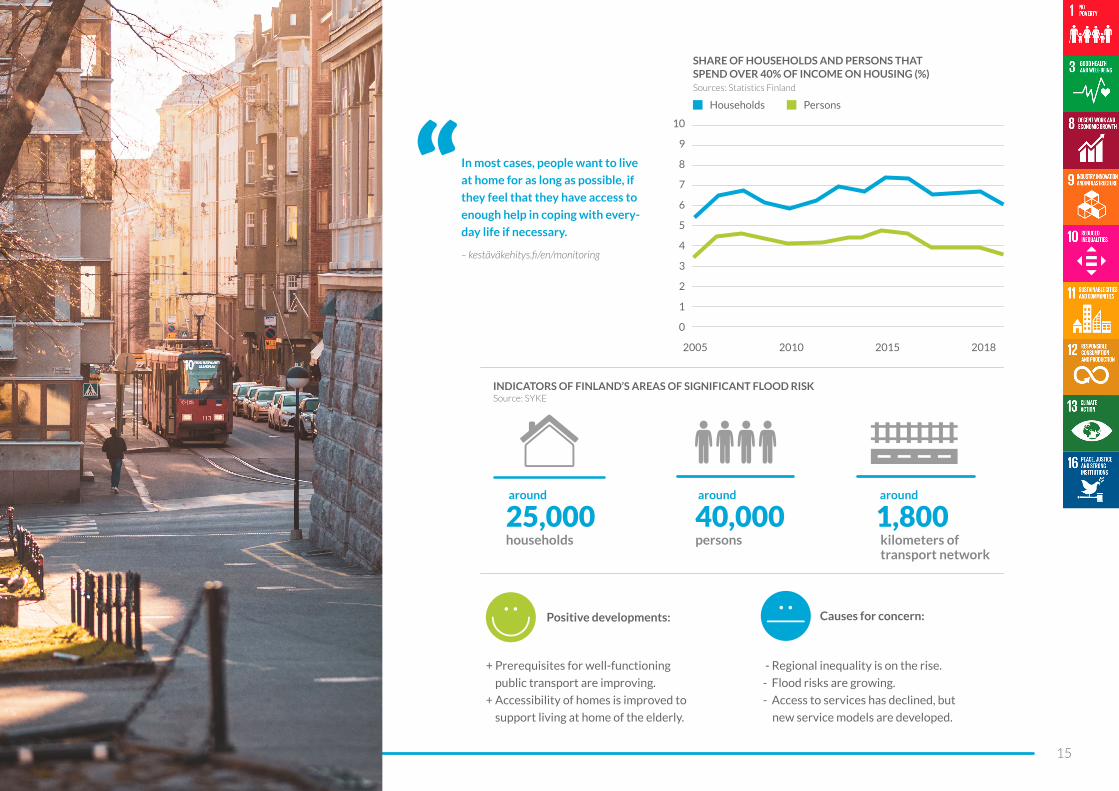
In 2018, housing costs exceeded 40% of net income in around
165,000 households which is 6% of all Finnish households. A few
years earlier, the amount was as high as 190,000 households. High
housing costs put pressure on those living in rented housing in par-
ticular, depending on their place of residence. In 2018, the tenth of
households with the highest incomes spent about 14% of their net
income on housing, whereas the tenth of households with the lowest
income spent 30% of their net income on housing.
Over 90% of Finns aged 75 or over live at homeThe percentage of people aged 75 or over who live at home has been
growing since 2012. While those belonging to the age group are in
better shape when compared with previous generations, there are
also elderly people in frailer condition than before still living at home.
Living at home is supported by home care and meal services. The
number of persons receiving a large number of home care services
has more than doubled in the span of a decade. In 2018, approximate-
ly 20,000 people of those who live at home and are provided home
care services received more than 60 visits a month. Finland’s national
objective is to further increase the number of people living at home
by paying attention to the accessibility of homes and living environ-
ments. The Housing Finance and Development Centre of Finland
(ARA) grants renovation subsidies for the purposes of refurbishing
homes for elderly and disabled people, removing barriers to mobility
and building new lifts in blocks of walk-up flats.
Elderly inhabitants find it important that various services are easily
accessible. Since 2012, the accessibility of grocery shops has de-
clined slightly in larger urban areas, moderately in many small urban
areas and considerably in rural areas. The accessibility of local shops
has declined in recent years due to factors such as concentration of
trade. In the near future, e-commerce and the emergence of new
types of transport services may reduce the significance of the loca-
tion of shops for the consumer.
Flood risks to grow in the years to comeBased on estimates by the Finnish Environment Institute (SYKE),
flood risks will double or triple in Finland by the year 2100. According
to a long-term forecast, climate change will especially increase flood
risk on sea coasts. It is necessary to prepare for flood risks because
they may cause considerable damage to people, environments and
economic activities. This can be done by means such as flood maps.
Flood risks must be considered in the construction of new residen-
tial buildings and land use planning, among other things. When com-
pared with many other countries, however, the flood risks in Finland
are relatively low. The lakes level out flow rates and people know how
to manage flood risks.
4Communities that adapt to changes proactively and flexibly and are safe and functional for their residents are a prerequisite for sus-
tainable development. In Finland, housing and communities are changing as a result of the ageing population, urbanisation and climate
change. Finland’s population density has risen in large urban areas in particular. Regional differences are increasing as new construction
activities are focused on the largest cities. Ageing demographics draw more and more attention to the accessibility of living environ-
ments. Influencing the community structure and flood preparedness are examples of climate change mitigation and adaptation measures.
15
In most cases, people want to live
at home for as long as possible, if
they feel that they have access to
enough help in coping with every-
day life if necessary.
“– kestäväkehitys.fi/en/monitoring
+ Prerequisites for well-functioning
public transport are improving.
+ Accessibility of homes is improved to
support living at home of the elderly.
- Regional inequality is on the rise.
- Flood risks are growing.
- Access to services has declined, but
new service models are developed.
Causes for concern:Positive developments:
10
9
8
7
6
5
4
2005 2010 2015 2018
SHARE OF HOUSEHOLDS AND PERSONS THAT SPEND OVER 40% OF INCOME ON HOUSING (%) Sources: Statistics Finland
3
2
1
0
40,000persons kilometers of
transport network
25,000households
around around around
1,800
INDICATORS OF FINLAND’S AREAS OF SIGNIFICANT FLOOD RISK Source: SYKE
PersonsHouseholds
16
Prerequisites for healthVarious studies indicate that Finns’ quality of life has improved. A comparative OECD study indicates that, alongside education, health is one
of the areas where Finland has achieved its targets relating to the 2030 Agenda for Sustainable Development. These targets focus on aspects
such as child mortality, accident fatalities, alcohol consumption and the incidence of various epidemics. According to the morbidity index
produced by the National Institute for Health and Welfare (THL), Finns are getting ill less and less frequently. However, as the proportion of el-
derly people in the population increases, diseases are becoming more prevalent. Finns’ health status also reflects social inequality. The health
problems that Finns tend to wrestle with involve obesity, elevated blood pressure, tobacco, alcohol and depression.
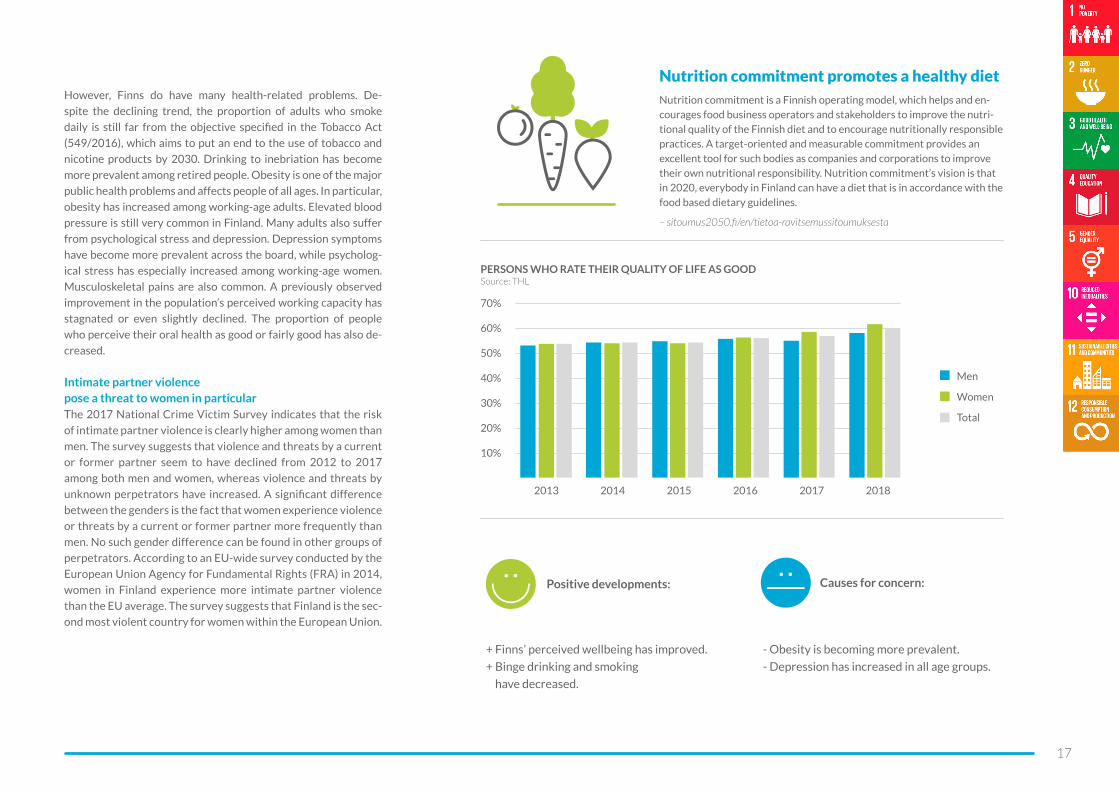
The THL quality of life indicator suggests that perceived quality of life
among Finns aged over 20 improved from 2013 to 2018. Women and
men estimated their quality of life to be equally good. Broken down by
region, perceived quality of life in 2018 was best in Uusimaa and poor-
est in Satakunta.
The majority of Finns rate their quality of life as good well into advanced
age. While the quality of life starts to decline after the age of 80, more
than half of this age group still rated their quality of life as good. How-
ever, one in ten of those aged 80 or over perceived their quality of life as
poor, whereas this was rare in other age groups. The THL 2017 National
FinHealth Study nevertheless indicates that the quality of life experi-
enced by older age groups has developed positively. By way of example,
their vision has improved and their lives are more social than before.
The quality of life is influenced by social status. Besides old age, the
highest risk factors for poor quality of life include disability, unemploy-
ment and poverty. The best defences against poor quality of life include
good education, good health, secure employment, an adequate income,
an intimate relationship, and living in at least a two-person household.
Risks for poor quality of life are mostly linked to problems with income
and housing among young people and to reduced functional capacity
among older people.
Finns living in the south and west are healthier than their peers in the east and northAccording to the THL morbidity index, the overall morbidity of
Finns has been steadily declining since 2000. People are healthier
in Western and Southern Finland than in the east and north. When
comparing cities with a population of 50,000 or more, the healthiest
Finns live in Espoo, Helsinki and Vantaa, while morbidity is highest
in Kuopio, Oulu and Joensuu. Coronary disease, musculoskeletal
diseases and mental health disorders are more common in the large
cities of Eastern and Northern Finland than in those located in the
western and southern parts of the country. Cerebrovascular diseases
and cancers are fairly evenly distributed across the country. The
incidence of accidental injuries is highest in Joensuu and Rovaniemi,
while the number of dementia diagnoses is highest in Kotka.
There are many factors behind regional differences in morbidity.
Lifestyles such as smoking, alcohol consumption, physical activity,
sleeping and eating habits are relevant, but unemployment, financial
standing and education are also reflected in the population’s health.
The effectiveness of health and social services as well as cultural and
genetic factors play a role, as well. Most diseases are much more
common in older age groups than among young people. Although
morbidity has declined and this positive trend seems to be continuing,
the proportion of elderly people in the population is growing, which
means that the number of people suffering from illnesses will increase.
The index takes account of the following groups of diseases: cancers,
coronary disease, cerebrovascular diseases, musculoskeletal diseas-
es, mental health disorders, accidental injuries and dementia. When
comparing the figures in the morbidity index, it must be borne in mind
that an effective healthcare system may also contribute to a higher
level of morbidity as diseases are screened, diagnosed and treated
efficiently.
Binge drinking and smoking on the decline; weight gain and depression on the riseThe 2017 National FinHealth Study indicates that positive signs
in Finnish lifestyles include a decline in daily smoking, increasing
prevalence of sobriety and decreasing rates of binge drinking
among the working-age population. Adults also get more physi-
cal exercise than before. The population’s total cholesterol levels
have taken another downward turn, which may significantly re-
duce the incidence of cardiovascular diseases. Elevated blood glu-
cose levels have not become more prevalent either. The persistent
increase in allergic symptoms would seem to be levelling off.
5
17
However, Finns do have many health-related problems. De-
spite the declining trend, the proportion of adults who smoke
daily is still far from the objective specified in the Tobacco Act
(549/2016), which aims to put an end to the use of tobacco and
nicotine products by 2030. Drinking to inebriation has become
more prevalent among retired people. Obesity is one of the major
public health problems and affects people of all ages. In particular,
obesity has increased among working-age adults. Elevated blood
pressure is still very common in Finland. Many adults also suffer
from psychological stress and depression. Depression symptoms
have become more prevalent across the board, while psycholog-
ical stress has especially increased among working-age women.
Musculoskeletal pains are also common. A previously observed
improvement in the population’s perceived working capacity has
stagnated or even slightly declined. The proportion of people
who perceive their oral health as good or fairly good has also de-
creased.
Intimate partner violence pose a threat to women in particularThe 2017 National Crime Victim Survey indicates that the risk
of intimate partner violence is clearly higher among women than
men. The survey suggests that violence and threats by a current
or former partner seem to have declined from 2012 to 2017
among both men and women, whereas violence and threats by
unknown perpetrators have increased. A significant difference
between the genders is the fact that women experience violence
or threats by a current or former partner more frequently than
men. No such gender difference can be found in other groups of
perpetrators. According to an EU-wide survey conducted by the
European Union Agency for Fundamental Rights (FRA) in 2014,
women in Finland experience more intimate partner violence
than the EU average. The survey suggests that Finland is the sec-
ond most violent country for women within the European Union.
Nutrition commitment is a Finnish operating model, which helps and en-courages food business operators and stakeholders to improve the nutri-tional quality of the Finnish diet and to encourage nutritionally responsible practices. A target-oriented and measurable commitment provides an excellent tool for such bodies as companies and corporations to improve their own nutritional responsibility. Nutrition commitment’s vision is that in 2020, everybody in Finland can have a diet that is in accordance with the food based dietary guidelines.
+ Finns’ perceived wellbeing has improved.
+ Binge drinking and smoking
have decreased.
- Obesity is becoming more prevalent.
- Depression has increased in all age groups.
10%
2013 2014 2015 2016 2017 2018
30%
60%
20%
50%
40%
70%
PERSONS WHO RATE THEIR QUALITY OF LIFE AS GOOD
Men
Women
Total
Nutrition commitment promotes a healthy diet
– sitoumus2050.fi/en/tietoa-ravitsemussitoumuksesta
Source: THL
Causes for concern:Positive developments:
18
Social inequalitySocial inequality is a global problem and a challenge also in Finland. The indicators suggest that the sharp expansion of
income disparities and the increase in low-income rates have come to a halt, but the differences are still high compared
with the early 1990s. The number of people receiving basic social assistance has decreased.
It is important to reduce inequalities because both affluence and
deprivation tend to accumulate. Inequality is manifested in aspects
such as income disparities, health, social exclusion, perceived well-
being and life satisfaction, education, and confidence in the future. A
level playing field guarantees more equal opportunities for younger
generations to advance in society, while also ensuring social peace.
The standard of living, quality of life and lifestyles have generally im-
proved for a large proportion of Finns since the mid-1970s.
Finland’s income disparities among the EU’s lowest, proportion of basic social assistance recipients decreasingOne way of measuring inequality is to look at the proportion of peo-
ple on low incomes. In 2017, the figure was 12.1% in Finland, which
means that 654,000 people lived in low-income households. Income
disparities can also be measured using the Gini coefficient, which as-
signs the value of zero to a society where everyone receives the same
income. It is generally recognised that income disparities are small
if the Gini coefficient is less than 25%. In 2017, the Gini coefficient
in Finland was 27.7%. Income disparities in Finland are among the
lowest in the European Union. According to Eurostat, the statistical
office of the European Union, only the Czech Republic, Slovenia and
Slovakia have lower income disparities than Finland. The average
Gini coefficient in the European Union is over 30%.
Wealth inequality is a key factor indicative of economic inequality.
According to Statistics Finland, differences in wealth have increased
during this millennium as well as after the 2008 economic crisis.
Statistics Finland defines wealth as net assets. Net assets can be de-
termined by adding up the value of one’s own residence, other real
assets and financial assets. Debts will then be deducted from these.
Another good indicator for analysing inequality is the proportion of
people on basic social assistance. In 2019, approximately 397 000
people received basic social assistance in Finland, accounting for
7.2% of the population. The amount decreased from the previous
year. The proportion of recipients was highest in Päijät-Häme, fol-
lowed by the Uusimaa region and Central Finland. The numbers of
people on basic social assistance are directly linked to economic up-
turns and downturns.
Life satisfaction declining among young adultsThe satisfaction of young adults reflects their attitudes towards
the future and the opportunities provided by society. The Europe-
an Social Survey 2016 indicates that 85% of young Finnish adults
are satisfied with their lives. In contrast, in 2006, the percentage
was as high as 91.9%. After the 2008 recession, dissatisfaction has
increased as a result of growing unemployment and financial prob-
lems among young people.
Discrimination is a serious problem in FinlandEnding discrimination is one of the UN Sustainable Development
Goals for 2030. Nevertheless, discrimination, physical violence and
hate speech are still current concerns. A survey conducted by the
EU Fundamental Rights Agency (FRA) shows that Finland was one
of the most discriminating countries in Europe in 2017. While dis-
crimination was most frequently experienced in connection with
looking for employment, it was also common in public and private
services, such as shops, restaurants and banks. Experiences of dis-
crimination are particularly prevalent among second-generation
immigrants. Conversely, the 2018 World Happiness Report sug-
gests that the happiest immigrants in the world could be found in
Finland between 2005 and 2017.
Finland’s refugee quota has slightly increasedInequality is also linked to the vulnerable position of refugees. Glob-
ally, there are over 65 million people who have been displaced due
to wars and conflicts as well as changes in their living environments.
The consequences of climate change have barely been taken into
account in the current conventions on refugees. According to UN
forecasts, about 200 million people will be forced to abandon their
homes for reasons such as drought. The IPBES report estimates that
climate change will force 50–700 million people to migrate.
6
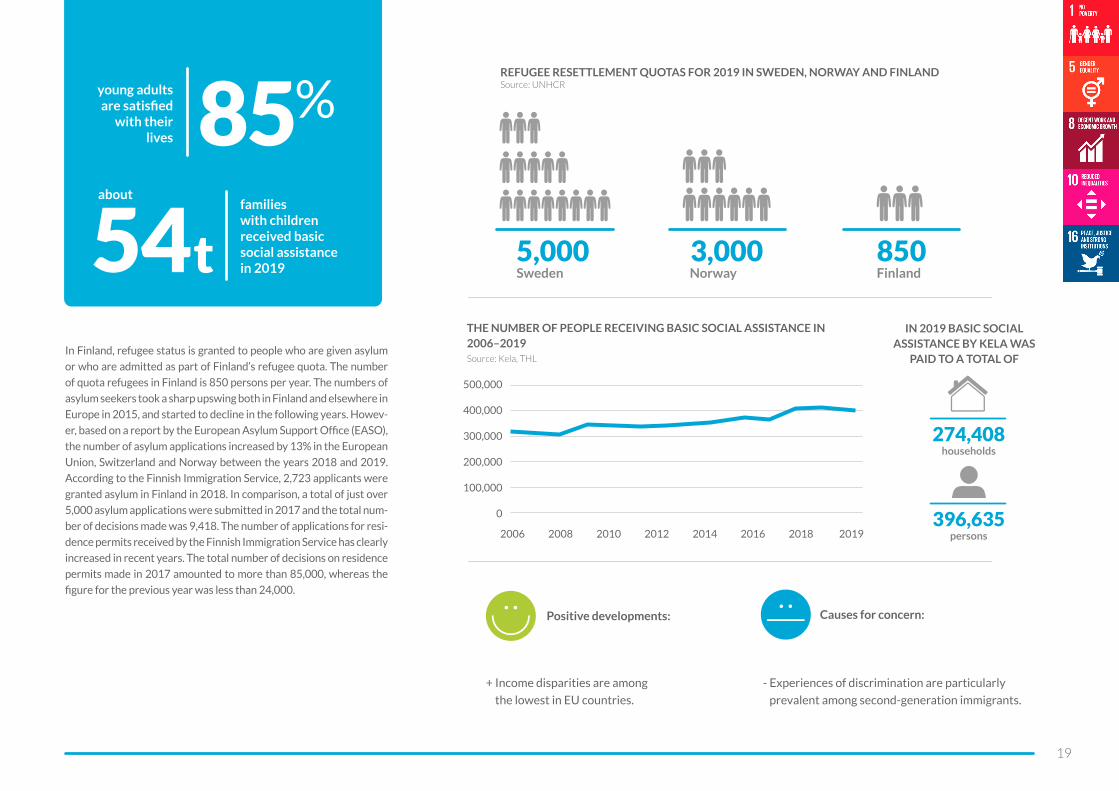
19
In Finland, refugee status is granted to people who are given asylum
or who are admitted as part of Finland’s refugee quota. The number
of quota refugees in Finland is 850 persons per year. The numbers of
asylum seekers took a sharp upswing both in Finland and elsewhere in
Europe in 2015, and started to decline in the following years. Howev-
er, based on a report by the European Asylum Support Office (EASO),
the number of asylum applications increased by 13% in the European
Union, Switzerland and Norway between the years 2018 and 2019.
According to the Finnish Immigration Service, 2,723 applicants were
granted asylum in Finland in 2018. In comparison, a total of just over
5,000 asylum applications were submitted in 2017 and the total num-
ber of decisions made was 9,418. The number of applications for resi-
dence permits received by the Finnish Immigration Service has clearly
increased in recent years. The total number of decisions on residence
permits made in 2017 amounted to more than 85,000, whereas the
figure for the previous year was less than 24,000.
+ Income disparities are among
the lowest in EU countries.
- Experiences of discrimination are particularly
prevalent among second-generation immigrants.
familieswith childrenreceived basic social assistancein 201954t
about
85%young adults are satisfied
with their lives
Causes for concern:Positive developments:
REFUGEE RESETTLEMENT QUOTAS FOR 2019 IN SWEDEN, NORWAY AND FINLAND
5,000 3,000 850Sweden Norway Finland
Source: UNHCR
500,000
400,000
2006 20102008 20142012 2018 20192016
300,000
200,000
100,000
0
THE NUMBER OF PEOPLE RECEIVING BASIC SOCIAL ASSISTANCE IN 2006–2019Source: Kela, THL
274,408
396,635
households
persons
IN 2019 BASIC SOCIAL ASSISTANCE BY KELA WAS
PAID TO A TOTAL OF
20
Social exclusion and inclusivityThe number of young people not in employment, education or training has decreased slightly in Finland in recent years. Young people’s
trust in society has also improved. However, one out of ten schoolchildren feels lonely from year to year. Finns turn out to vote in elections
less frequently than before, but other forms of participation have emerged in lieu of voting. Finland is still performing well in international
country rankings on corruption and press freedom.
There is no established definition for ‘social exclusion’. Nevertheless,
young people occupy a key place in any exploration of the subject. Ex-
perts have therefore selected the proportion of young people aged 15 to
24 not in employment, education or training (NEETs) as one of the indi-
cators of social exclusion and inclusion. In 2018, the proportion was 51
000 people which is 8.3% of the age group. The figure has been decreas-
ing slightly every year since 2015.
Social exclusion is also linked to the issue of loneliness. A child or young
person with no friends might accumulate many risks related to health
and wellbeing. The School Health Promotion Survey carried out by the
National Institute for Health and Welfare (THL) reveals that one out of
ten schoolchildren feels lonely. In 2019, just over 11% of boys in grades 8
and 9 (aged 14–15) had no close friends, while the corresponding figure
for girls was about 7%. However, the proportion of young people with
no close friends, boys in particular, has declined over the last ten years.
Varying confidence in Finland as a future country of residenceYoung people’s trust in Finnish society varies. According to the 2018
Youth Barometer, 77% of responders believed that Finland would be a
good country of residence in the future, whereas in 2016, the figure was
55%. The sense of belonging to Finnish society is also experiencing rapid
fluctuations. The 2017 Youth Barometer showed a reversal towards a
closer sense of belonging, back up to 2012 levels. Researchers suggest
that these fluctuations may reflect current public debate about themes
that affect young people’s lives, such as the economic situation or immi-
gration, but this is not a certainty.
Voter turnout increased in 2019 parliamentary electionsVoter turnout is often used as an indicator of political participation
because reliable data is easily available. According to democracy
indicators, voter turnout in Finland has declined over the last few
decades at a rate exceeding the Western European average. Voting
is no longer perceived as a civic duty to the same extent as some de-
cades ago. The concept of citizenship is undergoing a transforma-
tion in other respects as well. In a follow-up report by civil society
organisations (CSOs) entitled ‘Finland and the 2030 Agenda’, Finn-
ish Environmental Organisation Dodo points out that many Finns
see themselves primarily as consumers rather than citizens. Only
a small fraction is involved in politics. Participation in civil society
organisations is more common, but Dodo states that they are not
having their voices adequately heard in politics.
Especially young men vote infrequently. At the most recent municipal
elections in 2017, over two thirds of all voters aged under 25 failed
to vote. In contrast, in the 2019 parliamentary elections, the turnout
among Finnish citizens living in Finland was 72.1%, which is slightly
higher than in the previous parliamentary elections. Voter turnout also
increased among voters living abroad, as 12.6% of them voted in the
2019 parliamentary elections. However, voter turnout is a limited indi-
cator of participation in society. Many new forms of participation have
cropped up alongside the more traditional ways, including the citizens’
initiative, online participation and voluntary activism. In particular,
the citizens’ initiative is becoming an established channel for political
participation. As an increasing number of citizens’ initiatives clear the
threshold of 50,000 supporters, several initiatives have been sent to
Parliament for consideration during the 2015–2019 electoral term.
Finland ranked the third least corrupt nation in the worldSocial inclusion also entails freedom of expression and free media. Fin-
land is performing well in rankings on corruption and press freedom.
Transparency International’s Corruption Index ranks Finland the third
least corrupt nation in the world, only surpassed by New Zealand and
Denmark. However, the organisation has pointed out that the index fails
to capture the kind of structural corruption typical of Finnish society.
Finland is nevertheless one of the least corrupt countries in the world.
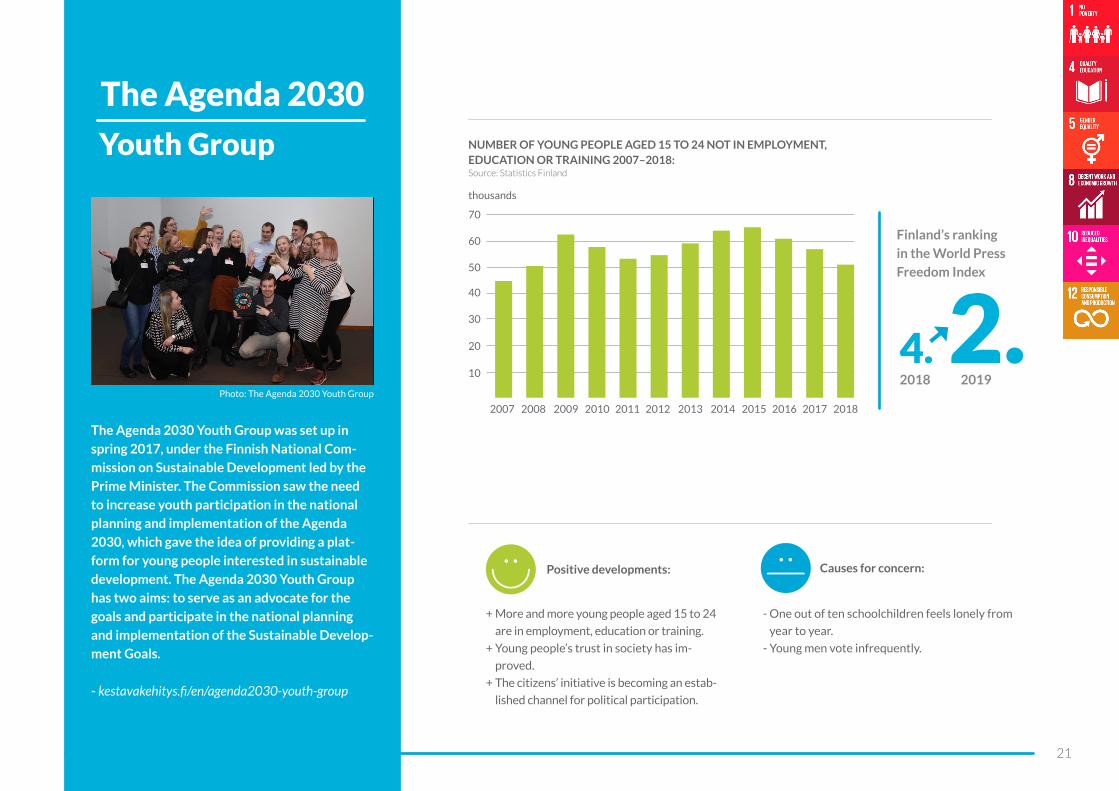
Finland is also doing well in terms of press freedom when compared
with many other countries. Finland was ranked first in the World Press
Freedom Index for many years. In 2019, it moved up in the ranking
from fourth to second place.
7
Structural corruption = Structural corruption often occurs in the interface
between the public and the private sectors. High-risk areas for corruption are
the construction sector, public procurement and competitive tendering, urban
planning, political decision-making, and party and campaign funding. Corrup-
tion typically takes the form of giving and accepting undue advantages, conflicts
of interest and favouritism. Source: the Ministry of Justice
21
4.
Finland’s ranking
in the World Press
Freedom Index
20192018
The Agenda 2030 Youth Group was set up in
spring 2017, under the Finnish National Com-
mission on Sustainable Development led by the
Prime Minister. The Commission saw the need
to increase youth participation in the national
planning and implementation of the Agenda
2030, which gave the idea of providing a plat-
form for young people interested in sustainable
development. The Agenda 2030 Youth Group
has two aims: to serve as an advocate for the
goals and participate in the national planning
and implementation of the Sustainable Develop-
ment Goals.
- kestavakehitys.fi/en/agenda2030-youth-group
+ More and more young people aged 15 to 24
are in employment, education or training.
+ Young people’s trust in society has im-
proved.
+ The citizens’ initiative is becoming an estab-
lished channel for political participation.
- One out of ten schoolchildren feels lonely from
year to year.
- Young men vote infrequently.
The Agenda 2030
Youth Group
Photo: The Agenda 2030 Youth Group
2007
10
20
30
40
50
60
70
20122008 20132009 20142010 20152011 2016 2017
NUMBER OF YOUNG PEOPLE AGED 15 TO 24 NOT IN EMPLOYMENT, EDUCATION OR TRAINING 2007–2018:
thousands
Source: Statistics Finland
Causes for concern:Positive developments:
2018
2.
22
Working life, quality and changeThe world of work is changing at a dizzying pace. Although labour productivity is declining in Finland, the employment rate continues to grow
and is already catching up with the levels preceding the latest economic crisis. There are no major changes in the numbers of employees who
find their work mentally or physically strenuous. Opportunities to influence work have slightly improved. Inequalities between men and
women are still visible in working life. The gender pay gap is shrinking slowly and the rise in educational level of women has not had expected
effect on their position in the labour markets. A growing number of companies pay attention to corporate social responsibility practices.
According to Statistics Finland, employment has developed pos-
itively after the recent recession and the employment rate is al-
ready close to the levels preceding the latest economic crisis. How-
ever, labour productivity in Finland has taken a slight downward
turn compared to other economies after the two-year-long upward
trend. The economic recovery can be attributed more strongly to
employment trends among men than women. The differences in
employment rates between men and women were at their lowest
level in 2014, after which they have again taken an upward turn. In
2018, the average employment rates among men and women aged
between 16 and 64 stood at 72.7% and 70.6%, respectively.
The share of underemployed workers of all employed people
has increased considerably in recent years, whereas the share of
low-income earners has shrunk. According to the most recent data,
the low-income rate of employed persons was 3.1% and the under-
employment rate was 5.5%. Underemployment refers to the share
of employed persons who work part-time and want to work more
hours. A low-income worker is one whose household’s disposable
income is below 60% of the median income of the whole popula-
tion. In 2018, the limit for one-person households was EUR 14,970
per year, or about EUR 1,250 per month. In international compar-
isons, share of low-income persons in Finland is one of the lowest
in the world.
No change in the physical and mental strain of workThe proportion of employees who find their work physically and men-
tally strenuous has remained unchanged. Slightly over one third find
their work physically demanding and about 60% find it mentally de-
manding. A lack of autonomy at work contributes to the level of strain
experienced at work. According to the Working life barometer 2018,
84% of employees felt that they could learn new things in their work-
place. The opportunities to influence one’s work tasks and rates and
the division of work have slightly improved from the previous year.
Despite the moderate development of the past few years, opportuni-
ties to influence are still at quite a high level by European standards.
Men have more opportunities to influence their work than women.
Finnish working life has been changing and there is no end in sight.
According to the Work 2040 scenario report produced by think tank
Demos Helsinki, employees’ competencies have increased as a result
of factors such as technology. The report indicates, however, that this
has only been reflected in increasing productivity instead of also ben-
efiting employees. Employees can perform a larger number of more
versatile tasks than before. Job descriptions are becoming fragment-
ed while the contents of professions are diversifying. Working hours,
physical workplaces and incomes have been reorganised.
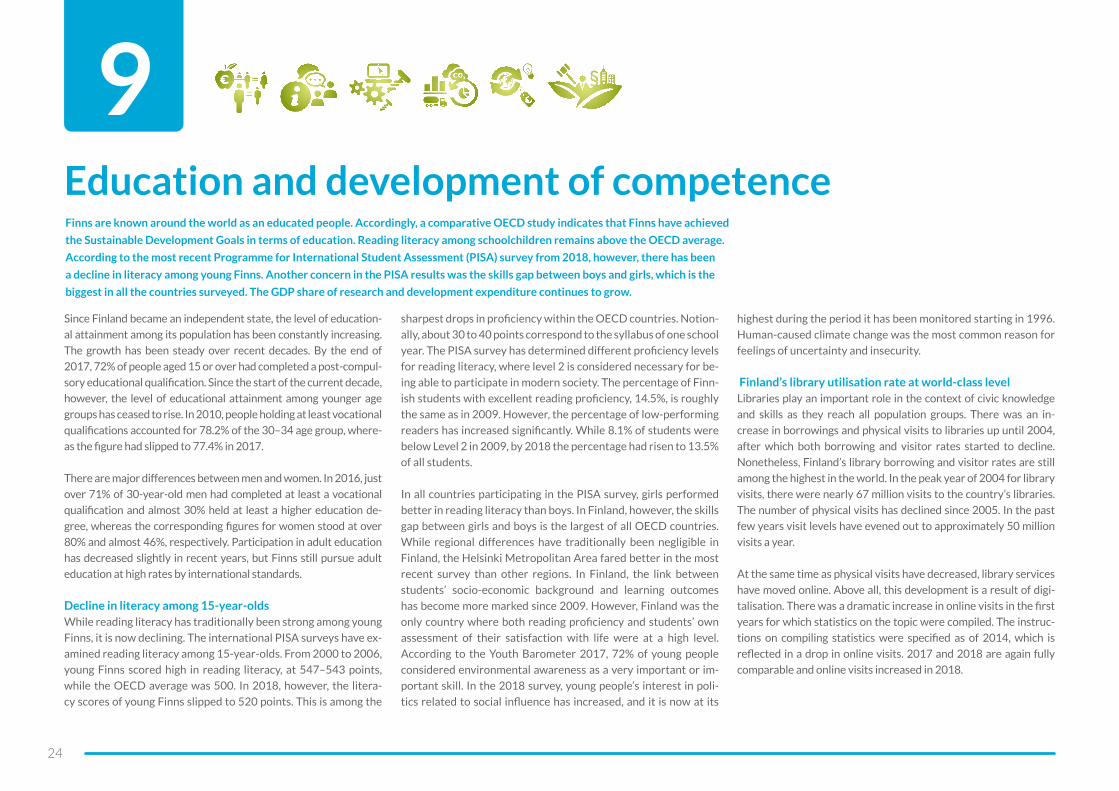
Pay gap between women and men shrinking slowlyThe gender pay gap has only shrunk by about five percentage
points in the last 20 years. In 2018, a woman earned 85% of a man’s
average monthly pay, while the figure for 1995 was 80%. In other
words, the pay gap has shrunk only five percentage points, even
though women have become more educated. In 2018, the pay gap
was 15%, as women and men earned an average of EUR 3,112 and
EUR 3,681 per month, respectively. A significant part of the pay dif-
ferential can be explained by the fact that men and women often
work in different fields, occupations and positions. There are also
more men than women in management roles. Furthermore, wom-
en do a larger share of family care work and are therefore absent
from working life more frequently than men. The absences and un-
even division of care responsibilities affect women’s career devel-
opment and perpetuate pay differentials. According to an OECD
study entitled Measuring Distance to the SDG Targets, Finland is
far from its targets for gender equality.
Corporate social responsibility difficult to monitor comprehensivelyA good working life also entails responsibility. In Finland, an or-
ganisation focusing on corporate social responsibility (CSR) called
FIBS carries out annual interview surveys exploring CSR practices
8
23
+ Unemployment is decreasing.
+ Fewer and fewer working people
earn a low income.
+ Businesses focus on CSR practices.
- Gender equality is not reality in working life.
- Work is perceived as strenuous to the same extent as before.
- Underemployment has increased.
- Skills development concentrates to those already skilled.
Labour productivity = the amount of value added
or output gained per hour worked.
in large and medium-sized companies. Its 2018 report indicates
that corporate social responsibility in Finland has made progress
from the previous situation. More than half the companies have
included objectives relating to sustainable development as part
of their strategies. Larger companies report on various measures
more frequently than smaller businesses. Finnish companies have
ranked well also in international indices that measure respon-
sibility. The Global 100 Most Sustainable Corporations in the
World in 2020 index includes six Finnish companies. Moreover,
according to the PWC Corporate Social Responsibility Barome-
ter 2018, more and more Finnish companies include descriptions
in their reporting of the human rights-related measures they
have implemented in their own activities and in the management
of their supply chains.
Monitoring CRS within companies operating in Finland is chal-
lenging because there are no adequate indicators or compre-
hensive follow-up data. One of the ideas suggested as a solution
is enacting a law on corporate social responsibility, which would
require enterprises to undertake to comply with certain obliga-
tions and, if irregularities are detected, to correct the situation.
Causes for concern:Positive developments:
GENDER WAGE GAP BY NORDIC
COUNTRY (%)
Den
mar
k 5
.3
No
rway
7
.1
Icel
and
11
.5
Swed
en
7.1
Fin
lan
d 1
7.7
1995
500
1,000
1,500
2,000
2,500
3,000
3,500
4,000
2005 2010 2015 20182000
GENDER PAY GAP (€/MONTH)
Men Women
Source: OECD
Source: Statistics Finland
24
Education and development of competenceFinns are known around the world as an educated people. Accordingly, a comparative OECD study indicates that Finns have achieved
the Sustainable Development Goals in terms of education. Reading literacy among schoolchildren remains above the OECD average.
According to the most recent Programme for International Student Assessment (PISA) survey from 2018, however, there has been
a decline in literacy among young Finns. Another concern in the PISA results was the skills gap between boys and girls, which is the
biggest in all the countries surveyed. The GDP share of research and development expenditure continues to grow.
Since Finland became an independent state, the level of education-
al attainment among its population has been constantly increasing.
The growth has been steady over recent decades. By the end of
2017, 72% of people aged 15 or over had completed a post-compul-
sory educational qualification. Since the start of the current decade,
however, the level of educational attainment among younger age
groups has ceased to rise. In 2010, people holding at least vocational
qualifications accounted for 78.2% of the 30–34 age group, where-
as the figure had slipped to 77.4% in 2017.
There are major differences between men and women. In 2016, just
over 71% of 30-year-old men had completed at least a vocational
qualification and almost 30% held at least a higher education de-
gree, whereas the corresponding figures for women stood at over
80% and almost 46%, respectively. Participation in adult education
has decreased slightly in recent years, but Finns still pursue adult
education at high rates by international standards.
Decline in literacy among 15-year-oldsWhile reading literacy has traditionally been strong among young
Finns, it is now declining. The international PISA surveys have ex-
amined reading literacy among 15-year-olds. From 2000 to 2006,
young Finns scored high in reading literacy, at 547–543 points,
while the OECD average was 500. In 2018, however, the litera-
cy scores of young Finns slipped to 520 points. This is among the
sharpest drops in proficiency within the OECD countries. Notion-
ally, about 30 to 40 points correspond to the syllabus of one school
year. The PISA survey has determined different proficiency levels
for reading literacy, where level 2 is considered necessary for be-
ing able to participate in modern society. The percentage of Finn-
ish students with excellent reading proficiency, 14.5%, is roughly
the same as in 2009. However, the percentage of low-performing
readers has increased significantly. While 8.1% of students were
below Level 2 in 2009, by 2018 the percentage had risen to 13.5%
of all students.
In all countries participating in the PISA survey, girls performed
better in reading literacy than boys. In Finland, however, the skills
gap between girls and boys is the largest of all OECD countries.
While regional differences have traditionally been negligible in
Finland, the Helsinki Metropolitan Area fared better in the most
recent survey than other regions. In Finland, the link between
students’ socio-economic background and learning outcomes
has become more marked since 2009. However, Finland was the
only country where both reading proficiency and students’ own
assessment of their satisfaction with life were at a high level.
According to the Youth Barometer 2017, 72% of young people
considered environmental awareness as a very important or im-
portant skill. In the 2018 survey, young people’s interest in poli-
tics related to social influence has increased, and it is now at its
highest during the period it has been monitored starting in 1996.
Human-caused climate change was the most common reason for
feelings of uncertainty and insecurity.
Finland’s library utilisation rate at world-class levelLibraries play an important role in the context of civic knowledge
and skills as they reach all population groups. There was an in-
crease in borrowings and physical visits to libraries up until 2004,
after which both borrowing and visitor rates started to decline.
Nonetheless, Finland’s library borrowing and visitor rates are still
among the highest in the world. In the peak year of 2004 for library
visits, there were nearly 67 million visits to the country’s libraries.
The number of physical visits has declined since 2005. In the past
few years visit levels have evened out to approximately 50 million
visits a year.
At the same time as physical visits have decreased, library services
have moved online. Above all, this development is a result of digi-
talisation. There was a dramatic increase in online visits in the first
years for which statistics on the topic were compiled. The instruc-
tions on compiling statistics were specified as of 2014, which is
reflected in a drop in online visits. 2017 and 2018 are again fully
comparable and online visits increased in 2018.
9
25
A certificate attests to commitment to sustainable development In view of the future, it is important to determine what is learnt
about sustainable development at schools and nursery schools.
Sustainable development certificates are being granted to an in-
creasing number of nursery schools, schools and other education-
al institutions. A certificate attests to commitment to sustainable
development. In 2018, 267 organisations used the Green Flag, 80
organisations had a Certificate on Education for Sustainable Devel-
opment and a total of 134 organisations were members of the UN
Schools network in Finland. Moreover, 5.4% of primary, secondary
and upper secondary schools have the right to use the Green Flag
and 4.6% are members of the UN Schools network. The concepts
of ‘eco-social education’ and ‘sustainable development’ have also
been enshrined in the National Core Curricula for basic education
and general upper secondary schools.
Research and development funding is growingResearch advances society. One of the targets included in the 2030
Agenda is to significantly increase public and private funding for
research and development (R&D) activities by 2030. In Finland,
public and private spending on research and development has de-
creased in the current decade. The decline in R&D investments has
been particularly significant in the private sector. The reduction in
public sector investments bottomed out and the rate of decline in
private sector investments slowed down in 2016. In the state bud-
get for 2019, the total appropriations for R&D activities amount
to EUR 1,991 million. The appropriations increased by 3.8% in real
terms compared to previous year. The Government’s Research and
Innovation Council has set an objective for Finland to increase its
investments in research and innovation activities to the level of 4%
of GDP by 2030.
PISA survey = The Programme for International Student Assessment (PISA) is a joint research programme of OECD countries, producing information about the status and outcomes of education as well as about learning outside school settings in an international frame of reference. The survey explores the extent to which young people aged 15 master key skills essential for the future, the kinds of factors that influence these skills, and the ways in which the skills develop over time.
+ The level of educational attainment
among Finns has increased.
+ Young Finns’ satisfaction with life is at a
high level.
+ R&D expenditure continues to grow.
- Young Finns’ reading literacy has plummeted.
- Differences between girls and boys in reading
literacy are among the largest in the world.
- Men acquire less education than women.
An eco-socially educated citizen is an agent of social change
leading to sustainable lifestyles and culture, ensuring that
the ecological foundation of life will endure and the prereq-
uisites for human rights will be preserved. The economy is an
instrument for fair distribution of the material good instead
of economic growth for its own sake. The core values of
all-round education are predicated on responsibility, moder-
ation and human interaction.– Arto O. Salonen, Associate Professor, University of Eastern Finland, Faculty of Social Sciences and Business Studies
“
Causes for concern:Positive developments:
The Literacy Movement is an ongoing governmental programme aimed at promoting the literacy of Finnish residents, especially children and young people. It aims to expand the concept of literacy and to bring forward the importance of both multiliteracy and multilingualism.
Literacy Movement promotes the literacy and multiliteracy of Finnish children and youth
Lukuliike.fi
26
Global responsibility and policy coherenceTaking global responsibility means that Finland and other highly developed, high-income countries participate in international
cooperation and promote the achievement of the Sustainable Development Goals across the world. Support from developed
countries such as Finland is highly significant for developing countries in issues such as the fight against climate change. However,
a considerable proportion of the environmental impacts caused by Finns is generated outside the country. The climate financing
offered by Finland to developing countries increased considerably around the turn of the current decade, but plunged in 2016.
The level of Finland’s development cooperation funding is low when compared with other Nordic countries.
Finland promotes sustainable development globally by, for in-
stance, participating in international crisis management and
prevention and in post-crisis recovery by military and civilian
means. The aim is to promote peace and security, which creates
the preconditions for sustainable development. In relation to its
population size, Finland sends more participants to civilian crisis
management operations than any other EU country.
Through its trade policy, Finland can contribute to the realisation
of, for example, equality and human rights and to more sustain-
able use of natural resources. Finland plays an active role in the
implementation of clauses on trade and sustainable develop-
ment in EU free trade agreements. Finland promotes exports of
environmental products and aims to prevent fossil fuel subsidies
at the international level. At the same time, however, the goods
imported to Finland from abroad include plenty of products man-
ufactured using non-renewable natural resources, while Finnish
exports include significant amounts of renewable wood and pro-
cessed wood-based products. Because a rapid reduction in the
use of fossil fuels is necessary to mitigate climate change, imports
of fossil materials can be expected to decline. Many products also
involve so-called hidden material flows. Indeed, a considerable
proportion of the environmental impacts caused by Finns is gen-
erated outside the country.
Every year, a non-governmental organisation called the Center for
Global Development ranks 27 of the world’s richest countries on
their commitment to improving the status of people living in the
poorest countries using the Commitment to Development Index
(CDI). Finland performs well in this ranking: in 2018, Finland scored
5.32 on the index, ranking third after Sweden and Denmark.
According to the Good Country Index published in early 2019,
Finland contributes most to the common good of humanity rela-
tive to the size of its national economy while burdening the planet
the least among all countries. In the latest ranking of 153 coun-
tries, Finland climbed from fourth place to number one. Other top
countries are Ireland, Sweden, Germany and Denmark.
Finland’s development cooperation appropriations far from the target shareThe support Finland and other donor countries have given
to developing countries has made a difference. The percent-
age of the world population living in extreme poverty has
halved since 1990. The vast majority of girls and boys can go
to school. Mortality rates among mothers and children under
five years of age have decreased significantly. The number of
people living without water supply and sewerage has halved.
In the long term, Finland is committed to increasing its de-
velopment cooperation appropriations to 0.7% of its gross
national income (GNI). The target was close in 2014, when
the figure was 0.59%. Cuts in 2016 as part of the balancing
of government finances changed the situation significantly. In
2018, Finland used 0.36% of its GNI on development coopera-
tion. That amounted to EUR 833 million and made Finland the
ninth biggest donor country within the European Union. The
estimated figure for 2019 is 0.42%. Finland has lagged behind
other Nordic countries in terms of development funding.
10
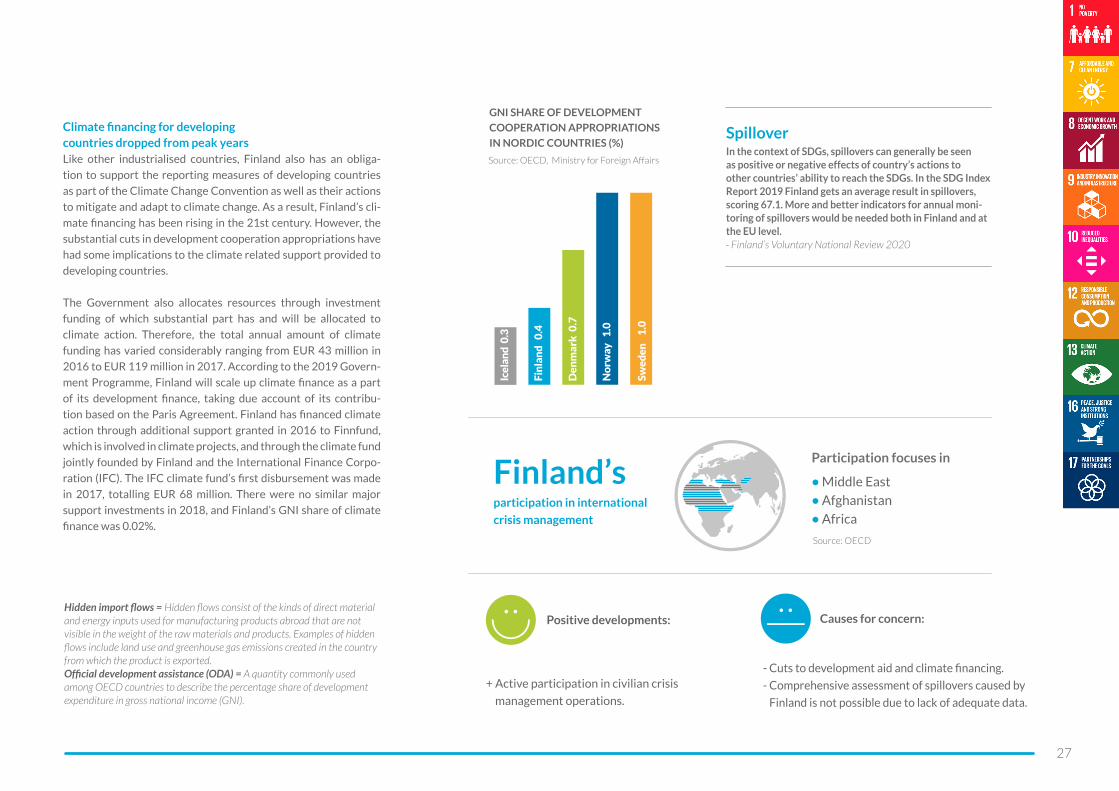
27
Hidden import flows = Hidden flows consist of the kinds of direct material and energy inputs used for manufacturing products abroad that are not visible in the weight of the raw materials and products. Examples of hidden flows include land use and greenhouse gas emissions created in the country from which the product is exported.Official development assistance (ODA) = A quantity commonly used among OECD countries to describe the percentage share of development expenditure in gross national income (GNI).
+ Active participation in civilian crisis
management operations.
- Cuts to development aid and climate financing.
- Comprehensive assessment of spillovers caused by
Finland is not possible due to lack of adequate data.
Climate financing for developing countries dropped from peak yearsLike other industrialised countries, Finland also has an obliga-
tion to support the reporting measures of developing countries
as part of the Climate Change Convention as well as their actions
to mitigate and adapt to climate change. As a result, Finland’s cli-
mate financing has been rising in the 21st century. However, the
substantial cuts in development cooperation appropriations have
had some implications to the climate related support provided to
developing countries.
The Government also allocates resources through investment
funding of which substantial part has and will be allocated to
climate action. Therefore, the total annual amount of climate
funding has varied considerably ranging from EUR 43 million in
2016 to EUR 119 million in 2017. According to the 2019 Govern-
ment Programme, Finland will scale up climate finance as a part
of its development finance, taking due account of its contribu-
tion based on the Paris Agreement. Finland has financed climate
action through additional support granted in 2016 to Finnfund,
which is involved in climate projects, and through the climate fund
jointly founded by Finland and the International Finance Corpo-
ration (IFC). The IFC climate fund’s first disbursement was made
in 2017, totalling EUR 68 million. There were no similar major
support investments in 2018, and Finland’s GNI share of climate
finance was 0.02%.
Finland’sparticipation in international
crisis management
Participation focuses in
• Middle East
• Afghanistan
• Africa
Source: OECD
Causes for concern:Positive developments:
In the context of SDGs, spillovers can generally be seen as positive or negative effects of country’s actions to other countries’ ability to reach the SDGs. In the SDG Index Report 2019 Finland gets an average result in spillovers, scoring 67.1. More and better indicators for annual moni-toring of spillovers would be needed both in Finland and at the EU level.- Finland’s Voluntary National Review 2020
GNI SHARE OF DEVELOPMENT
COOPERATION APPROPRIATIONS
IN NORDIC COUNTRIES (%)
Icel
and
0.3
Fin
lan
d 0
.4
Den
mar
k 0
.7
No
rway
1.0
Swed
en
1.0
Source: OECD, Ministry for Foreign Affairs
Spillover
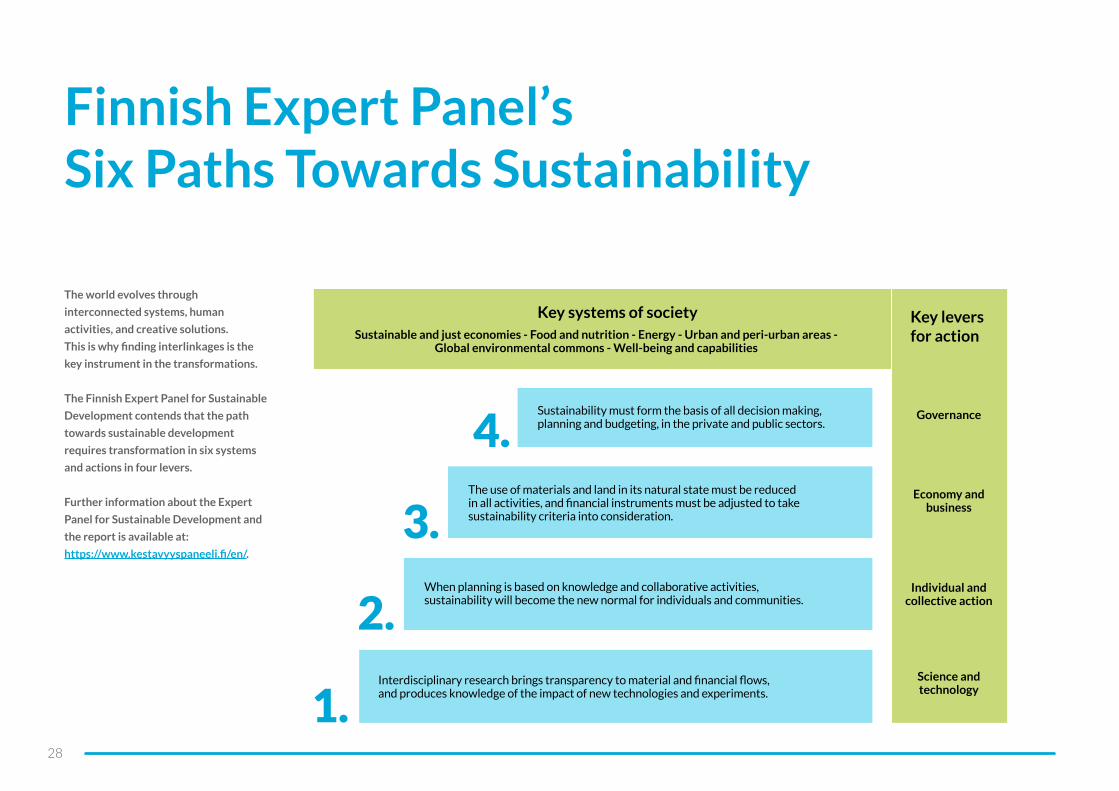
28
Finnish Expert Panel’s Six Paths Towards Sustainability
The world evolves through
interconnected systems, human
activities, and creative solutions.
This is why finding interlinkages is the
key instrument in the transformations.
The Finnish Expert Panel for Sustainable
Development contends that the path
towards sustainable development
requires transformation in six systems
and actions in four levers.
Further information about the Expert
Panel for Sustainable Development and
the report is available at:
https://www.kestavyyspaneeli.fi/en/.
1.
2.
3.
4.
Key systems of society Key levers for action Sustainable and just economies - Food and nutrition - Energy - Urban and peri-urban areas -
Global environmental commons - Well-being and capabilities
Interdisciplinary research brings transparency to material and financial flows, and produces knowledge of the impact of new technologies and experiments.
When planning is based on knowledge and collaborative activities, sustainability will become the new normal for individuals and communities.
The use of materials and land in its natural state must be reduced in all activities, and financial instruments must be adjusted to take sustainability criteria into consideration.
Sustainability must form the basis of all decision making, planning and budgeting, in the private and public sectors.
Governance
Economy and business
Individual and collective action
Science and technology
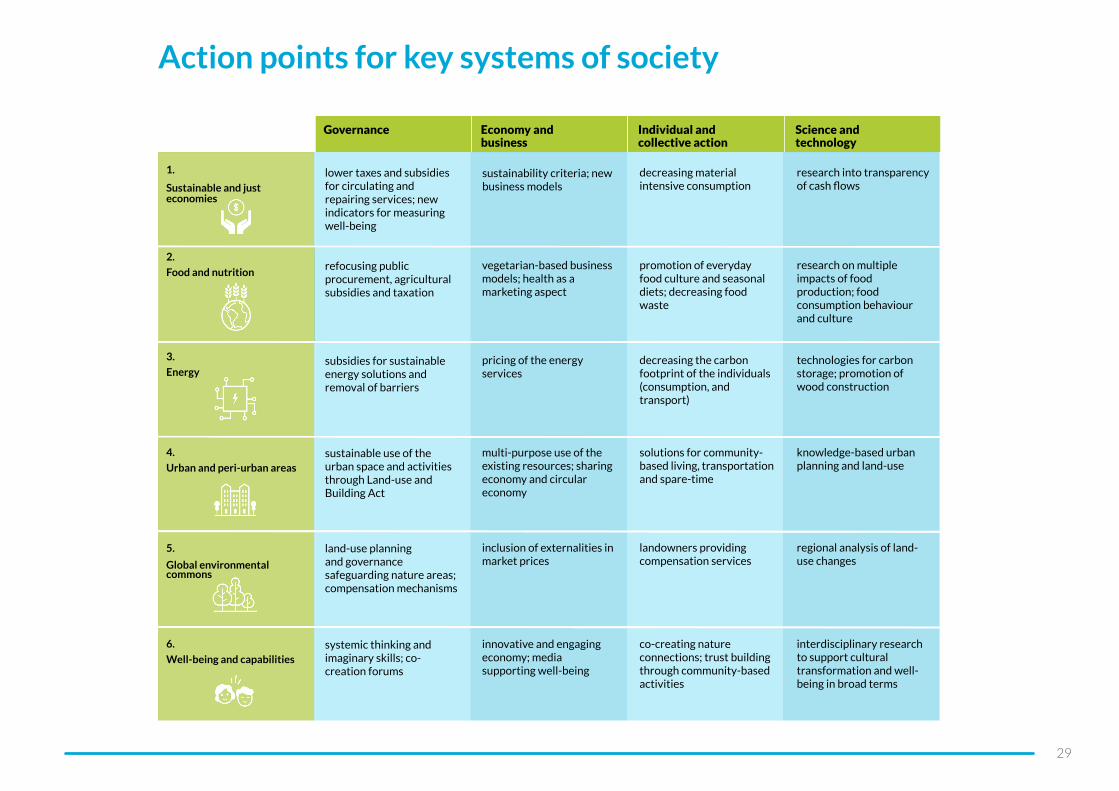
29
Action points for key systems of society
1.
Sustainable and just economies
Governance Economy and business
Individual andcollective action
Science andtechnology
lower taxes and subsidies for circulating and repairing services; new indicators for measuring well-being
refocusing public procurement, agricultural subsidies and taxation
subsidies for sustainable energy solutions and removal of barriers
sustainable use of the urban space and activities through Land-use and Building Act
land-use planning and governance safeguarding nature areas; compensation mechanisms
systemic thinking and imaginary skills; co-creation forums
sustainability criteria; new business models
vegetarian-based business models; health as a marketing aspect
pricing of the energy services
multi-purpose use of the existing resources; sharing economy and circular economy
inclusion of externalities in market prices
innovative and engaging economy; media supporting well-being
decreasing material intensive consumption
promotion of everyday food culture and seasonal diets; decreasing food waste
decreasing the carbon footprint of the individuals (consumption, and transport)
solutions for community-based living, transportation and spare-time
landowners providing compensation services
co-creating nature connections; trust building through community-based activities
research into transparency of cash flows
research on multiple impacts of food production; food consumption behaviour and culture
technologies for carbon storage; promotion of wood construction
knowledge-based urban planning and land-use
regional analysis of land-use changes
interdisciplinary research to support cultural transformation and well-being in broad terms
2.
Food and nutrition
3.
Energy
4.
Urban and peri-urban areas
5.
Global environmental commons
6.
Well-being and capabilities
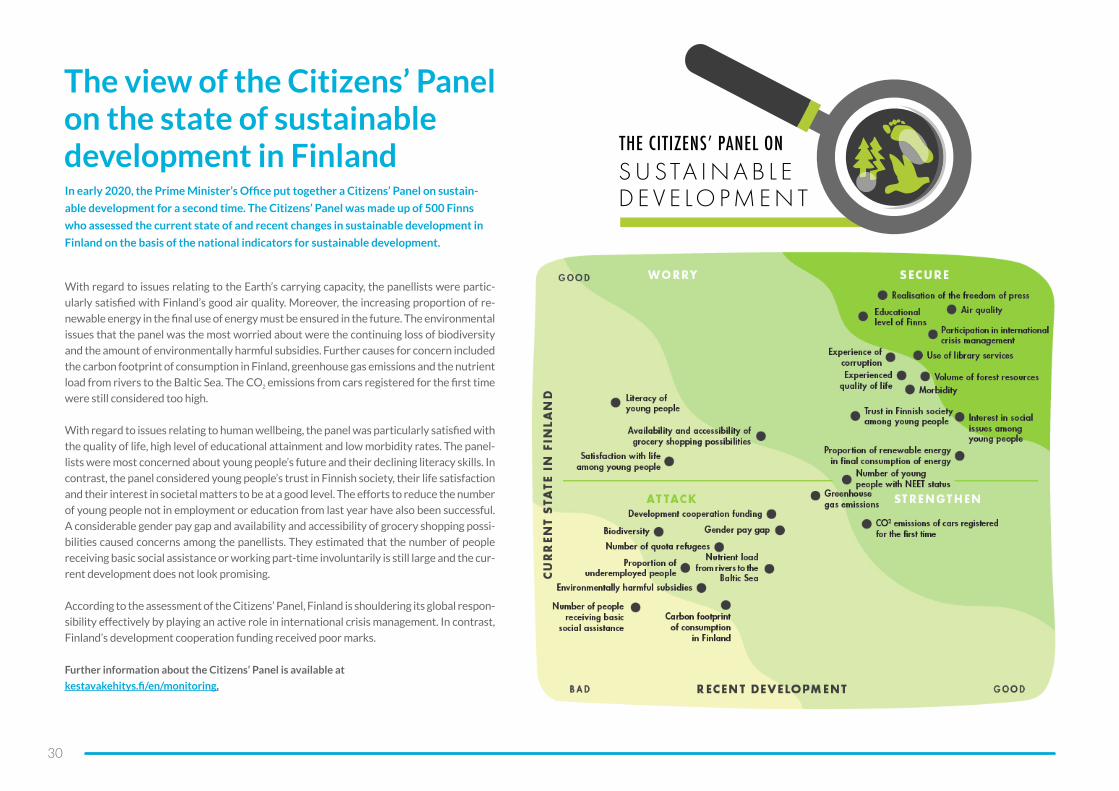
30
In early 2020, the Prime Minister’s Office put together a Citizens’ Panel on sustain-
able development for a second time. The Citizens’ Panel was made up of 500 Finns
who assessed the current state of and recent changes in sustainable development in
Finland on the basis of the national indicators for sustainable development.
With regard to issues relating to the Earth’s carrying capacity, the panellists were partic-
ularly satisfied with Finland’s good air quality. Moreover, the increasing proportion of re-
newable energy in the final use of energy must be ensured in the future. The environmental
issues that the panel was the most worried about were the continuing loss of biodiversity
and the amount of environmentally harmful subsidies. Further causes for concern included
the carbon footprint of consumption in Finland, greenhouse gas emissions and the nutrient
load from rivers to the Baltic Sea. The CO2 emissions from cars registered for the first time
were still considered too high.
With regard to issues relating to human wellbeing, the panel was particularly satisfied with
the quality of life, high level of educational attainment and low morbidity rates. The panel-
lists were most concerned about young people’s future and their declining literacy skills. In
contrast, the panel considered young people’s trust in Finnish society, their life satisfaction
and their interest in societal matters to be at a good level. The efforts to reduce the number
of young people not in employment or education from last year have also been successful.
A considerable gender pay gap and availability and accessibility of grocery shopping possi-
bilities caused concerns among the panellists. They estimated that the number of people
receiving basic social assistance or working part-time involuntarily is still large and the cur-
rent development does not look promising.
According to the assessment of the Citizens’ Panel, Finland is shouldering its global respon-
sibility effectively by playing an active role in international crisis management. In contrast,
Finland’s development cooperation funding received poor marks.
Further information about the Citizens’ Panel is available at
kestavakehitys.fi/en/monitoring.
The view of the Citizens’ Panel on the state of sustainable development in Finland S U STA I N A B L E
D E V E L O P M E N T
THE CITIZENS’ PANEL ON
31
Acknowledgements and sourcesThe content of this publication is largely based on articles published on the State of Sustainable Develop-
ment website. We would like to thank the national network of experts on sustainable development.
kestavakehitys.fi/en/monitoring
Center for Global DevelopmentCorporate Knights: The Global 100 indexDemos Helsinki: Work 2040 scenario reportEuropean Asylum Support Office (EASO): Annual Report on the Situation of Asylum in the European UnionEuropean Union Agency for Fundamental Rights (FRA)European Social SurveyEurostatFIBSFinland and the 2030 Agenda: A follow-up report by CSOsFinnish Environment Institute (SYKE)Finnish Environmental Organisation DodoFinnish Expert Panel for Sustainable DevelopmentFinnish Immigration ServiceFinnish Innovation Fund SitraFinnwatchGlobal Footprint NetworkHelsinki Term Bank for the Arts and SciencesHousing Finance and Development Centre of Finland (ARA)Institute for Health and Welfare (THL) Intergovernmental Panel on Climate Change (IPCC)Intergovernmental Science-Policy Platform on Biodiversity and Ecosystem Services (IPBES) reportKelaLiteracy Movement
Ministry of Agriculture and Forestry Ministry of Economic Affairs and Employment: Working Life BarometerMinistry of Education and Culture Ministry of the EnvironmentMinistry for Foreign AffairsMinistry of JusticeMinistry of Transport and CommunicationsNational Crime Victim SurveyNatural Resources Institute Finland (Luke)OECD (incl. PISA, Measuring Distance to the SDG Targets)PWC Corporate Social Responsibility BarometerReporters Without Borders (RSF)Statistics FinlandThe 2019 Red List of Finnish speciesThe Agenda 2030 Youth Group The State Youth Council: Youth BarometerTransparency InternationalThe Good Country IndexUNHCRUnited Nations (UN)WikipediaWorld Happiness Report 2018WWF: Living Planet 2018 report
32
PUBLISHED BY
Prime Minister’s Office
CONTACTS
General Secretariat
on Sustainable Development
Sami Pirkkala, Chief Specialist
kestavakehitys.fi/en/monitoring