Embed Size (px)
Citation preview
1
Town of Danvers, Massachusetts
Management Compensation and Classification Study
Final Report ● February 3, 2019
Submitted by:
Human Resources Services, Inc. 9 Bartlet Street, Suite 186
Andover, MA 01810 www.hrsconsultinginc.com
2
HRS Consultant Team
Aleksandra (Sandy) Stapczynski, President, Human Resources Services, Inc.
Served as Principal Consultant and Project Manager
Reginald (Buzz) Stapczynski, Senior Management Consultant, Human Resources Services, Inc.
Served as Senior Project Leader
Anthony Torrisi, Senior Management Consultant, Human Resources Services, Inc.
Served as Senior Consultant
Erin Bailey, Senior Management Consultant, Human Resources Services, Inc.
Served as Senior Consultant
3
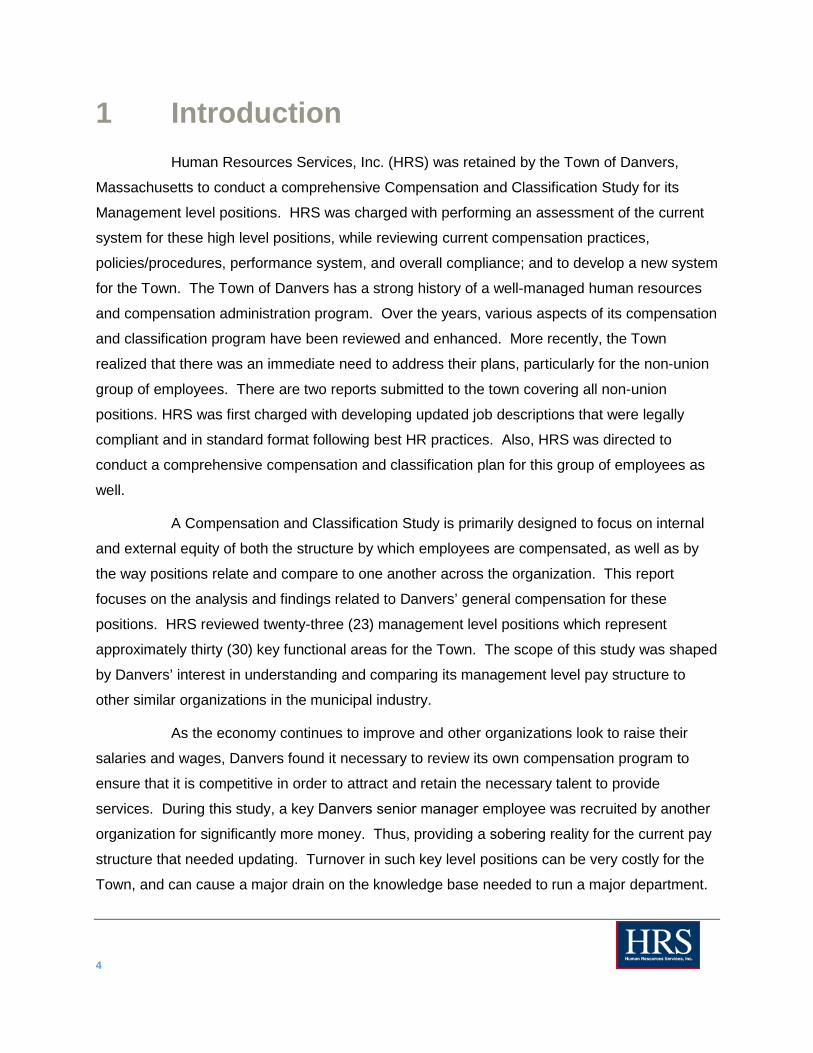
Table of Contents 1 Introduction ............................................................................................................ 4
2 Salary Survey and the Market Peers ...................................................................... 8
2.1 COMMUNICATION OF COMPENSATION ................................................................................................. 8
2.2 SELECTING BENCHMARK COMMUNITIES ............................................................................................. 9
3 The Compensation Plan ....................................................................................... 10
4 Job Descriptions ................................................................................................... 11
4.1 THE CLASSIFICATION PLAN .............................................................................................................. 12
4.2 PERFORMANCE SYSTEM .................................................................................................................. 13
4.3 SUCCESSION PLANNING .................................................................................................................. 14
5 Solutions and Administration ................................................................................ 15
6 Conclusion ........................................................................................................... 16
6.1 MEPA ............................................................................................................................................ 16
6.2 TOWN PHILOSOPHY ......................................................................................................................... 17
7 Stats, Data, New Plans............................... .......................................................... 18
4
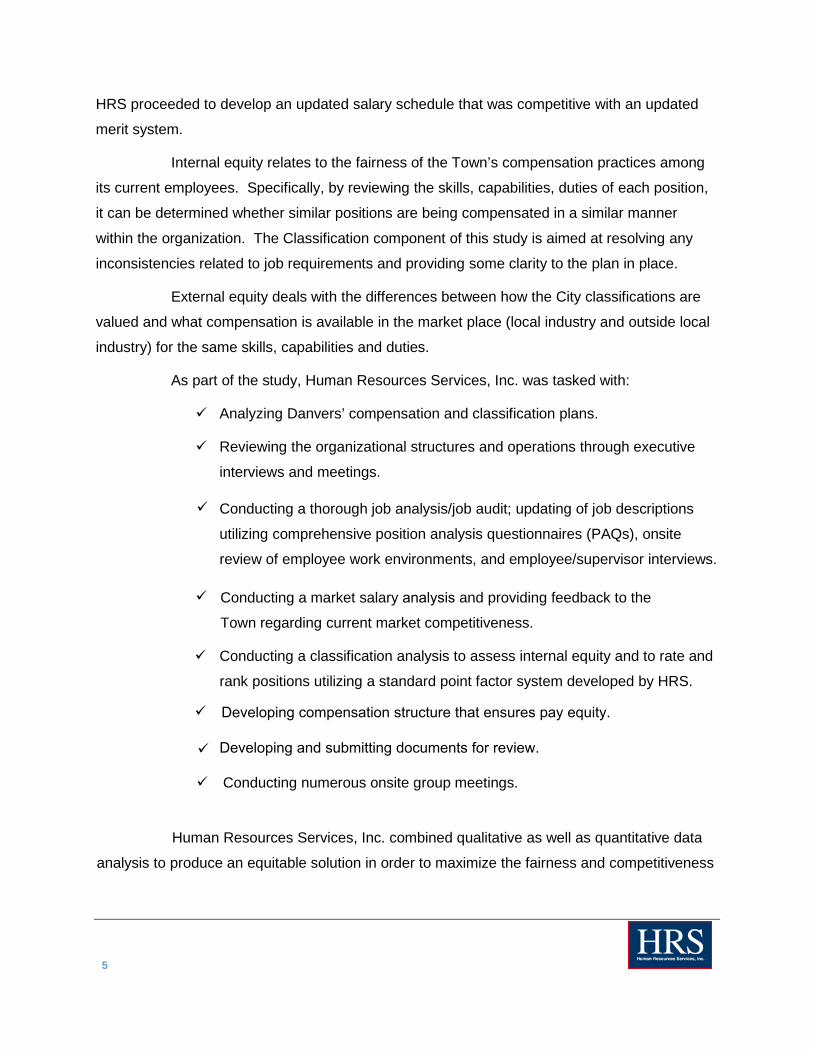
1 Introduction Human Resources Services, Inc. (HRS) was retained by the Town of Danvers,
Massachusetts to conduct a comprehensive Compensation and Classification Study for its
Management level positions. HRS was charged with performing an assessment of the current
system for these high level positions, while reviewing current compensation practices,
policies/procedures, performance system, and overall compliance; and to develop a new system
for the Town. The Town of Danvers has a strong history of a well-managed human resources
and compensation administration program. Over the years, various aspects of its compensation
and classification program have been reviewed and enhanced. More recently, the Town
realized that there was an immediate need to address their plans, particularly for the non-union
group of employees. There are two reports submitted to the town covering all non-union
positions. HRS was first charged with developing updated job descriptions that were legally
compliant and in standard format following best HR practices. Also, HRS was directed to
conduct a comprehensive compensation and classification plan for this group of employees as
well.
A Compensation and Classification Study is primarily designed to focus on internal
and external equity of both the structure by which employees are compensated, as well as by
the way positions relate and compare to one another across the organization. This report
focuses on the analysis and findings related to Danvers’ general compensation for these
positions. HRS reviewed twenty-three (23) management level positions which represent
approximately thirty (30) key functional areas for the Town. The scope of this study was shaped
by Danvers’ interest in understanding and comparing its management level pay structure to
other similar organizations in the municipal industry.
As the economy continues to improve and other organizations look to raise their
salaries and wages, Danvers found it necessary to review its own compensation program to
ensure that it is competitive in order to attract and retain the necessary talent to provide
services. During this study, a key Danvers senior manager employee was recruited by another
organization for significantly more money. Thus, providing a sobering reality for the current pay
structure that needed updating. Turnover in such key level positions can be very costly for the
Town, and can cause a major drain on the knowledge base needed to run a major department.
5
HRS proceeded to develop an updated salary schedule that was competitive with an updated
merit system.
Internal equity relates to the fairness of the Town’s compensation practices among
its current employees. Specifically, by reviewing the skills, capabilities, duties of each position,
it can be determined whether similar positions are being compensated in a similar manner
within the organization. The Classification component of this study is aimed at resolving any
inconsistencies related to job requirements and providing some clarity to the plan in place.
External equity deals with the differences between how the City classifications are
valued and what compensation is available in the market place (local industry and outside local
industry) for the same skills, capabilities and duties.
As part of the study, Human Resources Services, Inc. was tasked with:
Analyzing Danvers’ compensation and classification plans.
Reviewing the organizational structures and operations through executive
interviews and meetings.
Conducting a thorough job analysis/job audit; updating of job descriptions
utilizing comprehensive position analysis questionnaires (PAQs), onsite
review of employee work environments, and employee/supervisor interviews.
Conducting a market salary analysis and providing feedback to the
Town regarding current market competitiveness.
Conducting a classification analysis to assess internal equity and to rate and
rank positions utilizing a standard point factor system developed by HRS.
Developing and submitting documents for review.
Conducting numerous onsite group meetings.
Human Resources Services, Inc. combined qualitative as well as quantitative data
analysis to produce an equitable solution in order to maximize the fairness and competitiveness
Developing compensation structure that ensures pay equity.
6
of the Town’s compensation and classification structure and practices. Best practices were
followed and utilized throughout the duration of the project. The following activities took place.
Meetings with Human Resources Director, Finance Director, Town
Accountant, Town Manager and key project staff to discuss study issues and
requirements.
Orientation sessions with employees; several large orientations were
conducted to include employees, supervisors, department/division heads,
and HR staff. The orientation included discussion on the methodology,
purpose of the study, the process; it also included PAQ- job description
training and overview.
Interviews of employees by an HRS consultant in person. Also facilitation of
meetings onsite with key management officials.
Salary survey, compilation and analyses; statistical comparisons.
Comprehensive update of job descriptions based on employee PAQ
feedback and interviews and thorough review with HR and management.
Rating and ranking of positions.
Development of recommendations and implementation plan.
Creating draft and final reports. The consultant team combined all of the
above approaches and methods in developing this final reports.
During the interview and job analysis process, we learned a great deal about each
and every department within the Town of Danvers. The recommendations contained in this
report are comprehensive. The consultant team found overall most compensation practices to
be in general compliance, but in some areas HRS found that items, such as job descriptions,
were outdated. In a few instances FLSA status needed updating simply because the job duties
had changed over time. The compensation, classification and performance systems needed
updating and modernization. The recommendations in this report are an enhancement to those
many good systems and practices which are already in place and exist today in Danvers. It is
our understanding that the Town has implemented these plans as presented in our report.
7
HRS has developed the basic framework and organization of a sound compensation
and classification system. HRS has provided the Town with the needed tools to regularly
update its plans.
8
2 Salary Survey and the Market Peers To measure the pay rates amongst the Town’s municipal competitors for these
positions. Human Resources Services, Inc. distributed custom survey documents to
comparable municipalities jointly identified by the Town and HRS. Danvers is somewhat unique
because of its municipal light department, and also its hybrid job combination of duties. HRS
scanned similar type municipalities to ensure appropriate matches for pay rate comparisons.
The survey instrument was designed to collect information regarding specific components of
pay rates including minimum wages, maximum wages, and any unique characteristics about the
positions which would affect pay. Respondents were asked to provide information for those
jobs that represented a best match to their Town’s positions. As needed, follow-up calls were
made to the comparable communities. Sometimes it is difficult to find exact positions from other
comparable organizations. However, in general, if 70 percent of the duties and responsibilities
are the same, then the position is a good match for market analysis purposes. HRS also
utilized its own extensive databases of information such as the Economic Research Institute
(ERI) for state-wide municipal data, and the Department of Labor database, and other
professional surveys such as the Massachusetts Municipal Personnel Association (MMPA), and
the Municipal Electric Association of Massachusetts (MEAM) report, MA Retirement Board
Survey, and other municipal association surveys.
HRS conducted a broad salary survey and market analysis to determine the market
competitiveness for positions included in this study and to ensure correct industry matches.
HRS included survey responses from the municipalities listed below. Together these
communities offer a composite of similarities with regard to many factors that the consultants
had to consider for the Town of Danvers: Andover, Beverly, Billerica, Burlington, Canton,
Dedham, Lexington, North Andover, Norwood, Reading, Tewksbury, and Westwood.
2.1 Communication of Compensation In our experience, we find that communication can always be an issue and can
always be improved. HRS worked very diligently throughout the process to communicate the
communities selected and benchmarked, the custom survey instrument and the data results to
management employees and officials. Compensation can be difficult to understand, why one
9
data point was utilized and another was not; why there is more data for one position and less for
another. We did our best in the process to match positions to the market and to communicate
our factual findings. Our process was used consistently in the study across all positions.
Where little or no data was available, HRS relied on its rating system to place positions on the
classification plan. The Town’s HR Department will continue to communicate and interface with
departments as needed. Please remember that the data is a point in time and should be
regularly reviewed with the market at least every two - three years.
All of the comparative data is current salary information and included as
attachments to this report. HRS collected minimum and maximum salary ranges from the
comparable organizations. Certain wage data may have been annualized for comparison
purposes only. When looking at the attached market data, in each cell, the top number indicates
the minimum salary range for each position and the bottom number indicates the maximum
salary range for each position. Virtually every organization had some type of a compensation
and classification plan structure. HRS analyzed the average, range, 75th percentile, and
variables to Danvers.
For each position analyzed, data points were collected from the labor market. The
data points indicate the amount of salary information for each position surveyed. In some
instances: (1) the organization did not have a comparable position; or (2) the consultants
determined that the position was not comparable to the position in Danvers; or (3) the
information was not made available. HRS utilized professional discretionary judgment when
comparing positions to the comparable data. If there was less than two data points of salary
information for a position, HRS placed more emphasis on the position rating when placing the
position on the compensation and classification plan.
2.2 Selecting Benchmark Communities The communities were chosen based on a mix of these factors: form of government,
location, income per capital, operating budgets, population, and organizational structures. The
consultant team met with the Human Resources Director and Town Manager to review draft
plans and market data collected, and to discuss its meaning. A comparison was then made to
the Danvers salaries for the management positions.
10
3 The Compensation Plan In analyzing the competitiveness and usefulness of pay plans, HRS typically
reviews three components: (1) base pay structure, in terms of number of grades and range from
minimum to maximum for each grade; (2) employee turnover and ability to retain qualified
employees; and (3) employee progression through the ranges and placement of employees in
the ranges. All of the pay ranges, together with the compensation policies, are referred to as
the Compensation Plan. An assessment of the Town’s compensation plan included the ease of
administering the plan, the competitiveness of the pay scales, and the criteria used for
progressing through pay ranges.
The proposed compensation plan is attached to this report. The Consultants found
that the Town’s entry level for many of the grades on the pay structure were low as compared to
the market, in its totality. Therefore, it was necessary to increase the entire pay plan overall.
Realistically, employees would not be hired at these lower rates. Continuously hiring
employees beyond the grade mid-point is not a good practice either. Without increasing these
ranges, the Town may find it difficult recruiting and retaining key employees for the organization
at these lower rates. At the other end of the pay scale, it was discovered that many employees
were “maxed-out”, or falling at or near maximum grade range. Therefore, the ranges needed to
be adjusted to the market and to provide some job growth at the higher end. Comparative data
was considered to set the grade parameters. A new pay range was developed for each grade
utilizing the salary market data and targeting approximately the average of the market.
The proposed pay rates for this management group will also assist to reduce any
compression issues within the entire organization. A potential existed where lower level
positions were close to the levels of senior manager levels. The potential consequences from
compression of the pay could lead to poor morale amongst this group.
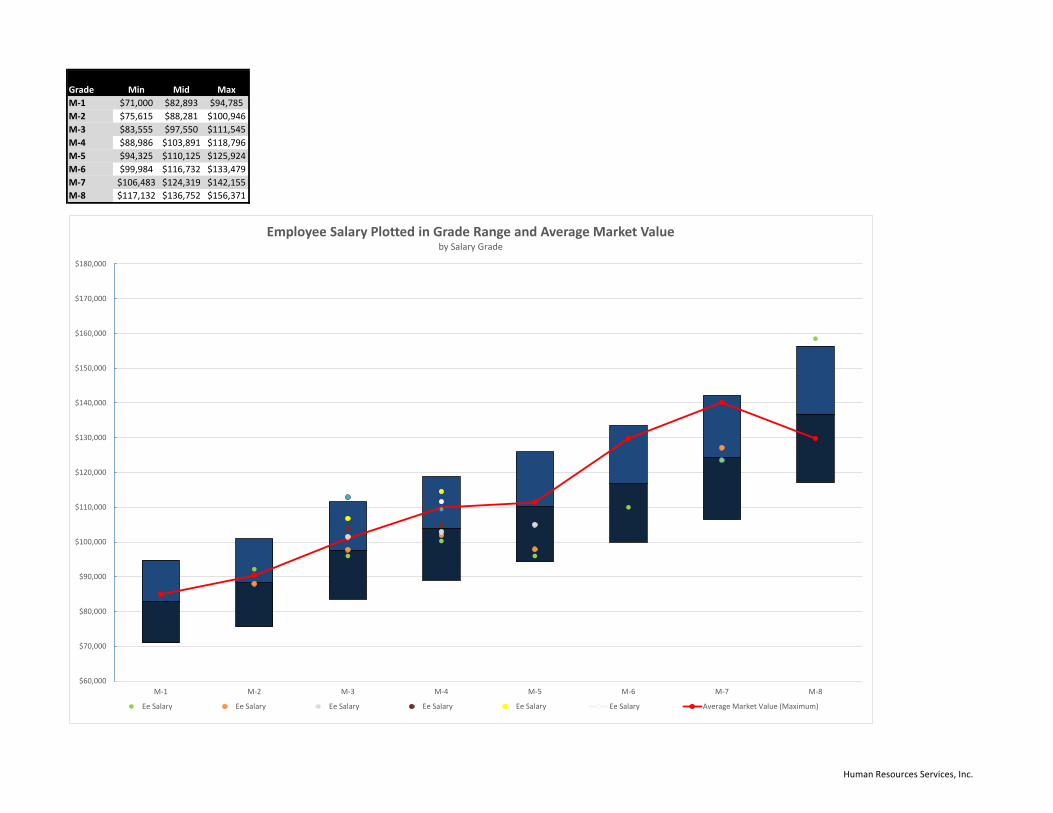
The proposed compensation plan is based on fiscal year 2019 market data. This is
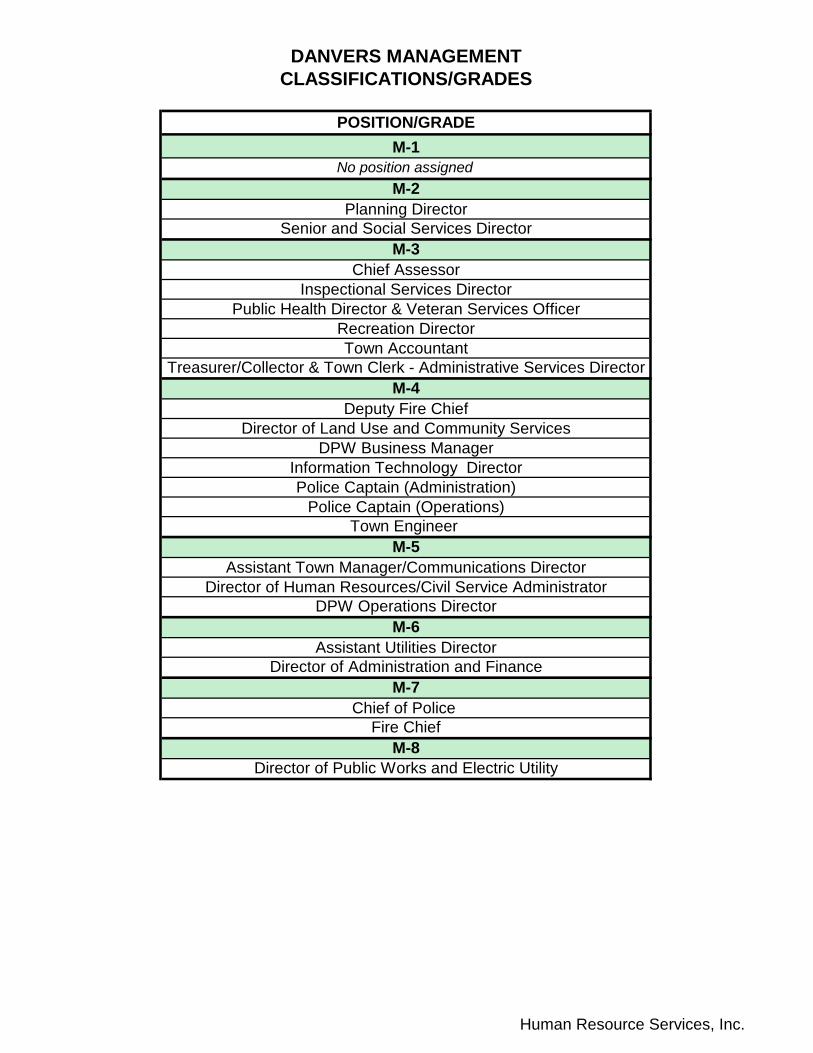
a base salary plan for FY-2019. There are eight (8) grades with approximately 34% pay spread
from minimum to maximum. The plan has been adopted and implemented with approval by the
Town Manager and Board of Selectmen. Attached please find the charts where the employees
are plotted within the plans based on longevity, merit and skill.

11
4 Job Descriptions The development of the new job descriptions was a major component of the study.
It was a multi-step process to ensure that all job descriptions were accurate with essential
functions, up-to-date, had the requisite requirements, and were ADA and FLSA compliant.
Through the job analysis process which included each employee completing a comprehensive
HRS Position Analysis questionnaire (PAQ), HRS discovered that many of the current job
descriptions needed significant updating. Based on employee feedback and
employee/supervisor comments on the PAQ tool, job descriptions were updated so as to better
reflect actual work performed and to streamline and standardize the formats. The HR
Department staff and the employees/supervisors further reviewed the job descriptions to ensure
accuracies. HRS edited descriptions based on commentary received from all parties. HRS’
proposed job descriptions are submitted to the Town as part of this final report. They are
submitted in electronic Word format only through a secure web portal for the Human Resource
Department, for ease in future maintenance and updating.
In addition to assisting with the development of job analysis and classifications,
good descriptions produce many other important benefits to the Town. These job descriptions
emphasize the purposes of each position and the types of results which each incumbent is
expected to produce. Representative examples of the work performed and the minimum
qualification requirements are listed. These job descriptions are small but important
components of more comprehensive personnel, organizational, and administrative systems or
plans. They can and should be used not only for recruitment and promotion, but as tools to
assist in the administration of the Town. They help define initial expectations, provide
fundamental building blocks for administering compensation systems, and give additional
definition to organization charts. They can and should be used when developing employee
objectives, performance plans and performance appraisals. The new job descriptions also
make reference to Danvers as an EEO/AA/Pay Equity employer.
The job descriptions presented to the Town are up-to-date and current, clear, and
identify the duties of each position, as well as the education, experience, training, knowledge,
ability, and skills, and competency levels required. Further they are now FLSA and ADA
compliant.
12
4.1 The Classification Plan Classification is the process of grouping individual positions into broader groupings
for personnel, budgeting, and other management purposes. The classification plan ties into the
salary schedule (compensation plan). The classification process conducted by HRS sorted the
work of individual positions based on type of work and then levels of responsibility, skill and
difficulty. The Town’s classification plan needed updating to continue to maintain its integrity.
Consolidation of positions and retitling of jobs were required in some cases in order to
modernize or appropriately name the position within the organization. Certain positions were
regrouped to make better internal equity alignments.
Additionally, the classification plan’s accompanying compensation plan has fallen out-
–of-sync with the market and needed updating to better reflect a competitive stand.
Consideration of the external market as well will benefit the organization in a number of ways. A
competitive pay structure will allow the Town to be an effective recruiter in the market place for
these senior manager level positions, contribute to a reduction in employee turnover, and set
the precedent to offer comparable bases salaries for positions.
Many of the senior managers provided the HRS team with issues specific to
individual classifications which were analyzed during the PAQ process. A couple of general
themes were consistent:
It was observed by some that job titles often did not reflect the actual work being
performed in the job and that job descriptions overall needed to be updated.
There was a strong concern that too many senior managers are wearing too
many hats; in other words there are many hybrid and uniquely organized
positions which are hard to match in other communities.
Many felt their salaries were low in general to the market, but felt fairly treated
with regard to compensation within the organization.
13
4.2 Performance System
HRS was asked to review and offer input for improvements and modernization of
the Town’s performance evaluation system. The Town has a long history of employing a pay-
for-performance system for these management level employees. The system they currently
utilize was originally developed in the late 1970s and continuously modernized over the many
years. This year the Town wanted to further streamline and simplyfy the system and change its
evaluation form and methods for reward. HRS provided input and suggestions to enhance the
Town’s current management performance evaluation system. HRS provided the Town with
general user guidelines and suggestions to improve the evaluation form; offering general overall
improvement to the system in Danvers. The performance guidelines were provided to the Town
in a separate document from this report. The Town’s current system for performance
management is completed for each employee by the Town Manager and employees receive
wage adjustments based on the outcome of their performance evaluation score. HRS has a
number of recommendations with regard to the newly updated system:
1. The system is imbalanced as it does not include a COLA to the salary schedule
structure in addition to the merit pay. The Town may wish to consider adding a
yearly cost-of-living adjustment to the salary schedule every year going forward.
How an employee moves through the pay ranges is based on performance
(wage adjustment), but the pay structure needs to be updated yearly to reflect
the general rise in goods and services (COLA adjustment). As an example an
employee may receive 2% merit increase and 1% COLA increase for a total of
3%.
2. There appears to be a lack of training for managers of the new system. More
training into the use of the tool would be helpful to improve the system.
Employees will also feel the consistency across the board in the administration of
the new tool if there is proper training.
.
14
4.3 Succession Planning The age of the workforce and growing retirement eligibility should be concerning for
Danvers, as it is for many public organizations today. It is not an emergency, but workforce
planning will assist with filling positions as the jobs turnover. Workforce and succession
planning need to become a collaborative effort with compensation management planning. A
formal succession plan and process will allow the Town to project retirements and prepare for
replacement of lost competencies and skills. The Town should identify future workload and
activities; analyze competencies and skill sets needed in the future workforce. This will assist
with recruitments, promotions, and transfers as they come up.
15
5 Solutions and Administration Throughout the study the HRS consultant team met with the Town staff to review the
market data collected and discuss its meaning and to review draft compensation and
classification plans. The consultants also had group meetings with the senior managers to
discuss the draft plans and all managers had an opportunity for input. Based on the information
received, some adjustments were made to the plans as deemed appropriate by HRS. It was
the Town’s desire to stay within its current administration program with pay ranges and no
steps. It was also their desire to have a performance system tied to pay, something that has a
long history in Danvers and works successfully. Further it was the Town’s desire to benchmark
to the average of the market. This system will continue to provide the Town with the most
flexibility. The recommendations for this compensation and classification plan is designed
based on the results of the previous phases within this study process and reflect best practices
and the desired market position the Town. Whenever possible, client input was received and
considered without compromising the objectivity of the study and analysis.
The Town should continue to use the average of the market for targeting pay
ranges. It will also assist in eliminating salary compression. Danvers is a major community on
the north shore in Massachusetts where at the minimum, the average salaries are required to
recruit and retain a qualified workforce.
Whenever a vacancy develops, it is a good time to automatically review the position.
This may involve a job analysis and updating the job description and reviewing the market for
the particular position. The tools provide to the Town will be helpful in conducting this type of
analysis.
16
6 Conclusion
In conclusion, through a comprehensive job analysis, the consultants reviewed each
position to see: what work was being done; how the work was being done; why the work was being done; and what knowledge, skills, and abilities were involved in doing the work. This was done for each position and was a very inclusive and labor intensive process.
Any compensation system will not meet a municipality’s needs if it does not have
strong administrative support. Throughout the study the town officials were very engaged and
supportive of the process and as a result, the Town has a positive outcome from this study.
However, recommendations are derived from data for a fixed period of time. In other words,
compensation plans have definitive shelf lives, after which, they will no longer compete with the
market and cause recruitment and retention strain for the Town over time. Without proper
maintenance, the compensation structure will lose its effectiveness and market competitiveness
over a period of time. We recommend regular benchmarking to the external market, at least
every two years. We also recommend that the entire plan be reviewed again in five years.
The Town should be proud of Lisa Crowley, Human Resources Director and her
staff, and the Steve Bartha, Town Manager and his staff for their commitment to making this a
smooth and efficient process.
6.1 MEPA On July 2, 2018 Massachusetts implemented its new pay equity law. The
Massachusetts Equal Pay Act (MEPA) generally provides that “No employer shall discriminate
in any way on the basis of gender in the payment of wages, or pay any person in its employ a
salary or wage rate less than the rates paid to its employees of a different gender for
comparable work.” The law defines “comparable work” as work that requires substantially
similar skill, effort, and responsibility, and is performed under similar working conditions. M.G.L.
c. 149, § 105A (“MEPA”). The Town has taken the right steps to ensure pay equity by
commissioning this study to conduct job analysis/job audits for all positions, ensure job
descriptions are updated and compliant with FLSA, and to ensure that there is pay equity
throughout the organization.
17
6.2 Town Philosophy The Town of Danvers has developed a state-of-the-art mission/philosophy that
we have included on all job descriptions and is on the performance system too. We would like
to end by stating it here again.
“Must be fully committed to providing service excellence to every person who visits, works, or resides in the Town of Danvers by embodying the organization’s five core values: inclusion, integrity, accountability, positivity, and collaboration.”
The Town of Danvers is dedicated to high-quality service and continuous
improvements. HRS found that all employees at all levels were committed to their jobs and
to the Town, and also committed to maintaining a positive working environment. It is
commendable that the Town strives to reward their service.
18
7 Stats, Data, and New Plans The following pages are the details from our analysis including the compensation
and classification plan.
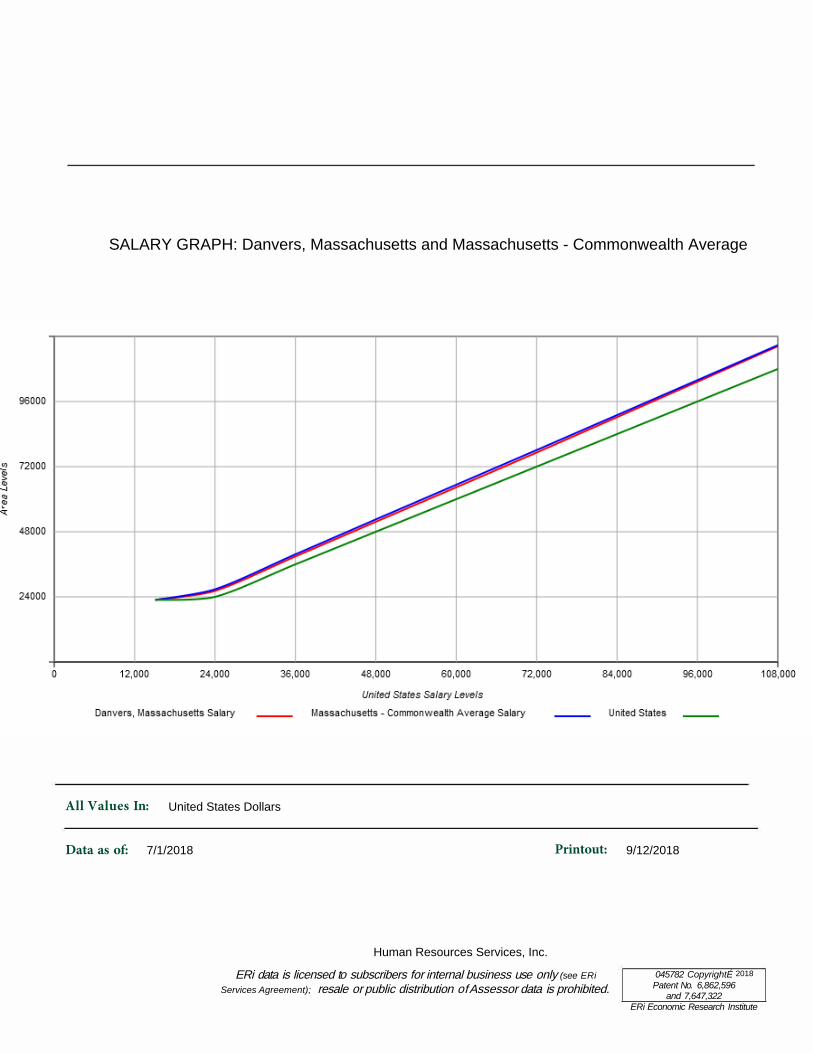
All Values In:
Data as of: Printout:
ERi data is licensed to subscribers for internal business use only (see ERi Services Agreement); resale or public distribution of Assessor data is prohibited.
045782 Copyright© Patent No. 6,862,596
and 7,647,322 ERi Economic Research Institute
SALARY GRAPH: Danvers, Massachusetts and Massachusetts - Commonwealth Average
United States Dollars
7/1/2018 9/12/2018
Human Resources Services, Inc.
2018
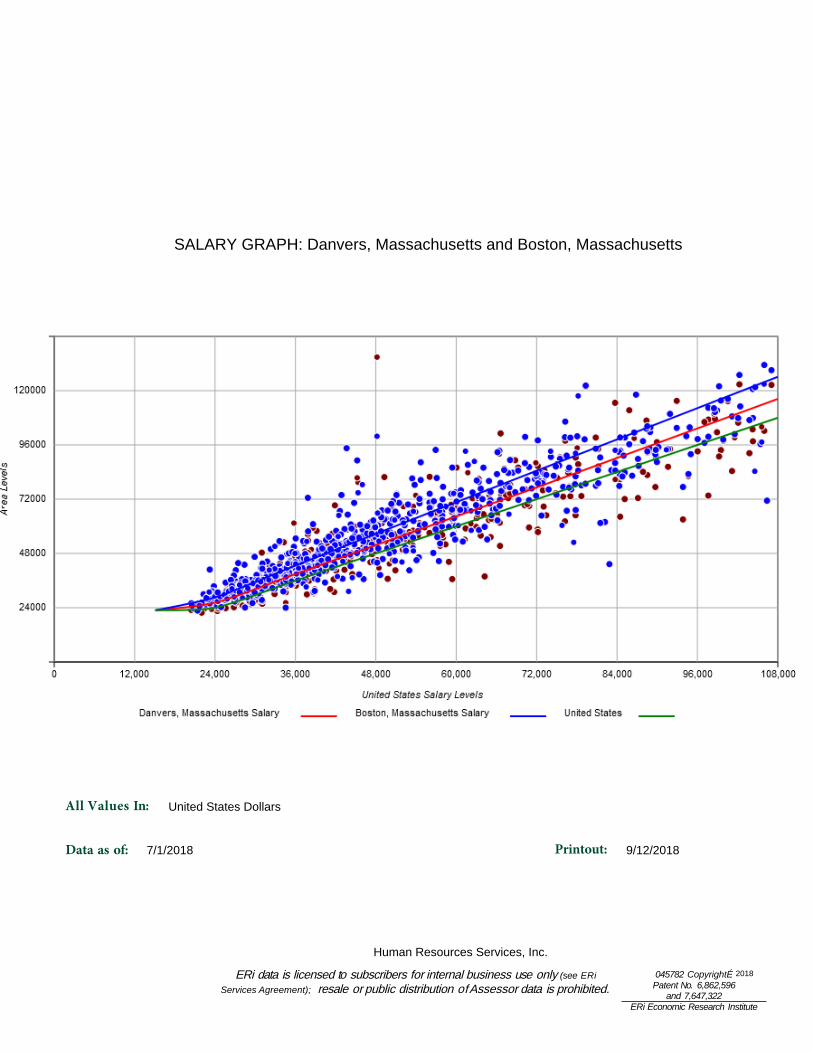
All Values In:
Data as of: Printout:
ERi data is licensed to subscribers for internal business use only (see ERi Services Agreement); resale or public distribution of Assessor data is prohibited.
045782 Copyright© Patent No. 6,862,596
and 7,647,322 ERi Economic Research Institute
SALARY GRAPH: Danvers, Massachusetts and Boston, Massachusetts
United States Dollars
7/1/2018 9/12/2018
Human Resources Services, Inc.
2018
Human Resources Services, Inc.
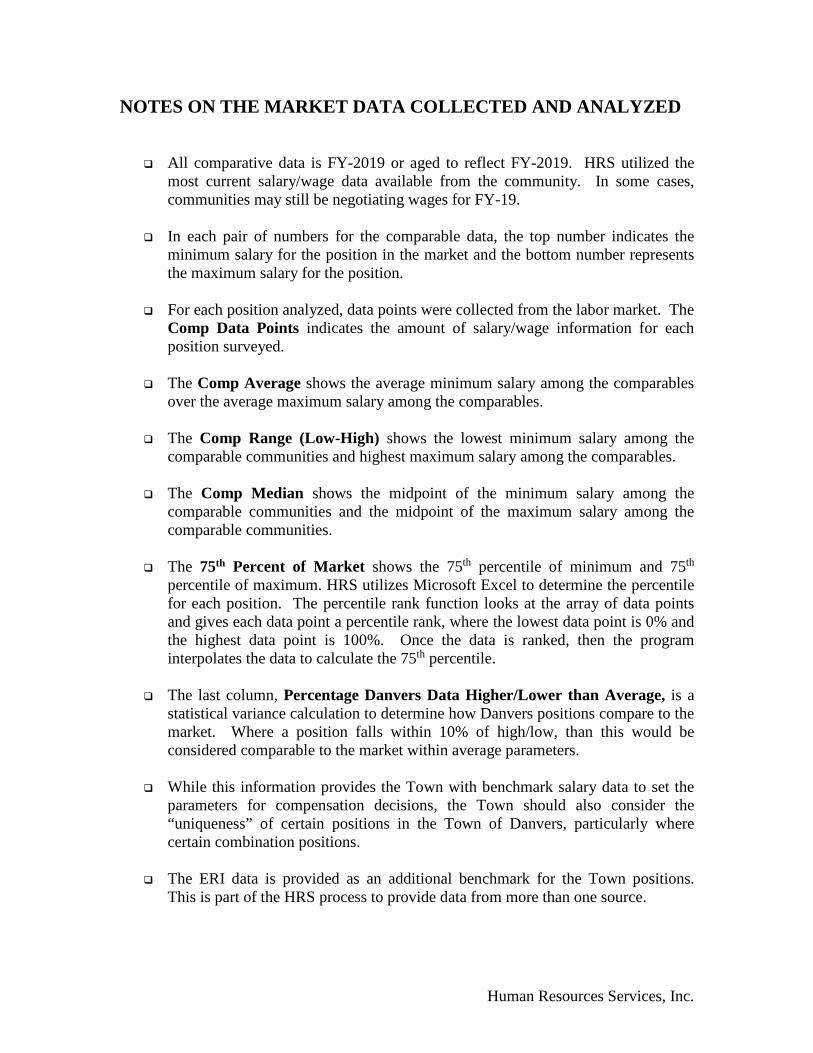
NOTES ON THE MARKET DATA COLLECTED AND ANALYZED
All comparative data is FY-2019 or aged to reflect FY-2019. HRS utilized themost current salary/wage data available from the community. In some cases,communities may still be negotiating wages for FY-19.
In each pair of numbers for the comparable data, the top number indicates theminimum salary for the position in the market and the bottom number representsthe maximum salary for the position.
For each position analyzed, data points were collected from the labor market. TheComp Data Points indicates the amount of salary/wage information for eachposition surveyed.
The Comp Average shows the average minimum salary among the comparablesover the average maximum salary among the comparables.
The Comp Range (Low-High) shows the lowest minimum salary among thecomparable communities and highest maximum salary among the comparables.
The Comp Median shows the midpoint of the minimum salary among thecomparable communities and the midpoint of the maximum salary among thecomparable communities.
The 75th Percent of Market shows the 75th percentile of minimum and 75th
percentile of maximum. HRS utilizes Microsoft Excel to determine the percentilefor each position. The percentile rank function looks at the array of data pointsand gives each data point a percentile rank, where the lowest data point is 0% andthe highest data point is 100%. Once the data is ranked, then the programinterpolates the data to calculate the 75th percentile.
The last column, Percentage Danvers Data Higher/Lower than Average, is astatistical variance calculation to determine how Danvers positions compare to themarket. Where a position falls within 10% of high/low, than this would beconsidered comparable to the market within average parameters.
While this information provides the Town with benchmark salary data to set theparameters for compensation decisions, the Town should also consider the“uniqueness” of certain positions in the Town of Danvers, particularly wherecertain combination positions.
The ERI data is provided as an additional benchmark for the Town positions.This is part of the HRS process to provide data from more than one source.
Human Resource Services, Inc.
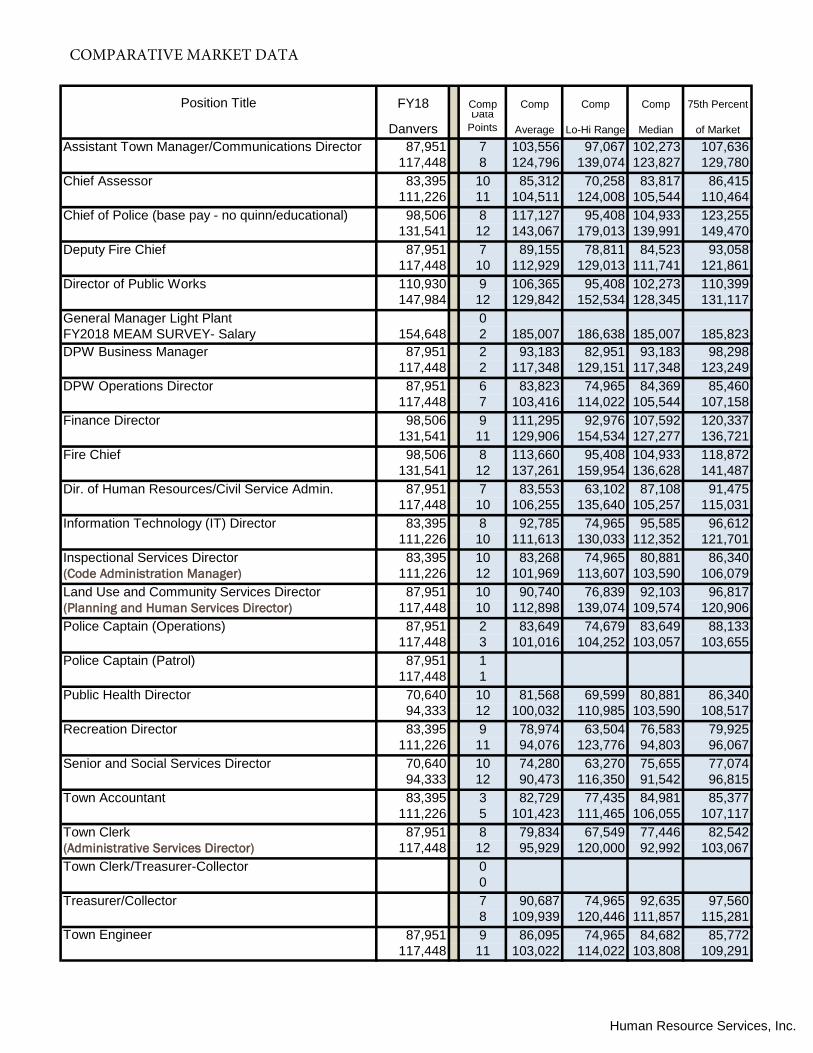
Position Title FY18 Comp Comp Comp Comp 75th Percent
DanversData
Points Average Lo-Hi Range Median of MarketAssistant Town Manager/Communications Director 87,951 7 103,556 97,067 102,273 107,636
117,448 8 124,796 139,074 123,827 129,780Chief Assessor 83,395 10 85,312 70,258 83,817 86,415
111,226 11 104,511 124,008 105,544 110,464Chief of Police (base pay - no quinn/educational) 98,506 8 117,127 95,408 104,933 123,255
131,541 12 143,067 179,013 139,991 149,470Deputy Fire Chief 87,951 7 89,155 78,811 84,523 93,058
117,448 10 112,929 129,013 111,741 121,861Director of Public Works 110,930 9 106,365 95,408 102,273 110,399
147,984 12 129,842 152,534 128,345 131,117General Manager Light Plant 0FY2018 MEAM SURVEY- Salary 154,648 2 185,007 186,638 185,007 185,823DPW Business Manager 87,951 2 93,183 82,951 93,183 98,298
117,448 2 117,348 129,151 117,348 123,249DPW Operations Director 87,951 6 83,823 74,965 84,369 85,460
117,448 7 103,416 114,022 105,544 107,158Finance Director 98,506 9 111,295 92,976 107,592 120,337
131,541 11 129,906 154,534 127,277 136,721Fire Chief 98,506 8 113,660 95,408 104,933 118,872
131,541 12 137,261 159,954 136,628 141,487Dir. of Human Resources/Civil Service Admin. 87,951 7 83,553 63,102 87,108 91,475
117,448 10 106,255 135,640 105,257 115,031Information Technology (IT) Director 83,395 8 92,785 74,965 95,585 96,612
111,226 10 111,613 130,033 112,352 121,701Inspectional Services Director 83,395 10 83,268 74,965 80,881 86,340(Code Administration Manager) 111,226 12 101,969 113,607 103,590 106,079Land Use and Community Services Director 87,951 10 90,740 76,839 92,103 96,817(Planning and Human Services Director) 117,448 10 112,898 139,074 109,574 120,906Police Captain (Operations) 87,951 2 83,649 74,679 83,649 88,133
117,448 3 101,016 104,252 103,057 103,655Police Captain (Patrol) 87,951 1
117,448 1Public Health Director 70,640 10 81,568 69,599 80,881 86,340
94,333 12 100,032 110,985 103,590 108,517Recreation Director 83,395 9 78,974 63,504 76,583 79,925
111,226 11 94,076 123,776 94,803 96,067Senior and Social Services Director 70,640 10 74,280 63,270 75,655 77,074
94,333 12 90,473 116,350 91,542 96,815Town Accountant 83,395 3 82,729 77,435 84,981 85,377
111,226 5 101,423 111,465 106,055 107,117Town Clerk 87,951 8 79,834 67,549 77,446 82,542(Administrative Services Director) 117,448 12 95,929 120,000 92,992 103,067Town Clerk/Treasurer-Collector 0
0Treasurer/Collector 7 90,687 74,965 92,635 97,560
8 109,939 120,446 111,857 115,281Town Engineer 87,951 9 86,095 74,965 84,682 85,772
117,448 11 103,022 114,022 103,808 109,291
COMPARATIVE MARKET DATA
Human Resource Services, Inc.
DANVERS MANAGEMENTCLASSIFICATIONS/GRADES
POSITION/GRADEM-1
No position assignedM-2
Planning DirectorSenior and Social Services Director
M-3Chief Assessor
Inspectional Services DirectorPublic Health Director & Veteran Services Officer
Recreation DirectorTown Accountant
Treasurer/Collector & Town Clerk - Administrative Services DirectorM-4
Deputy Fire ChiefDirector of Land Use and Community Services
DPW Business ManagerInformation Technology DirectorPolice Captain (Administration)
Police Captain (Operations)Town Engineer
M-5Assistant Town Manager/Communications Director
Director of Human Resources/Civil Service AdministratorDPW Operations Director
M-6Assistant Utilities Director
Director of Administration and FinanceM-7
Chief of Police Fire Chief
M-8Director of Public Works and Electric Utility
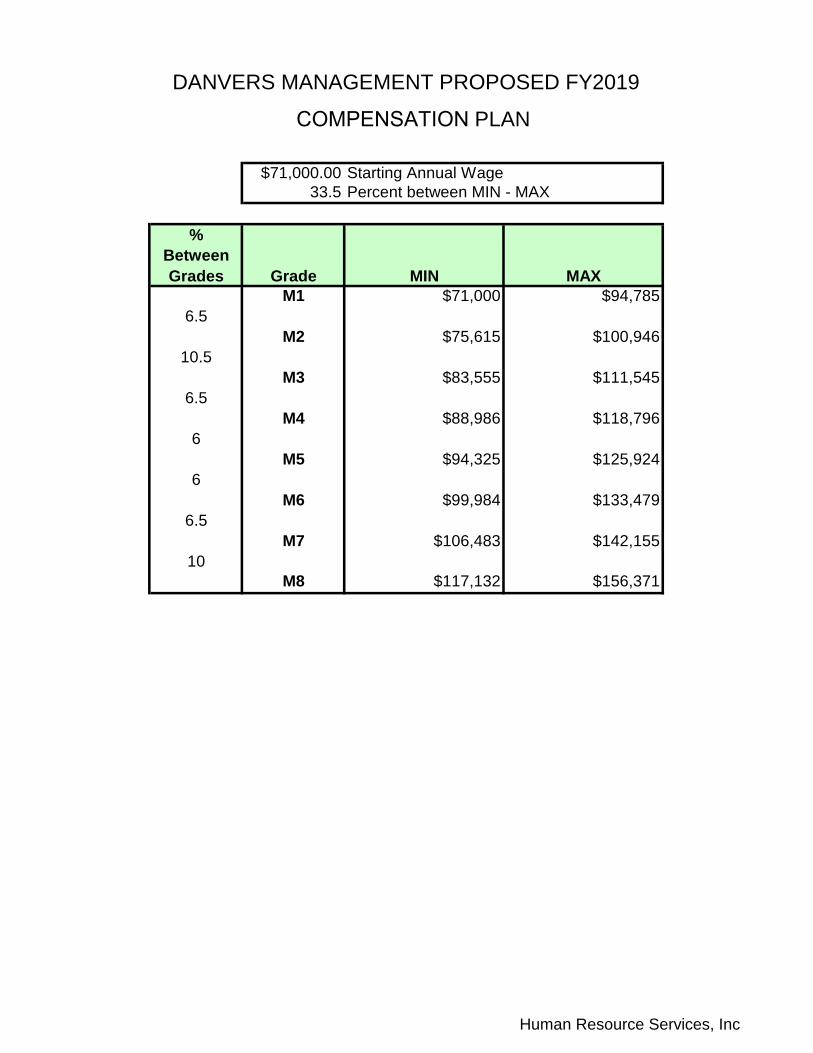
DANVERS MANAGEMENT PROPOSED FY2019
COMPENSATION PLAN
Human Resource Services, Inc
$71,000.00 Starting Annual Wage33.5 Percent between MIN - MAX
%BetweenGrades Grade MIN MAX
M1 $71,000 $94,7856.5
M2 $75,615 $100,94610.5
M3 $83,555 $111,5456.5
M4 $88,986 $118,7966
M5 $94,325 $125,9246
M6 $99,984 $133,4796.5
M7 $106,483 $142,15510
M8 $117,132 $156,371
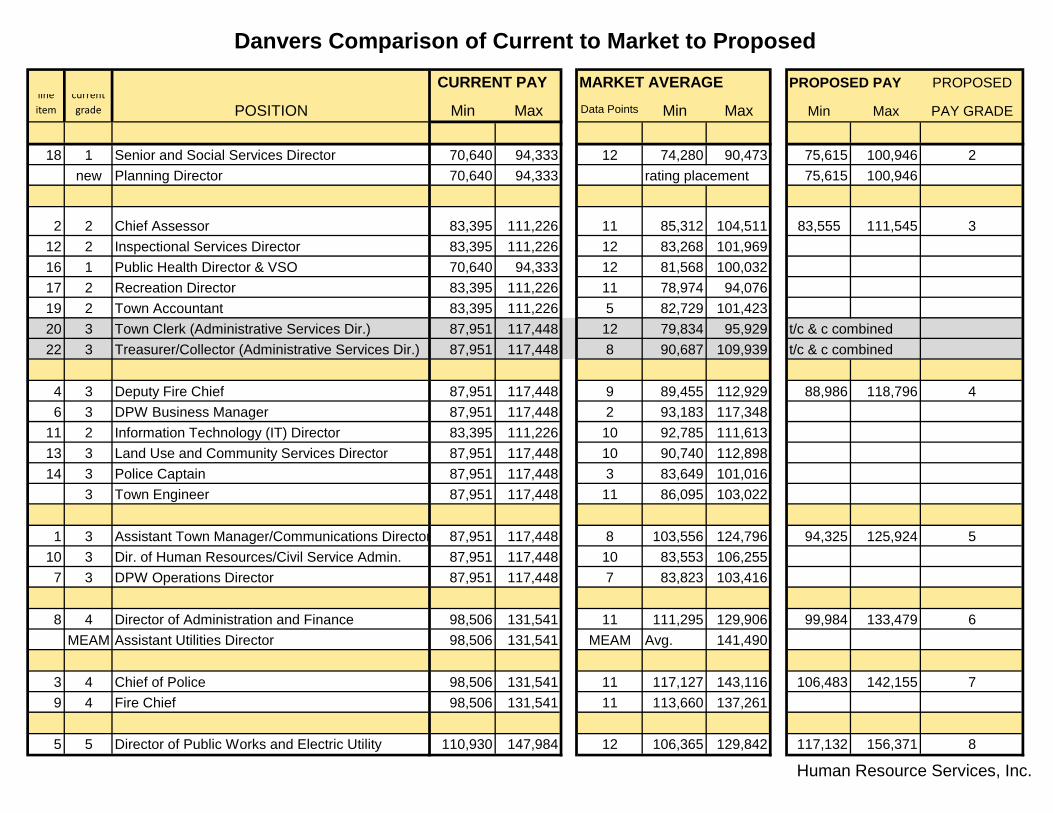
Danvers Comparison of Current to Market to Proposed
Human Resource Services, Inc.
CURRENT PAY MARKET AVERAGE PROPOSED PAY PROPOSEDlineitem
current grade POSITION Min Max Data Points Min Max Min Max PAY GRADE
18 1 Senior and Social Services Director 70,640 94,333 12 74,280 90,473 75,615 100,946 2new Planning Director 70,640 94,333 rating placement 75,615 100,946
2 2 Chief Assessor 83,395 111,226 11 85,312 104,511 83,555 111,545 312 2 Inspectional Services Director 83,395 111,226 12 83,268 101,96916 1 Public Health Director & VSO 70,640 94,333 12 81,568 100,03217 2 Recreation Director 83,395 111,226 11 78,974 94,07619 2 Town Accountant 83,395 111,226 5 82,729 101,42320 3 Town Clerk (Administrative Services Dir.) 87,951 117,448 12 79,834 95,929 t/c & c combined22 3 Treasurer/Collector (Administrative Services Dir.) 87,951 117,448 8 90,687 109,939 t/c & c combined
4 3 Deputy Fire Chief 87,951 117,448 9 89,455 112,929 88,986 118,796 46 3 DPW Business Manager 87,951 117,448 2 93,183 117,348
11 2 Information Technology (IT) Director 83,395 111,226 10 92,785 111,61313 3 Land Use and Community Services Director 87,951 117,448 10 90,740 112,89814 3 Police Captain 87,951 117,448 3 83,649 101,016
3 Town Engineer 87,951 117,448 11 86,095 103,022
1 3 Assistant Town Manager/Communications Director 87,951 117,448 8 103,556 124,796 94,325 125,924 510 3 Dir. of Human Resources/Civil Service Admin. 87,951 117,448 10 83,553 106,255
7 3 DPW Operations Director 87,951 117,448 7 83,823 103,416
8 4 Director of Administration and Finance 98,506 131,541 11 111,295 129,906 99,984 133,479 6MEAM Assistant Utilities Director 98,506 131,541 MEAM Avg. 141,490
3 4 Chief of Police 98,506 131,541 11 117,127 143,116 106,483 142,155 79 4 Fire Chief 98,506 131,541 11 113,660 137,261
5 5 Director of Public Works and Electric Utility 110,930 147,984 12 106,365 129,842 117,132 156,371 8
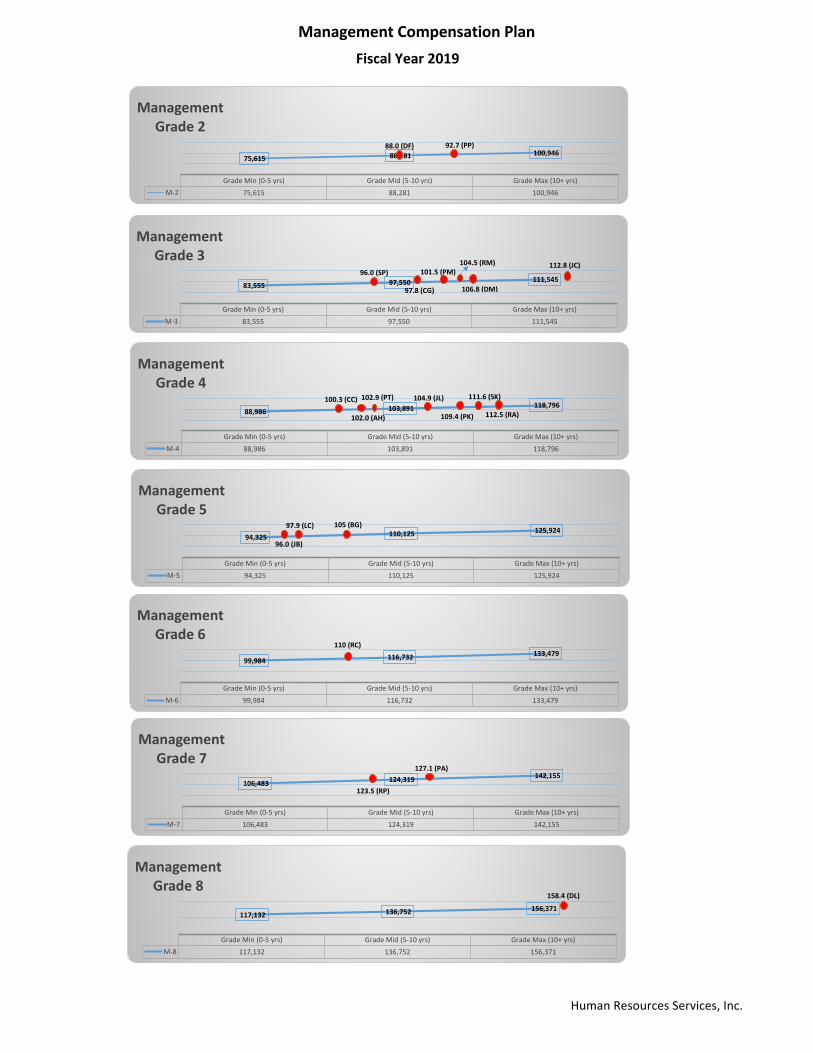
Management Compensation PlanFiscal Year 2019
Human Resources Services, Inc.
Grade Min (0-5 yrs) Grade Mid (5-10 yrs) Grade Max (10+ yrs)M-2 75,615 88,281 100,946
75,615 88,281 100,946
ManagementGrade 2
Grade Min (0-5 yrs) Grade Mid (5-10 yrs) Grade Max (10+ yrs)M-3 83,555 97,550 111,545
83,555 97,550 111,545
ManagementGrade 3
Grade Min (0-5 yrs) Grade Mid (5-10 yrs) Grade Max (10+ yrs)M-4 88,986 103,891 118,796
88,986 103,891 118,796
ManagementGrade 4
Grade Min (0-5 yrs) Grade Mid (5-10 yrs) Grade Max (10+ yrs)M-5 94,325 110,125 125,924
94,325 110,125 125,924
ManagementGrade 5
Grade Min (0-5 yrs) Grade Mid (5-10 yrs) Grade Max (10+ yrs)M-6 99,984 116,732 133,479
99,984 116,732 133,479
ManagementGrade 6
Grade Min (0-5 yrs) Grade Mid (5-10 yrs) Grade Max (10+ yrs)M-7 106,483 124,319 142,155
106,483 124,319 142,155
ManagementGrade 7
Grade Min (0-5 yrs) Grade Mid (5-10 yrs) Grade Max (10+ yrs)M-8 117,132 136,752 156,371
117,132 136,752 156,371
ManagementGrade 8
92.7 (PP)
96.0 (SP)
97.8 (CG)
101.5 (PM)104.5 (RM)
106.8 (DM)
112.8 (JC)
100.3 (CC)
102.0 (AH)
102.9 (PT) 104.9 (JL)
97.9 (LC)
111.6 (SK)
109.4 (PK)
96.0 (JB)
105 (BG)
123.5 (RP)
127.1 (PA)
112.5 (RA)
110 (RC)
158.4 (DL)
88.0 (DF)
Human Resources Services, Inc.
Grade Min Mid MaxM-1 $71,000 $82,893 $94,785M-2 $75,615 $88,281 $100,946M-3 $83,555 $97,550 $111,545M-4 $88,986 $103,891 $118,796M-5 $94,325 $110,125 $125,924M-6 $99,984 $116,732 $133,479M-7 $106,483 $124,319 $142,155M-8 $117,132 $136,752 $156,371
$60,000
$70,000
$80,000
$90,000
$100,000
$110,000
$120,000
$130,000
$140,000
$150,000
$160,000
$170,000
$180,000
M-1 M-2 M-3 M-4 M-5 M-6 M-7 M-8
Employee Salary Plotted in Grade Range and Average Market Valueby Salary Grade
Ee Salary Ee Salary Ee Salary Ee Salary Ee Salary Ee Salary Average Market Value (Maximum)
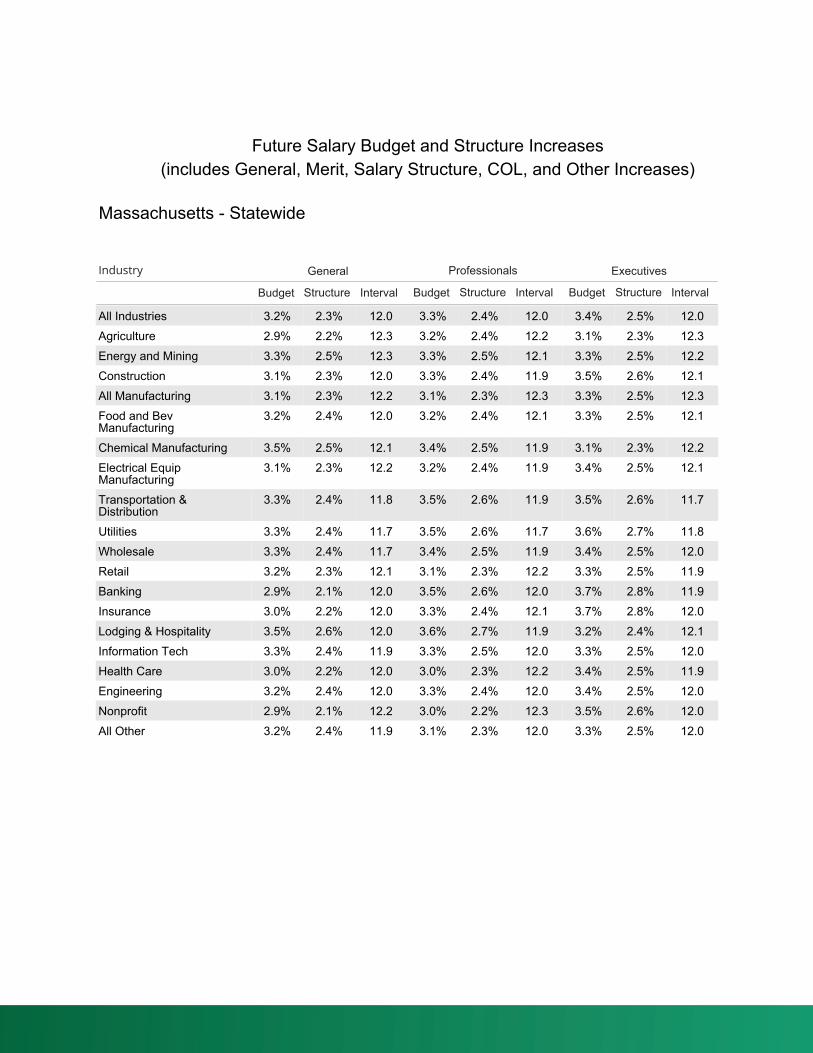
Industry ProfessionalsGeneral Executives
Budget Structure Interval Budget Structure Interval Budget Structure Interval
Future Salary Budget and Structure Increases(includes General, Merit, Salary Structure, COL, and Other Increases)
Massachusetts - Statewide
All Industries 3.2% 2.3% 12.0 3.3% 2.4% 12.0 3.4% 2.5% 12.0Agriculture 2.9% 2.2% 12.3 3.2% 2.4% 12.2 3.1% 2.3% 12.3Energy and Mining 3.3% 2.5% 12.3 3.3% 2.5% 12.1 3.3% 2.5% 12.2Construction 3.1% 2.3% 12.0 3.3% 2.4% 11.9 3.5% 2.6% 12.1All Manufacturing 3.1% 2.3% 12.2 3.1% 2.3% 12.3 3.3% 2.5% 12.3Food and BevManufacturing
3.2% 2.4% 12.0 3.2% 2.4% 12.1 3.3% 2.5% 12.1
Chemical Manufacturing 3.5% 2.5% 12.1 3.4% 2.5% 11.9 3.1% 2.3% 12.2Electrical EquipManufacturing
3.1% 2.3% 12.2 3.2% 2.4% 11.9 3.4% 2.5% 12.1
Transportation &Distribution
3.3% 2.4% 11.8 3.5% 2.6% 11.9 3.5% 2.6% 11.7
Utilities 3.3% 2.4% 11.7 3.5% 2.6% 11.7 3.6% 2.7% 11.8Wholesale 3.3% 2.4% 11.7 3.4% 2.5% 11.9 3.4% 2.5% 12.0Retail 3.2% 2.3% 12.1 3.1% 2.3% 12.2 3.3% 2.5% 11.9Banking 2.9% 2.1% 12.0 3.5% 2.6% 12.0 3.7% 2.8% 11.9Insurance 3.0% 2.2% 12.0 3.3% 2.4% 12.1 3.7% 2.8% 12.0Lodging & Hospitality 3.5% 2.6% 12.0 3.6% 2.7% 11.9 3.2% 2.4% 12.1Information Tech 3.3% 2.4% 11.9 3.3% 2.5% 12.0 3.3% 2.5% 12.0Health Care 3.0% 2.2% 12.0 3.0% 2.3% 12.2 3.4% 2.5% 11.9Engineering 3.2% 2.4% 12.0 3.3% 2.4% 12.0 3.4% 2.5% 12.0Nonprofit 2.9% 2.1% 12.2 3.0% 2.2% 12.3 3.5% 2.6% 12.0All Other 3.2% 2.4% 11.9 3.1% 2.3% 12.0 3.3% 2.5% 12.0