Embed Size (px)
Citation preview

TOWN OF PORT HEDLAND
MONTHLY STATEMENT OF FINANCIAL ACTIVITY
FOR THE PERIOD ENDED 30 November 2015
TABLE OF CONTENTS
ITEM PAGE No.Statements of Financial Activity 2-4
Bank Reconciliation 5
Investments 6-8
Borrowings 9-10
Reserves 11-12
Grants Register 13-15
Rates 16
Sundry Debtors 17-19
Capital Works Program 20-26
Road Program 27
Attachment 2 to Item 13.1 Statement of Financial Activity for the period ended 30 November 2015

Adopted Budget Current Budget YTD Budget YTD Actuals
$000's $000's $000's $000's % $000's
Operating Revenue
Rates 25,621 25,676 25,414 25,227 ‐1% 187
Operating Grants, Subsidies and Contributions 3,391 3,614 1,506 997 ‐34% 509
Fees & Charges 29,059 28,885 13,711 12,410 ‐9% 1,301
Service Charges 0 0 0 0 0% 0
Interest Earnings 2,210 2,212 922 482 ‐48% 440
Other Revenue 9,870 9,869 4,138 2,494 ‐40% 1,644
Total Operating Revenue 70,149 70,256 45,691 41,609 ‐9% 4,081
Operating Expenditure
Employee Costs (21,112) (21,137) (9,170) (8,884) ‐3% ‐286
Materials & Contracts (25,836) (26,908) (11,211) (8,416) ‐25% ‐2,794
Utility Charges (3,682) (4,050) (1,688) (1,362) ‐19% ‐325
Depreciation (14,462) (16,049) (6,687) 0 ‐100% ‐6,687
Interest Expense (1,557) (1,557) (649) (121) ‐81% ‐528
Insurance Expense (1,340) (1,340) (1,340) (1,385) 3% 45
Other Expenditure (1,711) (1,711) (713) (635) ‐11% ‐77
Total Operating Expenditure (69,700) (72,751) (31,457) (20,804) ‐34% ‐10,652
Operating Surplus/(Deficit) 450 ‐2,495 14,234 20,805 46% ‐6,571
Add Back Non Cash Items
Depreciation 14,462 16,049 6,687 0 ‐100% 6,687
(Profit )/ Loss on Disposal of Assets 31 31 13 0 ‐100% 13
Capital Expenditure and Revenue
Acquisition of Infrastructure, Property, Plant and Equipment (38,849) (39,507) (16,461) (5,774) ‐65% ‐10,687
Proceeds from Disposal of Assets 4,984 4,984 2,077 640 ‐69% 1,436
Capital Grants and Contributions for the Development of Assets 4,258 4,801 2,000 747 ‐63% 1,253
New Loan Borrowings 5,322 5,322 0 0 0% 0
Proceeds from Self Supporting Loans 92 92 38 42 9% ‐3
Transfers from Reserves 16,043 13,945 5,810 241 ‐96% 5,569
Loan Principal Repayments (1,156) (1,156) (482) (388) ‐19% ‐93
Transfers to Reserves (6,627) (5,528) (2,304) (2,864) 24% 560
Municipal Surplus / (Deficit) Carried Forward 1 July 2015 2,950 5,066 5,066
Municipal Surplus / (Deficit) Brought Forward 30 June 2016 1,960 1,604 18,515
Sum of Total Budget (15,484) (19,542)
‐ 201516/078 Increase the transfer to the Asset Management Reserve from $1.05m to $3.166m
‐ 201516/067 Reduce the transfer to Waste Reserves by $450,000 and include a budget for $450,000 for the Tyre Disposal Service.
The current budget is a reflection of the adopted September Quarter Budget Review and the below variations made to the budget which were approved by Council in one off
submissions:
TOWN OF PORT HEDLAND
MONTHLY STATEMENT OF FINANCIAL ACTIVITY
BY NATURE AND TYPE
FOR THE PERIOD ENDED 30 NOVEMBER 2015
YTD Variance
Page 2

30/11/2015
Adopted Budget Current Budget YTD Budget YTD Actuals
$000's $000's $000's $000's % $000'sOperating Revenue
3 General Purpose Income 32,399 34,651 29,153 26,382 ‐10% 2,7714 Governance 4 5 2 3 48% ‐15 Law, Order & Public Safety 263 263 112 116 4% ‐47 Health 72 96 40 57 43% ‐178 Education & Welfare 979 988 412 257 ‐38% 1559 Housing 349 349 145 106 ‐27% 4010 Community Amenities 11,696 9,535 5,649 6,240 10% ‐59111 Recreation & Culture 1,884 1,812 755 650 ‐14% 10512 Transport 19,850 19,844 8,268 6,176 ‐25% 2,09213 Economic Services 2,171 2,230 929 1,425 53% ‐49614 Other Properties & Services 483 483 225 197 ‐13% 28
Total Operating Revenue 70,149 70,256 45,691 41,609 ‐9% 4,081
Operating Expenditure3 General Purpose Income (373) (373) (159) (112) ‐30% ‐474 Governance (2,642) (2,585) (1,182) (1,074) ‐9% ‐1085 Law, Order & Public Safety (2,064) (2,087) (892) (672) ‐25% ‐2207 Health (966) (944) (403) (341) ‐15% ‐628 Education & Welfare (3,877) (3,709) (1,627) (1,903) 17% 2769 Housing (1,824) (1,754) (769) (447) ‐42% ‐32210 Community Amenities (9,759) (9,984) (4,210) (2,400) ‐43% ‐1,81011 Recreation & Culture (23,086) (22,433) (9,616) (5,334) ‐45% ‐4,28212 Transport (19,961) (23,098) (9,872) (6,057) ‐39% ‐3,81413 Economic Services (2,446) (2,549) (1,076) (788) ‐27% ‐28814 Other Properties & Services (2,704) (3,234) (1,651) (1,675) 1% 24
Total Operating Expenditure (69,700) (72,751) (31,457) (20,804) ‐34% ‐10,652
Operating Surplus/(Deficit) 450 ‐2,495 14,234 20,805 46% ‐6,571
Add Back Non Cash ItemsDepreciation 14,462 16,049 6,687 0 ‐100% 6,687(Profit )/ Loss on Disposal of Assets 31 31 13 0 ‐100% 13
Capital Expenditure and RevenueAcquisition of Infrastructure, Property, Plant and Equipment (38,849) (39,507) (16,461) (5,774) ‐65% ‐10,687Proceeds from Disposal of Assets 4,984 4,984 2,077 640 ‐69% 1,436Capital Grants and Contributions for the Development of Assets 4,258 4,801 2,000 747 ‐63% 1,253New Loan Borrowings 5,322 5,322 0 0 0% 0Proceeds from Self Supporting Loans 92 92 38 42 9% ‐3Transfers from Reserves 16,043 13,945 5,810 241 ‐96% 5,569Loan Principal Repayments (1,156) (1,156) (482) (388) ‐19% ‐93Transfers to Reserves (6,627) (5,528) (2,304) (2,864) 24% 560
Municipal Surplus / (Deficit) Carried Forward 1 July 2015 2,950 5,066 5,066Municipal Surplus / (Deficit) Brought Forward 30 June 2016 1,960 1,604 18,515
Sum of Total Budget (15,484) (19,542)
‐ 201516/078 Increase the transfer to the Asset Management Reserve from $1.05m to $3.166m‐ 201516/067 Reduce the transfer to Waste Reserves by $450,000 and include a budget for $450,000 for the Tyre Disposal Service.
The current budget is a reflection of the adopted September Quarter Budget Review and the below variations made to the budget which were approved by Council in
one off submissions:
YTD Variance
TOWN OF PORT HEDLAND
MONTHLY STATEMENT OF FINANCIAL ACTIVITY
FOR THE PERIOD ENDED 30 NOVEMBER 2015
BY PROGRAM
Page 3

15/16 Actual
15/16 Adopted
Budget* 14/15 Projected* 14/15 Actual**
$000's $000's $000's $000'sCURRENT ASSETS
Cash and Investments 93,781 65,474 77,663 81,134Receivables 10,437 10,200 12,914 14,073Inventories 551 500 600 551Land Held for Resale 1,187 0 0 1,187TOTAL CURRENT ASSETS 105,957 76,174 91,177 96,945
CURRENT LIABILITIESPayables (1,530) (4,000) (7,800) (8,588)Current Loan Liability (1,156) (1,156) (1,278) (1,135)Provisions (2,617) (3,200) (3,300) (2,618)TOTAL CURRENT LIABILITIES (5,303) (8,356) (12,378) (12,341)
NET CURRENT ASSETS 100,654 67,818 78,799 84,604
LessRestricted Cash ‐ Reserves (82,109) (63,502) (72,851) (79,486)Restricted Receivables 0 (3,500) (4,276) 0Land Held for Resale (1,187) 0 0 (1,187)PlusCurrent Loan Liability 1,156 1,156 1,278 1,135ESTIMATED SURPLUS/ (DEFICIENCY) 18,514 1,972 2,950 5,066
* as per Adopted 2015/16 Budget Note 7
** as per the audited 2014/15 Annual Financial Report Note 24(b)
TOWN OF PORT HEDLANDMONTHLY STATEMENT OF FINANCIAL ACTIVITYFOR THE PERIOD ENDED 30 NOVEMBER 2015
Page 4

BANK RECONCILIATIONS
CASH on CALL MUNICIPAL BHP RESERVE RESERVE POOLED ARENA TOTAL CASH & TRUST
FUND FUND FUNDS INVESTMENTS FUND INVESTMENTS FUND
SYNERGY CASH BOOK CLOSING BALANCE $5,829,300.96 ($768,505.63) $513,139.16 $91,722.69 $88,000,000.00 $110,000.00 $93,775,657.18 $315,923.37
BANK STATEMENT CLOSING BALANCE $3,192,144.66 $2,116,230.60 $515,189.52 $91,722.69 $88,000,000.00 $110,446.58 $94,025,734.05 $300,657.98
BANK STATEMENT CLOSING BALANCE‐ CATAMORE $0.00VARIANCE $2,637,156.30 ($2,884,736.23) ($2,050.36) $0.00 $0.00 ($446.58) ($250,076.87) $15,265.39
RECONCILING ITEMS:
AddUncleared Cash / Cheque Deposits $5,163.62 $5,163.62
Credit Card Expenses yet to be paid $24,081.15 $24,081.15
LessOutstanding Transfers between Trust and Municipal accounts ($20,564.89) ($20,564.89) $20,564.89
Reserve Transfer $0.00
Superannuation contributions yet to be paid ($194,894.20) ($194,894.20)
Outstanding Transfers between Call and Municipal accounts $2,637,156.30 ($2,637,156.30) $0.00
Interest not yet processed in Synergy ($2,050.36) ($446.58) ($2,496.94)
Unpresented Cheques ($60,782.77) ($60,782.77) ($5,299.50)
Receipts not yet processed in Synergy ($582.84) ($582.84)
TOTAL RECONCILING ITEMS $2,637,156.30 ($2,884,736.23) ($2,050.36) $0.00 $0.00 ($446.58) ($250,076.87) $15,265.39
TOTAL CASH & INVESTMENTS ‐ SYNERGY CASH BOOK CLOSING BALANCE 93,775,657
Municipal Funds 11,666,727
Reserve Funds 82,108,930
93,775,657
Other Cash Amounts:
Cash on Hand 5,350
Muni Suspense Account ‐31
TOTAL CASH & INVESTMENTS 93,780,976
FOR THE PERIOD ENDED 30 NOVEMBER 2015MONTHLY STATEMENT OF FINANCIAL ACTIVITY
TOWN OF PORT HEDLAND
Page 5

INVESTMENTS
Summary of Portfolio by Financial Institutions (including At Call account)
Institution Principal % of Portfolio Average Interest Rate
National Australia Bank 30,692,145 34% 2.96%
ANZ 27,600,000 31% 2.92%
Bank of Queensland 12,900,000 14% 2.93%
Bendigo Bank 4,000,000 4% 2.95%
Commonwealth Bank 4,000,000 4% 2.78%
ING Bank Australia 1,000,000 1% 2.30%
AMP 5,000,000 6% 2.90%
Westpac 6,000,000 4% 2.86%
TOTAL 91,192,145 100% 2.92%
Summary of Portfolio by Credit Ratings (including At Call account)
Credit Rating Principal % of Portfolio Policy Limit
A1+ 68,292,145 74% 100%
A‐1 5,000,000 6% 60%
A‐2 17,900,000 20% 20%
TOTAL 91,192,145 100%
Local Government (Financial Management) Regulations 1996, Part 2 s. 6.10 Regulation 8 (3)
states that money from different accounts may be placed in a common investment authorised
by the Act.
The Town of Port Hedland Investment Policy stipulates that direct investments with "A‐1+"
ratings can be a maximum of 100% of the portfolio. For "A‐1" rated Authorised Deposit
Institutions (ADI), the maximum that can be invested is 60% of the portfolio while "A‐2" rated
ADI, the maximum that can be invested is 20% of the portfolio.
TOWN OF PORT HEDLAND
MONTHLY STATEMENT OF FINANCIAL ACTIVITY
FOR THE PERIOD ENDED 30 NOVEMBER 2015
Page 6

TOWN OF PORT HEDLAND
MONTHLY STATEMENT OF FINANCIAL ACTIVITY
FOR THE PERIOD ENDED 30 NOVEMBER 2015Detailed Portfolio Balances
Institution Credit Rating Principal Interest Rate Term to Maturity Maturity DateInterest on Maturity
($)% of Portfolio
Westpac A1+ 2,000,000 2.94% 3 months 01/12/2015 20,942 1.1%
ANZ A1+ 1,800,000 2.97% 3 months 19/01/2016 13,182 0.7%
ANZ A1+ 2,200,000 2.98% 3 months 21/01/2016 16,525 0.9%
Westpac A1+ 2,000,000 2.83% 4 months 17/12/2015 18,608 1.0%
Commonwealth Bank A1+ 2,500,000 2.76% 4 months 29/12/2015 22,874 1.2%
Westpac A1+ 800,000 2.75% 6 months 03/12/2015 11,030 0.6%
Bank of Queensland A‐2 1,500,000 2.95% 6 months 22/01/2016 22,064 1.2%
ANZ A1+ 1,000,000 3.00% 6 months 05/02/2016 15,123 0.8%
Bank of Queensland A‐2 2,000,000 2.80% 6 months 16/02/2016 27,003 1.4%
National Australia Bank A1+ 1,000,000 2.90% 6 months 29/02/2016 14,699 0.8%
AMP A‐1 5,000,000 2.90% 6 months 29/02/2016 73,493 3.9%
Bank of Queensland A‐2 1,800,000 3.00% 6 months 12/04/2016 26,630 1.4%
National Australia Bank A1+ 4,000,000 2.86% 6 months 28/04/2016 56,416 3.0%
Bank of Queensland A‐2 500,000 3.00% 7 months 18/01/2016 8,795 0.5%
National Australia Bank A1+ 4,000,000 2.94% 7 months 22/02/2016 67,660 3.6%
ANZ A1+ 2,000,000 2.94% 7 months 09/03/2016 29,319 1.6%
Bank of Queensland A‐2 1,000,000 3.00% 7 months 04/05/2016 17,836 0.9%
Westpac A1+ 1,200,000 3.00% 8 months 25/03/2016 17,753 0.9%
Bank of Queensland A‐2 2,200,000 2.98% 8 months 02/06/2016 43,826 2.3%
National Australia Bank A1+ 2,000,000 3.15% 9 months 08/12/2015 48,674 2.6%
National Australia Bank A1+ 2,000,000 2.97% 9 months 29/02/2016 44,916 2.4%
National Australia Bank A1+ 2,500,000 3.00% 9 months 04/04/2016 56,712 3.0%
Bank of Queensland A‐2 2,000,000 2.90% 9 months 18/04/2016 43,858 2.3%
National Australia Bank A1+ 2,000,000 2.85% 9 months 30/05/2016 43,101 2.3%
ANZ A1+ 1,800,000 2.90% 9 months 08/07/2016 39,186 2.1%
ANZ A1+ 2,000,000 2.90% 9 months 12/07/2016 43,381 2.3%
ANZ A1+ 1,800,000 2.90% 10 months 08/08/2016 43,619 2.3%
National Australia Bank A1+ 10,000,000 3.00% 12 months 28/06/2016 300,000 15.9%
ING Bank Australia A‐2 1,000,000 2.30% 12 months 06/09/2016 22,937 1.2%
ANZ A1+ 1,000,000 2.87% 12 months 09/09/2016 28,779 1.5%
Commonwealth Bank A1+ 1,500,000 2.80% 12 months 15/09/2016 41,425 2.2%
Page 7

TOWN OF PORT HEDLAND
MONTHLY STATEMENT OF FINANCIAL ACTIVITY
FOR THE PERIOD ENDED 30 NOVEMBER 2015
Institution Credit Rating Principal Interest Rate Term to Maturity Maturity DateInterest on Maturity
($)% of Portfolio
Bendigo Bank A‐2 4,000,000 2.95% 12 months 28/07/2016 118,000 6.3%
ANZ A1+ 10,000,000 2.98% 12 months 28/08/2016 307,797 16.3%
Bank of Queensland A‐2 1,900,000 2.80% 12 months 19/09/2016 53,492 2.8%
ANZ A1+ 2,000,000 2.95% 12 months 12/10/2016 59,000 3.1%
ANZ A1+ 2,000,000 2.75% 12 months 04/11/2016 55,000 2.9%
TOTAL POOLED INVESTMENTS 88,000,000 TOTAL INTEREST PROJECTED 1,873,656
National Australia Bank A1+ 3,192,145 2.50% At Call Account 9,356 0.5%
TOTAL INVESTMENTS 91,192,145 TOTAL INTEREST PROJECTED 1,883,012 100.00%
Spoilbank Reserve of $38.99m is included in the above Term Deposits
Page 8

INFORMATION ON BORROWINGS
(a) Loan Repayments `
GovernanceCivic Centre Upgrade (New) ‐ 4,800,000 4,800,000
Law, Order & Public Safety* SES Shed (123) 152,777 152,777 17,071 34,686 135,706 118,091 4,782 10,094
HousingStaff Housing Morgan Street (125) 1,235,261 1,235,262 55,308 1,235,261 1,179,954 90,742
Staff Housing Morgan Street (127) 1,818,164 1,818,164 76,931 1,818,164 1,741,233 134,125
Catamore Court Housing (139) 1,570,487 1,570,487 24,689 50,021 1,545,798 1,520,466 40,911 91,402
Catamore Court (New) ‐ 522,000 21,158 500,842 10,000
Community Amenities** Pilbara Underground Power (134) 406,643 406,643 64,731 130,649 341,913 275,994 7,462 16,217
GP Housing ‐ (135) 1,404,980 1,404,980 25,176 50,948 1,379,804 1,354,032 33,228 75,068
Recreation and Culture* Yacht Club (126) 376,570 376,570 11,709 28,639 364,861 347,931 10,042 26,039
* Yacht Club Additional (128) 202,498 202,498 5,539 13,531 196,958 188,967 5,024 13,146
JD Hardie Upgrade 2 (129) 1,368,075 1,368,075 52,672 1,368,075 1,315,403 91,070
Marquee Park A (130) 732,582 732,582 28,205 732,582 704,377 48,767
Marquee Park B (132) 4,026,440 4,026,440 74,994 151,945 3,951,446 3,874,495 105,090 234,502
JD Hardie Facility Upgrade (136) 1,353,455 1,353,455 24,491 49,548 1,328,965 1,303,907 31,332 70,965
Wanangkura Stadium (133) 7,093,901 7,093,901 132,126 267,701 6,961,775 6,826,200 185,151 413,153
Wanangkura Stadium (137) 2,343,092 2,343,092 84,240 2,343,092 2,258,852 127,372
* SH Bowls & Tennis Club (138) 485,317 485,317 7,629 15,458 477,688 469,859 12,643 28,246
Loans
New
Original
Budget ($)
Original
Budget ($)Actual ($)Actual ($)
Principal Repayments
Budget ($)
TOWN OF PORT HEDLANDMONTHLY STATEMENT OF FINANCIAL ACTIVITYFOR THE PERIOD ENDED 30 NOVEMBER 2015
Actual ($)Original
Budget ($)Actual ($)
Original
Budget ($)
Loan purpose by Program01‐Jul‐15
Principal Interest
Actual ($)
Principal
Outstanding Repayments
Page 9

INFORMATION ON BORROWINGS
(a) Loan Repayments `
Loans
New
Original
Budget ($)
Original
Budget ($)Actual ($)Actual ($)
Principal Repayments
Budget ($)
TOWN OF PORT HEDLANDMONTHLY STATEMENT OF FINANCIAL ACTIVITYFOR THE PERIOD ENDED 30 NOVEMBER 2015
Actual ($)Original
Budget ($)Actual ($)
Original
Budget ($)
Loan purpose by Program01‐Jul‐15
Principal Interest
Actual ($)
Principal
Outstanding Repayments
TransportStaff Housing Airport (131) 1,147,272 1,147,272 44,209 1,147,272 1,103,063 76,268
25,717,515 25,717,515 0 5,322,000 388,155 1,155,849 25,329,360 29,883,666 435,664 1,557,176
(*) Self supporting loan financed by payments from either the Port Hedland Yacht Club, South Hedland Bowling Club or Fire and Emergency Services.(**) Self supporting loan financed by payments from ratepayers who have elected to make payments over a 5 year period for underground power.All other loan repayments are to be financed by general purpose revenue.
(b) New Loans
Loan Purpose ActualOriginal
BudgetCivic Centre Upgrade ‐ 4,800,000
Catamore Court ‐ 522,000
TOTAL ‐ 5,322,000
Page 10
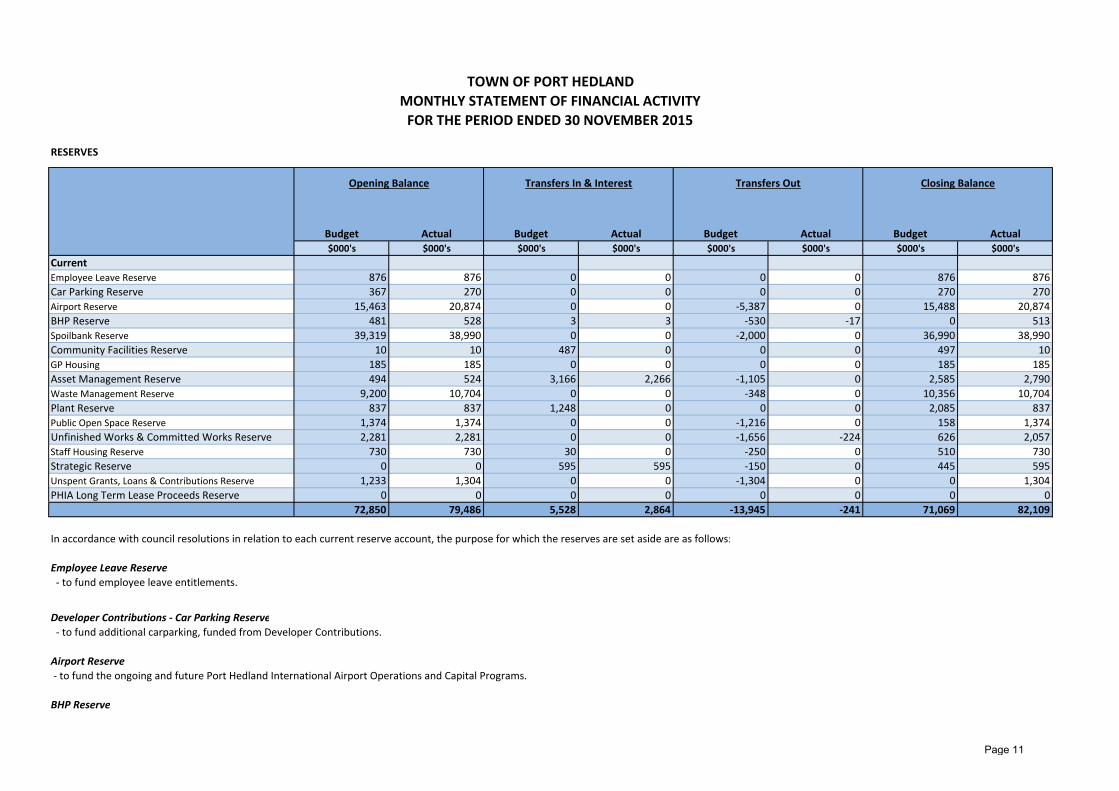
RESERVES
Budget Actual Budget Actual Budget Actual Budget Actual
$000's $000's $000's $000's $000's $000's $000's $000's
Current
Employee Leave Reserve 876 876 0 0 0 0 876 876
Car Parking Reserve 367 270 0 0 0 0 270 270
Airport Reserve 15,463 20,874 0 0 ‐5,387 0 15,488 20,874
BHP Reserve 481 528 3 3 ‐530 ‐17 0 513
Spoilbank Reserve 39,319 38,990 0 0 ‐2,000 0 36,990 38,990
Community Facilities Reserve 10 10 487 0 0 0 497 10
GP Housing 185 185 0 0 0 0 185 185
Asset Management Reserve 494 524 3,166 2,266 ‐1,105 0 2,585 2,790
Waste Management Reserve 9,200 10,704 0 0 ‐348 0 10,356 10,704
Plant Reserve 837 837 1,248 0 0 0 2,085 837
Public Open Space Reserve 1,374 1,374 0 0 ‐1,216 0 158 1,374
Unfinished Works & Committed Works Reserve 2,281 2,281 0 0 ‐1,656 ‐224 626 2,057
Staff Housing Reserve 730 730 30 0 ‐250 0 510 730
Strategic Reserve 0 0 595 595 ‐150 0 445 595
Unspent Grants, Loans & Contributions Reserve 1,233 1,304 0 0 ‐1,304 0 0 1,304
PHIA Long Term Lease Proceeds Reserve 0 0 0 0 0 0 0 0
72,850 79,486 5,528 2,864 ‐13,945 ‐241 71,069 82,109
In accordance with council resolutions in relation to each current reserve account, the purpose for which the reserves are set aside are as follows:
Employee Leave Reserve ‐ to fund employee leave entitlements.
Developer Contributions ‐ Car Parking Reserve ‐ to fund additional carparking, funded from Developer Contributions.
Airport Reserve ‐ to fund the ongoing and future Port Hedland International Airport Operations and Capital Programs.
BHP Reserve
TOWN OF PORT HEDLAND
Opening Balance Transfers In & Interest Transfers Out Closing Balance
FOR THE PERIOD ENDED 30 NOVEMBER 2015
MONTHLY STATEMENT OF FINANCIAL ACTIVITY
Page 11

TOWN OF PORT HEDLAND
FOR THE PERIOD ENDED 30 NOVEMBER 2015
MONTHLY STATEMENT OF FINANCIAL ACTIVITY
‐ to fund approved projects under the BHPBIO Town of Port Hedland Sustainability Partnership.
Spoilbank Reserve ‐ to fund the development of the Port Hedland Spoilbank Precinct.
Community Facilities Reserve ‐ to fund the ongoing maintenance, refurbishment, replacement and upgrade of community infrastructure within the Town of Port Hedland.
GP Housing Reserve ‐ to fund the development, maintenance and ongoing management of GP Housing within the Town of Port Hedland.
Asset Management Reserve ‐ to fund the ongoing maintenance, renewal, and upgrade of new and existing infrastructure within the Town of Port Hedland.
Waste Management Reserve ‐ to fund the development, operation and maintenance of the Town's waste management facilities.
Plant Reserve ‐ to fund the Plant Replacement Program.
Developer Contributions ‐ Public Open Space Reserve ‐ to hold contributions which arise from conditions applied to a Development Application for public open space.
Unfinished Works & Committed Works Reserve ‐ to transfer unspent Municipal funded expenditure on specific projects to enable identification of carryover expenditure into the next financial year.
Staff Housing Reserve ‐ to fund the maintenance, refurbishment, redevelopment and construction of staff housing.
Strategic Reserve ‐ to fund strategic projects as included in the Town's Strategic Community Plan and Corporate Business Plan.
Unspent Grants, Loans & Contributions Reserve ‐ to restrict unspent grants, loans and contributions at the end of the financial year.
Port Hedland International Airport Long Term Lease Proceeds Reserve ‐ to account for the lease proceeds from the long term lease of the PHIA and disburse funds as per the wealth management framework.
Page 12

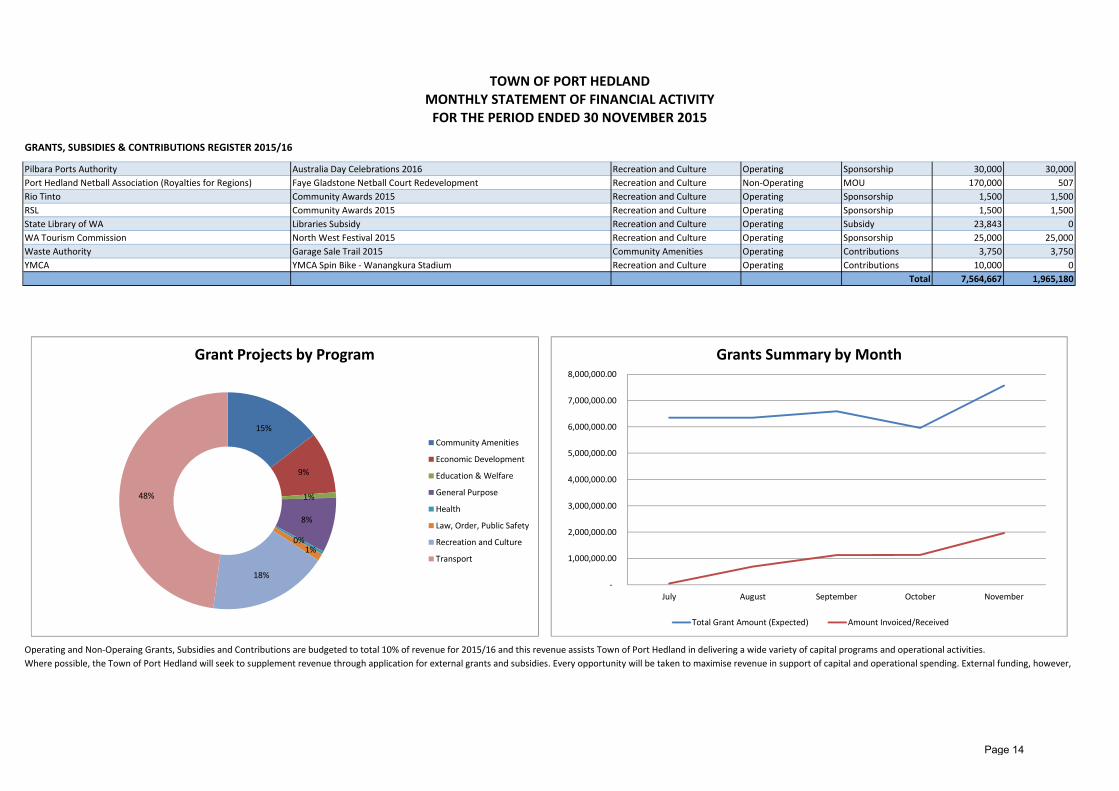
GRANTS, SUBSIDIES & CONTRIBUTIONS REGISTER 2015/16
SUCCESSFUL / APPROVED APPLICATIONS
Funding Provider Purpose ProgramOperating /
Non‐operatingType
Amount
Expected
Amount
Invoiced /
Received
BHP Billiton Iron Ore Pty Ltd North West Festival 2016 Recreation and Culture Operating Grant 300,000 0
BHP Billiton Iron Ore Pty Ltd Australia Day Celebrations 2016 Recreation and Culture Operating Grant 17,360 17,360
BHP Billiton Iron Ore Pty Ltd Faye Gladstone Netball Court Redevelopment Recreation and Culture Non‐Operating Grant 1,142,000 296,236
Childrens Book Council of Australia Childrens Bookweek Recreation and Culture Operating Grant 3,680 3,680
Department of Fire & Emergency Services Local Government Grants Scheme 2015/16 Law, Order, Public Safety Operating Subsidy 73,267 20,790
Department of Health Reimbursement: CLAG Mosquito Control Health Operating Grant 6,132 6,132
Department of Housing Licence Fees for Carparking Bays Community Amenities Non‐Operating Contributions 268,182 268,182
Department of Infrastructure and Regional DevelopmentRoads to Recovery: Pinga St; Yandeyarra Road; Murdoch Drive/ Captain Way
IntersectionTransport Non‐Operating Grant 763,058 160,000
Department of Local Government & Communities North West Skate Fest 2015 Education & Welfare Operating Grant 5,000 5,000
Department of Local Government & Communities Financial Assistance Grants ‐ General Purpose Grant General Purpose Operating Grant 548,911 274,456
Department of Local Government & Communities Financial Assistance Grants ‐ Road Grant Transport Operating Grant 320,717 172,859
Department of Local Government & Communities Financial Assistance Grants ‐ Special Road Works Transport Operating Grant 50,000 0
Department of PlanningNorthern Planning Program ‐ Housing Strategy, South East Planning, West
End and Port Hedland Town Centre PlanCommunity Amenities Operating Grant 483,746 35,567
Department of Planning Northern Planning Program ‐ Landfill Planning Studies Community Amenities Operating Grant 257,550 0
Department of Sport & Recreation Government Grant ‐ Gratwick Olympic Pool Recreation and Culture Non‐Operating Grant 32,000 0
Department of Sport & Recreation Government Grant ‐ South Hedland Aquatic Centre Recreation and Culture Non‐Operating Grant 32,000 0
Department of Sport & Recreation Recreation Administration ‐ Club Development Officer Recreation and Culture Operating Grant 60,000 0
Department of Transport Finucane Island Boat Ramp Improvement Plan Economic Development Non‐Operating Grant 149,625 0
Disability Services Commission Disability Week Recreation and Culture Operating Sponsorship 500 500
Finucane Island Sports & Rec Club Community Awards 2015 Recreation and Culture Operating Sponsorship 1,500 1,500
Fortescue Metals Group Ltd North West Festival 2015 Recreation and Culture Operating Sponsorship 25,000 25,000
Fortescue Metals Group Ltd Contributions: FMG Memberships ‐ Wanangkura Stadium Recreation and Culture Operating Contributions 500,000 250,000
Horizon Power Holiday Lights Competition Recreation and Culture Operating Sponsorship 2,500 2,500
Horizon Power Community Awards 2015 Recreation and Culture Operating Sponsorship 1,500 1,500
ITOCHU Minerals & Energy of Australia Community Awards 2015 Recreation and Culture Operating Sponsorship 3,000 3,000
Landcorp Footpath Construction ‐ South Hedland Town Centre Transport Non‐Operating Contributions 346,364 306,162
Lotterywest Spinifex Spree Carnival 2015 Recreation and Culture Operating Sponsorship 20,000 20,000
Lotterywest North West Festival 2015 Recreation and Culture Operating Grant 20,000 0
Main Roads WA Street Lighting Transport Operating Grant 20,700 0
Main Roads WA Direct Grant Transport Operating Grant 134,000 0
Main Roads WA Regional Roads Group: Pinga St; Yandeyarra Rd; Pippingara Rd Transport Non‐Operating Grant 1,211,938 12,500
Main Roads WA Roadside Litter Cleanup Campaign Health Operating Contributions 20,000 20,000
Mia Mia Port Hedland International Airport Community Contributions: Mia Mia ‐ Economic Development Economic Development Operating Contributions 464,845 0
Orica Mining Services RAV Contributions: Infrastructure Maintenance Engineering Transport Operating Contributions 14,000 0
TOWN OF PORT HEDLANDMONTHLY STATEMENT OF FINANCIAL ACTIVITYFOR THE PERIOD ENDED 30 NOVEMBER 2015
Page 13
GRANTS, SUBSIDIES & CONTRIBUTIONS REGISTER 2015/16
TOWN OF PORT HEDLANDMONTHLY STATEMENT OF FINANCIAL ACTIVITYFOR THE PERIOD ENDED 30 NOVEMBER 2015
Pilbara Ports Authority Australia Day Celebrations 2016 Recreation and Culture Operating Sponsorship 30,000 30,000
Port Hedland Netball Association (Royalties for Regions) Faye Gladstone Netball Court Redevelopment Recreation and Culture Non‐Operating MOU 170,000 507
Rio Tinto Community Awards 2015 Recreation and Culture Operating Sponsorship 1,500 1,500
RSL Community Awards 2015 Recreation and Culture Operating Sponsorship 1,500 1,500
State Library of WA Libraries Subsidy Recreation and Culture Operating Subsidy 23,843 0
WA Tourism Commission North West Festival 2015 Recreation and Culture Operating Sponsorship 25,000 25,000
Waste Authority Garage Sale Trail 2015 Community Amenities Operating Contributions 3,750 3,750
YMCA YMCA Spin Bike ‐ Wanangkura Stadium Recreation and Culture Operating Contributions 10,000 0
Total 7,564,667 1,965,180
Operating and Non‐Operaing Grants, Subsidies and Contributions are budgeted to total 10% of revenue for 2015/16 and this revenue assists Town of Port Hedland in delivering a wide variety of capital programs and operational activities.
Where possible, the Town of Port Hedland will seek to supplement revenue through application for external grants and subsidies. Every opportunity will be taken to maximise revenue in support of capital and operational spending. External funding, however,
‐
1,000,000.00
2,000,000.00
3,000,000.00
4,000,000.00
5,000,000.00
6,000,000.00
7,000,000.00
8,000,000.00
July August September October November
Grants Summary by Month
Total Grant Amount (Expected) Amount Invoiced/Received
15%
9%
1%
8%
0%1%
18%
48%
Grant Projects by Program
Community Amenities
Economic Development
Education & Welfare
General Purpose
Health
Law, Order, Public Safety
Recreation and Culture
Transport
Page 14

GRANTS, SUBSIDIES & CONTRIBUTIONS REGISTER 2015/16
TOWN OF PORT HEDLANDMONTHLY STATEMENT OF FINANCIAL ACTIVITYFOR THE PERIOD ENDED 30 NOVEMBER 2015
UNSUCESSFUL/ PENDING APPLICATIONS
Funding Organisation Purpose of Grant Program Amount
Department of Local Government and Communities National Youth Week 2016 Grants Program Recreation and Culture 1,000
Department of Fire & Emergency Services Bushfire Mitigation Health 20,000
Department of Fire & Emergency Services Petermarer Fire Tank Health 35,000
Department of Fire & Emergency Services Turner River Fire Tank Health 35,000
Department of Infrastructure and Regional DevelopmentNational Stronger Regions Fund: South Hedland Integrated Community
FacilityRecreation and Culture 10,000,000
Department of Regional DevelopmentRoyalties for Regions Regional Venues Improvement Fund: Matt Dann
Theatre & CinemaRecreation and Culture 550,000
Department of Sport & RecreationCommunity Sport and Recreation Facilities Fund:
Floodlighting of sporting oval at OspreyRecreation and Culture 106,000
Department of Sport & RecreationCommunity Sport and Recreation Facilities Fund:
South Hedland Aquatic CentreRecreation and Culture 1,000,000
Department of Sport & Recreation Youth Engagement Scheme: Slam Recreation and Culture 40,000
Department of Transport Heavy Vehicle Safety & Productivity Program Transport TBC
Department of Transport2016/17 Project: Regional Network Bicycle Grant Program:
Shared Bike Path from Cooke Point to Redbank BridgeTransport 222,375
Department of Transport2016/17 Project: Regional Network Bicycle Grant Program:
Shared Bike Path from Styles Road to Wilson Street Transport 39,375
Fortescue Metals Group LtdProvide funding for proposed Scotty's Training Café located in Marquee Park
South HedlandEconomic Development 1,200,000
Lotterywest Community Spaces ‐ Buildings & Fit out: Civic Centre Refurbishment Economic Development TBC
Main Roads WA Blackspot Program 2016/17 Transport 1,051,500
Main Roads WA Indigenous Access Roads: Yandeyarra Rd Transport 25,000
Pilbara Development Commission Retail and Attraction Grant Economic Development 50,000
WA Police Deadly Skate Recreation and Culture 23,830
WA Police CCTV Strategy Fund: Upgrade existing 32 cameras to night vision Economic Development 300,000
WA Police State Graffitti Fund: GIS Graffitti Module Economic Development 20,000
Landcorp South Hedland CBD Road Modification Transport 500,000
Department of Transport Coastal Adaptation and Protection Grant Transport 300,000
Various ‐ TBC North West Festival 2016 Recreation and Culture 125,000
15,644,080
Application submitted July 2015
Unsuccessful
Application submitted October 2015
Application submitted October 2015
Verbal confirmation only to date. Agreement & funds to follow
Application submitted 29th October 2015
Application in progress
Grant supports projects that are primarly used for community
Application submitted September 2015
Application submitted October 2015
Project currently on hold subject to funding
Application submitted October 2015
Status
Funding round opens 02 Dec 2015
Application submitted October 2015
Application submitted October 2015
Application submitted July 2015
Application submitted September 2015
Application November 2015
Eligible for 50% of $50,000 FAG towards Indigenous Access
Road ‐ claim to be submitted
Application in progress 24/11/2015. Estimate provided. Quote
to be received EOM
Application in progress 24/11/2015
TOTAL
Funding round opens early 2016
Funding to be confirmed
Page 15

RATES
Rate Type Rate in $Number of
Properties
Rateable
Value
Rate
Revenue
Interim
RatesBack Rates
Total
RevenueBudget
Differential General Rate (GRV)
GRV Residential 5.6920 5,527 262,895,065 14,963,987 136,906 45,362 15,146,255 15,357,549
GRV Commercial 4.3026 173 21,668,626 932,314 (58,596) 2,749 876,468 934,345
GRV Industrial 2.8978 372 62,556,266 1,812,755 33,329 1,507 1,847,591 1,700,940
GRV Shopping Centre 5.7891 2 9,642,311 558,203 513 558,716 558,203
GRV Mass Accommodation 26.0000 6 12,880,000 3,348,800 10,140 3,358,940 3,348,800
GRV Tourist Accommodation 11.4339 10 7,360,080 841,544 841,544 941,544
UV Mining 42.3693 61 2,403,687 1,018,425 2,752 1,722 1,022,899 1,018,425
UV Mining Exploration 36.1702 51 523,083 189,200 (18,092) (567) 170,541 189,201
UV Mining Other 36.9834 152 167,234 61,849 (116,933) (6,419) (61,503) 74,115
UV Pastoral 10.8292 11 1,334,424 144,507 (2,545) 141,963 135,022
UV Other 18.8800 14 1,510,880 285,254 (25,110) 260,144 284,106
Sub‐Totals 6,379 382,941,656 24,156,840 ‐37,637 44,354 24,163,557 24,542,251
Minimum
Minimum Rates $
GRV Residential 1260 729 9,124,765 918,540 0 0 918,540 924,840
GRV Commercial 1260 62 797,145 78,120 0 0 78,120 80,640
GRV Industrial 1260 41 939,533 51,660 0 0 51,660 51,660
GRV Shopping Centre 1260 0 0 0 0 0 0 0
GRV Mass Accommodation 1260 0 0 0 0 0 0 0
GRV Tourist Accommodation 1260 0 0 0 0 0 0 0
UV Mining 1260 44 58,311 55,440 0 0 55,440 55,440
UV Mining Exploration 1100 49 66,432 53,900 0 0 53,900 53,900
UV Mining Other 260 39 18,822 10,140 0 0 10,140 7,280
UV Pastoral 1260 0 0 0 0 0 0 0
UV Other 1260 10 4,149 12,600 0 0 12,600 12,600
Sub‐Totals 974 11,009,157 1,180,400 0 0 1,180,400 1,186,360
Concessions (Note 12) ‐113,029 ‐107,874
TOTAL 7,353 393,950,813 25,337,240 ‐37,637 44,354 25,230,928 25,620,737
TOWN OF PORT HEDLAND
MONTHLY STATEMENT OF FINANCIAL ACTIVITY
FOR THE PERIOD ENDED 30 NOVEMBER 2015
2015/16
89%
7%
4%
Total Rates
GRV
UV
GRV Minimum
UV Minimum
Interim67%
4%
8%
2%
15%4%
Differential General Rate (GRV)
GRV Residential
GRV Commercial
GRV Industrial
GRV Shopping Centre
GRV MassAccommodation
Page 16

SUNDRY DEBTORS
Current 3,371,518.38$
30 Days 320,760.23$
60 days 29,201.47$
90 days 346,988.67$
4,068,468.75$
Credits (336.61)$
TOTAL 4,068,132.14$
Underground Power Debtors 617,342.80$
ALL SUNDRY DEBTORS 4,685,474.94$
Previous Month 5,234,303.90$
Movement in Debtors (548,828.96)$
Percentage Change ‐10.49%
Debtor Amount Owing ‐ 90 Days Commentary Airport Landfill
7949 192,610.70$ Debt Collectors
6624 30,282.10$ Recreation investigating
8455 23,332.40$ Debt Collectors x
7545 13,461.07$ Leasing investigating
9285 10,568.98$ Finance investigating
8811 10,457.60$ Administrator appointed x
8629 6,209.18$ Administrator appointed x
240 6,198.10$ Finance investigating x
7989 5,857.09$ Legal intent letter sent x
7206 5,006.40$ Administrator appointed x
6088 5,000.00$ Debt collectors x
6245 4,694.00$ Debt collectors
9134 3,733.95$ Payment plan
8816 2,948.25$ Administrator appointed x
9286 2,520.00$ Legal intent sent
8506 2,320.00$ Debt collectors
7650 2,057.68$ Since paid
7314 2,050.60$ Since paid x
9106 1,815.65$ Administrator appointed x
8293 1,793.15$ Debt collectors x
8554 1,650.00$ Since paid
6135 1,574.07$ Leasing investigating
671 1,340.13$ Leasing investigating
9125 1,132.70$ Administrator appointed x
8701 1,048.15$ Write off x
9205 790.50$ Write off
9296 669.08$ Legal intent sent
8538 644.00$ Finance investigating x
8807 585.10$ Administrator appointed x
450 449.00$ Leasing investigating
8189 249.27$ Leasing investigating
9267 220.00$ Building investigating
9366 220.00$ Building investigating
9355 220.00$ Building investigating
9360 220.00$ Building investigating
9339 220.00$ Building investigating
4350 220.00$ Building investigating
9294 220.00$ Building investigating
9295 220.00$ Building investigating
9337 220.00$ Finance investigating
9345 220.00$ Building investigating
TOWN OF PORT HEDLANDMONTHLY STATEMENT OF FINANCIAL ACTIVITYFOR THE PERIOD ENDED 30 November 2015
Debtors outstanding for 90 days or more as at 30 November 2015
Page 17

Debtor Amount Owing ‐ 90 Days Commentary Airport Landfill
9356 220.00$ Building investigating
9338 220.00$ Building investigating
9344 220.00$ Building investigating
9363 220.00$ Building investigating
8581 220.00$ Building investigating
8631 203.50$ Administrator appointed x
8713 197.02$ Finance investigating
8819 98.43$ Write off
9257 60.00$ Write off
6097 29.92$ Finance investigating
9240 17.75$ Finance investigating
30 15.50$ Finance investigating
8425 14.65$ Write off
8400 3.00$ Finance investigating
Total 90 Days 346,988.67$
Page 18

TOWN OF PORT HEDLANDMONTHLY STATEMENT OF FINANCIAL ACTIVITYFOR THE PERIOD ENDED 30 NOVEMBER 2015
0.00
1000000.00
2000000.00
3000000.00
4000000.00
5000000.00
6000000.00
7000000.00
8000000.00
9000000.00
Dec‐14 Jan‐15 Feb‐15 Mar‐15 Apr‐15 May‐15 Jun‐15 Jul‐15 Aug‐15 Sep‐15 Oct‐15 Nov‐15
Summary of Sundry Debtors ‐ Past 12 Months
90 Days
60 Days
30 Days
Current
9,228,9247,990,613
7,599,219
10,533,906
6,549,915
11,516,41911,976,411
6,425,4475,500,840
4,660,169
5,234,304
4,685,475
‐
2,000,000.00
4,000,000.00
6,000,000.00
8,000,000.00
10,000,000.00
12,000,000.00
14,000,000.00
Dec‐14 Jan‐15 Feb‐15 Mar‐15 Apr‐15 May‐15 Jun‐15 Jul‐15 Aug‐15 Sep‐15 Oct‐15 Nov‐15
Total Sundry Debtors
Total SundryDebtors
8%1%
8%
83%
Summary of Sundry Debtors ‐ 30 November 2015
90 Days
60 Days
30 Days
Current
Page 19

CAPITAL WORKS PROGRAM
Description Current Budget 15/16Total Actuals
(Actuals + Orders)MUNICIPAL FUNDED RESERVE FUNDED LOAN FUNDED GRANT FUNDED
CAPITAL PROJECTSCapital Expenditure ‐ Furniture & Equipment ‐ ICT Hardware ‐
Information Communication Technology191,000 75,145 115,855 39.34% (191,000)
Capital Expenditure ‐ Furniture & Equipment ‐ ICT Implementation Plan
2012‐2017 ‐ Information Communication Technology198,000 17,241 180,759 8.71% (198,000)
Capital Expenditure ‐ Buildings ‐ Staff Housing (Various) Refurbishments ‐
Staff Housing567,200 27,271 539,929 4.81% (317,200) (250,000)
Capital Expenditure ‐ Work in Progress ‐ Staff Housing Construction :
Catamore Court: Contributed Assets ‐ Staff Housing522,000 1,516,187 (994,187) 290.46% (522,000)
Capital Expenditure ‐ Work in Progress ‐ Pioneer Cemetery Upgrade ‐
Cemeteries22,600 22,600 0 100.00% (22,600)
Capital Expenditure ‐ Work In Progress ‐ South Hedland Cemetery Upgrade
(Friends of the Cemetery) ‐ Cemeteries35,000 0 35,000 0.00% (35,000)
Capital Expenditure ‐ Work in Progress ‐ Waste Water Central Control
System ‐ Waste Management & Recycling650,000 334,590 315,410 51.48% (650,000)
Capital Expenditure ‐ Buildings ‐ Building Refurbishment ‐ Port Hedland
Civic Centre4,800,000 616,363 4,183,637 12.84% (4,800,000)
Capital Expenditure ‐ Work in Progress ‐ Facility Upgrade ‐ J D Hardie
Centre150,159 0 150,159 0.00% (150,159)
Capital Expenditure ‐ Work in progress ‐ Turtle Board Walk ‐
Beaches/Foreshore43,000 42,584 416 99.03% (43,000)
Capital Expenditure ‐ Work in Progress ‐ Gratwick Aquatic Centre Upgrades
‐ Gratwick Olympic Pool32,000 0 32,000 0.00% (32,000)
Capital Expenditure ‐ Work in Progress ‐ Gym Upgrade ‐ Gratwick
Olympic Pool11,046 15,205 (4,159) 137.65% (11,046)
Capital Expenditure ‐ Work in Progress ‐ SHAC Plant & Equipment
Upgrades ‐ South Hedland Aquatic Centre32,000 18,070 13,930 56.47% (32,000)
Capital Expenditure ‐ Infrastructure ‐ Faye Gladstone Netball Courts ‐
South Hedland Sportsgrounds : Recreation1,300,000 82,512 1,217,488 6.35% (296,236) (1,003,764)
Variance
(Current Budget & Total Actuals)
TOWN OF PORT HEDLANDMONTHLY STATEMENT OF FINANCIAL ACTIVITY
FOR THE PERIOD ENDED 30 NOVEMBER 2015
EXPENDITURE FUNDING
Page 20

CAPITAL WORKS PROGRAM
Description Current Budget 15/16Total Actuals
(Actuals + Orders)MUNICIPAL FUNDED RESERVE FUNDED LOAN FUNDED GRANT FUNDED
Variance
(Current Budget & Total Actuals)
TOWN OF PORT HEDLANDMONTHLY STATEMENT OF FINANCIAL ACTIVITY
FOR THE PERIOD ENDED 30 NOVEMBER 2015
EXPENDITURE FUNDING
Capital Expenditure ‐ Work in Progress ‐ South Hedland Town Centre Stage
2A Landscaping ‐ South Hedland Sportgrounds Recreation1,216,260 0 1,216,260 0.00% (1,216,260)
Capital Expenditure ‐ Infrastructure ‐ Scoreboard Replacement ‐ Port &
South Sportsgrounds : Parks & Gardens220,000 14,213 205,787 6.46% (50,000) (170,000)
Capital Expenditure ‐ Work in Progress ‐ Static Fitness Equipment
Installation Port Hedland ‐ Port & South Sportsgrounds : Parks & Gardens30,000 300 29,700 1.00% (30,000)
Capital Expenditure ‐ Infrastructure ‐ Pedestrian Bridge Hand Railing
South Hedland ‐ Port & South Sportsgrounds : Parks & Gardens15,000 13,706 1,294 91.37% (15,000)
Capital Expenditure ‐ Infrastructure ‐ Playground Equipment ‐ Port &
South Sportsgrounds : Parks & Gardens206,000 108,471 97,529 52.66% (104,000) (102,000)
Capital Expenditure ‐ Buildings ‐ Sports Building Upgrades ‐ Port & South
Sportsgrounds : Parks & Gardens1,466 1,466 0 100.00% (1,466)
Capital Expenditure ‐ Work in Progress ‐ South Hedland Integrated
Community Facility (RFR Funded) ‐ Libraries283,938 19,000 264,938 6.69% (283,938)
Capital Expenditure ‐ Infrastructure ‐ Wanangkura Stadium Signage ‐
Wanangkura Stadium3,100 3,100 0 100.00% (3,100)
Capital Expenditure ‐ Work in Progress ‐ Scotty's Cafe Construction ‐
Marquee Park1,200,000 0 1,200,000 0.00% (1,200,000)
Capital Expenditure ‐ Work in Progress ‐ Marquee Park Compliance &
Upgrades ‐ Marquee Park300,000 0 300,000 0.00% (300,000)
Capital Expenditure ‐ Work in Progress ‐ Kingsford Smith Business Park :
Landscaping ‐ Infrastructure Construction480,000 9,850 470,150 2.05% (480,000)
Capital Expenditure ‐ Infrastructure ‐ Finucane Island Boat Ramp Upgrade
‐ Infrastructure Construction199,500 0 199,500 0.00% (49,875) (149,625)
Capital Expenditure ‐ Infrastructure ‐ Richardson St Boat Ramp ‐
Infrastructure Construction100,000 7,579 92,421 7.58% (100,000)
Capital Expenditure ‐ Infrastructure ‐ Goode St Erosion ‐ Infrastructure
Construction150,000 0 150,000 0.00% (150,000)
Capital Expenditure ‐ Work in Progress ‐ Flood Study ‐ Protection Of
Environment120,000 0 120,000 0.00% (120,000)
Page 21

CAPITAL WORKS PROGRAM
Description Current Budget 15/16Total Actuals
(Actuals + Orders)MUNICIPAL FUNDED RESERVE FUNDED LOAN FUNDED GRANT FUNDED
Variance
(Current Budget & Total Actuals)
TOWN OF PORT HEDLANDMONTHLY STATEMENT OF FINANCIAL ACTIVITY
FOR THE PERIOD ENDED 30 NOVEMBER 2015
EXPENDITURE FUNDING
Capital Expenditure ‐ Work in Progress ‐ Caravan Route Signage / Port
Hedland Boundary Signs ‐ Infrastructure Maintenance60,000 0 60,000 0.00% (60,000)
Capital Expenditure ‐ Infrastructure ‐ Concrete Infills ‐ Road Verge
Maintenance50,000 0 50,000 0.00% (50,000)
Capital Expenditure ‐ Plant And Equipment ‐ Heavy Vehicles & Plant ‐
Plant Purchases909,000 413,711 495,289 45.51% (909,000)
Capital Expenditure ‐ Plant And Equipment ‐ Light Plant ‐ Plant Purchases 62,000 0 62,000 0.00% (62,000)
Capital Expenditure ‐ Plant And Equipment ‐ Parks & Gardens Plant ‐
Plant Purchases38,300 0 38,300 0.00% (38,300)
Capital Expenditure ‐ Work in Progress ‐ Wedgefield Entry Statement ‐
Tourism & Area Promotion50,000 0 50,000 0.00% (50,000)
Capital Expenditure ‐ Work in Progress ‐ CBD Street Banners ‐ Tourism &
Area Promotion32,000 27,291 4,709 85.28% (32,000)
Capital Expenditure ‐ Work in Progress ‐ Reconciliation Action Plan (Flag
Poles) ‐ Tourism & Area Promotion26,500 25,855 645 97.57% (26,500)
Capital Expenditure ‐ Buildings ‐ PHVC Upgrade ‐ Tourism & Area
Promotion18,780 10,258 8,522 54.62% (18,780)
Capital Expenditure ‐ Land ‐ Land Development : JD Hardie ‐ Economic
Development20,000 0 20,000 0.00% (20,000)
Capital Expenditure ‐ Work in Progress ‐ Kingsford Smith Business Park:
Subdivision Construction ‐ Economic Development3,454 3,454 0 99.99% (3,454)
Capital Expenditure ‐ Work in Progress ‐ Land Development : Pretty
Pool/Cooke Pt ‐ Economic Development35,000 7,000 28,000 20.00% (35,000)
Capital Expenditure ‐ Furniture & Equipment ‐ GIS Implementation ‐
Information Communication Technology200,000 84,462 115,539 42.23% (200,000)
Capital Expenditure ‐ Furniture & Equipment ‐ Computer Software:
Records Management ‐ Information Communication Technology250,000 0 250,000 0.00% (250,000)
Capital Expenditure ‐ Infrastructure ‐ Spoilbank Construction ‐ Economic
Development2,000,000 0 2,000,000 0.00% (2,000,000)
Total Capital Projects 16,834,303 3,517,483 13,316,820 20.89% (3,166,246) (5,928,668) (5,322,000) (2,417,389)
Page 22

CAPITAL WORKS PROGRAM
Description Current Budget 15/16Total Actuals
(Actuals + Orders)MUNICIPAL FUNDED RESERVE FUNDED LOAN FUNDED GRANT FUNDED
Variance
(Current Budget & Total Actuals)
TOWN OF PORT HEDLANDMONTHLY STATEMENT OF FINANCIAL ACTIVITY
FOR THE PERIOD ENDED 30 NOVEMBER 2015
EXPENDITURE FUNDING
ROAD PROGRAMCapital Expenditure ‐ Work in Progress ‐ Captains Way : Murdoch Drive :
Blackspot Program ‐ Infrastructure Construction445,650 476,562 (30,912) 106.94% (45,650) (400,000)
Capital Expenditure ‐ Work in Progress ‐ Pinga Street Upgrade ‐
Infrastructure Construction2,100,000 1,880,143 219,857 89.53% (150,144) (464,453) (1,485,403)
Capital Expenditure ‐ Work in Progress ‐ Wedgefield Road & Drainage
Strategy ‐ Infrastructure Construction200,000 30,750 169,250 15.38% (100,000) (100,000)
Capital Expenditure ‐ Work in Progress ‐ Shoata Road ‐ Infrastructure
Construction75,000 0 75,000 0.00% (75,000)
Capital Expenditure ‐ Work in Progress ‐ Pippingarra Road : Rrg ‐
Infrastructure Construction190,000 0 190,000 0.00% (130,000) (60,000)
Capital Expenditure ‐ Infrastructure ‐ Yandeyarra Road ‐ Infrastructure
Construction175,000 26,460 148,540 15.12% (15,000) (160,000)
Capital Expenditure ‐ Work in Progress ‐ Drainage Construction
Wanangkura Stadium & Faye Gladstone Netball Courts ‐ Infrastructure
Construction
520,077 36,422 483,655 7.00% (366,356) (153,721)
Capital Expenditure ‐ Infrastructure ‐ Port Hedland Footpath Construction
‐ Infrastructure Construction646,364 574,951 71,413 88.95% (300,000) (346,364)
Capital Expenditure ‐ Infrastructure ‐ Reseals ‐ Infrastructure
Construction656,260 406,010 250,250 61.87% (500,000) (156,260)
Capital Expenditure ‐ Infrastructure ‐ Kerbing Construction ‐
Infrastructure Construction130,000 17,010 112,990 13.08% (68,580) (61,420)
Capital Expenditure ‐ Infrastructure ‐ Walkway Lighting ‐ Infrastructure
Construction32,745 4,500 28,245 13.74% (32,745)
Capital Expenditure ‐ Infrastructure ‐ South Hedland CBD Road
Modifications ‐ Infrastructure Construction100,000 0 100,000 0.00% (100,000)
Capital Expenditure ‐ Infrastructure ‐ Cycleway Port to South ‐
Infrastructure Construction40,000 0 40,000 0.00% (40,000)
Road Program 5,311,096 3,452,808 1,858,288 65.01% (1,705,080) (1,154,249) 0 (2,451,767)
Page 23

CAPITAL WORKS PROGRAM
Description Current Budget 15/16Total Actuals
(Actuals + Orders)MUNICIPAL FUNDED RESERVE FUNDED LOAN FUNDED GRANT FUNDED
Variance
(Current Budget & Total Actuals)
TOWN OF PORT HEDLANDMONTHLY STATEMENT OF FINANCIAL ACTIVITY
FOR THE PERIOD ENDED 30 NOVEMBER 2015
EXPENDITURE FUNDING
WASTE PROJECTSCapital Expenditure ‐ Infrastructure ‐ Site Infrastructure ‐ Landfill
Business Unit23,111 31,902 (8,791) 138.04% (23,111)
Capital Expenditure ‐ Infrastructure ‐ South Hedland Water Treatment
Plant ‐ Landfill Business Unit2,000,000 0 2,000,000 0.00% (2,000,000)
Capital Expenditure ‐ Infrastructure ‐ Landfill Transfer Station ‐ Landfill
Business Unit200,000 7,450 192,550 3.73% (200,000)
Capital Expenditure ‐ Infrastructure ‐ Tip Shop ‐ Landfill Business Unit 180,000 7,450 172,550 4.14% (180,000)
Capital Expenditure ‐ Work In Progress ‐ Windblown Litter Solution ‐
Landfill Business Unit300,000 0 300,000 0.00% (300,000)
Capital Expenditure ‐ Infrastructure ‐ Landfill Weighbridge Load Cell
Replacement ‐ Landfill Business Unit40,000 32,750 7,250 81.88% (40,000)
Capital Expenditure ‐ Furniture & Equipment ‐ ICT Hardware Landfill ‐
Landfill Business Unit65,000 1,175 63,825 1.81% (65,000)
Capital Expenditure ‐ Plant And Equipment ‐ Heavy Plant Purchases ‐
Landfill Business Unit300,000 0 300,000 0.00% (300,000)
Waste Projects 3,108,111 80,727 3,027,384 2.60% 0 (3,108,111) 0 0
AIRPORT PROJECTSCapital Expenditure ‐ Work in Progress ‐ Solar Farm ‐ Airport
Administration4,725,675 21,510 4,704,165 0.46% (4,725,675)
Capital Expenditure ‐ Work in Progress ‐ Carpark : Ground Transport
Reconfiguration ‐ Airport Administration150,000 150,156 (156) 100.10% (150,000)
Capital Expenditure ‐ Buildings: Airport ‐ Terminal Precinct ‐ Airport
Administration500,000 678,629 (178,629) 135.73% (500,000)
Capital Expenditure ‐ Work in Progress ‐ International Terminal Works
Expansion ‐ Airport Administration83,952 215,114 (131,162) 256.23% (83,952)
Page 24

CAPITAL WORKS PROGRAM
Description Current Budget 15/16Total Actuals
(Actuals + Orders)MUNICIPAL FUNDED RESERVE FUNDED LOAN FUNDED GRANT FUNDED
Variance
(Current Budget & Total Actuals)
TOWN OF PORT HEDLANDMONTHLY STATEMENT OF FINANCIAL ACTIVITY
FOR THE PERIOD ENDED 30 NOVEMBER 2015
EXPENDITURE FUNDING
Capital Expenditure ‐ Work in Progress ‐ Solar Farm Development Costs ‐
Airport Administration75,000 156,551 (81,551) 208.74% (75,000)
Capital Expenditure ‐ Furniture & Equipment ‐ IT Network Upgrade ‐
Airport Administration20,000 7,928 12,072 39.64% (20,000)
Capital Expenditure ‐ Work in Progress ‐ Water Services ‐ Airport
Administration2,375,000 153,998 2,221,002 6.48% (2,375,000)
Capital Expenditure ‐ Work in Progress ‐ Sewer Services ‐ Airport
Administration250,000 0 250,000 0.00% (250,000)
Capital Expenditure ‐ Buildings: Airport ‐ Building Upgrades ‐ Airport
Administration260,000 69,785 190,215 26.84% (260,000)
Capital Expenditure ‐ Infrastructure: Airport ‐ Taxiway Overlay ‐ Airport
Administration500,000 0 500,000 0.00% (500,000)
Capital Expenditure ‐ Infrastructure: Airport ‐ Main Apron Strengthening ‐
Airport Administration905,000 135,787 769,213 15.00% (905,000)
Capital Expenditure ‐ Work in Progress ‐Infra:Airport ‐ Perimeter Fence
Upgrade and Crash Gates ‐ Airport Administration500,000 440,814 59,186 88.16% (500,000)
Capital Expenditure ‐ Infrastructure: Airport ‐ Electrical Infrastructure ‐
Airport Administration1,908,844 1,865,169 43,675 97.71% (1,908,844)
Capital Expenditure ‐ Work in Progress ‐ Security Upgrades CTO ‐ Airport
Administration2,000,000 119,072 1,880,928 5.95% (2,000,000)
Airport Projects 14,253,471 4,061,513 10,191,958 28.49% 0 (14,253,471) 0 0
Capital Works (Excluding Airport) 25,253,510 7,051,018 18,202,492 27.92% (4,871,326) (10,191,028) (5,322,000) (4,869,156)
TOTAL Capital Works 39,506,981 11,112,531 28,394,450 28.13% (4,871,326) (24,444,499) (5,322,000) (4,869,156)
Page 25

Description Current Budget 15/16UNFINISHED WORKS AND
COMMITTED WORKS RESERVESTRATEGIC RESERVE
CAPITAL PROJECTSCapital Expenditure ‐ Work in Progress ‐ Cemetery Improvements ‐
Cemeteries0 (55,000)
Capital Expenditure ‐ Work in Progress ‐ SHAC Upgrade ‐ South Hedland
Aquatic Centre0 (457,739)
Capital Expenditure ‐ Infrastructure ‐ Goode Street Erosion ‐ Engineering
Management0 (350,000)
Capital Expenditure ‐ Buildings ‐ Sports Building Upgrades ‐ Port & South
Sportsgrounds : Parks & Gardens0 (168,000)
Capital Expenditure ‐ Work in Progress ‐ Depot Infrastructure ‐
Engineering Management0 (40,000)
Capital Projects 0 (625,739) (445,000)
The projects below have not been currently budgeted for, however, an approximate allocation for each project is held in the Town
reserves. Once these projects have been scoped, a budget amendment will be presented to Council. Until then, the funds will remain
in reserves.
TOWN OF PORT HEDLANDMONTHLY STATEMENT OF FINANCIAL ACTIVITYFOR THE PERIOD ENDED 30 NOVEMBER 2015
EXPENDITURE FUNDING
Page 26

ROADS PROGRAM
Current Budget
2015/16 TOTALYTD Actuals
Purchase
Orders
Outstanding
Total Roads to Recovery
Federal Aboriginal
Road Grant /
Financial
Assistance Grant
Regional Road
Group 15/16
Program
Regional Road Group
14/15 Carryover
Requested from
Main Roads for Pinga
Street
Main Roads WA
Direct Grant
Unspent Regional
Road Group
Unspent Country
Local Government
Fund
Unfinished Works
& Committed
Works Reserve
Asset
Management
Reserve
Municipal Other
ROAD PROJECTS
Pinga Street Wedgefield 2,100,000 1,398,487 481,656 1,880,143 (363,466) (603,250) (518,687) (161,084) (303,369) (150,144)Yandeyarra Road 175,000 12,900 13,560 26,460 (80,000) (50,000) (30,000) (15,000)Captains Way/Murdoch 445,650 41,472 435,090 476,562 (319,592) (80,408) (29,298) (16,352)Reseals 656,260 290,943 115,067 406,010 (156,260) (500,000)Shoata Road South Hedland 75,000 0 0 0 (75,000)Pippingara Road 190,000 0 0 0 (60,000) (130,000)Wedgefield Road & Drainage Strategy 200,000 30,750 0 30,750 (75,000) (25,000) (100,000)South Hedland CBD 100,000 0 0 0 (100,000)Linemarking 0 0 0 0Drainage Construction 520,077 36,422 0 36,422 (153,721) (366,356)Footpath Construction 646,364 234,583 340,369 574,951 (300,000) (346,364)Kerbing Construction 130,000 0 17,010 17,010 (31,420) (30,000) (68,580)Walkway Lighting 32,745 4,500 0 4,500 (32,745)Dual Cycle Way (Port to South Link) 40,000 0 0 0 (40,000)TOTAL Expenditure 5,311,096 2,050,057 1,402,751 3,452,808 (763,058) (50,000) (693,250) (518,687) (134,000) (161,084) (64,165) (561,388) (367,612) (1,705,080) (346,364)
Roads Program Operating Expenditure*Current Budget
2015/16 TOTALYTD Actuals
Purchase
Orders
Outstanding
Total
Roadwork Signs 12,300 258 2,045 2,303
Street Signage 332,490 105,776 22,175 127,951
Unsealed Road Maintenance 244,260 82,363 17,296 99,659
Linemarking 50,000 4,015 5,198 9,213
Road Shoulder Maintenance 212,320 66,805 18,155 84,960
Roadworks General Maintenance 418,790 280,158 17,680 297,838
Kerb Maintenance 92,630 8,773 0 8,773
TOTAL Expenditure 1,362,790 548,148 82,549 630,697*for the purpose of calculating own source expenditure in accordance with the Roads to Recovery requirements.
Other Roads Operating Expenditure**Current Budget
2015/16 TOTALYTD Actuals
Purchase
Orders
Outstanding
Total
Drainage Maintenance 421,440 24,071 123 24,195
Floodwater Pump Maintenance 61,000 323 0 323
Cyclone Response 18,000 0 0 0
Footpath Maintenance 166,480 24,206 4,420 28,626
Street Cleaning 294,360 89,444 0 89,444
Street/Walkway Lighting 696,325 146,045 0 146,045
Footpath Sweeping 202,310 35,018 0 35,018
Medians Maintenance 36,850 2,098 0 2,098
Verge Slashing 125,450 27,254 0 27,254
Street Tree Maintenance 139,850 26,819 1,710 28,529
TOTAL Expenditure 2,162,065 375,278 6,253 381,532**for the purpose of calculating addtional own source expenditure in accordance with the annual WALGA Road Assets & Expenditure Report requirements.
TOWN OF PORT HEDLAND
MONTHLY STATEMENT OF FINANCIAL ACTIVITY
FOR THE PERIOD ENDED 30 NOVEMBER 2015
FEDERAL FUNDING SOURCES STATE FUNDING SOURCES INTERNAL FUNDING SOURCESEXPENDITURE
Page 27