Embed Size (px)
Citation preview

Town Special Districts in New York:Background, Trends and Issues
DIVISION OF LOCAL GOVERNMENT SERVICES & ECONOMIC DEVELOPMENT
A RESEARCH SERIES FROM THE
OFFICE OF THE NEW YORK STATE COMPTROLLER
LOCAL GOVERNMENT ISSUES IN FOCUS
“The revenue raised for
special district services
represents nearly one-
quarter of total revenues raised
by towns.”
“Should residents be charged at
different rates for substantially
the same public service
based on where they live
in a town?”
CONTENTS (VOL. 3 NO. 1 March 2007) Pg. #
Introduction ................................................................................... 2 Background .................................................................................... 3Changing Landscape in Towns ................................................... 4State Comptroller’s Responsibilities ........................................... 8Town Special District Finances ................................................. 10Policy Implications ...................................................................... 19
RMD15
Town Special Districts in New York:Background, Trends and Issues
Thomas P. DiNapoliState Comptroller
Summary• In addition to the 4,200 local governments in New York State, there are more than 6,900 town special districts. Special districts have been used liberally by towns over the last 50 years to address the increased residential needs brought on by suburban growth that were not necessarily occurring on a townwide basis.
• The demographic and fiscal landscape has changed. Continued population growth in towns has caused them to look and act more like cities. Urbanized towns now find themselves responsible for delivering services such as garbage collection, water and sewer systems on a large–scale basis. In light of these changes, special district proliferation may no longer be the ideal mechanism to provide services—especially in urbanized areas.
• The majority of special district revenues come from property taxes and assessments. Indeed, special districts can add hundreds of dollars to an individual tax bill. In 2004, $862 million, or 67 percent, of special district revenue came from property taxes and assessments. New York is the third highest taxed state in the nation in local property taxes.
• The amount of revenue raised by special districts is considerable. In 2004, towns raised $5.4 billion in revenues, including $1.3 billion (24 percent) for special districts. In certain counties, special district revenues represent a much greater share of total town revenues: Nassau (52 percent), Niagara (41 percent) and Erie (32 percent).
• Special districts in urbanized counties–areas where property tax concerns are growing– account for two-thirds of total special district revenues statewide. While the 140 special districts in Nassau County represent only two percent of the districts statewide, they are responsible for 31 percent of all special district revenues collected throughout the State. Districts in Suffolk, Erie and Westchester counties account for another 35 percent of special district revenues, and districts in the remaining 53 counties are responsible for the remaining one-third of special district revenues collected statewide.
• Recent developments in some Long Island special districts have raised concerns over special districts statewide. Media stories have highlighted a lack of transparency and potential abuse of taxpayer money. In addition, questions have been raised about whether special districts remain the best approach to delivering public services, and whether they operate efficiently and equitably for all taxpayers.
• There are some potential actions that State and local policy makers could consider as they pursue further study of this important issue. By encouraging local unit cost analysis of special
district operations, by requiring consolidation studies in heavily urbanized areas and by expanding the State’s Shared Municipal Services Incentive (SMSI) program to include special districts, policy makers can greatly improve the level and quality of information upon which to make critical decisions regarding equity, efficiency and transparency.

Town Special Districts in New York OFFICE OF THE STATE COMPTROLLER2
Introduction
There are 932 towns in New York, which encompass all areas of the State except those within the boundaries of cities or Native American reservations. Because of the outward migration from cities into suburban and rural areas over the past 50 years, many towns have fared better economically than other classes of governments, with sizable increases in suburban population and real property values. As growth has occurred, towns have found themselves facing service demands previously provided only to city dwellers, such as garbage collection, water and sewers.
In response, the State created a mechanism – the special district – by which towns could deliver certain services. A special district is a geographic area within a town established to address specific needs of the property owners within that district, utilizing charges1 and, in some cases, user fees paid by taxpayers within the district to finance these services. Special districts were statutorily authorized to assist towns in adjusting to patterns of growth that were not townwide, and have been used liberally by towns over the last several decades to address increased residential needs. The revenue raised to pay for special district services now represents a significant share of total revenue raised by local governments, which can cost a taxpayer hundreds of dollars annually.
Recently, questions have been raised about whether special districts remain the best approach to handling the increased growth within towns, and whether they operate efficiently and equitably for all taxpayers. Some of these questions have been fueled by the attention given to fire and sanitation districts on Long Island, where media stories highlighted a lack of transparency and potential abuse of taxpayer monies. That scrutiny, along with the changing landscape of towns, has brought more attention to both town board-administered special districts and special districts governed by separately elected boards.
The purpose of this report is to help shed light on how town special improvement districts are structured, how they operate and what fiscal burden they impose on property owners. It aims to inform policy makers at the State and local levels regarding special districts, their impact on town taxpayers and the town governments that administer them.
Town Special Districts in New York 3 DIVISION OF LOCAL GOVERNMENT SERVICES & ECONOMIC DEVELOPMENT
Background
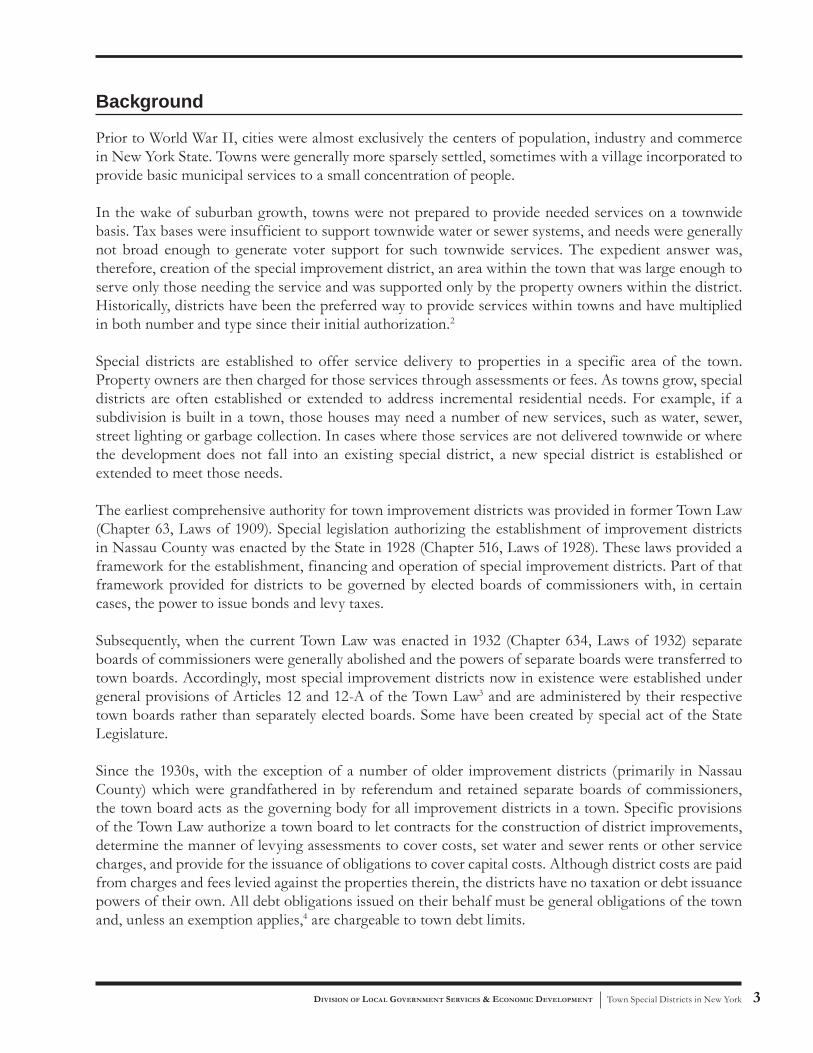
Prior to World War II, cities were almost exclusively the centers of population, industry and commerce in New York State. Towns were generally more sparsely settled, sometimes with a village incorporated to provide basic municipal services to a small concentration of people.
In the wake of suburban growth, towns were not prepared to provide needed services on a townwide basis. Tax bases were insufficient to support townwide water or sewer systems, and needs were generally not broad enough to generate voter support for such townwide services. The expedient answer was, therefore, creation of the special improvement district, an area within the town that was large enough to serve only those needing the service and was supported only by the property owners within the district. Historically, districts have been the preferred way to provide services within towns and have multiplied in both number and type since their initial authorization.2
Special districts are established to offer service delivery to properties in a specific area of the town. Property owners are then charged for those services through assessments or fees. As towns grow, special districts are often established or extended to address incremental residential needs. For example, if a subdivision is built in a town, those houses may need a number of new services, such as water, sewer, street lighting or garbage collection. In cases where those services are not delivered townwide or where the development does not fall into an existing special district, a new special district is established or extended to meet those needs.
The earliest comprehensive authority for town improvement districts was provided in former Town Law (Chapter 63, Laws of 1909). Special legislation authorizing the establishment of improvement districts in Nassau County was enacted by the State in 1928 (Chapter 516, Laws of 1928). These laws provided a framework for the establishment, financing and operation of special improvement districts. Part of that framework provided for districts to be governed by elected boards of commissioners with, in certain cases, the power to issue bonds and levy taxes.
Subsequently, when the current Town Law was enacted in 1932 (Chapter 634, Laws of 1932) separate boards of commissioners were generally abolished and the powers of separate boards were transferred to town boards. Accordingly, most special improvement districts now in existence were established under general provisions of Articles 12 and 12-A of the Town Law3 and are administered by their respective town boards rather than separately elected boards. Some have been created by special act of the State Legislature.
Since the 1930s, with the exception of a number of older improvement districts (primarily in Nassau County) which were grandfathered in by referendum and retained separate boards of commissioners, the town board acts as the governing body for all improvement districts in a town. Specific provisions of the Town Law authorize a town board to let contracts for the construction of district improvements, determine the manner of levying assessments to cover costs, set water and sewer rents or other service charges, and provide for the issuance of obligations to cover capital costs. Although district costs are paid from charges and fees levied against the properties therein, the districts have no taxation or debt issuance powers of their own. All debt obligations issued on their behalf must be general obligations of the town and, unless an exemption applies,4 are chargeable to town debt limits.

Town Special Districts in New York OFFICE OF THE STATE COMPTROLLER4
Changing Landscape in Towns
The majority of our cities, towns and villages were established prior to 1920. Historically, cities were more populous than towns and villages, but today, there are many more big towns in New York than there are big cities. Ten towns exceed 100,000 in population, whereas only the “Big Five” cities5 are this populous. Four of these “mega-towns” exceed the populations of Buffalo, Rochester, Syracuse and Yonkers—making them the largest municipalities outside of New York City. Further down the scale, the relative size of large towns becomes even more apparent. For example, only 12 cities today have populations greater than 50,000, whereas 21 towns exceed this level. And while only 27 of 62 cities have populations over 25,000, there are 60 towns and 6 villages that exceed this level. In fact, there are more towns exceeding the median city population than there are cities in total.
This growth has caused many towns to look and act more like traditional cities. According to a recent study on municipal structures from the Office of the State Comptroller (OSC), one-quarter of the towns in New York State are considered to be suburban or urban.7 Those 172 towns falling in the “suburban” category are likely to have relatively newer housing and fewer residents in poverty when compared to other groups. Twenty-nine towns statewide are considered to be “urban centers.” Towns in this category experience challenges similar to those faced by most cities. As expected, some regions of the State, including the North Country (98
percent), the Mohawk Valley (93 percent) and the Southern Tier (91 percent) have an overwhelming majority of rural towns, while all towns on Long Island and most in the mid-Hudson region (72 percent) are considered suburban or urban.
The growth of the suburban subdivision and the need for additional services are well illustrated by the example of Levittown in Nassau County. A large swathe of farmland was developed in the years following World War II to accommodate an upsurge in housing demand. By 1951, more than 17,000 homes had been constructed, and a suburb was created. With those homes came the need for access to water, fire protection, street lighting and garbage collection; many of these needs were met through the creation of special districts. Today, 50 years after its development, Levittown is in the middle of the most urbanized county in New York, and one of the most urbanized areas in the country.
0
1
2
3
4
5
6
7
8
9
10
1900 1910 1920 1930 1940 1950 1960 1970 1980 1990 2000 2005
Mill
ions
of P
eopl
e
Towns
Cities
Villages
*excluding New York CIty
Population in Towns, Cities* and Villages from 1900
0
100
200
300
400
500
600
700
Rural Suburban Urban
Num
ber o
f Tow
ns
610
172
29
Classifi cation of Towns in New York State6
Town Special Districts in New York 5 DIVISION OF LOCAL GOVERNMENT SERVICES & ECONOMIC DEVELOPMENT
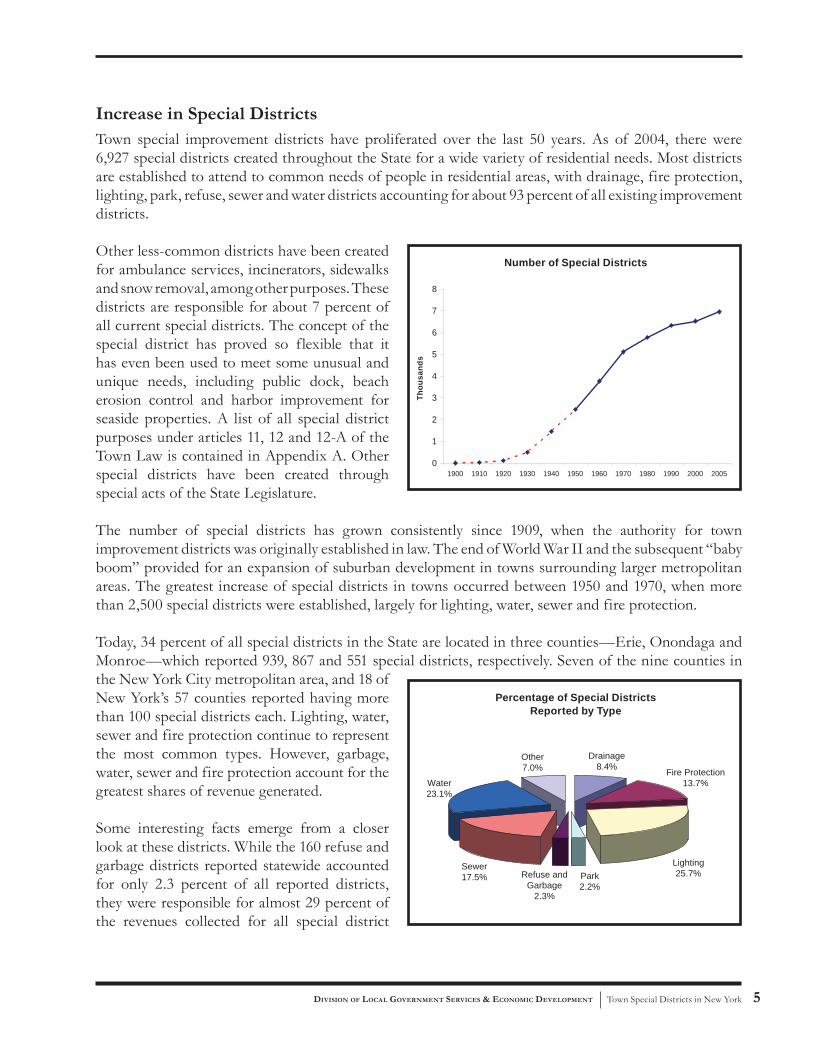
Increase in Special DistrictsTown special improvement districts have proliferated over the last 50 years. As of 2004, there were 6,927 special districts created throughout the State for a wide variety of residential needs. Most districts are established to attend to common needs of people in residential areas, with drainage, fire protection, lighting, park, refuse, sewer and water districts accounting for about 93 percent of all existing improvement districts.
Other less-common districts have been created for ambulance services, incinerators, sidewalks and snow removal, among other purposes. These districts are responsible for about 7 percent of all current special districts. The concept of the special district has proved so flexible that it has even been used to meet some unusual and unique needs, including public dock, beach erosion control and harbor improvement for seaside properties. A list of all special district purposes under articles 11, 12 and 12-A of the Town Law is contained in Appendix A. Other special districts have been created through special acts of the State Legislature.
The number of special districts has grown consistently since 1909, when the authority for townimprovement districts was originally established in law. The end of World War II and the subsequent “baby boom” provided for an expansion of suburban development in towns surrounding larger metropolitan areas. The greatest increase of special districts in towns occurred between 1950 and 1970, when more than 2,500 special districts were established, largely for lighting, water, sewer and fire protection.
Today, 34 percent of all special districts in the State are located in three counties—Erie, Onondaga and Monroe—which reported 939, 867 and 551 special districts, respectively. Seven of the nine counties in the New York City metropolitan area, and 18 of New York’s 57 counties reported having more than 100 special districts each. Lighting, water, sewer and fire protection continue to represent the most common types. However, garbage, water, sewer and fire protection account for the greatest shares of revenue generated.
Some interesting facts emerge from a closer look at these districts. While the 160 refuse and garbage districts reported statewide accounted for only 2.3 percent of all reported districts, they were responsible for almost 29 percent of the revenues collected for all special district
0
1
2
3
4
5
6
7
8
1900 1910 1920 1930 1940 1950 1960 1970 1980 1990 2000 2005
Number of Special Districts
Thou
sand
s
Sewer17.5%
Water23.1%
Other7.0%
Lighting25.7%
Fire Protection13.7%
Drainage8.4%
Refuse and Garbage
2.3%
Park2.2%
Percentage of Special Districts Reported by Type

Town Special Districts in New York OFFICE OF THE STATE COMPTROLLER6
purposes. Fifteen percent of all refuse and garbage districts statewide are located in Nassau County, but these districts are responsible for close to 50 percent of the statewide revenues reported for refuse and garbage. In other words, Nassau County’s 24 garbage districts are responsible for 14 percent ($181.1 million) of all revenues collected for special district purposes, statewide.
Conversely, the 1,783 lighting districts in the State were responsible for more than a quarter of the 6,927 districts reported statewide – the largest number of districts reported – yet accounted for only 4 percent of special district revenues collected. Again, Long Island lighting districts are responsible for a disproportionate amount of revenues. Combined, Nassau and Suffolk have 24 lighting districts, or 1.3 percent of the statewide total, yet are responsible for 55 percent of the statewide revenues for lighting purposes. Erie, Monroe and Onondaga counties, in comparison, have 427, 188 and 161 lighting districts, respectively – 44 percent of the statewide total – yet these districts are responsible for only 27 percent of all revenues collected for lighting purposes.
Sewer15.6%
Water21.3%
Other6.3%
Park9.9%
Refuse and Garbage28.9%
Drainage1.8% Fire Protection
12.1% Lighting4.1%
Chautauqua
Erie
Monroe
Onondaga
Ontario
Oneida
Madison
Broome
Franklin
Saratoga
Rensselaer
Ulster
DutchessSullivan
Orange
Westchester
Nassau
Suffolk
St. Lawrence
Cattaraugus Allegany
Wyoming
Steuben
Livingston
Genesee
Niagara Orleans
Wayne
Cayuga
Yates
Seneca
Schuyler
ChemungTioga
TompkinsCortland
Chenango
Otsego
Delaware
Oswego
Schoharie
Greene
Putnam
Rockland
Columbia
Albany
SchenectadyMontgomery
Fulton
Washington
Warren
Herkimer
Hamilton
Lewis
JeffersonEssex
Clinton
Concentration of Special Districtsin New York State
Number of Special DistrictsLess than 25
25 - 99
100 - 199
200 - 549
550 or more
Entities = 6,927
Percentage of Special Districts Reported by Total Revenues

Town Special Districts in New York 7 DIVISION OF LOCAL GOVERNMENT SERVICES & ECONOMIC DEVELOPMENT
Town Special District Entity Counts (2004)
Counties Drainage Fire Protection Lighting Park Refuse and
Garbage Sewer Water OtherTotal Town
Special Districts
Erie 144 43 427 3 23 119 143 37 939Onondaga 177 35 188 10 20 220 143 74 867Monroe 102 15 161 45 14 62 98 54 551Westchester 16 28 21 15 5 141 54 21 301Oneida 14 26 90 0 2 36 81 19 268Orange 22 7 26 3 9 72 54 13 206Suffolk 1 34 21 10 21 11 18 84 200Broome 24 33 30 1 1 22 38 1 150Chautauqua 4 33 41 1 1 26 42 2 150Nassau 1 31 3 23 24 5 28 25 140Saratoga 0 14 22 11 4 13 39 18 121Ulster 8 13 49 1 0 18 24 7 120Dutchess 1 7 25 1 1 34 42 8 119Ontario 6 25 29 1 0 17 37 3 118Sullivan 0 13 45 0 1 26 20 7 112Madison 5 16 28 0 0 13 35 10 107Rensselaer 0 16 22 0 0 29 36 4 107Franklin 1 21 15 0 1 27 34 2 101St. Lawrence 0 31 33 0 0 15 19 2 100Clinton 0 13 29 0 0 20 32 5 99Jefferson 1 15 26 0 0 20 35 1 98Wayne 3 18 24 0 2 11 32 8 98Niagara 7 12 13 0 13 18 26 3 92Oswego 0 22 22 0 0 15 31 0 90Putnam 6 10 10 11 4 12 26 10 89Schenectady 23 7 22 10 0 16 9 0 87Essex 1 9 7 2 2 23 39 2 85Cattaraugus 0 23 18 0 0 22 19 1 83Steuben 0 30 20 0 0 9 16 3 78Greene 0 14 27 0 0 14 12 8 75Allegany 0 25 14 0 1 11 15 5 71Herkimer 0 20 19 0 1 6 24 1 71Orleans 1 8 9 0 0 1 48 0 67Tompkins 1 7 18 0 0 11 28 1 66Otsego 0 16 32 0 1 4 8 0 61Cayuga 1 10 18 0 1 8 21 1 60Lewis 0 18 6 0 0 6 23 1 54Livingston 3 11 12 0 0 6 20 2 54Warren 1 9 10 2 1 11 20 0 54Albany 1 12 13 0 1 4 13 9 53Chenango 0 21 17 0 0 1 10 1 50Columbia 0 17 17 0 2 5 6 3 50Chemung 1 16 16 1 0 1 11 1 47Rockland 0 5 7 1 2 7 0 25 47Seneca 1 14 7 0 1 9 14 1 47Washington 2 25 8 1 0 2 6 0 44Delaware 0 4 25 0 0 2 12 0 43Genesee 1 10 0 0 0 8 20 1 40Wyoming 0 18 13 0 0 3 6 0 40Fulton 0 15 2 0 0 5 4 0 26Schoharie 0 9 8 0 0 3 3 0 23Montgomery 1 12 2 0 0 3 4 0 22Yates 0 8 2 0 0 2 9 0 21Schuyler 0 12 1 0 0 2 4 0 19Tioga 0 3 11 0 0 2 2 0 18Hamilton 0 7 0 0 1 1 5 2 16Cortland 0 5 2 0 0 1 4 0 12
Total 581 951 1,783 153 160 1,211 1,602 486 6,927

Town Special Districts in New York OFFICE OF THE STATE COMPTROLLER8
State Comptroller’s Responsibilities
The State Comptroller’s responsibility with respect to town special districts is defined in statute (Town Law, Articles 12 and 12-A). The Comptroller’s approval is required for the creation and/or extension of a special district established pursuant to articles 12 or 12-A of the Town Law if both of these criteria are met:
• The cost of establishing or extending a district is to be financed by the issuance of town bonds and notes; and• The cost of the district or extension to the “typical property” exceeds the cost threshold that is calculated annually by the State Comptroller.
This concept of cost threshold is based on a list (compiled by OSC) of costs by district type throughout the year. Generally, the cost threshold for a given year is based on an average of the costs of those new special districts of the same type created in the prior three years.
One important caveat to note is in the case of town improvements provided for under Article 12-C or, in the case of towns governed by the “Suburban Town Law,” Town Law §54. Under Article 12-C and Town Law §54, certain improvements (e.g., water, sewer, drainage) may be undertaken without the formation of a special district, with capital costs borne by either an area of benefited properties or part of the general tax levy on the entire area of the town outside of any incorporated villages. Operation and maintenance costs of such town improvements are borne by the entire town outside village area. OSC approval is required for these improvements if debt is to be issued and the estimated expense of the improvement exceeds one-tenth of one percent of the full valuation of taxable real property within the town outside of any villages —regardless of the estimated cost threshold.
In all cases where these statutes require OSC approval, the Comptroller must determine that:
• The public interest will be served by the proposed creation or extension, and• The cost will not be an undue burden upon the property owners who will bear the costs.
Reporting RequirementsTowns proposing Article 12 or 12-A special districts for which indebtedness is proposed, but which do not exceed the OSC cost threshold, are required to submit to OSC a copy of their notice of hearing on the district, which contains an estimate of costs for the typical property. This information is used by the Comptroller’s Office when calculating the annual cost threshold.
Irrespective of the date they were created, all special improvement districts must file annual financial reports with the State Comptroller pursuant to provisions in General Municipal Law §30, which states: “every municipal corporation and school, fire, improvement, and special district shall annually make a report of its financial condition to the Comptroller.” Special districts generally satisfy the requirements of GML §30 by reporting their finances as part of the respective town presentations or by filing separate reports. Towns with populations of less than 5,000 must file within 60 days. Towns with populations of more than 5,000 and less than 20,000 must file their reports within 90 days. Towns with populations of 20,000 or more must file within 120 days.

Town Special Districts in New York 9 DIVISION OF LOCAL GOVERNMENT SERVICES & ECONOMIC DEVELOPMENT
Audits of Special DistrictsOSC has the authority to audit town special districts. Most often, special district records and management practices are audited during a town audit, but occasionally OSC conducts specific audits of town special districts. Recent OSC audit findings have identified instances of poor internal controls and inefficient operations in some town special districts.
In Nassau County, commissioner-run districts have recently been the subject of increased scrutiny and public discussion. Concerns are mounting that these districts operate largely outside the scope of government oversight and that they impose too significant a tax burden.
This spike in interest follows a series of audits and a report* released by the Nassau County Comptroller in 2005. The report cites “serious financial mismanagement, a lack of oversight, few written policies and procedures, overspending, faulty contracting and questionable employment and benefit practices.”
The only “structural check” noted by the county comptroller is the annual district election. Unfortunately, there appear to be significant problems is this area, too. The report specifically cites inadequate public notices regarding elections, questionable election oversight and low voter turnout as evidence that “elections were administered in a manner so as to limit participation.”
In addition to accountability and transparency concerns raised in the report, there are also concerns over cost and efficiency. Findings from an operating cost analysis are presented which suggest that “large town-run districts that contract out services are far more efficient and less costly to operate than commissioner-run districts (Districts Nos. 1, 2 and 6 in the Town of Hempstead).” This inefficiency translates into tax bills that are up to three times higher for Hempstead residents compared to residents of other districts. The report further asserts that “the higher tax levies in Hempstead’s three districts compared to other districts are not explained by any differences in quality and scope of services provided.”
In light of these findings, the county comptroller has called for a comprehensive review of the administration and organization of all special districts in Nassau County, both commissioner-run as well as town-run special districts.
OSC recently released an audit** of Hempstead District No. 1 and found many of the same problems cited by the county. Specifically, the OSC audit cites: inexperienced and poorly trained fiscal staff; inaccurate financial records and tax reporting; potential conflicts of interest in purchasing and contracting; lack of independent audits of the District’s financial statements and failure to implement prior recommendations of State and local government auditors to improve internal controls over financial operations. The audit identifies $462,000 in excess costs which were passed on to taxpayers because of these problems.
* A summary of the Nassau County Comptroller sanitary district audit findings and links to the audit reports can be found at www.nassaucountyny.gov/agencies/Comptroller/NewsRelease/2005/9-08-05.html.
The report, entitled “Nassau County Special Districts: A Case for Reform,” can be found at www.nassaucountyny.gov/agencies/Comptroller/Docs/PDF/05Dec19-SpecDistRpt.pdf
**Sanitary District No. 1 Town of Hempstead Internal Controls Over Financial Operations, Office of the State Comptroller (2005-S-69).
Nassau County

Town Special Districts in New York OFFICE OF THE STATE COMPTROLLER10
Town Special District Finances8
Town special districts serve a specific subset of town residents. Most special districts are administered by town governments and their operations are funded through the collection of town real property taxes and assessments or through user fees.
A small minority of special districts are structured differently. These districts are not administered through towns, but rather have their own separately elected boards of commissioners and, in some cases, have the ability to levy taxes and issue debt. According to OSC records, these independent districts number around 100 and make up less than two percent of all special districts. Most of these districts are in Nassau County, including 11 of the 24 special sanitation districts in Nassau County’s three towns of North Hempstead, Hempstead and Oyster Bay.
Special District RevenuesIn most cases, special district revenues are collected through town taxes, assessments and user fees which are reported in annual financial statements as a portion of town revenues. In 2004, total revenues raised in towns were $5.4 billion; revenues for town special districts accounted for $1.3 billion (24 percent) of that amount.
Most special district revenues are collected with the property tax levy. These taxes and assessments accounted for $862 million (67 percent) of all special district revenues in 2004. User fees also play a significant role in the funding of special districts; $259 million (20 percent) of total special district revenues
are accounted for through the collection of water, sewer and garbage fees. The final $173 million (13 percent) are funds collected through other user fees and non-property taxes.
Nassau County (31 percent) and Suffolk County (19 percent) on Long Island are responsible for half of the State’s special district revenues. Combined with Erie (11 percent) and Westchester (5 percent), these four counties are responsible for two-thirds of all special district revenues. The other 53 counties together account for only 34 percent of the revenues collected for special districts.
Sewer Fees4.9%
Refuse Fees3.2%
Sales Tax1.9%
Other Non-Property Taxes
3.3%
Other8.2%
Water Fees11.8%
Real Property Taxes and
Assessmens66.6%
$1.3 billion
Nassau31%
Suffolk19%Erie
11%
Westchester5%
All Other Counties
34%
How Special Districts are Funded
Four Counties are Responsible for 66% ofAll Special District Revenues

Town Special Districts in New York 11 DIVISION OF LOCAL GOVERNMENT SERVICES & ECONOMIC DEVELOPMENT
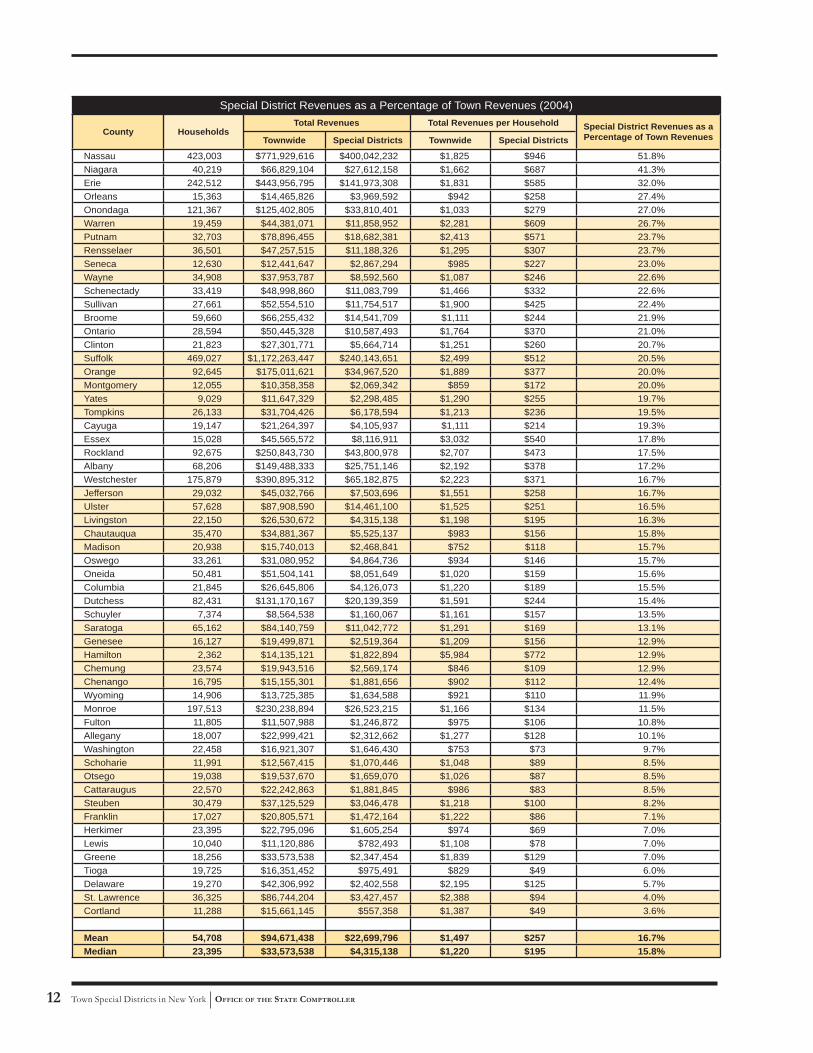
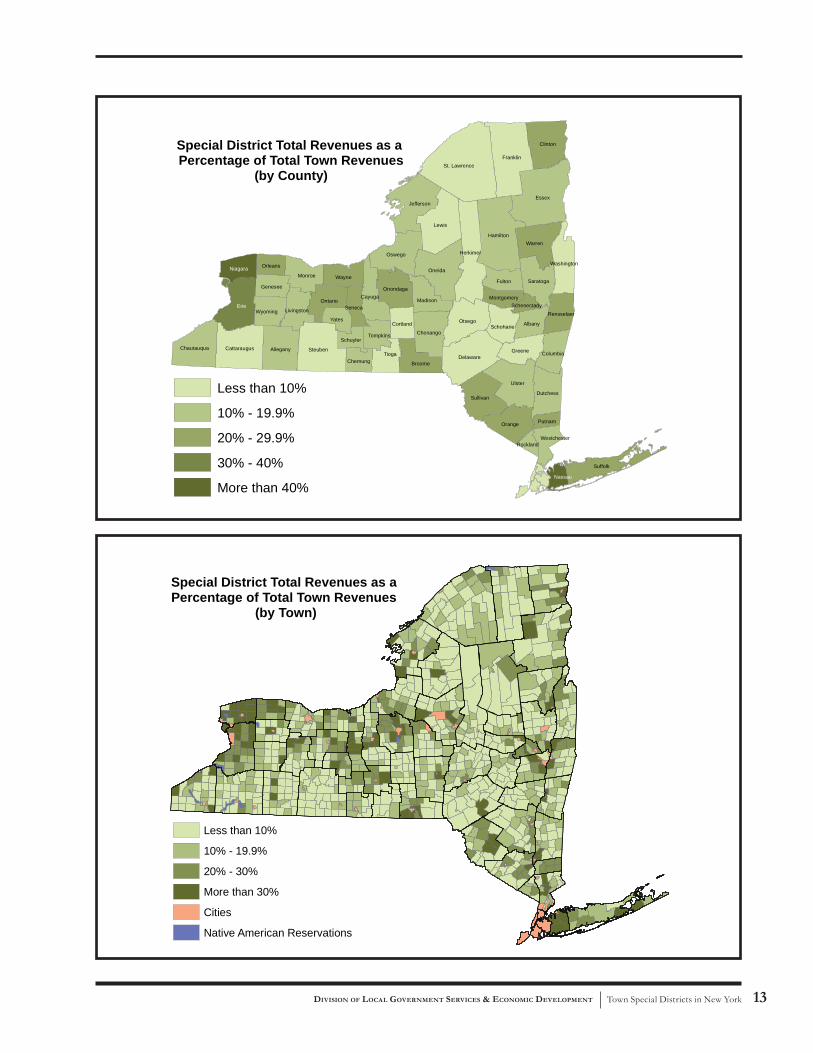
Special District Revenues as a Percentage of Total Town RevenuesThe following tables and corresponding maps offer more precise views of towns with strong reliance on special districts. Suburban towns outside cities bordering the Hudson River and west along the Thruway corridor had the greatest amounts of special district revenues. Within individual counties, special districts are responsible for 52 percent of all revenues in Nassau County, 41 percent in Niagara County and 32 percent in Erie County. Taxes and assessments on real property are responsible for two-thirds of all special district revenues statewide. Special districts in Niagara County (77 percent), Nassau County (65 percent) and Warren County (52 percent) were responsible for a majority of all real property taxes and assessment revenues collected by towns in those counties in 2004.
When examined on a per household basis, the relative significance of special districts varies widely. The portion of total town charges attributable to special districts per household range from as little as 3 percent (Tioga County) to as high as 77 percent (Niagara County).
When taxpayers try to piece together how much they actually pay for special districts, it is often difficult for them to make sense of their tax and utility bills. There is no set of standard billing practices and the multiple methods for billing and collecting taxes, assessments and fees can lead to confusion. Below are some ways residents pay for townwide and special district services.
Property Taxes and Assessments – Most often, town residents pay for services through property taxes. Special districts and Article 12-C improvements receive portions of taxes and assessments, and residents are billed at varying rates depending on a variety of factors. Special district portions of the charges are sometimes shown on tax bills, and at other times they are billed separately.
Special District User Fees – Special districts often bill residents directly for services like metered water usage fees or sewer rents. These fees may appear on property tax bills but are separate from real property tax and assessment collections.
Fees to Other Entities – Other organizations, like water and sewer authorities, are sometimes responsible for specific service or resource delivery. For example, a water authority can provide water to municipalities on a broader regional basis and residents are billed directly.
Lack of Transparency Leads to Taxpayer Confusion
Town Special Districts in New York OFFICE OF THE STATE COMPTROLLER12
Special District Revenues as a Percentage of Town Revenues (2004)
County HouseholdsTotal Revenues Total Revenues per Household Special District Revenues as a
Percentage of Town RevenuesTownwide Special Districts Townwide Special Districts
Nassau 423,003 $771,929,616 $400,042,232 $1,825 $946 51.8%Niagara 40,219 $66,829,104 $27,612,158 $1,662 $687 41.3%Erie 242,512 $443,956,795 $141,973,308 $1,831 $585 32.0%Orleans 15,363 $14,465,826 $3,969,592 $942 $258 27.4%Onondaga 121,367 $125,402,805 $33,810,401 $1,033 $279 27.0%Warren 19,459 $44,381,071 $11,858,952 $2,281 $609 26.7%Putnam 32,703 $78,896,455 $18,682,381 $2,413 $571 23.7%Rensselaer 36,501 $47,257,515 $11,188,326 $1,295 $307 23.7%Seneca 12,630 $12,441,647 $2,867,294 $985 $227 23.0%Wayne 34,908 $37,953,787 $8,592,560 $1,087 $246 22.6%Schenectady 33,419 $48,998,860 $11,083,799 $1,466 $332 22.6%Sullivan 27,661 $52,554,510 $11,754,517 $1,900 $425 22.4%Broome 59,660 $66,255,432 $14,541,709 $1,111 $244 21.9%Ontario 28,594 $50,445,328 $10,587,493 $1,764 $370 21.0%Clinton 21,823 $27,301,771 $5,664,714 $1,251 $260 20.7%Suffolk 469,027 $1,172,263,447 $240,143,651 $2,499 $512 20.5%Orange 92,645 $175,011,621 $34,967,520 $1,889 $377 20.0%Montgomery 12,055 $10,358,358 $2,069,342 $859 $172 20.0%Yates 9,029 $11,647,329 $2,298,485 $1,290 $255 19.7%Tompkins 26,133 $31,704,426 $6,178,594 $1,213 $236 19.5%Cayuga 19,147 $21,264,397 $4,105,937 $1,111 $214 19.3%Essex 15,028 $45,565,572 $8,116,911 $3,032 $540 17.8%Rockland 92,675 $250,843,730 $43,800,978 $2,707 $473 17.5%Albany 68,206 $149,488,333 $25,751,146 $2,192 $378 17.2%Westchester 175,879 $390,895,312 $65,182,875 $2,223 $371 16.7%Jefferson 29,032 $45,032,766 $7,503,696 $1,551 $258 16.7%Ulster 57,628 $87,908,590 $14,461,100 $1,525 $251 16.5%Livingston 22,150 $26,530,672 $4,315,138 $1,198 $195 16.3%Chautauqua 35,470 $34,881,367 $5,525,137 $983 $156 15.8%Madison 20,938 $15,740,013 $2,468,841 $752 $118 15.7%Oswego 33,261 $31,080,952 $4,864,736 $934 $146 15.7%Oneida 50,481 $51,504,141 $8,051,649 $1,020 $159 15.6%Columbia 21,845 $26,645,806 $4,126,073 $1,220 $189 15.5%Dutchess 82,431 $131,170,167 $20,139,359 $1,591 $244 15.4%Schuyler 7,374 $8,564,538 $1,160,067 $1,161 $157 13.5%Saratoga 65,162 $84,140,759 $11,042,772 $1,291 $169 13.1%Genesee 16,127 $19,499,871 $2,519,364 $1,209 $156 12.9%Hamilton 2,362 $14,135,121 $1,822,894 $5,984 $772 12.9%Chemung 23,574 $19,943,516 $2,569,174 $846 $109 12.9%Chenango 16,795 $15,155,301 $1,881,656 $902 $112 12.4%Wyoming 14,906 $13,725,385 $1,634,588 $921 $110 11.9%Monroe 197,513 $230,238,894 $26,523,215 $1,166 $134 11.5%Fulton 11,805 $11,507,988 $1,246,872 $975 $106 10.8%Allegany 18,007 $22,999,421 $2,312,662 $1,277 $128 10.1%Washington 22,458 $16,921,307 $1,646,430 $753 $73 9.7%Schoharie 11,991 $12,567,415 $1,070,446 $1,048 $89 8.5%Otsego 19,038 $19,537,670 $1,659,070 $1,026 $87 8.5%Cattaraugus 22,570 $22,242,863 $1,881,845 $986 $83 8.5%Steuben 30,479 $37,125,529 $3,046,478 $1,218 $100 8.2%Franklin 17,027 $20,805,571 $1,472,164 $1,222 $86 7.1%Herkimer 23,395 $22,795,096 $1,605,254 $974 $69 7.0%Lewis 10,040 $11,120,886 $782,493 $1,108 $78 7.0%Greene 18,256 $33,573,538 $2,347,454 $1,839 $129 7.0%Tioga 19,725 $16,351,452 $975,491 $829 $49 6.0%Delaware 19,270 $42,306,992 $2,402,558 $2,195 $125 5.7%St. Lawrence 36,325 $86,744,204 $3,427,457 $2,388 $94 4.0%Cortland 11,288 $15,661,145 $557,358 $1,387 $49 3.6%
Mean 54,708 $94,671,438 $22,699,796 $1,497 $257 16.7%Median 23,395 $33,573,538 $4,315,138 $1,220 $195 15.8%
Town Special Districts in New York 13 DIVISION OF LOCAL GOVERNMENT SERVICES & ECONOMIC DEVELOPMENT
Chautauqua Cattaraugus Allegany Steuben
LivingstonWyomingErie
Niagara Orleans
Monroe
Ontario
Wayne
Seneca
Yates
Schuyler
Chemung
Tompkins
Tioga
CayugaOnondaga
Oswego
Cortland
Broome
Chenango
Delaware
Sullivan
Orange Putnam
RocklandWestchester
Nassau
Suffolk
Dutchess
Ulster
Columbia
SchoharieOtsego
Greene
Albany
RensselaerSchenectady
Montgomery
Saratoga
Washington
Warren
Fulton
Herkimer
Oneida
Lewis
Jefferson
Hamilton
Essex
Clinton
FranklinSt. Lawrence
Genesee
Madison
Less than 10%
10% - 19.9%
20% - 29.9%
30% - 40%
More than 40%
Special District Total Revenues as aPercentage of Total Town Revenues
(by County)
Less than 10%
10% - 19.9%
20% - 30%
More than 30%
Cities
Native American Reservations
Special District Total Revenues as aPercentage of Total Town Revenues
(by Town)

Town Special Districts in New York OFFICE OF THE STATE COMPTROLLER14
Average Property Taxes and Assessments per Household for Townwide vs Special District-wide Services (2004)
County Households
Property Taxes and Assessments Property Taxes and Assessmentsper Household Special District
Property Taxes and Assessments as
a Percent of Town Total
Townwide Special Districts Townwide Special Districts
Niagara 40,219 $22,256,867 $17,042,447 $553 $424 76.6%Nassau 423,003 $415,575,774 $271,299,268 $982 $641 65.3%Warren 19,459 $13,353,487 $6,976,492 $686 $359 52.2%Montgomery 12,055 $2,242,539 $1,111,566 $186 $92 49.6%Genesee 16,127 $2,666,243 $1,239,059 $165 $77 46.5%Ontario 28,594 $9,680,967 $4,277,743 $339 $150 44.2%Erie 242,512 $244,737,778 $102,184,549 $1,009 $421 41.8%Oneida 50,481 $16,017,333 $6,570,709 $317 $130 41.0%Saratoga 65,162 $18,403,061 $7,391,050 $282 $113 40.2%Tompkins 26,133 $14,085,880 $5,151,309 $539 $197 36.6%Cayuga 19,147 $7,153,508 $2,568,394 $374 $134 35.9%Albany 68,206 $41,104,850 $13,923,499 $603 $204 33.9%Chemung 23,574 $5,989,234 $1,993,117 $254 $85 33.3%Onondaga 121,367 $84,329,275 $27,659,145 $695 $228 32.8%Broome 59,660 $24,309,688 $7,751,891 $407 $130 31.9%Orleans 15,363 $7,564,597 $2,308,520 $492 $150 30.5%Putnam 32,703 $50,875,442 $15,521,927 $1,556 $475 30.5%Seneca 12,630 $5,338,530 $1,620,393 $423 $128 30.4%Suffolk 469,027 $558,337,789 $169,453,596 $1,190 $361 30.3%Rensselaer 36,501 $23,770,515 $7,052,285 $651 $193 29.7%Schenectady 33,419 $23,548,462 $6,319,693 $705 $189 26.8%Jefferson 29,032 $8,152,786 $2,179,456 $281 $75 26.7%Columbia 21,845 $9,727,335 $2,584,249 $445 $118 26.6%Orange 92,645 $87,151,571 $22,934,634 $941 $248 26.3%Oswego 33,261 $16,577,762 $3,960,996 $498 $119 23.9%Fulton 11,805 $4,362,162 $1,039,468 $370 $88 23.8%Clinton 21,823 $11,506,768 $2,725,572 $527 $125 23.7%Chautauqua 35,470 $14,487,429 $3,423,267 $408 $97 23.6%Wayne 34,908 $17,274,047 $3,938,031 $495 $113 22.8%Schuyler 7,374 $4,278,820 $929,337 $580 $126 21.7%Chenango 16,795 $7,766,996 $1,678,745 $462 $100 21.6%Yates 9,029 $6,618,852 $1,406,430 $733 $156 21.2%Madison 20,938 $10,801,041 $2,044,249 $516 $98 18.9%Westchester 175,879 $218,315,000 $40,841,266 $1,241 $232 18.7%Livingston 22,150 $11,887,827 $2,209,851 $537 $100 18.6%Monroe 197,513 $123,527,059 $22,716,098 $625 $115 18.4%Dutchess 82,431 $61,808,916 $10,132,734 $750 $123 16.4%Essex 15,028 $22,203,391 $3,529,998 $1,477 $235 15.9%Wyoming 14,906 $8,335,930 $1,314,534 $559 $88 15.8%Hamilton 2,362 $10,080,154 $1,481,855 $4,268 $627 14.7%Ulster 57,628 $54,696,903 $7,970,643 $949 $138 14.6%Sullivan 27,661 $30,102,822 $4,254,256 $1,088 $154 14.1%Rockland 92,675 $174,221,041 $24,483,669 $1,880 $264 14.1%Washington 22,458 $10,914,535 $1,495,534 $486 $67 13.7%Herkimer 23,395 $9,252,770 $1,264,462 $396 $54 13.7%St. Lawrence 36,325 $15,234,034 $1,948,486 $419 $54 12.8%Schoharie 11,991 $7,709,518 $966,815 $643 $81 12.5%Franklin 17,027 $10,943,792 $1,182,364 $643 $69 10.8%Cattaraugus 22,570 $9,906,502 $1,023,238 $439 $45 10.3%Steuben 30,479 $17,413,080 $1,747,022 $571 $57 10.0%Allegany 18,007 $12,197,026 $1,172,931 $677 $65 9.6%Greene 18,256 $13,988,265 $1,333,725 $766 $73 9.5%Otsego 19,038 $10,646,973 $994,867 $559 $52 9.3%Lewis 10,040 $7,462,170 $494,863 $743 $49 6.6%Cortland 11,288 $5,640,620 $337,453 $500 $30 6.0%Delaware 19,270 $16,503,788 $482,595 $856 $25 2.9%Tioga 19,725 $6,276,472 $172,369 $318 $9 2.7%
Mean 54,708 $46,654,666 $15,119,521 $703 $161 24.8%Median 23,395 $13,353,487 $2,568,394 $559 $119 22.8%

Town Special Districts in New York 15 DIVISION OF LOCAL GOVERNMENT SERVICES & ECONOMIC DEVELOPMENT
Chautauqua Cattaraugus
Sullivan
Ulster
Orange
Dutchess
Putnam
Rockland
Westchester
Nassau
Suffolk
ColumbiaGreeneDelaware
OtsegoSchoharie
AlbanyRensselaer
Schenectady
Saratoga
Washington
Montgomery
Fulton
HamiltonWarren
Essex
Franklin
Clinton
St. Lawrence
Herkimer
Lewis
Oneida
Jefferson
Oswego
OnondagaMadison
Cortland
Broome
Chenango
Tioga
Tompkins
Cayuga
Seneca
Wayne
Ontario
Yates
Schuyler
Chemung
SteubenAllegany
LivingstonErie
Wyoming
Genesee
Niagara Orleans
Monroe
Less than 5%
5% - 19.9%
20% - 34.9%
35% - 50%
More than 50%
Special District Property Taxes and Assessments as aPercentage of Town Property Taxes and Assessments
(by County)
Less than 10%
10% - 24.9%
25% - 44.9%
45% - 70%
More than 70%
Cities
Native American Reservations
Special District Property Taxes and Assessments as aPercentage of Town Property Taxes and Assessments
(by Town)

Town Special Districts in New York OFFICE OF THE STATE COMPTROLLER16
Special District Revenues as a Percentage of Statewide Totals (2004)
CountyStatewide Revenues Collected
Drainage Fire Protection Lighting Park Parking
Refuse and
GarbageSewer Water Miscellaneous
Nassau 30.9% 48.1% 9.3% 25.5% 58.1% 91.9% 48.4% 6.7% 25.9% 20.8%Suffolk 18.6% 0.0% 11.9% 29.6% 35.9% 4.8% 28.5% 2.6% 8.4% 32.5%Erie 11.0% 27.0% 11.7% 16.3% 0.2% 0.0% 7.6% 25.6% 6.9% 12.4%Westchester 5.0% 0.2% 4.4% 2.2% 1.2% 2.5% 3.3% 3.7% 10.8% 7.4%Rockland 3.4% 0.0% 1.1% 2.3% 0.0% 0.0% 6.3% 3.7% 1.0% 9.0%Orange 2.7% 0.0% 1.4% 0.9% 0.0% 0.1% 1.8% 6.6% 3.9% 1.8%Onondaga 2.6% 6.1% 8.8% 4.1% 0.1% 0.0% 1.1% 1.9% 2.8% 0.7%Niagara 2.1% 1.8% 3.3% 0.4% 0.0% 0.0% 1.0% 5.2% 2.6% 0.4%Monroe 2.0% 12.7% 3.9% 6.1% 0.2% 0.0% 0.1% 4.9% 1.2% 0.6%Albany 2.0% 0.1% 2.2% 0.1% 0.0% 0.0% 0.0% 4.2% 4.5% 1.7%Dutchess 1.6% 1.5% 1.2% 1.7% 0.0% 0.0% 0.0% 5.3% 2.2% 0.4%Putnam 1.4% 0.0% 3.7% 0.4% 0.7% 0.0% 1.0% 1.2% 1.5% 1.8%Broome 1.1% 0.3% 2.0% 1.0% 0.7% 0.0% 0.0% 2.3% 1.4% 1.4%Ulster 1.1% 0.0% 1.0% 0.7% 0.0% 0.0% 0.0% 2.8% 2.1% 1.1%Warren 0.9% 0.0% 2.3% 0.3% 0.0% 0.0% 0.0% 1.1% 2.1% 0.0%Sullivan 0.9% 0.0% 0.5% 1.0% 0.0% 0.7% 0.1% 3.4% 1.0% 0.5%Rensselaer 0.9% 0.0% 1.4% 0.3% 0.0% 0.0% 0.2% 1.6% 1.4% 1.1%Schenectady 0.9% 0.2% 0.5% 0.3% 0.0% 0.0% 0.0% 2.0% 2.2% 0.0%Saratoga 0.9% 0.0% 1.1% 0.6% 0.3% 0.0% 0.0% 0.7% 2.1% 1.9%Ontario 0.8% 0.5% 1.6% 0.3% 0.0% 0.0% 0.0% 1.9% 1.4% 0.0%Wayne 0.7% 1.0% 1.4% 0.3% 0.0% 0.0% 0.0% 1.3% 1.2% 0.1%Essex 0.6% 0.0% 0.7% 0.1% 2.1% 0.0% 0.0% 0.9% 0.9% 0.1%Oneida 0.6% 0.0% 1.6% 0.5% 0.0% 0.0% 0.3% 1.2% 0.7% 0.0%Jefferson 0.6% 0.0% 0.8% 0.2% 0.0% 0.0% 0.0% 0.9% 1.4% 0.5%Tompkins 0.5% 0.0% 2.5% 0.1% 0.0% 0.0% 0.0% 0.3% 0.5% 0.3%Clinton 0.4% 0.2% 0.3% 0.7% 0.0% 0.0% 0.0% 0.9% 0.9% 0.8%Chautauqua 0.4% 0.2% 1.3% 0.4% 0.0% 0.0% 0.0% 0.6% 0.7% 0.0%Oswego 0.4% 0.0% 1.9% 0.2% 0.0% 0.0% 0.0% 0.4% 0.3% 0.0%Livingston 0.3% 0.0% 0.7% 0.1% 0.0% 0.0% 0.0% 0.3% 0.9% 0.0%Columbia 0.3% 0.0% 0.9% 0.3% 0.0% 0.0% 0.0% 0.6% 0.4% 0.3%Cayuga 0.3% 0.0% 0.4% 0.1% 0.0% 0.0% 0.0% 0.7% 0.7% 0.0%Orleans 0.3% 0.0% 0.5% 0.1% 0.0% 0.0% 0.0% 0.0% 1.1% 0.0%St. Lawrence 0.3% 0.0% 0.9% 0.3% 0.0% 0.0% 0.0% 0.4% 0.4% 0.0%Steuben 0.2% 0.1% 0.9% 0.2% 0.0% 0.0% 0.0% 0.4% 0.3% 0.0%Seneca 0.2% 0.0% 0.5% 0.1% 0.1% 0.0% 0.0% 0.3% 0.4% 0.1%Chemung 0.2% 0.0% 0.8% 0.5% 0.1% 0.0% 0.0% 0.0% 0.2% 0.4%Genesee 0.2% 0.0% 0.6% 0.0% 0.0% 0.0% 0.0% 0.2% 0.4% 0.0%Madison 0.2% 0.0% 0.5% 0.1% 0.0% 0.0% 0.0% 0.2% 0.2% 0.7%Delaware 0.2% 0.0% 0.2% 0.2% 0.0% 0.0% 0.0% 0.8% 0.2% 0.0%Greene 0.2% 0.0% 0.7% 0.3% 0.0% 0.0% 0.0% 0.3% 0.1% 0.1%Allegany 0.2% 0.0% 0.4% 0.2% 0.0% 0.0% 0.0% 0.3% 0.3% 0.1%Yates 0.2% 0.0% 0.4% 0.0% 0.0% 0.0% 0.0% 0.3% 0.4% 0.0%Montgomery 0.2% 0.0% 0.7% 0.0% 0.0% 0.0% 0.0% 0.2% 0.2% 0.0%Cattaraugus 0.1% 0.0% 0.5% 0.1% 0.0% 0.0% 0.0% 0.2% 0.3% 0.0%Chenango 0.1% 0.0% 1.0% 0.1% 0.0% 0.0% 0.0% 0.1% 0.1% 0.0%Hamilton 0.1% 0.0% 0.2% 0.0% 0.0% 0.0% 0.0% 0.1% 0.4% 0.4%Otsego 0.1% 0.0% 0.5% 0.2% 0.0% 0.0% 0.0% 0.2% 0.1% 0.1%Washington 0.1% 0.0% 0.8% 0.1% 0.0% 0.0% 0.0% 0.0% 0.1% 0.0%Wyoming 0.1% 0.0% 0.6% 0.1% 0.0% 0.0% 0.0% 0.1% 0.1% 0.0%Herkimer 0.1% 0.0% 0.5% 0.1% 0.0% 0.0% 0.0% 0.1% 0.2% 0.0%Franklin 0.1% 0.0% 0.5% 0.1% 0.0% 0.0% 0.0% 0.2% 0.1% 0.0%Fulton 0.1% 0.0% 0.6% 0.0% 0.0% 0.0% 0.0% 0.0% 0.0% 0.0%Schuyler 0.1% 0.0% 0.5% 0.0% 0.0% 0.0% 0.0% 0.0% 0.1% 0.0%Schoharie 0.1% 0.0% 0.6% 0.0% 0.0% 0.0% 0.0% 0.0% 0.0% 0.0%Tioga 0.1% 0.0% 0.0% 0.1% 0.0% 0.0% 0.0% 0.0% 0.3% 0.0%Lewis 0.1% 0.0% 0.3% 0.0% 0.0% 0.0% 0.0% 0.0% 0.1% 0.0%Cortland 0.0% 0.0% 0.1% 0.0% 0.0% 0.0% 0.0% 0.1% 0.1% 0.0%
Totals 100.0% 100.0% 100.0% 100.0% 100.0% 100.0% 100.0% 100.0% 100.0% 100.0%

Town Special Districts in New York 17 DIVISION OF LOCAL GOVERNMENT SERVICES & ECONOMIC DEVELOPMENT
Chautauqua Cattaraugus Allegany Steuben
Schuyler
Yates
Ontario
LivingstonWyoming
Genesee
Erie
Niagara Orleans
Monroe Wayne
Seneca
Cayuga
Tompkins
Tioga
Cortland
Broome
Onondaga
Chenango
Delaware
Sullivan
Ulster
Dutchess
Orange Putnam
RocklandWestchester
Nassau
Suffolk
ColumbiaGreene
SchoharieAlbany
RensselaerSchenectady
Otsego
Madison
Oneida
Oswego
Jefferson
Lewis
Hamilton
Herkimer
Fulton Saratoga
Warren
Essex
Washington
Clinton
FranklinSt. Lawrence
Chemung
Montgomery
Special District Burden Per Household*
Less than $50
$50 - $174
$175 - $349
$350 - $600
More than $600*See table on page 12
Special District ExpendituresTowns reported expenses of $6 billion in 2004. Special district expenditures accounted for $1.24 billion (21 percent) of these expenditures. Excluding debt service, current expenditures account for $1.12 billion.
In some functional categories, like health and fire protection, expenses are predominantly contractual in nature, with very little personal service or capital expenditures. Health and fire protection account for about 17 percent of all functional expenditures in special districts. Most health expenditures are for ambulance services. Both of these services are often performed by ambulance and fire companies, which contract with towns to provide services to specific areas. In many cases, the employees are volunteers and are not accounted for in personal service costs.
Contractual Services:63.0%
DebtService: 9.1%
PersonalServices:26.1%
Equipment and Capital: 1.7%
$1.2 billion
Total Special District Fund Expenses

Town Special Districts in New York OFFICE OF THE STATE COMPTROLLER18
Fire protection is provided through two different mechanisms within towns – fire districts and fire protection districts.
Fire districts are autonomous public corporations, independent from the towns in which they are located, established for the primary purpose of providing fire protection and responding to certain other types of emergencies. They are usually governed by an elected board of fire commissioners and have the authority to levy taxes. Fire districts have the authority to incur debt generally without approval from any other governmental entity. Fire district boundaries sometimes cross town and county lines. Fire districts must file their own financial reports (the Annual Update Document, or AUD) annually with OSC. As of 2004, there were 871 fire districts statewide which raised total revenues of $492 million. Because fire districts are separate governmental entities, they are not included in the analysis presented in this report.
Fire protection districts are administrative units of towns, not independent public corporations. Towns, on behalf of their fire protection districts, contract with fire companies, fire districts, cities or villages for the provision of fire protection and certain other services within the fire protection districts. The amounts paid under these contracts are assessed and levied on taxable property within the districts at the same time and in the same manner as town taxes. Contracts for fire protection are responsible for 95 percent of fire protection expenditures within towns. All budgetary controls and financial reporting are handled by town governments; fire protection districts are not required to file separate AUDs with OSC. Fire protection districts are included in the analysis in this report.
Fire Protection in Towns– a Primer
$0
$50
$100
$150
$200
$250
$300
$350
$400
$450
GeneralGovernment
Police Health Transportation Culture andRecreation
Fire Protection Utilities Other CommunityServices
.6% 1.2%
13.6%
3.0%
5.5%
11.1%
30.9%
34.2%
refusegarbagedrainage
watersewer
parks
lightingparking
ambulance
fire
Special District Expenditures by Purpose$1.12 Billion
Current Operations
Mill
ions Contractual Services 69.8%
PersonalServices:28.4%
Equipment and Capital Outlay: 1.9%

Town Special Districts in New York 19 DIVISION OF LOCAL GOVERNMENT SERVICES & ECONOMIC DEVELOPMENT
Policy Implications
Special improvement districts have played an important role in the delivery of town services for many decades. Their creation reflected the unique service needs of certain communities as well as the desire to allocate costs for those services to only those who received them. As the population of New York has shifted and more people have moved out of cities and into surrounding towns, the question as to whether special districts remain the ideal mechanism for providing these services is one that deserves thoughtful consideration.
The number of special districts has increased exponentially over the years and they continue to be created. In fact, there are examples of policy decisions at higher levels of government, not just at the local level, that spur municipalities to create additional districts (see textbox). As such, focus on the administrative and operational workings of special districts is imperative.
Because towns are so diverse in their composition and operation, it is difficult to develop standardized models for specific service delivery. However, any cost/benefit analysis of special districts within and among towns should take into consideration issues of equity, efficiency and transparency when framing discussions about special districts.
By January 2008, communities within urbanized areas (as defined by the Census Bureau) are required by the EPA to have established storm water management programs aimed at controlling the discharge of polluted water from storm water systems into natural waters. Because local governments control the ways in which land is used and developed within their area, affected municipalities must enact local storm water management laws that amend existing or enact new subdivision, site plan and/or zoning laws or ordinances to require construction site operators to comply with the requirements established by the EPA.
In addition to completion of their storm water management plans, affected local governments must consider ways to pay for administration and maintenance of the plans. Towns impacted by this requirement may have several options for funding these activities, including general appropriation on a townwide basis; the creation of drainage improvement districts wherein storm water activities in a discrete area would be funded based on the assessed benefit to each property within the district; or implementation of drainage improvements without districts wherein costs of storm water management plans would be spread over the entire town, outside village area, and/or restricted to the benefited area by the town board. The town board may authorize issuance of debt, including bonds to fund the construction of new storm water management facilities or capital improvements to its existing system.
Affected municipalities will need to budget for: program development and creation of new local enactments; technical services for storm water plan review; the required storm water management officer and contact person; and site inspections and enforcement. Affected municipalities will also have to establish and implement programs to maintain storm water management practices (treatment ponds, wetlands, etc). As local governments grapple with ways to fund both the initial capital improvements and the ongoing administrative and capital maintenance costs associated with the plans, there is clearly the potential for the creation of new special districts.
Storm Water Management: Potential Demand for the Creation of New Districts

Town Special Districts in New York OFFICE OF THE STATE COMPTROLLER20
In urbanized and suburbanized towns, which make up almost one-quarter of all towns in the State, many residents in special districts are charged different rates for the same service. As new developments are built, new special districts are often established for specific services and their residents are responsible for paying for the service expenses, including capital infrastructure. This is not how all town services are funded. For example, roads in new developments generally are not paid for solely by those who live there; they are paid for with townwide resources. Should the cost of water or sewer systems be treated differently than roads? When services are widespread, should residents be charged at different rates for substantially the same public services based on where they live in the town? What costs are appropriate to share on a larger geographic basis, and across a longer timeline? Is it fair for a new resident in a new development to bear a higher cost for sewer service while a new resident in an older neighborhood receives the same services at lower cost because their section of the sewer system was built 20 years ago?
Efficiency in towns and districts is also a concern. Many urbanized towns must administer multiple special districts. Erie County towns administer more than 400 lighting districts and Onondaga County towns have more than 200 sewer districts. Towns are responsible for allocating costs, tracking revenues and levying different taxes, assessments and fees on the residents living in each district. Would it be more efficient for urbanized towns to consolidate districts in order to simplify the administration of these services? Could economies of scale be realized?
The Nassau County Comptroller found that operating costs in certain commissioner-run districts in Nassau County towns were much higher than those administered through town boards. These districts have the power to issue debt and levy taxes, and historically some have operated with very little transparency. If provided with comparative information, would residents conclude that town board governance might be more beneficial?
Special districts are supported primarily through taxes and assessments. The level of “tax” burden that special districts impose varies from one community to the next. In some areas, this support can add hundreds of dollars to a household’s tax bill each year. In his study, the Nassau County Comptroller found that bills for services provided in Hempstead were up to three times higher than those provided in other districts. Moreover, the excessive cost difference did not appear to relate to the level of service provided.
New York State ranks third in the nation in terms of local property tax burden – 56 percent above the national average in 2004. Any opportunity to alleviate some of that burden, including improving the efficiency of special districts, warrants further investigation.
In order to analyze and address these issues, State and local policy makers could consider the following actions:
Unit Cost Analysis – The State and local governments could begin conducting unit cost studies similar to the one conducted in Nassau County. Findings from such studies could shed light on possible inequities and inefficiencies in the current delivery of services.

Town Special Districts in New York 21 DIVISION OF LOCAL GOVERNMENT SERVICES & ECONOMIC DEVELOPMENT
Thresholds – The State Legislature could consider enacting legislation which would compel towns to formally undertake a consolidation study if certain prescribed thresholds or triggers are met. For example, thresholds could be based on the percentage of population living in an area served by multiple special districts with the same purpose. For instance, once a town has 65 percent or more of its population living in an area serviced by multiple districts of the same type, the town would have to formally study either consolidation of these districts or, if authorized, delivery of services on a town outside village basis.9
Expansion of the Shared Municipal Services Incentive (SMSI) Program – The State currently offers grants to local governments looking at consolidation opportunities. The program could be expanded to include special districts as eligible participants.
Purposes of Special Districts Under Articles 11, 12 and 12-A of the Town Law 10
• Ambulance• Aquatic Plant Growth Control• Beach Erosion Control• Dock• Drainage• Fire Alarm• Fire Protection • Harbor Improvement • Lighting• Park• Public Dock• Public Parking• Refuse and Garbage Disposal• Sewage Disposal• Sewer• Sidewalk• Snow Removal• Wastewater Disposal• Water• Water Acquisition and Storage• Water Quality Treatment• Water Storage and Distribution• Water Supply
Appendix A
Town Special Districts in New York OFFICE OF THE STATE COMPTROLLER22
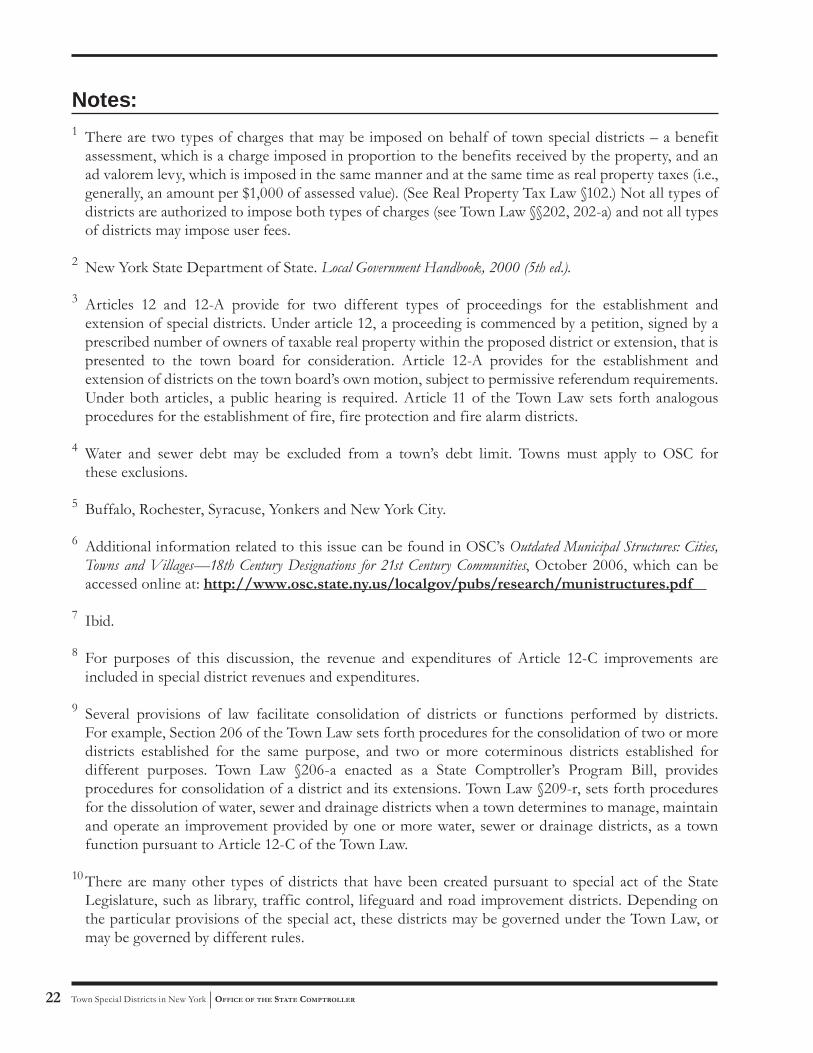
Notes:1 There are two types of charges that may be imposed on behalf of town special districts – a benefit assessment, which is a charge imposed in proportion to the benefits received by the property, and an ad valorem levy, which is imposed in the same manner and at the same time as real property taxes (i.e., generally, an amount per $1,000 of assessed value). (See Real Property Tax Law §102.) Not all types of districts are authorized to impose both types of charges (see Town Law §§202, 202-a) and not all types of districts may impose user fees.
2 New York State Department of State. Local Government Handbook, 2000 (5th ed.).
3 Articles 12 and 12-A provide for two different types of proceedings for the establishment and extension of special districts. Under article 12, a proceeding is commenced by a petition, signed by a prescribed number of owners of taxable real property within the proposed district or extension, that is presented to the town board for consideration. Article 12-A provides for the establishment and extension of districts on the town board’s own motion, subject to permissive referendum requirements. Under both articles, a public hearing is required. Article 11 of the Town Law sets forth analogous procedures for the establishment of fire, fire protection and fire alarm districts.
4 Water and sewer debt may be excluded from a town’s debt limit. Towns must apply to OSC for these exclusions.
5 Buffalo, Rochester, Syracuse, Yonkers and New York City.
6 Additional information related to this issue can be found in OSC’s Outdated Municipal Structures: Cities, Towns and Villages—18th Century Designations for 21st Century Communities, October 2006, which can be accessed online at: http://www.osc.state.ny.us/localgov/pubs/research/munistructures.pdf
7 Ibid.
8 For purposes of this discussion, the revenue and expenditures of Article 12-C improvements are included in special district revenues and expenditures.
9 Several provisions of law facilitate consolidation of districts or functions performed by districts. For example, Section 206 of the Town Law sets forth procedures for the consolidation of two or more districts established for the same purpose, and two or more coterminous districts established for different purposes. Town Law §206-a enacted as a State Comptroller’s Program Bill, provides procedures for consolidation of a district and its extensions. Town Law §209-r, sets forth procedures for the dissolution of water, sewer and drainage districts when a town determines to manage, maintain and operate an improvement provided by one or more water, sewer or drainage districts, as a town function pursuant to Article 12-C of the Town Law.
10 There are many other types of districts that have been created pursuant to special act of the State Legislature, such as library, traffic control, lifeguard and road improvement districts. Depending on the particular provisions of the special act, these districts may be governed under the Town Law, or may be governed by different rules.


New York StateOffi ce of the State Comptroller
Division of Local Government Services and Economic Development
For additional copies of this report contact:
New York State Comptroller’s Offi ceDivision of Local Government Service and Economic Development110 State Street, 12th fl oorAlbany, New York 12236 (518) 474- 6975
Email address: [email protected]