Embed Size (px)
Citation preview

Townsville Community Profileslocal government areamarch 2016
2education townsville community profiles
Contents
Contents . . . . . . . . . . . . . . . . . . . . . . . . . . . . . . . . . . . . . . . . . . . . . . . . . . . . . . . . . . . . . . . . . . . . . . . . . . . . . . . . . . . . . 2
History . . . . . . . . . . . . . . . . . . . . . . . . . . . . . . . . . . . . . . . . . . . . . . . . . . . . . . . . . . . . . . . . . . . . . . . . . . . . . . . . . . . . . . 5
Our Key Statistics . . . . . . . . . . . . . . . . . . . . . . . . . . . . . . . . . . . . . . . . . . . . . . . . . . . . . . . . . . . . . . . . . . . . . . . . . . . . . 8
Townsville Local Government Area - Quick Facts . . . . . . . . . . . . . . . . . . . . . . . . . . . . . . . . . . . . . . . . . . . . . . . . . . . . 9
People . . . . . . . . . . . . . . . . . . . . . . . . . . . . . . . . . . . . . . . . . . . . . . . . . . . . . . . . . . . . . . . . . . . . . . . . . . . . . . . . . . . . . . . 10
Education . . . . . . . . . . . . . . . . . . . . . . . . . . . . . . . . . . . . . . . . . . . . . . . . . . . . . . . . . . . . . . . . . . . . . . . . . . . . . . . . . . . . 14
Cultures . . . . . . . . . . . . . . . . . . . . . . . . . . . . . . . . . . . . . . . . . . . . . . . . . . . . . . . . . . . . . . . . . . . . . . . . . . . . . . . . . . . . . 18
Housing . . . . . . . . . . . . . . . . . . . . . . . . . . . . . . . . . . . . . . . . . . . . . . . . . . . . . . . . . . . . . . . . . . . . . . . . . . . . . . . . . . . . . . 22
Employment . . . . . . . . . . . . . . . . . . . . . . . . . . . . . . . . . . . . . . . . . . . . . . . . . . . . . . . . . . . . . . . . . . . . . . . . . . . . . . . . . . 24
Social Infrastructure and Community Involvement . . . . . . . . . . . . . . . . . . . . . . . . . . . . . . . . . . . . . . . . . . . . . . . . . . 29
Parks and Community Sporting Organisations . . . . . . . . . . . . . . . . . . . . . . . . . . . . . . . . . . . . . . . . . . . . . . . . . . . . . . 34
Transport and Development . . . . . . . . . . . . . . . . . . . . . . . . . . . . . . . . . . . . . . . . . . . . . . . . . . . . . . . . . . . . . . . . . . . . . 36
Safety . . . . . . . . . . . . . . . . . . . . . . . . . . . . . . . . . . . . . . . . . . . . . . . . . . . . . . . . . . . . . . . . . . . . . . . . . . . . . . . . . . . . . . . 39

3townsville community profiles
Acknowledgment of Country
The Townsville City Council would like to acknowledge the Bindal and Wulgurukaba peoples as Traditional Owners of the land on which our Council operates . We pay respect to Elders past, present and future and value the traditions, culture and aspirations of the first Australians of this land . We acknowledge and hold in great significance the valuable contribution that Traditional Owners have made and continue to make within the Townsville Community .
Aboriginal and Torres Strait Islander peoples should be aware that this document may contain images or names of people who have since passed away .
Disclaimer:
The information contained in this publication is for general information only . Townsville City Council does not warrant the accuracy, completeness of currency of this information in this publication . It is your responsibility to evaluate the accuracy, completeness and currency of any information in this publication . To the full extent permitted by law, Council disclaims all liability for or in connection with any loss or damage suffered by you or any other person arising directly or indirectly from or in connection with your use of or reliance on the information contained in this publication . Townsville City Council acknowledges that the information in this publication may not represent all local neighbourhoods or select communities within the Townsville Local Government Area or the Council Electoral Division .

4townsville community profiles
Townsville City Council Local Government Area
Townsville is located approximately halfway between the tip of Cape York and Brisbane and is within the Burdekin Dry Tropics Region . The Townsville City Council Local Government Area (the LGA) covers 3,376 square kilometres .
The LGA contains several National Parks and reserves including Magnetic Island, Paluma Range, Bowling Green Bay National Parks; and the Cape Pallarenda and Townsville Town Common Conservation Parks . Our region is partly within and adjoins the Great Barrier Reef World Heritage Area, the Great Barrier Reef Marine Park and the Queensland State Marine Park .
Townsville City Council Local Government Area contains ten (10) Electoral Divisions .
map 1 – townsville city council local government area
SEE INSET
DIVISION 4
DIVISION 10
DIVISION 2
DIVISION 3DIVISION 1
Bluewater Park
Bluewater
Clemant
Crystal Creek
Mutarnee
Rollingstone
Balgal Beach
Toomulla
Toolakea
Yabulu
Saunders Beach
Alice River Gumlow
Rangewood
Paluma
Lynam
Granite Vale
Hervey Range
Calcium
Reid River
Woodstock
Majors Creek
Barringha
Ross River
Pinnacles
Kelso
Oak Valley
Mount Stuart
Rassmussen Roseneath
Julago
Stuart
Nome
Alligator Creek
Brookhill
Toonpan Mount Elliot
Cape Cleveland
Rowes BayGarbutt
DeeragunBurdell
Town Common
Pallarenda
Horseshoe Bay
Florence Bay
Picnic Bay
West Point
Shelly BeachBushland
Beach
Black River Jensen
Beach Holm
Bohle Plains
Shaw
Mount Low
Blue Hills
Nelly Bay
Arcadia
DIVISION 2
DIVISION 1
DIVISION 7
DIVISION 5
DIVISION 6
DIVISION 8
DIVISION 3
DIVISION 9
DIVISION 10
DIVISION 4Rose Neath
Murray
Mount Stuart
Rassmussen
Gumlow
Condon
Bohle Plains
Kirwan
Thuringowa Central
AnnandaleCranbrook
Wulguru
Stuart
Cluden
Rosslea
Shaw
Aitkenvale
Idalia
Oonoomba
Town Common
Mount St John
Mount Low
BohleBurdell
Garbutt
HeatleyGulliver
Vincent
Currajong
West End
Douglas
Mount Louisa
Cosgrove
Hermit Park
Railway Estate
South Townsville
Castle Hill
Rowes Bay
North Ward
Townsville City

5townsville community profiles
History
Traditional owners and custodians, the Bindal and Wulgurukaba People, are the first people to have lived in the Townsville region .
When Europeans first arrived in Townsville, they presumed that no one occupied or owned the land because there were no boundaries marked by farms or fences . However the Bindal and Wulgurukaba Peoples had been living here for many, many generations . Archaeological sites near Townsville have been dated over 10,000 years old .
The Bindal people call the country “Thul Garrie Waja” . An important symbol for the Bindal people is the shooting star . They believe that wherever the star fell, or the direction the star fell, meant there was either danger coming or someone from that direction was in need of help or in danger .
The Wulgurukaba people call their country “Gurrumbilbarra” . Wulgurukaba means “canoe people” . An important symbol of the Wulgurukaba people is the carpet snake . Wulgurukaba’s creation story tells the story of the creation snake that comes down from the Herbert River, went out to sea creating the Hichinbrook Channel and down to Palm and Magnetic Islands . His body broke up leaving parts along the coast . The tail of the snake is at Halifax Bay, his body is at Palm Island, while his head rests at Arcadia, Magnetic Island .
Townsville’s first European contact occurred in 1819, when Allan Cunningham, aboard the survey vessel Mermaid along with Captain Phillip Parker King, landed on Cape Cleveland and collected botanical specimens to take back to England . Forty five years later John Melton Black and his business partner Robert Towns, after whom the city was named, founded Townsville in November 1864 .
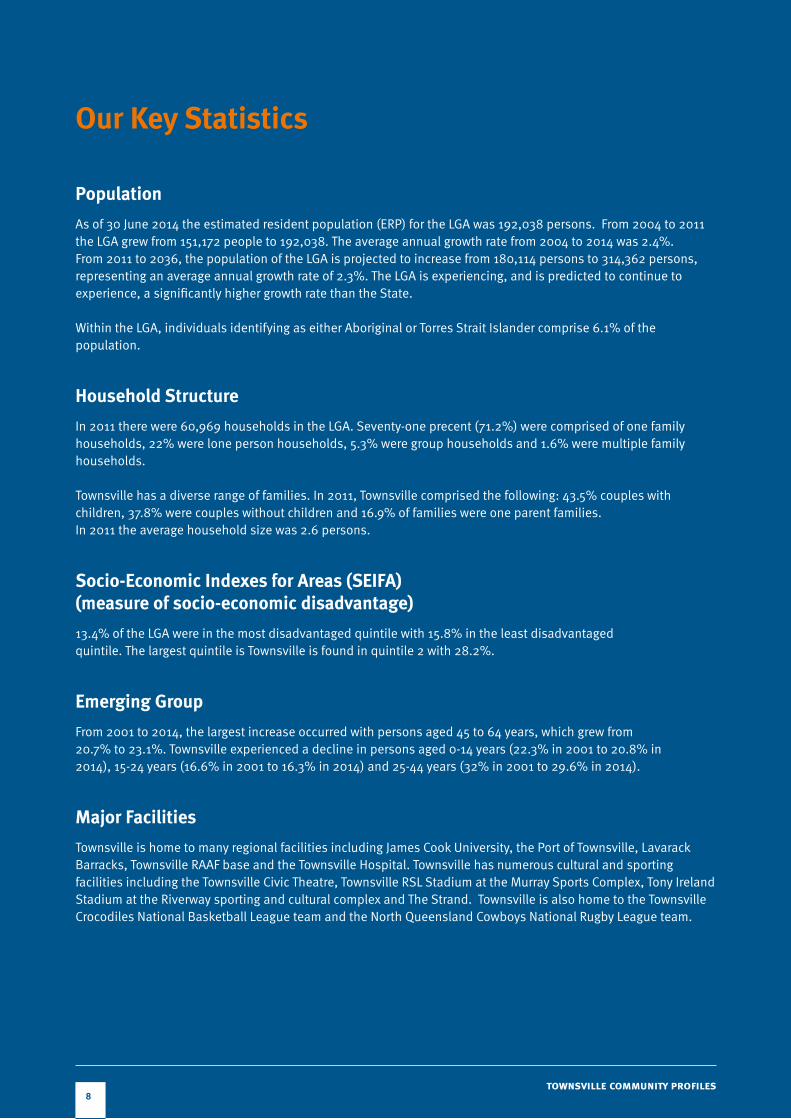
Black despatched Andrew Ball and Mark Watt Reid from Woodstock Station (south west of Townsville) to search for a coastal site where a suitable port could be established . Ball’s party reached the mouth of Ross Creek in April 1864 and they set up camp below the rocky spur of Melton Hill (near the present Customs House on the Strand) . After further exploration of the surrounding area, Ball returned to Woodstock Station and reported the discovery of a site for a settlement .
The first party of settlers, led by William A . Ross, arrived at Cleveland Bay from Woodstock Station on 5 November 1864 . Andrew Ball helped establish the settlement that would become Townsville . During 1865, the first road to the hinterland was opened .
Cleveland Bay was declared a Port of Entry on 23 September 1865 and Townsville was declared a municipality in February 1866, with John Melton Black elected first Mayor of the new municipality .
From 1868 to 1872, Townsville’s population grew to around 2000 people .
In 1876 Harry Butler and his family came to Picnic Bay and became the first permanent white settlers on Magnetic Island . In that same year, the Anglican Diocese of North Queensland was founded and the census listed the population as comprising 1148 females and 1527 males .
In 1879 the Thuringowa Divisional Board was created . The board covered an area of approximately 3,219 square kilometres . The area included Ross Island, Hermit Park, Magnetic Island, extended to Crystal Creek to the north; to the Burdekin River in the south; and to the top of the range near Mingela .
The population of Townsville by 1892 had increased to 13,000 people .
The formation of the Commonwealth in 1901 led to a nationwide competition to design the new country’s flag . Over 30,000 entries were received, and the winner was unfurled in Melbourne on 3 September 1901 . Governor General Lord Hopetoun was in Townsville later that month, and a local sailmaker produced a flag, which was

6townsville community profiles
unfurled by the Governor General at Town Hall on 16 September . This event is reputed to mark the first time the new Commonwealth flag was formally raised in Queensland by the Governor General .
By 1936 Townsville’s population reached 30,000 people .
Between 1942 and 1945 Townsville played an important part in the War in the Pacific . Townsville became a major military base, accommodating up to 90,000 Australian, American and other allied service personnel . The City was bombed on three occasions by the Japanese, and was used as a major offensive launching base during the battle of the Coral Sea . Crowds flocked to Flinders Street when peace was announced on 15 August 1945 . World War II Victory Day celebrations were held on 10 June 1946 .
The CSIRO Davies Laboratory was established on University Road on 27 July 1965 .
Lavarack Barracks was established when the Australian 3rd Task Force transferred to Townsville in 1967 . On 20 April 1970 James Cook University (formerly known as the University College of Townsville) was proclaimed as an Act of Parliament .
In 1981, Edward Mabo, a Townsville resident, and a number of other local Aboriginal leaders held a conference at James Cook University and decided to pursue a native land title claim for the people of the Murray Islands in the High Court of Australia . The ‘Mabo’ land rights campaign was successful and the High Court of Australia gave recognition of indigenous land ownership in 1992 .
The ‘twin cities’ of Townsville and Thuringowa were amalgamated in 2008 .
In 2016 Townsville is celebrating the 150th anniversary of its being declared a municipality .
7education townsville community profiles
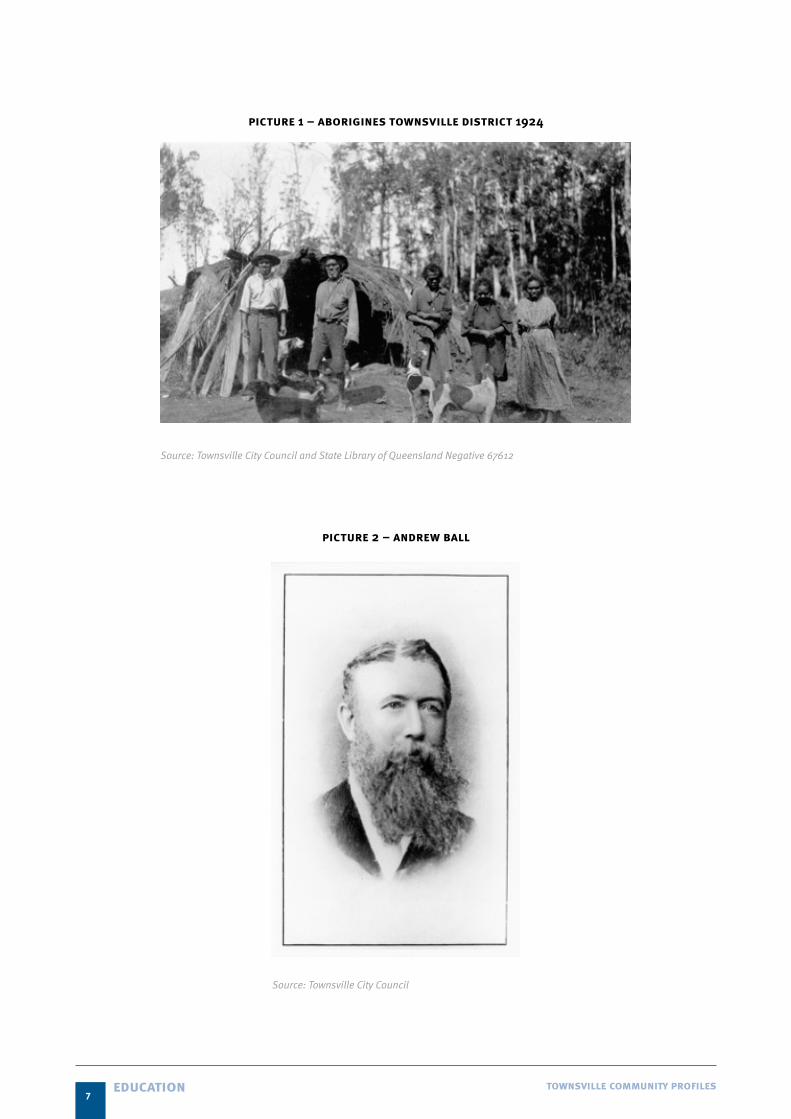
picture 1 – aborigines townsville district 1924
Source: Townsville City Council and State Library of Queensland Negative 67612
picture 2 – andrew ball
Source: Townsville City Council
8education townsville community profiles
8
Our Key Statistics
Population
As of 30 June 2014 the estimated resident population (ERP) for the LGA was 192,038 persons . From 2004 to 2011 the LGA grew from 151,172 people to 192,038 . The average annual growth rate from 2004 to 2014 was 2 .4% . From 2011 to 2036, the population of the LGA is projected to increase from 180,114 persons to 314,362 persons, representing an average annual growth rate of 2 .3% . The LGA is experiencing, and is predicted to continue to experience, a significantly higher growth rate than the State .
Within the LGA, individuals identifying as either Aboriginal or Torres Strait Islander comprise 6 .1% of the population .
Household Structure
In 2011 there were 60,969 households in the LGA . Seventy-one precent (71 .2%) were comprised of one family households, 22% were lone person households, 5 .3% were group households and 1 .6% were multiple family households .
Townsville has a diverse range of families . In 2011, Townsville comprised the following: 43 .5% couples with children, 37 .8% were couples without children and 16 .9% of families were one parent families . In 2011 the average household size was 2 .6 persons .
Socio-Economic Indexes for Areas (SEIFA) (measure of socio-economic disadvantage)
13 .4% of the LGA were in the most disadvantaged quintile with 15 .8% in the least disadvantaged quintile . The largest quintile is Townsville is found in quintile 2 with 28 .2% .
Emerging Group
From 2001 to 2014, the largest increase occurred with persons aged 45 to 64 years, which grew from 20 .7% to 23 .1% . Townsville experienced a decline in persons aged 0-14 years (22 .3% in 2001 to 20 .8% in 2014), 15-24 years (16 .6% in 2001 to 16 .3% in 2014) and 25-44 years (32% in 2001 to 29 .6% in 2014) .
Major Facilities
Townsville is home to many regional facilities including James Cook University, the Port of Townsville, Lavarack Barracks, Townsville RAAF base and the Townsville Hospital . Townsville has numerous cultural and sporting facilities including the Townsville Civic Theatre, Townsville RSL Stadium at the Murray Sports Complex, Tony Ireland Stadium at the Riverway sporting and cultural complex and The Strand . Townsville is also home to the Townsville Crocodiles National Basketball League team and the North Queensland Cowboys National Rugby League team .
townsville community profiles

9townsville community profiles
Townsville Local Government Area - Quick Facts
Current Population 192,038 (ERP June 2014)
Projected Population – 2036 (QGSO) 314,362
Median Age 33 .3 years
Indigenous Population 6 .1%
SEIFA Index (Advantage & Disadvantage) 998 .7
Unemployment 7 .9% (September 2015)
No. of Families 45,319
No. of Households 60,969
Average Household Size 2 .6
Average Family Income $84,552 per annum
Median Personal Income $35,100 per annum
Note: Unless otherwise stated the figures are source from the ABS – Census 2011

10people townsville community profiles
What is our current population?
FACT: The LGA had an estimated resident population of 192,038 people in 2014 .FACT: The average annual population growth rate was 2 .3% from 2001-2014, slightly higher than the rate for Queensland over the same period (2 .2%) .
estimated resident population
0
50,000
100,000
150,000
200,000
2004 2009 2014p
Persons
Year
Source: ABS 3218.0, Regional Population Growth, Australia, 2013-14 and Queensland Treasury estimates
People
Snapshot • The estimated resident population in
2014 was 192,038 persons which is an increase of 40,866 persons since 2004 .
• The average annual growth rate over 5 years was 2 .1% and the average annual growth rate over 10 years is 2 .4% .
• Between 2001 and 2014 the proportion of people aged over 65 years and over increased from 8 .4% to 10 .6% (20,344 persons) .
• Townsville’s median age is 33 .3 years, 3 .5 years less than the state median of 36 .8 years .
• The percentage of one family households in the LGA was 71 .2% in 2011 . This compares to 70 .7% of Queensland households comprising one family households .
Note: Unless otherwise stated the figures are source from the ABS – Census 2011
11people townsville community profiles
What is our projected population?
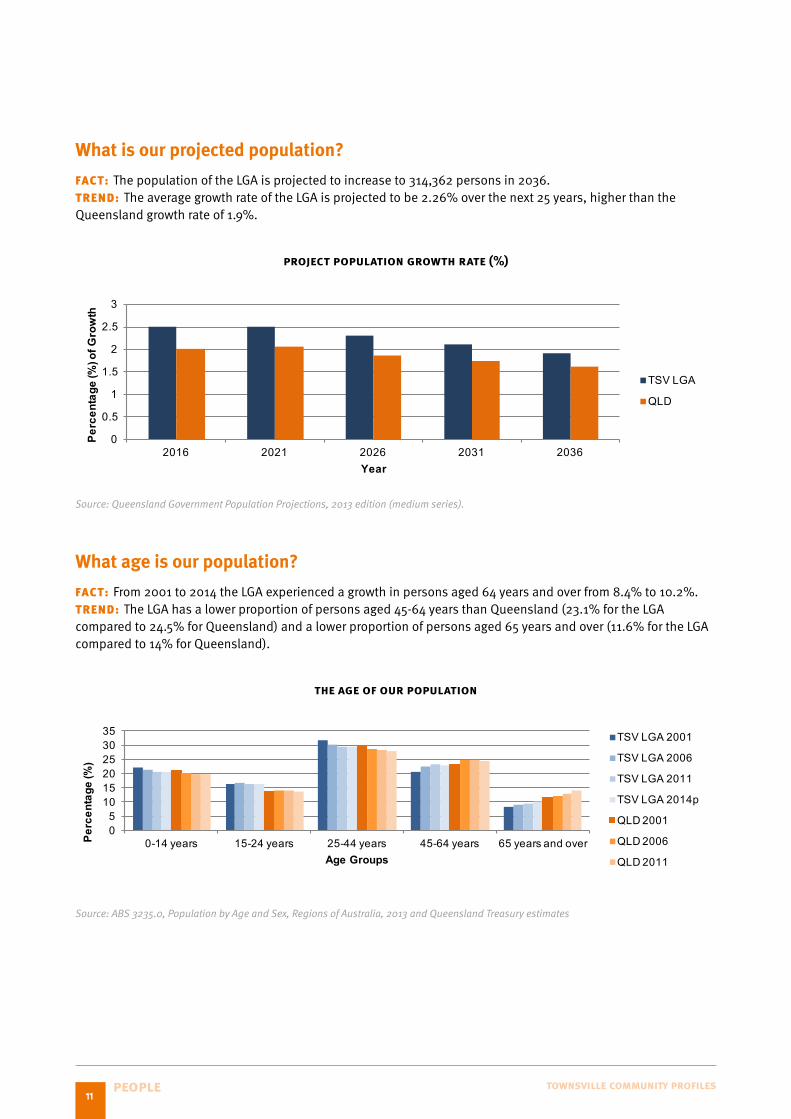
FACT: The population of the LGA is projected to increase to 314,362 persons in 2036 .TREND: The average growth rate of the LGA is projected to be 2 .26% over the next 25 years, higher than the Queensland growth rate of 1 .9% .
project population growth rate (%)
0
0.5
1
1.5
2
2.5
3
2016 2021 2026 2031 2036
Perc
enta
ge (%
) of G
row
th
Year
TSV LGA
QLD
Source: Queensland Government Population Projections, 2013 edition (medium series).
What age is our population?
FACT: From 2001 to 2014 the LGA experienced a growth in persons aged 64 years and over from 8 .4% to 10 .2% . TREND: The LGA has a lower proportion of persons aged 45-64 years than Queensland (23 .1% for the LGA compared to 24 .5% for Queensland) and a lower proportion of persons aged 65 years and over (11 .6% for the LGA compared to 14% for Queensland) .
the age of our population
05
101520253035
0-14 years 15-24 years 25-44 years 45-64 years 65 years and overPerc
enta
ge (%
)
Age Groups
TSV LGA 2001
TSV LGA 2006
TSV LGA 2011
TSV LGA 2014p
QLD 2001
QLD 2006
QLD 2011
Source: ABS 3235.0, Population by Age and Sex, Regions of Australia, 2013 and Queensland Treasury estimates

12people townsville community profiles
What is the age of our projected population?
TREND: It is projected that the LGA will continue to have a higher proportion of people under the age of 24 than Queensland and a lower proportion of people over the age of 45 years .
the age of projected population
0
5
10
15
20
25
30
0-14 years 15-24 years 25-44 years 45-64 years 65 years and over
Perc
enta
ge (%
)
Age Groups
TSV LGA 2011TSV LGA 2016TSV LGA 2021TSV LGA 2026TSV LGA 2031TSV LGA 2036QLD 2011QLD 2016QLD 2021QLD 2026QLD 2031QLD 2036
Source: Queensland Government Population Projections, 2013 edition (medium series).
What our median age?
FACT: The median age for the LGA has increased by 1 year from 32 .3 years (2004) to 33 .3 years (2013) compared to a 1 .1 year median age increase across Queensland .
median age of townsville lga and queensland
303132333435363738
2004 2009 2014p
Age
(yea
rs)
Year
TSV LGA
QLD
13people townsville community profiles
What proportion of our population identify as Indigenous (Aboriginal and Torres Strait Islander)?
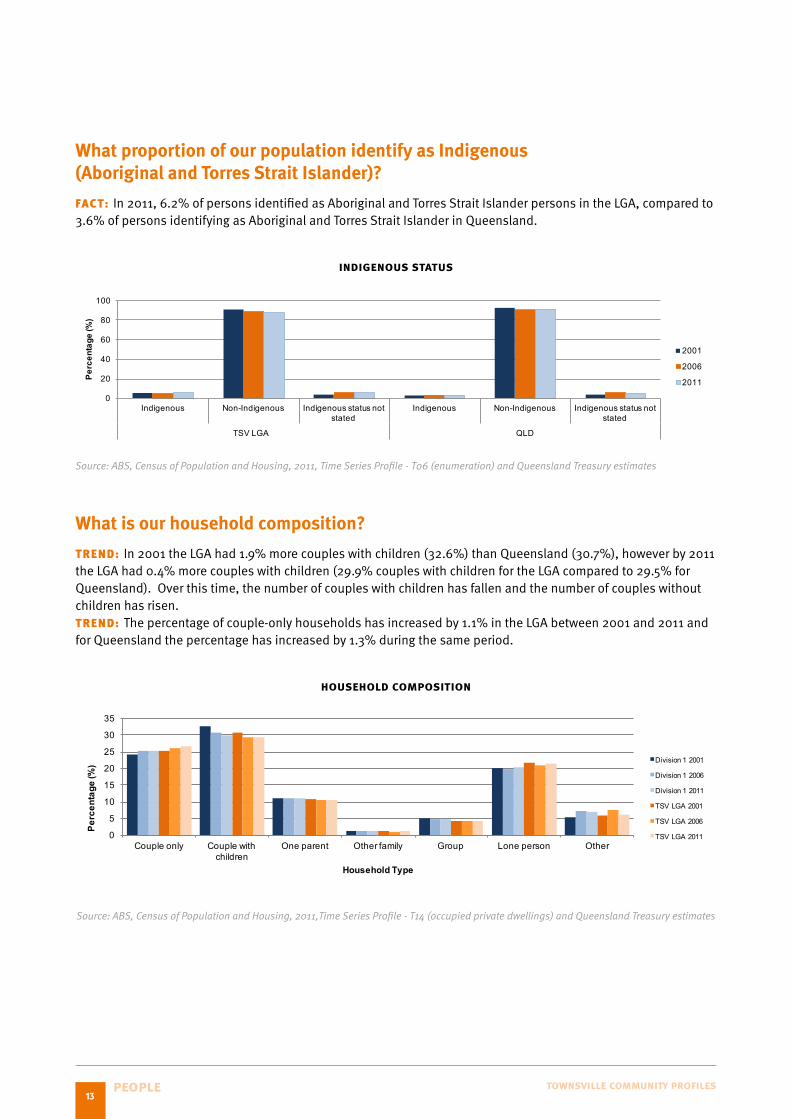
FACT: In 2011, 6 .2% of persons identified as Aboriginal and Torres Strait Islander persons in the LGA, compared to 3 .6% of persons identifying as Aboriginal and Torres Strait Islander in Queensland .
indigenous status
0
20
40
60
80
100
Indigenous Non-Indigenous Indigenous status not stated
Indigenous Non-Indigenous Indigenous status not stated
TSV LGA QLD
Perc
enta
ge (%
)
2001
2006
2011
Source: ABS, Census of Population and Housing, 2011, Time Series Profile - T06 (enumeration) and Queensland Treasury estimates
What is our household composition?
TREND: In 2001 the LGA had 1 .9% more couples with children (32 .6%) than Queensland (30 .7%), however by 2011 the LGA had 0 .4% more couples with children (29 .9% couples with children for the LGA compared to 29 .5% for Queensland) . Over this time, the number of couples with children has fallen and the number of couples without children has risen . TREND: The percentage of couple-only households has increased by 1 .1% in the LGA between 2001 and 2011 and for Queensland the percentage has increased by 1 .3% during the same period .
household composition
0
5
10
15
20
25
30
35
Couple only Couple with children
One parent Other family Group Lone person Other
Perc
enta
ge (%
)
Household Type
Division 1 2001
Division 1 2006
Division 1 2011
TSV LGA 2001
TSV LGA 2006
TSV LGA 2011
Source: ABS, Census of Population and Housing, 2011,Time Series Profile - T14 (occupied private dwellings) and Queensland Treasury estimates

14education townsville community profiles
What are the student attendance rates of State Schools?
FACT: Townsville (90 .7%) had a lower student attendance in 2014 compared to the Queensland average (91 .1%) .
state school student attendance rate
70
80
90
2013 2014 2015
Perc
enta
ge (%
)
Year
TSV LGA
QLD
Source: Department of Education and Training
Education
Snapshot • At June 30 2015 there are 58 schools in
Townsville, 36 of which are State Schools (Department of Education and Training) .
• Persons in Townsville with highest level of schooling of year 11 or 12 (or equivalent) is on par with Queensland, 55 .1% for Townsville and 55 .3% for Queensland .
• The percentage of persons in the LGA with a non-school qualification was 53 .8% .
• The largest non-school qualification field of study in Townsville was Engineering and Related Technologies (18 .8%), followed by Management and Commerce (14%) and Health (10 .1%) .
• 36 .6% of year 12 completers went onto university studies .
Note: Unless otherwise stated the figures are source from the ABS – Census 2011
15education townsville community profiles
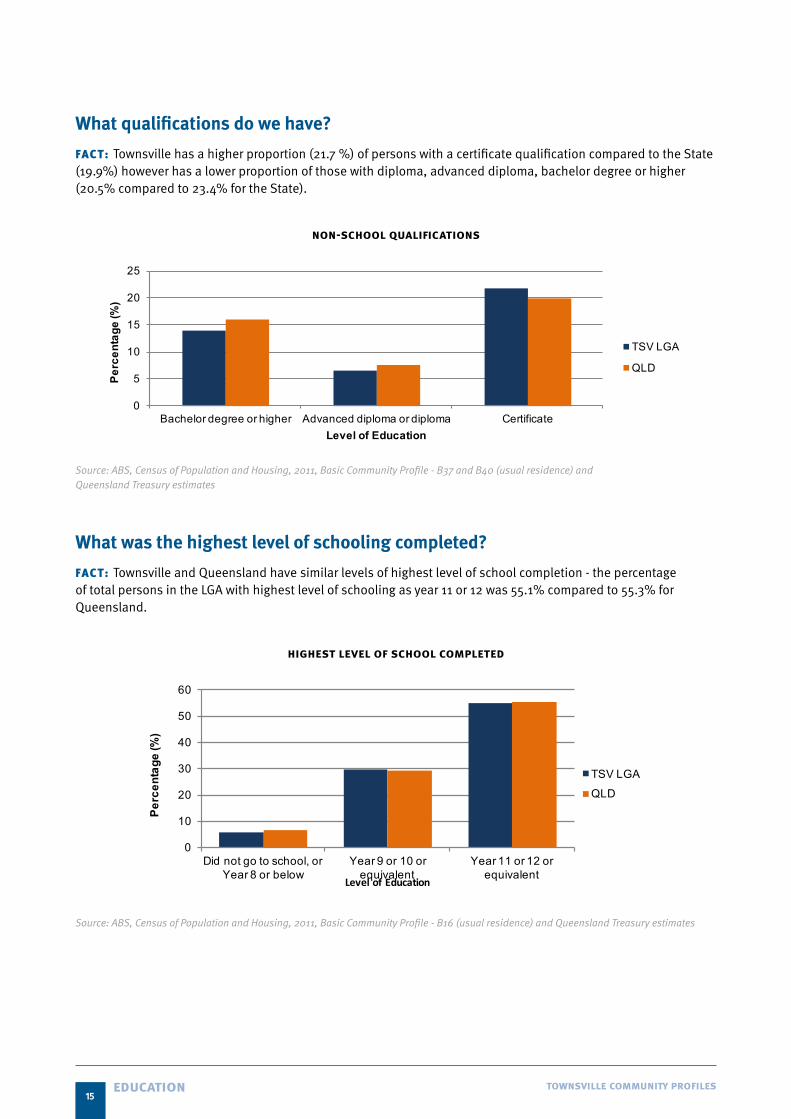
What qualifications do we have?
FACT: Townsville has a higher proportion (21 .7 %) of persons with a certificate qualification compared to the State (19 .9%) however has a lower proportion of those with diploma, advanced diploma, bachelor degree or higher (20 .5% compared to 23 .4% for the State) .
non-school qualifications
0
5
10
15
20
25
Bachelor degree or higher Advanced diploma or diploma Certificate
Perc
enta
ge (%
)
Level of Education
TSV LGA
QLD
Source: ABS, Census of Population and Housing, 2011, Basic Community Profile - B37 and B40 (usual residence) and Queensland Treasury estimates
What was the highest level of schooling completed?
FACT: Townsville and Queensland have similar levels of highest level of school completion - the percentage of total persons in the LGA with highest level of schooling as year 11 or 12 was 55 .1% compared to 55 .3% for Queensland .
highest level of school completed
0
10
20
30
40
50
60
Did not go to school, or Year 8 or below
Year 9 or 10 or equivalent
Year 11 or 12 or equivalent
Perc
enta
ge (%
)
LevelofEducation
TSV LGA
QLD
Source: ABS, Census of Population and Housing, 2011, Basic Community Profile - B16 (usual residence) and Queensland Treasury estimates

16education townsville community profiles
What is the destination of Year 12 completers?
FACT: A bachelor degree was the destination for 36 .6% students following year 12, with a higher proportion of females going on to university . FACT: In 2015, 14% of years 12 completers were seeking work while 26 .6% had either full or part time employment .
main destination of year 12 completers in townsville
0
5
10
15
20
25
30
35
40
45
50
Bachelor Degree VET Certi IV+ Vet Cert III VET Cert I-II/other Apprenticeship Traineeship Full-Time Employment
Part-Time Employment
Seeking Work NILFET*
Perc
enta
ge (%
)
Main DestinationsMale Female
Source: Department of Education, Training and Employment
What is the field of study of Year 12 completers in education and training?
FACT: For females Health (30 .2%) is the most popular field of study while engineering and Related Technologies (30%) was for males .
field of study for year 12 completers in divisions 4 and 5
0
5
10
15
20
25
30
35
Agriculture, Environmental and
Related Studies
Architecture and Building
Creative Arts Double Field of Study
Education Engineering and Related
Technologies
Food, Hospitality and Personal
Services
Health Information Technology
Management and Commerce
Mixed Field Programs
Natural and Physical Sciences
Other
Percentage (%
)
Male Female
Source: Department of Education, Training and Employment
Male Female

17education townsville community profiles
What are the Naplan (National Assessment Program Literacy and Numeracy) results?(Note: NAPLAN is an annual assessment to test the skills that are essential for every child to progress through school and life.)
FACT: The majority of children attending school in Townsville are at or above the National Minimum Standard .
% of year 3 students at or above the national minimum standard for naplan
60
65
70
75
80
85
90
95
100
Reading 2013-2014 Writing 2013-2014 Spelling 2013-2014 Grammer 2013-2014 Numeracy 2013-2014
Perc
enta
ge (
%) TSV 2013
QLD 2013
TSV 2014
QLD 2014
% of year 5 students at or above the national minimum standard for naplan
60
65
70
75
80
85
90
95
100
Reading 2013-2014 Writing 2013-2014 Spelling 2013-2014 Grammer 2013-2014 Numeracy 2013-2014
Percentage
(%)
TSV 2013
QLD 2013
TSV 2014
QLD 2014
% of year 7 students at or above the national minimum standard for naplan
60
65
70
75
80
85
90
95
100
Reading 2013-2014 Writing 2013-2014 Spelling 2013-2014 Grammer 2013-2014 Numeracy 2013-2014
Perc
enta
ge (%
)
TSV 2013
QLD 2013
TSV 2014
QLD 2014
Source: Australian Curriculum Assessment and Reporting Authority

18cultures townsville community profiles
What are our religious affiliations?
FACT: The top five religious affiliations are Catholic (28 .1%), No Religion (21 .9%), Anglican (18 .3%), Uniting Church (6 .5%), Presbyterian and Reformed (3 .6%) .
main religious affiliations
0
10
20
30
40
50
60
70
Christianity Other No religion
Perc
enta
ge (%
)
TSV LGA
QLD
Source: ABS, Census of Population and Housing, 2011, Basic Community Profile - B14 (usual residence) and Queensland Treasury estimates
Cultures
Snapshot • Townsville’s top five English speaking
backgrounds are United Kingdom, Channel Island and Isle of Man (3 .4%), New Zealand (2 .6%), South Africa (0 .5%), United States of America (0 .3%) and Canada (0 .2%) .
• 32 .4% of persons stated they spoke a language other than English at home .
• 13 .3% of persons were born overseas .
• 113,799 (65 .2%) stated they were affiliated with a Christian religion, slightly more than Queensland at 64 .3% .
Note: Unless otherwise stated the figures are source from the ABS – Census 2011
19cultures townsville community profiles
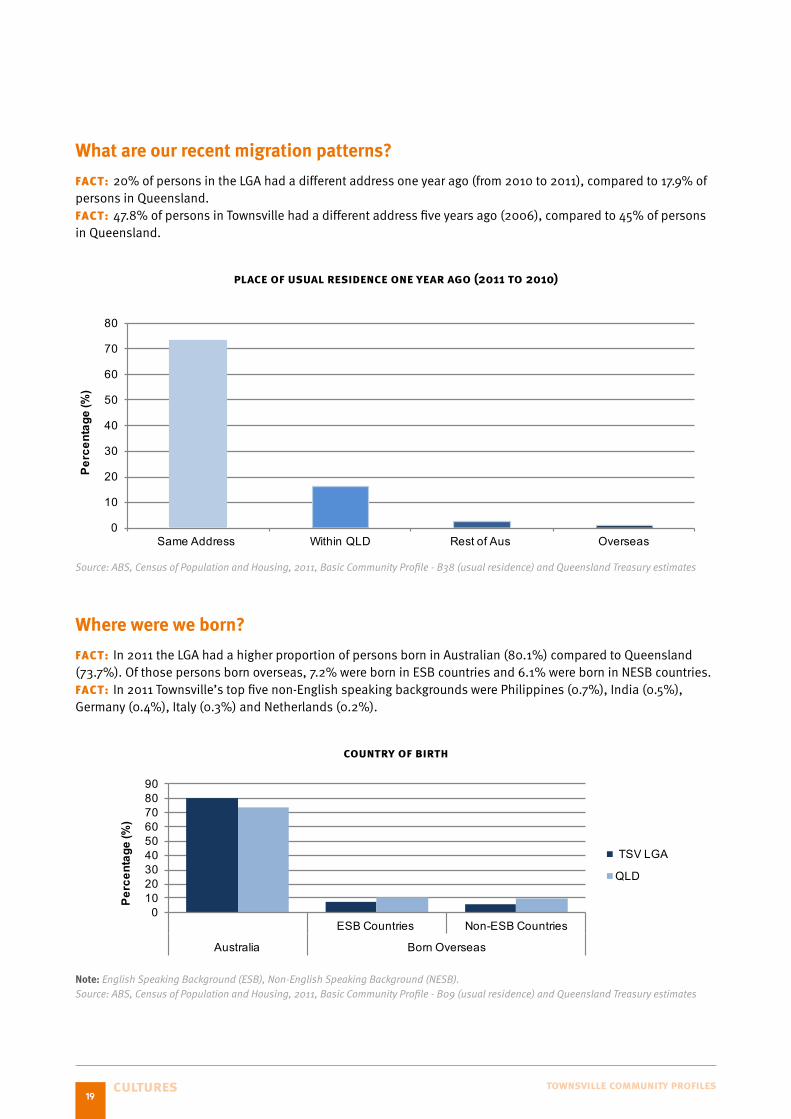
What are our recent migration patterns?
FACT: 20% of persons in the LGA had a different address one year ago (from 2010 to 2011), compared to 17 .9% of persons in Queensland . FACT: 47 .8% of persons in Townsville had a different address five years ago (2006), compared to 45% of persons in Queensland .
place of usual residence one year ago (2011 to 2010)
0
10
20
30
40
50
60
70
80
Same Address Within QLD Rest of Aus Overseas
Perc
enta
ge (%
)
Source: ABS, Census of Population and Housing, 2011, Basic Community Profile - B38 (usual residence) and Queensland Treasury estimates
Where were we born?
FACT: In 2011 the LGA had a higher proportion of persons born in Australian (80 .1%) compared to Queensland (73 .7%) . Of those persons born overseas, 7 .2% were born in ESB countries and 6 .1% were born in NESB countries . FACT: In 2011 Townsville’s top five non-English speaking backgrounds were Philippines (0 .7%), India (0 .5%), Germany (0 .4%), Italy (0 .3%) and Netherlands (0 .2%) .
country of birth
0102030405060708090
ESB Countries Non-ESB Countries
Australia Born Overseas
Perc
enta
ge (%
)
TSV LGA
QLD
Note: English Speaking Background (ESB), Non-English Speaking Background (NESB). Source: ABS, Census of Population and Housing, 2011, Basic Community Profile - B09 (usual residence) and Queensland Treasury estimates
20cultures townsville community profiles
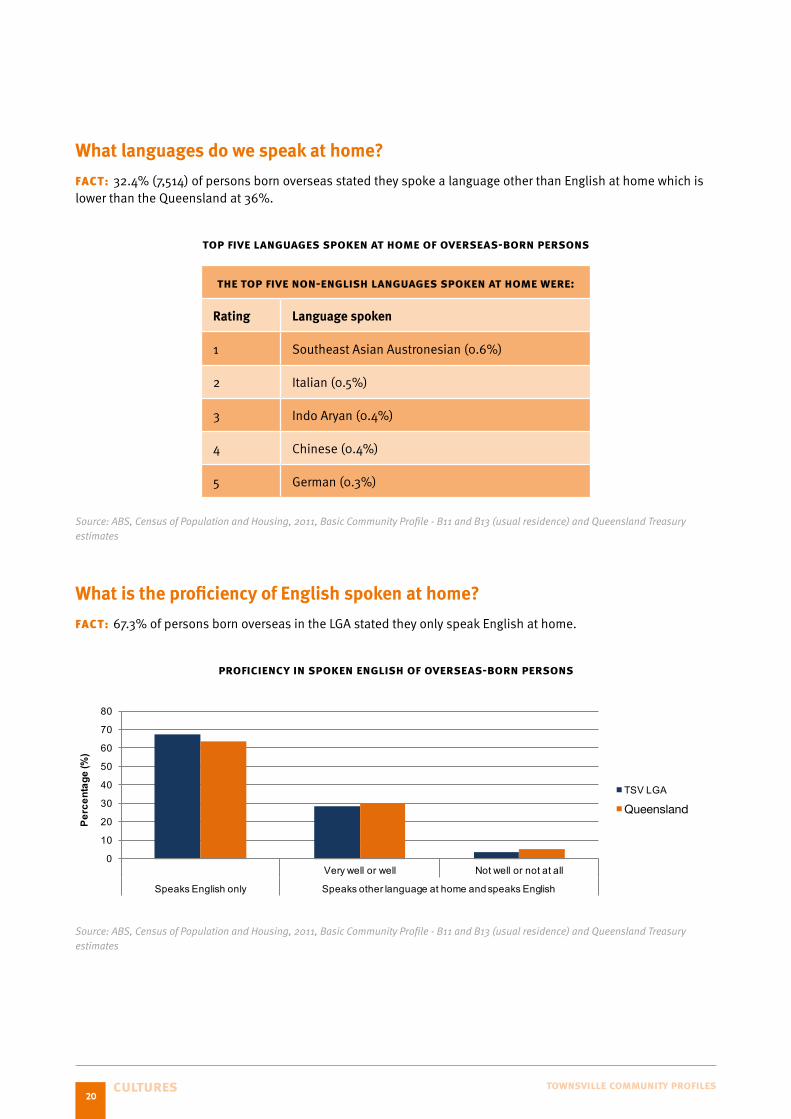
What languages do we speak at home?
FACT: 32 .4% (7,514) of persons born overseas stated they spoke a language other than English at home which is lower than the Queensland at 36% .
top five languages spoken at home of overseas-born persons
the top five non-english languages spoken at home were:
Rating Language spoken
1 Southeast Asian Austronesian (0 .6%)
2 Italian (0 .5%)
3 Indo Aryan (0 .4%)
4 Chinese (0 .4%)
5 German (0 .3%)
Source: ABS, Census of Population and Housing, 2011, Basic Community Profile - B11 and B13 (usual residence) and Queensland Treasury estimates
What is the proficiency of English spoken at home?
FACT: 67 .3% of persons born overseas in the LGA stated they only speak English at home .
proficiency in spoken english of overseas-born persons
0
10
20
30
40
50
60
70
80
Very well or well Not well or not at all
Speaks English only Speaks other language at home and speaks English
Perc
enta
ge (%
)
TSV LGA
Townsville LGA
Source: ABS, Census of Population and Housing, 2011, Basic Community Profile - B11 and B13 (usual residence) and Queensland Treasury estimates
Queensland

21cultures townsville community profiles
What is the age of our Indigenous Population?
FACT: In the LGA in 2011, 2 .6% of Aboriginal and Torres Strait Islander peoples were aged 65 plus, 0 .8% lower than Queensland Aboriginal and Torres Strait Islander population (3 .4%) .FACT: The youth (0-14 year) Indigenous population in both Townsville and Queensland is significantly higher than the non-indigenous population (Townsville 37 .9% compared to 20 .1%) .
age of indigenous and non-indigenous persons
21
What is the age of our Indigenous Population?
FACT: In the LGA in 2011, 2.6% of Aboriginal and Torres Strait Islanders peoples were aged 65 plus, 0.8% lower than Queensland Aboriginal and Torres Strait Islander population (3.4%).
FACT: The youth (0-14 year) Indigenous population in both Townsville and Queensland is significantly higher than the non-indigenous population (Townsville 37.9% compared to 20.1%).
Age of Indigenous and Non-Indigenous Persons
Source: ABS, Census of Population and Housing, 2011, Indigenous Profile - I03 (usual residence) and Queensland Treasury estimates
What is our family composition?
FACT: Townsville has a lower rate of couple families with no children compared to Queensland (37.8% compared to 39.5%).
Family Composition
Source: ABS, Census of Population and Housing, 2011, Basic Community Profile - B25 (families and persons) and Queensland Treasury estimates
0
10
20
30
40
0-14 15-24 25-44 45-64 65+
Perc
enta
ge (
%)
Age Groups
TSV LGA Indigenous
TSV LGA Non-Indigenous
QLD Indigenous
QLD Non-Indigenous
0
10
20
30
40
50
Couple family with no children
Couple family with children One-parent family
Perc
enta
ge (%
)
Family Groups
TSV LGA
QLD
ABS, Census of Population and Housing, 2011, Indigenous Profile - I03 (usual residence) and Queensland Treasury estimates
What is our family composition?
FACT: In the LGA in 2011, 2 .6% of Aboriginal and Torres Strait Islanders peoples were aged 65 plus, 0 .8% lower than Queensland Aboriginal and Torres Strait Islander population (3 .4%) .FACT: The youth (0-14 year) Indigenous population in both Townsville and Queensland is significantly higher than the non-indigenous population (Townsville 37 .9% compared to 20 .1%) .
family composition
0
10
20
30
40
50
Couple family with no children
Couple family with children
One-parent family
Perc
enta
ge (%
)
Family Groups
TSV LGA
QLD
Source: ABS, Census of Population and Housing, 2011, Basic Community Profile - B25 (families and persons) and Queensland Treasury estimates

22housing townsville community profiles
What types of dwellings do we live in?
TREND: Townsville has experienced minimal growth in the proportion of apartments in the LGA .
types of dwelling we occupy
0
20
40
60
80
100
Separate house Semi-detached Apartment Other
Perc
enta
ge (%
)
Dwelling Types
TSV LGA 2001
TSV LGA 2006
TSV LGA 2011
QLD 2001
QLD 2006
QLD 2011
Note: “Other” Includes Caravan, cabin, houseboat; Improvised home, tent, sleepers out; House or flat attached to a shop, office, etc
Source: ABS, Census of Population and Housing, 2011, Time Series Profile - T18 (occupied private dwellings) and Queensland Treasury estimates
Housing
Snapshot • Separate houses (80 .7%) are the main
occupied type of dwelling in Townsville .
• 22 .6% of private dwellings were fully owned in 2011, less than in 2001 where the figure was 29 .7% .
• The median rent for a 3 bedroom house has decreased from $340 a week in December 2011 to $318 a week in December 2015 .
23housing townsville community profiles
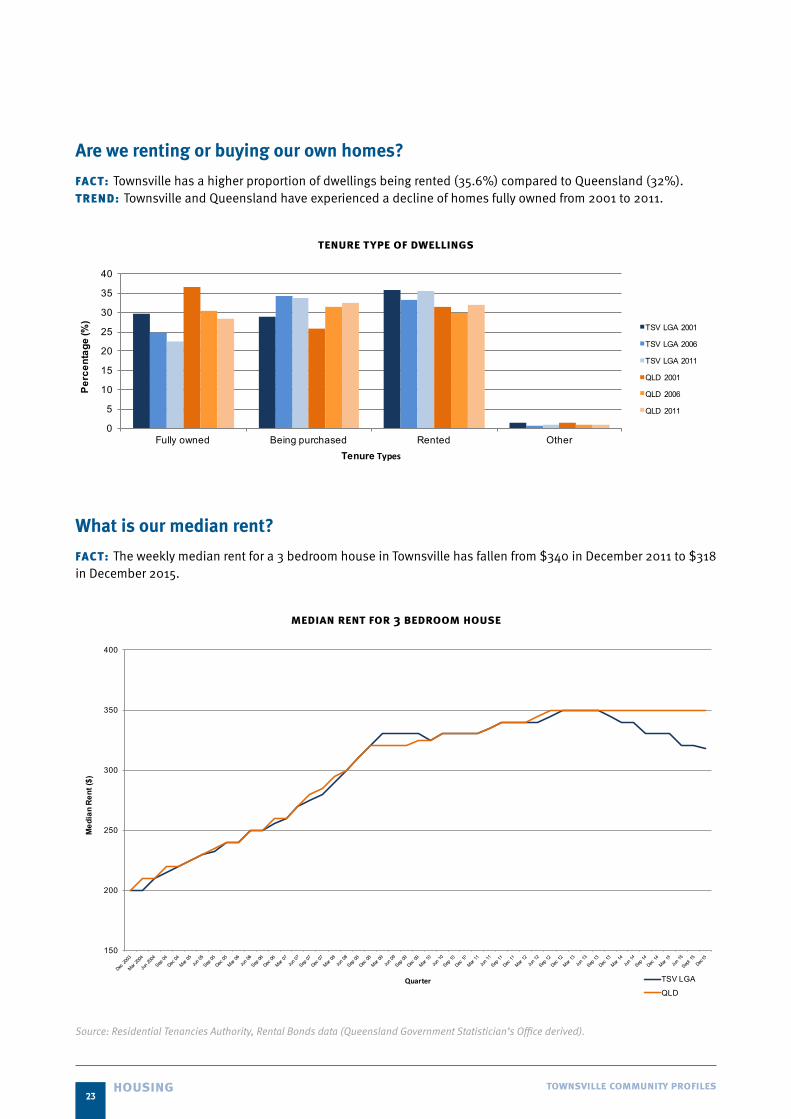
Are we renting or buying our own homes?
FACT: Townsville has a higher proportion of dwellings being rented (35 .6%) compared to Queensland (32%) . TREND: Townsville and Queensland have experienced a decline of homes fully owned from 2001 to 2011 .
tenure type of dwellings
0
5
10
15
20
25
30
35
40
Fully owned Being purchased Rented Other
Perc
enta
ge (%
)
Tenure Types
TSV LGA 2001
TSV LGA 2006
TSV LGA 2011
QLD 2001
QLD 2006
QLD 2011
What is our median rent?
FACT: The weekly median rent for a 3 bedroom house in Townsville has fallen from $340 in December 2011 to $318 in December 2015 .
median rent for 3 bedroom house
150
200
250
300
350
400
Med
ian
Rent
($)
Quarter TSV LGA
QLD
Source: Residential Tenancies Authority, Rental Bonds data (Queensland Government Statistician’s Office derived).

24employment townsville community profiles
What is our unemployment rate?
FACT: The employment rate for Townsville at September 2015 was 7 .9%, higher than the State at 6 .5% .TREND: Since June 2014 both the LGA and Queensland have had an unemployment rate over 6% .
unemployment rate 2010 to 2015
0.0
1.0
2.0
3.0
4.0
5.0
6.0
7.0
8.0
9.0
Dec 2010
Mar 2011
Jun 2011
Sep 2011
Dec 2011
Mar 2012
Jun 2012
Sep 2012
Dec 2012
Mar 2013
Jun 2013
Sep 2013
Dec 2014
Mar 2014
Jun 2014
Sep 2014
Dec 2014
Mar 2015
Jun 2015
Sep 2015
Unem
ploy
men
t Rat
e (%
)
Quarter
TSV LGA
QLD
Source: ABS, Census of Population and Housing, 2011, Time Series Profile - T32 (enumeration) and Queensland Treasury estimates
Employment
Snapshot • Unemployment has risen from 5 .2% in
September 2011 to 7 .9% in September 2015
• 72 .3% of workers aged 25-54 years worked full-time .
• There were 12,112 businesses trading in Townsville between 2013-2014 .
• There are 4,348 low-income families in Townsville (10%) .
• The top five occupation sub-major groups of employment for persons living in Townsville are:
1 . Sales Assistants and Salespersons (6 .6%)
2 . Health Professionals (5 .1%)
3 . Specialist Managers (4 .7%)
4 . Automotive and Engineering Trades Workers (4 .7%)
5 . Carers and Aides (4%)
25employment townsville community profiles
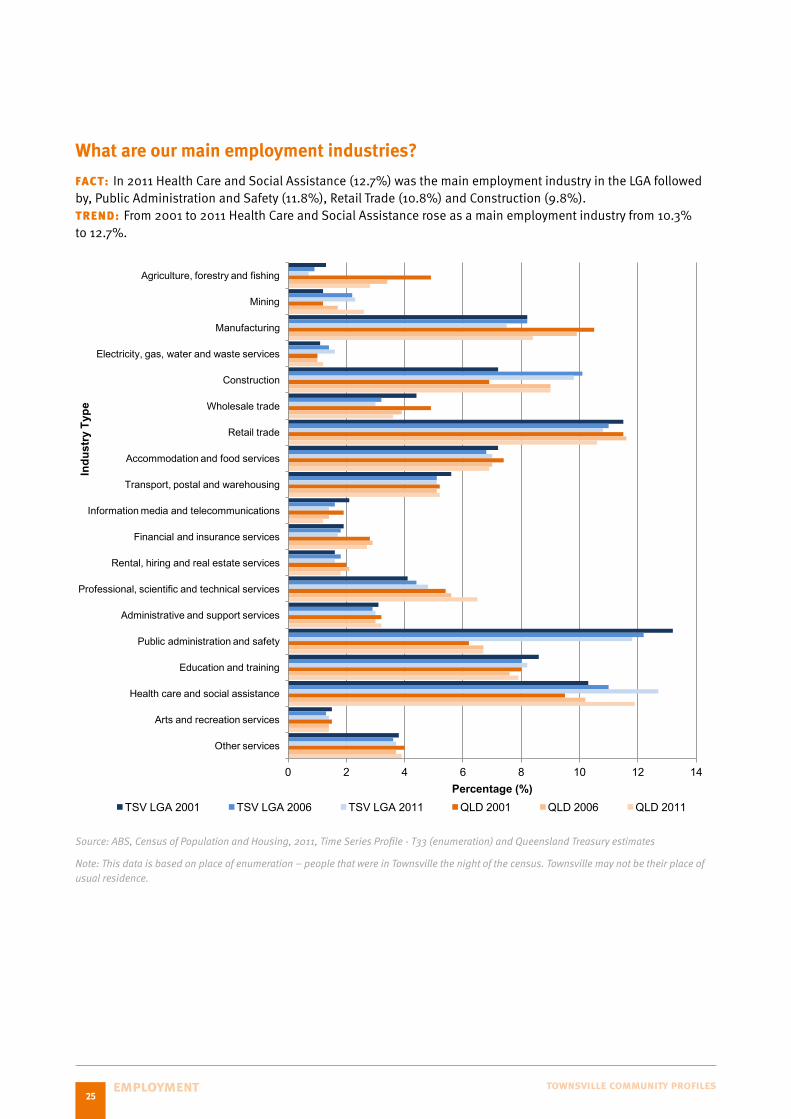
What are our main employment industries?
FACT: In 2011 Health Care and Social Assistance (12 .7%) was the main employment industry in the LGA followed by, Public Administration and Safety (11 .8%), Retail Trade (10 .8%) and Construction (9 .8%) .TREND: From 2001 to 2011 Health Care and Social Assistance rose as a main employment industry from 10 .3% to 12 .7% .
25
What are our main employment industries?
FACT: In 2011 Health Care and Social Assistance (12.7%) was the main employment industry in the LGA followed by, Public Administration and Safety (11.8%), Retail Trade (10.8%) and Construction (9.8%).
TREND: From 2001 to 2011 Health Care and Social Assistance rose as a main employment industry from 10.3% to 12.7%.
Source: ABS, Census of Population and Housing, 2011, Time Series Profile - T33 (enumeration) and Queensland Treasury estimates
Note: This data is based on place of enumeration – people that we in Townsville the night of the census. Townsville may not be their place of usual residence.
0 2 4 6 8 10 12 14
Agriculture, forestry and fishing
Mining
Manufacturing
Electricity, gas, water and waste services
Construction
Wholesale trade
Retail trade
Accommodation and food services
Transport, postal and warehousing
Information media and telecommunications
Financial and insurance services
Rental, hiring and real estate services
Professional, scientific and technical services
Administrative and support services
Public administration and safety
Education and training
Health care and social assistance
Arts and recreation services
Other services
Percentage (%)
Indu
stry
Typ
e
TSV LGA 2001 TSV LGA 2006 TSV LGA 2011 QLD 2001 QLD 2006 QLD 2011
Source: ABS, Census of Population and Housing, 2011, Time Series Profile - T33 (enumeration) and Queensland Treasury estimates
Note: This data is based on place of enumeration – people that were in Townsville the night of the census. Townsville may not be their place of usual residence.

26employment townsville community profiles
What are the main occupations of persons who live in Townsville?
FACT: The main occupations for persons who live in Townsville are Technicians and trade workers (20 .6%) and Clerical and administrative workers (15%) . FACT: Townsville has a lower rate of professionals compared to the State (Townsville 11 .5% compared to Queensland 18 .9%) .
occupations of persons in townsville lga (usual residence)
0
5
10
15
20
25
Managers Professionals Technicians and trades
workers
Community and personal
service workers
Clerical and administrative
workers
Sales workers Machinery operators and
drivers
Labourers
Perc
enta
ge (%
)
Occupation Types
TSV LGA
QLD
Source: ABS, Census of Population and Housing, 2011, Basic Community Profile - B45 (usual residence) and Queensland Treasury estimates
What are the main occupations of persons who work in Townsville?
FACT: Counted by place of work, Professionals (19%) are the largest occupation of persons working in Townsville, followed by Clerical and administrative workers (16%) .
occupations of people working in townsville
0
5
10
15
20
25
Managers Professionals Technicians and trades workers
Community and personal service workers
Clerical and administrative workers
Sales workers Machinery operators and drivers
Labourers
Perc
enta
ge (%
)
Occupation Types TSV LGA QLD
Source: ABS, Census of Population and Housing, 2011, Working Population Profile - W13 (place of work) and Queensland Treasury estimates

27employment townsville community profiles
How many businesses do we have?
FACT: Townsville has 6,863 (56 .7%) non-employing businesses .FACT: Townsville has a higher proportion of businesses employing 5-19 employees compared to the State (Townsville 13 .3% compared to the State 9 .8%) .
Note: A non-employing business includes sole proprietorships and partnerships without employees.
business count by employment size
0
10
20
30
40
50
60
70
Non-employing 1–4 employees 5–19 employees 20–199 employees 200+ employees
Perc
enta
ge (%
)
Employment Size
TSV LGA
QLD
Source: ABS 8165.0, Counts of Australian Businesses, including Entries and Exits, various editions and Queensland Treasury estimates
How much do our businesses turn over?
FACT: The LGA had 845 businesses with a turnover of $2 million or more in 2013-2014 .
business count by turnover range 2013-2014
0
10
20
30
40
50
$0 to less than $100k $100k to less than $500k $500k to less than $2m $2m or more
Perc
enta
ge (%
)
Turnover Range ($)
TSV LGA
QLD
Source: ABS 8165.0, Counts of Australian Businesses, including Entries and Exits, various editions and Queensland Treasury estimates
28employment townsville community profiles
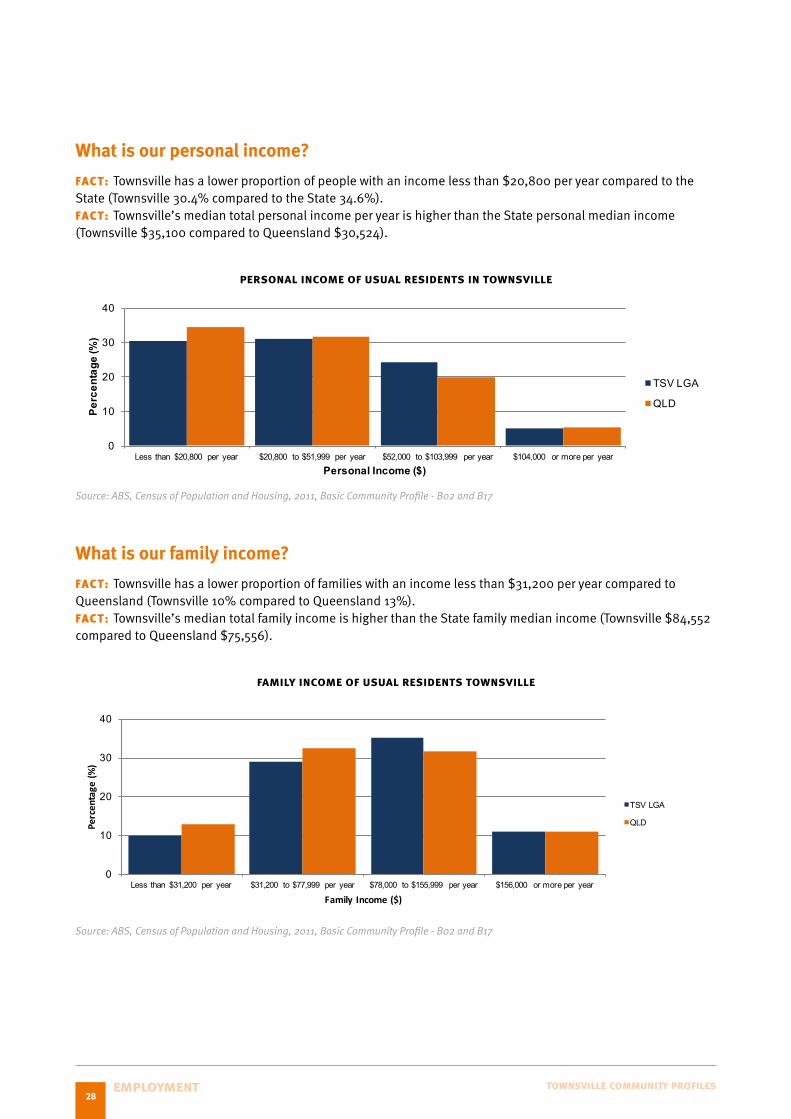
What is our personal income?
FACT: Townsville has a lower proportion of people with an income less than $20,800 per year compared to the State (Townsville 30 .4% compared to the State 34 .6%) . FACT: Townsville’s median total personal income per year is higher than the State personal median income (Townsville $35,100 compared to Queensland $30,524) .
personal income of usual residents in townsville
0
10
20
30
40
Less than $20,800 per year $20,800 to $51,999 per year $52,000 to $103,999 per year $104,000 or more per year
Perc
enta
ge (%
)
Personal Income ($)
TSV LGA
QLD
Source: ABS, Census of Population and Housing, 2011, Basic Community Profile - B02 and B17
What is our family income?
FACT: Townsville has a lower proportion of families with an income less than $31,200 per year compared to Queensland (Townsville 10% compared to Queensland 13%) .FACT: Townsville’s median total family income is higher than the State family median income (Townsville $84,552 compared to Queensland $75,556) .
family income of usual residents townsville
0
10
20
30
40
Less than $31,200 per year $31,200 to $77,999 per year $78,000 to $155,999 per year $156,000 or more per year
Percentage(%
)
FamilyIncome($)
TSV LGA
QLD
Source: ABS, Census of Population and Housing, 2011, Basic Community Profile - B02 and B17

29social infrastructure and community involvement townsville community profiles
What is our Index of Relative Socio-Economic Disadvantage
Socio-Economic Indexes for Areas (SEIFA) is a summary measure of the social and economic conditions of geographic areas across Australia .FACT: Townsville has a lower proportion of persons in Quintile 1 (13 .4%) than the State (20%) . FACT: Townsville largest Quintile is Quintile 2 with 28 .2% .
0
10
20
30
Quintile 1 (most disadvantaged)
Quintile 2 Quintile 3 Quintile 4 Quintile 5 (least disadvantaged)
Perc
enta
ge (%
)
SEIFA Quintile
TSV LGA
QLD
Source: ABS 2033.0.55.001, Census of Population and Housing: Socio-Economic Indexes for Areas (SEIFA), Australia - Data only, 2011, (Queensland Treasury derived)
how many early childhood education and care services do we have at 31 august 2015?
Family Day Care
Kindergartens Long Day Care School Age Care
Limited Hours Care
TOTAL
Townsville LGA 4 19 76 31 1 135
Queensland 149 506 1,456 722 32 2,976
Source: Office for Early Childhood Education and Care, Department of Education and Training and Queensland Treasury estimates
how many emergency services, schools and hospitals do we have at 30 june 2015?
Police Stations Ambulance Stations
Fire Stations Schools Hospitals
Townsville LGA 7 5 5 58 8
Queensland 336 291 242 1,796 276
Snapshot • There are 7 police, 5 fire and 5 ambulance
stations in Townsville .
• 16 .7% of the Townsville population participate in volunteer work .
• At 30 June 2014 there were 28 aged care services in Townsville .
Social Infrastructure and Community Involvement

30social infrastructure and community involvement townsville community profiles
Location of Emergency services, schools and hospitals.
DIV
ISIO
N 2
DIV
ISIO
N 1
DIV
ISIO
N 7
DIV
ISIO
N 5
DIV
ISIO
N 6
DIV
ISIO
N 8
DIV
ISIO
N 3
DIV
ISIO
N 1
0
DIV
ISIO
N 4
Ros
e N
eath
Mur
ray
Mou
nt S
tuar
t
Ras
smus
sen
Gum
low
Con
don
Boh
le
Plai
ns
Kirw
an
Thur
ingo
wa
Cen
tral
Ann
anda
leC
ranb
rook
Wul
guru
Stua
rt
Clu
den
Ros
slea
Shaw
Aitk
enva
le
Idal
ia
Oon
oom
ba
Tow
n C
omm
on
Mou
nt
St J
ohn
Mou
nt
Low
Boh
leB
urde
ll
Gar
butt
Hea
tley
Gul
liver
Vinc
ent
Cur
rajo
ng
Wes
t End
Dou
glas
Mou
nt
Loui
saC
osgr
ove
Her
mit
Park
Rai
lway
Es
tate
Sout
h To
wns
ville
Cas
tle
Hill
Row
es
Bay
Nor
th
War
d
Tow
nsvi
lle
City
SEE
INSE
T
DIV
ISIO
N 4
DIV
ISIO
N 1
0
DIV
ISIO
N 2
DIV
ISIO
N 3
DIV
ISIO
N 1
DIV
ISIO
N 9
Blu
ewat
er
Park
Blu
ewat
er
Cle
man
t
Mut
arne
e
Rol
lings
tone
Bal
gal
Bea
ch
Toom
ulla
Tool
akea
Yabu
luSaun
ders
Bea
ch
Alic
e R
iver
Gum
low
Ran
gew
ood
Palu
ma
Lyna
m
Gra
nite
Val
e
Her
vey
Ran
ge
Cal
cium
Rei
d R
iver
Woo
dsto
ck
Maj
ors
Cre
ek
Bar
ringh
a
Ros
s R
iver
Pinn
acle
sKel
so
Oak
Va
lley
Mou
nt S
tuar
t
Ras
smus
sen
Ros
enea
th
Jula
go
Stua
rt
Nom
e
Alli
gato
r C
reek
Bro
okhi
ll
Toon
pan
Mou
nt E
lliot
Cap
e C
leve
land
Row
es B
ayG
arbu
tt
Dee
ragu
nB
urde
ll
Tow
n C
omm
on
Palla
rend
aHor
sesh
oe B
ay
Flor
ence
Bay
Picn
ic
Bay
Wes
t Po
int
Shel
ly B
each
Bus
hlan
d B
each
Bla
ck R
iver
Jens
en
Bea
ch
Hol
m
Boh
le
Plai
nsShaw
Mou
nt L
ow
Blu
e H
ills
Nel
ly
Bay
Arc
adia
SCH
OO
L
HO
SPIT
AL
AM
BU
LAN
CE
POLI
CE
STAT
ION
FIR
E ST
ATIO
N
RU
RA
L FI
RE
BR
IGA
DE
31social infrastructure and community involvement townsville community profiles
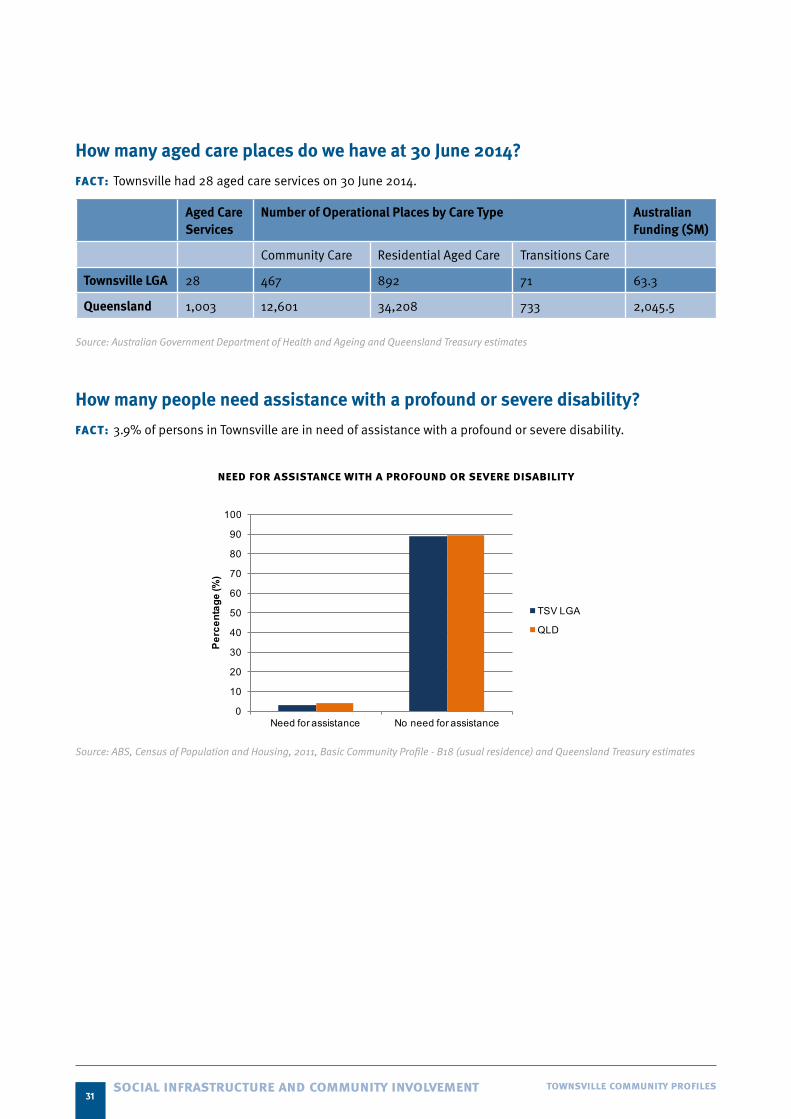
How many aged care places do we have at 30 June 2014?
FACT: Townsville had 28 aged care services on 30 June 2014 .
Aged Care Services
Number of Operational Places by Care Type Australian Funding ($M)
Community Care Residential Aged Care Transitions Care
Townsville LGA 28 467 892 71 63 .3
Queensland 1,003 12,601 34,208 733 2,045 .5
Source: Australian Government Department of Health and Ageing and Queensland Treasury estimates
How many people need assistance with a profound or severe disability?
FACT: 3 .9% of persons in Townsville are in need of assistance with a profound or severe disability .
need for assistance with a profound or severe disability
0
10
20
30
40
50
60
70
80
90
100
Need for assistance No need for assistance
Perc
enta
ge (%
)
TSV LGA
QLD
Source: ABS, Census of Population and Housing, 2011, Basic Community Profile - B18 (usual residence) and Queensland Treasury estimates

32social infrastructure and community involvement townsville community profiles
How many people volunteer in Townsville?
FACT: 22,934 persons (16 .7%) volunteered from August 2010 to August 2011 . This is 2% less than the volunteering rate for Queensland at 18 .7% .
0
10
20
30
40
50
60
70
80
Volunteer Not a volunteer
Perc
enta
ge (%
)
TSV LGA
QLD
Source: ABS, Census of Population and Housing, 2011, Basic Community Profile - B19 (usual residence) and Queensland Treasury estimates
How many people in Townsville are Council library members in 2012?
FACT: Townsville had 122,725 library members in 2014/2015 .
SEE INSET
DIVISION 4
DIVISION 10
DIVISION 2
DIVISION 3DIVISION 1
Bluewater Park
Bluewater
Clemant
Mutarnee
Rollingstone
Balgal Beach
Toomulla
Toolakea
Yabulu
Saunders Beach
Alice River Gumlow
Rangewood
Paluma
Lynam
Granite Vale
Hervey Range
Calcium
Reid River
Woodstock
Majors Creek
Barringha
Ross River
Number of Members
0 – 100100 – 200200 – 300300 – 400400 – 500
Pinnacles
Kelso
Oak Valley
Mount Stuart
Rassmussen Roseneath
Julago
Stuart
Nome
Alligator Creek
Brookhill
Toonpan Mount Elliot
Cape Cleveland
Rowes BayGarbutt
DeeragunBurdell
Town Common
Pallarenda
Horseshoe Bay
Florence Bay
Picnic Bay
West Point
Shelly BeachBushland
Beach
Black River Jensen
Beach Holm
Bohle Plains
Shaw
Mount Low
Blue Hills
Nelly Bay
Arcadia
DIVISION 1DIVISION 9
DIVISION 5
DIVISION 6
DIVISION 7
DIVISION 8
DIVISION 3
DIVISION 10
DIVISION 2
DIVISION 4Rose Neath
Murray
Mount Stuart
Rassmussen
Gumlow
Condon
Bohle Plains
Kirwan
Thuringowa Central
AnnandaleCranbrook
Wulguru
Stuart
Cluden
Rosslea
Shaw
Aitkenvale
Idalia
Oonoomba
Town Common
Mount St John
Mount Low
BohleBurdell
Garbutt
HeatleyGulliver
Vincent
Currajong
West End
Douglas
Mount Louisa
Cosgrove
Hermit Park
Railway Estate
South Townsville
Castle Hill
Rowes Bay
North Ward
Townsville City

33social infrastructure and community involvement townsville community profiles
Where are our Community Services located?
DIV
ISIO
N 2
DIV
ISIO
N 1
DIV
ISIO
N 3
DIV
ISIO
N 1
0
DIV
ISIO
N 4
SEE
INSE
T
DIV
ISIO
N 4
DIV
ISIO
N 1
0
DIV
ISIO
N 2
DIV
ISIO
N 3
DIV
ISIO
N 1
DIV
ISIO
N 9
DIV
ISIO
N 5
DIV
ISIO
N 6
DIV
ISIO
N 7
DIV
ISIO
N 8
Blu
ewat
er
Park
Blu
ewat
er
Cle
man
t
Mut
arne
e
Rol
lings
tone
Bal
gal
Bea
ch
Toom
ulla
Tool
akea
Yabu
luSaun
ders
Bea
ch
Alic
e R
iver
Gum
low
Ran
gew
ood
Palu
ma
Lyna
m
Gra
nite
Val
e
Her
vey
Ran
ge
Cal
cium
Rei
d R
iver
Woo
dsto
ck
Maj
ors
Cre
ek
Bar
ringh
a
Ros
s R
iver
Pinn
acle
sKel
so
Oak
Va
lley
Mou
nt S
tuar
t
Ras
smus
sen
Ros
enea
th
Jula
go
Stua
rt
Nom
e
Alli
gato
r C
reek
Bro
okhi
ll
Toon
pan
Mou
nt E
lliot
Cap
e C
leve
land
Row
es B
ayG
arbu
tt
Dee
ragu
nB
urde
ll
Tow
n C
omm
on
Palla
rend
aHor
sesh
oe B
ay
Flor
ence
Bay
Picn
ic
Bay
Wes
t Po
int
Shel
ly B
each
Bus
hlan
d B
each
Bla
ck R
iver
Jens
en
Bea
ch
Hol
m
Boh
le
Plai
nsShaw
Mou
nt L
ow
Blu
e H
ills
Nel
ly
Bay
Arc
adia
Ros
e N
eath
Mur
ray
Mou
nt S
tuar
t
Ras
smus
sen
Gum
low
Con
don
Boh
le
Plai
ns
Kirw
an
Thur
ingo
wa
Cen
tral
Ann
anda
leC
ranb
rook
Wul
guru
Stua
rt
Clu
den
Ros
slea
Shaw
Aitk
enva
le
Idal
ia
Oon
oom
ba
Tow
n C
omm
on
Mou
nt
St J
ohn
Mou
nt
Low
Boh
leB
urde
ll
Gar
butt
Hea
tley
Gul
liver
Vinc
ent
Cur
rajo
ng
Wes
t End
Dou
glas
Mou
nt
Loui
saC
osgr
ove
Her
mit
Park
Rai
lway
Es
tate
Sout
h To
wns
ville
Cas
tle
Hill
Row
es
Bay
Nor
th
War
d
Tow
nsvi
lle
City
Com
mun
ity S
ervi
ces

34parks and community sporting organisations townsville community profiles
Where are our sport clubs located?
DIVISION 2
DIVISION 1
DIVISION 3
DIVISION 10
DIVISION 4
SEE INSET
DIVISION 4
DIVISION 10
DIVISION 2
DIVISION 3DIVISION 1
DIVISION 9
DIVISION 5
DIVISION 6
DIVISION 7
DIVISION 8
Bluewater Park
Bluewater
Clemant
Mutarnee
Rollingstone
Balgal Beach
Toomulla
Toolakea
Yabulu
Saunders Beach
Alice River Gumlow
Rangewood
Paluma
Lynam
Granite Vale
Hervey Range
Calcium
Reid River
Woodstock
Majors Creek
Barringha
Ross River
Pinnacles
Kelso
Oak Valley
Mount Stuart
Rassmussen Roseneath
Julago
Stuart
Nome
Alligator Creek
Brookhill
Toonpan Mount Elliot
Cape Cleveland
Rowes BayGarbutt
DeeragunBurdell
Town Common
Pallarenda
Horseshoe Bay
Florence Bay
Picnic Bay
West Point
Shelly BeachBushland
Beach
Black River Jensen
Beach Holm
Bohle Plains
Shaw
Mount Low
Blue Hills
Nelly Bay
Arcadia
Rose Neath
Murray
Mount Stuart
Rassmussen
Gumlow
Condon
Bohle Plains
Kirwan
Thuringowa Central
AnnandaleCranbrook
Wulguru
Stuart
Cluden
Rosslea
Shaw
Aitkenvale
Idalia
Oonoomba
Town Common
Mount St John
Mount Low
BohleBurdell
Garbutt
HeatleyGulliver
Vincent
Currajong
West End
Douglas
Mount Louisa
Cosgrove
Hermit Park
Railway Estate
South Townsville
Castle Hill
Rowes Bay
North Ward
Townsville City
AFL
Archery
Athletics
Badminton
Baseball
Basketball
BMX
Cricket
Cycling Mountain Bike
Cycling Track
Dog Sports
Golf
Gymnastics
Hockey
Horse Sports
Jet Ski, Water Ski
Lawn Bowls
Life Saving
Motor Sports
Netball
Outrigger Canoe
Oztag
Rowing
Rugby League
Rugby Union
Sailing
Shooting
Skating
Soccer
Softball
Swimming
Tennis & Table Tennis
Touch
Vigoro
Volleyball
Parks and Community Sporting Organisations
Snapshot • There are 14 off leash areas in Townsville, 13
boat ramp locations, several public swimming pools, and a wide range of other community and sporting venues, parklands and facilities
scattered throughout Townsville that are available for use by the public .

35parks and community sporting organisations townsville community profiles
Where are our parks located?
DIV
ISIO
N 2
DIV
ISIO
N 1
DIV
ISIO
N 3
DIV
ISIO
N 1
0
DIV
ISIO
N 4
SEE
INSE
T
DIV
ISIO
N 4
DIV
ISIO
N 1
0
DIV
ISIO
N 2
DIV
ISIO
N 3
DIV
ISIO
N 1
DIV
ISIO
N 9
DIV
ISIO
N 5
DIV
ISIO
N 6
DIV
ISIO
N 7
DIV
ISIO
N 8
Blu
ewat
er
Park
Blu
ewat
er
Cle
man
t
Mut
arne
e
Rol
lings
tone
Bal
gal
Bea
ch
Toom
ulla
Tool
akea
Yabu
luSaun
ders
Bea
ch
Alic
e R
iver
Gum
low
Ran
gew
ood
Palu
ma
Lyna
m
Gra
nite
Val
e
Her
vey
Ran
ge
Cal
cium
Rei
d R
iver
Woo
dsto
ck
Maj
ors
Cre
ek
Bar
ringh
a
Ros
s R
iver
Pinn
acle
sKel
so
Oak
Va
lley
Mou
nt S
tuar
t
Ras
smus
sen
Ros
enea
th
Jula
go
Stua
rt
Nom
e
Alli
gato
r C
reek
Bro
okhi
ll
Toon
pan
Mou
nt E
lliot
Cap
e C
leve
land
Row
es B
ayG
arbu
tt
Dee
ragu
nB
urde
ll
Tow
n C
omm
on
Palla
rend
aHor
sesh
oe B
ay
Flor
ence
Bay
Picn
ic
Bay
Wes
t Po
int
Shel
ly B
each
Bus
hlan
d B
each
Bla
ck R
iver
Jens
en
Bea
ch
Hol
m
Boh
le
Plai
nsShaw
Mou
nt L
ow
Blu
e H
ills
Nel
ly
Bay
Arc
adia
Ros
e N
eath
Mur
ray
Mou
nt S
tuar
t
Ras
smus
sen
Gum
low
Con
don
Boh
le
Plai
ns
Kirw
an
Thur
ingo
wa
Cen
tral
Ann
anda
leC
ranb
rook
Wul
guru
Stua
rt
Clu
den
Ros
slea
Shaw
Aitk
enva
le
Idal
ia
Oon
oom
ba
Tow
n C
omm
on
Mou
nt
St J
ohn
Mou
nt
Low
Boh
leB
urde
ll
Gar
butt
Hea
tley
Gul
liver
Vinc
ent
Cur
rajo
ng
Wes
t End
Dou
glas
Mou
nt
Loui
saC
osgr
ove
Her
mit
Park
Rai
lway
Es
tate
Sout
h To
wns
ville
Cas
tle
Hill
Row
es
Bay
Nor
th
War
d
Tow
nsvi
lle
City
36transport and development townsville community profiles
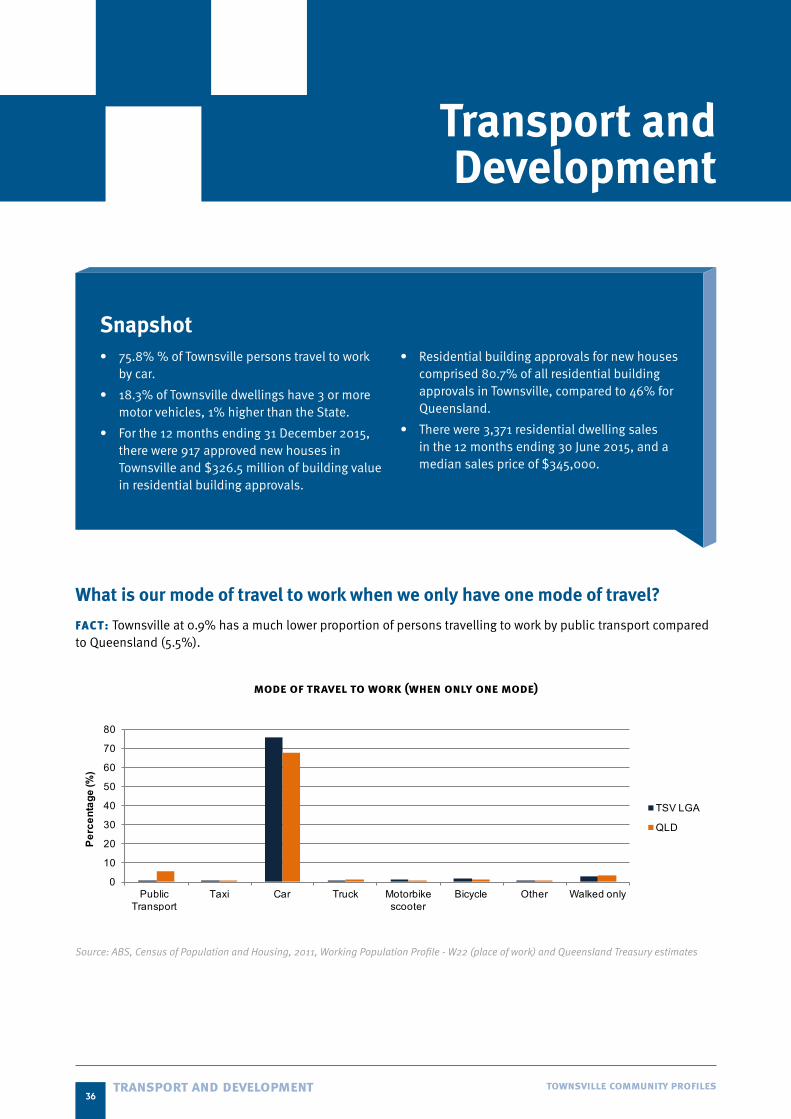
What is our mode of travel to work when we only have one mode of travel?
FACT: Townsville at 0 .9% has a much lower proportion of persons travelling to work by public transport compared to Queensland (5 .5%) .
mode of travel to work (when only one mode)
0
10
20
30
40
50
60
70
80
Public Transport
Taxi Car Truck Motorbike scooter
Bicycle Other Walked only
Perc
enta
ge (%
)
TSV LGA
QLD
Source: ABS, Census of Population and Housing, 2011, Working Population Profile - W22 (place of work) and Queensland Treasury estimates
Transport and Development
Snapshot • 75 .8% % of Townsville persons travel to work
by car .
• 18 .3% of Townsville dwellings have 3 or more motor vehicles, 1% higher than the State .
• For the 12 months ending 31 December 2015, there were 917 approved new houses in Townsville and $326 .5 million of building value in residential building approvals .
• Residential building approvals for new houses comprised 80 .7% of all residential building approvals in Townsville, compared to 46% for Queensland .
• There were 3,371 residential dwelling sales in the 12 months ending 30 June 2015, and a median sales price of $345,000 .

37social infrastructure and community involvement townsville community profiles
How many motor vehicles do we have per dwelling?
FACT: Townsville has a higher proportion of dwellings with 2 motor vehicles (39%) than Queensland (37 .2%) .
dwelling motor vehicle ownership in 2011
0
10
20
30
40
50
No motor vehicles 1 motor vehicle 2 motor vehicles 3 or more motor vehicles
Perc
enta
ge (%
)
TSV LGA
QLD
Source: ABS, Census of Population and Housing, 2011, Basic Community Profile - B29 (occupied private dwellings) and Queensland Treasury estimates
How many residential building approvals have been granted?
FACT: In September 2012 the LGA had the highest number of residential building approvals with 272 building approvals for the month . FACT: Townsville experienced a decline in the monthly average number of building approvals in 2015 to 99 compared to 213 in 2007 .
residential building approvals
-500
500
1,500
2,500
3,500
4,500
5,500
050
100150200250300350400450
Que
ensl
and
(num
ber)
Tow
nsvi
lle L
GA
(num
ber)
Month TSV LGA QLD
Source: ABS 8731.0, Building Approvals, Australia, various editions and Queensland Treasury estimates
38social infrastructure and community involvement townsville community profiles
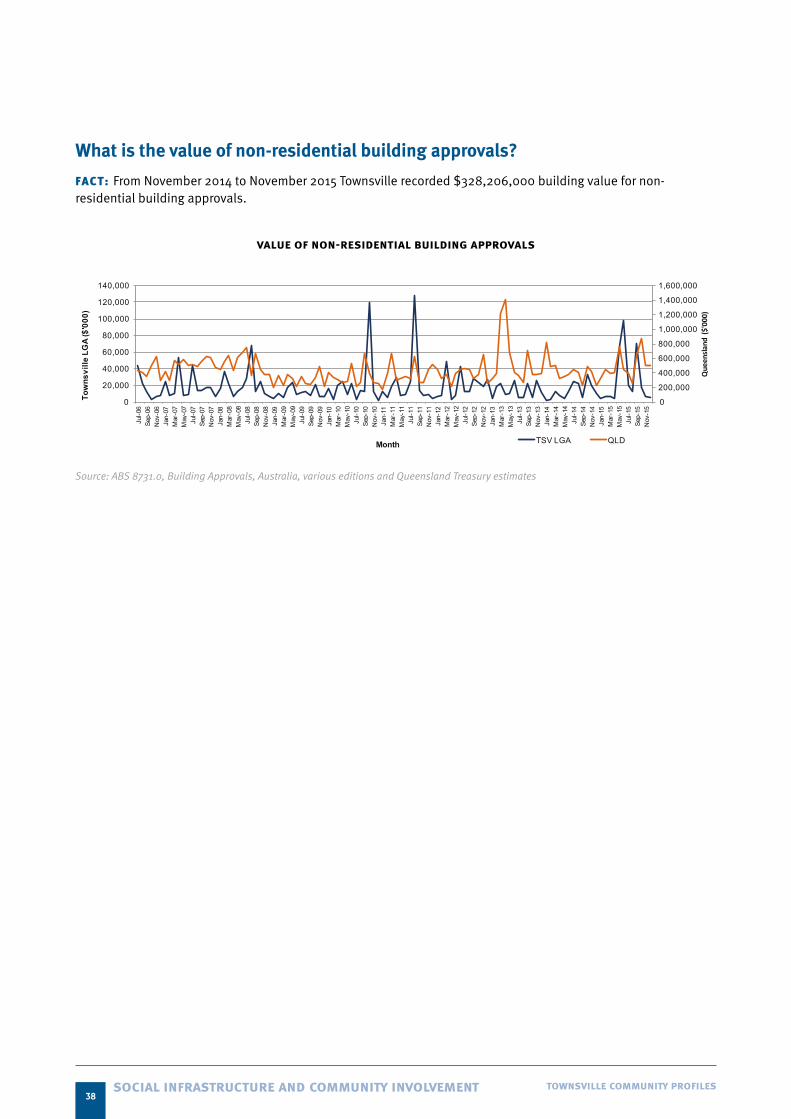
What is the value of non-residential building approvals?
FACT: From November 2014 to November 2015 Townsville recorded $328,206,000 building value for non-residential building approvals .
value of non-residential building approvals
0
200,000
400,000
600,000
800,000
1,000,000
1,200,000
1,400,000
1,600,000
0
20,000
40,000
60,000
80,000
100,000
120,000
140,000
Jul-0
6Se
p-06
Nov
-06
Jan-
07M
ar-0
7M
ay-0
7Ju
l-07
Sep-
07N
ov-0
7Ja
n-08
Mar
-08
May
-08
Jul-0
8Se
p-08
Nov
-08
Jan-
09M
ar-0
9M
ay-0
9Ju
l-09
Sep-
09N
ov-0
9Ja
n-10
Mar
-10
May
-10
Jul-1
0Se
p-10
Nov
-10
Jan-
11M
ar-1
1M
ay-1
1Ju
l-11
Sep-
11N
ov-1
1Ja
n-12
Mar
-12
May
-12
Jul-1
2Se
p-12
Nov
-12
Jan-
13M
ar-1
3M
ay-1
3Ju
l-13
Sep-
13N
ov-1
3Ja
n-14
Mar
-14
May
-14
Jul-1
4Se
p-14
Nov
-14
Jan-
15M
ar-1
5M
ay-1
5Ju
l-15
Sep-
15N
ov-1
5
Queensla
nd($'000)
Tow
nsvi
lle L
GA
($'0
00)
Month TSV LGA QLD
Source: ABS 8731.0, Building Approvals, Australia, various editions and Queensland Treasury estimates

39safety townsville community profiles
What are the main offences reported against people?
FACT: There were 2 homicides reported in Townsville in 2014/2015 .TREND: Since 2012/2013 reported robberies against people have decreased from 72 in 2012/2013 to 56 in 2014/2015 .
number of reported offences against people
-
200
400
600
800
1,000
1,200
1,400
Assault Sexual Offences Robbery Homicide Other homicide Other Offence Against a Person
Num
ber
2012/2013
2013/2014
2014/ 2015
Other Offences Against a person’ include kidnapping, abduction, extortion, stalking and life endangering acts and ‘Other Homicide’ include attempted murder and driving causing death.
Source: Queensland Police Service
Snapshot • Total reported offences decreased in
2014/2015 to 2,524, down from 3,103 in 2013/2014 and 3,184 in 2012/2013
• Reported vehicle theft (includes stealing from/enter with intent) decreased by 209 in 2012/2013 to 139 in 2014/2015 .
• Unlawful use of motor vehicle decreased by almost 50% from 2012/2013 (896) to 2014/2015 (478) .
• Whilst overall offences are down, drug offences increased from 2,897 offences reported in 2012/2013 rising to 3,689 in 2014/2015 .
Safety

40safety townsville community profiles
What are the main offences reported against property?
FACT: In 2014/2015 Townsville had 1,644 reports for unlawful entry . TREND: Since 2012/2013 Townsville has experienced a decrease in unlawful use of motor vehicles (896 in 2012/2013 to 478 in 2014/2015) .
number of reported offences against property
-
1,000
2,000
3,000
4,000
5,000
6,000
Unlawful Entry Other Property Damage
Unlawful Use of Motor Vehicle
Other Theft (excl. Unlawful Entry)
Fraud Arson
Num
ber
2012/2013
2013/2014
2014/ 2015
Note: Other Theft include stealing form dwellings, stop stealing, vehicles (steal from/enter with intent) and other stealing.
Source: Queensland Police Service
How other offences have been reported?
FACT: There were 3,689 drug offences reported in 2014/2015 . TREND: Since 2012/2013 Townsville has experienced an increase in breaches in domestic violence protection orders (723 in 2012/2013 to 1,020 in 2014/2015) .TREND: There has been a rise in reported drug offences from 12% of all offences in 2012/2013 rising to 16% of all reported offences in 2014/2015 .
number of other offences reported
-
500
1,000
1,500
2,000
2,500
3,000
3,500
4,000
Drug Offences Liquor (excl. Drunkenness)
Breach Domestic Violence
Protection Order
Trespassing and Vagrancy
Weapons Act Offences
Good Order Offences
Traffic and Related Offences
Miscellaneous Offences
Num
ber
2012/2013
2013/2014
2014/2015
Source: Queensland Police Service


for more information: www.townsville.qld.gov.au
1300 878 001