Embed Size (px)
Citation preview
i
TOXIC TRACE METAL REMOVAL USING BIOGENIC MANGANESE OXIDE
IN A PACKED-BED BIOREACTOR
A Master’s Thesis Presented to the Faculty of California Polytechnic State University
San Luis Obispo, California
In partial fulfillment of the requirements for the degree of
Master of Science in General Engineering
with a specialization in Biochemical Engineering
By Jared S. Ervin
March 1, 2005

ii
COPYRIGHT OF MASTER’S THESIS
I hereby grant permission for the reproduction of this thesis in its entirety or any of its parts, without further authorization, provided acknowledgement is made to the author(s) and advisor(s). Jared S. Ervin ____________________________ Date: ________________________

iii
MASTER’S THESIS APPROVAL
TITLE: TOXIC TRACE METAL REMOVAL USING BIOGENIC MANGANESE OXIDE IN A PACKED-BED BIOREACTOR AUTHOR: JARED S. ERVIN DATE SUBMITTED: MARCH 1, 2005 THESIS COMMITTEE MEMBERS: Dr. Daniel Walsh ____________________________ Date: ____________________ Dr. Nirupam Pal ____________________________ Date: ____________________ Dr. Yarrow Nelson ____________________________ Date: ____________________

iv
ABSTRACT
TOXIC TRACE METAL REMOVAL USING BIOGENIC MANGANESE OXIDE IN A PACKED-BED BIOREACTOR
JARED S. ERVIN
The ability of biogenic manganese oxide biofilms to adsorb toxic lead was tested
using a packed-bed bioreactor. Pure cultures of the manganese-oxidizing bacterium
Leptothrix discophora SS-1 were grown and used to create biofilms in two bioreactors
packed with one-quarter inch solid polypropylene beads. Inoculated media trickled down
over the bed like a trickling filter during a growth period of two to three weeks. During
this time, temperature and pH were monitored and kept at approximately 28oC and 7.0,
respectively. After the growth period manganese was added to one of the bioreactors and
the other remained as a control. The bioreactors continued to run for another day to let
the bacterial oxidation of manganese take place. The bioreactors were then flushed, and a
solution of 2 umol/L (414 ppb) lead was run through the columns at 5 mL/min up-flow.
A 10 mL sample of the effluent flow was collected every half hour, equal to one retention
time, for 25 samples. This entire process was repeated three different times with some
alterations in an attempt to maximize lead adsorption to the biofilms. Graphite furnace
atomic absorption spectroscopy (GFAAS) was used to determine the concentration of
lead in the effluent samples. GFAAS was also used to determine the concentration of
manganese in the bed, and the mass of the biofilms was found gravimetrically.
Atomic absorption results from the samples showed that there was lead adsorption
to the oxidized manganese biofilm, but that there was no period of high removal

v
efficiency in the beginning of the breakthrough curve. In all experiments the effluent
lead concentration neared that of the influent concentration after just 5 hours (10
retention times) or less. Oxidized manganese deposits on the bioreactor bed were about
0.4 mg and total biomass was about 0.1g. These low levels could account for the low
rates of lead adsorption observed. Results were compared to other researcher’s
adsorption capacities, and it was found that the manganese oxides in this study adsorbed
two orders of magnitude less lead than that reported by another research group. A mass
transfer analysis was also performed which showed that adsorption in the packed bed was
not likely to be limited by the diffusion of lead to the surface of the biofilms on the beads.
Ultimately, the limitation was therefore presumed to be one of the kinetics of lead
adsorption to the biogenic manganese oxide biofilm.
Further experiments should be conducted with a much slower flow rate or more
time given for adsorption to occur. A larger or longer column could also increase
adsorption, and a more tightly packed bed may assist in the growth phase and allow for
greater biomass and in turn higher concentrations of oxidized manganese on the bed.
Further efforts could also be made to establish growth of a pure Leptothrix discophora
SS-1 biofilm. After attaining a successful filter, a commercial product could be produced
that would filter lead and other toxic trace metals out of wastewater and other aqueous
environments.

vi
ACKNOWLEDGEMENTS
Special thanks to:
Dr. Yarrow Nelson
Dr. Nirupam Pal
Dr. Dan Walsh
Carolyn Zeiner at Cornell
Bunkim Chokshi and Lynne Maloney
All my friends and family
& Christina
This project was supported in part by the Cal Poly C3RP program
through the U.S. Office of Naval Research
For Mom and Dad

vii
TABLE OF CONTENTS
LIST OF TABLES ………………………………………………………………… ……. x LIST OF FIGURES …………………………………………………………………….. xi INTRODUCTION……………………………………………………………………….. 1 PROJECT SCOPE ………………………………………………………………………. 3 BACKGROUND ………………………………………………………………………... 5
3.1 Biological Manganese Oxidation ………………………………………………... 7
3.1.1 Effects of Condition Changes on Manganese Oxidation …………………. 7
3.1.2 Rate Law for Biological Manganese Oxidation …………………………... 9
3.1.3 Comparison of Biological Manganese Oxidation to Abiotic
Oxidation Rates ………………………………………………………….. 10
3.2 Trace Metal Adsorption to Biogenic Manganese Oxides ……………………… 10
3.2.1 Lead Adsorption to Leptothrix discophora manganese oxides ………….. 11 3.2.2 Discussion of Increased Adsorption …………………………………….. 12
3.3 Manganese Oxide Biofilms …………………………………………………….. 13 3.4 Background Conclusion .……………………………………………………….. 15
MATERIALS AND METHODS……………………………………………………….. 16
4.1 Leptothrix discophora SS-1 Growth …………………………………………… 16 4.2 Bioreactor Design and Construction …………………………………………… 23
4.3 Bioreactor Operation …………………………………………………………… 28
4.3.1 Biofilm Growth ………………………………………………………….. 29 4.3.2 Manganese Oxidation …………………………………………………… 30
4.4 Lead Adsorption ………………………………………………………………... 31

viii
4.5 Atomic Absorption Spectroscopy ……………………………………………… 32
4.5.1 Lead Analysis by Atomic Absorption …………………………………… 33
4.5.2 Manganese Analysis by Atomic Absorption ……………………………. 35
4.6 Biomass Characterization ……………………………………………………… 37
4.6.1 Microscopy ……………………………………………………………… 38 4.6.2 Dry Weight Analysis …………………………………………………….. 38
RESULTS ……………………………………………………………………………… 40
5.1 Results from First Complete Run ……………………………………………… 40
5.1.1 Lead Breakthrough Curve for First Run ………………………………… 41 5.1.2 Manganese Analysis for First Run ………………………………………. 45
5.1.3 Biomass Dry Weight for First Run .……………………………………... 47
5.1.4 Observations and Microscopy for First Run …………………………….. 48
5.2 Results from Second Complete Run …………………………………………… 50
5.2.1 Lead Breakthrough Curve for Second Run …….………………………... 50 5.2.2 Manganese Analysis for Second Run …………………………………… 53
5.2.3 Biomass Dry Weight for Second Run …………………………………… 55
5.2.4 Observations and Microscopy for Second Run …………………………. 56
5.3 Results from Third Complete Run ………………………………....................... 58
5.3.1 Lead Breakthrough Curve for Third Run ………………………………... 58 5.3.2 Manganese Analysis for Third Run ……………………………………... 61
5.3.3 Biomass Dry Weight for Third Run ……………………………………... 63
5.3.4 Observations and Microscopy for Third Run …………………………… 64
5.4 Lead Removal Efficiency for All 3 Runs ……………………………………… 66

ix
DISCUSSION ………………………………………………………………………….. 68
6.1 Lead Adsorption Results Discussion …………………………………………... 68 6.2 Comparison to Lead Adsorption by Manganese Oxides in Other Studies …...... 73
6.2.1 Quantity of Manganese in the Biofilms …………………………………. 73 6.2.2 Quantity of Lead Adsorbed to the Biofilms ……………………………... 74
6.3 Mass Transfer Analysis…………………………………………………………. 75
6.4 Possible Future Experiments …………………………………………………… 77
6.5 Potential Applications ……………………………….………………................. 78
CONCLUSIONS ………………………………………………………………………. 79
7.1 Summary ……………………………………………………………………….. 79 7.2 Future Recommendations ……………………………………………………… 81
REFERENCES ………………………………………………………………………… 83

x
LIST OF TABLES
Table 1 Composition of Pyruvate Growth Media …………………………......... 17 Table 2 Composition of MMS Growth Media ………………………………….. 22 Table 3 Results from Lead Standards by GFAAS from 8/17/2004 …………….. 41 Table 4 Results for Lead Samples from Column #1, Manganese Added, by
GFAAS from 8/17/2004 ……………………………………………….. 43 Table 5 Results for Lead Samples from Column #2, Control with No Manganese
Added, by GFAAS from 8/17/2004 ……………………………………. 44 Table 6 Results from Manganese Standards by GFAAS from 8/17/2004 ……… 46 Table 7 Biomass Dry Weight from 8/17/2004 ………………………………….. 47
Table 8 Results from Lead Standards by GFAAS from 11/6/2004 …………….. 51 Table 9 Effluent Lead Concentrations from Column #1, Manganese Added, and
Column #2, Control with No Manganese Added, by GFAAS from 11/6/2004 ………………………………………………………………. 52
Table 10 Results from Manganese Standards by Graphite Furnace Atomic
Absorption Spectroscopy from 11/6/2004 ……………………………... 54 Table 11 Biomass Dry Weight from 11/6/2004 ………………………………….. 55
Table 12 Results from Lead Standards by GFAAS from 12/3/2004 …………….. 59 Table 13 Results for Lead Samples from Column #1 and Column #2, Both with
Manganese Added, by GFAAS from 12/3/2004…………………........... 60 Table 14 Results of Manganese Concentration on the Column Beds from
12/3/2004 ………………………………………………………………. 62 Table 15 Biomass Dry Weights from 12/3/2004……………………………......... 63 Table 16 Total Biomass and Manganese Results from All Complete Runs ……... 72

xi
LIST OF FIGURES
Figure 1 Plate Streaking Procedure ……………………………………………… 19 Figure 2 Reservoir Design ……………………………………………………….. 24
Figure 3 Packed-bed biofilm Column Design …………………………………… 26
Figure 4 Bioreactor Apparatus …………………………………………………... 27
Figure 5 Up-flow Lead Adsorption Column …………………………………….. 32
Figure 6 Lead Graphite Furnace Atomic Absorption Conditions ……………….. 35
Figure 7 Manganese Graphite Furnace Atomic Absorption Conditions ………… 37
Figure 8 Lead Calibration Curve by GFAAS from 8/17/2004 …………………... 42
Figure 9 Breakthrough Curves for L. discophora Lead Adsorption Over Time by Both Control and Sample Column Packed-beds With and Without Manganese Oxide from 8/17/2004 ……………………………………... 45
Figure 10 Manganese Calibration Curve by GFAAS from 8/17/2004 …………… 46 Figure 11 1000X Magnification of Media Sample Taken from the Sample Column
on 8/17/2004 …………………………………………………………… 48 Figure 12 1000X Magnification of Media Sample Taken from the Control Column
on 8/17/2004 …………………………………………………………… 49 Figure 13 Lead Calibration Curve by GFAAS from 11/6/2004 …………………... 51 Figure 14 Breakthrough Curves for L. discophora Lead Adsorption Over Time by
Both Control and Sample Column Packed-beds With and Without Manganese Oxide from 11/6/2004 ……………………………………... 53
Figure 15 Manganese Calibration Curve by GFAAS from 11/6/2004 …………… 54 Figure 16 1000X Magnification of Media Sample Taken from the Sample Column
from 11/6/2004 …………………………………………………………. 56 Figure 17 1000X Magnification of Media Sample Taken from the Control Column
from 11/6/2004 …………………………………………………………. 57 Figure 18 Lead Calibration Curve by GFAAS from 12/3/2004 …………………... 59
xii
Figure 19 Lead Breakthrough Curves for L. discophora Lead Adsorption Over Time by Both Packed-bed Columns With Manganese Oxide from 12/3/2004 ………………………………………………………………. 61
Figure 20 1000X Magnification of Media Sample Taken from the Sample Column
#1 from 12/3/2004 ……………………………………………………… 64 Figure 21 1000X Magnification of Media Sample Taken from the Sample Column
#2 from 12/3/2004 ……………………………………………………… 65 Figure 22 Lead Adsorption Results from All 3 Runs ……………………………... 66 Figure 23 1000X Magnification of pure L. discophora from Inoculation Broth …. 71 Figure 24 1000X Magnification of pure L. discophora from Growth Plate with
Oxidized Manganese Present …………………………………………... 71
1
CHAPTER 1
INTRODUCTION
Toxic trace metals, such as lead, can be hazardous even at very low
concentrations (Nriagu, 1990). When they get into water supplies and aqueous
environments the health of plants and animals, as well as humans, can be impaired.
Toxic trace metals are commonly found in wastewater and removing them efficiently
presents a unique challenge. Whether contamination occurs as a result of human
intervention or naturally, an easy and non-intrusive way of cleaning up such hazards
would be beneficial to everyone. In the environment biologically formed manganese and
iron oxides regulate the bioavailability of some toxic trace metals (Nelson et al., 1999a).
Metals are bound to the biogenic manganese and iron oxides and removed from solution
rendering the solution free of toxic trace metals. This adsorption process could
potentially be exploited for the development of engineered toxic metal removal
processes.
Previous research has shown that manganese oxide biofilms produced by
Leptothrix discophora SS-1 have a high affinity for the binding of toxic lead from an
aqueous solution (Nelson et al., 1999b). In some cases the metal binding of the biogenic
manganese oxides was orders of magnitude greater than that of abiotic manganese oxide
minerals. This research concluded that further experimentation needed to be done on the
ability of biogenic manganese oxides to bind lead and their possible uses in more
practical engineering applications. This previous research is what prompted

2
experimentation on building a laboratory filter that uses a biogenic manganese oxide
biofilm to remove toxic trace metals from an aqueous solution.
This project was designed to test the ability of a biogenic manganese oxide
biofilm to filter toxic lead out of an aqueous solution using a packed-bed bioreactor.
Biofilms of L. discophora were grown on plastic beads and manganese was added to
allow for the formation of biogenic manganese oxides on the surfaces of the beads.
Aqueous lead solutions were then pumped through the packed-bed columns. Atomic
absorption spectroscopy was used to determine lead concentrations in filtered solutions
and manganese concentrations on the bioreactor bed. Details on the scope of this project
are presented in the next chapter. Results from this project will give insight into what
further steps need to be taken in order to further this technology. It will also help
determine the real world effectiveness of such a filter, possible engineering applications,
and the feasibility of producing a commercial product at some point in the future.

3
CHAPTER 2
PROJECT SCOPE
Laboratory experiments were conducted on the ability of biogenically oxidized
manganese biofilms to filter toxic lead in a packed-bed bioreactor. Two packed-bed
bioreactors were designed and built to conduct the experiments in. Two bioreactors
allowed a control to be run simultaneously in each experiment. The bioreactors were
packed with one-quarter inch solid polypropylene balls to facilitate a large surface area
on which to grow the biofilms. Pure cultures of Leptothrix discophora SS-1 were grown
and used to create biofilms in the bioreactors by trickling inoculated media down over the
bioreactor beds. The trickling filter design allowed for maximum aeration and nutrients
to be brought to the biofilm from a reservoir at the same time. The biofilms were given
two to three weeks to grow in each experiment before manganese was added. The
control was kept free of manganese in order to determine the adsorption effects of the
bioreactors without oxidized manganese. Manganese sulfate solution was recirculated
through the bioreactor for one day to allow for manganese oxidation. Finally, the
bioreactor beds were flushed with a media solution and a solution of lead was run up-
flow through the bioreactor beds. Up-flow allowed for a low flow rate that was thought
to be necessary to get good binding of the lead to the oxidized manganese biofilm.
Samples of the effluent were collected and analyzed for lead concentrations using
GFAAS. The graphite furnace was necessary in order to detect the low levels of lead
present in the samples. The bioreactor bed was then dried and weighed before dissolving
the biofilm and oxidized manganese in nitric acid. GFAAS was then used to determine

4
the concentration of manganese on the bioreactor bed. This information along with the
dry weight of the biofilm was gathered in order to characterize the biomass. Three
complete experimental processes were completed over the course of one year with slight
variations to each experiment in an attempt to maximize lead adsorption.

5
CHAPTER 3
BACKGROUND
This project was based on the formation of biogenic manganese oxides in a
biofilm and their ability to adsorb toxic trace metals. Previous research into this subject
has been done, but much is still unknown about the subject. It has been recognized that
in the environment biological manganese oxidation is important in controlling not only
the bioavailability of manganese, but also the bioavailability of other trace metals
(Nelson et al., 1999a). This includes toxic trace metals such as lead that are strongly
bound to suspended biogenic manganese oxides. Manganese cycling is very important in
the environment, and research has been done into the enzymatic pathways responsible for
biological manganese oxidation (Tebo et al., 1997). Other research has also been done
into a kinetic model for biological manganese oxidation (Zhang et al., 2002) and the
effects of strong trace metal binding by biogenic manganese oxides in aqueous
environments (Nelson et al., 1999a; Nelson et al., 2003; Dong et al., 2003). This research
has given insight into biogenic manganese oxidation and spurred the need for more
research to be completed to further understand the subject.
Manganese oxidation can occur without the help of microorganisms, but abiotic
manganese oxidation occurs only at a high pH and is therefore not expected to frequently
occur in nature (Tebo et al., 1997). This means that manganese oxidation in the
environment is mostly due to biological processes. There are two theories of how this
might occur. Biological manganese oxidation could occur as the result of an
enzymatically catalyzed reaction or as the result of local changes in pH caused by other

6
microorganisms such as algae (Nelson et al., 2003). There are several microorganisms
with the reported ability to biologically oxidize manganese that have been found and
isolated in the environment. The bacterium Bacillus subtilis, found in the ocean, the
bacterium Pseudomonas putida MnB1, found in freshwater, and the bacterium that was
used in this project, Leptothrix discophora, which was isolated from the metallic surface
film of freshwater wetlands in New York State (ATCC, 2004), all have the ability to
biologically oxidize manganese.
This chapter will focus on several different aspects of biological manganese
oxidation in order to gain a complete understanding of the subject and the work that has
been done on it. The first section will focus on biological manganese oxidation and the
kinetics that follow. Here the research that led up to the creation of a rate law for
biologically catalyzed manganese oxidation will be discussed. Next, the focus will shift
to the ability of those biological manganese oxides to adsorb trace metals and the
mechanism by which they do this. And finally, there will be a discussion of the research
that has been done on trace metal adsorption to natural biofilms that contain biogenic
manganese oxides. Researchers have long thought that biologically formed manganese
oxides would have a much higher trace metal binding capability than those formed
abiotically and recent research done to find out if that is true will be discussed. That will
then conclude the bulk of the literature review that is pertinent to the understanding of
and prompting of this project.

7
3.1 Biological Manganese Oxidation
When manganese oxidation was first studied it was only abiotic methods that
were taken into account and biological manganese oxidation was completely ignored.
However, abiotic manganese oxidation occurs readily only at a pH of 9 or greater and
proceeds extremely slowly at lower pH’s like those found in the natural environment
(Nelson et al., 2003). Because of this it is generally recognized that in order for the
reaction to occur there must be some kind of biological catalyst. It has been shown that
manganese oxidation in a natural environment at a pH near neutral can occur at a rate
several orders of magnitude greater than that of abiotic manganese oxidation (Nealson et
al., 1988). From this research it was clear that a kinetic model for the biogenic oxidation
of manganese at neutral pH levels needed to be developed. Reported rates of biological
manganese oxidation vary greatly depending on growth medium, conditions, and
bacterial strain used in each experiment. Temperature and pH also play a major role in
the rate of biological manganese oxidation in natural environments as well as in pure
cultures of Leptothrix discophora SS-1. It has been shown that Leptothrix discophora
SS-1 exhibits a maximum rate of manganese oxidation at a pH of 7.5 and a temperature
of 30oC (Adams and Ghiorse, 1987).
3.1.1 Effects of Condition Changes on Manganese Oxidation
Experiments were conducted over a range of conditions using the bacterium
Leptothrix discophora SS-1 (Nelson et al., 2003). In one experiment variables included
temperature, pH, and the concentrations of cells, manganese, oxygen and copper. As in
previous research, biological manganese oxide biofilms were grown in laboratory
controlled bioreactors and in a defined growth medium (Zhang et al., 2002). A defined

8
growth media is necessary when doing this research because undefined media ingredients
could contain trace metals and some buffers could interfere with manganese oxidation.
The results of this research showed that biological manganese oxidation was directly
proportional to cell and oxygen concentrations and that there was a pH optimum of 7.5
and a temperature optimum of 30oC, which was consistent with previous research
(Adams and Ghiorse, 1987). It was also found that for Leptothrix discophora SS-1
manganese oxidation kinetics were consistent with Michaelis-Menton enzyme kinetics in
terms of manganese concentration (Nelson et al., 2003; Tebo and Emerson, 1986).
Michaelis-Menton parameters were then determined for Leptothrix discophora SS-1
(Zhang et al. 2002). At optimum conditions, the maximum biological manganese
oxidation rate was determined to be 0.0059 umol Mn/min-mg cell, and the half velocity
coefficient for biological manganese oxidation by Leptothrix discophora SS-1 was
determined to be 5.7 umol Mn/L (Zhang et al., 2002). These Michaelis-Menton
parameters were used in the development of a rate law for the biological oxidation of
manganese by Leptothrix discophora SS-1 under these ideal conditions.
Other research has shown that copper concentrations are important in the
biological oxidation of manganese (Corstjens et al., 1992). Studies looking into the
molecular biology of manganese oxidizing bacteria have shown that enzymes containing
copper may play an important role in bacterial manganese oxidation (Corstjen et al.,
1992). Addition of copper at concentrations as low as 0.02 uM has been shown to
increase the rate of manganese oxidation by 25%, but at the same time slightly inhibit the
growth rate and ultimate biomass yield when using Leptothrix discophora SS-1 (Zhang et
al., 2002). Zhang et al. also showed that it was important for copper to be present in the

9
growth media from the beginning. When copper was added after growth was complete it
did not increase the rate of manganese oxidation.
3.1.2 Rate Law for Biological Manganese Oxidation
With information on the effects of the parameters described above it was then
possible to develop a general rate law for biological manganese oxidation by Leptothrix
discophora SS-1. The rate law took into account the effects of cell concentration,
manganese concentration, pH, temperature, dissolved oxygen concentration, and copper
concentration and is shown in Equation 1 (Zhang et al., 2002).
)])([1(]/[/][1
)])([()]([)](][[)]([
21
/22 IICuk
HKKHk
AeOkIIMnKIIMnXk
dtIIMnd
cpHRTEa
os
+⎟⎟⎠
⎞⎜⎜⎝
⎛+++
=− ++− (Eq. 1)
In Equation 1, [X] = cell concentration, mg/L; [O2] = dissolved oxygen
concentration, mg/L; [Cu] = total dissolved copper concentration, umol/L; k = 0.0059
umol Mn(II)/(mg cell · min); Ks = 5.7 umol Mn(II)/L; ko2 = 1/8.05 = 0.124 L/mg ([O2] =
8.05 mg/L at 25oC and I = 0.05 mol/L); Ea = 22.9 kcal/(g cell · mol); A = 2.3 × 10¹⁴; K1 =
3.05 × 10⁻⁸; K2 = 2.46 × 10⁻⁸; kpH = 2.82; kC = 8.8 L/umol Cu. Under typical conditions,
temperature = 25 oC, pH = 7.5, [O2] = 8.05 mg/L and zero added copper, the above
equation can be simplified into Equation 2, which is the Michaelis-Menton expression for
biological manganese oxidation.
)]([)](][[)]([
IIMnKIIMnXk
dtIIMnd
s +=− (Eq. 2)

10
3.1.3 Comparison of Biological Manganese Oxidation to Abiotic Oxidation Rates
The rate law described above was then used to compare the rate of biological
manganese oxidation to that of abiotic manganese oxidation (Nelson et al., 2003). It was
found that at a pH of 8.03 it would only take a Leptothrix discophora SS-1 cell
concentration of 0.30 ug/L to match the rate of abiotic manganese oxidation at the same
pH. Cell populations of manganese oxidizing bacteria much higher than this can be
found in natural environments, and an even smaller concentration of manganese
oxidizing bacteria would be necessary to match the abiotic rate at a lower pH. This rate
law equation is only true for Leptothrix discophora SS-1 and other bacteria or even other
strains of Leptothrix discophora would almost certainly exhibit different rates of
biological manganese oxidation. However, the general form of the equation would most
likely be the same for other manganese oxidizing bacteria and other strains of Leptothrix
discophora. This research helped to improve validity of the theory that manganese
oxidation in natural environments is controlled by manganese oxidizing bacteria and not
abiotic reactions.
3.2 Trace Metal Adsorption to Biogenic Manganese Oxides
The most crucial research that led up to this project was that of toxic trace metal
adsorption by biogenic manganese oxides. It has been shown that in natural
environments toxic trace metals are controlled by interactive biogeochemical processes
including adsorption, complexation and multiple biological interactions (Nelson et al.,
1999a). Previous research has also shown that microorganisms have the ability to adsorb
large amounts of toxic trace metals and many bacteria are able to bind metals to
extracellular polymers that they produce (Lion et al., 1988; Nelson et al., 1995). Certain

11
trace metals, however, have a much higher potential to be adsorbed to biogenic
manganese and iron oxides than to be adsorbed by organic material. The next section
will focus on research done on the binding capabilities of trace metals to biogenic
manganese oxides in controlled laboratory conditions.
3.2.1 Lead Adsorption to Leptothrix discophora Manganese Oxides
The only significant research to date into trace metal adsorption by biologically
formed manganese oxides was done by Nelson et al. (2003). Manganese oxidation and
trace metal adsorption experiments were conducted under controlled laboratory
conditions using Leptothrix discophora as the manganese oxidizing bacteria in a
chemically defined growth medium. Because buffers can complex manganese they were
left out of the growth medium, and pH controllers were used to control the pH. Other
trace metals were also omitted from the growth medium except for a very small amount
of iron (0.1 uM), which was found to be necessary for manganese oxidation (Nelson et
al., 1999b). In this research it was found that at a pH of 6.0 and a temperature of 25 oC,
lead adsorption by Leptothrix discophora cells with biogenic manganese oxide coatings
was two orders of magnitude greater than lead adsorption by the same cells without
biogenic manganese oxide coatings (Nelson et al., 1999b). This confirmed the theory
that lead has a much higher binding affinity for metal oxides than it does for organic
material. However, the research also found that lead had a much higher binding affinity
for biogenic manganese oxides than for abiotic manganese oxides. Experiments
conducted under the same conditions as above showed that biogenic manganese oxides
had five times the lead adsorption capacity as that of freshly prepared abiotic manganese
oxides (Nelson et al., 1999b). Other results from the same research showed that the

12
difference in lead adsorption by biogenic manganese oxides compared to abiotic
manganese oxides was even more significant at very low lead concentrations like those
that would be found in natural aquatic environments. It was also found that adsorption of
lead by biogenic manganese oxides under the same conditions was several orders of
magnitude greater than that of abiotic pyrolusite manganese oxide minerals and more
than an order of magnitude greater than colloidal iron oxyhydroxide (Nelson et al.,
1999b). This research concluded that even though there is much less manganese than
iron in natural aquatic environments, the increased ability of manganese oxides to absorb
lead may make manganese oxides as important or even more important than iron oxides
in the natural adsorption of some toxic trace metals (Nelson et al., 1999b).
3.2.2 Discussion of Increased Adsorption
Further research was conducted into why biogenic manganese oxides have such
an increased affinity for the binding of lead and some other toxic trace metals.
Research was conducted on biogenic manganese oxides formed in the same controlled
laboratory conditions as above using x-ray diffraction analysis (Nelson et al., 2001). The
analysis showed that the biogenic manganese oxides were amorphous and would thus be
expected to exhibit greater surface area than other types of manganese oxide examined.
The specific surface area of biogenic manganese oxide was found to be 220 m2/g (Nelson
et al., 2001). This research found that the greater surface area was proportional to the
greater lead binding affinity in biogenic manganese oxides over abiotic manganese
oxides. However, this relationship did not hold true when comparing biogenic and
freshly precipitated abiotic manganese oxides to crystalline pyrolusite manganese oxides.
The ratio of lead adsorption to surface area was much greater for the biogenic and abiotic

13
manganese oxides (Nelson et al., 2003). Therefore, it was concluded that surface area
may play an important role in the increased lead adsorption of manganese oxides, but
other surface properties of the highly adsorbent biogenic manganese oxides may also be
important.
The comparison of adsorption by manganese oxides to that of iron oxides depends
on pH because pH strongly affects cation adsorption. When lead adsorption to biogenic
manganese oxides was compared with lead adsorption to colloidal iron oxides over a
range of pH’s, it was shown that biogenic manganese oxides had a higher affinity for
binding lead than iron oxides at pH below 8.5 and iron oxides had a greater affinity at pH
above 8.5 (Nelson et al. 2003). These studies demonstrated the importance of biogenic
manganese oxides in the binding of trace metals in the environment and the need for
further research.
3.3 Manganese Oxide Biofilms
This thesis investigated the ability of biogenic manganese oxide biofilms to
adsorb toxic trace metals and there has been some previous research done on this subject.
In natural aquatic environments, manganese oxidizing bacteria such as Leptothrix
discophora tend to form biofilms (Ghiorse et al., 1984). The manganese oxides are
contained in these biofilms and it is in the biofilm that trace metal adsorption takes place.
Research was done to determine the extent of trace metal adsorption by biogenic
manganese oxide biofilms in natural environments (Nelson et al., 2003). Two methods
were developed in order to determine this. The first method made use of a surrogate
adsorption and additivity model to measure the relative contributions of manganese
oxides, iron oxides and other organic materials in lead adsorption to a natural biofilm

14
(Nelson et al., 1999a). It was determined, as expected, that at a pH of 6.0 manganese
oxides were responsible for the most lead adsorption when experiments were conducted
with natural biofilms from several freshwater lakes (Nelson et al., 1999a). Further
research was conducted to determine lead adsorption at several different pH’s (Wilson et
al., 2001). This research concluded that manganese oxides were responsible for the most
lead adsorption below a pH of 6.5 and iron oxides were most responsible at pH’s above
6.5 with manganese oxides second (Wilson et al., 2001).
The second method made use of selective extraction experiments in which surface
coatings on glass slides from a freshwater lake in New York were tested for lead and
cadmium adsorption (Dong et al., 2000). Adsorption measurements were made after
each extraction to determine the role of the extracted material in lead and cadmium
adsorption. Extractions of manganese oxides, manganese and iron oxides, and
manganese and iron oxides and other organic matter were performed and subsequent lead
and cadmium adsorption were compared for each. As with the first method above, it was
determined that manganese oxides played the largest role in the adsorption of lead with
iron oxides second (Dong et al., 2000). Iron oxides were found to be most dominant in
cadmium adsorption, which shows that different sorbents can dominate adsorption
depending on the trace metal being analyzed. Further research was performed on
manganese and cadmium adsorption under actual lake conditions (Dong et al., 2003).
This research also concluded that manganese oxides were the dominate factor in the
adsorption of lead to natural biofilms.

15
3.4 Background Conclusion
With an understanding of biogenic manganese oxidation, trace metal adsorption
to biogenic manganese oxides and manganese oxide biofilms and the research that has
been performed in these areas it is easy to see why continued research is necessary. The
lead adsorption capabilities of biogenic manganese oxides in the natural environment
have been well documented. There is, however, a need for this phenomenon to be
engineered into something practical. It is this need that prompted this thesis project.
16
CHAPTER 4
MATERIALS AND METHODS
There were five major steps in my research. There was the growth of pure
cultures of manganese oxidizing bacteria, the design and construction of bioreactors, the
operation of those bioreactors, trace metal adsorption in the bioreactors, and finally
analysis of the trace metal adsorption, which included atomic adsorption spectroscopy of
both lead and manganese and characterization of the biomass. The first step in the
project turned out to be one of the most difficult and time consuming. The next section
focuses on the steps taken in the growth of pure cultures of manganese oxidizing bacteria,
and is followed by sections containing details of the other four steps.
4.1 Leptothrix Discophora SS-1 Growth
The bacterial strain Leptothrix discophora SS-1 (L. discophora) was chosen for
this project because of its well documented ability to form biogenic manganese oxide
biofilms and bind lead to them (Nelson et al., 2003). Pure cultures of L. discophora were
ordered from The American Type Culture Collection (ATCC #43182) and received on a
large Petri dish that had been frozen for preservation.
Growth media was prepared in order to transfer and grow pure cultures of L.
discophora. ATCC 1503, the recipe for growth media recommended by the ATCC for L.
discophora, was used with the exception that 0.5 g pyruvate was used instead of 0.5 g
glucose as a carbon source for the bacteria. This switch was made in order to get the
bacteria accustomed to growing on a pyruvate based media, which is the type of media
that would be used later in the experiment. Pyruvate has previously been shown to be a

17
good carbon source for L. discophora (Adams and Ghiorse, 1987). The recipe as used is
shown in Table 1.
Table 1 Composition of Pyruvate Growth Media
Peptone …………….. 0.5 g
Yeast extract ……….. 0.5 g
Pyruvate …………….. 0.5 g
MgSO4 · 7H2O ……… 0.6 g
CaCl2 · 2H2O ……….. 0.07 g
HEPES ……………… 3.57 g
MnSO4 · H2O ……….. 17.0 mg
Distilled Water ……… 1.0 L
Each ingredient in Table 1, except pyruvate, was added to one liter of deionized
(DI) water. Pyruvate was left out because it would break down during the autoclaving
process. Once all the above ingredients were added, 1.5% agar was added (15 g for 1 L)
to the solution to make the media harden after autoclaving for streak plates and slant
tubes. The pH was measured using a pH probe and then adjusted by adding 1% NaOH in
DI water 1 mL at a time until the pH was just above 7.0. After pH adjustment, the media
was poured into a 2 L media bottle. A cap was placed loosely on top of the bottle and
then the whole bottle was autoclaved at 121 oC for 15 minutes. Having 1 L of media in a
2 L bottle allows for some boiling to occur without spilling out of the bottle. After
autoclaving, the cap was tightened and the media was allowed to cool until safe to handle
with bare hands. Pyruvate was then introduced to the media by adding 10 mL of a 50 g/L
pyruvate solution. The 50 g/L pyruvate solution had been prepared by adding 5 g of
pyruvate to 100 mL of DI water. This solution was then filter sterilized with a disposable

18
0.2-micron Nalgene® filter to remove all contaminants, and excess solution was stored in
the refrigerator for later use. After adding the pyruvate, the bottle was shaken to
completely mix up the pyruvate solution. Streak plates were then prepared by pouring
the media into sterile Petri dishes and allowing them to cool and harden. About 20 mL of
media was poured into each Petri dish, the dish was gently swirled for even coverage and
then the sterile lid was placed on the dish. Slant tubes were also prepared by pouring
about 10 mL of media into sterile test tubes and capping them with a sterile lid. The
tubes were then tilted at an angle of about 65 degrees and allowed to harden while tilted.
This angle gives a large slanted surface area for the bacteria to grow on once streaked.
All pouring was done under a sterile laminar flow hood to avoid contamination as much
as possible. Once hardened the plates and slants were stored in a refrigerator for later
use.
The streaking of plates is designed to spread bacteria out on a media surface to
allow pure isolated colonies of the desired bacteria to grow. The process started by
removing a plate with pure isolated colonies of L. discophora and about five empty plates
from the refrigerator and allowing them to warm up a bit. An inoculation loop was
flamed until red hot, allowed to cool for a few seconds and then touched to a single pure
colony of L. discophora. The loop was then touched to an empty streak plate and moved
back and forth across the surface on one third of the plate. The loop was then flamed
again, moved through the area that was just streaked a couple of times and then moved
back and forth across the surface on a second third of the plate. The loop was flamed
again, moved through the second streak a single time and then moved back and forth
across the last third of the plate. This process allows for three dilutions of bacterial

19
concentration to occur by spreading them out so that single bacterium will be separated.
A single pure colony will then be created from that single bacterium. The streaking
process is depicted in Figure 1.
Figure 1 Plate Streaking Procedure
This process was usually repeated on five or more plates in order to ensure plenty
of L. discophora growth and pure isolated colonies. All streaking was performed under a
laminar flow hood and bacteria on the plates were left there to grow at room temperature
for three to five days depending on visible growth. Plates streaked from the dish obtained
from the ATCC showed no L. discophora growth and a new source of bacteria had to be
found. At the time, research was being conducted at Cornell University using L.
discophora SS-1 and they were kind enough to send some bacteria. Plates were streaked
and then allowed to grow while in the mail. This provided freshly grown L. discophora
1
2
3

20
and the bacteria were immediately transferred onto more streak plates by the process
above.
Bacteria were also transferred onto slant tubes from the streak plates. Four or five
empty slant tubes were removed from the refrigerator and allowed to warm up along with
a streak plate with pure isolated colonies of L. discophora. An inoculation loop was
flamed and then touched to a single colony on the streak plate. The loop was then
touched to the bottom of the surface of the media in the slant tube and moved upward
across the surface in a single streak. Slant streaking and growth was also performed
under a laminar flow hood. The slants were then allowed to grow at room temperature
for three to five days depending on visible growth. Slant tubes were used in addition to
streak plates because they are much better for storing bacteria for longer periods of time.
Once visible growth was observed, bacterial colonies on the plates and slants
were observed under the microscope to make sure that they were pure L. discophora. An
Olympus BX50 optical microscope with an Olympus OLY-200 integrated camera, for
capturing digital images, was used for all microscopy performed. 8 uL of DI water was
pipetted onto a clean microscopic slide and then a flamed inoculation loop was touched to
a single colony of bacteria and then to the drop of DI water. A cover slip was then placed
over the drop and the slide was mounted on the microscope. The slide was first brought
into focus at 100X magnification and phase contrast 1 and then switched to 1000X
magnification and phase contrast 3. At this magnification it was easy to see if the
bacteria on the slide were pure L disc. L disc could also be identified directly on the
slants and plates by the brown color of their colonies. The brown color is due to the
manganese in the growth media being oxidized by the bacteria.
21
After streak plates and slant tubes were grown they were placed in the refrigerator
to stop growth and preserve the fresh colonies. Plates and tubes were streaked
approximately every week to ensure that fresh L. discophora were always available.
Bacteria on plates from the week before were streaked onto new slants and bacteria from
slants from the week before were streaked onto new plates to keep the bacteria pure.
Bacterial cultures needed to be in a different media and in broths for the experiment. A
minimal mineral salts (MMS) media was chosen for the broths because it is a defined
media with no unnecessary trace metals or buffers. The recipe for the media is shown in
Table 2. For this media the Vitamin B12 and the FeSO4, in addition to the pyruvate, were
left out of the media until after autoclaving was complete and the solution had cooled
down. The rest of the ingredients were added and the media was prepared, pH balanced
to 7.0, and autoclaved in the same way as the Pyruvate media. Solutions of 2 mg/L
Vitamin B12 and 15 mg/L FeSO4 were made and filter sterilized into separate sterile
bottles so that 1 mL of each could be added to the media once it had cooled down. These
stock solutions were also stored in the refrigerator for later use. Four or five 250-mL
Erlenmeyer flasks with silicone closures were autoclaved along with the media. After
cooling, 100 mL of media was poured into each of the Erlenmeyer flasks. This allowed
for plenty of surface area in the flask to allow good aeration. After pouring the rims of
the Erlenmeyer flasks were flamed before replacing the silicone closures, to prevent any
contamination. Remaining media was stored in the refrigerator for later use. The media
was inoculated by flaming an inoculation loop and touching it to a single pure colony of
L. discophora on a streak plate and then dipping the loop into the media in the
Erlenmeyer flask. Inoculation was done under a laminar flow hood and the flasks were

22
then placed on a shaker table to grow at room temperature for three days to a week,
depending on visible growth. The shaker table was set to 100 rotations per minute to
provide aeration and mixing.
Table 2 Composition of MMS Growth Media
Pyruvate …………… 240 mg
CaCl2 · 2H2O ……… 30 mg
MgSO4 · 7H2O …..... 35 mg
(NH4)2SO4 ………………... 120 mg
KNO3 ………………………… 15 mg
NaHCO3 ………………....... 0.84 mg
KH2PO4 …………………….. 0.70 mg
Vitamin B12 ………………. 0.002 mg
FeSO4 ………………………. 0.015 mg
Distilled Water …..... 1.0 L
Although fresh healthy colonies of L. discophora were used, no growth was
observed in the MMS medium and it was decided that a more nutrient-rich media would
need to be used. 1 L of 1987 growth media was prepared and autoclaved in the same way
as the other medias. 1987 growth media is the same as Pyruvate growth media except
there is no MnSO4 · H2O added. The media needed to be in liquid form so no agar was
added either. Experiments on growth were conducted by adding small amounts of the
1987 growth media to the MMS growth media and inoculating. Flasks with MMS
growth media and 1%, 5%, 10% and 25% 1987 growth media were prepared and all
inoculated at the same time from the same source. After five days of growth the flasks
were examined to compare growth at different 1987 media concentrations. Broths were
also checked under the microscope to make sure there was pure L. discophora growth.

23
No growth was observed in the flask with 1% 1987 media, a small amount of growth was
observed in the 5% flask and good growth was observed in the 10% and 25% flasks.
Because 1987 media is an undefined media, the smallest amount possible was desired and
it was decided to use a 10% concentration when growing L. discophora in broths.
4.2 Bioreactor Design and Construction
While bacterial growth experiments were taking place, the bioreactor apparatus
for biofilm growth and adsorption experiments was designed and constructed. Two
complete setups were constructed so that a control could be run at the same time as the
actual experiment. All components needed to be autoclavable so that the entire
bioreactor apparatus could be sterilized before each experiment. The design included a
reservoir of inoculated media where temperature and pH could be monitored and
adjusted. Inoculated media was then pumped to the top of each column with a packed-
bed that the biofilm could be grown on. The media then returned to the reservoir in a
closed loop.
Two 2-L jacketed beakers with rubber lids were used as the media reservoirs
(Figure 2). Small holes of different sizes in the top of the rubber lids allowed for things
to go in and out of the reservoirs. A long glass thermometer was placed into each
reservoir to measure temperature, and an autoclavable pH probe was placed into each
reservoir to measure pH. A quarter-inch glass tube about four inches long with a rubber
lid was also placed into each lid. This allowed for addition of nutrients to encourage
growth and acids and bases to adjust pH to the reservoirs. The glass tube could also be
flamed after each time it was opened and something was added to help maintain sterile
conditions. A sampler was placed into each beaker capable of removing a small amount

24
of liquid from the reservoir without contamination. And finally, a long piece of quarter-
inch Tygon® tubing was run from the bottom of each reservoir through a peristaltic
pump and into the top of each column, and another long piece of Tygon® tubing was run
from the bottom of the column back into the reservoir. Everything was fit tightly into the
rubber lid and remaining holes were sealed off with rubber stoppers and solid glass rods
so no contamination could get into the reservoirs. Temperature-controlled water was run
through the jacket of the beaker from bottom to top to keep a steady reservoir
temperature of 28oC. The entire beaker was set on a stir plate and a Teflon® stir rod was
placed in the beaker to ensure even mixing inside the reservoir.
Figure 2 Reservoir Design
Stir Plate
Jacketed Beaker
Water In
Water Out
pH Probe
Thermometer
Media In From Column
Media Out To Column
Sampler
Glass Tube
Rubber Lid

25
The design for the two packed-bed columns where the L. discophora biofilms
would be grown is shown in Figure 3. Each column needed a place for the inoculated
media to enter at the top and exit at the bottom, as well as a place for air to be pumped in
and out. Two plastic Drierite® columns were used for the columns in the bioreactor
apparatus. The columns were emptied and then two quarter-inch holes were drilled in
each column. One hole was drilled in the center of the lid to allow media to enter and
another hole was drilled in the side of the column about two inches from the bottom to
allow air to enter. Existing holes near the top and bottom of the columns would allow
media and air to exit. Drilled holes were then threaded so that plastic fittings could be
screwed into the columns. The quarter-inch Tygon® tubing from the peristaltic pump
was connected to the fitting in the lid of each column and the existing hole near the
bottom of the column was connected to the tubing that ran back into the reservoir. An
aquarium air pump with an in-line filter was connected to the fitting two inches from the
bottom of the column with eighth-inch Tygon® tubing and more of the same tubing with
another in-line filter was connected to the existing hole near the top of the column.

26
Figure 3 Packed-bed Biofilm Column Design
In order to keep the column bed off the bottom of the column and allow the media
to drain out easily, a column support was constructed by cutting a circle the same
diameter as the inside of the column out of plastic. Many holes were punched in the lid
to allow the media to flow through but still keep the bed supported. In order to distribute
the media evenly over the top of the bed a showerhead style sprayer was constructed out
of a media bottle cap. Small holes were drilled in the cap and it was glued upside down
to the bottom of the column lid.
Quarter-inch solid polypropylene balls were chosen to make up the bed. Round
balls were chosen to provide a large surface area for the biofilm to grow on. A plastic
bed was desired because it would not adsorb the trace metals being tested and
polypropylene was good because it was autoclavable. Approximately 2,500 balls were
Media In
Media Out
Air Out
Air In
Column
Column Lid
Column Bed
Column Support
Air Filter
Air Filter
Sprayer

27
used in each bioreactor bed for a total bed volume of 0.475 L and a pore volume of 0.140
L. Once finished, the columns were zip-tied to a peg board stand and connected to the
reservoirs. The finished bioreactor apparatus setup is shown in Figure 4.
Figure 4 Bioreactor Apparatus
Packed-bed Columns
Aquarium Pumps
pH Controllers
Peristaltic Pump
Pump Controller
Reservoirs
Stir Plates

28
4.3 Bioreactor Operation
Bioreactor operation included the growth of the L. discophora biofilms and the
oxidation of manganese. Before this could begin the entire bioreactor apparatus needed
to be sterilized, pH probes needed to be calibrated, and the growth media and inoculation
broth for the bioreactors needed to be prepared. Two 100-mL broths of pure L.
discophora were grown from the same source in two 250-mL Erlenmeyer flasks on a
shaker table at 100 rpm over three days. MMS growth media with 10% 1987 media was
used to prepare the inoculation broths. At this point the broths were visibly turbid and
microscopic slides were prepared to make sure they were pure L. discophora. Two liters
of growth media were also prepared for the bioreactor reservoirs. MMS growth media
with 10% 1987 media was also used for this.
Before being sterilized, the pH probes were calibrated using standard buffer
solutions of pH 7 and pH 10. The probes were set to pH 7 and the slope was adjusted to
pH 10 in order to calibrate. To sterilize the bioreactor apparatus, the columns were
removed from the peg board, air pumps were unhooked at the filters, the tubing was
taken out of the peristaltic pump, and the entire setup was autoclaved at 121 oC for 15
minutes. The lids of the columns were loosened before autoclaving and retightened
immediately afterward to keep them from sealing shut. One of the inoculation broths was
poured into each liter of fresh media and then one liter of inoculated media was poured
into each reservoir of the bioreactor apparatus. This was all done under a laminar flow
hood to avoid contamination of any kind. The rubber lids of the reservoirs were then
taped shut with autoclave tape to provide a seal against contamination getting into the
reactors during operation. The columns were zip tied back up to the peg board, the

29
reservoirs were placed back on the stir plates, air pumps were hooked back up to the
filters, and the tubing was run back through the peristaltic pump.
4.3.1 Biofilm Growth
After sterilizing and setting up as described above, the bioreactors were ready to
begin growing L. discophora biofilms. The pH probes were hooked up, and the stir
plates were turned on and adjusted to 300 rpm to keep the reservoirs well mixed. The air
pumps to the columns were turned on to aerate the column beds. The temperature
controller was turned on, and water was pumped through the jacketed beakers in series
from bottom to top at a temperature of 28 oC. Finally, the peristaltic pump was turned on
and adjusted to setting 3 to bring the inoculated media from the reservoirs to the top of
the columns. A setting of 3 on the peristaltic pump corresponded to a flow rate of
approximately 50 mL per minute. The bioreactor apparatus was then checked for leaks
and if any were found the appropriate fittings were tightened.
Samples were taken from each reservoir as follows: the valve on the sampler was
opened, the sampler ball was squeezed once and released, filling a sterilized vial with
media, the valve was closed, the vial was removed and capped, and a new sterilized vial
was screwed onto the sampler. The pH probe was re-calibrated by collecting a sample
and testing for pH with a separate external pH probe and adjusting the set knob on the pH
meters accordingly. The pH of the media in the bioreactor reservoirs was then adjusted.
A solution of 1% nitric acid was made by adding 1 mL of nitric acid to 99 mL of DI
water, and a solution of 1% sodium hydroxide was made by adding 1 g of sodium
hydroxide to 99 mL of DI water. The rubber cap was taken off of the glass tube in the
reservoir lid and 1% nitric acid or 1% sodium hydroxide was added 1 mL at a time by

30
pipette until the pH in each bioreactor reservoir read 7.0. The top of the glass tube was
then flamed and the rubber cap was replaced. The pH of the bioreactor reservoirs was
adjusted in this way nearly every day. The pH tended to rise as the L. discophora grew,
but the pH was kept at 7 by manual adjustment.
Samples of the reservoir media were taken every four or five days to check the
accuracy of the pH probes and the health and purity of the bacteria. Microscopic slides
were prepared from the samples and viewed under the microscope at 1000X
magnification and photomicrographs were taken of the bacteria.
After six or seven days of biofilm growth an added shot of pyruvate was
introduced to each bioreactor reservoir in order to get fresh nutrients to the biofilm and
encourage growth. A 15 g/L solution of pyruvate was filter sterilized into a sterile bottle
and stored in the refrigerator. 150 mg of pyruvate was then added to each bioreactor
reservoir by adding 10 mL of the 15 g/L pyruvate solution. This was added by pipette
through the glass tube in the reservoir lid in the same way that pH was adjusted. This
process was repeated after another six or seven days to continue growth of the biofilms
until the end of the experiment.
The bioreactors were operated in this way for approximately three weeks. After
that it was decided that they were ready to begin manganese oxidation
4.3.2 Manganese Oxidation
A stock solution of 8.45 g/L MnSO4 · H2O was prepared by adding 0.845 g of
MnSO4 · H2O to 100 mL of DI water and filter sterilizing. 1 mL of this solution was then
added to one of the bioreactor reservoirs. This made a manganese concentration in the
reservoir of 50 uM. The second bioreactor reservoir was left without manganese to act as

31
a control. The difference between the two bioreactor setups was that one contained
biogenic manganese oxides in the biofilm of the column bed and the other one did not.
The biofilms were then given one day’s time to oxidize the manganese before conducting
adsorption experiments. Because of low adsorption to the manganese oxide biofilms in
the first experiment the concentration of manganese added to the bioreactor reservoir was
changed to 500 uM for all subsequent experiments. To do this, 10 mL of 8.45 g/L
MnSO4 · H2O was added to one of the bioreactor reservoirs instead of 1 mL. After the
biofilms had oxidized the manganese as much as possible toxic trace metal adsorption
was then ready to begin.
4.4 Lead Adsorption
To get the columns ready for lead adsorption experiments, the peristaltic pump,
air pumps, temperature control, pH probes and stir plates were all turned off and the
bioreactor reservoirs were disconnected from the columns. The air pumps and filters
were also disconnected from the columns and the loose ends of tubing were crimped off.
A 1-L solution of MMS with no phosphate, pyruvate, or vitamin B12 added was prepared
and pumped through the column bed in the up-flow direction (Figure 5). The MMS
solution was used to flush the bioreactor in preparation for lead adsorption experiments.
The up-flow allowed the bioreactor bed to be completely submerged in the MMS
solution. The solution was pumped at a rate of 5 mL/min for one hour. This flow rate
gave a retention time in the bioreactor bed of 30 minutes and ensured the column beds
were completely flushed after one hour.
To prepare the lead solution, several more liters of the MMS solution with no
phosphate, pyruvate, or vitamin B12 were prepared. A 2 uM or 414 ppb lead solution was

32
then prepared by adding 414 uL of 1000 ppm lead stock solution to each liter of MMS
solution. The lead solution was then pumped upwards through the columns at a rate of 5
mL/min. 10-mL samples of the effluent flow coming out the top of the columns were
taken in small polypropylene scintillation vials every 30 minutes until 25 samples were
taken from each column.
Figure 5 Up-Flow Lead Adsorption Column
4.5 Atomic Absorption Spectroscopy
Atomic absorption spectroscopy was used to determine the lead concentrations in
the samples taken from the columns as well as the manganese concentration on the
column bed after experimentation was complete. A Perkin-Elmer 3110 Atomic
Absorption Spectrometer with a Perkin-Elmer HGA-600 power source and a Perkin-
Lead Solution
Out
Lead Solution
In
Samples
Column Bed w/ Biofilm

33
Elmer AS-60 Autosampler were used for this analysis. Atomic absorption was chosen as
the method for analysis in this experiment because of its ability to measure extremely
small trace metal concentrations, single parts per billion, by graphite furnace atomic
absorption spectroscopy (GFAAS) as well as higher concentrations in parts per million,
by flame atomic absorption spectroscopy (FAAS). This versatility made atomic
absorption ideal for these analyses.
4.5.1 Lead Analysis by Atomic Absorption
To measure the lead concentrations in the effluent samples collected from the
column, GFAAS was used. Standard solutions of 0, 5, 10, 20, 50, 100 and 200 ppb lead
were prepared by adding different volumes of a 1000 ppb lead solution to MMS with no
phosphate, pyruvate, or vitamin B12. 2 mL of 1000 ppb lead solution were added to 8 mL
of MMS to make the 200 ppb standard, 1 mL of 1000 ppb lead solution was added to 9
mL of MMS to make the 100 ppb standard, and so on until only 10 mL of MMS was used
to make the 0 ppb standard. The standards were then analyzed by GFAAS to develop a
standard curve.
Before GFAAS analysis could be performed several steps needed to be taken to
prepare the machine. The graphite furnace autosampler unit was positioned into the
atomic absorption spectrometer and locked into place. The autosampler feed bottle was
filled with a 2% nitric acid in DI water solution and the liquid in the waste bottle was
properly disposed of. Argon, the venting fan and cooling water to the furnace from a tap
were turned on. The computer, spectrometer and power source were also turned on, and
the analysis software was loaded. The absorbance wavelength on the spectrometer was
set to 283.3 nm and the slit width was set to 0.7 inches. The lamp used for lead analysis

34
was then plugged in and the lamp adjustment tool on the software was selected. The
lamp was turned on and adjusted for maximum power. The furnace tool on the software
was then selected, the sampler tip was aligned into the graphite tube and the tube was
conditioned. At this point the spectrometer was ready to begin analyzing lead samples.
Using a pipette, 1 mL of each lead standard solution was put into a sample vial
and placed in the sampler. The method editor tool on the software was selected and lead
analysis was selected. This loaded the method and specifications for lead analysis. A
complete list of the conditions for graphite furnace atomic absorption analysis of lead is
included in Figure 6. The auto tool was then selected, locations for sampling were input,
and the analysis of the lead standards was begun. A small mirror was used to look into
the graphite tube to make sure that the sample was properly injected. The results tool on
the software was then selected and the absorbance of each standard was recorded. A
graph of absorbance vs. lead concentration was made from the data and an equation was
derived from the best fit line. The equation related lead concentration to absorbance and
could then be used to find the lead concentration of unknown samples.
The samples collected of the adsorption column effluent were analyzed by the
same method as the lead standards. The absorbance results were converted into ppb
using the standard curve equation and a graph of ppb lead coming out of the column over
time was generated.

35
Wavelength (nm): 283.3 Low Slit (nm): 0.7
Pretreatment Temp. (oC): 850 Atomization Temp. (oC): 1800
Tube/Site: Pyro/Platform Matrix Modifier: 0.2 mg NH4H2PO4
Characteristic Mass: 10.0 pg/0.0044 A-s Sensitivity Check: 22.7 ug/L for 0.2 A-s
Figure 6 Lead Graphite Furnace Atomic Absorption Conditions
4.5.2 Manganese Analysis by Atomic Absorption
After lead adsorption was complete, further analysis was conducted on the
biofilms in the column to determine the amount of manganese that was oxidized and
contained in the biofilms. After the column bed was dried and weighed (discussed in the
next section), it was soaked in 1 liter of a 2% nitric acid DI water solution. The solution
and column bed were poured into a 2 liter media bottle and periodically shaken over
several days to completely dissolve all the oxidized manganese in the biofilm. This
solution was then analyzed by FAAS for manganese concentration. Standard solutions of
0, 1, 2, 5, and 10 ppm manganese were prepared by adding different volumes of a 100
ppm manganese stock solution that had previously been prepared to DI water. 1 mL of
100 ppm manganese solution was added to 9 mL of DI water to make the 10 ppm
standard, 0.5 mL of 100 ppm manganese solution was added to 9.5 mL of DI water to
make the 5 ppm standard, and so on until only 10 mL of DI water was used to make the 0
ppm standard. The standards were then analyzed by FAAS to develop a standard curve.
Before FAAS analysis could be performed several steps needed to be taken to
prepare the instrument. The graphite furnace autosampler unit was removed from the
atomic absorption spectrometer and replaced with the flame unit. Connections for the

36
fuel, oxidant, interlocks and interface were made before the flame unit was positioned
and screwed into place. The lamp used for lead analysis was removed and replaced with
the lamp used for manganese analysis. Operation of the atomic absorption spectrometer
for FAAS was performed from the interface on the spectrometer rather than from the
computer. The lamp was adjusted to maximize power, the absorbance wavelength was
set to 278.9 nm and the slit width was set to 0.2 inches. At this point the spectrometer
was ready to begin analyzing manganese samples.
The atomic absorption spectrometer was turned on and acetylene and oxygen
flows were initiated. The venting fan was turned on before the lighting of the flame. To
light the flame, the control knob on the spectrometer was turned to the setting for air as
an oxidant. The fuel level was adjusted to a setting of 3, and the oxidant level was
adjusted to a setting of 5. The ignite button was pressed and held until the flame was lit.
The sampling tube was then dipped into each of the manganese standards and the
absorption was read directly off the spectrometer interface. A standard curve of
absorbance vs. manganese concentration was made from the data and an equation was
derived from the best fit line.
With a standard curve for manganese concentration complete, the analysis of the
solution from the column bed with unknown manganese concentration could then be
completed. The sampling tube was dipped into the solutions and the absorbance was
recorded. These data were then converted into ppm manganese using the standard curve
equation.
Because the manganese concentrations of the samples were not within the range
of the standard curve, GFAAS was then performed on the solution. Manganese standards

37
of 0, 5, 20, 50, 200 and 500 ppb were prepared in the same way the other previous
manganese standards had been prepared. The flame unit was replaced with the graphite
furnace autosampler unit and set up in the same way as before only the manganese lamp
was left in and the corresponding wavelength remained the same. The standards were
analyzed in the same way as the lead standards except that the manganese method was
loaded on the software instead of the lead method. A complete list of the conditions for
graphite furnace atomic absorption analysis of manganese is included in Figure 7. The
standard curve and best fit equation were also generated in the same way. The solution
from the column bed with unknown manganese concentration was then tested by GFAAS
and the result was recorded. The graphite furnace was then used in all subsequent tests
for manganese concentration.
Wavelength (nm): 279.5
Low Slit (nm): 0.2 Pretreatment Temp. (oC): 1400 Atomization Temp. (oC): 2200
Tube/Site: Pyro/Platform Matrix Modifier: 0.5 mg Mg(NO3)2
Characteristic Mass: 2.0 pg/0.0044 A-s Sensitivity Check: 4.5 ug/L for 0.2 A-s
Figure 7 Manganese Graphite Furnace Atomic Absorption Conditions
4.6 Biomass Characterization
To characterize the biofilm in the column bed, the concentration of bacteria in the
biofilm needed to be found in addition to the oxidized manganese concentration in the
biofilm. With this information the biomass could be completely characterized in terms of
the amount of bacteria grown, the amount of manganese oxidized, and the amount of lead
adsorbed. Two methods were used in an attempt to find the concentration of bacteria in

38
the biomass. First, microscopy was used to count the number of cells in the biofilm and
second, dry weight was used to find the mass of the biofilm.
4.6.1 Microscopy
At the completion of lead adsorption, a single bead was taken out of the column
bed. The bead was placed on a microscopic slide and a cover slip was balanced on top of
the bead. The slide was placed under the microscope and viewed at 1000X
magnification. Attempts were made to count the number of bacteria on the surface of the
bead over a certain surface area, but this turned out to be most difficult due to clumping
of the bacteria and non-uniform growth over the bead surface. This method of
characterizing the concentration of bacteria in the biomass was quickly abandoned and
the method of dry weight analysis was used instead.
4.6.2 Dry Weight
After lead adsorption was complete, the air pumps were reconnected to the
columns and turned on. Air was pumped through the columns for several days until the
column beds had completely dried out. The column bed was then removed from the
column and weighed before being immersed in 2% nitric acid for manganese testing.
After the manganese testing was completed, the beads were thoroughly washed and
completely dried again in the same way as before. The beads were then weighed a
second time and the difference in weights represented biofilm weight. In subsequent
experiments the bioreactor bed was divided into two halves and weighed separately in an
attempt to provide more accurate results. The two halves were also tested separately for
manganese concentration by GFAAS.

39
The entire process of growing biofilms, oxidizing manganese, adsorbing lead, and
analyzing the samples and column bed was repeated three times from beginning to end.
Slight changes, as noted in the methods, were made after each complete run in an attempt
to maximize lead adsorption to the column bed. In the third run, manganese was added to
both bioreactors and no control was run. The results of all three runs are detailed in the
next chapter.

40
CHAPTER 5
RESULTS
The results chapter is divided into three main sections, one for each of the runs
completed in the project. Data for the runs are referred to by the dates that lead
adsorption and analysis were performed. The first section shows the results from the first
run in which analysis was performed on 8/17/2004, the second section shows results from
the second run in which analysis was performed on 11/6/2004, and the third section
shows the results from the third run in which analysis was performed on 12/3/2004. Each
of these three sections is divided into subsections which show the results from analysis of
lead atomic absorption, manganese atomic adsorption, biomass dry weight, and
observations and microscopy. A fourth section at the end of the chapter outlines results
for the overall success of the biofilm reactor by comparing results from all three runs.
5.1 Results from First Complete Run
The first complete run was really the third attempt to grow and test a biofilm
using the bioreactor apparatus. The first attempt was aborted because the peristaltic
pump wore through the tubing after about a week and all the media was pumped out all
over the lab space. The second attempt was aborted because of high levels of microbial
contamination and low levels of L. discophora growth in the media. Operation and
growth on the third attempt was much improved and this turned out to be the first
complete run. Growth of the biofilm on the column bed began by inoculation of the
media reservoir on 7/30/2004. 2.44 mg of manganese (44 umol/L) was added to one of
the media reservoirs after 18 days on 8/16/2004, and 24 hours was allowed for

41
manganese oxidation. On 8/17/2004 a lead solution was pumped through the columns,
and lead analysis was performed on the effluent samples the same day.
5.1.1 Lead Breakthrough Curve for First Run
A lead solution of concentration 414 ppb (2 umol/L) was run through both
columns at 5 mL/min and 10 mL samples were taken every 30 minutes. The total liquid
volume in the packed-bed column was 140 mL, so 30 minutes equals about 1 retention
time. These samples were then tested for lead concentration by GFAAS. The atomic
absorption results of lead standard analysis are shown in Table 3 and Figure 8. A linear
regression of the standard data gave the equation shown in Figure 8 with an R2 of 0.9995.
Table 3 Results from Lead Standards by GFAAS from 8/17/2004
LEAD STANDARDS 8/17/2004 ppb Pb Abs #1 Abs #2 Abs#3 Avg Abs Std. Dev.
0 0.010 0.006 0.003 0.006 0.004 5 0.016 0.015 0.017 0.016 0.001
10 0.030 0.024 0.017 0.024 0.007 20 0.049 0.046 0.040 0.045 0.005 50 0.105 0.088 0.088 0.094 0.010 100 0.189 0.167 0.176 0.177 0.011 200 0.339 0.330 0.339 0.336 0.005 414 0.558 0.538 0.534 0.543 0.013

42
y = 607x - 5.5268R2 = 0.9995
0
50
100
150
200
250
0.0 0.1 0.2 0.3 0.4 0.5
Absorbance
Pb c
once
ntra
tion
(ppb
)
Figure 8 Lead Calibration Curve by GFAAS from 8/17/2004
The standard curve was used to calculate the lead concentration of each effluent
sample collected, and these results for column #1, the column where manganese was
added to the media, are shown in Table 4. The results for the same test from column #2,
the control column with no manganese added, are shown in Table 5.

43
Table 4 Results for Lead Samples from Column #1, Manganese Added, by GFAAS from 8/17/2004
SAMPLE 8/17/2004
time (hrs) Abs #1 Abs #2 Avg Abs ppb Pb 0.0 0.001 0.000 0.001 -5 0.5 -0.008 -0.011 -0.010 -11 1.0 -0.017 -0.005 -0.011 -12 1.5 0.042 0.017 0.030 12 2.0 0.071 -0.007 0.032 14 2.5 0.112 0.044 0.078 42 3.0 0.188 0.099 0.144 82 3.5 0.234 0.139 0.187 108 4.0 0.277 0.202 0.240 140 4.5 0.279 0.191 0.235 137 5.0 0.259 0.284 0.272 159 5.5 0.337 0.329 0.333 197 6.0 0.312 0.329 0.321 189 6.5 0.330 0.308 0.319 188 7.0 0.325 0.338 0.332 196 7.5 0.348 0.353 0.351 207 8.0 0.367 0.355 0.361 214 8.5 0.388 0.377 0.383 227 9.0 0.388 0.428 0.408 242 9.5 0.423 0.424 0.424 252 10.0 0.518 0.538 0.528 315 10.5 0.523 0.531 0.527 314 11.0 0.536 0.570 0.553 330 11.5 0.527 0.560 0.544 324 12.0 0.557 0.576 0.567 338

44
Table 5 Results for Lead Samples from Column #2, Control with No Manganese Added, by GFAAS from 8/17/2004
CONTROL 8/17/2004
time (hrs) Abs #1 Abs #2 Avg Abs ppb Pb 0.0 0.000 -0.002 -0.001 -6 0.5 0.003 -0.001 0.001 -5 1.0 -0.008 -0.008 -0.008 -10 1.5 0.089 0.006 0.048 23 2.0 0.120 0.097 0.109 60 2.5 0.195 0.083 0.139 79 3.0 0.293 0.176 0.235 137 3.5 0.369 0.207 0.288 169 4.0 0.380 0.261 0.321 189 4.5 0.379 0.350 0.365 216 5.0 0.457 0.376 0.417 247 5.5 0.498 0.444 0.471 280 6.0 0.465 0.437 0.451 268 6.5 0.466 0.468 0.467 278 7.0 0.468 0.496 0.482 287 7.5 0.317 0.164 0.241 140 8.0 0.539 0.469 0.504 300 8.5 0.563 0.439 0.501 299 9.0 0.577 0.518 0.548 327 9.5 0.605 0.512 0.559 333 10.0 0.670 0.618 0.644 385 10.5 0.663 0.505 0.584 349 11.0 0.656 0.575 0.616 368 11.5 0.653 0.533 0.593 354 12.0 0.640 0.479 0.560 334
The results of the samples from both columns were then graphed to show the
breakthrough curves for lead by the column beds over time and the difference between
the control column bed and the sample column bed containing oxidized manganese
(Figure 9). The graph shows that lead was adsorbed for 2 hours time before
concentrations began to steadily increase and level off after 10 hours at about 350 ppb.

45
-50
0
50
100
150
200
250
300
350
400
0.0 2.0 4.0 6.0 8.0 10.0 12.0
Time (hrs)
Pb c
once
ntra
tion
(ppb
)
L. discophoraonly (Control)L. discophorawith Mn oxide
Figure 9 Breakthrough Curves for L. discophora Lead Adsorption Over Time by Both Control and Sample Column Packed-beds With and Without Manganese Oxide from 8/17/2004
5.1.2 Manganese Analysis for First Run
The manganese content of the biofilms was determined by extracting the
manganese into nitric acid at the end of the experiment and measuring manganese
concentration by GFAAS. Manganese standards were prepared and analyzed using
GFAAS (Table 6), and these results were then graphed to create a calibration curve for
manganese over a 5 to 500 ppb range (Figure 10).

46
Table 6 Results from Manganese Standards by GFAAS from 8/17/2004
Mn STANDARDS 8/17/2004 ppb Mn Abs #1 Abs #2 Avg Abs Std. Dev.
5 0.036 0.081 0.059 0.032 20 0.147 0.218 0.183 0.050 50 0.430 0.467 0.449 0.026
200 1.186 1.077 1.132 0.077 500 1.339 1.465 1.402 0.089
Sample 0.899 1.040 0.970 0.100
y = 322.92x - 53.155R2 = 0.8486
-100
0
100
200
300
400
500
600
0.000 0.500 1.000 1.500
Absorbance
Mn
conc
entra
tion
(ppb
)
Figure 10 Manganese Calibration Curve by GFAAS from 8/17/2004

47
Also shown with the manganese standards in Table 6 is the absorbance of the
manganese sample taken from the column bed. This absorbance was then converted to a
concentration using the equation in Figure 10 resulting in a manganese concentration of
260 ppb when dissolved in 1 L of 2% nitric acid. This concentration corresponds to 0.26
mg of oxidized manganese on the column bed and a surface concentration of 0.82 mg/m2
or 15 umol/m2. Since 2.44 mg total manganese was added to the broth, only about 10%
of the manganese ended up in the biofilms.
5.1.3 Biomass Dry Weight for First Run
To determine the weight of the biomass on the column bed, a dry weight method
of analysis was used. The total dry weight of biofilm in the column was 0.22 g (Table 7)
and the concentration of manganese in the biofilm was 1.18 mg Mn/g biofilm.
Table 7 Biomass Dry Weight from 8/17/2004
BIOMASS 8/17/2004 Dry Wt. w/ Biofilm (g) 270.60 Dry Wt. w/o Biofilm (g) 270.38 Biomass Wt. (g) 0.22

48
5.1.4 Observations and Microscopy for First Run
During the course of biofilm growth both visual observations of the broth in the
reservoir and microscopic observations of samples of that broth were made. In the
sample reactor from 8/17/2004 it was noted that growth appeared to be pure L.
discophora. This can be seen in photomicrographs taken of the broth at magnification
1000X (Figure 11).
Figure 11 1000X Magnification of Media Sample Taken from the Sample Column on 8/17/2004

49
In the control reactor from 8/17/2004 it was noted that growth appeared to be
predominately L. discophora, but that some contamination was present. This can be seen
in photomicrographs taken of the broth at magnification 1000X (Figure 12).
Figure 12 1000X Magnification of Media Sample Taken from the Control Column on 8/17/2004

50
5.2 Results from Second Complete Run
The second complete run also took a couple of attempts to get started before an
entire run was completed. The first attempt was aborted because of severe microbial
contamination in both the control and sample bioreactors. Growth on the second attempt
was much improved and this became the second complete run. Growth of the biofilm on
the column bed began by inoculation of the media reservoir on 10/18/2004. 27.5 mg of
manganese (500 umol/L) was added to one of the media reservoirs after 18 days on
11/5/2004, and 24 hours was allowed for manganese oxidation. On 11/6/2004 a lead
solution was pumped through the columns, and lead analysis was performed on the
effluent samples the same day. Increased levels of manganese were used in order to get
the maximum oxidized manganese concentration possible on the column bed and
therefore the maximum lead adsorption.
5.2.1 Lead Breakthrough Curve for Second Run
A lead solution of concentration 414 ppb (2 umol/L) was again run through both
columns at 5 mL/min and 10 mL samples were taken every 30 minutes. The effluent
samples were then tested for lead concentration by GFAAS. New lead standards were
also prepared and analyzed by GFAAS. The atomic absorption results of lead standard
analysis are shown in Table 8 and Figure 13. A linear regression of the standard data
gave the equation shown in Figure 13 with an R2 of 0.9954.

51
Table 8 Results from Lead Standards by GFAAS from 11/6/2004
LEAD STANDARDS 11/6/2004 ppb Pb Abs #1 Abs #2 Avg Abs Std. Dev.
0 0.001 -0.012 -0.006 0.009 5 0.011 0.021 0.016 0.007
10 0.018 0.034 0.026 0.011 20 0.064 0.049 0.057 0.011 50 0.128 0.131 0.130 0.002 100 0.272 0.270 0.271 0.001 200 0.463 0.491 0.477 0.020
y = 411.37x - 2.034R2 = 0.9954
0
50
100
150
200
250
0.0 0.1 0.2 0.3 0.4 0.5
Absorbance
Pb c
once
ntra
tion
(ppb
)
Figure 13 Lead Calibration Curve by GFAAS from 11/6/2004
The breakthrough curve results for column #1, the column where manganese was added
to the media and column #2, the control column with no manganese added, are shown in
Table 9.

52
Table 9 Effluent Lead Concentrations from Column #1, Manganese Added, and Column #2, Control with No Manganese Added, by GFAAS from 11/6/2004
The effluent lead concentrations from both columns were then graphed to show the
adsorbance of lead by the column beds over time and the difference between the control
column bed and the sample column bed containing oxidized manganese (Figure 14).
Results showed that immediately the first effluent samples collected after 30 minutes had
lead concentrations of about 300 ppb and these remained constant throughout the 12-hour
experiment. The first samples taken from each column showed lower concentrations of
CONTROL 11/6/2004 SAMPLE 11/6/2004 time (hrs) Abs ppb Pb time (hrs) Abs ppb Pb
0.0 0.232 93 0.0 0.075 29 0.5 0.688 281 0.5 0.612 250 1.0 0.753 308 1.0 0.708 289 1.5 0.754 308 1.5 0.698 285 2.0 0.742 303 2.0 0.697 285 2.5 0.735 301 2.5 0.701 286 3.0 0.736 301 3.0 0.714 292 3.5 0.716 293 3.5 0.729 298 4.0 0.690 282 4.0 0.672 274 4.5 0.691 282 4.5 0.667 272 5.0 0.681 278 5.0 0.708 289 5.5 0.764 312 5.5 0.760 311 6.0 0.691 282 6.0 0.795 325 6.5 0.765 313 6.5 0.773 316 7.0 0.735 301 7.0 0.654 267 7.5 0.768 314 7.5 0.695 284 8.0 0.698 285 8.0 0.720 294 8.5 0.722 295 8.5 0.699 286 9.0 0.743 304 9.0 0.766 313 9.5 0.920 377 9.5 0.781 319
10.0 0.759 310 10.0 0.795 325 10.5 0.758 310 10.5 0.775 317 11.0 0.748 306 11.0 0.772 316 11.5 0.742 303 11.5 0.668 273 12.0 0.757 310 12.0 0.771 315
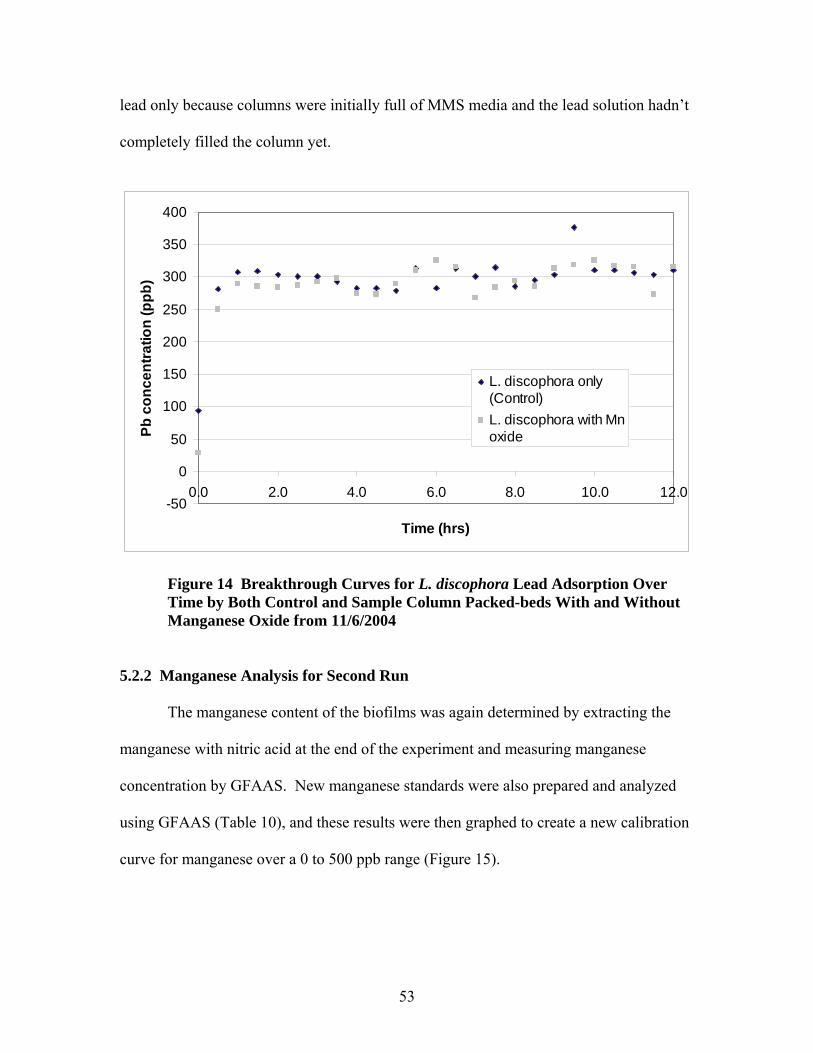
53
lead only because columns were initially full of MMS media and the lead solution hadn’t
completely filled the column yet.
-50
0
50
100
150
200
250
300
350
400
0.0 2.0 4.0 6.0 8.0 10.0 12.0
Time (hrs)
Pb c
once
ntra
tion
(ppb
)
L. discophora only(Control)L. discophora with Mnoxide
Figure 14 Breakthrough Curves for L. discophora Lead Adsorption Over Time by Both Control and Sample Column Packed-beds With and Without Manganese Oxide from 11/6/2004
5.2.2 Manganese Analysis for Second Run
The manganese content of the biofilms was again determined by extracting the
manganese with nitric acid at the end of the experiment and measuring manganese
concentration by GFAAS. New manganese standards were also prepared and analyzed
using GFAAS (Table 10), and these results were then graphed to create a new calibration
curve for manganese over a 0 to 500 ppb range (Figure 15).

54
Table 10 Results from Manganese Standards by Graphite Furnace Atomic Absorption Spectroscopy from 11/6/2004
Mn STANDARDS 11/6/2004
ppb Mn Abs #1 Abs #2 Avg Abs Std. Dev. 0 -0.213 0.173 -0.020 0.273 5 -0.176 0.006 -0.085 0.129 20 0.063 0.108 0.086 0.032 50 0.190 -0.022 0.084 0.150
200 0.530 0.401 0.466 0.091 500 0.892 0.588 0.740 0.215
Sample -0.380 0.517 0.069 0.634
y = 588.53x + 4.5946R2 = 0.9295
-100
0
100
200
300
400
500
600
-0.200 0.000 0.200 0.400 0.600 0.800
Absorbance
Mn
conc
entra
tion
(ppb
)
Figure 15 Manganese Calibration Curve by GFAAS from 11/6/2004
Many of the results in Table 10 have a very high standard deviation due to low
reproducibility during atomic absorption. This should be noted when considering the
results for manganese concentration. Also shown with the manganese standards in Table
10 is the absorbance of the manganese sample taken from the column bed. This
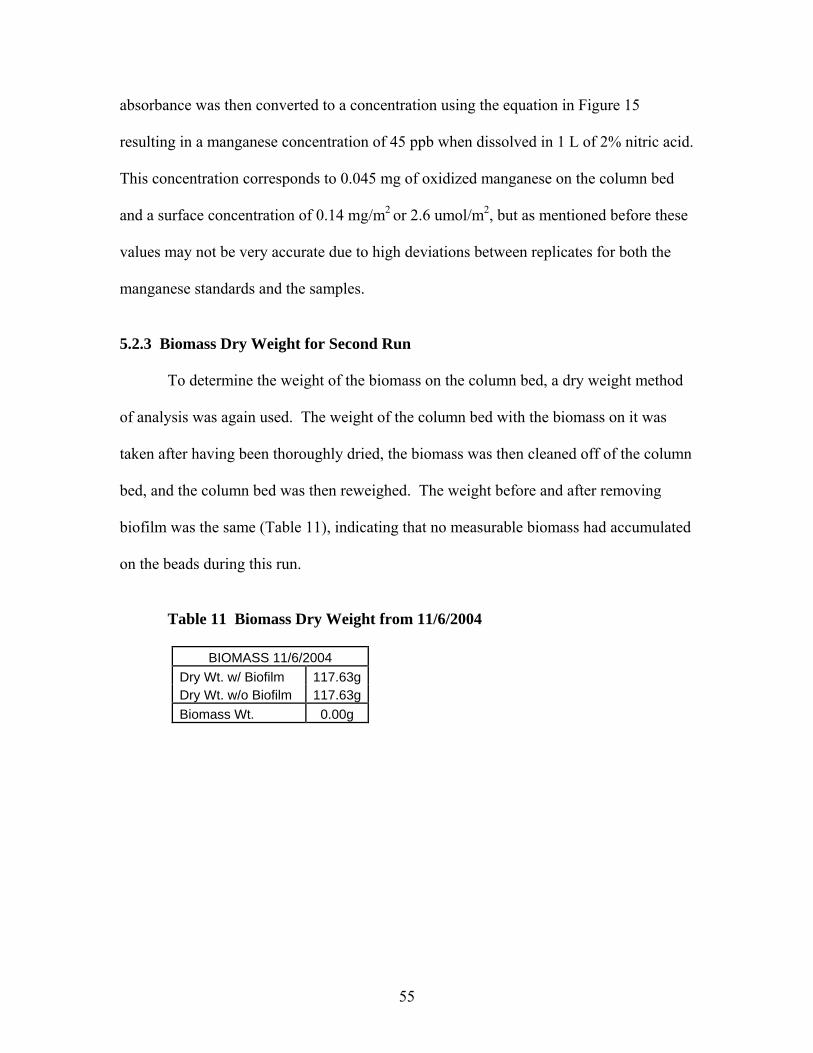
55
absorbance was then converted to a concentration using the equation in Figure 15
resulting in a manganese concentration of 45 ppb when dissolved in 1 L of 2% nitric acid.
This concentration corresponds to 0.045 mg of oxidized manganese on the column bed
and a surface concentration of 0.14 mg/m2 or 2.6 umol/m2, but as mentioned before these
values may not be very accurate due to high deviations between replicates for both the
manganese standards and the samples.
5.2.3 Biomass Dry Weight for Second Run
To determine the weight of the biomass on the column bed, a dry weight method
of analysis was again used. The weight of the column bed with the biomass on it was
taken after having been thoroughly dried, the biomass was then cleaned off of the column
bed, and the column bed was then reweighed. The weight before and after removing
biofilm was the same (Table 11), indicating that no measurable biomass had accumulated
on the beads during this run.
Table 11 Biomass Dry Weight from 11/6/2004
BIOMASS 11/6/2004 Dry Wt. w/ Biofilm 117.63gDry Wt. w/o Biofilm 117.63gBiomass Wt. 0.00g

56
5.2.4 Observations and Microscopy for Second Run
During the course of biofilm growth, both visual observations of the broth in the
reservoir and microscopic observations of samples of that broth were again made. In the
sample reactor broth from 11/6/2004 it was noted that growth appeared to be some L.
discophora with a lot of microbial contamination. This can be seen in photomicrographs
taken of the sample broth at magnification 1000X (Figure 16).
Figure 16 1000X Magnification of Media Sample Taken from the Sample Column from 11/6/2004

57
In the control reactor from 11/6/2004 it was noted that growth appeared to also be some
L. discophora with a lot of microbial contamination present. This can be seen in
photomicrographs taken of the control broth at magnification 1000X (Figure 17).
Figure 17 1000X Magnification of Media Sample Taken from the Control Column from 11/6/2004
Even though the measured weight of the biomass on the columns was zero, bacterial cells
were still present in the broth as can be seen in Figure 16 and Figure 17.

58
5.3 Results from Third Complete Run
A different method for bioreactor inoculation was used for the third complete run
to limit the amount of microbial contamination. Two full liters of L. discophora broth
were grown and poured into the reactors instead of inoculating sterile media from 100
mL broths. Growth of the biofilm on the column bed then began on 11/15/2004.
Another difference in the third compete run was that no control was used since sufficient
control data had been collected from previous experiments. 27.5 mg of manganese (500
umol/L) was added to both of the media reservoirs after 17 days on 12/2/2004, and 24
hours was allowed for manganese oxidation. On 12/3/2004 a lead solution was pumped
through the columns, and lead analysis was performed on the effluent samples the same
day.
5.3.1 Lead Breakthrough Curve for Third Run
A lead solution of concentration 414 ppb (2 umol/L) was again run through both
columns at 5 mL/min and 10 mL samples were taken every 30 minutes. The effluent
samples were then tested for lead concentration by GFAAS. New lead standard were
also prepared and analyzed by GFAAS. The atomic absorption results of lead standard
analysis are shown in Table 12 and Figure 18. A linear regression of the standard data
gave the equation shown in Figure 18 with an R2 of 0.9946.

59
Table 12 Results from Lead Standards by GFAAS from 12/3/2004
LEAD STANDARDS 12/3/2004 ppb Pb Abs
0 0.008 5 0.016
10 0.034 20 0.053 50 0.142 100 0.254 200 0.448 414 0.749
y = 445.82x - 5.8229R2 = 0.9946
0
50
100
150
200
250
0 0.1 0.2 0.3 0.4 0.5
Absorbance
Pb c
once
ntra
tion
(ppb
)
Figure 18 Lead Calibration Curve by GFAAS from 12/3/2004

60
The results from column #1 and column #2, both with manganese added to the media, are
shown in Table 13. The effluent lead concentrations from both columns were then
graphed to show the adsorbance of lead by the column beds over time (Figure 19).
Results showed that some lead began coming through the column immediately and then
steadily increased until leveling off after about 4 hours.
Table 13 Results for Lead Samples from Column #1 and Column #2, Both with Manganese Added, by GFAAS from 12/3/2004
COLUMN #1 12/3/2004 COLUMN #2 12/3/2004
time (hrs) Abs ppb Pb time (hrs) Abs ppb Pb 0.0 -0.006 -8 0.0 0.016 1 0.5 0.003 -4 0.5 0.043 13 1.0 0.123 49 1.0 0.367 158 1.5 0.315 135 1.5 0.472 205 2.0 0.419 181 2.0 0.549 239 2.5 0.501 218 2.5 0.553 241 3.0 0.587 256 3.0 0.553 241 3.5 0.577 251 3.5 0.618 270 4.0 0.593 259 4.0 0.621 271 4.5 0.665 291 4.5 0.654 286 5.0 0.663 290 5.0 0.706 309 5.5 0.675 295 5.5 0.678 296 6.0 0.663 290 6.0 0.685 300 6.5 0.667 292 6.5 0.670 293 7.0 0.718 314 7.0 0.660 288 7.5 0.711 311 7.5 0.705 308 8.0 0.728 319 8.0 0.714 312 8.5 0.720 315 8.5 0.706 309 9.0 0.682 298 9.0 0.717 314 9.5 0.727 318 9.5 0.722 316

61
-50
0
50
100
150
200
250
300
350
400
0.0 2.0 4.0 6.0 8.0 10.0 12.0
Time (hrs)
Pb c
once
ntra
tion
(ppb
)
Column #1Column #2
Figure 19 Lead Breakthrough Curves for L. discophora Lead Adsorption Over Time by Both Packed-bed Columns With Manganese Oxide from 12/3/2004
5.3.2 Manganese Analysis for Third Run
The manganese content of the biofilms was again determined by extracting the
manganese with nitric acid at the end of the experiment and measuring manganese
concentration by GFAAS. This analysis was performed at the same time as that from the
second complete run and therefore the same manganese standards (Table 10) and
calibration curve for manganese over a 0 to 500 ppb range (Figure 15) were used. Again,
many of the results in Table 14 had a very high standard deviation due to low
reproducibility during atomic absorption and this should be noted when considering the
results for manganese concentration in the column.
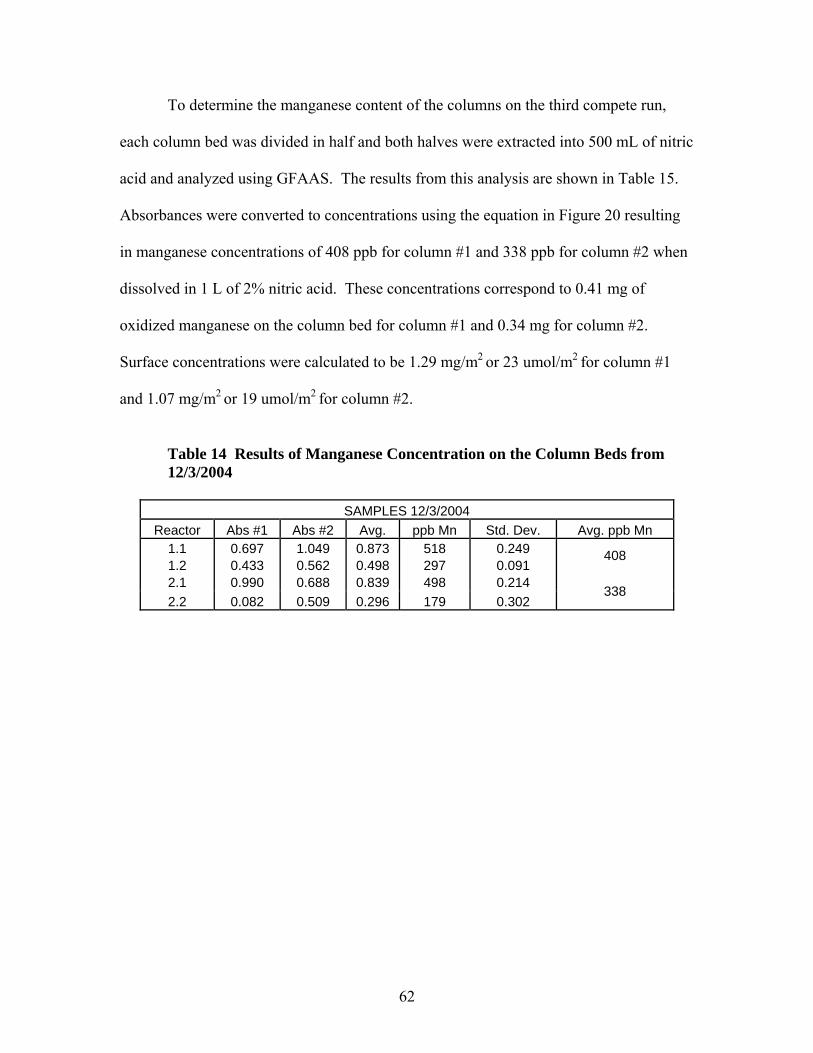
62
To determine the manganese content of the columns on the third compete run,
each column bed was divided in half and both halves were extracted into 500 mL of nitric
acid and analyzed using GFAAS. The results from this analysis are shown in Table 15.
Absorbances were converted to concentrations using the equation in Figure 20 resulting
in manganese concentrations of 408 ppb for column #1 and 338 ppb for column #2 when
dissolved in 1 L of 2% nitric acid. These concentrations correspond to 0.41 mg of
oxidized manganese on the column bed for column #1 and 0.34 mg for column #2.
Surface concentrations were calculated to be 1.29 mg/m2 or 23 umol/m2 for column #1
and 1.07 mg/m2 or 19 umol/m2 for column #2.
Table 14 Results of Manganese Concentration on the Column Beds from 12/3/2004
SAMPLES 12/3/2004
Reactor Abs #1 Abs #2 Avg. ppb Mn Std. Dev. Avg. ppb Mn 1.1 0.697 1.049 0.873 518 0.249 1.2 0.433 0.562 0.498 297 0.091
408
2.1 0.990 0.688 0.839 498 0.214 2.2 0.082 0.509 0.296 179 0.302
338
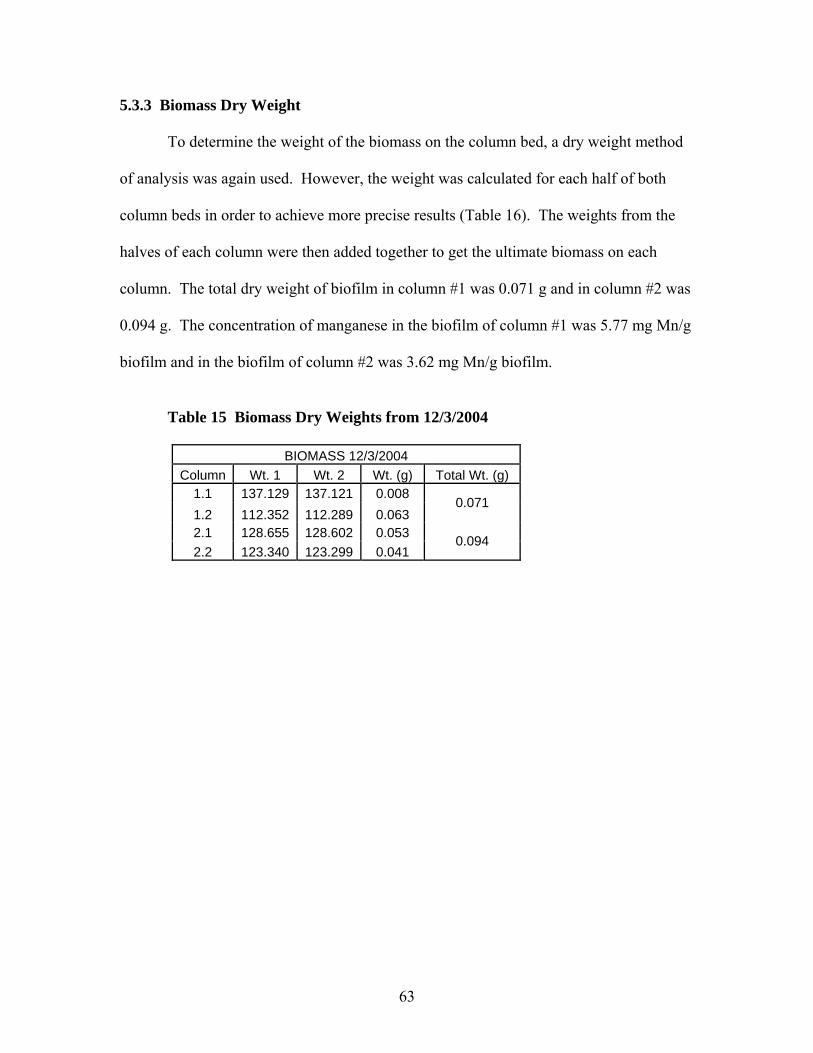
63
5.3.3 Biomass Dry Weight
To determine the weight of the biomass on the column bed, a dry weight method
of analysis was again used. However, the weight was calculated for each half of both
column beds in order to achieve more precise results (Table 16). The weights from the
halves of each column were then added together to get the ultimate biomass on each
column. The total dry weight of biofilm in column #1 was 0.071 g and in column #2 was
0.094 g. The concentration of manganese in the biofilm of column #1 was 5.77 mg Mn/g
biofilm and in the biofilm of column #2 was 3.62 mg Mn/g biofilm.
Table 15 Biomass Dry Weights from 12/3/2004
BIOMASS 12/3/2004 Column Wt. 1 Wt. 2 Wt. (g) Total Wt. (g)
1.1 137.129 137.121 0.008 1.2 112.352 112.289 0.063
0.071
2.1 128.655 128.602 0.053 2.2 123.340 123.299 0.041
0.094

64
5.3.4 Observations and Microscopy for Third Run
During the course of biofilm growth both visual observations of the broth in the
reservoir and microscopic observations of samples of that broth were again made. In
column #1 from 12/3/2004 growth appeared to be predominately L. discophora with
some microbial contamination. This can be seen in photomicrographs taken of the broth
at magnification 1000X (Figure 21).
Figure 20 1000X Magnification of Media Sample Taken from the Sample Column #1 from 12/3/2004

65
In column #2 from 12/3/2004 that growth also appeared to be predominately L.
discophora with some microbial contamination present. This can be seen in
photomicrographs taken of the broth at magnification 1000X (Figure 22).
Figure 21 1000X Magnification of Media Sample Taken from the Sample Column #2 from 12/3/2004

66
5.4 Lead Removal Efficiency for All 3 Runs
In order to see how successful the experiments were it is useful to see all the lead
adsorption results together. A total of six biofilms were grown in the three complete runs
and the lead adsorption data from these were put onto a single graph (Figure 23).
-50
0
50
100
150
200
250
300
350
400
0.0 2.0 4.0 6.0 8.0 10.0 12.0
Time (hrs)
Pb c
once
ntra
tion
(ppb
)
Control 8/17/2004 Sample 8/17/2004 Control 11/6/2004Sample 11/6/2004 Sample #1 12/3/2004 Sample #2 12/3/2004
Figure 22 Lead Adsorption Results from All 3 Runs
From Figure 23 it is clear that there was essentially no lead adsorption for the two runs on
11/6/2004, but some adsorption was observed for the other 4 runs. The lack of lead
adsorption observed for the 11/6/2004 experiment may have been due to the very low
biomass content during that experiment, as discussed in the next chapter. For the 4

67
column runs that exhibited lead adsorption, there was a very short period of low effluent
lead concentrations. This is an important limitation of these columns for practical lead
removal from wastewater, and this too is discussed in the following chapter.
68
CHAPTER 6
DISCUSSION
6.1 Lead Adsorption Results Discussion As described above and illustrated in Figure 23, the observed lead adsorption
resulted in breakthrough cures that would not be practical for removal of lead from
wastewater. There are many possible explanations for the poor breakthrough curves and
we will investigate many of these in this chapter. There were also large differences in the
breakthrough curves for each of the three pairs of column runs. In this chapter we first
compare the results of each completed run (Section 6.1) and examine possible limitations
to get a better understanding of the results.
The most lead adsorption was observed for the first complete run on 8/17/2004.
In this run there is a clear difference between the sample results, with manganese oxide,
and the control results, without manganese oxide (Figure 9). This difference shows that
there was increased adsorption due to the presence of biogenic manganese oxide as this
was the only difference between the two columns. The observations during initial
biofilm growth showed that these columns had the best growth with the highest
percentage of L. discophora and the least amount of microbial contamination. This is the
most plausible reason why the first complete run showed better results than the next two.
Results from the biomass dry weight and manganese analysis showed a biomass of 0.22
g, the highest recorded, and 0.26 g of manganese deposited on the column bed. It should
also be noted that this was the first time the columns and column beds had been exposed
to lead solutions and there may have been adsorption there that was not present in the

69
subsequent experiments. Although the apparatus was thoroughly washed and rinsed with
DI water between each experiment, there may have been some level of adsorption to the
column and the column bed upon first exposure that was not washed away. In future
experiments the apparatus should be acid washed between each run. This adsorption
could not account for the difference between the sample with manganese oxide and the
control without manganese oxide since the data would be skewed the same amount in
each column. However, this could be a factor in accounting for the increased adsorption
in the 8/17/2004 run as compared to the next two completed runs.
The least lead adsorption was observed for the second complete run on 11/6/2004.
Both sample and control in this run showed almost no adsorption (Figure 14). In fact, the
results are very close to what would be expected if there was no biofilm present on the
column bed of any kind and therefore no oxidized manganese either. The observations
during growth showed that these columns indeed had no measurable growth and high
levels of microbial contamination. Results from the biomass dry weight and manganese
atomic absorption analysis on the column bed confirmed these observations. Biomass
dry weight analysis showed no measurable biomass, and the total manganese deposited
on the column bed was also very small, measured at 0.045 g and this value is suspect due
to high deviation in the standards. These results show that both the sample column and
the control column from 11/6/2004 can be seen as control experiments in which there was
little to no biomass of any kind and almost no oxidized manganese present.
Results from the third complete run on 12/3/2004 are slightly different than the
first two in that there was no control column, but instead two sample columns both with
manganese oxide. This was done to increase the chances of one of the columns having

70
more significant growth of pure L. discophora. Both columns exhibited approximately
the same growth and very similar lead adsorption results. Observations during growth
showed that both columns had significant biofilm growth predominately made up of L
discophora, but with some microbial contamination. This made these columns
comparable to the sample column from 8/17/2004, however, the results showed less
adsorption than that column (Figure 23). In addition to the reasons already discussed,
there could be several explanations for this. Microbial contamination in the columns
from 12/3/2004 could make a significant difference since there was minimal
contamination in the sample column from 8/17/2004. The inoculation media was also
prepared differently in the third complete run by growing the entire liter of reservoir
media in a media bottle on a shaker table and this could have changed biofilm growth and
manganese oxidation.
It is also useful to see what the bacteria in the media reservoirs, seen in
photomicrographs taken from each completed run, looked like compared to what pure
cultures of L. discophora from the inoculating broths and pure cultures of L. discophora
from plates with oxidized manganese looked like. There is a much higher density of
bacteria in these pictures and the bacterial cultures appear to be much healthier with no
microbial contamination present. Some differences in appearance can be attributed to the
different growth conditions in the bioreactor apparatus as opposed to the broths and
plates, but ideally the bacteria would look very similar. Photomicrographs taken at
magnification 1000X of pure L. discophora cultures from an inoculation broth, Figure 24,
and from a growth plate with oxidized manganese present, Figure 25, are shown below.

71
Figure 23 1000X Magnification of pure L. discophora from Inoculation Broth
Figure 24 1000X Magnification of pure L. discophora from Growth Plate with Oxidized Manganese Present

72
The total biomass and manganese in the columns from all completed runs is
compared in Table 17. The results for the first and third complete runs are comparable
while the second complete run showed little or no biomass or manganese. Increased
manganese oxide deposits compared to total biomass on the third run can be accounted
for because 10 times more manganese was added to those columns.
Table 16 Total Biomass and Manganese Results from All Complete Runs
Biomass (g) Mn Content (mg) 1st Run 0.22 0.26 2nd Run 0.00 0.05
3rd Run #1 0.07 0.41 3rd Run #2 0.09 0.34
Even understanding the differences between the lead adsorption results from the
three completed runs it is still important to explore methods of increasing lead adsorption
for more practical use of these columns. The first consideration is if the equilibrium
adsorption capacity of the biogenic manganese oxides is sufficient for the lead removal
desired. This is explored below in Section 6.2 by comparing the lead adsorption in these
experiments to that reported in the literature for biogenic manganese oxides. This will
tell us if enough manganese oxide was provided on the biofilms. The second
consideration is the kinetics of lead adsorption in the columns. It is possible that kinetic
and mass-transfer limitations do no allow enough time for the desired lead adsorption. If
the kinetics of lead adsorption are slow, it is possible that it is just not feasible given the
apparatus and conditions used in this experiment to provide useful breakthrough curves.
This is discussed in Section 6.3.

73
6.2 Comparison to Lead Adsorption by Manganese Oxides in Other Studies
Here lead adsorption observed in the columns in this research is compared to
other research that has been done on lead adsorption by biogenic manganese oxides. By
comparing the results from this research to similar research that has been done on the
subject it is possible to determine, at least part of the reason, why limited lead adsorption
was observed. In the following sections, the quantity of manganese oxide present in the
biofilms (Section 6.2.1) and the amount of lead adsorbed to that manganese oxide
(Section 6.2.2) are compared to results from previous research.
6.2.1 Quantity of Manganese in the Biofilms
Oxidized manganese concentrations from this research were compared to those
from other research performed to determine if there were much higher levels of
biogenically oxidized manganese in those experiments that were allowing an increased
level of lead adsorption. Previous research on lead adsorption to biogenic manganese
oxide biofilms grown in the laboratory on glass slides reported manganese concentrations
of 15 – 20 umol Mn/m2 (Nelson and Lion, 1996). In another experiment biogenic
manganese oxide biofilms were grown on glass slides, except this time in a natural lake
known to contain manganese oxidizing bacteria. Biofilms were tested for lead adsorption
and manganese concentrations from several experiments were reported to be from 8 – 32
umol Mn/m2 (Dong et al., 2002).
Results from this research reported a maximum manganese concentration on the
column bed of 23 umol Mn/m2. This value is in the same range as the values reported in
the other experiments mentioned above. This shows that the manganese concentration on
the bed should have been high enough to adsorb lead at the concentration that was used,

74
since about the same concentration of lead was used, 2 umol/L, in all experiments, and
that there must be some other reason that the lead adsorption observed was so low.
6.2.2 Quantity of Lead Adsorbed to the Biofilms
To determine the quantity of lead that was adsorbed to oxidized manganese in the
biofilm, data from the first complete run, in which there was a noted difference between
control and sample breakthrough curves (Figure 9), was used. The total quantity of lead
adsorbed was determined by integrating over the first five hours of lead adsorption for the
column containing oxidized manganese to find total lead adsorbed and doing the same for
the column containing only L. discophora and then subtracting the two to find the total
lead that was adsorbed by the oxidized manganese only. It was calculated that .027 umol
of lead was adsorbed by the 0.26 mg of oxidized manganese in the biofilm. This means
that 5.74 mmol Pb/mol Mn was adsorbed. This number is two orders of magnitude less
than that of previous research results, which found adsorption of lead to manganese
oxidized by L. discophora to be 550 mmol Pb/mol Mn (Nelson et al., 1999b). This
shows again that perhaps low levels of oxidized manganese were not as much of a
problem as poor adsorption of lead to that oxidized manganese.
Knowing the concentration of biogenically oxidized manganese on the column
bed, it was possible to calculate the amount of lead that could theoretically be adsorbed
using Langmuir adsorption isotherm parameters determined in previous research (Nelson
et al., 1999b). To make this comparison, we can calculate the expected lead adsorption to
the manganese oxide biofilm when 90% of the lead has been removed. If 90% of the lead
in solution was adsorbed to the biofilm, 0.028 umol/L lead would be the equilibrium lead
concentration in equilibrium with the lead adsorbed to the manganese oxide in the

75
column bed. Using this number in the Langmuir adsorption isotherm it was determined
that 349 umol of lead would be adsorbed per mol of manganese present on the column
bed. Using the maximum amount of manganese present on the bed discussed above of 23
umol Mn/m2 it was then determined that 2.54 umol of lead could be adsorbed to the
biofilm. With lead being introduced at a rate of 0.28 umol every 30 minutes, this would
mean that it would be 4.5 hours before the column become completely saturated. In
contrast, for the columns used in the 8/17/2004 experiments, the column with manganese
oxide reached the point of 10% remaining lead in solution at 2.5 hours (Figure 9), which
is about half the time expected based on equilibrium adsorption isotherms of previous
studies. The column without manganese reached this point in only about 1 hour. It
should also be noted that a lag time of up to an hour may be present in the breakthrough
curves because the columns were full of MMS media and it took some time for the lead
solution to flow through the columns. This means the effluent lead concentration may
have passed 10% in as little as 1.5 hours compared to the 4.5 hours expected.
6.3 Mass Transfer Analysis
A mass transfer analysis of the packed-bed bioreactor was performed to determine
if the lead solution had a sufficient amount of contact time with the biogenic manganese
oxide biofilm on the surface of the beads in the bed. Methods from the textbook
Transport Processes and Separation Process Principles were used for the calculation of
mass transfer rates in a packed bed (Geankoplis, 2003).
To begin this calculation a diffusion coefficient for lead in water of 1.5×10⁻⁵
cm2/sec was used. Calculations were made using a column bed height of 20 cm, a
column bed diameter of 5.5 cm, a bead diameter of 0.635 cm, a porosity of 0.295, a

76
temperature of 25 oC, a feed rate of 5 mL/min, a feed lead concentration of 2 umol/L. A
Reynold’s Number of 2.2, and a Schmidt Number of 580 were calculated. Using
Equation 3 and Equation 4, a mass transfer coefficient of 0.0066 cm/min was found. In
these equations, JD is the mass-transfer coefficient, NRe is the Reynold’s Number, ε is the
void fraction, Kc’ is the flux coefficient, V’ is the velocity, and NSe is the Schmidt
Number.
3/2
Re09.1 −= NJ D ε
(Eq. 3)
3/2'
'
)( Sec
D NVK
J = (Eq. 4)
This calculation resulted in an effluent concentration of lead of 0.031 umol/L
based on the assumption that all lead was adsorbed instantly at the surface of the beads.
For this analysis the concentration of lead at the surface of the beads was zero, because of
the assumption of instantaneous adsorption. It was also assumed that the biogenic
manganese oxide biofilms were completely and evenly covering the surface of the
column beds. This shows that under these conditions mass transfer is not a problem in
the adsorption of lead to the biogenic manganese oxide biofilm and that much higher
adsorption should have been possible up until saturation was achieved after several hours,
as discussed in the previous section. While both of the assumptions are not correct, the
calculation still shows that under this ideal scenario, mass transfer limitations in the
column bed would not be a problem and would not account for the high effluent lead
concentrations that were observed.

77
The calculations suggest that the kinetics of lead adsorption to the manganese
oxide surfaces in the packed-bed bioreactor may be an important limitation. It is highly
likely that lead is not adsorbed instantaneously or even over a short time to the biogenic
manganese oxide biofilms, but rather needs a longer amount of time to completely
adsorb. In other research, at least 24 hours were given for lead adsorption measurements
(Nelson et al, 1999b). There currently hasn’t been any research reported on the kinetics
of lead adsorption to biogenic manganese oxide biofilms and this would need to be done
to determine if indeed it is a kinetics problem with the packed-bed biofilm bioreactor that
is causing such low levels of lead adsorption.
6.4 Possible Future Experiments
Assuming that kinetics is the major problem in the experiment there are several
changes that could be made to increase the performance of a packed-bed biogenic
manganese oxide adsorption column. If a circulating solution of lead was left to adsorb
for a longer period of time it is possible that much more complete lead adsorption would
occur. Another option would be to slow down the influent flow rate of the lead solution
in order to give plenty of time for adsorption. Perhaps, if the retention time was slowed
from 30 minutes to 12 hours or even 24 hours then much more complete adsorption
would be allowed take place. A much larger or taller column, perhaps 4 or 5 ft. in length,
could also increase success. Of course, increased biofilm growth of pure L. discophora
and in turn increased levels of biogenically oxidized manganese in the column bed will
increase the potential for lead adsorption. A more densely packed column bed with
smaller beads may also help with the biofilm growth by allowing a more evenly wetted
bed. This would greatly increase the surface area available for lead adsorption. Still,

78
many of the suggestions discussed above are speculation and it would be very helpful if
straight kinetic experiments were performed on adsorption rates of lead to biogenic
manganese oxide biofilms.
6.5 Potential Applications
Once the proper changes were made to the bioreactor apparatus and high levels of
lead adsorption were achieved, it would then be possible to use that design in several
potential applications. One major application would be in filtering toxic trace metals like
the lead tested in this experiment out of wastewater. There is also the possibility of toxic
trace metal contamination to drinking water supplies, which could be very dangerous to
large populations of people. Whether the contamination was to occur naturally or by
some human intervention having a way to simply and quickly remove the contamination
from such a water supply would be very important.
Perhaps toxic materials other than trace metals could also be effectively removed
from liquid solutions by biogenic manganese oxides. One possibility of this would be to
use the biofilm bioreactor to oxidize hydrocarbons or other organic contaminants, which
are a major source of contamination in groundwater and other natural aquatic
environments. Preliminary research has shown that manganese oxides can catalyze the
oxidation of humic acids (Sunda et al., 1994), and this is an indication that they could
oxidize other recalcitrant compounds. Further research should thus be done to perfect the
apparatus for lead adsorption as well as further testing on other toxic trace metals and
toxic substances.

79
CHAPTER 7
CONCLUSIONS
7.1 Summary
Three complete runs of lead adsorption experiments were performed in packed-
bed columns containing L. discophora manganese oxide biofilms. The first complete run
showed very little microbial contamination in the columns and, results from lead
adsorption showed a difference in the adsorption of lead to the biofilm containing
oxidized manganese compared to the control with no manganese. In the second complete
run there were high levels of microbial contamination present in both columns, and no
measurable biofilm growth was observed. Results from lead adsorption showed no
significant lead adsorption and no significant difference between control and sample
columns as would be expected if there was no biofilm on the column bed. The third
complete run showed some microbial contamination, and results from lead adsorption
showed that some lead was adsorbed to the biofilms in both columns, although less than
observed in the first run.
Several steps were taken in an attempt to determine the reason or reasons that
such low levels of lead adsorption were observed. Manganese concentrations on the
column bed surface were compared to those in other research performed in which lead
adsorption had been tested. These manganese concentrations were found to be at a
similar level, 23 umol Mn/m2 in column #1 of the third run compared to 15-20 in the
literature (Nelson et al., 1999b). Lead adsorption to that oxidized manganese was then
compared, and it was found that lead adsorption from the first complete run was two

80
orders of magnitude lower than that in the previous study by Nelson et al. (1999b). This
indicates that the oxidized manganese biofilms were not saturated with lead to nearly the
extent possible based on previously determined isotherms. Therefore, the amount of
oxidized manganese present may not be the limitation of the columns, but rather the
kinetics of adsorption. Also using data from previous research, a calculation was made to
determine when saturation of the biogenic manganese oxide biofilm would occur. It was
determined that it would take 4.5 hours for saturation to occur in the column containing
the most oxidized manganese.
A mass transfer analysis was also performed to determine if the lead solution had
a sufficient amount of contact time for diffusion of lead to the surface of the manganese
oxide biofilm to occur. This analysis showed that the effluent concentration of lead
would be 0.031 umol/L if all lead that diffused to the surface of the beads was instantly
adsorbed. This means that if there was sufficient adsorption capacity and no limitation
due to kinetics of adsorption, that an effluent concentration of 0.031 umol/L would be
possible. Since the observed effluent lead concentrations were quickly much higher than
this, it is likely that the kinetics of adsorption is the limiting process.
After ruling out the possibilities of major problems discussed above, it was
determined that the low levels of lead adsorption to the biogenic manganese oxide
biofilm were most likely due to the kinetics of lead adsorption. It is currently unknown
how long it takes for lead to adsorb to a biogenic manganese oxide biofilm and further
research would need to be performed to determine this. There are, however, several steps
that could be taken to improve the possibility of success in this experiment and some of
them are discussed in the next section.

81
7.2 Future Recommendations
The following are recommendations to improve the lead adsorption success of the L.
discophora oxidized manganese packed-bed bioreactor and other future experiments that
should be performed once those improvements are made.
• Pure kinetics experiments on how fast lead binds to biogenic manganese oxide
biofilms should be performed to better determine how to change the bioreactor
apparatus for maximum lead adsorption.
• Experiments should be conducted in which a significantly slower flow rate is used
to allow more contact time with the oxidized manganese biofilm. The flow rate
could be reduced so that a single retention time was 12 or even 24 hours.
• A much larger or longer column should be experimented with to give the lead
solution more residence time in the packed-bed column. A column as long as 1 m
may be necessary to maximize adsorption.
• A more densely packed bed in which smaller beads are used should be
experimented with. This may improve biofilm growth as well as contact time
during lead adsorption.
• Further efforts should be made to reduce contamination in the reservoir and
column by improving pure culture techniques when inoculating the bioreactors
and during biofilm growth.

82
• Experiments should be conducted to increase the biomass in the packed-bed
column and in turn maximize oxidized manganese.
• Further testing should be done on other trace metals, as well as other substances
such as hydrocarbons.

83
REFERENCES
Adams, L.F. and Ghiorse, W.C., 1987, Characterization of extracellular Mn2+-oxidizing
activity and isolation of an Mn2+-oxidizing protein from Leptothrix discophora
SS-1, J. Bacteriol., 169, 1279.
Adams, L.F. and Ghiorse, W.C., 1988, Oxidation state of Mn in the Mn oxide produced
by Leptothrix discophora SS-1, Geochim. Cosmochim. Acta, 52, 2073.
Corstjens, P. L. A. M. et al., 1992, Enzymatic iron oxidation by Leptothrix discophora:
identification of an iron-oxidizing protein, Appl. Environ. Microbiol, 58, 450.
Dong, D. et al., 2000, Adsorption of Pb and Cd onto metal oxides and organic material in
natural surface coatings as determined by selective extractions: New evidence for
the importance of Mn and Fe oxides, Water Res., 34, 427.
Dong, D. et al., 2003, Pb scavenging from a freshwater lake by Mn oxides in
heterogeneous surface coating materials, Water Research, 37, 1662.
Geankoplis, C. J., 2003, Transport Processes and Separation Process Principles, Fourth
Edition, Prentice Hall, Upper Saddle River, NJ, 466-486.
Ghiorse, W.C., 1984, Biology of iron- and manganese-depositing bacteria, Ann. Rev.
Microbiol., 38, 515.
Lion, L.W. et al., 1988, Trace metal interactions with microbial biofilms in natural and
engineered systems, CRC Crit. Rev. Environ. Control, 17, 273.
Nealson, K.H., Tebo, B.B., and Rosson, R.A., 1988, Occurrence and mechanisms of
microbial oxidation of manganese, Adv. Appl. Microbiol., 33, 299.

84
Nelson, Y.M. et al., 1995, Lead distribution in a simulated aquatic environment: Effects
of bacterial biofilms and iron oxide, Water Res., 29, 1934.
Nelson, Y.M. and Lion, L.W. et al., 1996, Modeling oligotrophic biofilm formation and
lead adsorption to biofilm components, Environ. Sci. & Technol., 30, 6, 2027.
Nelson, Y.M. et al., 1999a, Lead binding to metal oxides and organic phases of natural
aquatic biofilms, Limnol. Oceanogr., 44, 1715.
Nelson, Y.M. et al., 1999b, Production of biogenic Mn oxides by Leptothrix discophora
SS-1 in a chemically defined medium and evaluation of their Pb adsorption
characteristics, Appl. Environ. Microbiol., 65, 175.
Nelson, Y.M. et al., 2001, Adsorption properties of mixed ferric and manganese oxides,
paper presented at American Chemical Society, 221st national meeting, San
Diego, CA.
Nelson, Y.M. and Lion, L.W., 2003, Formation of biogenic manganese oxides and their
influence on the scavenging of toxic trace elements, Geochemical and
Hydrological Reactivity of Heavy Metals in Soils, p. 169.
Nriagu, J. O., 1990, Global metal pollution: poisoning the biosphere?, Environment,
32, 7.
Sunda, W.G. and Kieber, D.J., 1994, Oxidation of humic substances by manganese
oxides yields low-molecular-weight organic substrates, Nature, 367, 62.
Tebo, B.M. and Emerson, S., 1986, Microbial manganese (II) oxidation in the marine
environment: A quantitative study, Biogeochemistry, 2, 149.

85
Tebo, B.M. et al., 1997, Bacterially mediated mineral formation: Insights into
manganese(II) oxidation from molecular genetic and biochemical studies, in
Geomicrobiology: Interactions Between Microbes and Minerals, Banfield, J.F.
and Nealson, K.H., Eds., Mineralogical Society of America, Washington, D.C., p.
225.
The American Type Culture Collection (ATCC). February 2004. Catalog detail on
Leptothrix discophora SS-1. http://www.atcc.org.
Wilson, A.R. et al., 2001, The effects of pH and surface composition on Pb adsorption to
natural freshwater biofilms, Environ. Sci. Technol., 35, 3182.
Zhang, J. et al., 2002, Kinetics of Mn oxidation by Leptothrix discophora SS1,
Geochim. Cosmochim. Acta, 65, 773.