Embed Size (px)
Citation preview
TOXICOLOGICAL PROFILE FOR ETHYLBENZENE
U.S. DEPARTMENT OF HEALTH AND HUMAN SERVICES Public Health Service
Agency for Toxic Substances and Disease Registry
November 2010

ii ETHYLBENZENE
DISCLAIMER
The use of company or product name(s) is for identification only and does not imply endorsement by the Agency for Toxic Substances and Disease Registry.
iii ETHYLBENZENE
UPDATE STATEMENT
A Toxicological Profile for Ethylbenzene, Draft for Public Comment was released in October 2007. This edition supersedes any previously released draft or final profile.
Toxicological profiles are revised and republished as necessary. For information regarding the update status of previously released profiles, contact ATSDR at:
Agency for Toxic Substances and Disease Registry Division of Toxicology and Environmental Medicine/Applied Toxicology Branch
1600 Clifton Road NE Mailstop F-62
Atlanta, Georgia 30333

iv ETHYLBENZENE
This page is intentionally blank.
FOREWORD
This toxicological profile is prepared in accordance with guidelines* developed by the Agency for Toxic Substances and Disease Registry (ATSDR) and the Environmental Protection Agency (EPA). The original guidelines were published in the Federal Register on April 17, 1987. Each profile will be revised and republished as necessary.
The ATSDR toxicological profile succinctly characterizes the toxicologic and adverse health effects infonnation for these toxic substances described therein. Each peer-reviewed profile identifies and reviews the key literature that describes a substance's toxicologic properties. Other pertinent literature is also presented, but is described in less detail than the key studies. The profile is not intended to be an exhaustive document; however, more comprehensive sources of specialty information are referenced.
The focus of the profiles is on health and toxicologic infonnation; therefore, each toxicological profile begins with a public health statement that describes, in nontechnical language, a substance's relevant toxicological properties. Following the public health statement is infonnation concerning levels of significant human exposure and, where known, significant health effects. The adequacy of infonnation to detennine a substance's health effects is described in a health effects summary. Data needs that are of significance to protection of public health are identified by ATSDR.
Each profile includes the following:
(A) The examination, summary, and interpretation ofavailable toxicologic infonnation and epidemiologic evaluations on a toxic substance to ascertain the levels of significant human exposure for the substance and the associated acute, subacute, and chronic health effects;
(B) A determination ofwhether adequate infonnation on the health effects of each substance is available or in the process of development to detennine levels ofexposure that present a significant risk to human health ofacute, subacute, and chronic health effects; and
(C) Where appropriate, identification of toxicologic testing needed to identifY the types or levels ofexposure that may present significant risk of adverse health effects in humans.
The principal audiences for the toxicological profiles are health professionals at the Federal, State, and local levels; interested private sector organizations and groups; and members of the public.
This profile reflects ATSDR's assessment ofall relevant toxicologic testing and infonnation that has been peer-reviewed. Staffs ofthe Centers for Disease Control and Prevention and other Federal scientists have also reviewed the profile. In addition, this profile has been peer-reviewed by a nongovernmental panel and was made available for public review. Final responsibility for the contents and views expressed in this toxicological profile resides with ATSDR.
// 7\\ /);/A~-'0/.L.-- /r:../C~--(Xj
Thomas R. Frieden, M.D., M.P.H. Administrator
Agency for Toxic Substances and Disease Registry
"Legislative Background
The toxicological profiles are developed under the Comprehensive Environmental Response, Compensation, and Liability Act of 1980, as amended (CERCLA or Superfund). CERCLA section 104(i)(1) directs the Administrator of ATSDR to " ...effectuate and implement the health related authorities" of the statute. This includes the preparation of toxicological profiles for hazardous substances most commonly found at facilities on the CERCLA National Priorities List and that pose the most significant potential threat to human health, as determined by ATSDR and the EPA. Section 104(i)(3) ofCERCLA, as amended, directs the Administrator ofATSDR to prepare a toxicological profile for each substance on the list. In addition, A TSDR has the authority to prepare toxicological profiles for substances not found at sites on the National Priorities List, in an effort to " ...establish and maintain inventory of literature, research, and studies on the health effects of toxic substances" under CERCLA Section 104(i)(IXB), to respond to requests for consultation under section 104(i)(4), and as otherwise necessary to support the site-specific response actions conducted by A TSDR.
vii ETHYLBENZENE
QUICK REFERENCE FOR HEALTH CARE PROVIDERS
Toxicological Profiles are a unique compilation of toxicological information on a given hazardous substance. Each profile reflects a comprehensive and extensive evaluation, summary, and interpretation of available toxicologic and epidemiologic information on a substance. Health care providers treating patients potentially exposed to hazardous substances will find the following information helpful for fast answers to often-asked questions.
Primary Chapters/Sections of Interest
Chapter 1: Public Health Statement: The Public Health Statement can be a useful tool for educating patients about possible exposure to a hazardous substance. It explains a substance’s relevant toxicologic properties in a nontechnical, question-and-answer format, and it includes a review of the general health effects observed following exposure.
Chapter 2: Relevance to Public Health: The Relevance to Public Health Section evaluates, interprets, and assesses the significance of toxicity data to human health.
Chapter 3: Health Effects: Specific health effects of a given hazardous compound are reported by type of health effect (death, systemic, immunologic, reproductive), by route of exposure, and by length of exposure (acute, intermediate, and chronic). In addition, both human and animal studies are reported in this section. NOTE: Not all health effects reported in this section are necessarily observed in the clinical setting. Please refer to the Public Health Statement to identify general health effects observed following exposure.
Pediatrics: Four new sections have been added to each Toxicological Profile to address child health issues: Section 1.6 How Can (Chemical X) Affect Children? Section 1.7 How Can Families Reduce the Risk of Exposure to (Chemical X)? Section 3.7 Children’s Susceptibility Section 6.6 Exposures of Children
Other Sections of Interest: Section 3.8 Biomarkers of Exposure and Effect Section 3.11 Methods for Reducing Toxic Effects
ATSDR Information Center Phone: 1-800-CDC-INFO (800-232-4636) or 1-888-232-6348 (TTY) Fax: (770) 488-4178 E-mail: [email protected] Internet: http://www.atsdr.cdc.gov
The following additional material can be ordered through the ATSDR Information Center:
Case Studies in Environmental Medicine: Taking an Exposure History—The importance of taking an exposure history and how to conduct one are described, and an example of a thorough exposure history is provided. Other case studies of interest include Reproductive and Developmental Hazards; Skin Lesions and Environmental Exposures; Cholinesterase-Inhibiting Pesticide Toxicity; and numerous chemical-specific case studies.
viii ETHYLBENZENE
Managing Hazardous Materials Incidents is a three-volume set of recommendations for on-scene (prehospital) and hospital medical management of patients exposed during a hazardous materials incident. Volumes I and II are planning guides to assist first responders and hospital emergency department personnel in planning for incidents that involve hazardous materials. Volume III— Medical Management Guidelines for Acute Chemical Exposures—is a guide for health care professionals treating patients exposed to hazardous materials.
Fact Sheets (ToxFAQs) provide answers to frequently asked questions about toxic substances.
Other Agencies and Organizations
The National Center for Environmental Health (NCEH) focuses on preventing or controlling disease, injury, and disability related to the interactions between people and their environment outside the workplace. Contact: NCEH, Mailstop F-29, 4770 Buford Highway, NE, Atlanta, GA 30341-3724 • Phone: 770-488-7000 • FAX: 770-488-7015.
The National Institute for Occupational Safety and Health (NIOSH) conducts research on occupational diseases and injuries, responds to requests for assistance by investigating problems of health and safety in the workplace, recommends standards to the Occupational Safety and Health Administration (OSHA) and the Mine Safety and Health Administration (MSHA), and trains professionals in occupational safety and health. Contact: NIOSH, 200 Independence Avenue, SW, Washington, DC 20201 • Phone: 800-356-4674 or NIOSH Technical Information Branch, Robert A. Taft Laboratory, Mailstop C-19, 4676 Columbia Parkway, Cincinnati, OH 45226-1998 • Phone: 800-35-NIOSH.
The National Institute of Environmental Health Sciences (NIEHS) is the principal federal agency for biomedical research on the effects of chemical, physical, and biologic environmental agents on human health and well-being. Contact: NIEHS, PO Box 12233, 104 T.W. Alexander Drive, Research Triangle Park, NC 27709 • Phone: 919-541-3212.
Referrals
The Association of Occupational and Environmental Clinics (AOEC) has developed a network of clinics in the United States to provide expertise in occupational and environmental issues. Contact: AOEC, 1010 Vermont Avenue, NW, #513, Washington, DC 20005 • Phone: 202-347-4976 • FAX: 202-347-4950 • e-mail: [email protected] • Web Page: http://www.aoec.org/.
The American College of Occupational and Environmental Medicine (ACOEM) is an association of physicians and other health care providers specializing in the field of occupational and environmental medicine. Contact: ACOEM, 25 Northwest Point Boulevard, Suite 700, Elk Grove Village, IL 60007-1030 • Phone: 847-818-1800 • FAX: 847-818-9266.
ix ETHYLBENZENE
CONTRIBUTORS
CHEMICAL MANAGER(S)/AUTHOR(S):
Jessilynn Taylor, M.S. Henry Abadin, M.S.P.H. Heraline Hicks Oscar Tarrago, M.D., M.P.H. Diana Cronin ATSDR, Division of Toxicology and Environmental Medicine, Atlanta, GA
Julie M. Klotzbach, Ph.D., Mario Citra, Ph.D., Gary Diamond, Ph.D., Lisa Ingerman, Ph.D., DABT, Antonio Quiñones-Rivera, Ph.D. SRC, Inc., North Syracuse, NY
THE PROFILE HAS UNDERGONE THE FOLLOWING ATSDR INTERNAL REVIEWS:
1. Health Effects Review. The Health Effects Review Committee examines the health effects chapter of each profile for consistency and accuracy in interpreting health effects and classifying end points.
2. Minimal Risk Level Review. The Minimal Risk Level Workgroup considers issues relevant to substance-specific Minimal Risk Levels (MRLs), reviews the health effects database of each profile, and makes recommendations for derivation of MRLs.
3. Data Needs Review. The Applied Toxicology Branch reviews data needs sections to assure consistency across profiles and adherence to instructions in the Guidance.
4. Green Border Review. Green Border review assures the consistency with ATSDR policy.

x ETHYLBENZENE
This page is intentionally blank.
xi ETHYLBENZENE
PEER REVIEW
A peer review panel was assembled for ethylbenzene. The panel consisted of the following members:
Draft for Public Comment:
1. John DeSesso, Ph.D., Senior Fellow, Noblis, Falls Church, VA;
2. James McDougal, Ph.D., Professor and Director of Toxicology Research, Boonshoft School of Medicine, Wright State University, Department of Pharmacology and Toxicology, Dayton, OH;
3. Andrew Salmon, Ph.D., Senior Toxicologist and Chief, Air Toxicology and Risk Assessment Unit, Office of Environmental Health Hazard Assessment, California Environmental Protection Agency, Oakland, CA.
Revised Minimal Risk Levels:
4. John DeSesso, Ph.D., Senior Fellow, Noblis, Falls Church, VA;
5. Brent Finley, Ph.D., DABT, Principal Health Scientist and Vice President, ChemRisk, San Francisco, CA;
6. Andrew Salmon, Ph.D., Senior Toxicologist and Chief, Air Toxicology and Risk Assessment Unit, Office of Environmental Health Hazard Assessment, California Environmental Protection Agency, Oakland, CA.
These experts collectively have knowledge of ethylbenzene's physical and chemical properties, toxicokinetics, key health end points, mechanisms of action, human and animal exposure, and quantification of risk to humans. All reviewers were selected in conformity with the conditions for peer review specified in Section 104(I)(13) of the Comprehensive Environmental Response, Compensation, and Liability Act, as amended.
Scientists from the Agency for Toxic Substances and Disease Registry (ATSDR) have reviewed the peer reviewers' comments and determined which comments will be included in the profile. A listing of the peer reviewers' comments not incorporated in the profile, with a brief explanation of the rationale for their exclusion, exists as part of the administrative record for this compound.
The citation of the peer review panel should not be understood to imply its approval of the profile's final content. The responsibility for the content of this profile lies with the ATSDR.

xii ETHYLBENZENE
This page is intentionally blank.
xiii ETHYLBENZENE
CONTENTS
DISCLAIMER ................................................................................................................................ ii UPDATE STATEMENT............................................................................................................... iii FOREWORD .................................................................................................................................. v QUICK REFERENCE FOR HEALTH CARE PROVIDERS ..................................................... vii CONTRIBUTORS......................................................................................................................... ix PEER REVIEW ............................................................................................................................. xi CONTENTS................................................................................................................................. xiii LIST OF FIGURES .................................................................................................................... xvii LIST OF TABLES....................................................................................................................... xix
1. PUBLIC HEALTH STATEMENT............................................................................................ 1 1.1 WHAT IS ETHYLBENZENE?......................................................................................... 1 1.2 WHAT HAPPENS TO ETHYLBENZENE WHEN IT ENTERS THE
ENVIRONMENT?............................................................................................................ 2 1.3 HOW MIGHT I BE EXPOSED TO ETHYLBENZENE?................................................ 2 1.4 HOW CAN ETHYLBENZENE ENTER AND LEAVE MY BODY?............................. 3 1.5 HOW CAN ETHYLBENZENE AFFECT MY HEALTH?.............................................. 4 1.6 HOW CAN ETHYLBENZENE AFFECT CHILDREN?................................................. 4 1.7 HOW CAN FAMILIES REDUCE THE RISK OF EXPOSURE TO
ETHYLBENZENE?.......................................................................................................... 5 1.8 IS THERE A MEDICAL TEST TO DETERMINE WHETHER I HAVE BEEN
EXPOSED TO ETHYLBENZENE?................................................................................. 6 1.9 WHAT RECOMMENDATIONS HAS THE FEDERAL GOVERNMENT
MADE TO PROTECT HUMAN HEALTH? ................................................................... 6 1.10 WHERE CAN I GET MORE INFORMATION? ............................................................. 7
2. RELEVANCE TO PUBLIC HEALTH ..................................................................................... 9 2.1 BACKGROUND AND ENVIRONMENTAL EXPOSURES TO
ETHYLBENZENE IN THE UNITED STATES .............................................................. 9 2.2 SUMMARY OF HEALTH EFFECTS............................................................................ 10 2.3 MINIMAL RISK LEVELS (MRLs) ............................................................................... 15
3. HEALTH EFFECTS................................................................................................................ 33 3.1 INTRODUCTION........................................................................................................... 33 3.2 DISCUSSION OF HEALTH EFFECTS BY ROUTE OF EXPOSURE ........................ 33
3.2.1 Inhalation Exposure .................................................................................................. 34 3.2.1.1 Death .................................................................................................................. 34 3.2.1.2 Systemic Effects................................................................................................. 35 3.2.1.3 Immunological and Lymphoreticular Effects .................................................... 66 3.2.1.4 Neurological Effects........................................................................................... 66 3.2.1.5 Reproductive Effects .......................................................................................... 69 3.2.1.6 Developmental Effects ....................................................................................... 70 3.2.1.7 Cancer................................................................................................................. 72
ETHYLBENZENE xiv
3.2.2 Oral Exposure ........................................................................................................... 74 3.2.2.1 Death .................................................................................................................. 74 3.2.2.2 Systemic Effects................................................................................................. 74 3.2.2.3 Immunological and Lymphoreticular Effects .................................................... 82 3.2.2.4 Neurological Effects........................................................................................... 83 3.2.2.5 Reproductive Effects .......................................................................................... 83 3.2.2.6 Developmental Effects ....................................................................................... 84 3.2.2.7 Cancer................................................................................................................. 84
3.2.3 Dermal Exposure ...................................................................................................... 84 3.2.3.1 Death .................................................................................................................. 84 3.2.3.2 Systemic Effects................................................................................................. 84 3.2.3.3 Immunological and Lymphoreticular Effects .................................................... 87 3.2.3.4 Neurological Effects........................................................................................... 87 3.2.3.5 Reproductive Effects .......................................................................................... 87 3.2.3.6 Developmental Effects ....................................................................................... 87 3.2.3.7 Cancer................................................................................................................. 87
3.3 GENOTOXICITY ........................................................................................................... 87 3.4 TOXICOKINETICS........................................................................................................ 91
3.4.1 Absorption................................................................................................................. 92 3.4.1.1 Inhalation Exposure............................................................................................ 92 3.4.1.2 Oral Exposure..................................................................................................... 93 3.4.1.3 Dermal Exposure................................................................................................ 94
3.4.2 Distribution ............................................................................................................... 95 3.4.2.1 Inhalation Exposure............................................................................................ 95 3.4.2.2 Oral Exposure..................................................................................................... 96 3.4.2.3 Dermal Exposure................................................................................................ 96
3.4.3 Metabolism ............................................................................................................... 96 3.4.4 Elimination and Excretion ...................................................................................... 100
3.4.4.1 Inhalation Exposure.......................................................................................... 100 3.4.4.2 Oral Exposure................................................................................................... 102 3.4.4.3 Dermal Exposure.............................................................................................. 103
3.4.5 Physiologically Based Pharmacokinetic (PBPK)/Pharmacodynamic (PD) Models.................................................................................................................... 104
3.5 MECHANISMS OF ACTION ...................................................................................... 121 3.5.1 Pharmacokinetic Mechanisms ................................................................................ 121 3.5.2 Mechanisms of Toxicity ......................................................................................... 122 3.5.3 Animal-to-Human Extrapolations........................................................................... 124
3.6 TOXICITIES MEDIATED THROUGH THE NEUROENDOCRINE AXIS.............. 125 3.7 CHILDREN’S SUSCEPTIBILITY............................................................................... 126 3.8 BIOMARKERS OF EXPOSURE AND EFFECT ........................................................ 128
3.8.1 Biomarkers Used to Identify or Quantify Exposure to Ethylbenzene .................... 129 3.8.2 Biomarkers Used to Characterize Effects Caused by Ethylbenzene ...................... 130
3.9 INTERACTIONS WITH OTHER CHEMICALS ........................................................ 130 3.10 POPULATIONS THAT ARE UNUSUALLY SUSCEPTIBLE................................... 131
xv ETHYLBENZENE
3.11 METHODS FOR REDUCING TOXIC EFFECTS....................................................... 132 3.11.1 Reducing Peak Absorption Following Exposure................................................. 132 3.11.2 Reducing Body Burden ....................................................................................... 133 3.11.3 Interfering with the Mechanism of Action for Toxic Effects.............................. 133
3.12 ADEQUACY OF THE DATABASE............................................................................ 133 3.12.1 Existing Information on Health Effects of Ethylbenzene.................................... 134 3.12.2 Identification of Data Needs................................................................................ 134 3.12.3 Ongoing Studies .................................................................................................. 143
4. CHEMICAL AND PHYSICAL INFORMATION ............................................................... 147 4.1 CHEMICAL IDENTITY............................................................................................... 147 4.2 PHYSICAL AND CHEMICAL PROPERTIES............................................................ 147
5. PRODUCTION, IMPORT/EXPORT, USE, AND DISPOSAL............................................ 151 5.1 PRODUCTION ............................................................................................................. 151 5.2 IMPORT/EXPORT ....................................................................................................... 156 5.3 USE................................................................................................................................ 156 5.4 DISPOSAL .................................................................................................................... 156
6. POTENTIAL FOR HUMAN EXPOSURE........................................................................... 159 6.1 OVERVIEW.................................................................................................................. 159 6.2 RELEASES TO THE ENVIRONMENT...................................................................... 162
6.2.1 Air ........................................................................................................................... 162 6.2.2 Water....................................................................................................................... 166 6.2.3 Soil .......................................................................................................................... 166
6.3 ENVIRONMENTAL FATE.......................................................................................... 167 6.3.1 Transport and Partitioning ...................................................................................... 167 6.3.2 Transformation and Degradation ............................................................................ 169
6.3.2.1 Air..................................................................................................................... 169 6.3.2.2 Water ................................................................................................................ 170 6.3.2.3 Sediment and Soil............................................................................................. 174
6.4 LEVELS MONITORED OR ESTIMATED IN THE ENVIRONMENT..................... 175 6.4.1 Air ........................................................................................................................... 175 6.4.2 Water....................................................................................................................... 181 6.4.3 Sediment and Soil ................................................................................................... 184 6.4.4 Other Environmental Media ................................................................................... 184
6.5 GENERAL POPULATION AND OCCUPATIONAL EXPOSURE........................... 186 6.6 EXPOSURES OF CHILDREN..................................................................................... 190 6.7 POPULATIONS WITH POTENTIALLY HIGH EXPOSURES ................................. 193 6.8 ADEQUACY OF THE DATABASE............................................................................ 194
6.8.1 Identification of Data Needs ................................................................................... 194 6.8.2 Ongoing Studies...................................................................................................... 197
7. ANALYTICAL METHODS ................................................................................................. 199 7.1 BIOLOGICAL MATERIALS....................................................................................... 199 7.2 ENVIRONMENTAL SAMPLES.................................................................................. 203
ETHYLBENZENE xvi
7.3 ADEQUACY OF THE DATABASE............................................................................ 209 7.3.1 Identification of Data Needs ................................................................................... 210 7.3.2 Ongoing Studies...................................................................................................... 212
8. REGULATIONS, ADVISORIES, AND GUIDELINES ...................................................... 215
9. REFERENCES ...................................................................................................................... 221
10. GLOSSARY ........................................................................................................................ 255
APPENDICES A. ATSDR MINIMAL RISK LEVELS AND WORKSHEETS............................................... A-1 B. USER’S GUIDE.....................................................................................................................B-1 C. ACRONYMS, ABBREVIATIONS, AND SYMBOLS ........................................................C-1 D. INDEX .................................................................................................................................. D-1
xvii ETHYLBENZENE
LIST OF FIGURES
3-1. Levels of Significant Exposure to Ethylbenzene - Inhalation ...............................................55
3-2. Levels of Significant Exposure to Ethylbenzene - Oral ........................................................79
3-3. Metabolic Scheme for Ethylbenzene in Humans ................................................................. 97
3-4. Conceptual Representation of a Physiologically Based Pharmacokinetic (PBPK) Model for a Hypothetical Chemical Substance ................................................................. 106
3-5. Schematic Representation of the Model of Dermal Absorption......................................... 119
3-6. Existing Information on Health Effects of Ethylbenzene................................................... 135
6-1. Frequency of NPL Sites with Ethylbenzene Contamination .............................................. 160
6-2. Major Degradation Pathways for Ethylbenzene in the Atmosphere .................................. 171
6-3. Major Degradation Pathways for Ethylbenzene in Water, Sediment, and Soil.................. 172

xviii ETHYLBENZENE
This page is intentionally blank.
xix ETHYLBENZENE
LIST OF TABLES
2-1. Human Equivalent Concentrations (HECs) for CAP Threshold Shifts................................ 19
2-2. Human Equivalent Concentrations (HECs) for Auditory Effects in Sprague-Dawley Rats Exposed to Ethylbenzene 6 Hours/Day, 6 Days/Week for 4 or 13 Weeks.................. 22
2-3. Internal Dose Metrics for Male and Female F344/N Rats Exposed to Ethylbenzene 6 Hours/Day, 5 Days/Week for 104 Weeks......................................................................... 25
2-4. Effects on Serum Liver Enzymes, Liver Weights, and Liver Histopathology in Male and Female Rats Exposed to Oral Ethylbenzene for 13 Weeks........................................... 28
2-5. Benchmark Doses and Human Equivalent Doses for Liver Effects Using Arterial Ethylbenzene Concentration (MCL) Dose Metric............................................................... 30
2-6. Benchmark Doses (BMDs) and Human Equivalent Doses (HEDs) for Liver Effects Using MRAMKL Internal Dose Metric............................................................................... 31
3-1. Levels of Significant Exposure to Ethylbenzene - Inhalation ...............................................36
3-2. Levels of Significant Exposure to Ethylbenzene - Oral ........................................................75
3-3. Levels of Significant Exposure to Ethylbenzene - Dermal ...................................................86
3-4. Genotoxicity of Ethylbenzene In Vivo.................................................................................. 88
3-5. Genotoxicity of Ethylbenzene In Vitro................................................................................. 89
3-6. Parameter Values for Tardif et al. (1997) Ethylbenzene PBPK Models ............................ 108
3-7. Parameter Values for Nong et al. (2007) Ethylbenzene Mouse Physiologically-based Pharmacokinetic Model ..................................................................................................... 112
3-8. Parameter Values for Dennison et al. (2003) Ethylbenzene PBPK Model ........................ 116
3-9. Parameters Used in the Shatkin and Brown PBPK Model of Dermal Absorption of Ethylbenzene...................................................................................................................... 120
3-10. Ongoing Studies on Ethylbenzene.................................................................................... 144
4-1. Chemical Identity of Ethylbenzene .................................................................................... 148
4-2. Physical and Chemical Properties of Ethylbenzene ........................................................... 149
5-1. Ethylbenzene Production in the United States from 1983 to 2005 ..................................... 152
xx ETHYLBENZENE
5-2. Facilities that Produce, Process, or Use Ethylbenzene....................................................... 153
5-3. Manufacturers and Annual Production Capacity of Ethylbenzene .................................... 155
6-1. Releases to the Environment from Facilities that Produce, Process, or Use Ethylbenzene...................................................................................................................... 163
6-2. Ethylbenzene Concentrations in Ambient Air Samples Collected in the United States .... 180
6-3. Distribution of Blood Ethylbenzene Concentrations in Children (ng/mL) ........................ 192
6-4. Ongoing Research Regarding the Environmental Fate and Exposure to Ethylbenzene..... 198
7-1. Analytical Methods for Determining Ethylbenzene in Biological Samples....................... 200
7-2. Analytical Methods for Determining Ethylbenzene in Environmental Samples ............... 204
7-3. Analytical Methods for Determining Biomarkers of Ethylbenzene in Biological Materials ............................................................................................................................ 211
7-4. Analytical Methods for Determining Environmental Degradation Products of Ethylbenzene...................................................................................................................... 213
8-1. Regulations, Advisories, and Guidelines Applicable to Ethylbenzene .............................. 217
1 ETHYLBENZENE
1. PUBLIC HEALTH STATEMENT
This public health statement tells you about ethylbenzene and the effects of exposure to it.
The Environmental Protection Agency (EPA) identifies the most serious hazardous waste sites in the
nation. These sites are then placed on the National Priorities List (NPL) and are targeted for long-term
federal clean-up activities. Ethylbenzene has been found in at least 829 of the 1,689 current or former
NPL sites. Although the total number of NPL sites evaluated for this substance is not known, the
possibility exists that the number of sites at which ethylbenzene is found may increase in the future as
more sites are evaluated. This information is important because these sites may be sources of exposure
and exposure to this substance may be harmful.
When a substance is released either from a large area, such as an industrial plant, or from a container,
such as a drum or bottle, it enters the environment. Such a release does not always lead to exposure. You
can be exposed to a substance only when you come in contact with it. You may be exposed by breathing,
eating, or drinking the substance, or by skin contact.
If you are exposed to ethylbenzene, many factors will determine whether you will be harmed. These
factors include the dose (how much), the duration (how long), and how you come in contact with it. You
must also consider any other chemicals you are exposed to and your age, sex, diet, family traits, lifestyle,
and state of health.
1.1 WHAT IS ETHYLBENZENE?
Colorless liquid that smells like gasoline
You can smell ethylbenzene in the air at 2 parts of ethylbenzene per million parts of air (2 ppm). It evaporates at room temperature and burns easily.
2 ETHYLBENZENE
1. PUBLIC HEALTH STATEMENT
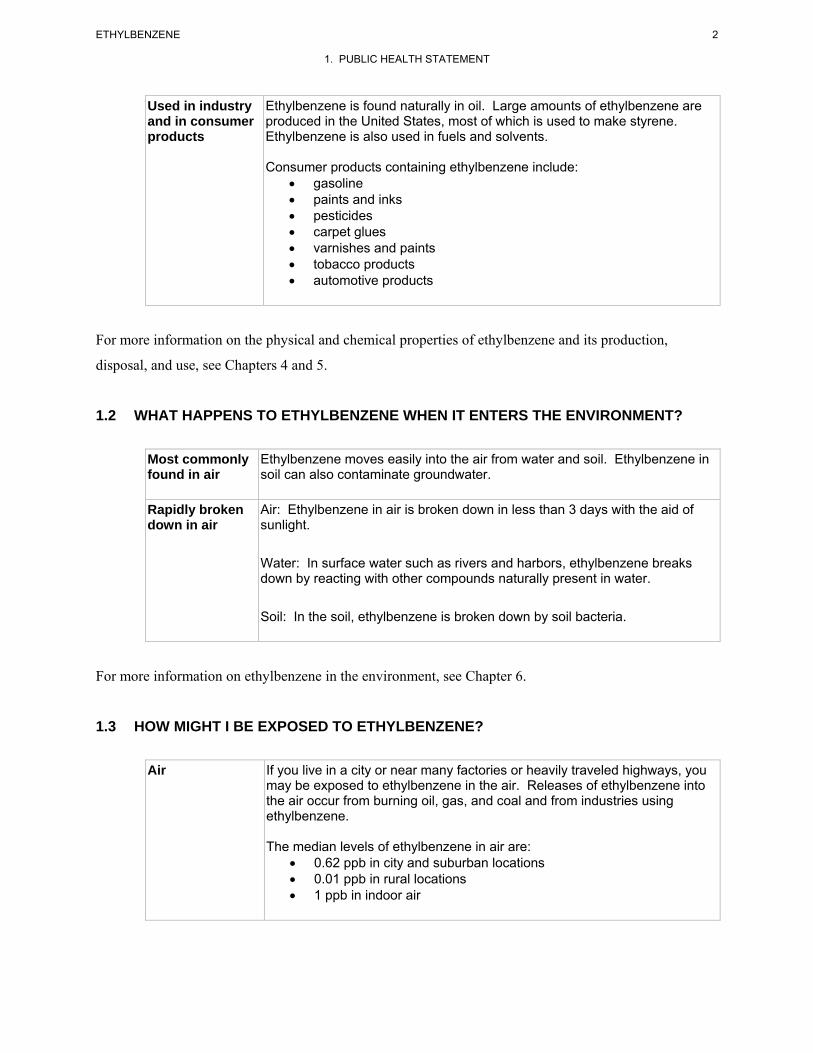
Used in industry and in consumer products
Ethylbenzene is found naturally in oil. Large amounts of ethylbenzene are produced in the United States, most of which is used to make styrene. Ethylbenzene is also used in fuels and solvents.
Consumer products containing ethylbenzene include: • gasoline • paints and inks • pesticides • carpet glues • varnishes and paints • tobacco products • automotive products
For more information on the physical and chemical properties of ethylbenzene and its production,
disposal, and use, see Chapters 4 and 5.
1.2 WHAT HAPPENS TO ETHYLBENZENE WHEN IT ENTERS THE ENVIRONMENT?
Most commonly found in air
Ethylbenzene moves easily into the air from water and soil. Ethylbenzene in soil can also contaminate groundwater.
Rapidly broken down in air
Air: Ethylbenzene in air is broken down in less than 3 days with the aid of sunlight.
Water: In surface water such as rivers and harbors, ethylbenzene breaks down by reacting with other compounds naturally present in water.
Soil: In the soil, ethylbenzene is broken down by soil bacteria.
For more information on ethylbenzene in the environment, see Chapter 6.
1.3 HOW MIGHT I BE EXPOSED TO ETHYLBENZENE?
Air If you live in a city or near many factories or heavily traveled highways, you may be exposed to ethylbenzene in the air. Releases of ethylbenzene into the air occur from burning oil, gas, and coal and from industries using ethylbenzene.
The median levels of ethylbenzene in air are: • 0.62 ppb in city and suburban locations • 0.01 ppb in rural locations • 1 ppb in indoor air
3 ETHYLBENZENE
1. PUBLIC HEALTH STATEMENT
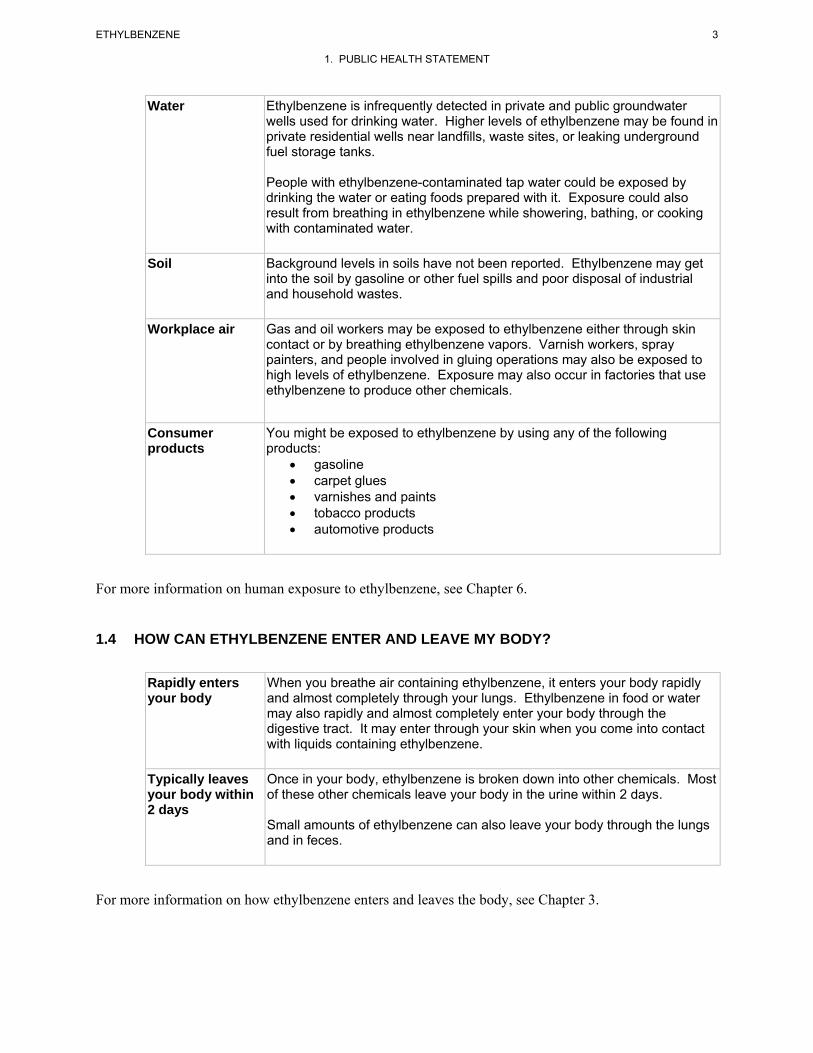
Water Ethylbenzene is infrequently detected in private and public groundwater wells used for drinking water. Higher levels of ethylbenzene may be found in private residential wells near landfills, waste sites, or leaking underground fuel storage tanks.
People with ethylbenzene-contaminated tap water could be exposed by drinking the water or eating foods prepared with it. Exposure could also result from breathing in ethylbenzene while showering, bathing, or cooking with contaminated water.
Soil Background levels in soils have not been reported. Ethylbenzene may get into the soil by gasoline or other fuel spills and poor disposal of industrial and household wastes.
Workplace air Gas and oil workers may be exposed to ethylbenzene either through skin contact or by breathing ethylbenzene vapors. Varnish workers, spray painters, and people involved in gluing operations may also be exposed to high levels of ethylbenzene. Exposure may also occur in factories that use ethylbenzene to produce other chemicals.
Consumer products
You might be exposed to ethylbenzene by using any of the following products: • gasoline • carpet glues • varnishes and paints • tobacco products • automotive products
For more information on human exposure to ethylbenzene, see Chapter 6.
1.4 HOW CAN ETHYLBENZENE ENTER AND LEAVE MY BODY?
Rapidly enters your body
When you breathe air containing ethylbenzene, it enters your body rapidly and almost completely through your lungs. Ethylbenzene in food or water may also rapidly and almost completely enter your body through the digestive tract. It may enter through your skin when you come into contact with liquids containing ethylbenzene.
Typically leaves your body within 2 days
Once in your body, ethylbenzene is broken down into other chemicals. Most of these other chemicals leave your body in the urine within 2 days.
Small amounts of ethylbenzene can also leave your body through the lungs and in feces.
For more information on how ethylbenzene enters and leaves the body, see Chapter 3.
ETHYLBENZENE 4
1. PUBLIC HEALTH STATEMENT
1.5 HOW CAN ETHYLBENZENE AFFECT MY HEALTH?
Scientists use many tests to protect the public from harmful effects of toxic chemicals and to find ways
for treating persons who have been harmed
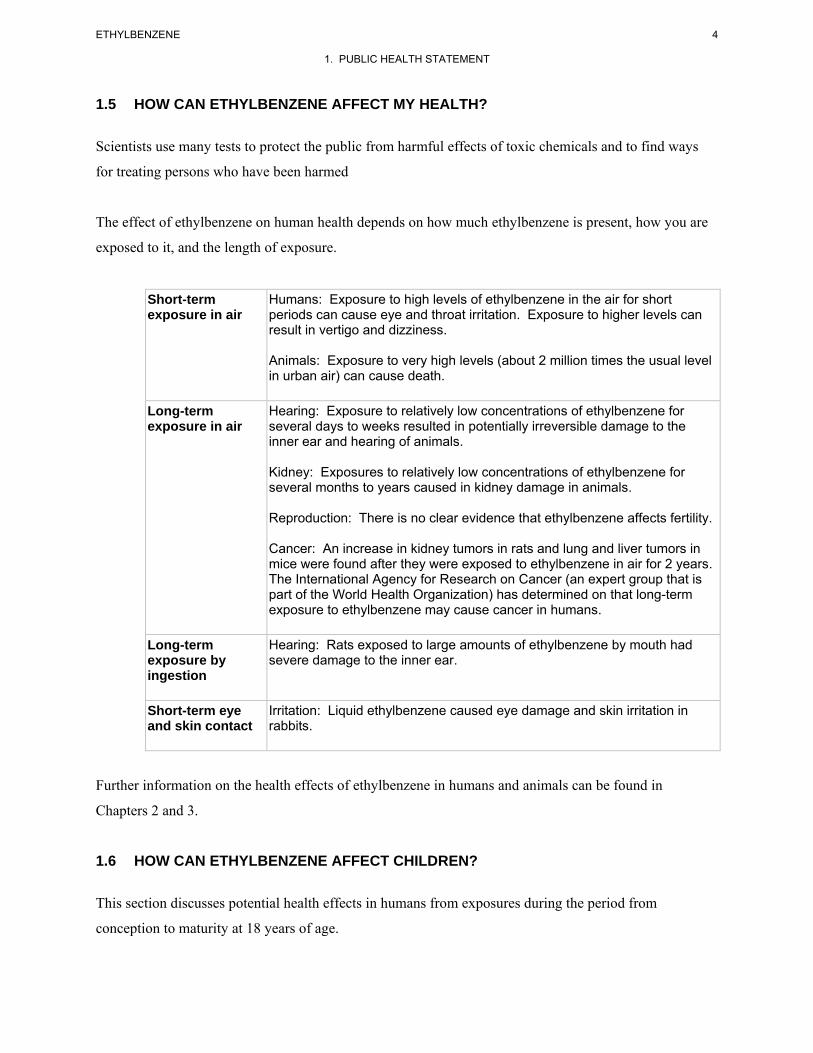
The effect of ethylbenzene on human health depends on how much ethylbenzene is present, how you are
exposed to it, and the length of exposure.
Short-term Humans: Exposure to high levels of ethylbenzene in the air for short exposure in air periods can cause eye and throat irritation. Exposure to higher levels can
result in vertigo and dizziness.
Animals: Exposure to very high levels (about 2 million times the usual level in urban air) can cause death.
Long-term Hearing: Exposure to relatively low concentrations of ethylbenzene for exposure in air several days to weeks resulted in potentially irreversible damage to the
inner ear and hearing of animals.
Kidney: Exposures to relatively low concentrations of ethylbenzene for several months to years caused in kidney damage in animals.
Reproduction: There is no clear evidence that ethylbenzene affects fertility.
Cancer: An increase in kidney tumors in rats and lung and liver tumors in mice were found after they were exposed to ethylbenzene in air for 2 years. The International Agency for Research on Cancer (an expert group that is part of the World Health Organization) has determined on that long-term exposure to ethylbenzene may cause cancer in humans.
Long-term exposure by ingestion
Hearing: Rats exposed to large amounts of ethylbenzene by mouth had severe damage to the inner ear.
Short-term eye and skin contact
Irritation: Liquid ethylbenzene caused eye damage and skin irritation in rabbits.
Further information on the health effects of ethylbenzene in humans and animals can be found in
Chapters 2 and 3.
1.6 HOW CAN ETHYLBENZENE AFFECT CHILDREN?
This section discusses potential health effects in humans from exposures during the period from
conception to maturity at 18 years of age.
5 ETHYLBENZENE
1. PUBLIC HEALTH STATEMENT
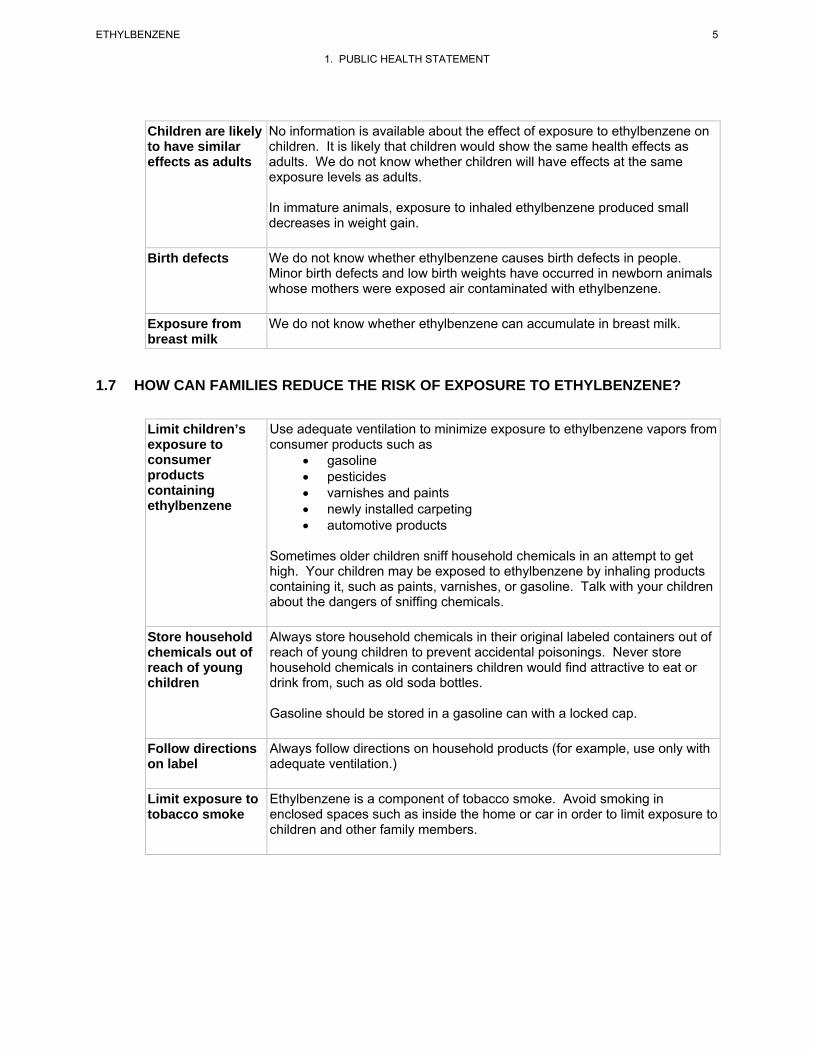
Children are likely to have similar effects as adults
No information is available about the effect of exposure to ethylbenzene on children. It is likely that children would show the same health effects as adults. We do not know whether children will have effects at the same exposure levels as adults.
In immature animals, exposure to inhaled ethylbenzene produced small decreases in weight gain.
Birth defects We do not know whether ethylbenzene causes birth defects in people. Minor birth defects and low birth weights have occurred in newborn animals whose mothers were exposed air contaminated with ethylbenzene.
Exposure from breast milk
We do not know whether ethylbenzene can accumulate in breast milk.
1.7 HOW CAN FAMILIES REDUCE THE RISK OF EXPOSURE TO ETHYLBENZENE?
Limit children’s exposure to consumer products containing ethylbenzene
Use adequate ventilation to minimize exposure to ethylbenzene vapors from consumer products such as
• gasoline • pesticides • varnishes and paints • newly installed carpeting • automotive products
Sometimes older children sniff household chemicals in an attempt to get high. Your children may be exposed to ethylbenzene by inhaling products containing it, such as paints, varnishes, or gasoline. Talk with your children about the dangers of sniffing chemicals.
Store household Always store household chemicals in their original labeled containers out of chemicals out of reach of young children to prevent accidental poisonings. Never store reach of young household chemicals in containers children would find attractive to eat or children drink from, such as old soda bottles.
Gasoline should be stored in a gasoline can with a locked cap.
Follow directions on label
Always follow directions on household products (for example, use only with adequate ventilation.)
Limit exposure to tobacco smoke
Ethylbenzene is a component of tobacco smoke. Avoid smoking in enclosed spaces such as inside the home or car in order to limit exposure to children and other family members.
ETHYLBENZENE 6
1. PUBLIC HEALTH STATEMENT
1.8 IS THERE A MEDICAL TEST TO DETERMINE WHETHER I HAVE BEEN EXPOSED TO ETHYLBENZENE?
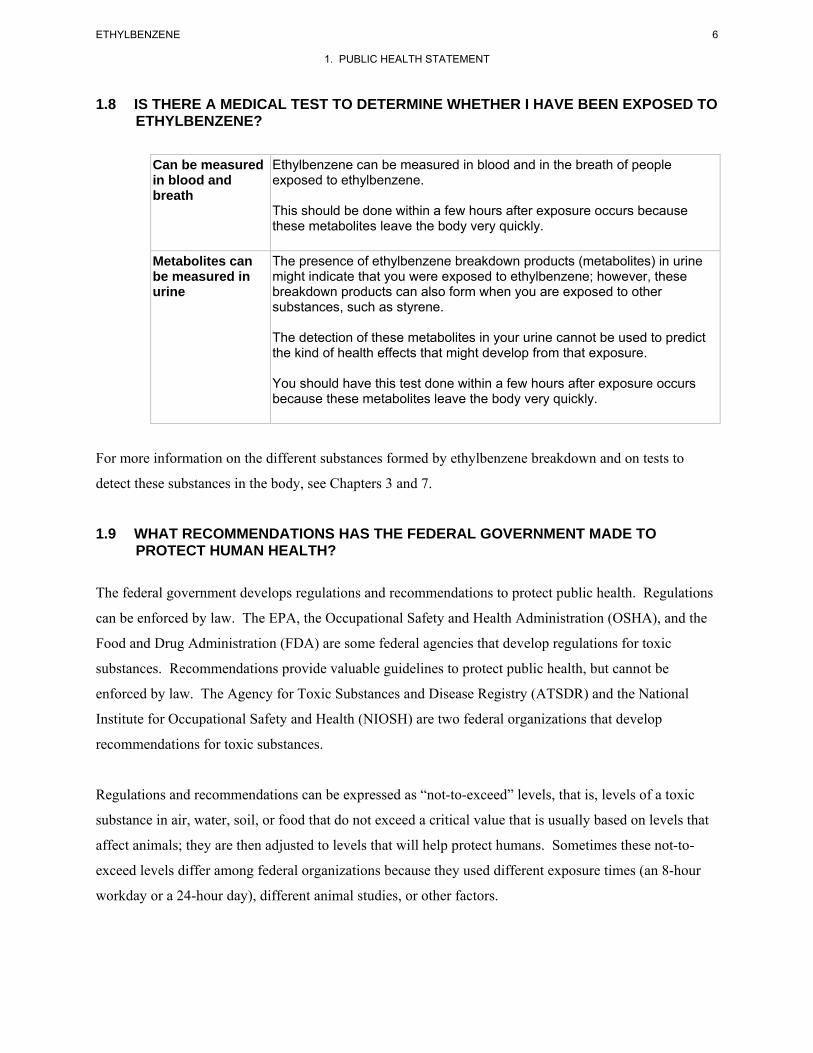
Can be measured in blood and breath
Ethylbenzene can be measured in blood and in the breath of people exposed to ethylbenzene.
This should be done within a few hours after exposure occurs because these metabolites leave the body very quickly.
Metabolites can be measured in urine
The presence of ethylbenzene breakdown products (metabolites) in urine might indicate that you were exposed to ethylbenzene; however, these breakdown products can also form when you are exposed to other substances, such as styrene.
The detection of these metabolites in your urine cannot be used to predict the kind of health effects that might develop from that exposure.
You should have this test done within a few hours after exposure occurs because these metabolites leave the body very quickly.
For more information on the different substances formed by ethylbenzene breakdown and on tests to
detect these substances in the body, see Chapters 3 and 7.
1.9 WHAT RECOMMENDATIONS HAS THE FEDERAL GOVERNMENT MADE TO PROTECT HUMAN HEALTH?
The federal government develops regulations and recommendations to protect public health. Regulations
can be enforced by law. The EPA, the Occupational Safety and Health Administration (OSHA), and the
Food and Drug Administration (FDA) are some federal agencies that develop regulations for toxic
substances. Recommendations provide valuable guidelines to protect public health, but cannot be
enforced by law. The Agency for Toxic Substances and Disease Registry (ATSDR) and the National
Institute for Occupational Safety and Health (NIOSH) are two federal organizations that develop
recommendations for toxic substances.
Regulations and recommendations can be expressed as “not-to-exceed” levels, that is, levels of a toxic
substance in air, water, soil, or food that do not exceed a critical value that is usually based on levels that
affect animals; they are then adjusted to levels that will help protect humans. Sometimes these not-to-
exceed levels differ among federal organizations because they used different exposure times (an 8-hour
workday or a 24-hour day), different animal studies, or other factors.
7 ETHYLBENZENE
1. PUBLIC HEALTH STATEMENT
Recommendations and regulations are also updated periodically as more information becomes available.
For the most current information, check with the federal agency or organization that provides it.
Some regulations and recommendations for ethylbenzene include the following:
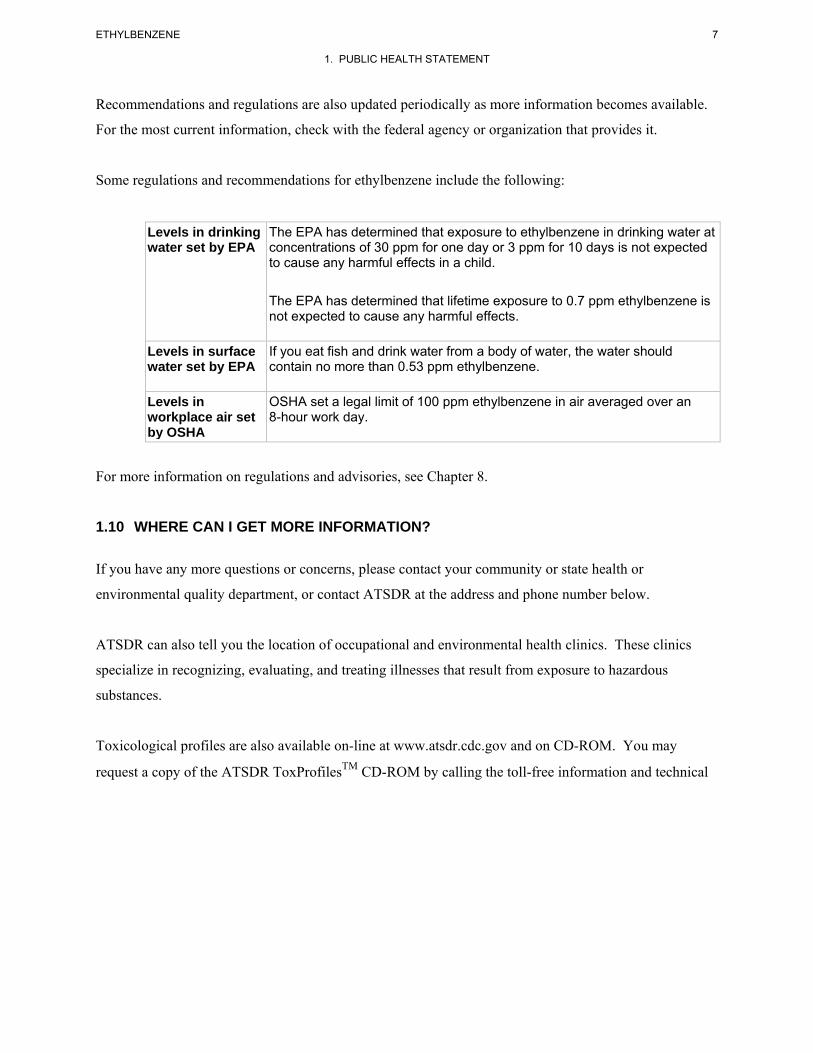
Levels in drinking water set by EPA
The EPA has determined that exposure to ethylbenzene in drinking water at concentrations of 30 ppm for one day or 3 ppm for 10 days is not expected to cause any harmful effects in a child.
The EPA has determined that lifetime exposure to 0.7 ppm ethylbenzene is not expected to cause any harmful effects.
Levels in surface water set by EPA
If you eat fish and drink water from a body of water, the water should contain no more than 0.53 ppm ethylbenzene.
Levels in workplace air set by OSHA
OSHA set a legal limit of 100 ppm ethylbenzene in air averaged over an 8-hour work day.
For more information on regulations and advisories, see Chapter 8.
1.10 WHERE CAN I GET MORE INFORMATION?
If you have any more questions or concerns, please contact your community or state health or
environmental quality department, or contact ATSDR at the address and phone number below.
ATSDR can also tell you the location of occupational and environmental health clinics. These clinics
specialize in recognizing, evaluating, and treating illnesses that result from exposure to hazardous
substances.
Toxicological profiles are also available on-line at www.atsdr.cdc.gov and on CD-ROM. You may
request a copy of the ATSDR ToxProfilesTM CD-ROM by calling the toll-free information and technical
8 ETHYLBENZENE
1. PUBLIC HEALTH STATEMENT
assistance number at 1-800-CDCINFO (1-800-232-4636), by e-mail at [email protected], or by writing
to:
Agency for Toxic Substances and Disease Registry Division of Toxicology and Environmental Medicine 1600 Clifton Road NE Mailstop F-62 Atlanta, GA 30333 Fax: 1-770-488-4178
Organizations for-profit may request copies of final Toxicological Profiles from the following:
National Technical Information Service (NTIS) 5285 Port Royal Road Springfield, VA 22161 Phone: 1-800-553-6847 or 1-703-605-6000 Web site: http://www.ntis.gov/
9 ETHYLBENZENE
2. RELEVANCE TO PUBLIC HEALTH
2.1 BACKGROUND AND ENVIRONMENTAL EXPOSURES TO ETHYLBENZENE IN THE UNITED STATES
Ethylbenzene is widely distributed in the environment. It is primarily used for the production of styrene,
which is the monomeric unit for polystyrene materials. Ethylbenzene is also used as a solvent and in the
manufacture of several organic compounds other than styrene; however, these uses are very minor in
comparison to the amounts used for styrene production. The production volume of ethylbenzene is
typically among the highest of all chemicals manufactured in the United States. In 2005, nearly 12 billion
pounds of ethylbenzene were produced domestically, with historical levels ranging anywhere from
approximately 7 to 13 billion pounds annually. Routine human activities, such as driving automobiles,
boats, or aircraft, and using gasoline powered tools and equipment as well as paints, varnishes, and
solvents release ethylbenzene to the environment. Environmental and background levels of ethylbenzene
are generally small and therefore, have minimal impact on public health. Trace levels of ethylbenzene are
found in internal combustion engine exhaust, food, soil, water, and tobacco smoke, but usually at levels
well below those that have been shown to exhibit toxic effects in laboratory animals or human exposure
studies.
Ethylbenzene is not considered highly persistent in the environment. It partitions primarily to air and
removal via photochemically generated hydroxyl radicals is an important degradation mechanism. The
half-life for this reaction in the atmosphere is approximately 1–2 days. Biodegradation under aerobic
conditions and indirect photolysis are important degradation mechanisms for ethylbenzene in soil and
water. Based on a vapor pressure of 9.53 mm Hg and Henry’s law constant of 7.9x10⁻³ atm-m3/mol,
volatilization from water and soil surfaces is expected to be an important environmental fate process for
ethylbenzene. If released to soil, ethylbenzene is expected to possess moderate mobility based on a soil
adsorption coefficient (Koc) value of 240.
Ethylbenzene is ubiquitous in ambient air, primarily as a result of automobile emissions. The median
level of ethylbenzene in city and suburban air was reported as 2.7 μg/m3 (0.62 ppb). In contrast, the
median level of ethylbenzene measured in rural locations was 0.056 μg/m3 (0.013 ppb). Ethylbenzene
levels in indoor air tend to be higher than corresponding levels monitored in outdoor air, as a result of
contributions from environmental tobacco smoke (ETS) and various consumer products, in addition to the
permeation indoors of ethylbenzene from attached garages or outside air. One study analyzed the
components of ETS for the 50 top-selling U.S. cigarette brand styles in 1991 and for the University of
10 ETHYLBENZENE
2. RELEVANCE TO PUBLIC HEALTH
Kentucky Research cigarette, K1R4F. The ethylbenzene concentrations measured were 8.68 μg/m3 for
full-flavor cigarettes, 8.24 μg/m3 for full-flavor, low-tar cigarettes, and 8.72 μg/m3 for ultra-low-tar
cigarettes. The mean ethylbenzene concentration for all cigarettes was 8.50 μg/m3. One study reported a
maximum outdoor air concentration of 7.4 μg/m3 (1.7 ppb) for ethylbenzene at four residential locations,
while indoor air concentrations at these same homes ranged from 5 to 110 μg/m3 (1–25.3 ppb).
Ethylbenzene is also released to the air during processing of crude oil.
Ethylbenzene is detected infrequently in surface water. Data from the EPA STOrage and REtrieval
Database (STORET), indicated that ethylbenzene was detected in <3% of the surface water samples
analyzed in the United States from January 2005 to March 2007, with a maximum concentration of 2 ppb.
Ethylbenzene can also be present in groundwater, particularly near current or former landfills, hazardous
sites, or gas stations. Oil- and gasoline-contaminated sites have also been found to have relatively high
ethylbenzene concentrations in soil.
Ethylbenzene was identified in 82 different food items at a maximum concentration of 0.129 ppm in data
obtained from the FDA Total Diet Study Market Basket Surveys collected between September 1991 and
October 2003. Trace concentrations of ethylbenzene have been reported in split peas (0.013 mg/kg
[ppm]), lentils (0.005 mg/kg [ppm]), and beans (mean concentration 0.005 mg/kg [ppm]; maximum
concentration 0.011 mg/kg [ppm]).
The general population is primarily exposed to ethylbenzene from the inhalation of ambient air. This is
due to the direct release of ethylbenzene into the air by the burning of fossil fuels or industrial processes,
and partitioning into the air from other media (e.g., soil, surface water). This partitioning of ethylbenzene
into the air or water would play a role in exposure to populations living near hazardous waste sites. In
addition to inhalation exposure, ingestion of ethylbenzene may also occur because trace amounts have
been found in water supplies and various food items.
2.2 SUMMARY OF HEALTH EFFECTS
In humans, eye irritation was observed after exposure to 10,000 ppm ethylbenzene for a few seconds.
Volunteers reported irritation and chest constriction after acute-duration exposures to 2,000 ppm
ethylbenzene. These symptoms worsened as the concentration was increased to 5,000 ppm. Human
exposures in the range of 2,000–5,000 ppm ethylbenzene were associated with dizziness and vertigo.
Complete recovery occurs if exposure is not prolonged. Momentary ocular irritation, a burning sensation,
11 ETHYLBENZENE
2. RELEVANCE TO PUBLIC HEALTH
and profuse lacrimation were observed in humans exposed to 1,000 ppm ethylbenzene. Workers exposed
occupationally to solvent mixtures that included ethylbenzene showed an increased incidence of hearing
loss compared to unexposed individuals. Respiratory effects were not observed in two patients exposed
to 55.3 ppm ethylbenzene for 15 minutes. An increase in the mean number of lymphocytes and a
decrease in hemoglobin levels were observed during a 1-year period in workers exposed chronically to
solvents including ethylbenzene. However, no adverse hematological effects were observed in workers
exposed to ethylbenzene for 20 years. Although no information on ethylbenzene concentrations was
reported, an estimated concentration of 6.4 mg/m3 was derived from a mean post-shift in urinary mandelic
acid concentration in workers, based on the relationship between ethylbenzene concentrations in air and
urinary mandelic acid concentration in a chamber-exposed group. No liver lesions or differences in liver
function tests between exposed and nonexposed workers were observed and no cases of malignancy in
workers were reported. However, given the low exposure concentration, this study had limited the power
to detect any effect. No other studies in humans exposed to ethylbenzene were located. Given that little
data in humans are available, it is assumed that adverse effects observed in animals are relevant to
humans.
Acute-duration and intermediate-duration studies in animals suggest that the auditory system is a sensitive
target of ethylbenzene toxicity. Significant losses of outer hair cells (OHCs) in the organ of Corti have
been observed in rats after acute-duration exposure ≥400 ppm and intermediate-duration inhalation
exposure to ≥200 ppm ethylbenzene. These OHC losses have been observed up to 11 weeks after
termination of the exposure, suggesting that these effects may be irreversible. Significant deterioration of
auditory thresholds is also observed in animals affected with OHC losses. Auditory deficits have also
been observed in animals after an intermediate-duration oral exposure to ethylbenzene. An almost
complete loss of the three rows of outer hair cells in the organ of Corti was observed in rats 10 days after
the last dose (900 mg/kg/day) in an acute-duration study. Effects on the central nervous system, such as
moderate motor activation, narcotic effects, changes in posture and arousal, and salivation and prostration
have been observed in animals after acute- and intermediate-duration exposure to ≥400 ppm
ethylbenzene.
Results of 4- and 13-week studies indicate that intermediate-duration oral exposure to ethylbenzene
produces effects to the liver. Effects indicative of liver toxicity observed included increased activity of
serum liver enzymes (alanine aminotransferase and γ-glutamyl transferase) in males (≥250 mg/kg/day)
and females (750 mg/mg/day), increased absolute and relative liver weights (≥250 mg/kg/day in males
and females), and a dose-related increase in the incidence of centrilobular hepatocyte hypertrophy
12 ETHYLBENZENE
2. RELEVANCE TO PUBLIC HEALTH
(≥250 mg/kg/day in males and females). Increased bilirubin (≤250 mg/kg/day in males and
750 mg/kg/day in females), total protein (750 mg/kg/day in females), albumin (750 mg/kg/day in males
and females), globulins (750 mg/kg/day in females), and cholesterol (≤250 mg/kg/day in males and
females), and decreased prothrombin time (750 mg/kg/day in males and ≥250 mg/kg/day in females) were
considered by study investigators as adaptive effects in the liver. In males in the 75 mg/k/day group,
relative liver weight was significantly increased by 4% compared to controls; however, no
histopathological changes, or increases in absolute liver or serum liver enzyme activities were observed at
this dosage. Given that ethylbenzene is a microsomal enzyme inducer, and the absence of histopathology
and other evidence of liver injury at the 75 mg/kg/day dosage, the small increase in relative liver weight
in male rats was at this dosage not considered evidence for an adverse effect on the liver. Results of the
4-week gavage study in rats were similar to those of the 13-week study, identifying no-observed-adverse-
effect level (NOAEL) and lowest-observed-adverse-effect level (LOAEL) values of 250 and
750 mg/kg/day, respectively, for liver effects. Observed effects consistent with hepatotoxicity included
increased absolute and relative liver weights (≥250 mg/kg/day in males and 750 mg/kg/day in females),
increased incidence of hepatocyte centrilobular (≥250 mg/kg/day in males and 750 mg/kg/day in
females), and increase serum liver enzyme activity (alanine aminotransferase) (750 mg/kg/day in males
and females). Histopathological changes characterized by cloudy swelling of parenchymal cells of the
liver and an increase in liver weight were observed in female rats administered 408 mg/kg/day by gavage
for 6 months. No other hepatic changes were reported. No liver effects were observed in female rats
administered 136 mg/kg/day. However, this study was poorly reported and did not provide adequate
descriptions of study methods or results.
Guinea pigs exposed to sublethal concentrations of ethylbenzene (≤10,000 ppm for <100 minutes)
showed “moderate” pulmonary edema and congestion. These findings had disappeared in animals after a
4–8-day recovery period, suggesting that these pathological effects in the lung are reversible. A 50%
respiratory depression was observed in mice exposed to ≥1,432 ppm for 5–30 minutes. Respiratory
depression has not been reported in humans exposed to ethylbenzene. Nasal and eye irritation was
evident in animals exposed to 1,000 ppm for ≥3 minutes. An NTP study did not observe weight or
histopathological effects in the lungs of rats or mice exposed to 782 ppm or rabbits exposed to 1,610 ppm
ethylbenzene for 4 weeks. Absolute and relative lung weight was increased in rats, but not mice, exposed
to ≥250 ppm for 13 weeks; no treatment-related histopathological effects were observed. Another study
did not report pulmonary injury in rats, guinea pigs, rabbits, or monkeys exposed to 600–2,200 ppm
ethylbenzene for approximately 6 months; however, only two animals were used in some of the dose
groups in rabbits and monkeys. In the NTP study, no treatment-related histopathological effects were
13 ETHYLBENZENE
2. RELEVANCE TO PUBLIC HEALTH
noted in respiratory tissue in rats or female mice exposed to up to 750 ppm ethylbenzene for 2 years.
Although an increase in alveolar epithelial hyperplasia was noted in male mice in the 750-ppm group the
incidence fell within historical controls for the conducting laboratory. The available data on adverse
respiratory effects associated with ethylbenzene exposure in animals and the limited data available in
humans suggest that respiratory effects in humans could result following inhalation exposure to high
concentrations of ethylbenzene. Respiratory effects from low-level exposure, such as that found in the
outdoor air, appear to be less likely.
Developmental effects have been reported in the offspring of pregnant animals exposed to ethylbenzene
during gestation. The best reported studies available suggest that developmental effects are generally
observed at concentrations of approximately ≥1,000 ppm. Significant increases in the incidence of fetal
skeletal variations were observed in the offspring of pregnant rats exposed to 2,000 ppm and reductions in
fetal body weight were observed in the offspring of pregnant rats exposed to ≥1,000 ppm ethylbenzene
during gestation. Maternal toxicity, manifested as reduced body weight gain, was also observed in rats
exposed to ≥1,000 ppm. No developmental effects were observed at concentrations of ≤500 ppm. In
contrast, an increased incidence of fetuses with extra ribs was observed in the offspring of rats exposed to
100 ppm during gestation, but not when the animals were exposed to 100 ppm during pre-mating and
gestation. No other significant increases in major malformations or minor anomalies were observed.
Neurodevelopmental assessments conducted on F2 rat offspring indicated no effects in a functional
observational battery assessment, fore- or hind-limb grip strength, swimming ability, motor activity,
startle response, or learning and memory assessments at 500 ppm.
The number of implantations or live fetuses per litter and the percentage of resorptions or non-live
implants per litter were unaffected in pregnant rats exposed to 2,000 ppm ethylbenzene during gestation.
In a two-generation study, estrous cycle length was significantly reduced in F0, but not F1, females
exposed to 500 ppm or in rats or mice exposed to 975 ppm ethylbenzene for 90 days. Reproductive
parameters were not affected in F0 or F1 males or females at 500 ppm ethylbenzene. Exposure of rats
and rabbits to 100 or 1,000 ppm ethylbenzene for 3 weeks during prior to mating or gestation or both
resulted in no conclusive evidence of reproductive effects in either species. Assessments of reproductive
organs conducted following intermediate- and chronic-duration exposure to ethylbenzene have not
observed histopathological changes in the testes of rats, mice, or rabbits exposed to concentrations as high
as 2,400 ppm ethylbenzene for 4 days or in rats or mice exposed to 782 ppm ethylbenzene or rabbits
exposed to 1,610 ppm for 4 weeks. No effect was observed on spermatid counts, sperm motility, weight
of the caudal epididymis, or testicular morphology in rats or mice exposed to 975 ppm ethylbenzene for
14 ETHYLBENZENE
2. RELEVANCE TO PUBLIC HEALTH
90 days. No adverse histopathological effects were seen in the testes of rats or guinea pigs exposed to
concentrations up to 1,250 or 600 ppm, respectively, for 6–7 months.
Other systemic effects have been observed in animals after acute-, intermediate-, and chronic-duration
exposures to ethylbenzene. Eye irritation and lacrimation have been observed after acute-duration
exposures in rats, mice, and guinea pigs exposed to ≥1,000 ppm ethylbenzene. Lacrimation was observed
in rats exposed to 382 ppm for 4 weeks. In contrast, no ocular effects were seen in rats or mice after a
13-week exposure to 975 ppm ethylbenzene. Mild irritation, reddening, exfoliation, and blistering have
been reported in rabbits when ethylbenzene was applied directly on the skin. Slight irritation of the eye
and corneal injuries were observed in rabbits when ethylbenzene was instilled onto the eyes.
One study examined the possible association between occupational exposure to ethylbenzene and
increased cancer risk; no cases of malignancy were observed in workers exposed to ethylbenzene for
20 years. Animal studies have found increased incidences of neoplasms in rats and mice following
inhalation or oral exposure, which are considered relevant to humans. The inhalation studies conducted
by NTP found clear evidence of carcinogenic activity in male rats based on increased incidences of renal
tubule neoplasm's and testicular adenomas, some evidence of carcinogenic activity in female rats based
on increased incidences of renal tubule adenomas, some evidence of carcinogenic activity in male mice
based on increased incidences of alveolar/bronchiolar neoplasms, and some evidence of carcinogenic
activity in female mice based on increased incidences of hepatocellular neoplasms. In a reevaluation of
the histopathology of rat kidneys from the NTP study, another study confirmed the NTP findings and
suggested that the increased incidence of kidney tumors in rats in the high-dose group was related to a
chemical-induced exacerbation of chronic progressive nephropathy (CPN) with a minor contributing
factor in male rats being α2µ-globulin nephropathy. The author suggests that since CPN is an age-related
disease of rodents without a counterpart in humans, the kidney results of the NTP study are not relevant to
humans for risk assessment purposes. However, in an analysis of the association between CPN and renal
tubule cell neoplasms in male F344 rats, it was concluded that the association between CPN and renal
tubule cell neoplasms is marginal. Results of this analysis suggest that the number of renal tubule cell
neoplasms secondary to CPN would be few. An increase in the total number of malignant tumors was
observed in rats orally exposed to ethylbenzene; however, data on specific tumor types were not provided.
On the basis of the NTP study, IARC has classified ethylbenzene as a Group 2B carcinogen (possibly
carcinogenic to humans). In the most recent carcinogenicity assessment by the EPA conducted in 1991,
ethylbenzene was classified as Group D (not classifiable as to human carcinogenicity) due to the lack of
15 ETHYLBENZENE
2. RELEVANCE TO PUBLIC HEALTH
animal bioassays and human studies; however, the EPA assessment predated the NTP study. Ethyl-
benzene is not included in the DHHS’s 11th Report on Carcinogens.
Acute- and intermediate-duration studies provide strong evidence that ototoxicity is a sensitive effect
following inhalation exposure to ethylbenzene. A more detailed discussion of this effect follows. The
reader is referred to Section 3.2, Discussion of Health Effects by Route of Exposure, for additional
information on other effects.
A study of workers exposed occupationally to solvent mixtures that include ethylbenzene (mean exposure
level 1.8 ppm) showed a 58% incidence of hearing loss compared to 36% in the reference (unexposed)
group. The role of ethylbenzene in the observed losses cannot be ascertained from this study given that
ethylbenzene was only one of several solvents, most of which were present at mean concentrations 1.5–
3.5 times higher than ethylbenzene. Consistent with the outcome of occupational studies showing hearing
loss, significant and persistent adverse auditory effects have been shown in animals after acute- and
intermediate-duration inhalation exposures to ethylbenzene and after acute-duration oral exposures.
OHCs in the organ of Corti (located in the cochlea) are a sensitive target of toxicity of ethylbenzene.
Significant losses of OHCs in the organ or Corti were observed in male rats after acute-duration
inhalation exposure to ≥400 ppm and intermediate-duration inhalation exposure to ≥200 ppm ethyl-
benzene. These losses in OHC were observed 8–11 weeks after the last exposures. Inhalation of
≥400 ppm ethylbenzene for 5 days or 4 weeks also resulted in a significant deterioration of auditory
thresholds. The magnitude of the shifts in auditory thresholds observed after the first 4 weeks of exposure
did not change during a 13-week exposure period or after an 8-week post-exposure recovery period.
Inner hair cells were affected by ethylbenzene only at ≥600 ppm in the intermediate-duration study.
Guinea pigs exposed to ethylbenzene at 2,500 ppm for 5 days did not show auditory deficits or losses in
outer hair cells, whereas significant deficits and hair cell loss were observed in rats exposed to ethyl-
benzene at 550 ppm. An almost complete loss of OHC was reported in male rats 10 days after an acute-
duration oral exposure to ethylbenzene. The mechanisms of the species differences between rats and
guinea pigs are not understood. However, given the observations of hearing loss in workers exposed to
1.8 ppm ethylbenzene, the rat appears to be an appropriate animal model.
2.3 MINIMAL RISK LEVELS (MRLs)
Estimates of exposure levels posing minimal risk to humans (MRLs) have been made for ethylbenzene.
An MRL is defined as an estimate of daily human exposure to a substance that is likely to be without an
16 ETHYLBENZENE
2. RELEVANCE TO PUBLIC HEALTH
appreciable risk of adverse effects (noncarcinogenic) over a specified duration of exposure. MRLs are
derived when reliable and sufficient data exist to identify the target organ(s) of effect or the most sensitive
health effect(s) for a specific duration within a given route of exposure. MRLs are based on
noncancerous health effects only and do not consider carcinogenic effects. MRLs can be derived for
acute, intermediate, and chronic duration exposures for inhalation and oral routes. Appropriate
methodology does not exist to develop MRLs for dermal exposure.
Although methods have been established to derive these levels (Barnes and Dourson 1988; EPA 1990a),
uncertainties are associated with these techniques. Furthermore, ATSDR acknowledges additional
uncertainties inherent in the application of the procedures to derive less than lifetime MRLs. As an
example, acute inhalation MRLs may not be protective for health effects that are delayed in development
or are acquired following repeated acute insults, such as hypersensitivity reactions, asthma, or chronic
bronchitis. As these kinds of health effects data become available and methods to assess levels of
significant human exposure improve, these MRLs will be revised.
Inhalation MRLs
• An MRL of 5 ppm has been derived for acute-duration inhalation exposure (14 days or less) to ethylbenzene.
There is limited information on the acute toxicity of ethylbenzene in humans. Acute exposures to
≥1,000 ppm resulted in ocular irritation, a burning sensation, and profuse lacrimation (Cometto-Muniz
and Cain 1995; Thienes and Haley 1972; Yant et al. 1930). Volunteers exposed to 2,000 ppm reported
irritation and chest constriction with worsening symptoms when the concentration was increased to
5,000 ppm (Yant et al. 1930). Studies in laboratory animals identify ototoxicity as the most sensitive end
point for acute-duration inhalation exposure to ethylbenzene. Damage to the outer hair cells (OHCs) of
the organ of Corti and, in some cases, significant reductions in auditory thresholds were observed in rats
exposed to ≥400 ppm ethylbenzene by inhalation for 5 days (Cappaert et al. 1999, 2000, 2001, 2002).
Loss of OHCs appeared to be concentration-related as losses were 52–66% in animals exposed to
800 ppm ethylbenzene (Cappaert et al. 1999), 40–75% at 550 ppm, and approximately 25% at 400 ppm
(Cappaert et al. 2000, 2001). OHC losses in rats exposed to 300 ppm were small (12%) and not
statistically significant (Cappaert et al. 2000). Auditory thresholds in rats exposed to ethylbenzene at
≥400 ppm were significantly affected in the mid-frequency region; however, an increasingly broader
range of frequencies was affected with increasing concentrations of ethylbenzene (Cappaert et al. 1999,
2000). Auditory assessments indicate that effects were evident shortly after exposure and persisted for up
17 ETHYLBENZENE
2. RELEVANCE TO PUBLIC HEALTH
to 11 weeks (termination of the observation period) (Cappaert et al. 1999, 2000, 2001, 2002), suggesting
that the auditory effects might be irreversible. Cappaert et al. (2002) demonstrated a significant species
difference in the susceptibility of rats and guinea pigs to the ototoxic effects of ethylbenzene, with guinea
pigs showing no auditory deficits or losses in OHCs at 2,500 ppm ethylbenzene after 5 days (Cappaert et
al. 2002).
Neurological effects were observed after acute-duration exposure to ethylbenzene at concentrations equal
to or higher than those that elicited auditory effects in animals. Effects observed after acute-duration
exposure to ethylbenzene include moderate activation of motor behavior in rats exposed to 400 ppm
(Molnar et al. 1986) and reduced activity and prostration and shallow breathing in rats and mice at
1,200 ppm (Ethylbenzene Producers Association 1986a). Rats or mice exposed to ≥2,000 ppm showed
posture changes, reduced grip strength, reduced motor coordination (Tegeris and Balster 1994), narcotic
effects (Molnar et al. 1986), and neurotransmission disturbances in the forebrain and hypothalamus
(Andersson et al. 1981). Mice exposed to 4,060 ppm for 20 minutes showed a 50% reduction in
respiratory rate (Nielsen and Alarie 1982). A 50% respiratory depression observed in mice at 1,432 ppm
was attributed to sensory irritation (De Ceaurriz et al. 1981).
Increased liver weight was reported after acute-duration exposure in rats exposed to ≥400 ppm
ethylbenzene (Ethylbenzene Producers Association 1986a; Toftgard and Nilsen 1982), but not in mice at
1,200 ppm or rabbits at 2,400 ppm (Ethylbenzene Producers Association 1986a). At these same levels
and exposure durations, induction of microsomal enzymes and related ultrastructural changes (e.g.,
proliferation of the smooth endoplasmic reticulum) were observed. These effects occurred in the absence
of histopathological changes to the liver. Therefore, the effects on the liver appear to be related to
induction of microsomal enzymes in smooth endoplasmic reticulum. An increase in relative kidney
weight was also observed in rats exposed to ≥1,200 ppm (Ethylbenzene Producers Association 1986a;
Toftgard and Nilsen 1982), but not in mice at 1,200 ppm or rabbits at 2,400 ppm (Ethylbenzene Producers
Association 1986a). However, increased kidney weights occurred in the absence of histological changes
(Ethylbenzene Producers Association 1986a). No histopathological alterations were observed in the lungs
of surviving rats, mice, or rabbits exposed to 1,200, 400, or 2,400 ppm ethylbenzene, respectively, for
4 days (Ethylbenzene Producers Association 1986a).
The observed damage to the auditory capacity of rats exposed to ethylbenzene during acute-duration
studies reported in Cappaert et al. study (2000) was chosen as a critical effect to derive the acute-duration
inhalation MRL. In the study by Cappaert et al. (2000), Wag/Rij rats (8 rats/group; sex not provided)
18 ETHYLBENZENE
2. RELEVANCE TO PUBLIC HEALTH
were exposed to 0, 300, 400, or 550 ppm ethylbenzene (99% pure) 8 hours/day for 5 days. Potential
auditory effects were examined by measuring distortion product otoacoustic emissions (DPOAE),
compound action potential (CAP), and hair cell counts at five locations of the organ of Corti 3–6 weeks
after the last ethylbenzene exposure. Exposed animals did not show clinical signs of intoxication and
there were no significant differences in terminal body weight between exposed and control rats. DPOAE
amplitude growth curves showed a significant reduction in rats exposed to 550 ppm, but not to 300 or
400 ppm ethylbenzene. Effects were significant at 5.6, 8, and 11.3 kHz, but not at other frequencies. The
DPOAE thresholds were significantly shifted (increased stimulus was needed to elicit the threshold
response) at 5.6, 8, 11.3, and 16 kHz in rats in the 550-ppm group. DPOAE threshold shifts were not
observed in other exposure groups. Animals exposed to 550 ppm showed a significant shift in the CAP
amplitude growth curves at 8, 12, and 16 kHz. In the 400-ppm group, the CAP growth curves were
affected only at 12 kHz and there was no effect in animals in the 300-ppm group. CAP thresholds were
significantly shifted at 8, 12, and 16 kHz in the 550-ppm group and at 12 and 16 kHz in the 400-ppm
group. There was no significant deterioration of CAP thresholds in the 300-ppm group. Significant OHC
losses of approximately 33 and 75% were observed in the 550-ppm group in the auditory regions
corresponding to 11 and 21 kHz, respectively. In the 400-ppm group, significant losses (25%) were
observed in the 11 kHz region. OHC losses in the 21 kHz region in the 300-ppm group were
approximately 12%, but were not statistically significantly different from controls. This study identifies a
NOAEL of 300 ppm and a LOAEL of 400 ppm for significant deterioration in CAP auditory thresholds
and significant OHC losses.
The point of departure for an acute-duration inhalation MRL was identified using benchmark dose (BMD)
analysis of the CAP auditory threshold data using data from this study provided by Dr. Cappaert to
ATSDR. The largest effects on CAP threshold occurred in response to 8, 12, and 16 kHz stimuli and, on
this basis, these data were selected for BMD modeling. The BMD modeling was run using an internal
dose metric (time-averaged arterial blood concentration of ethylbenzene, MCA), which was simulated
using a physiologically-based pharmacokinetic (PBPK) model. Using MCA as the dose metric, the CAP
threshold shift data were fit to all available continuous models in EPA’s Benchmark Dose Software
(BMDS, version 2.1.1) using a benchmark dose response (BMR) of 1 standard deviation. Details of the
BMD modeling and PBPK models are present in detail in Appendix A. At the 8 kHz frequency, the Hill,
polynomial (2- and 3-degree), and power models provided adequate fit to the data. Of these models, the
polynomial (3-degree) model provided the best fit to the data. At 12 and 16 kHz frequencies, only the
Hill model provided an adequate fit to the data. The 95% lower confidence limit on the benchmark
concentration (BMDLMCA) for these three models are presented in Table 2-1.
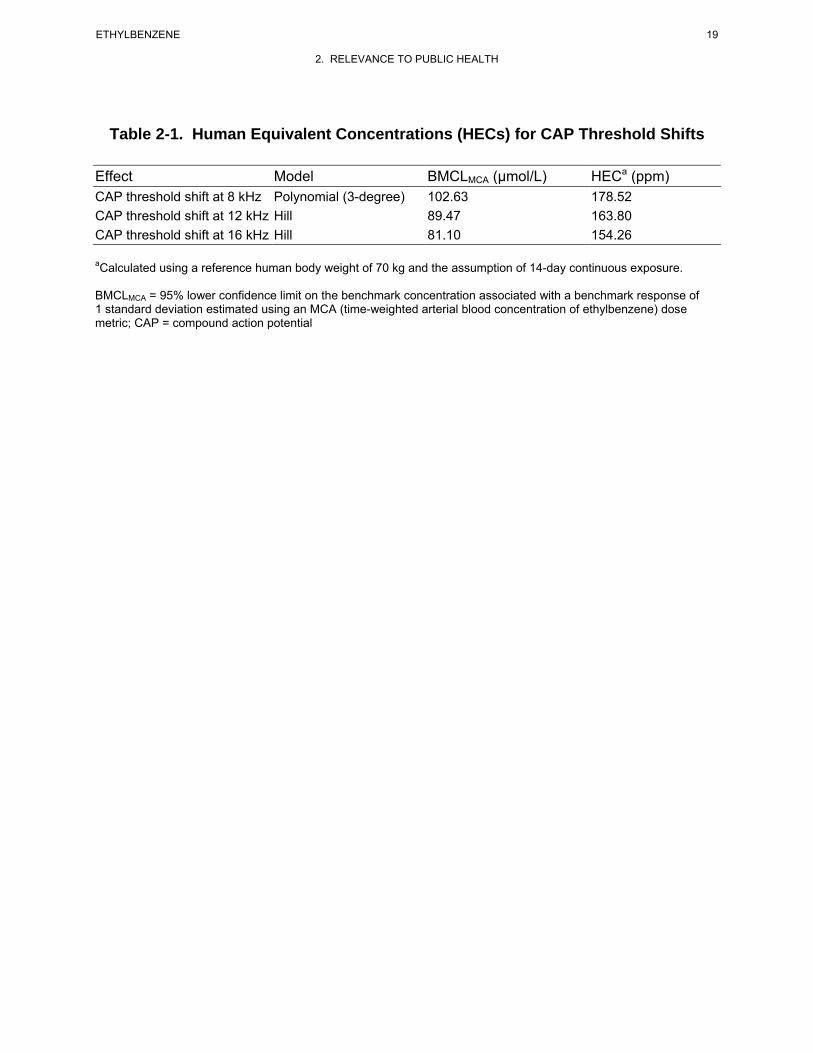
19 ETHYLBENZENE
2. RELEVANCE TO PUBLIC HEALTH
Table 2-1. Human Equivalent Concentrations (HECs) for CAP Threshold Shifts
Effect Model BMCLMCA (µmol/L) HECa (ppm) CAP threshold shift at 8 kHz Polynomial (3-degree) 102.63 178.52 CAP threshold shift at 12 kHz Hill 89.47 163.80 CAP threshold shift at 16 kHz Hill 81.10 154.26
aCalculated using a reference human body weight of 70 kg and the assumption of 14-day continuous exposure.
BMCLMCA = 95% lower confidence limit on the benchmark concentration associated with a benchmark response of 1 standard deviation estimated using an MCA (time-weighted arterial blood concentration of ethylbenzene) dose metric; CAP = compound action potential
20 ETHYLBENZENE
2. RELEVANCE TO PUBLIC HEALTH
To select the point of departure for the acute-duration inhalation MRL, human equivalent concentrations
(HECs) were predicted from the BMCLMCA values in Table 2-1 for CAP threshold data at 8, 12, and
16 kHz using the human PBPK model (estimation of the HEC values is described in Appendix A). The
lowest HEC of 154.26 ppm was selected as the point of departure. This HEC was divided by an
uncertainty factor of 30 (3 for extrapolation from animals to humans with dosimetric adjustments and 10
for human variability) resulting in an acute-duration inhalation MRL of 5 ppm.
• An MRL of 2 ppm has been derived for intermediate-duration inhalation exposure (15–364 days) to ethylbenzene.
Several studies in animals, but no studies in humans, have examined the toxicity of ethylbenzene
following intermediate-duration inhalation exposure. The available animal studies suggest that
ototoxicity is the most sensitive end point of ethylbenzene toxicity. Rats exposed to ≥400 ppm
ethylbenzene via inhalation for 4 or 13 weeks showed significant increases in auditory thresholds. These
threshold shifts persisted unchanged for the duration of the exposure period and during an 8-week post-
exposure recovery period (Gagnaire et al. 2007). Cell counts conducted in the organ of Corti after the
8-week recovery period showed significant losses of outer hair cells in rats exposed to ≥200 ppm.
Concentration-related losses of inner hair cells (IHC) (14 and 32%) were observed in animals in the
600 and 800 ppm groups, respectively, with occasional IHC losses in the 400 ppm group.
Systemic effects have been observed at concentrations equal to or higher than those that elicited ototoxic
effects in rats. Increased liver, kidney, lung, and spleen weights have been observed in animals exposed
to ethylbenzene concentrations in the 250–1,000 ppm range (Cragg et al. 1989; Elovaara et al. 1985;
NIOSH 1981; NTP 1992; Wolf et al. 1956). However, the changes in organ weight have not been
associated with histological alterations. One study (Cragg et al. 1989) reported a small, but statistically
significant, increase in platelet counts in male rats and leukocyte counts in female rats exposed to
782 ppm ethylbenzene for 4 weeks. Developmental effects have been observed in rats exposed to
≥1,000 ppm. Increases in the occurrence of skeletal malformations (NIOSH 1981; Saillenfait et al. 2003)
and decreases in fetal body weight (Saillenfait et al. 2003, 2006, 2007) have been observed at
≥1,000 ppm. The NOAEL for these effects is 500 ppm (NIOSH 1981; Saillenfait et al. 2003, 2006,
2007). Developmental landmarks and neurodevelopment were not statistically or biologically
significantly affected in the offspring of rats exposed to up to 500 ppm ethylbenzene in a two-generation
reproductive toxicity study (Faber et al. 2006, 2007).
21 ETHYLBENZENE
2. RELEVANCE TO PUBLIC HEALTH
Thus, the available intermediate-duration inhalation studies suggest that ototoxicity is the most sensitive
effect of ethylbenzene. Ototoxicity observed in the study by Gagnaire et al. (2007) was selected as the
critical effect to derive the intermediate-duration inhalation MRL. In the Gagnaire et al. (2007) study,
male Sprague-Dawley rats (14 rats/exposure group) were exposed to 0, 200, 400, 600, and 800 ppm
ethylbenzene (99% pure) 6 hours/day, 6 days/week for 13 weeks. Ototoxicity was assessed based on
effects on neurophysiological measurements after 4, 8, or 13 weeks of exposure and after a 8-week
recovery period and cochlear total hair cell counts were measured at the end of the 8-week recovery
period. There were no significant differences in body weight gain between the surviving treated animals
and controls. Audiometric thresholds at 2, 4, 8, and 16 kHz were significantly higher in animals exposed
to 400, 600, and 800 ppm ethylbenzene than in controls. The effect was evident at week 4, did not change
throughout the exposure period, and was not reversed after 8 weeks of recovery. No shift in audiometric
thresholds was observed in rats in the 200 ppm group; however, the morphological assessment of the
organ of Corti showed significant losses (up to 30% of the outer hair cells in the mid frequency region) in
the third row of the OHC in four of eight rats exposed to 200 ppm. A concentration-related loss in third
row OHC (OHC3) was evident with almost complete loss observed in the 600 and 800 ppm groups. The
data suggest that the extent of the damage at each concentration was greatest in the OHC3 followed, in
decreasing order, by damage in OHC2, OHC1, and IHC. There was no significant hair cell loss in the
control animals.
Auditory threshold shifts and OHC loss are selected as the critical effects following intermediate-duration
inhalation exposure to ethylbenzene. BMD analysis was conducted for these end points using a data set
provided to ATSDR by Dr. Gagnaire. The data for auditory thresholds at 4, 8, and 16 kHz in rats exposed
for 4 or 13 weeks and OHC loss at the end of the recovery period were fit to all available continuous
models in EPA’s BMDS (version 2.1.1) using a time-averaged arterial blood concentration of
ethylbenzene (MCA) as the dose metric and a BMR of 1 standard deviation change from control. The
BMD modeling and the PBPK model used to estimate the MCA dose metric are described in
Appendix A.
Most of the available BMD models did not adequately fit the auditory threshold data; however, with the
exception of the auditory thresholds at 16 kHz in rats exposed to ethylbenzene for 13 weeks, one BMD
model fit each data set often when the highest two dose groups were dropped. The BMCLMCA values
estimated from these models are presented in Table 2-2. None of the BMD models adequately fit the
OHC loss data. HECs corresponding to specific BMCLMCA values were simulated using a human PBPK
model (described in Appendix A). The HECs of the BMCLMCA values (Table 2-2) ranged from 63.64 to
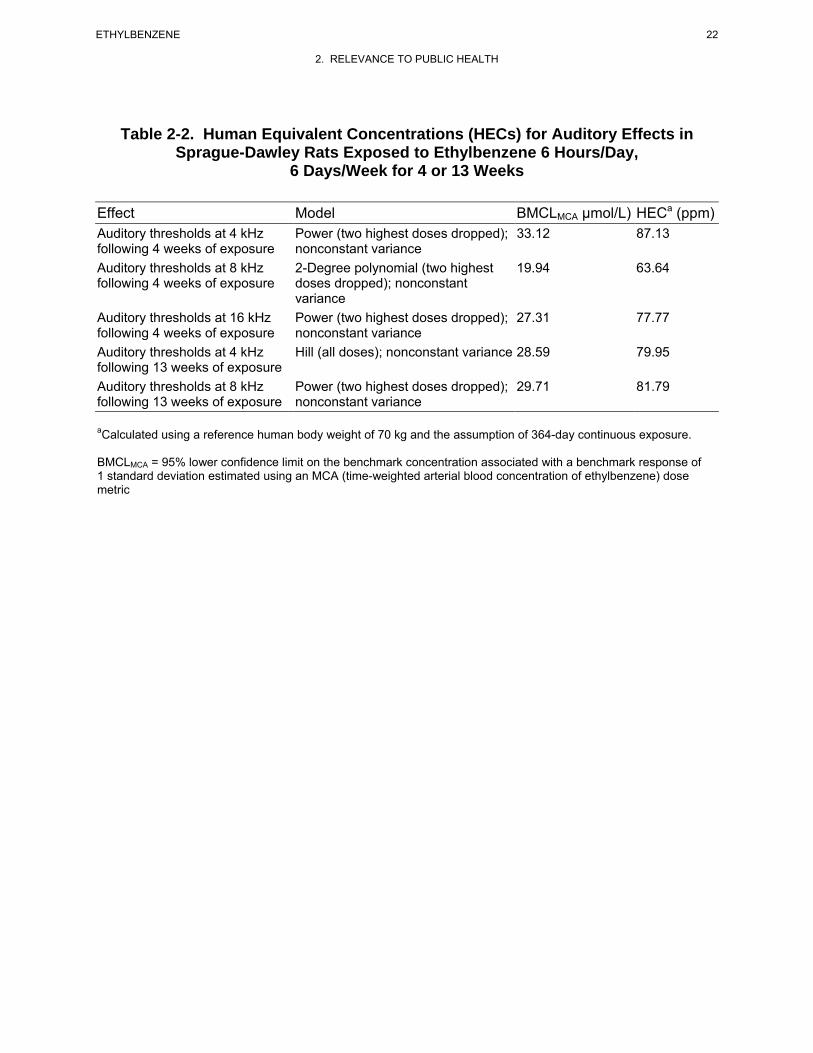
22 ETHYLBENZENE
2. RELEVANCE TO PUBLIC HEALTH
Table 2-2. Human Equivalent Concentrations (HECs) for Auditory Effects in Sprague-Dawley Rats Exposed to Ethylbenzene 6 Hours/Day,
6 Days/Week for 4 or 13 Weeks
Effect Model BMCLMCA µmol/L) HECa (ppm) Auditory thresholds at 4 kHz following 4 weeks of exposure Auditory thresholds at 8 kHz following 4 weeks of exposure
Auditory thresholds at 16 kHz following 4 weeks of exposure Auditory thresholds at 4 kHz following 13 weeks of exposure Auditory thresholds at 8 kHz following 13 weeks of exposure
Power (two highest doses dropped); 33.12 87.13 nonconstant variance 2-Degree polynomial (two highest 19.94 63.64 doses dropped); nonconstant variance Power (two highest doses dropped); 27.31 77.77 nonconstant variance Hill (all doses); nonconstant variance 28.59 79.95
Power (two highest doses dropped); 29.71 81.79 nonconstant variance
aCalculated using a reference human body weight of 70 kg and the assumption of 364-day continuous exposure.
BMCLMCA = 95% lower confidence limit on the benchmark concentration associated with a benchmark response of 1 standard deviation estimated using an MCA (time-weighted arterial blood concentration of ethylbenzene) dose metric
23 ETHYLBENZENE
2. RELEVANCE TO PUBLIC HEALTH
87.13 ppm; the lowest HEC of 63.64 ppm was selected as the point of departure for the MRL. This HEC
was divided by an uncertainty factor of 30 (3 for extrapolation from animals to humans with dosimetric
adjustments and 10 for human variability) resulting in an intermediate-duration inhalation MRL of 2 ppm.
• An MRL of 0.06 ppm has been derived for chronic-duration inhalation exposure (365 days or more) to ethylbenzene.
The chronic toxicity of inhaled ethylbenzene has been examined humans and in 2-year bioassays in rats
and mice (NTP 1999). Hematological effects (increased average number of lymphocytes and decreased
hemoglobin) were observed in workers exposed to solvents containing ethylbenzene (Angerer and Wulf
1985). In rats, concentration-related increases in the severity of nephropathy were observed in female rats
exposed to ≥75 ppm and in male rats exposed to 750 ppm (NTP 1999). Increases in the incidence of renal
tubule hyperplasia were also observed in male and female rats exposed to 750 ppm. The lowest LOAEL
identified in mice was 250 ppm for hyperplasia of pituitary gland pars distalis observed in females; at
750 ppm, thyroid follicular cell hyperplasia was observed in male and female mice and hypertrophy and
necrosis of the liver were observed in male mice (NTP 1999). These studies identify the kidney as a
sensitive target following chronic-duration inhalation exposure to ethylbenzene and the NTP (1999) rat
study was selected as the basis of the MRL.
In the NTP (1999) study, groups of male and female F344/N rats (50 animals/sex/dose group) were
exposed to 0, 75, 250, or 750 ppm ethylbenzene by inhalation 6 hours/day, 5 days/week, for 104 weeks.
Animals were observed twice daily and clinical findings were recorded monthly. Body weights were
measured throughout the study and a complete necropsy and microscopic examination of major tissues
and organs were performed on all rats. Survival of male rats in the 750 ppm group was significantly less
than that of the chamber controls. No clinical findings were attributed to ethylbenzene exposure.
Although the incidence of nephropathy (47/50, 43/50, 47/50, and 48/50 in males and 38/50, 42/50, 43/50,
46/49 in females) was not significantly different between the groups, significant increases in the severity
of the nephropathy were observed in females at ≥75 ppm and in males at 750 ppm. The nephropathy
severity scores in the 0, 75, 250, and 750 ppm groups were 2.3, 2.4, 2.3, and 3.5 in males, respectively,
and 1.3, 1.6, 1.7, and 2.3 in females, respectively. Additionally, a significant increase in the incidence of
renal tubule hyperplasia was observed in male rats exposed to 750 ppm. The incidences of renal tubule
adenoma and adenoma or carcinoma (combined) in the 750-ppm group were significantly greater than the
incidence in control animals. An increase in the incidence of cystic degeneration of the liver was also
observed in male rats at 750 ppm.
24 ETHYLBENZENE
2. RELEVANCE TO PUBLIC HEALTH
Increased severity of chronic progressive nephropathy observed in female rats exposed to ≥75 ppm (NTP
1999) was selected as the critical effect for the MRL. BMD analysis was considered for determining the
point of departure for the MRL; however, none of the available continuous exposure BMD models fit the
data (standard errors calculated using the raw severity score data). Thus, a NOAEL/LOAEL approach
was selected for calculating the point of departure; application of BMD analysis was precluded because
standard errors or standard deviations were not provided for the nephropathy severity ratings. A PBPK
model was developed (see Appendix A for details) to simulate two internal dose metrics for kidney
effects: time-averaged arterial blood concentration of ethylbenzene (MCA) and time-averaged rate of
metabolism of ethylbenzene expressed per kg body mass (MRAMKB). Both metrics were explored
because current knowledge of the mechanisms of toxicity of ethylbenzene does not include an
understanding of the relative contribution of parent compound or metabolites as proximate toxic agents in
kidney. The internal dose metrics (MCA and MRAMKB) for each exposure level are presented in
Table 2-3.
Human equivalent concentrations (HECs) corresponding to LOAELMCA and LOAELMRAMKB in female rats
was estimated using a human PBPK model (described in Appendix A). The HECs were 17.45 ppm for
the MCA dose metric and 52.68 ppm for the MRAMKB dose metric. Because there is limited
information to determine whether the observed renal toxicity in female rats exposed to ethylbenzene is
due to ethylbenzene or its metabolites, the lowest HEC value (17.45 ppm) was selected as the point of
departure for the MRL. The HECMCA of 17.45 ppm was divided by an uncertainty factor of 300 (10 for
the use of a LOAEL, 3 for extrapolation from animals to humans with dosimetric adjustments, and 10 for
human variability) resulting in a chronic-duration inhalation MRL of 0.06 ppm.
Oral MRLs
No studies describing acute-duration oral exposure of humans to ethylbenzene were found in the
literature. Two animal studies have examined the acute oral toxicity of ethylbenzene. An almost
complete loss of the three rows of OHCs in the organ of Corti were reported in male rats administered
900 mg/kg/day (the only dose tested) by gavage for 2 weeks (Gagnaire and Langlais 2005). These losses
were observed 10 days after the last dose. Although losses of OHCs have also been observed in acute-
duration inhalation studies (Cappaert et al. 1999, 2000, 2001, 2002), Gagnaire and Langlais (2005) did
not have a control group to establish the magnitude of the effects relative to unexposed animals; the study
was used to rank the ototoxicity of 21 solvents administered by gavage. Nevertheless, the OHC losses
observed in the ethylbenzene-treated animals were among the highest observed among the 21 organic
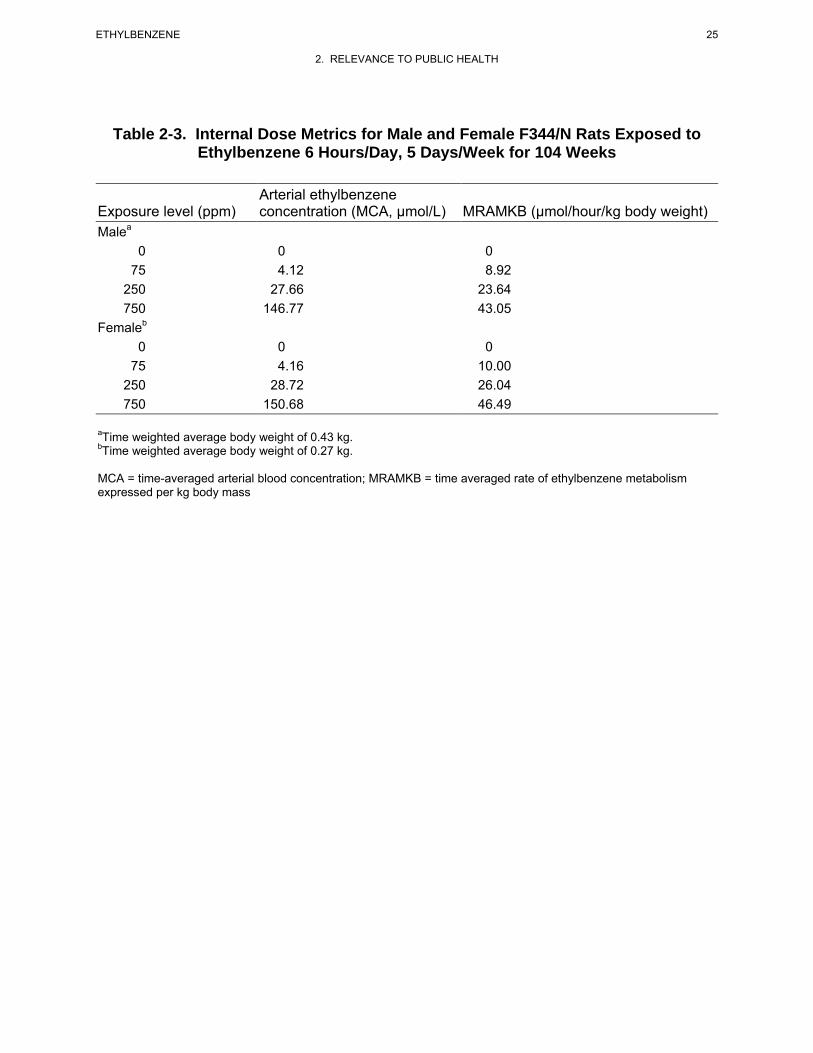
25 ETHYLBENZENE
2. RELEVANCE TO PUBLIC HEALTH
Table 2-3. Internal Dose Metrics for Male and Female F344/N Rats Exposed to Ethylbenzene 6 Hours/Day, 5 Days/Week for 104 Weeks
Arterial ethylbenzene Exposure level (ppm) concentration (MCA, µmol/L) MRAMKB (µmol/hour/kg body weight) Malea
0 0 0 75 4.12 8.92
250 27.66 23.64 750 146.77 43.05
Femaleb
0 0 0 75 4.16 10.00
250 28.72 26.04 750 150.68 46.49
aTime weighted average body weight of 0.43 kg.bTime weighted average body weight of 0.27 kg.
MCA = time-averaged arterial blood concentration; MRAMKB = time averaged rate of ethylbenzene metabolism expressed per kg body mass
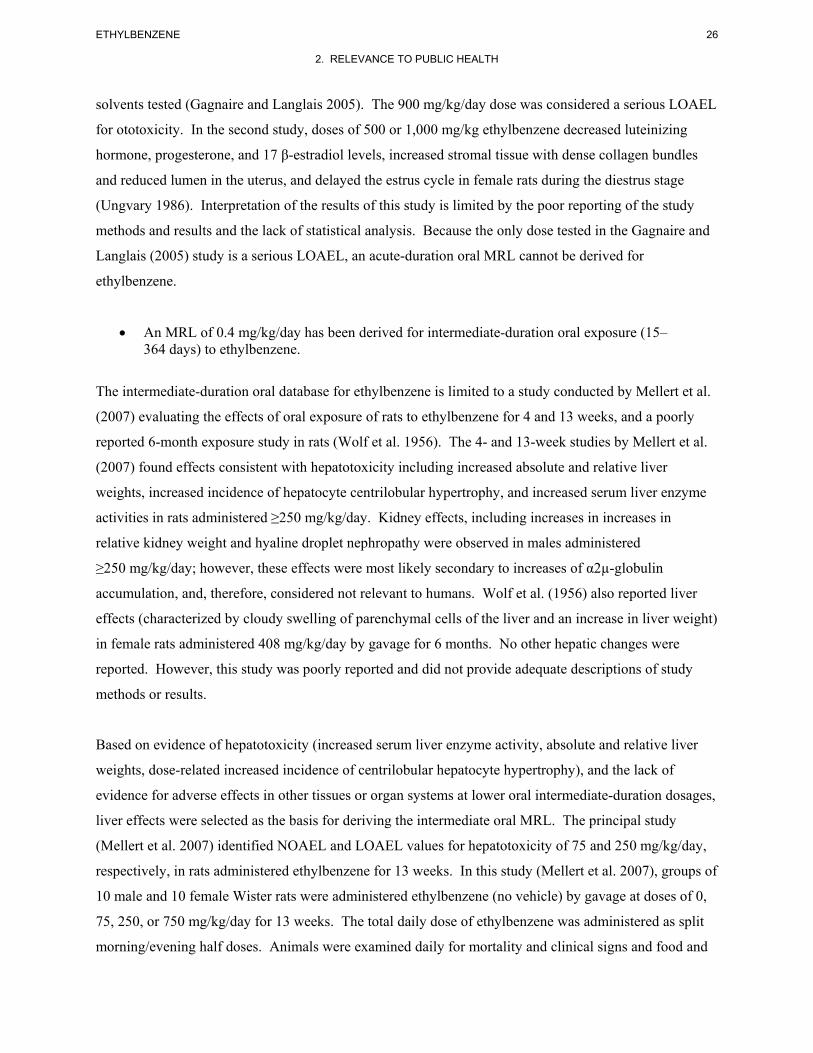
26 ETHYLBENZENE
2. RELEVANCE TO PUBLIC HEALTH
solvents tested (Gagnaire and Langlais 2005). The 900 mg/kg/day dose was considered a serious LOAEL
for ototoxicity. In the second study, doses of 500 or 1,000 mg/kg ethylbenzene decreased luteinizing
hormone, progesterone, and 17 β-estradiol levels, increased stromal tissue with dense collagen bundles
and reduced lumen in the uterus, and delayed the estrus cycle in female rats during the diestrus stage
(Ungvary 1986). Interpretation of the results of this study is limited by the poor reporting of the study
methods and results and the lack of statistical analysis. Because the only dose tested in the Gagnaire and
Langlais (2005) study is a serious LOAEL, an acute-duration oral MRL cannot be derived for
ethylbenzene.
• An MRL of 0.4 mg/kg/day has been derived for intermediate-duration oral exposure (15– 364 days) to ethylbenzene.
The intermediate-duration oral database for ethylbenzene is limited to a study conducted by Mellert et al.
(2007) evaluating the effects of oral exposure of rats to ethylbenzene for 4 and 13 weeks, and a poorly
reported 6-month exposure study in rats (Wolf et al. 1956). The 4- and 13-week studies by Mellert et al.
(2007) found effects consistent with hepatotoxicity including increased absolute and relative liver
weights, increased incidence of hepatocyte centrilobular hypertrophy, and increased serum liver enzyme
activities in rats administered ≥250 mg/kg/day. Kidney effects, including increases in increases in
relative kidney weight and hyaline droplet nephropathy were observed in males administered
≥250 mg/kg/day; however, these effects were most likely secondary to increases of α2µ-globulin
accumulation, and, therefore, considered not relevant to humans. Wolf et al. (1956) also reported liver
effects (characterized by cloudy swelling of parenchymal cells of the liver and an increase in liver weight)
in female rats administered 408 mg/kg/day by gavage for 6 months. No other hepatic changes were
reported. However, this study was poorly reported and did not provide adequate descriptions of study
methods or results.
Based on evidence of hepatotoxicity (increased serum liver enzyme activity, absolute and relative liver
weights, dose-related increased incidence of centrilobular hepatocyte hypertrophy), and the lack of
evidence for adverse effects in other tissues or organ systems at lower oral intermediate-duration dosages,
liver effects were selected as the basis for deriving the intermediate oral MRL. The principal study
(Mellert et al. 2007) identified NOAEL and LOAEL values for hepatotoxicity of 75 and 250 mg/kg/day,
respectively, in rats administered ethylbenzene for 13 weeks. In this study (Mellert et al. 2007), groups of
10 male and 10 female Wister rats were administered ethylbenzene (no vehicle) by gavage at doses of 0,
75, 250, or 750 mg/kg/day for 13 weeks. The total daily dose of ethylbenzene was administered as split
morning/evening half doses. Animals were examined daily for mortality and clinical signs and food and
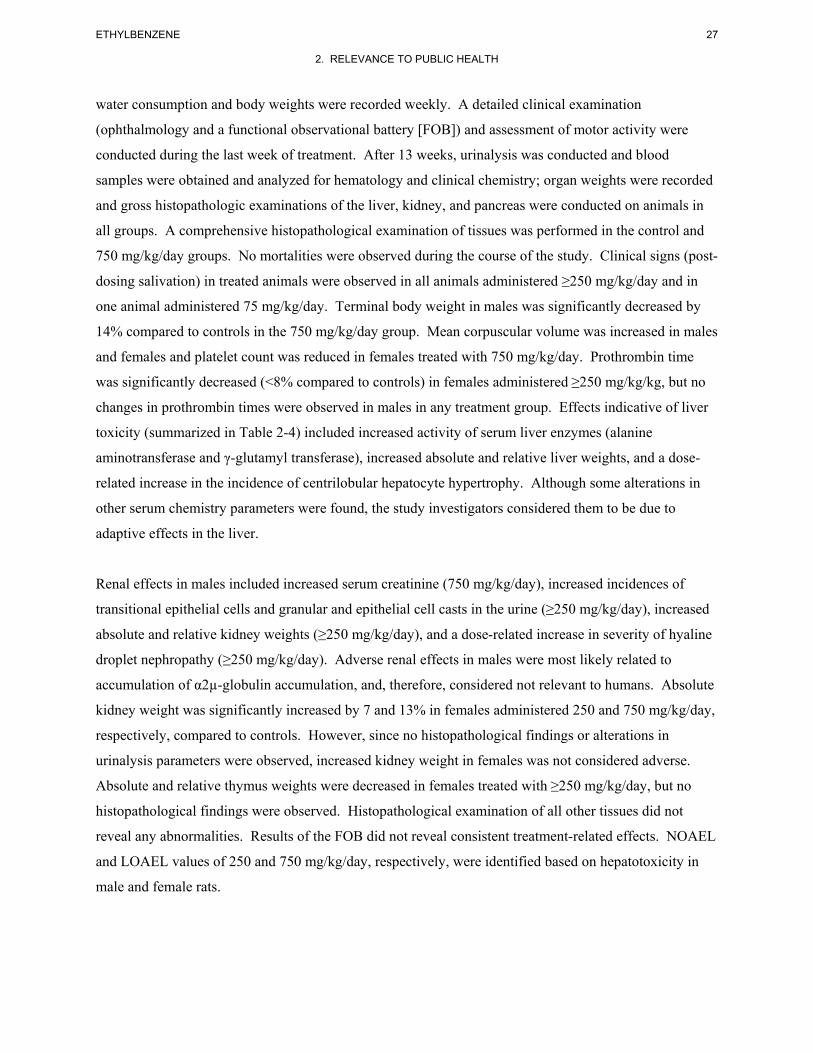
27 ETHYLBENZENE
2. RELEVANCE TO PUBLIC HEALTH
water consumption and body weights were recorded weekly. A detailed clinical examination
(ophthalmology and a functional observational battery [FOB]) and assessment of motor activity were
conducted during the last week of treatment. After 13 weeks, urinalysis was conducted and blood
samples were obtained and analyzed for hematology and clinical chemistry; organ weights were recorded
and gross histopathologic examinations of the liver, kidney, and pancreas were conducted on animals in
all groups. A comprehensive histopathological examination of tissues was performed in the control and
750 mg/kg/day groups. No mortalities were observed during the course of the study. Clinical signs (post-
dosing salivation) in treated animals were observed in all animals administered ≥250 mg/kg/day and in
one animal administered 75 mg/kg/day. Terminal body weight in males was significantly decreased by
14% compared to controls in the 750 mg/kg/day group. Mean corpuscular volume was increased in males
and females and platelet count was reduced in females treated with 750 mg/kg/day. Prothrombin time
was significantly decreased (<8% compared to controls) in females administered ≥250 mg/kg/kg, but no
changes in prothrombin times were observed in males in any treatment group. Effects indicative of liver
toxicity (summarized in Table 2-4) included increased activity of serum liver enzymes (alanine
aminotransferase and γ-glutamyl transferase), increased absolute and relative liver weights, and a dose-
related increase in the incidence of centrilobular hepatocyte hypertrophy. Although some alterations in
other serum chemistry parameters were found, the study investigators considered them to be due to
adaptive effects in the liver.
Renal effects in males included increased serum creatinine (750 mg/kg/day), increased incidences of
transitional epithelial cells and granular and epithelial cell casts in the urine (≥250 mg/kg/day), increased
absolute and relative kidney weights (≥250 mg/kg/day), and a dose-related increase in severity of hyaline
droplet nephropathy (≥250 mg/kg/day). Adverse renal effects in males were most likely related to
accumulation of α2µ-globulin accumulation, and, therefore, considered not relevant to humans. Absolute
kidney weight was significantly increased by 7 and 13% in females administered 250 and 750 mg/kg/day,
respectively, compared to controls. However, since no histopathological findings or alterations in
urinalysis parameters were observed, increased kidney weight in females was not considered adverse.
Absolute and relative thymus weights were decreased in females treated with ≥250 mg/kg/day, but no
histopathological findings were observed. Histopathological examination of all other tissues did not
reveal any abnormalities. Results of the FOB did not reveal consistent treatment-related effects. NOAEL
and LOAEL values of 250 and 750 mg/kg/day, respectively, were identified based on hepatotoxicity in
male and female rats.
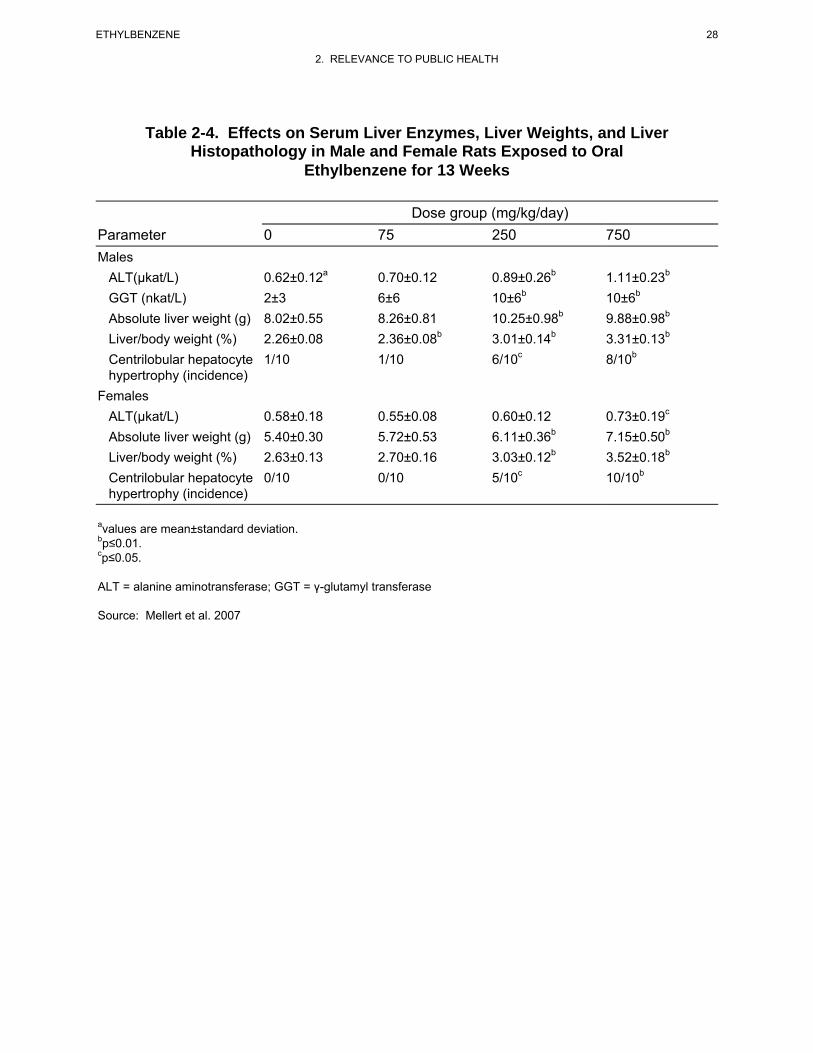
28 ETHYLBENZENE
2. RELEVANCE TO PUBLIC HEALTH
Table 2-4. Effects on Serum Liver Enzymes, Liver Weights, and Liver Histopathology in Male and Female Rats Exposed to Oral
Ethylbenzene for 13 Weeks
Dose group (mg/kg/day) Parameter 0 75 250 750 Males
ALT(µkat/L) 0.62±0.12a 0.70±0.12 0.89±0.26b 1.11±0.23b
GGT (nkat/L) 2±3 6±6 10±6b 10±6b
Absolute liver weight (g) 8.02±0.55 8.26±0.81 10.25±0.98b 9.88±0.98b
Liver/body weight (%) 2.26±0.08 2.36±0.08b 3.01±0.14b 3.31±0.13b
Centrilobular hepatocyte 1/10 1/10 6/10c 8/10b
hypertrophy (incidence) Females
ALT(µkat/L) 0.58±0.18 0.55±0.08 0.60±0.12 0.73±0.19c
Absolute liver weight (g) 5.40±0.30 5.72±0.53 6.11±0.36b 7.15±0.50b
Liver/body weight (%) 2.63±0.13 2.70±0.16 3.03±0.12b 3.52±0.18b
Centrilobular hepatocyte 0/10 0/10 5/10c 10/10b
hypertrophy (incidence)
avalues are mean±standard deviation. bp≤0.01. cp≤0.05.
ALT = alanine aminotransferase; GGT = γ-glutamyl transferase
Source: Mellert et al. 2007
29 ETHYLBENZENE
2. RELEVANCE TO PUBLIC HEALTH
Based on evidence of hepatotoxicity (increased serum liver enzyme activity, absolute and relative liver
weights, and incidence of centrilobular hepatocyte hypertrophy), the liver was identified as the most
sensitive target for oral ethylbenzene, with NOAEL and LOAEL values of 75 and 250 mg/kg/day,
respectively. Since serum liver enzyme activities were increased in the 250 and 750 mg/kg/day groups in
males, but only in the 750 mg/kg/day group in females, males appeared more sensitive than females to
hepatic effects of oral ethylbenzene.
To determine the point of departure for derivation of the intermediate-duration MRL, data sets for serum
liver enzymes (alanine aminotransferase and γ-glutamyl transferase), absolute liver weight, relative liver
weight, and centrilobular hepatocyte hypertrophy in male rats were evaluated for suitability for BMD
modeling using EPA’s BMDS (version 2.1.1). A PBPK model was developed to simulate two internal
dose metrics for liver effects: time-averaged concentration of ethylbenzene in liver (MCL) and time-
averaged rate of metabolism of ethylbenzene in liver (MRAMKL). The assumption of using the MCL
metric is that the liver response is correlated with the time-averaged concentration of ethylbenzene in
liver. The assumption in using the MRAMKL metric is that the liver response is correlated with the time-
averaged rate of production of ethylbenzene metabolites in liver. Both metrics were explored because
current knowledge of the mechanism of toxicity of ethylbenzene does not include an understanding of the
relative contributions of parent compound or metabolites as proximate toxic agents in liver. Detailed
discussions of the BMD modeling and PBPK model are presented in Appendix A.
Using the MCL and MRAMKL dose metrics, data for alanine aminotransferase, γ-glutamyl transferase,
absolute liver weight, and relative liver weight were analyzed using all available continuous variable
BMD models and a BMR of 1 standard deviation change from control and incidence data for centrilobular
hepatocyte hypertrophy were analyzed using all available dichotomous BMD models and the extra risk
option with a BMR of 10% extra risk. The BMD analysis identified nine BMDL values that could be
used as the point of departure for the intermediate-duration oral MRL; these values are presented in
Tables 2-5 and 2-6. For each end point and dose metric, human equivalent doses (HEDs) were estimated
from the BMDL value using the human PBPK model (discussed in Appendix A); the HEDs are
summarized in Tables 2-5 and 2-6.
The lowest HEDs were calculated from the BMDLMCL and BMDLMRAMKL for centrilobular hepatocyte
hypertrophy. Because there is limited information to determine whether the observed hepatic effects are
due to ethylbenzene or its metabolites, the lowest HED value (10.68 mg/kg/day) was selected as the point
of departure for the MRL. The HED was divided by an uncertainty factor of 30 (3 for extrapolation from
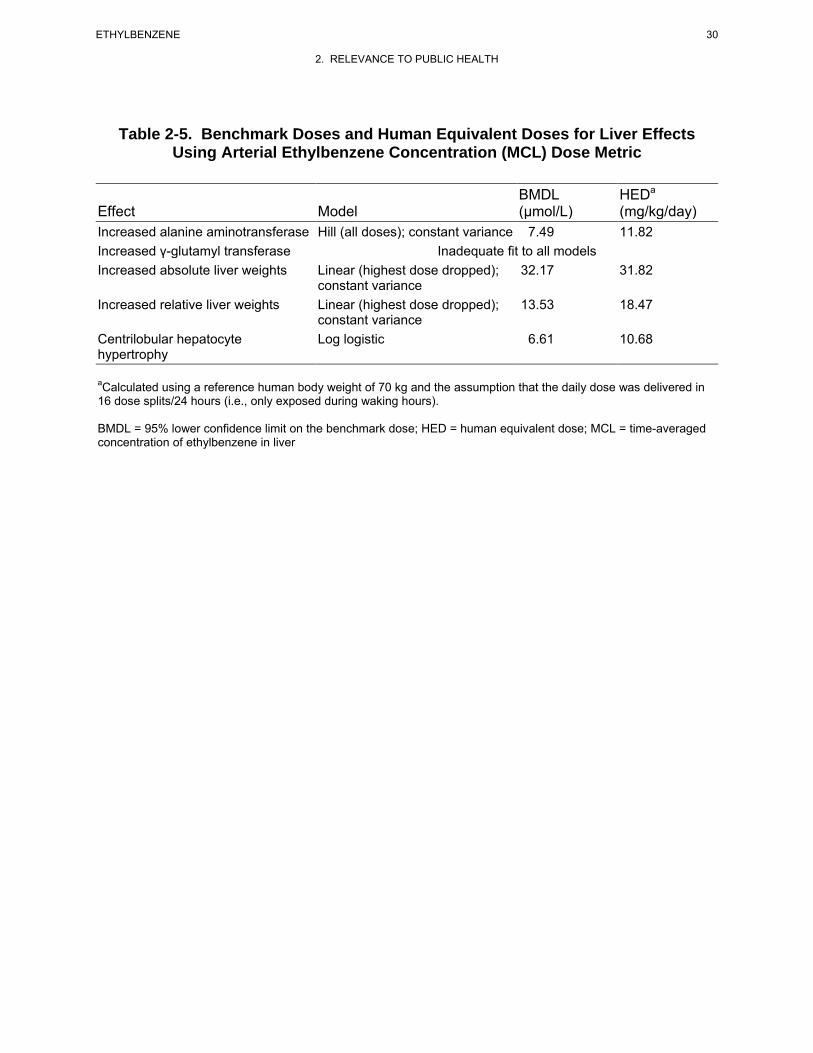
30 ETHYLBENZENE
2. RELEVANCE TO PUBLIC HEALTH
Table 2-5. Benchmark Doses and Human Equivalent Doses for Liver Effects Using Arterial Ethylbenzene Concentration (MCL) Dose Metric
BMDL HEDa
Effect Model (µmol/L) (mg/kg/day) Increased alanine aminotransferase Hill (all doses); constant variance 7.49 11.82 Increased γ-glutamyl transferase Inadequate fit to all models Increased absolute liver weights Linear (highest dose dropped); 32.17 31.82
constant variance Increased relative liver weights Linear (highest dose dropped); 13.53 18.47
constant variance Centrilobular hepatocyte Log logistic 6.61 10.68 hypertrophy
aCalculated using a reference human body weight of 70 kg and the assumption that the daily dose was delivered in 16 dose splits/24 hours (i.e., only exposed during waking hours).
BMDL = 95% lower confidence limit on the benchmark dose; HED = human equivalent dose; MCL = time-averaged concentration of ethylbenzene in liver
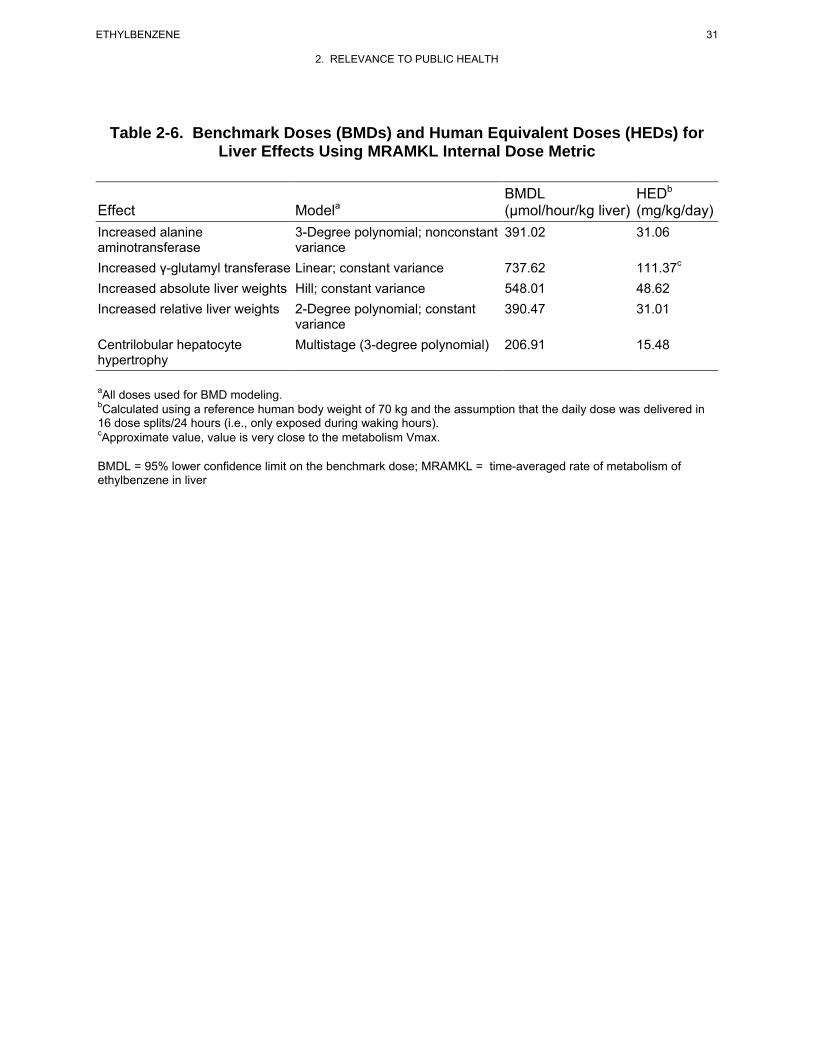
31 ETHYLBENZENE
2. RELEVANCE TO PUBLIC HEALTH
Table 2-6. Benchmark Doses (BMDs) and Human Equivalent Doses (HEDs) for Liver Effects Using MRAMKL Internal Dose Metric
BMDL HEDb
Effect Modela (µmol/hour/kg liver) (mg/kg/day) Increased alanine 3-Degree polynomial; nonconstant 391.02 31.06 aminotransferase variance Increased γ-glutamyl transferase Linear; constant variance 737.62 111.37c
Increased absolute liver weights Hill; constant variance 548.01 48.62 Increased relative liver weights 2-Degree polynomial; constant 390.47 31.01
variance Centrilobular hepatocyte Multistage (3-degree polynomial) 206.91 15.48 hypertrophy
aAll doses used for BMD modeling.bCalculated using a reference human body weight of 70 kg and the assumption that the daily dose was delivered in 16 dose splits/24 hours (i.e., only exposed during waking hours). cApproximate value, value is very close to the metabolism Vmax.
BMDL = 95% lower confidence limit on the benchmark dose; MRAMKL = time-averaged rate of metabolism of ethylbenzene in liver
32 ETHYLBENZENE
2. RELEVANCE TO PUBLIC HEALTH
animals to humans using dosimetric adjustments and 10 for human variability), resulting in an
intermediate-duration oral MRL of 0.4 mg/kg/day.
No studies describing the non-carcinogenic effects of chronic-duration oral exposure to ethylbenzene in
humans were located. Available chronic-duration oral exposure studies in animals (Maltoni et al. 1985,
1997) did not evaluate comprehensive noncancer end points and, therefore, do not provide suitable data
for derivation of a chronic-duration oral MRL.
33 ETHYLBENZENE
3. HEALTH EFFECTS
3.1 INTRODUCTION
The primary purpose of this chapter is to provide public health officials, physicians, toxicologists, and
other interested individuals and groups with an overall perspective on the toxicology of ethylbenzene. It
contains descriptions and evaluations of toxicological studies and epidemiological investigations and
provides conclusions, where possible, on the relevance of toxicity and toxicokinetic data to public health.
A glossary and list of acronyms, abbreviations, and symbols can be found at the end of this profile.
3.2 DISCUSSION OF HEALTH EFFECTS BY ROUTE OF EXPOSURE
To help public health professionals and others address the needs of persons living or working near
hazardous waste sites, the information in this section is organized first by route of exposure (inhalation,
oral, and dermal) and then by health effect (death, systemic, immunological, neurological, reproductive,
developmental, genotoxic, and carcinogenic effects). These data are discussed in terms of three exposure
periods: acute (14 days or less), intermediate (15–364 days), and chronic (365 days or more).
Levels of significant exposure for each route and duration are presented in tables and illustrated in
figures. The points in the figures showing no-observed-adverse-effect levels (NOAELs) or lowest-
observed-adverse-effect levels (LOAELs) reflect the actual doses (levels of exposure) used in the studies.
LOAELs have been classified into "less serious" or "serious" effects. "Serious" effects are those that
evoke failure in a biological system and can lead to morbidity or mortality (e.g., acute respiratory distress
or death). "Less serious" effects are those that are not expected to cause significant dysfunction or death,
or those whose significance to the organism is not entirely clear. ATSDR acknowledges that a
considerable amount of judgment may be required in establishing whether an end point should be
classified as a NOAEL, "less serious" LOAEL, or "serious" LOAEL, and that in some cases, there will be
insufficient data to decide whether the effect is indicative of significant dysfunction. However, the
Agency has established guidelines and policies that are used to classify these end points. ATSDR
believes that there is sufficient merit in this approach to warrant an attempt at distinguishing between
"less serious" and "serious" effects. The distinction between "less serious" effects and "serious" effects is
considered to be important because it helps the users of the profiles to identify levels of exposure at which
major health effects start to appear. LOAELs or NOAELs should also help in determining whether or not
34 ETHYLBENZENE
3. HEALTH EFFECTS
the effects vary with dose and/or duration, and place into perspective the possible significance of these
effects to human health.
The significance of the exposure levels shown in the Levels of Significant Exposure (LSE) tables and
figures may differ depending on the user's perspective. Public health officials and others concerned with
appropriate actions to take at hazardous waste sites may want information on levels of exposure
associated with more subtle effects in humans or animals (LOAELs) or exposure levels below which no
adverse effects (NOAELs) have been observed. Estimates of levels posing minimal risk to humans
(Minimal Risk Levels or MRLs) may be of interest to health professionals and citizens alike.
A User's Guide has been provided at the end of this profile (see Appendix B). This guide should aid in
the interpretation of the tables and figures for Levels of Significant Exposure and the MRLs.
3.2.1 Inhalation Exposure 3.2.1.1 Death
No studies were located regarding lethality in humans following inhalation exposure to ethylbenzene.
Matsumoto et al. (1992) reported the case of a 44-year-old man who died 9 days after exposure to
gasoline vapors for at least 10 hours in an enclosed car. The patient’s clothing was saturated with
gasoline, but there was no apparent ingestion of gasoline. The patient suffered chemical burns over 50%
of the total body surface area, and the cause of death was reported as multiple organ failure. Ethyl-
benzene was detected in the patient’s blood (estimated initial blood concentration of 2.6 µg/mL).
However, since gasoline contains approximately 1.4% (by weight) ethylbenzene (Agency for Toxic
Substances and Disease Registry 1995), it is unlikely that death was due to ethylbenzene exposure.
Studies on the lethality of inhaled ethylbenzene have been conducted using several animal models, with
exposure times ranging from a few hours to 2 years. The LC50 values obtained from acute inhalation
exposure studies were 13,367 ppm following a 2-hour exposure (Ivanov 1962) and 4,000 ppm following a
4-hour exposure (Smyth et al. 1962); 100% mortality was observed following exposure to 16,698 ppm for
2 hours (Ivanov 1962) and exposure to 8,000 ppm for 4 hours (Smyth et al. 1962). Inhalation exposure of
Fischer 344 rats and B6C3F1 mice to ethylbenzene for 6 hours/day for 4 days produced lethality at
concentrations of 1,200 and 2,400 ppm, respectively, although exposure to concentrations up to
2,400 ppm was not lethal to rabbits (Ethylbenzene Producers Association 1986a). In intermediate-
duration exposure studies, inhalation exposure of rats and mice to 782 ppm or rabbits to 1,610 ppm
35 ETHYLBENZENE
3. HEALTH EFFECTS
ethylbenzene for 4 weeks did not produce lethality (Cragg et al. 1989). No mortality was observed in rats
or mice exposed to 782 ppm or rabbits exposed to 1,610 ppm ethylbenzene for 4 weeks (Cragg et al.
1989) or in rats or mice exposed to 975 ppm ethylbenzene for 90 days (NTP 1992). Survival of male rats,
but not female rats or male or female mice, exposed to 750 ppm ethylbenzene for 2 years was
significantly decreased (NTP 1999); survival in male rats exposed to 75 or 250 ppm ethylbenzene was not
affected.
The LC50 values and all reliable LOAEL values for death in rats and mice following acute- or chronic-
duration exposure are recorded in Table 3-1 and plotted in Figure 3-1.
3.2.1.2 Systemic Effects
Little data are available on the systemic effects of inhaled ethylbenzene in humans. Most of the
information available is from case reports in which quantitative data on exposure concentrations and
durations were not reported. In addition, most of the available studies have confounding factors (e.g.,
simultaneous exposures to other toxic substances) and insufficient reporting of important study details. In
general, the systemic effects observed in humans were respiratory tract and ocular irritation, and possible
ototoxicity (hearing loss) and hematological alterations (increased lymphocyte counts and decreased
hemoglobin concentration) (Angerer and Wulf 1985; Cometto-Muñiz and Cain 1995; Thienes and Haley
1972; Yant et al. 1930).
Several studies were located on the systemic effects of ethylbenzene in animals following inhalation
exposure. Acute- and intermediate-duration exposure to inhaled ethylbenzene is associated with
respiratory irritation, changes to the liver (increased organ weights and induction of microsomal
enzymes), and effects on the hematological system (decreased platelets and increased leukocyte counts).
Chronic exposure is associated with adverse effects to the liver (necrosis and hypertrophy), kidney
(nephropathy and hyperplasia), and endocrine system (thyroid and pituitary hyperplasia).
No studies were located describing cardiovascular, gastrointestinal, musculoskeletal, renal, endocrine,
dermal, body weight, or metabolic effects in humans, or dermal effects in animals after inhalation
exposure to ethylbenzene.
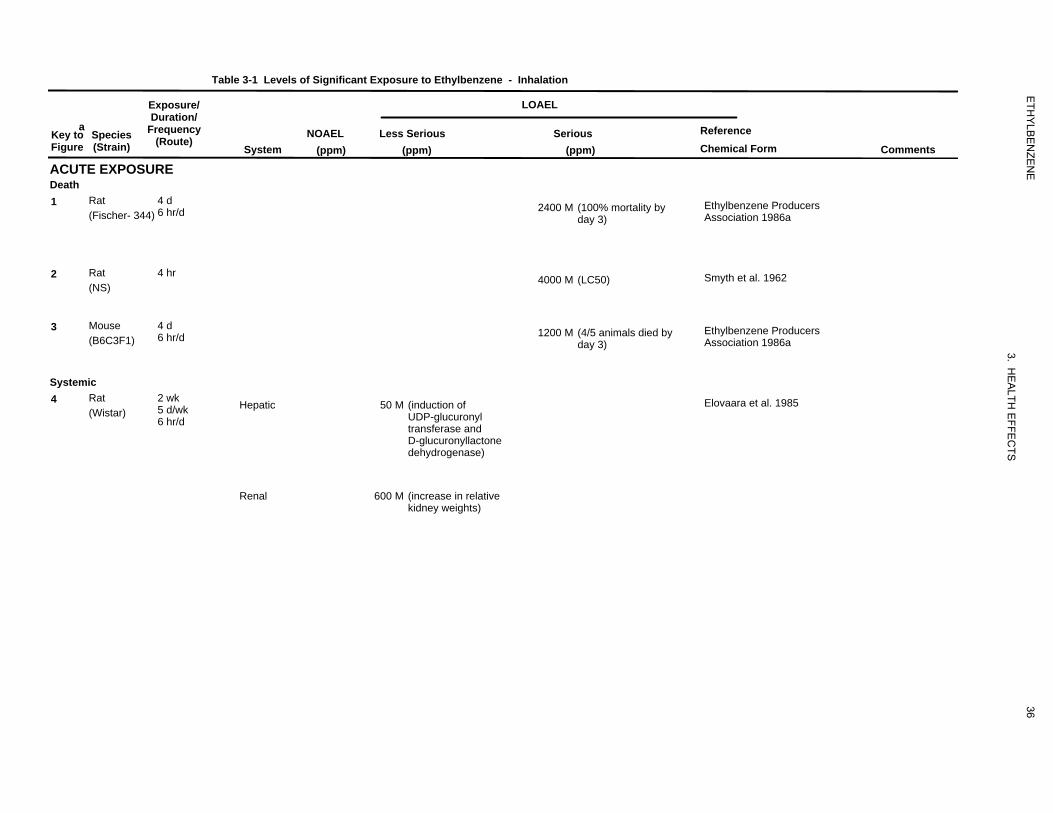
5132400
63
4000
5141200
52050
600
ETH
YLB
EN
ZEN
E
3. HE
ALTH
EFFE
CTS
Table 3-1 Levels of Significant Exposure to Ethylbenzene - Inhalation
a Key to Figure
Species (Strain)
Exposure/ Duration/
Frequency (Route)
ACUTE EXPOSURE Death 1 Rat
(Fischer- 344) 4 d 6 hr/d
System NOAEL
(ppm) Less Serious
(ppm)
LOAEL
Serious (ppm)
2400 M (100% mortality by day 3)
Reference Chemical Form
Ethylbenzene Producers Association 1986a
Comments
2 Rat (NS)
4 hr 4000 M (LC50) Smyth et al. 1962
3 Mouse (B6C3F1)
4 d 6 hr/d 1200 M (4/5 animals died by
day 3) Ethylbenzene Producers Association 1986a
Systemic 4 Rat
(Wistar) 2 wk 5 d/wk 6 hr/d
Hepatic 50 M (induction of UDP-glucuronyl transferase and D-glucuronyllactone dehydrogenase)
Elovaara et al. 1985
Renal 600 M (increase in relative kidney weights)
36
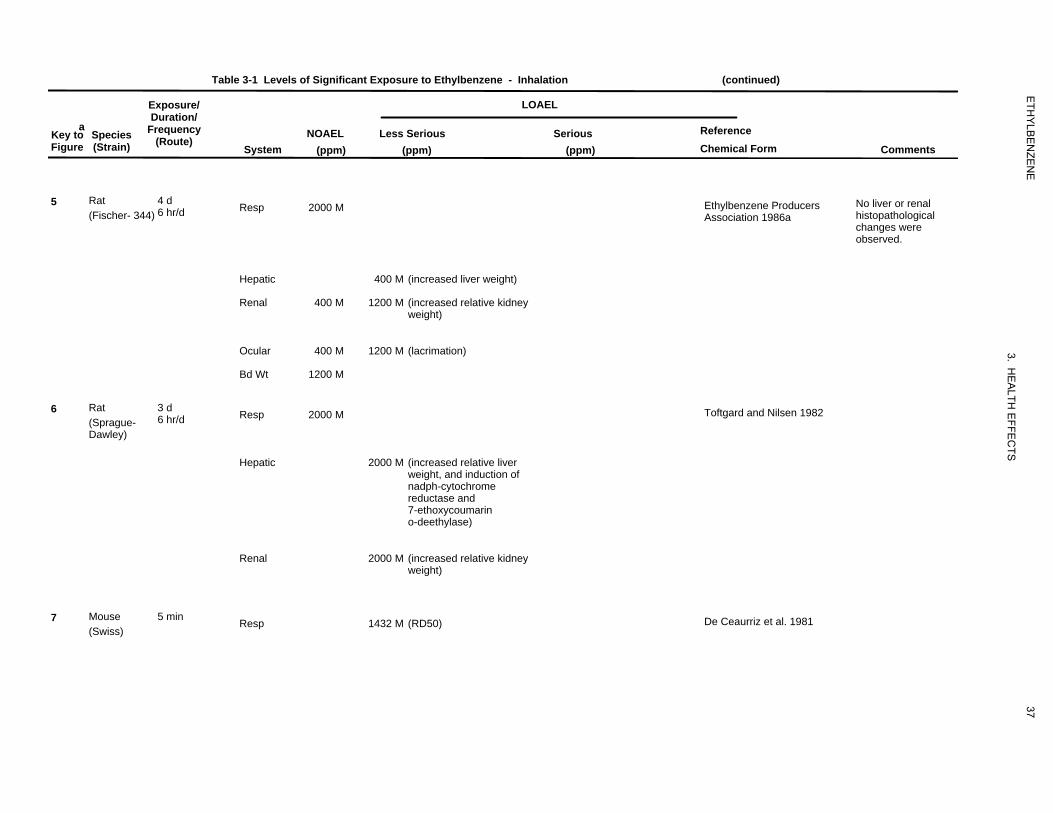
59
2000
400
400
1200
400 1200
1200
3
2000
2000
2000
4
1432
ETH
YLB
EN
ZEN
E
3. HE
ALTH
EFFE
CTS
Table 3-1 Levels of Significant Exposure to Ethylbenzene - Inhalation (continued)
a Key to Figure
Species (Strain)
Exposure/ Duration/
Frequency (Route)
System NOAEL
(ppm) Less Serious
(ppm)
LOAEL
Serious (ppm)
Reference Chemical Form Comments
5 Rat (Fischer- 344)
4 d 6 hr/d Resp 2000 M Ethylbenzene Producers
Association 1986a No liver or renal histopathological changes were observed.
Hepatic 400 M (increased liver weight)
Renal 400 M 1200 M (increased relative kidney weight)
Ocular 400 M 1200 M (lacrimation)
Bd Wt 1200 M
6 Rat (Sprague-Dawley)
3 d 6 hr/d Resp 2000 M Toftgard and Nilsen 1982
Hepatic 2000 M (increased relative liver weight, and induction of nadph-cytochrome reductase and 7-ethoxycoumarin o-deethylase)
Renal 2000 M (increased relative kidney weight)
7 Mouse (Swiss)
5 min Resp 1432 M (RD50) De Ceaurriz et al. 1981
37
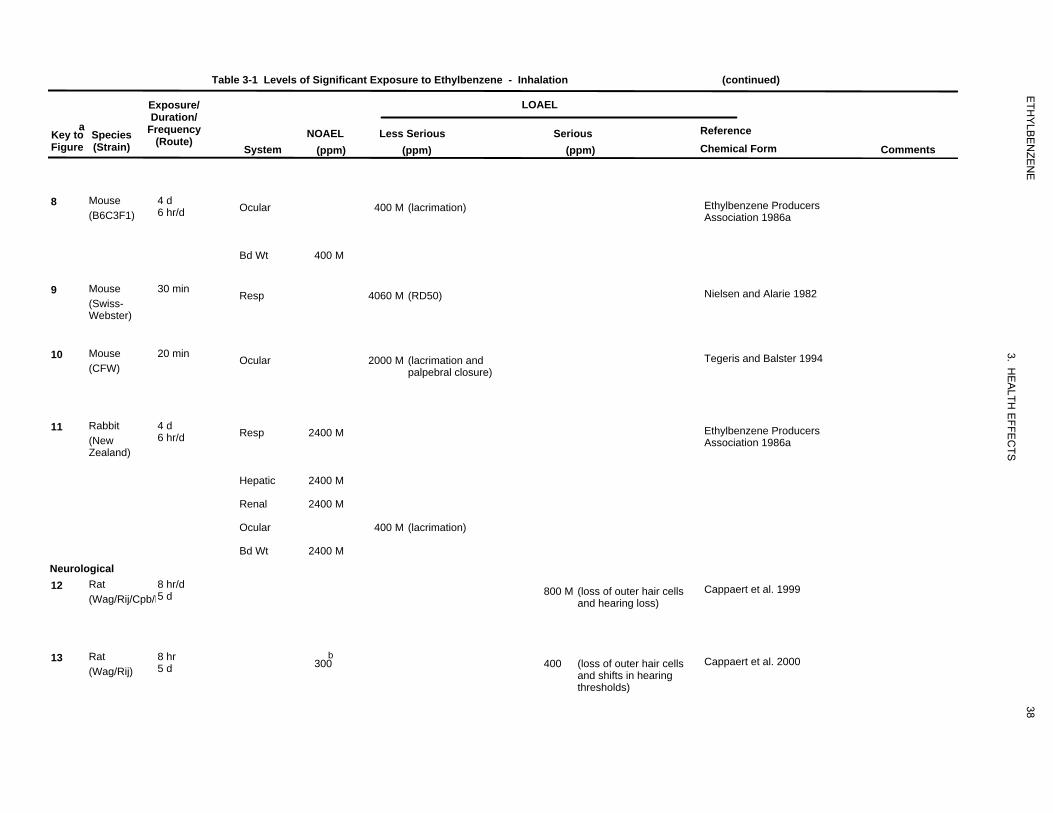
57
400
400
48
4060
4332000
60
2400
2400
2400
400
2400
954800
953
300
400
ETH
YLB
EN
ZEN
E
3. HE
ALTH
EFFE
CTS
Table 3-1 Levels of Significant Exposure to Ethylbenzene - Inhalation (continued)
a Key to Figure
Species (Strain)
Exposure/ Duration/
Frequency (Route)
System NOAEL
(ppm) Less Serious
(ppm)
LOAEL
Serious (ppm)
Reference Chemical Form Comments
8 Mouse (B6C3F1)
4 d 6 hr/d Ocular 400 M (lacrimation) Ethylbenzene Producers
Association 1986a
Bd Wt 400 M
9 Mouse (Swiss-Webster)
30 min Resp 4060 M (RD50) Nielsen and Alarie 1982
10 Mouse (CFW)
20 min Ocular 2000 M (lacrimation and palpebral closure)
Tegeris and Balster 1994
11 Rabbit (New Zealand)
4 d 6 hr/d
Neurological 12 Rat
(Wag/Rij/Cpb/H 8 hr/d 5 d
Resp
Hepatic
Renal
Ocular
Bd Wt
2400 M
2400 M
2400 M
2400 M
400 M (lacrimation)
800 M (loss of outer hair cells and hearing loss)
Ethylbenzene Producers Association 1986a
Cappaert et al. 1999
13 Rat (Wag/Rij)
8 hr 5 d
b 300 400 (loss of outer hair cells
and shifts in hearing thresholds)
Cappaert et al. 2000
38
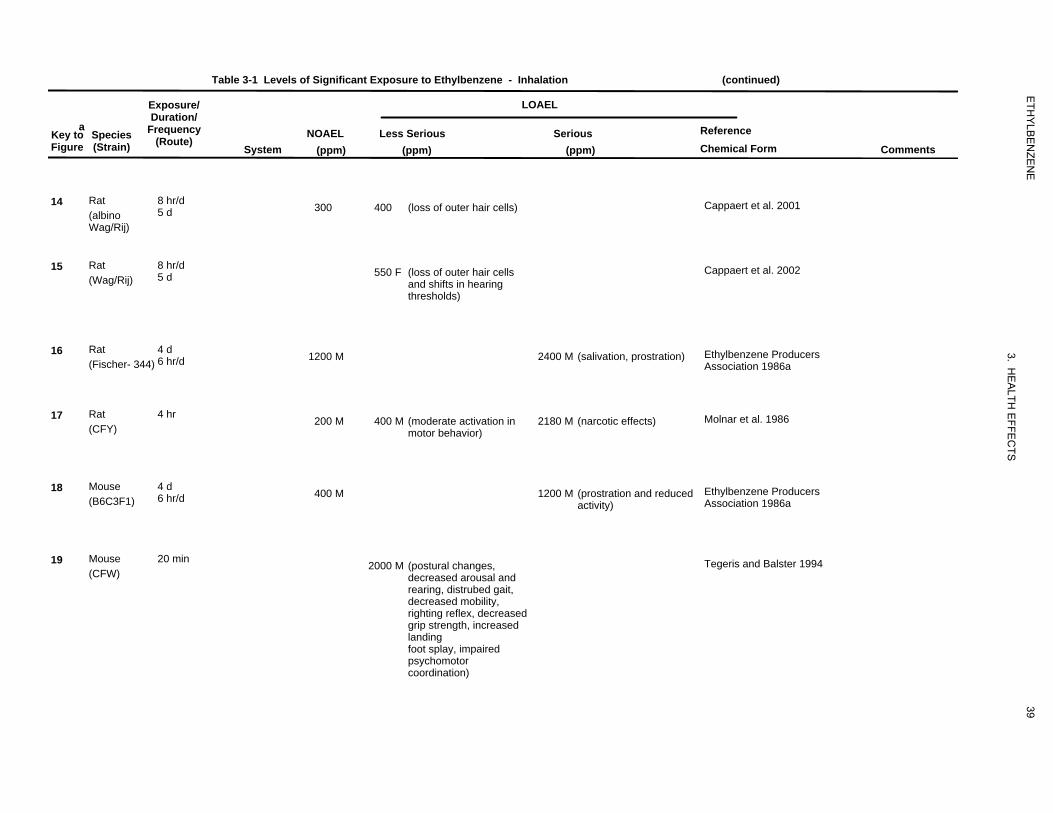
968
300 400
955550
516
1200 2400
2
200
400
2180
517
400
1200
4342000
ETH
YLB
EN
ZEN
E
3. HE
ALTH
EFFE
CTS
Table 3-1 Levels of Significant Exposure to Ethylbenzene - Inhalation (continued)
a Key to Figure
Species (Strain)
Exposure/ Duration/
Frequency (Route)
System NOAEL
(ppm)
LOAEL
Less Serious (ppm)
Serious (ppm)
Reference Chemical Form Comments
14 Rat (albino Wag/Rij)
8 hr/d 5 d 300 Cappaert et al. 2001400 (loss of outer hair cells)
15 Rat (Wag/Rij)
8 hr/d 5 d Cappaert et al. 2002550 F (loss of outer hair cells
and shifts in hearing thresholds)
16 Rat (Fischer- 344)
4 d 6 hr/d 1200 M Ethylbenzene Producers
Association 1986a 2400 M (salivation, prostration)
17 Rat (CFY)
4 hr 200 M Molnar et al. 1986400 M (moderate activation in motor behavior)
2180 M (narcotic effects)
18 Mouse (B6C3F1)
4 d 6 hr/d 400 M Ethylbenzene Producers
Association 1986a 1200 M (prostration and reduced
activity)
19 Mouse (CFW)
20 min Tegeris and Balster 19942000 M (postural changes, decreased arousal and rearing, distrubed gait, decreased mobility, righting reflex, decreased grip strength, increased landing foot splay, impaired psychomotor coordination)
39
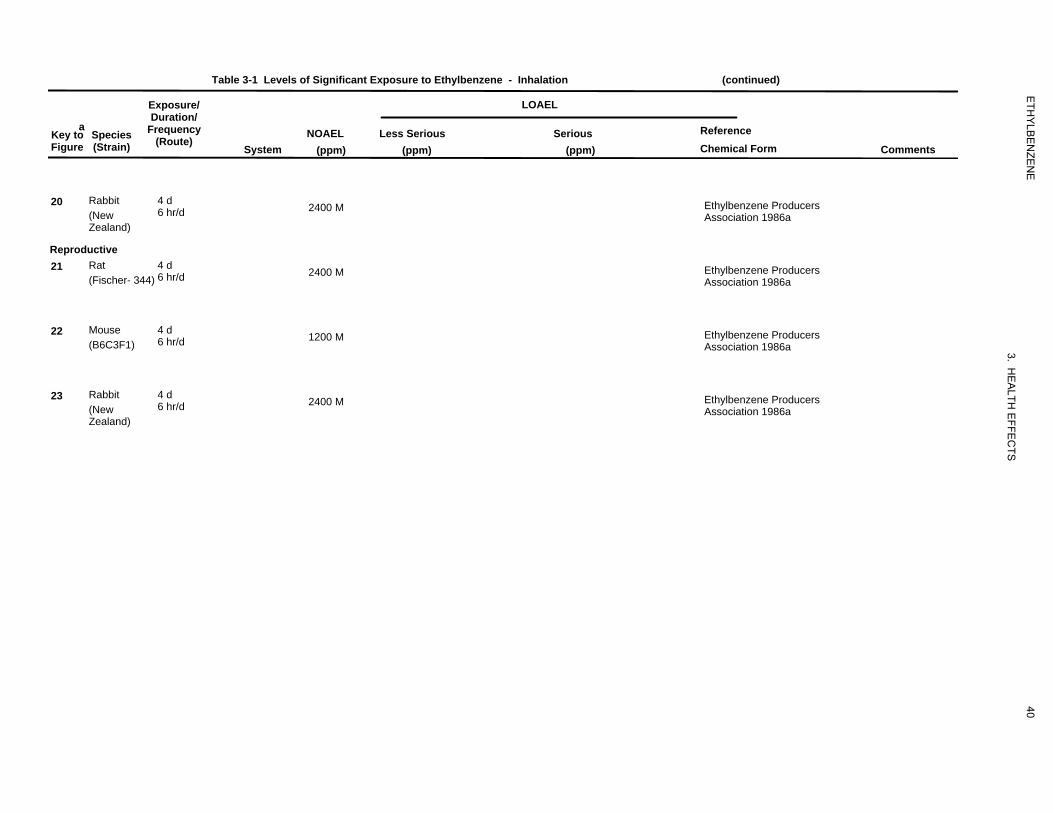
455
2400
456
2400
457
1200
458
2400
ETH
YLB
EN
ZEN
E
3. HE
ALTH
EFFE
CTS
Table 3-1 Levels of Significant Exposure to Ethylbenzene - Inhalation (continued)
a Key to Figure
Species (Strain)
Exposure/ Duration/
Frequency (Route)
System NOAEL
(ppm) Less Serious
(ppm)
LOAEL
Serious (ppm)
Reference Chemical Form Comments
20 Rabbit (New Zealand)
4 d 6 hr/d
Reproductive 21 Rat
(Fischer- 344) 4 d 6 hr/d
2400 M
2400 M
Ethylbenzene Producers Association 1986a
Ethylbenzene Producers Association 1986a
22 Mouse (B6C3F1)
4 d 6 hr/d 1200 M Ethylbenzene Producers
Association 1986a
23 Rabbit (New Zealand)
4 d 6 hr/d 2400 M Ethylbenzene Producers
Association 1986a
40
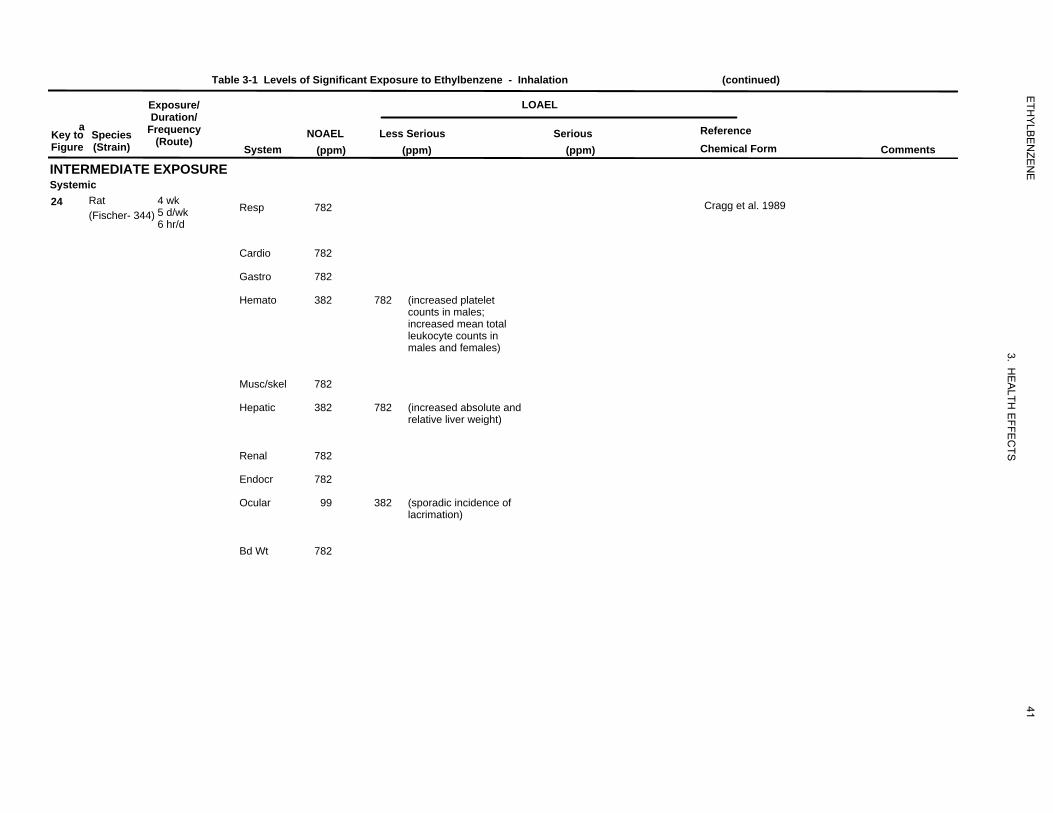
424
782
782
782
382
782
782
382
782
782
782
99
382
782
ETH
YLB
EN
ZEN
E
3. HE
ALTH
EFFE
CTS
Table 3-1 Levels of Significant Exposure to Ethylbenzene - Inhalation (continued)
Exposure/ Duration/
a Key to Species Frequency Figure (Strain) (Route)
INTERMEDIATE EXPOSURE Systemic 24 Rat 4 wk
5 d/wk(Fischer- 344) 6 hr/d
System
Resp
Cardio
Gastro
Hemato
Musc/skel
Hepatic
Renal
Endocr
Ocular
Bd Wt
LOAEL
NOAEL (ppm)
Less Serious (ppm)
Serious (ppm)
Reference Chemical Form Comments
782 Cragg et al. 1989
782
782
382 782 (increased platelet counts in males; increased mean total leukocyte counts in males and females)
782
382 782 (increased absolute and relative liver weight)
782
782
99 382 (sporadic incidence of lacrimation)
782
41
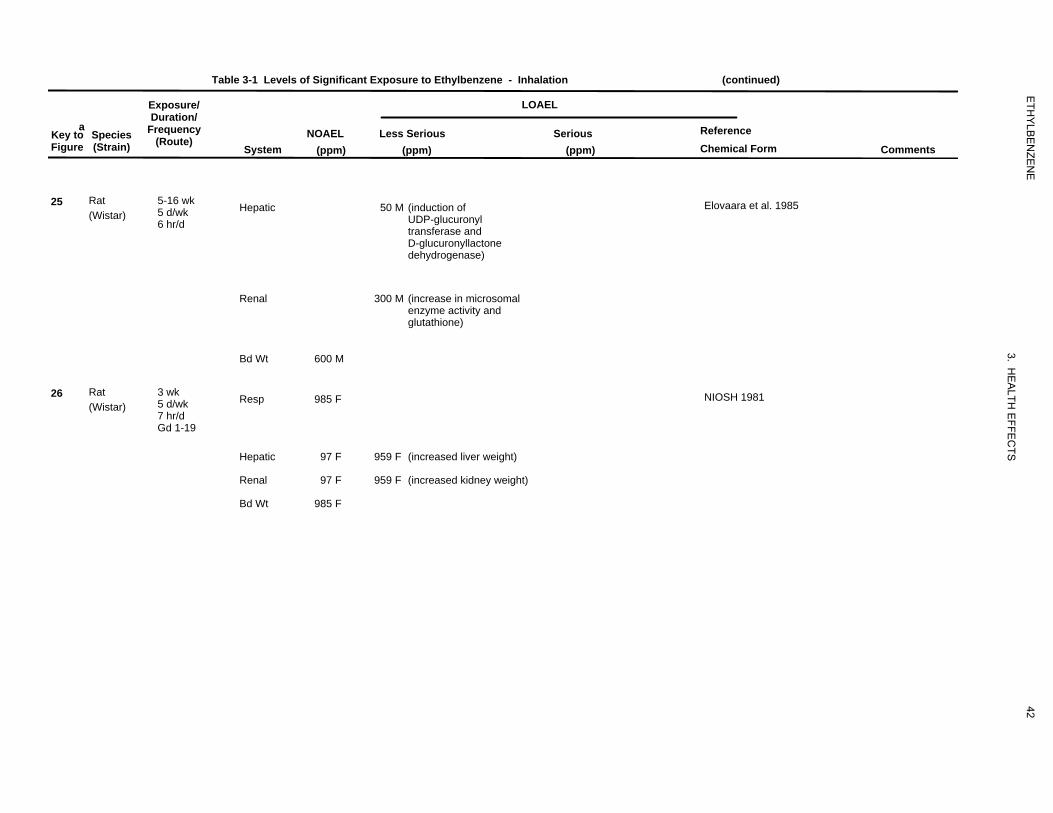
650
300
600
530
985
97 959
97 959
985
ETH
YLB
EN
ZEN
E
3. HE
ALTH
EFFE
CTS
Table 3-1 Levels of Significant Exposure to Ethylbenzene - Inhalation (continued)
Exposure/ Duration/
a Key to Species Frequency Figure (Strain) (Route)
25 Rat (Wistar)
5-16 wk 5 d/wk 6 hr/d
26 Rat (Wistar)
3 wk 5 d/wk 7 hr/d Gd 1-19
LOAEL
System NOAEL
(ppm) Less Serious
(ppm) Serious
(ppm)
Reference Chemical Form Comments
Hepatic 50 M (induction of Elovaara et al. 1985 UDP-glucuronyl transferase and D-glucuronyllactone dehydrogenase)
Renal 300 M (increase in microsomal enzyme activity and glutathione)
Bd Wt 600 M
Resp 985 F NIOSH 1981
Hepatic 97 F 959 F (increased liver weight)
Renal 97 F 959 F (increased kidney weight)
Bd Wt 985 F
42
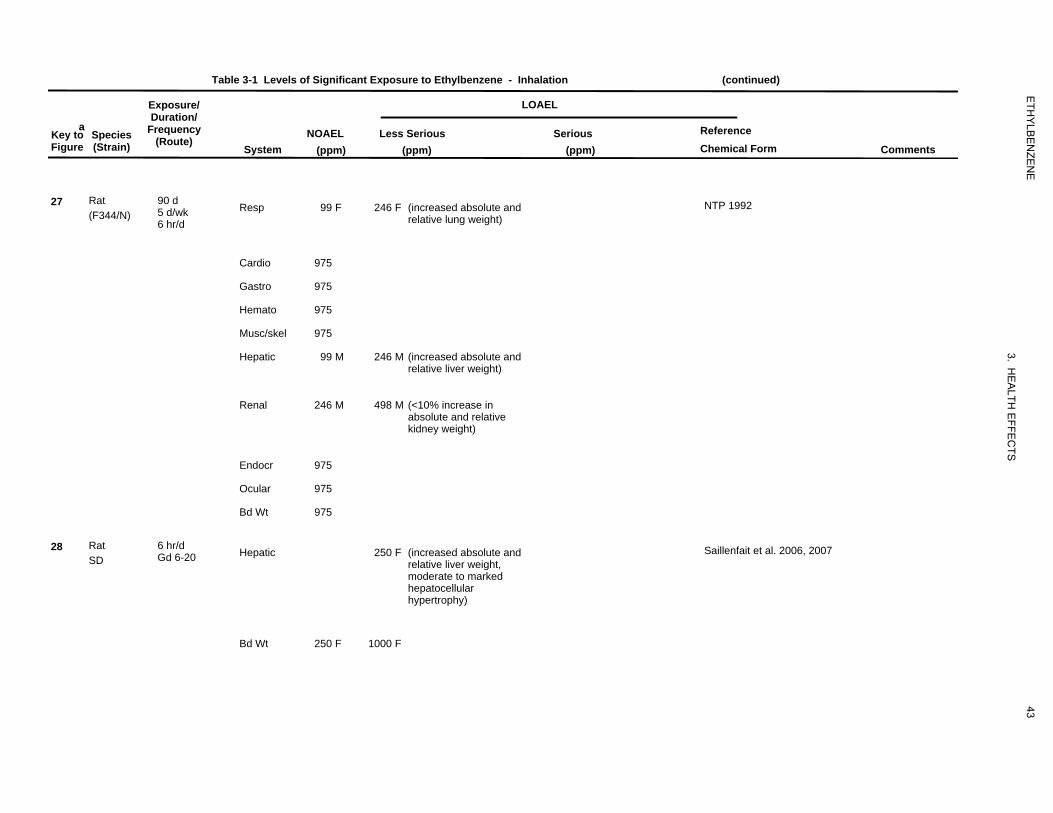
90
99
246
975
975
975
975
99
246
246
498
975
975
975
958250
250 1000
ETH
YLB
EN
ZEN
E
3. HE
ALTH
EFFE
CTS
Table 3-1 Levels of Significant Exposure to Ethylbenzene - Inhalation (continued)
Exposure/ LOAEL Duration/
a Key to Species Frequency NOAEL Less Serious Serious Reference
(Route)Figure (Strain) System (ppm) (ppm) (ppm) Chemical Form Comments
27 Rat (F344/N)
90 d 5 d/wk 6 hr/d
Resp 99 F 246 F (increased absolute and relative lung weight)
NTP 1992
Cardio 975
Gastro 975
Hemato 975
Musc/skel 975
Hepatic 99 M 246 M (increased absolute and relative liver weight)
Renal 246 M 498 M (<10% increase in absolute and relative kidney weight)
Endocr 975
Ocular 975
Bd Wt 975
28 Rat SD
6 hr/d Gd 6-20 Hepatic 250 F (increased absolute and
relative liver weight, moderate to marked hepatocellular hypertrophy)
Saillenfait et al. 2006, 2007
Bd Wt 250 F 1000 F
43
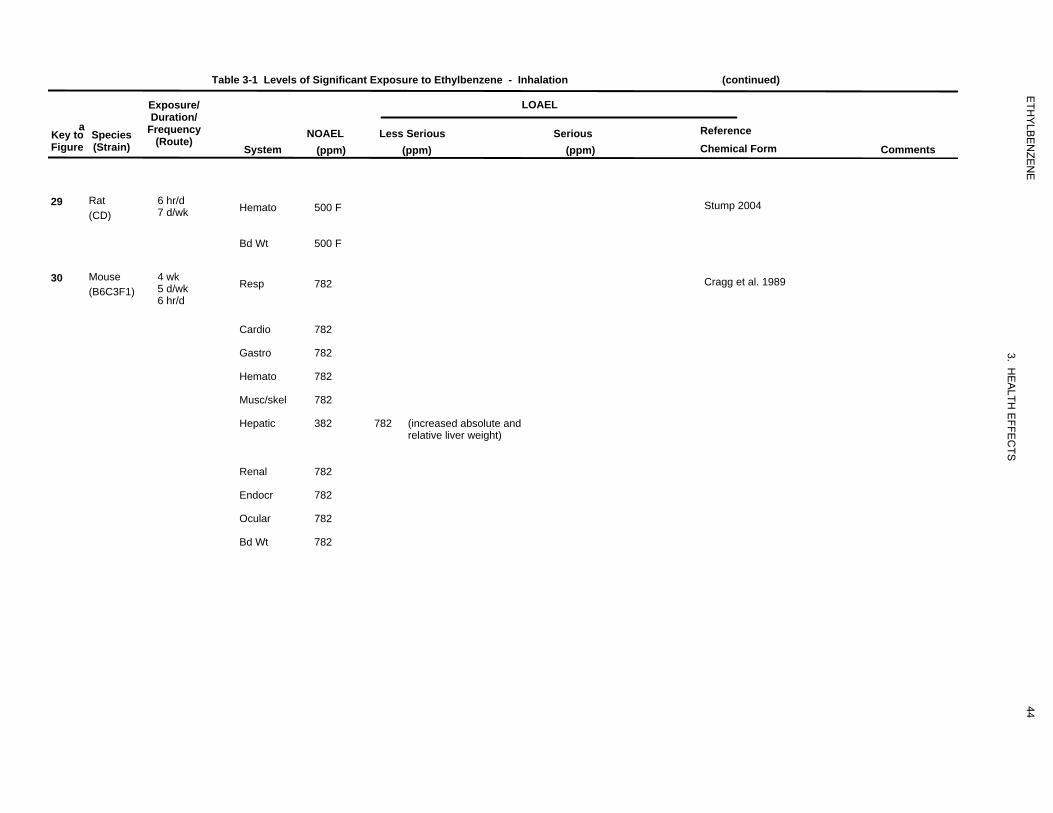
988
500
500
419
782
782
782
782
782
382
782
782
782
782
782
ETH
YLB
EN
ZEN
E
3. HE
ALTH
EFFE
CTS
Table 3-1 Levels of Significant Exposure to Ethylbenzene - Inhalation (continued)
a Key to Figure
Species (Strain)
Exposure/ Duration/
Frequency (Route)
System NOAEL
(ppm) Less Serious
(ppm)
LOAEL
Serious (ppm)
Reference Chemical Form Comments
29 Rat (CD)
6 hr/d 7 d/wk Hemato 500 F Stump 2004
Bd Wt 500 F
30 Mouse (B6C3F1)
4 wk 5 d/wk 6 hr/d
Resp 782 Cragg et al. 1989
Cardio
Gastro
Hemato
Musc/skel
Hepatic
782
782
782
782
382 782 (increased absolute and relative liver weight)
Renal
Endocr
Ocular
Bd Wt
782
782
782
782
44
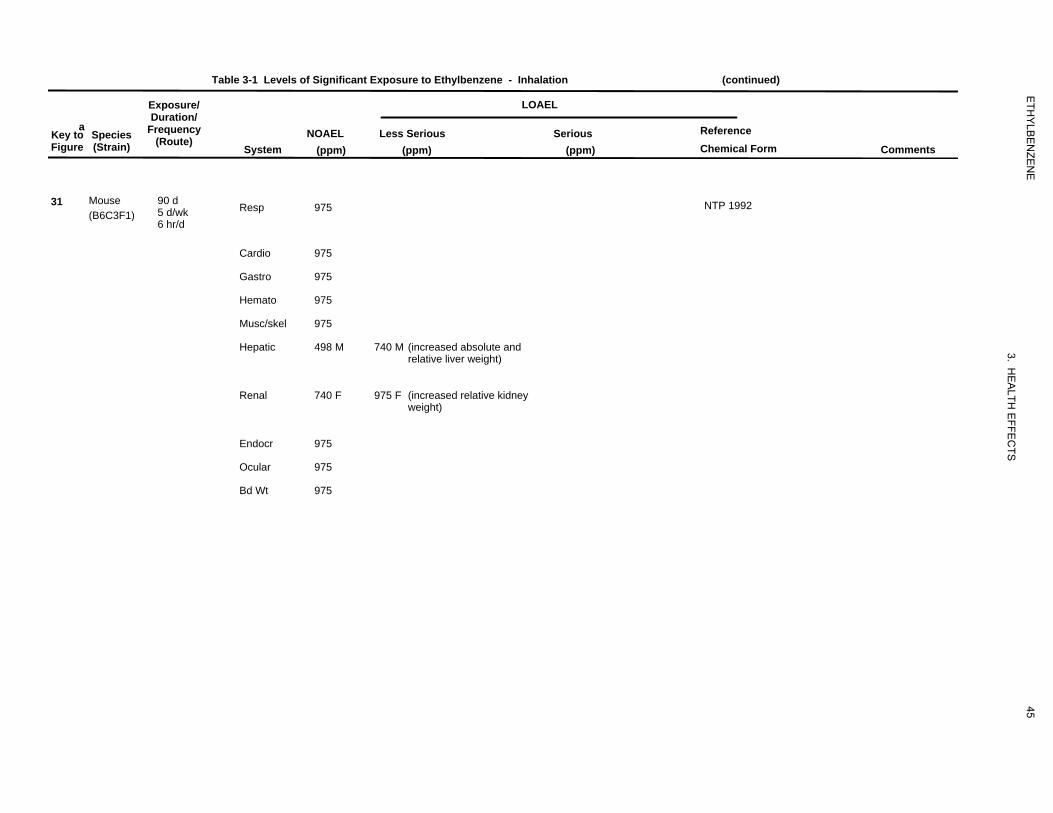
91
975
975
975
975
975
498
740
740
975
975
975
975
ETH
YLB
EN
ZEN
E
3. HE
ALTH
EFFE
CTS
Table 3-1 Levels of Significant Exposure to Ethylbenzene - Inhalation (continued)
a Key to Figure
Species (Strain)
Exposure/ Duration/
Frequency (Route)
System NOAEL
(ppm) Less Serious
(ppm)
LOAEL
Serious (ppm)
Reference Chemical Form Comments
31 Mouse (B6C3F1)
90 d 5 d/wk 6 hr/d
Resp 975 NTP 1992
Cardio 975
Gastro 975
Hemato 975
Musc/skel
Hepatic
975
498 M 740 M (increased absolute and relative liver weight)
Renal 740 F 975 F (increased relative kidney weight)
Endocr 975
Ocular 975
Bd Wt 975
45
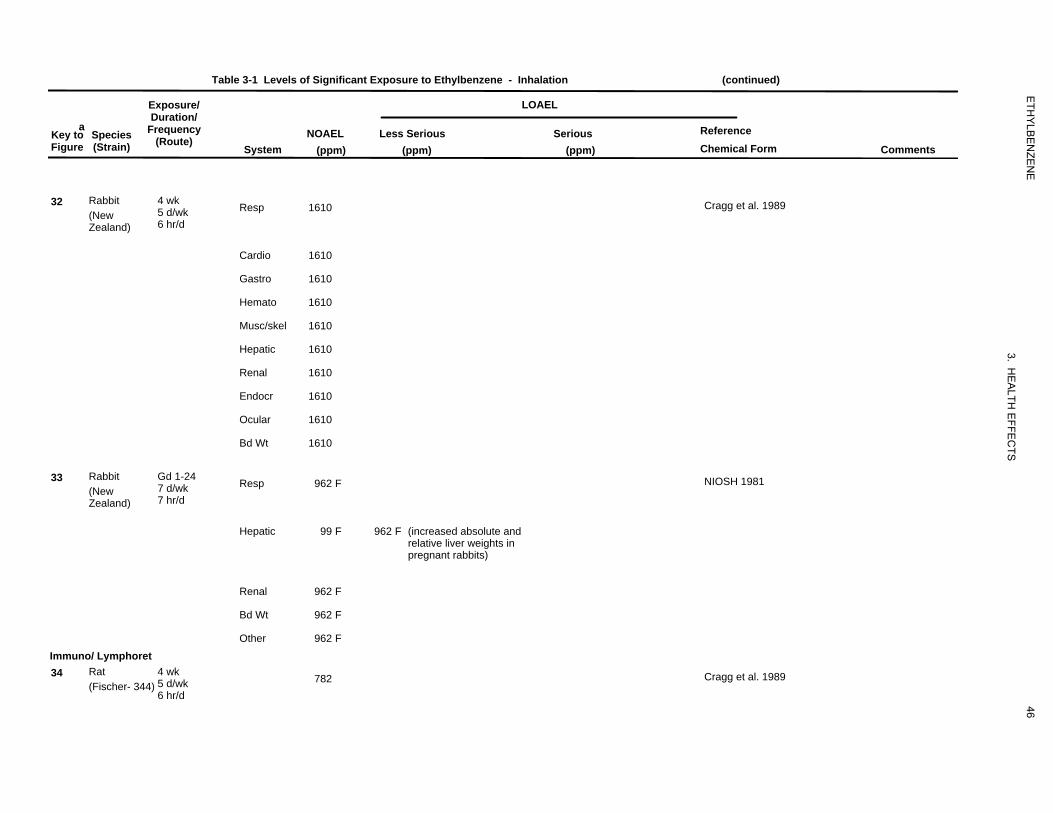
429
1610
1610
1610
1610
1610
1610
1610
1610
1610
1610
528
962
99
962
962
962
962
425
782
ETH
YLB
EN
ZEN
E
3. HE
ALTH
EFFE
CTS
Table 3-1 Levels of Significant Exposure to Ethylbenzene - Inhalation (continued)
Exposure/ Duration/
a Key to Species Frequency Figure (Strain) (Route)
32 Rabbit 4 wk 5 d/wk(New 6 hr/dZealand)
33 Rabbit Gd 1-24 7 d/wk(New 7 hr/dZealand)
Immuno/ Lymphoret 34 Rat 4 wk
5 d/wk(Fischer- 344) 6 hr/d
System
Resp
Cardio
Gastro
Hemato
Musc/skel
Hepatic
Renal
Endocr
Ocular
Bd Wt
Resp
Hepatic
Renal
Bd Wt
Other
LOAEL
NOAEL (ppm)
Less Serious (ppm)
Serious (ppm)
Reference Chemical Form Comments
1610 Cragg et al. 1989
1610
1610
1610
1610
1610
1610
1610
1610
1610
962 F NIOSH 1981
99 F 962 F (increased absolute and relative liver weights in pregnant rabbits)
962 F
962 F
962 F
782 Cragg et al. 1989
46
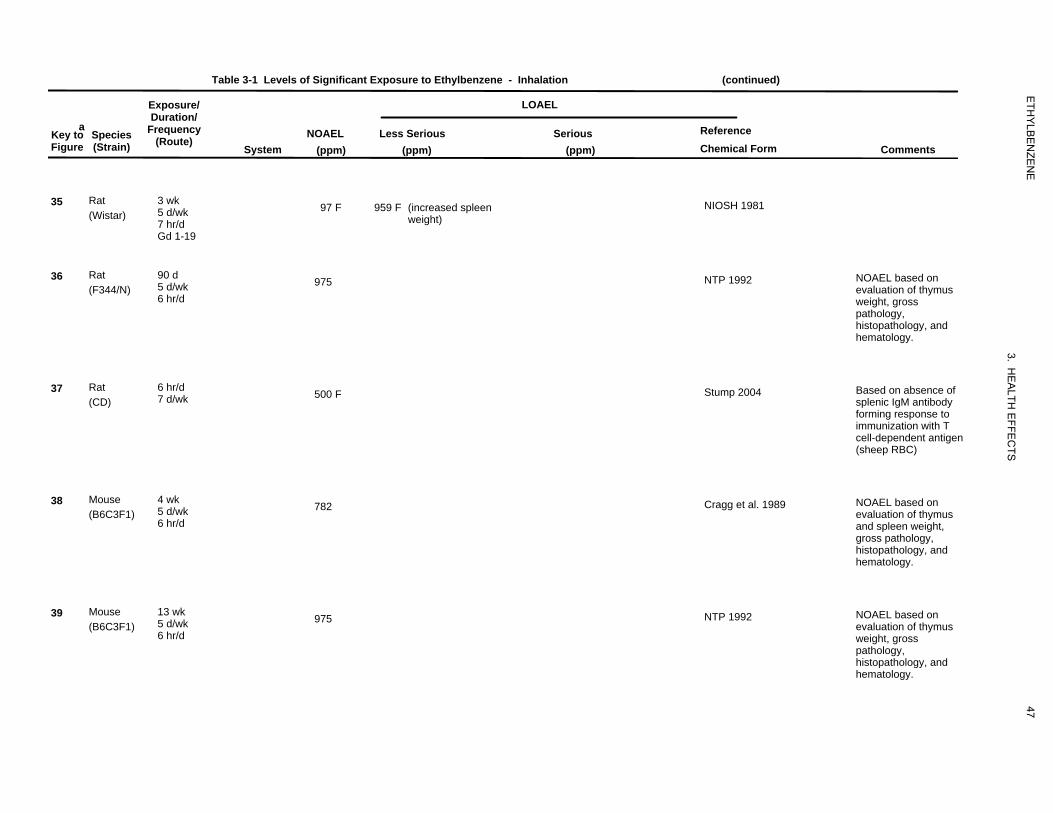
531
97
959
549
975
987
500
420
782
550
975
ETH
YLB
EN
ZEN
E
3. HE
ALTH
EFFE
CTS
Table 3-1 Levels of Significant Exposure to Ethylbenzene - Inhalation (continued)
a Key to Species Figure (Strain)
35 Rat (Wistar)
36 Rat (F344/N)
37 Rat (CD)
38 Mouse (B6C3F1)
39 Mouse (B6C3F1)
Exposure/ Duration/
Frequency (Route)
System NOAEL
(ppm) Less Serious
(ppm)
LOAEL
Serious (ppm)
Reference Chemical Form Comments
3 wk 5 d/wk 7 hr/d Gd 1-19
97 F 959 F (increased spleen weight)
NIOSH 1981
90 d 5 d/wk 6 hr/d
975 NTP 1992 NOAEL based on evaluation of thymus weight, gross pathology, histopathology, and hematology.
6 hr/d 7 d/wk 500 F Stump 2004 Based on absence of
splenic IgM antibody forming response to immunization with T cell-dependent antigen (sheep RBC)
4 wk 5 d/wk 6 hr/d
782 Cragg et al. 1989 NOAEL based on evaluation of thymus and spleen weight, gross pathology, histopathology, and hematology.
13 wk 5 d/wk 6 hr/d
975 NTP 1992 NOAEL based on evaluation of thymus weight, gross pathology, histopathology, and hematology.
47
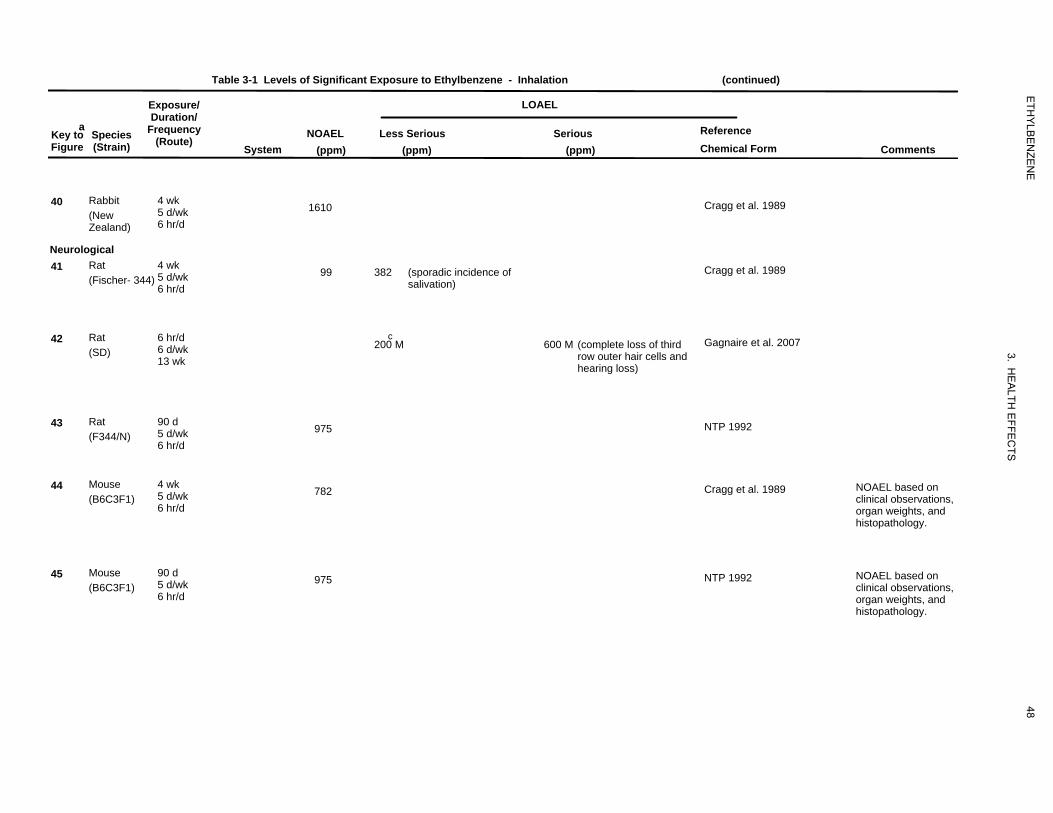
430
1610
426
99
382
957
200
600
551
975
421
782
552
975
ETH
YLB
EN
ZEN
E
3. HE
ALTH
EFFE
CTS
Table 3-1 Levels of Significant Exposure to Ethylbenzene - Inhalation (continued)
a Key to Figure
Species (Strain)
Exposure/ Duration/
Frequency (Route)
System NOAEL
(ppm) Less Serious
(ppm)
LOAEL
Serious (ppm)
Reference Chemical Form Comments
40 Rabbit (New Zealand)
4 wk 5 d/wk 6 hr/d
Neurological 41 Rat
(Fischer- 344) 4 wk 5 d/wk 6 hr/d
1610
99 382 (sporadic incidence of salivation)
Cragg et al. 1989
Cragg et al. 1989
42 Rat (SD)
6 hr/d 6 d/wk 13 wk
c 200 M 600 M (complete loss of third
row outer hair cells and hearing loss)
Gagnaire et al. 2007
43 Rat (F344/N)
90 d 5 d/wk 6 hr/d
975 NTP 1992
44 Mouse (B6C3F1)
4 wk 5 d/wk 6 hr/d
782 Cragg et al. 1989 NOAEL based on clinical observations, organ weights, and histopathology.
45 Mouse (B6C3F1)
90 d 5 d/wk 6 hr/d
975 NTP 1992 NOAEL based on clinical observations, organ weights, and histopathology.
48
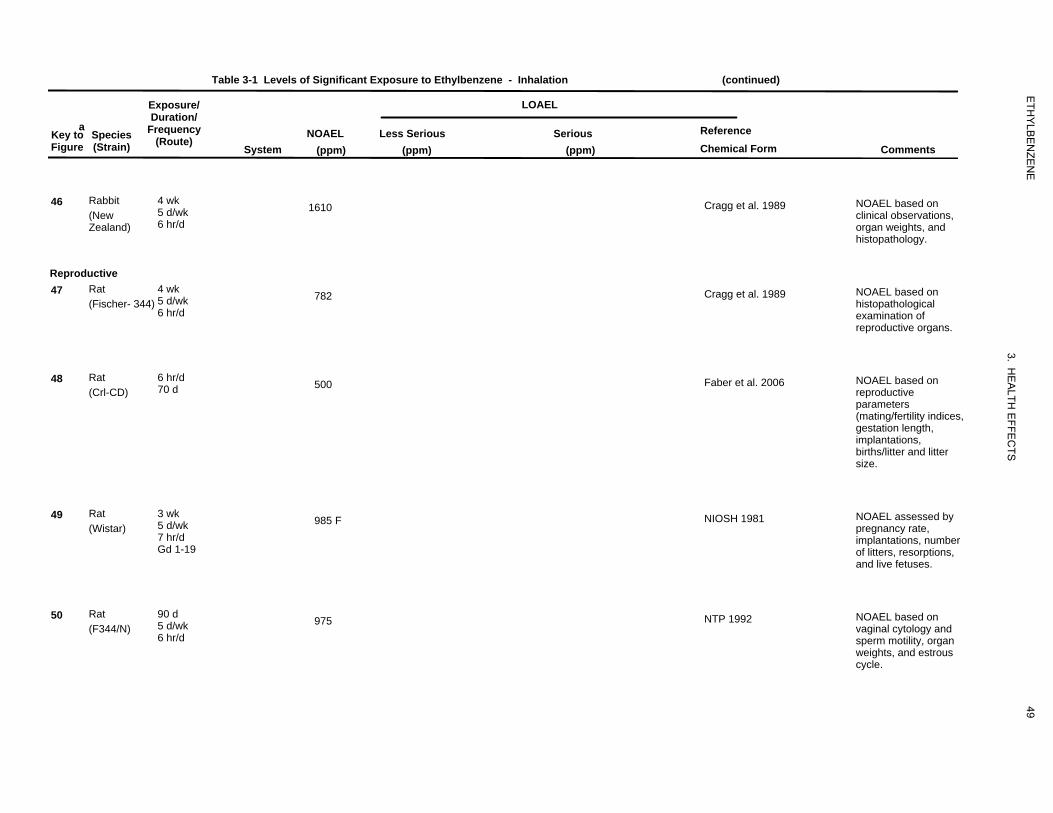
431
1610
427
782
959
500
75
985
553
975
ETH
YLB
EN
ZEN
E
3. HE
ALTH
EFFE
CTS
Table 3-1 Levels of Significant Exposure to Ethylbenzene - Inhalation (continued)
a Key to Figure
Species (Strain)
Exposure/ Duration/
Frequency (Route)
System NOAEL
(ppm) Less Serious
(ppm)
LOAEL
Serious (ppm)
Reference Chemical Form Comments
46 Rabbit (New Zealand)
4 wk 5 d/wk 6 hr/d
1610 Cragg et al. 1989 NOAEL based on clinical observations, organ weights, and histopathology.
Reproductive 47 Rat
(Fischer- 344) 4 wk 5 d/wk 6 hr/d
782 Cragg et al. 1989 NOAEL based on histopathological examination of reproductive organs.
48 Rat (Crl-CD)
6 hr/d 70 d 500 Faber et al. 2006 NOAEL based on
reproductive parameters (mating/fertility indices, gestation length, implantations, births/litter and litter size.
49 Rat (Wistar)
3 wk 5 d/wk 7 hr/d Gd 1-19
985 F NIOSH 1981 NOAEL assessed by pregnancy rate, implantations, number of litters, resorptions, and live fetuses.
50 Rat (F344/N)
90 d 5 d/wk 6 hr/d
975 NTP 1992 NOAEL based on vaginal cytology and sperm motility, organ weights, and estrous cycle.
49
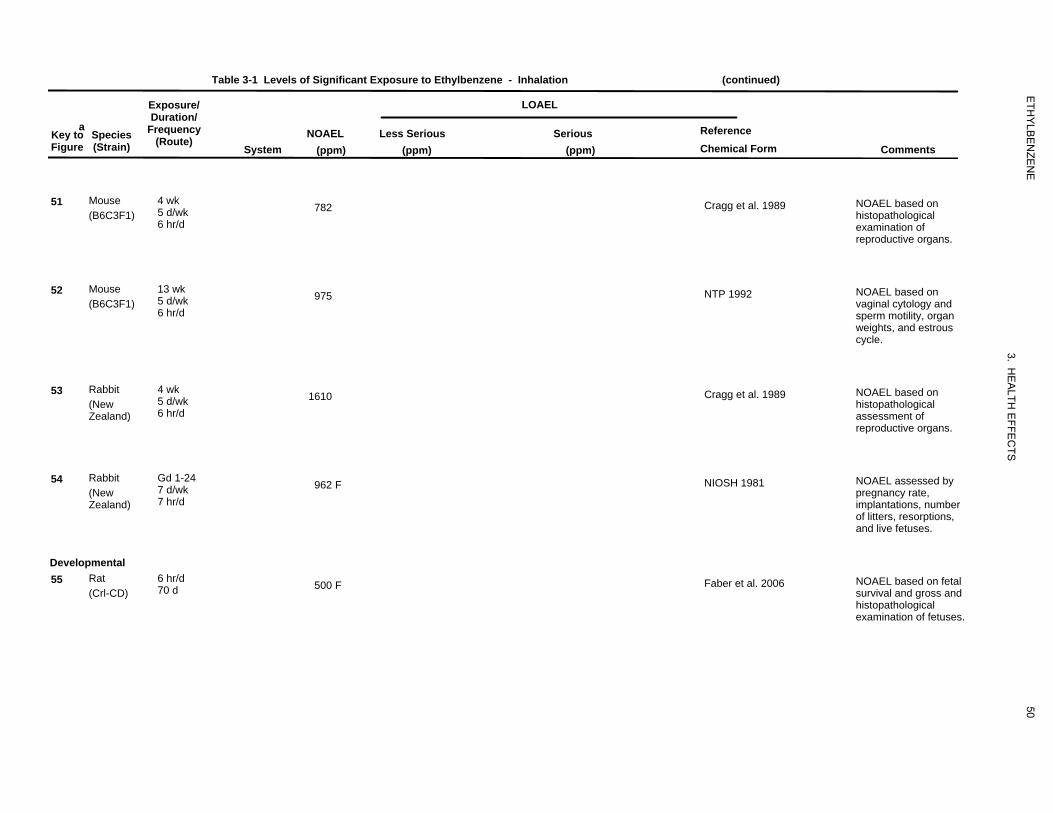
422
782
554
975
432
1610
77
962
960
500
ETH
YLB
EN
ZEN
E
3. HE
ALTH
EFFE
CTS
Table 3-1 Levels of Significant Exposure to Ethylbenzene - Inhalation (continued)
a Key to Species Figure (Strain)
51 Mouse (B6C3F1)
52 Mouse (B6C3F1)
53 Rabbit (New Zealand)
54 Rabbit (New Zealand)
Developmental 55 Rat
(Crl-CD)
Exposure/ Duration/
Frequency (Route)
System NOAEL
(ppm) Less Serious
(ppm)
LOAEL
Serious (ppm)
Reference Chemical Form Comments
4 wk 5 d/wk 6 hr/d
782 Cragg et al. 1989 NOAEL based on histopathological examination of reproductive organs.
13 wk 5 d/wk 6 hr/d
975 NTP 1992 NOAEL based on vaginal cytology and sperm motility, organ weights, and estrous cycle.
4 wk 5 d/wk 6 hr/d
1610 Cragg et al. 1989 NOAEL based on histopathological assessment of reproductive organs.
Gd 1-24 7 d/wk 7 hr/d
962 F NIOSH 1981 NOAEL assessed by pregnancy rate, implantations, number of litters, resorptions, and live fetuses.
6 hr/d 70 d 500 F Faber et al. 2006 NOAEL based on fetal
survival and gross and histopathological examination of fetuses.
50
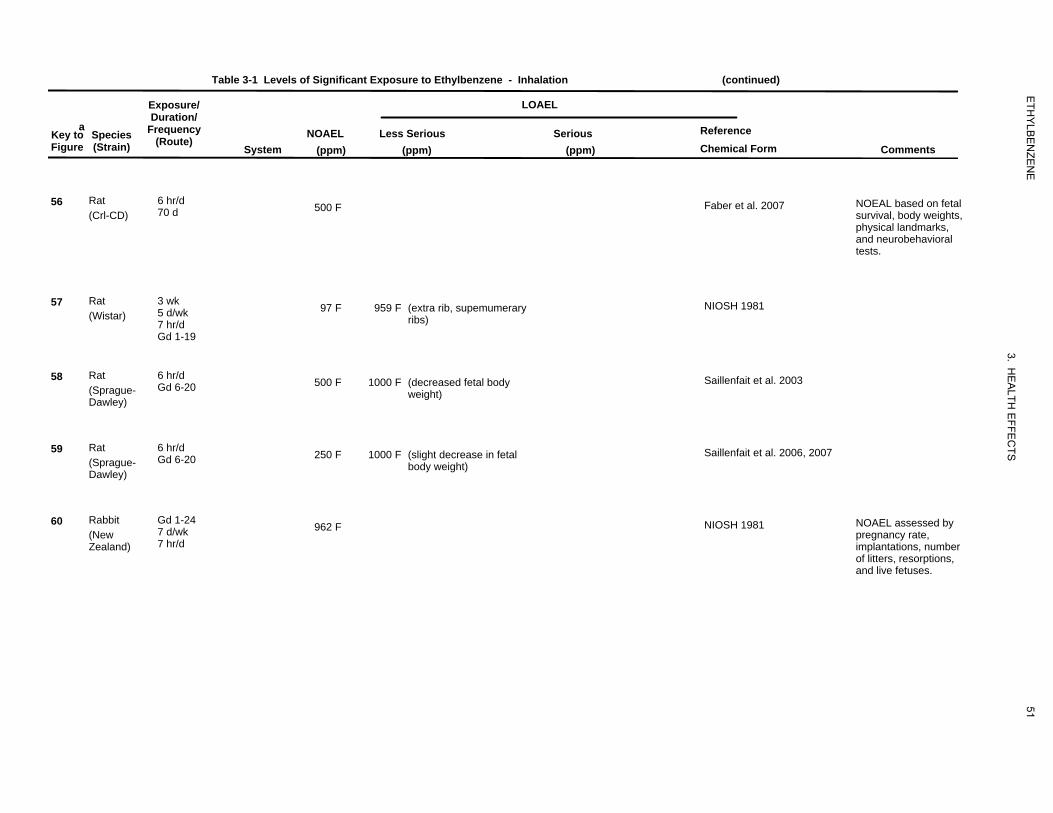
961
500
76
97
959
966
500
1000
967
250
1000
527
962
ETH
YLB
EN
ZEN
E
3. HE
ALTH
EFFE
CTS
Table 3-1 Levels of Significant Exposure to Ethylbenzene - Inhalation (continued)
a Key to Species Figure (Strain)
56 Rat (Crl-CD)
57 Rat (Wistar)
58 Rat (Sprague-Dawley)
59 Rat (Sprague-Dawley)
60 Rabbit (New Zealand)
Exposure/ Duration/
Frequency (Route)
System NOAEL
(ppm) Less Serious
(ppm)
LOAEL
Serious (ppm)
Reference Chemical Form Comments
6 hr/d 70 d 500 F Faber et al. 2007 NOEAL based on fetal
survival, body weights, physical landmarks, and neurobehavioral tests.
3 wk 5 d/wk 7 hr/d Gd 1-19
97 F 959 F (extra rib, supemumerary ribs)
NIOSH 1981
6 hr/d Gd 6-20 500 F 1000 F (decreased fetal body
weight) Saillenfait et al. 2003
6 hr/d Gd 6-20 250 F 1000 F (slight decrease in fetal
body weight) Saillenfait et al. 2006, 2007
Gd 1-24 7 d/wk 7 hr/d
962 F NIOSH 1981 NOAEL assessed by pregnancy rate, implantations, number of litters, resorptions, and live fetuses.
51
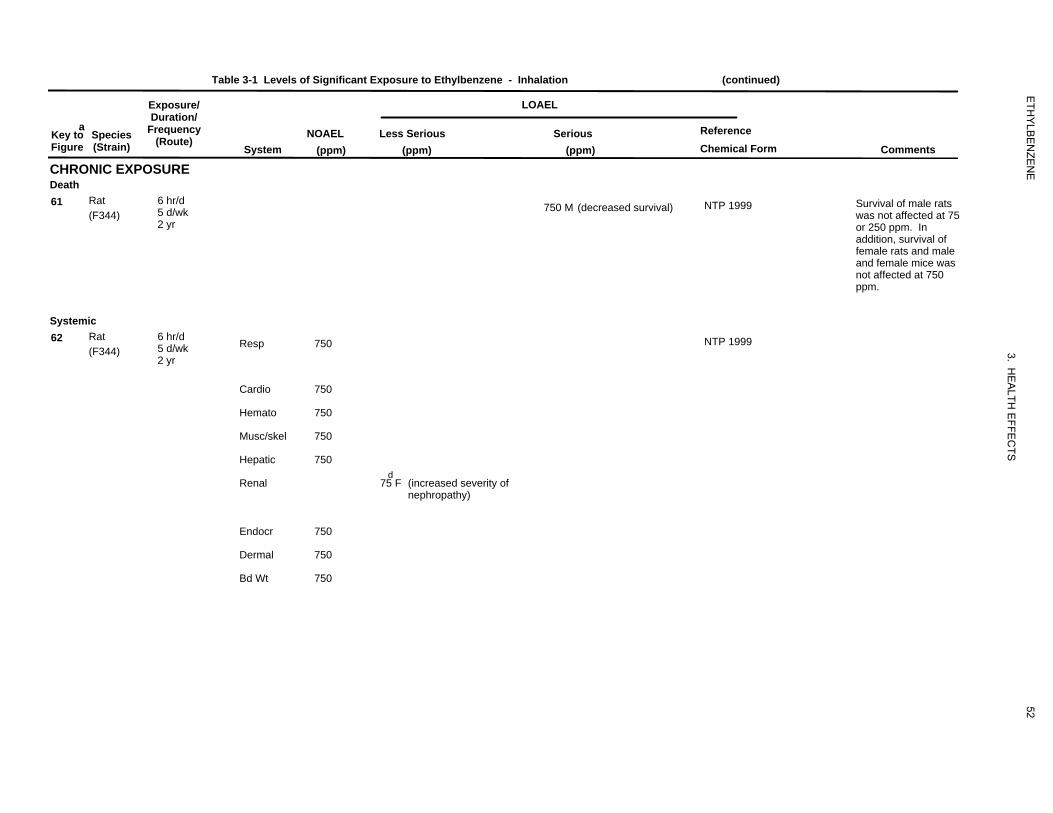
980
750
971
750
750
750
750
750
75
750
750
750
ETH
YLB
EN
ZEN
E
3. HE
ALTH
EFFE
CTS
Table 3-1 Levels of Significant Exposure to Ethylbenzene - Inhalation (continued)
Exposure/ Duration/
a Key to Species Frequency Figure (Strain) (Route)
CHRONIC EXPOSURE Death 61 Rat 6 hr/d
5 d/wk(F344) 2 yr
Systemic 62 Rat 6 hr/d
5 d/wk(F344) 2 yr
System
Resp
Cardio
Hemato
Musc/skel
Hepatic
Renal
Endocr
Dermal
Bd Wt
LOAEL
NOAEL (ppm)
Less Serious (ppm)
Serious (ppm)
Reference Chemical Form Comments
750 M (decreased survival) NTP 1999 Survival of male rats was not affected at 75 or 250 ppm. In addition, survival of female rats and male and female mice was not affected at 750 ppm.
750 NTP 1999
750
750
750
750 d
75 F (increased severity of nephropathy)
750
750
750
52
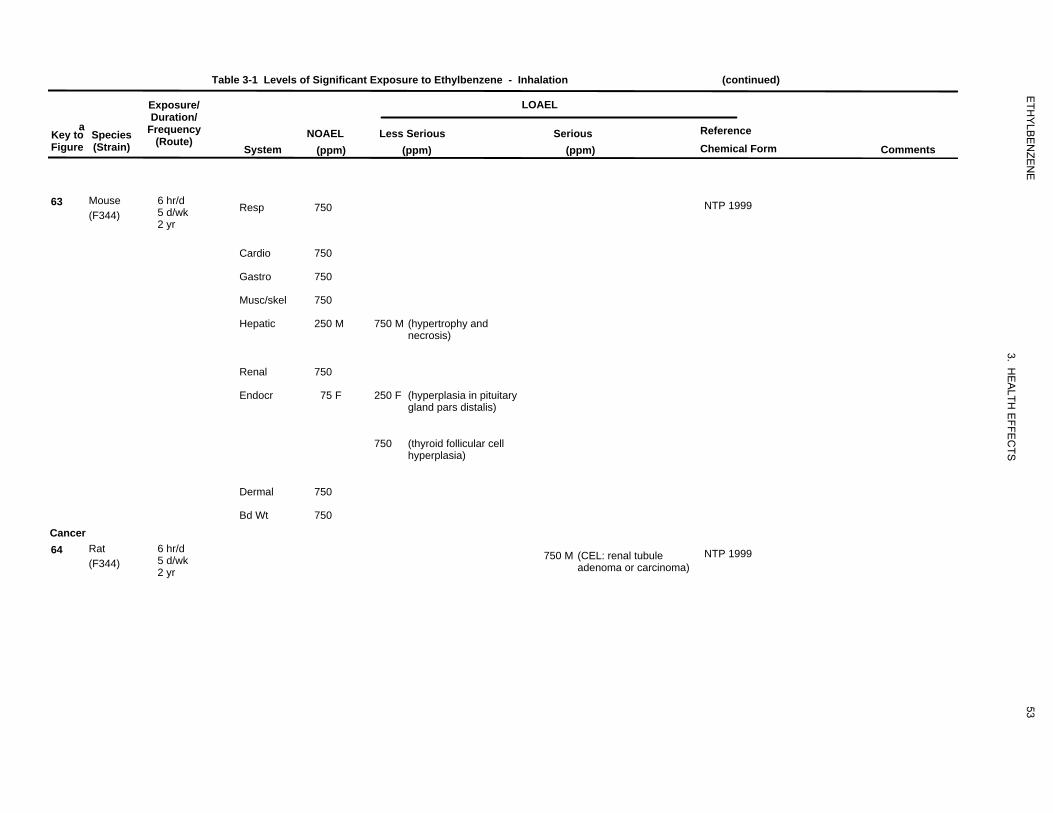
970
750
750
750
750
250
750
750
75
250
750
750
750
965750
ETH
YLB
EN
ZEN
E
3. HE
ALTH
EFFE
CTS
Table 3-1 Levels of Significant Exposure to Ethylbenzene - Inhalation (continued)
a Key to Figure
Species (Strain)
Exposure/ Duration/
Frequency (Route)
System NOAEL
(ppm) Less Serious
(ppm)
LOAEL
Serious (ppm)
Reference Chemical Form Comments
63 Mouse (F344)
6 hr/d 5 d/wk 2 yr
Resp 750 NTP 1999
Cardio 750
Gastro 750
Musc/skel
Hepatic
750
250 M 750 M (hypertrophy and necrosis)
Renal 750
Endocr 75 F 250 F (hyperplasia in pituitary gland pars distalis)
750 (thyroid follicular cell hyperplasia)
Dermal 750
Cancer 64 Rat
(F344) 6 hr/d 5 d/wk 2 yr
Bd Wt 750
750 M (CEL: renal tubule adenoma or carcinoma)
NTP 1999
53
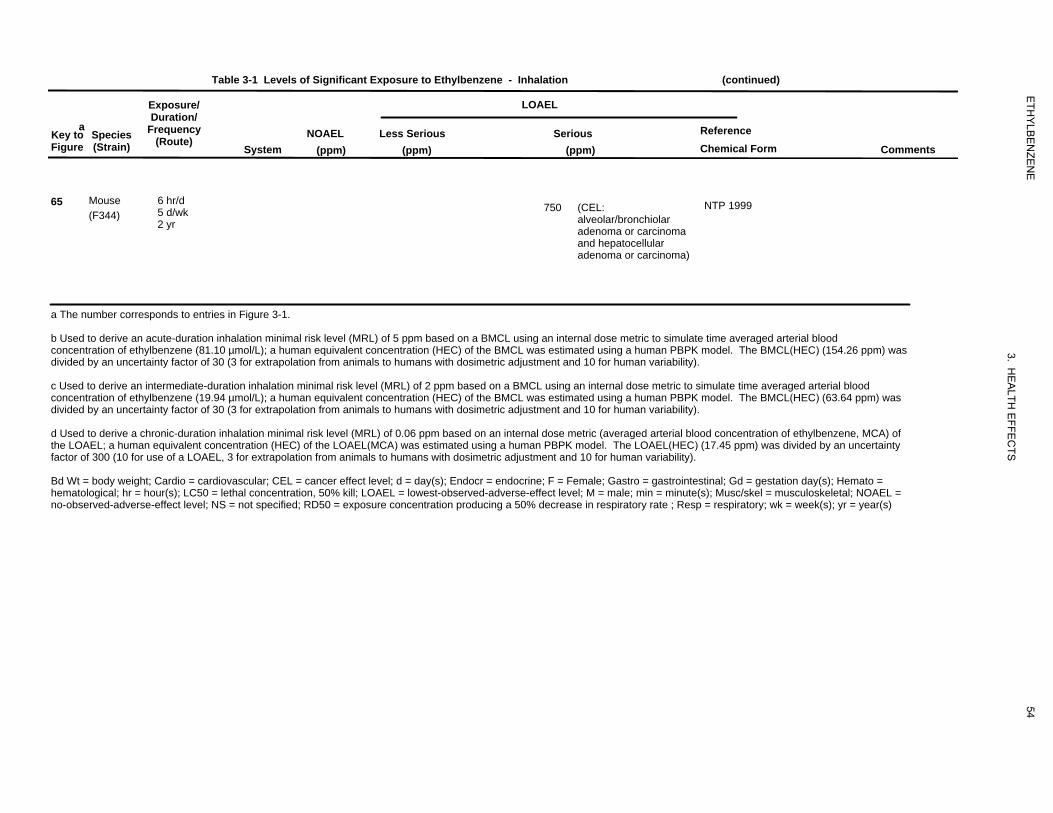
972750
ETH
YLB
EN
ZEN
E
3. HE
ALTH
EFFE
CTS
Table 3-1 Levels of Significant Exposure to Ethylbenzene - Inhalation (continued)
Exposure/ LOAEL Duration/
a Key to Species Frequency NOAEL Less Serious Serious Reference
(Route)Figure (Strain) System (ppm) (ppm) (ppm) Chemical Form Comments
65 Mouse (F344)
6 hr/d 5 d/wk 2 yr
750 (CEL: alveolar/bronchiolar adenoma or carcinoma
NTP 1999
and hepatocellular adenoma or carcinoma)
a The number corresponds to entries in Figure 3-1.
b Used to derive an acute-duration inhalation minimal risk level (MRL) of 5 ppm based on a BMCL using an internal dose metric to simulate time averaged arterial blood concentration of ethylbenzene (81.10 µmol/L); a human equivalent concentration (HEC) of the BMCL was estimated using a human PBPK model. The BMCL(HEC) (154.26 ppm) was divided by an uncertainty factor of 30 (3 for extrapolation from animals to humans with dosimetric adjustment and 10 for human variability).
c Used to derive an intermediate-duration inhalation minimal risk level (MRL) of 2 ppm based on a BMCL using an internal dose metric to simulate time averaged arterial blood concentration of ethylbenzene (19.94 µmol/L); a human equivalent concentration (HEC) of the BMCL was estimated using a human PBPK model. The BMCL(HEC) (63.64 ppm) was divided by an uncertainty factor of 30 (3 for extrapolation from animals to humans with dosimetric adjustment and 10 for human variability).
d Used to derive a chronic-duration inhalation minimal risk level (MRL) of 0.06 ppm based on an internal dose metric (averaged arterial blood concentration of ethylbenzene, MCA) of the LOAEL; a human equivalent concentration (HEC) of the LOAEL(MCA) was estimated using a human PBPK model. The LOAEL(HEC) (17.45 ppm) was divided by an uncertainty factor of 300 (10 for use of a LOAEL, 3 for extrapolation from animals to humans with dosimetric adjustment and 10 for human variability).
Bd Wt = body weight; Cardio = cardiovascular; CEL = cancer effect level; d = day(s); Endocr = endocrine; F = Female; Gastro = gastrointestinal; Gd = gestation day(s); Hemato = hematological; hr = hour(s); LC50 = lethal concentration, 50% kill; LOAEL = lowest-observed-adverse-effect level; M = male; min = minute(s); Musc/skel = musculoskeletal; NOAEL = no-observed-adverse-effect level; NS = not specified; RD50 = exposure concentration producing a 50% decrease in respiratory rate ; Resp = respiratory; wk = week(s); yr = year(s)
54
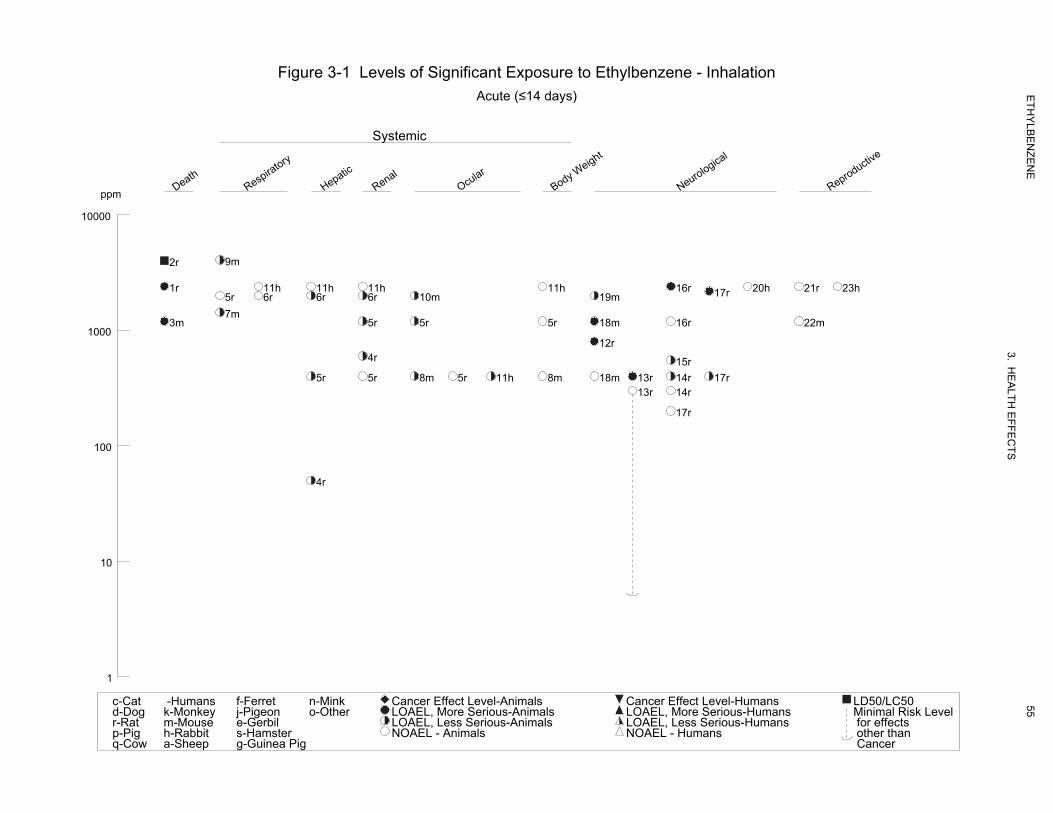
Figure 3-1 Levels of Significant Exposure to Ethylbenzene - Inhalation
Acute (≤14 days)
Systemic
ppm Death
Respiratory
Hepatic
Renal
Ocular
Body Weight
Neurological
Reproductive
10000
2r 9m
1r 11h 11h 11h 11h 16r 20h 21r 23h17r5r 6r 6r 6r 10m 19m
7m 3m 5r 5r 5r 18m 16r 22m
1000 12r
4r 15r
5r 5r 8m 5r 11h 8m 18m 13r 14r 17r 13r 14r
17r
100
4r
10
1
c-Cat -Humans f-Ferret n-Mink Cancer Effect Level-Animals Cancer Effect Level-Humans LD50/LC50d-Dog k-Monkey j-Pigeon o-Other LOAEL, More Serious-Animals LOAEL, More Serious-Humans Minimal Risk Levelr-Rat m-Mouse e-Gerbil LOAEL, Less Serious-Animals LOAEL, Less Serious-Humans for effectsp-Pig h-Rabbit s-Hamster NOAEL - Animals NOAEL - Humans other thanq-Cow a-Sheep g-Guinea Pig Cancer
ETH
YLB
EN
ZEN
E
3. HE
ALTH
EFFE
CTS
55
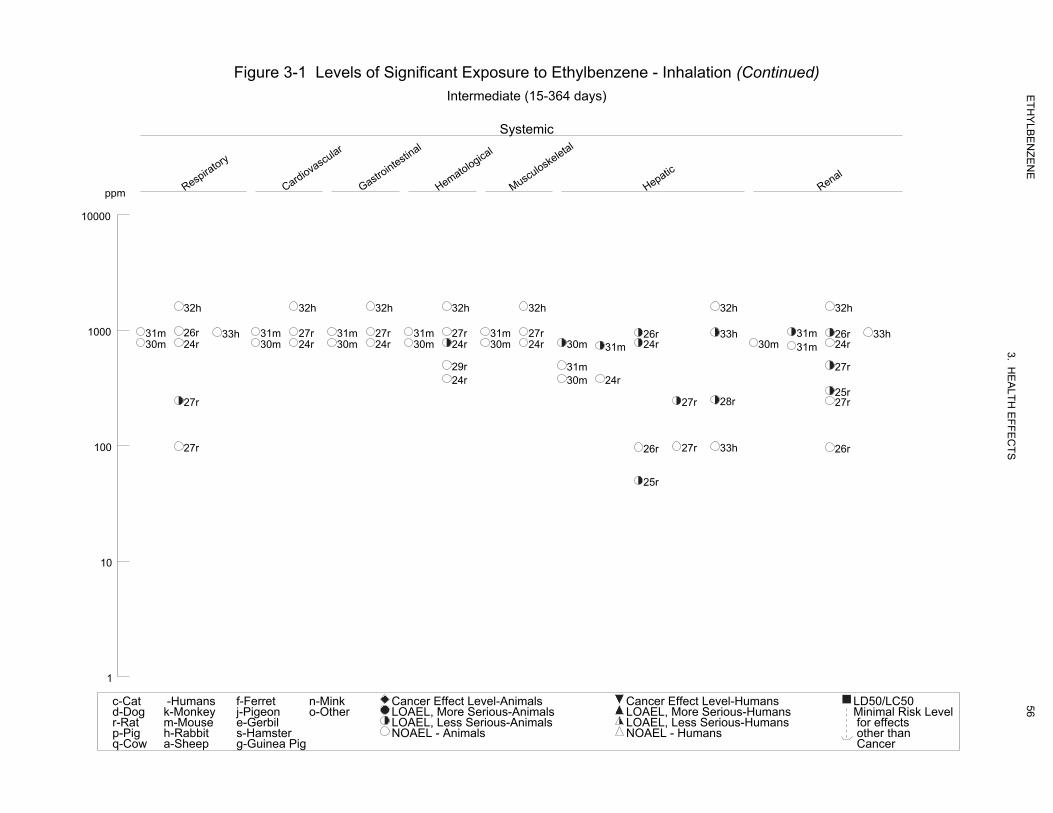
Figure 3-1 Levels of Significant Exposure to Ethylbenzene - Inhalation (Continued) Intermediate (15-364 days)
Systemic
ppm Respiratory
Cardiovascular
Gastrointestinal
Hematological
Musculoskeletal
Hepatic
Renal
10000
32h 32h 32h 32h 32h 32h 32h
1000 31m 26r 33h 31m 27r 31m 27r 31m 27r 31m 27r 26r 33h 31m 26r 33h30m 24r 30m 24r 30m 24r 30m 24r 30m 24r 30m 31m 24r 30m 31m 24r
29r 31m 27r 24r 30m 24r
25r 27r 27r 28r 27r
100 27r 26r 27r 33h 26r
25r
10
1
c-Cat -Humans f-Ferret n-Mink Cancer Effect Level-Animals Cancer Effect Level-Humans LD50/LC50d-Dog k-Monkey j-Pigeon o-Other LOAEL, More Serious-Animals LOAEL, More Serious-Humans Minimal Risk Levelr-Rat m-Mouse e-Gerbil LOAEL, Less Serious-Animals LOAEL, Less Serious-Humans for effectsp-Pig h-Rabbit s-Hamster NOAEL - Animals NOAEL - Humans other thanq-Cow a-Sheep g-Guinea Pig Cancer
ETH
YLB
EN
ZEN
E
3. HE
ALTH
EFFE
CTS
56
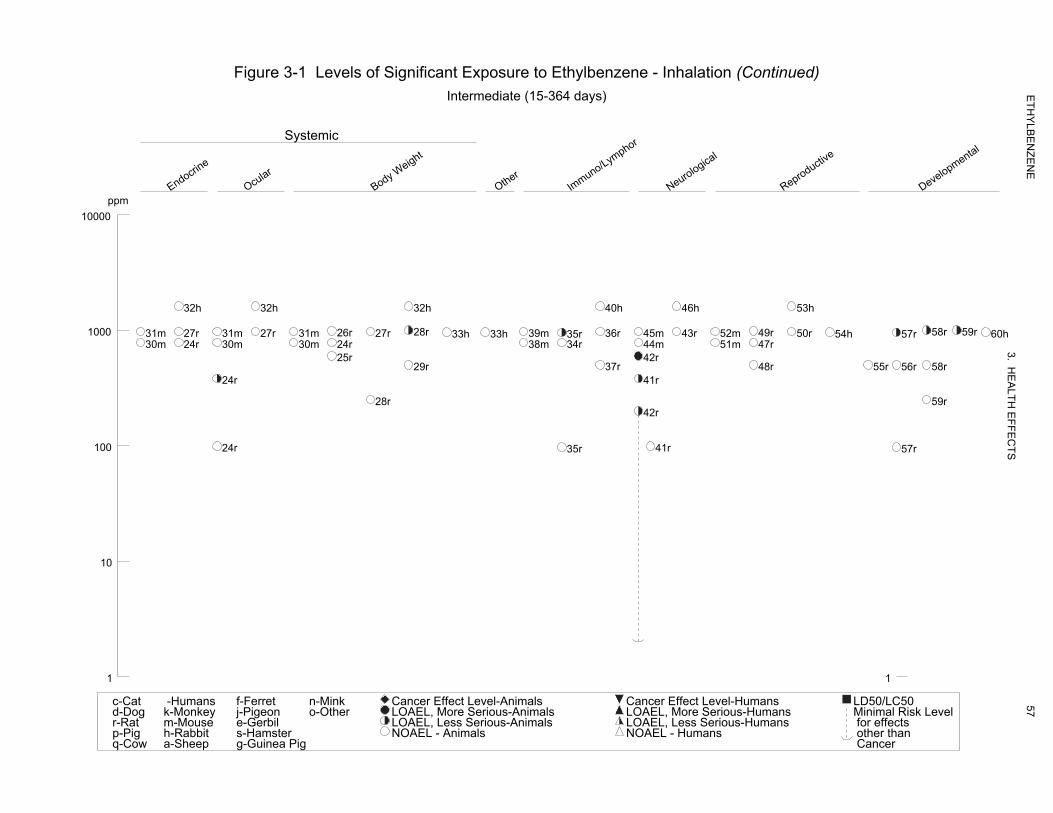
Figure 3-1 Levels of Significant Exposure to Ethylbenzene - Inhalation (Continued) Intermediate (15-364 days)
Systemic
Endocrine
Ocular
Body Weight
Other
Immuno/Lymphor
Neurological
Reproductive
ppm Developmental
10000
32h 32h 32h 40h 46h 53h
1000 31m 27r 31m 27r 31m 26r 27r 28r 33h 33h 39m 35r 36r 45m 43r 52m 49r 50r 54h 57r 58r 59r 6030m 24r 30m 30m 24r 38m 34r 44m 51m 47r
25r 42r 29r 37r 48r 55r 56r 58r
24r 41r
28r 59r 42r
100 24r 35r 41r 57r
10
1 1
c-Cat -Humans f-Ferret n-Mink Cancer Effect Level-Animals Cancer Effect Level-Humans LD50/LC50d-Dog k-Monkey j-Pigeon o-Other LOAEL, More Serious-Animals LOAEL, More Serious-Humans Minimal Risk Levelr-Rat m-Mouse e-Gerbil LOAEL, Less Serious-Animals LOAEL, Less Serious-Humans for effectsp-Pig h-Rabbit s-Hamster NOAEL - Animals NOAEL - Humans other thanq-Cow a-Sheep g-Guinea Pig Cancer
ETH
YLB
EN
ZEN
E
3. HE
ALTH
EFFE
CTS
h
57
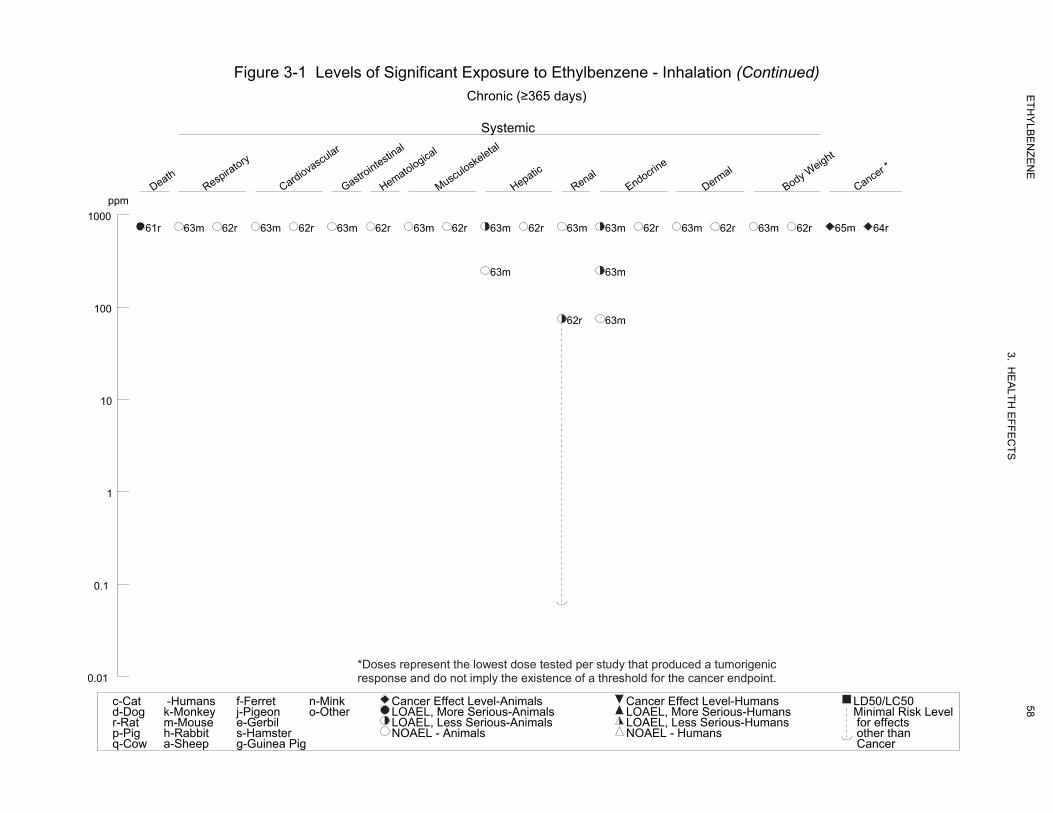
Figure 3-1 Levels of Significant Exposure to Ethylbenzene - Inhalation (Continued) Chronic (≥365 days)
Systemic
Death
Respiratory
Cardiovascular
Gastrointestinal
Hematological
Musculoskeletal
Hepatic
Renal
Endocrine
Dermal
Body Weight
Cancer *
ppm
1000 61r 63m 62r 63m 62r 63m 62r 63m 62r 63m 62r 63m 63m 62r 63m 62r 63m 62r 65m 64r
63m 63m
100 62r 63m
10
1
0.1
*Doses represent the lowest dose tested per study that produced a tumorigenic 0.01 response and do not imply the existence of a threshold for the cancer endpoint.
c-Cat -Humans f-Ferret n-Mink Cancer Effect Level-Animals Cancer Effect Level-Humans LD50/LC50d-Dog k-Monkey j-Pigeon o-Other LOAEL, More Serious-Animals LOAEL, More Serious-Humans Minimal Risk Levelr-Rat m-Mouse e-Gerbil LOAEL, Less Serious-Animals LOAEL, Less Serious-Humans for effectsp-Pig h-Rabbit s-Hamster NOAEL - Animals NOAEL - Humans other thanq-Cow a-Sheep g-Guinea Pig Cancer
ETH
YLB
EN
ZEN
E
3. HE
ALTH
EFFE
CTS
58
59 ETHYLBENZENE
3. HEALTH EFFECTS
The systemic effects observed after inhalation exposure are discussed below. The highest NOAEL values
and all reliable LOAEL values for systemic effects in each species and duration category are recorded in
Table 3-1 and plotted in Figure 3-1.
Respiratory Effects. Male volunteers reported throat and nasal irritation and feelings of “chest
constriction” during a 6-minute inhalation exposure to 2,000 ppm ethylbenzene (Yant et al. 1930). More
severe throat and nasal irritation were reported immediately upon exposure to 5,000 ppm ethylbenzene.
No data on pulmonary function were reported (Yant et al. 1930). No bronchospastic response was
observed in two subjects challenged with 55 ppm ethylbenzene for 15 minutes in an inhalation chamber,
based on comparison of pre- and post-exposure pulmonary function tests (Moscato et al. 1987).
Results of acute studies in animals indicate that inhalation of ethylbenzene produces adverse respiratory
effects ranging from irritation to pulmonary congestion. Nasal irritation (based on nose rubbing) was
observed in guinea pigs exposed to 1,000 ppm for 3 and 8 minutes and to 2,000, 5,000, and 10,000 ppm
for 480, 30, and 10 minutes, respectively (Yant et al. 1930). Gross histopathology revealed congestion
and edema in the lungs of animals that died after exposure to 10,000 ppm ethylbenzene, with less severe
effects observed in surviving animals. Pulmonary congestion also was observed in rats and mice that died
during exposure a 4-day exposure to 2,400 and ≥1,200 ppm ethylbenzene, respectively (Ethylbenzene
Producers Association 1986a). A 50% reduction in breathing rate was observed in mice exposed to
1,432 ppm for 5 minutes (De Ceaurriz et al. 1981) and 4,060 ppm for 30 minutes (Nielsen and Alarie
1982). No adverse respiratory effects were observed in rats exposed to 2,000 ppm for 3 days (Toftgard
and Nilsen 1982) or in rats, mice, and rabbits exposed to 1,200, 400, or 2,400 ppm, respectively, for
4 days (Ethylbenzene Producers Association 1986a).
Adverse respiratory effects attributed to intermediate- or chronic-duration inhalation exposures to
ethylbenzene have been observed in animals. Relative lung weight was increased in male rats exposed to
975 ppm for 90 days, although increased absolute and relative lung weights were observed only in female
rats exposed to 246 ppm ethylbenzene, but not to higher concentrations (NTP 1992). Pulmonary lesions
(inflammatory cell infiltrate) were observed in male rats exposed to ≥246 ppm for 90 days (NTP 1992).
However, the NTP Pathology Working Group considered these effects to be more typical of an infectious
agent than a response to the test compound; therefore, pulmonary findings were not attributed to
ethylbenzene exposure. No histopathological changes were observed in rats exposed to 2,200 ppm,
guinea pigs or rabbits exposed 1,250 ppm, or monkeys exposed to 600 ppm ethylbenzene for 6 months
(Wolf et al. 1956); however, the utility of this study is limited by a general lack of study details (e.g., no
60 ETHYLBENZENE
3. HEALTH EFFECTS
exposure or control data were provided) and the small size of exposure groups (1–2 rabbits or monkeys
per group). No histopathological findings clearly attributable to ethylbenzene were observed in
respiratory tissue of rats or mice exposed to up to 750 ppm ethylbenzene for 2 years (NTP 1999).
Although the incidences of edema, congestion, and hemorrhage observed in male rats in the 750 ppm
group were increased relative to control rats, observations were considered to be agonal changes in
moribund animals and not directly related to chemical toxicity (NTP 1999).
Cardiovascular Effects. Intermediate and chronic exposure of animals to inhaled ethylbenzene does
not appear to produce adverse cardiovascular effects, based on results of histopathological examinations.
No adverse histopathological effects were reported in cardiac tissue of rats or mice exposed to 782 ppm or
rabbits exposed to 1,610 ppm ethylbenzene for 4 weeks (Cragg et al. 1989). Similarly, no cardiovascular
effects were observed in rats or mice exposed to 975 ppm ethylbenzene for 90 days (NTP 1992) or in rats
exposed to 2,200 ppm, guinea pigs or rabbits exposed to 1,250 ppm, or monkeys exposed to 600 ppm
ethylbenzene for 6 months (Wolf et al. 1956). No adverse histopathological findings were observed in
cardiovascular tissues of rats or mice exposed to 750 ppm ethylbenzene for 2 years (NTP 1999).
Gastrointestinal Effects. No adverse effects on the gastrointestinal system have been observed
following intermediate or chronic inhalation exposure of animals. No changes in gross appearance or
adverse histopathological effects were observed in the intestines of rats and mice exposed to 782 ppm or
rabbits exposed to 1,610 ppm ethylbenzene for 4 weeks (Cragg et al. 1989). No adverse histopathological
changes in gastrointestinal tissue were observed in rats or mice exposed to ≤975 ppm ethylbenzene for
90 days (NTP 1992) or in rats or mice exposed to ≤750 ppm ethylbenzene for 2 years (NTP 1999).
Hematological Effects. Two studies involving long-term monitoring of workers occupationally
exposed to ethylbenzene were located (Angerer and Wulf 1985; Bardodej and Cirek 1988). Angerer and
Wulf (1985) reported increased lymphocyte count and decreased hemoglobin concentration in male
varnish workers exposed to a mixture of solvents, including ethylbenzene, compared to an unexposed
control group. Workers were employed for an average of 8.2 years and exposed to an average
ethylbenzene concentration of 1.64 ppm. Average lymphocyte levels increased (41.5–68.8%) and
average hemoglobin values decreased (5.2–7.1%) in exposed workers, compared to unexposed controls.
However, due to concomitant exposure to other chemicals (xylenes, lead, toluene), the relationship of
adverse hematological effects to inhaled ethylbenzene cannot be established. No adverse hematological
effects were seen in male workers employed at an ethylbenzene manufacturing facility over a 20-year
period, compared to unexposed control workers (Bardodej and Cirek 1988). Although no information on
61 ETHYLBENZENE
3. HEALTH EFFECTS
ethylbenzene concentrations was reported, an estimated concentration of 6.4 mg/m3 was derived from a
mean post-shift in urinary mandelic acid concentration in workers, based on the relationship between
ethylbenzene concentrations in air and urinary mandelic acid concentration in a chamber-exposed group
(Bardodej and Bardodejova 1988). However, given the low exposure concentration, this study had
limited power to detect any effect.
Studies using animal models yield conflicting results regarding hematological effects of inhaled
ethylbenzene. Platelet count was significantly decreased in male rats and mean total leukocyte count was
significantly increased in female rats exposed to 782 ppm ethylbenzene for 4 weeks; hematological
effects were not observed in male or female rats exposed to ≤382 ppm, mice exposed to ≤782 ppm, or
rabbits exposed to ≤1,610 ppm (Cragg et al. 1989). Similarly, no hematological effects were observed in
female rats exposed to ≤500 ppm ethylbenzene vapor daily for 28 days, based results of complete blood
count with differential and assessments of erythrocyte morphology and hemoglobin content (Stump
2004). No adverse hematological effects were observed in rats or mice exposed to 975 ppm ethylbenzene
for 90 days (NTP 1992), or in rats exposed to ≤2,200 ppm, guinea pigs or rabbits exposed ≤1,250 ppm, or
monkeys exposed to ≤600 ppm ethylbenzene for 6 months (Wolf et al. 1956).
Musculoskeletal Effects. No musculoskeletal effects have been observed in laboratory animals
exposed to inhaled ethylbenzene for intermediate or chronic durations. No bone tissue abnormalities
were observed upon histopathological examination of tissue from rats and mice exposed to 782 ppm and
rabbits exposed to 1,610 ppm for 4 weeks (Cragg et al. 1989). Similarly, no adverse effect on bone tissue
was observed in rats or mice exposed to 975 ppm ethylbenzene for 90 days (NTP 1992) or 750 ppm for
2 years (NTP 1999).
Hepatic Effects. No adverse effects on liver function, as measured by serum liver enzyme activities,
were observed in male workers employed at an ethylbenzene manufacturing facility over a 20-year period
(Bardodej and Cirek 1988). Although no information on ethylbenzene concentrations was reported, an
estimated concentration of 6.4 mg/m3 was derived as described above under hematological effects
(Section 3.2.1.3). Given the low exposure concentration, this study had limited the power to detect any
effect.
Results of studies in laboratory animals have found various effects on the liver, including induction of
cytochrome P-450, changes in liver weight (at least in part related to induction of cytochrome P-450),
changes in hepatocyte ultrastructure consistent with induction of smooth endoplasmic reticulum, and
62 ETHYLBENZENE
3. HEALTH EFFECTS
histopathological changes, including hepatocyte necrosis. Increased liver weights, induction of hepatic
drug metabolizing enzymes, and changes in hepatocyte ultrastructure (consistent with induction of
smooth endoplasmic reticulum) have been observed in rats following acute inhalation exposure to
ethylbenzene. Concentration-related increases in absolute and relative liver weights were reported in
male rats exposed to ≥400 ppm ethylbenzene for 3–4 days, although no histopathological changes were
observed (Ethylbenzene Producers Association 1986a). Increased relative liver weight, increased hepatic
concentration of cytochrome P-450, and induction of hepatic microsomal enzymes (NADPH-cytochrome
reductase, 7-ethoxycoumarin O-deethylase) were reported in rats exposed to 2,000 ppm ethylbenzene
concentrations for 3 days (Toftgard and Nilsen 1982). Similarly, hepatic drug metabolizing enzymes
(UDP glucuronyl-transferase, D-glucuronolactone dehydrogenase) were increased in male rats exposed to
50 ppm ethylbenzene for 2 weeks, and ethyoxycoumarin o-deethylase was increased at 300 ppm
(Elovaara et al. 1985). Electron microscopy showed changes in hepatocyte ultrastructure consistent with
induction of cytochrome P-450 (e.g., smooth endoplasmic reticulum proliferation, slight degranulation of
rough endoplasmic reticulum) in rats exposed to 600 ppm ethylbenzene for 2 weeks (Elovaara et al.
1985). Hepatic changes following acute exposure to ethylbenzene are consistent with induction of
hepatic microsomal enzymes.
Similar hepatic effects (liver weights, induction of hepatic drug metabolizing enzymes, and changes in
hepatocyte ultrastructure) also have been reported in laboratory animals exposed to inhaled ethylbenzene
for intermediate exposure durations. Significant increases in relative liver weight were observed in
female rats exposed to ≥250 ppm ethylbenzene for 15 days (Saillenfait et al. 2006), rats and mice exposed
to 782 ppm ethylbenzene for 4 weeks (Cragg et al. 1989), pregnant and nonpregnant rats and pregnant
rabbits exposed to 1,000 ppm ethylbenzene for 3 weeks prior to mating and throughout gestation (NIOSH
1981), and rats and mice exposed to 246 and 740 ppm ethylbenzene, respectively, for 90 days (NTP
1992). Increased liver weight was also observed in rats exposed to 400 ppm, and guinea pigs and
monkeys exposed to 600 ppm ethylbenzene for 6 months (Wolf et al. 1956). Hepatic microsomal
enzymes (total cytochrome P-450 protein, 7-ethoxycoumarin O-deethylase, aminopyrine N-demthylase)
were induced in rats exposed to 50 ppm ethylbenzene for 16 weeks and changes in hepatocyte
ultrastructure (e.g., smooth endoplasmic reticulum proliferation, slight degranulation of rough
endoplasmic reticulum) in rats exposed to ethylbenzene from 2 to 15 weeks (Elovaara et al. 1985).
Other histopathological findings in animals exposed to inhaled ethylbenzene were moderate to marked
hypertrophy of periportal hepatocytes with clear cytoplasm in female rats exposed to ≥250 ppm
ethylbenzene for 15 days (the investigators noted that minimal hypertrophy was observed in controls)
63 ETHYLBENZENE
3. HEALTH EFFECTS
(Saillenfait et al. 2006) and a cloudy swelling of hepatocytes of rats exposed to 2,200 ppm for 6 months
(Wolf et al. 1956). Slight, statistically significant increases in relative liver weights (≤7% compared to
controls) were observed in male and female B6C3F1 mice exposed to 750 ppm, but not 75 ppm,
ethylbenzene vapor for 1 or 4 weeks (Stott et al. 2003). Histopathological assessment showed
hepatocellular hypertrophy, mitotic figures, and S-phase DNA synthesis in mice exposed to 750 ppm
ethylbenzene vapor for 1 or 4 weeks, but serum activities of hepatic enzymes (alanine transaminase,
asparatate transpeptidase, alkaline phosphatase, and γ-glutamyl trnaspeptidase) were not elevated
compared to controls. No histopathological changes in the liver were observed in rats or mice exposed to
246 and 740 ppm, respectively, for 90 days (NTP 1992).
Chronic exposure of mice, but not rats, to inhaled ethylbenzene for 2 years produced hepatic toxicity, as
indicated by histopathological changes (syncytial alterations of hepatocytes, hepatocellular hypertrophy,
and hepatocyte necrosis) (NTP 1999). Syncytial alterations (enlarged hepatocytes with multiple nuclei),
which were concentration-related in incidence and severity, were observed at in male mice exposed to
≥75 ppm ethylbenzene, and hepatocyte hypertrophy and necrosis were observed in male mice exposed to
750 ppm. In female mice exposed to 750 ppm ethylbenzene for 2 years, the incidence and severity of
eosinophilic foci, which was considered to be a preneoplastic lesion, was increased.
Renal Effects. Renal effects of acute and intermediate exposure to inhaled ethylbenzene are primarily
limited to minimally adverse effects, including increased kidney weight in rats and mice and induction of
microsomal enzymes in rats. However, chronic exposure of male and female rats results in more serious
renal effects, including nephropathy, renal tubule hyperplasia, and renal tubular adenomas and
carcinomas (see Section 3.2.1.7, Cancer). In addition, effects associated with accumulation of
α2µ-globulin and hyaline droplets have been observed in male rats exposed to inhaled ethylbenzene.
Accumulation of α2µ-globulin in the renal tubule epithelial cells of male rats is associated with tubular
epithelial necrosis, regenerative proliferation, and renal tumors. This accumulation is not observed in
female rats, mice, or humans (which lack that protein), or in male rats, which are genetically lacking
α2µ-globulin. Adverse effects in male rats associated with renal accumulation of α2µ-globulin are
therefore not considered relevant to humans (EPA 1991d). However, since renal toxicity of chronic
exposure to inhaled ethylbenzene has been observed in female rats, renal effects associated with
ethylbenzene are relevant to humans.
Acute exposure to inhaled ethylbenzene had been reported to produce increases in kidney weight, induce
renal microsomal enzymes, and enhance renal hyaline droplets in rats of both sexes. In male rats only,
64 ETHYLBENZENE
3. HEALTH EFFECTS
this accumulation includes α2µ-globulin, but evidently other proteins are involved in females, and
probably also in the males. Relative kidney weight was significantly increased (11–20%) in male rats
exposed to 2,000 ppm for 2 days (Toftgard and Nilsen 1982) and 1,200 ppm ethylbenzene for 4 days
(Ethylbenzene Producers Association 1986a), and in male and female rats exposed to 750 ppm
ethylbenzene (6–7%), but not at 75 ppm, for 1 week (Stott et al. 2003). Although no change in renal
histopathology accompanied increased kidney weight in rats exposed to 1,200 ppm ethylbenzene for
4 days (Ethylbenzene Producers Association 1986a), increased accumulation of α2µ-globulin and hyaline
droplets were observed after 1 week in the kidneys of male rats exposed to 750 ppm ethylbenzene
compared to controls (Stott et al. 2003). Renal congestion was reported in rats and mice that died during
exposure to 2,400 or 1,200 ppm ethylbenzene, respectively (Ethylbenzene Producers Association 1986a).
Induction of renal cytochrome P-450 microsomal enzymes (7-ethoxycoumarin, O-deethylase, UDP
glucuronyl-transferase, NADPH-cytochrome c reductase) was reported in rats following a 3-day exposure
to 2,000 ppm ethylbenzene (Toftgard and Nilsen 1982).
Renal effects of intermediate-duration exposure to inhaled ethylbenzene are similar to those observed
following acute exposure (increased kidney weight, induction of renal microsomal enzymes, and changes
associated with accumulation of α2µ-globulin). Several studies have shown that exposure of rats or mice
to inhaled ethylbenzene for durations of 4 weeks –7 months increases relative kidney weight (Elovaara et
al. 1985; NIOSH 1981; NTP 1999; Stott et al. 2003; Wolf et al. 1956). Concentration-related increases in
renal microsomal enzymes (7-ethoxycoumarin O-deethylase, UDP glucuronyl-transferase) and renal
glutathione concentration were reported in rats following a 5–16-week exposure to ethylbenzene at
concentrations ranging from 50 to 600 ppm (Elovaara et al. 1985). Histopathological changes in the
kidney include α2µ-globulin-associated changes (nuclear-size and staining variations and vacuolation or
decreased amount of cytoplasm) in male rats exposed to 750 ppm for 4 weeks (Stott et al. 2003) and
swelling of the tubular epithelium in rats exposed to 600 ppm ethylbenzene for up to 7 months (Wolf et
al. 1956).
Chronic exposure of male and female rats, but not mice, to inhaled ethylbenzene for 2 years resulted in
nephropathy and renal tubule hyperplasia (NTP 1999). Although age-related nephropathy was observed
in control rats, the severity was increased compared to controls in female rats exposed to ≥75 ppm and
male rats exposed to 750 ppm. The incidence of renal tubular hyperplasia (considered as a preneoplastic
effect) was increased in male and female rats exposed to 750 ppm. NTP (1999) concluded that
ethylbenzene may have exacerbated the development of age-related nephropathy in rats and that renal
65 ETHYLBENZENE
3. HEALTH EFFECTS
tubular lesions were related to exposure. Additional information pertaining to renal carcinogenesis is
provided in Section 3.2.1.7.
Endocrine Effects. Adverse endocrine effects, based on histopathological examinations of endocrine
tissues, have not been observed in laboratory animals exposed to inhaled ethylbenzene for 4 weeks to
6 months (Cragg et al. 1989; NTP 1992; Wolf et al. 1956), although chronic exposure is reported to
produce hyperplasia of the thyroid and pituitary (NTP 1999). Mice exposed to 750 ppm ethylbenzene for
2 years showed an increased incidence of follicular cell hyperplasia in the thyroid gland. In female mice
exposed to ≥250 ppm ethylbenzene, the incidences of hyperplasia of the pituitary gland pars distalis were
significantly greater than those in the control group. No effects on other endocrine tissues were observed
in mice and no effects on any endocrine tissue were observed in rats exposed to 750 ppm ethylbenzene for
2 years (NTP 1999).
Ocular Effects. Ocular effects observed in humans and animals after inhalation exposure to
ethylbenzene are presumed to be due to direct contact of the eyes with ethylbenzene vapor. These effects
are discussed in Section 3.2.3.2.
Body Weight Effects. Studies in animals examined body weight effects in acute-, intermediate-, and
chronic-duration inhalation exposure to ethylbenzene. Mean body weight was not affected in rats or mice
exposed to 400 ppm or in rabbits exposed to 2,400 ppm ethylbenzene for 4 days (Ethylbenzene Producers
Association 1986a). Rats exposed to 1,200 ppm showed a mean body weight that was lower than in
control animals. No effect on body weight was observed in rabbits after 7 days of exposure to 750 ppm
(Romanelli et al. 1986).
No changes in body weight were observed in pregnant rats or rabbits exposed to 985 and 962 ppm
ethylbenzene, respectively, for 3 weeks prior to mating and throughout gestation (NIOSH 1981). A
decrease in body weight gain of 26–48% at weeks 2, 5, and 9, but not at week 16 was observed in male
rats exposed to 600 ppm ethylbenzene for 16 weeks (Elovaara et al. 1985). No adverse effect on body
weight was observed in rats or mice exposed to 782 ppm or rabbits exposed to 1,610 ppm ethylbenzene
for 4 weeks (Cragg et al. 1989). In female rats exposed to up to 500 ppm ethylbenzene daily for 28 days,
no effects on body weight were observed (Stump 2004). No effect on body weight was observed in rats
and mice exposed to 975 ppm ethylbenzene for 90 days (NTP 1992). Similarly, no biologically
significant effect on body weight was observed in rats and mice exposed to concentrations of
ethylbenzene of up to 750 ppm for 2 years (NTP 1999).
66 ETHYLBENZENE
3. HEALTH EFFECTS
3.2.1.3 Immunological and Lymphoreticular Effects
Angerer and Wulf (1985) reported increased lymphocyte counts in male varnish workers exposed to a
mixture of solvents, including ethylbenzene, compared to an unexposed control group. Workers were
employed for an average of 8.2 years and exposed to an average ethylbenzene concentration of 1.64 ppm.
Average lymphocyte levels increased (41.5–68.8%) in exposed workers, compared to unexposed controls.
However, due to concomitant exposure to other chemicals (xylenes, lead, toluene), the relationship of
adverse hematological effects to inhaled ethylbenzene cannot be established.
Mean total leukocyte count was significantly increased in female rats expose to 782 ppm ethylbenzene,
but not ≤382 ppm, for 4 weeks (Cragg et al. 1989). Absolute and relative spleen weights were increased
in pregnant rats exposed to 1,000 ppm ethylbenzene during pre-mating and gestation or gestation alone,
although histopathological changes were not observed (NIOSH 1981). Spleen weight was not affected in
rabbits exposed to 1,000 ppm during gestation (NIOSH 1981). No histopathological changes were
observed in bone marrow (sternum), lymph nodes, thymic region, or spleen of rats or mice exposed to
782 ppm or rabbits exposed to 1,610 ppm ethylbenzene for 4 weeks (Cragg et al. 1989). In female rats
exposed to ethylbenzene at concentrations up to 500 ppm for 6 hours/day, no effects were observed on
humoral immunity (as assessed by the IgM antibody-forming response to the T cell-dependent antigen
sheep erythrocytes), thymus or spleen weight, or blood leukocyte populations (Stump 2004). No
treatment-related effect on the histopathology of several lymphoreticular tissues, including bronchial
lymph nodes, regional lymph nodes, mandibular and mesenteric lymph nodes, mediastinal lymph nodes,
spleen, or thymus were observed in rats and mice exposed to 975 ppm ethylbenzene for 90 days (NTP
1992) or 750 ppm for 2 years (NTP 1999).
The highest NOAELs for immunological and lymphoreticular effects in each species for intermediate- or
chronic-duration exposure are reported in Table 3-1 and plotted in Figure 3-1.
3.2.1.4 Neurological Effects
Symptoms of dizziness accompanied by vertigo have been observed in humans acutely exposed to air
concentrations of ethylbenzene ranging from 2,000 to 5,000 ppm for 6 minutes (Yant et al. 1930).
Workers exposed occupationally for a mean of 13 years to solvent mixtures that include ethylbenzene
(mean ethylbenzene exposure level 1.8 ppm) showed a 58% incidence of hearing loss compared to
67 ETHYLBENZENE
3. HEALTH EFFECTS
36% in the reference group (Sliwinska-Kowalska et al. 2001). Hearing losses (expressed as increased
hearing thresholds) were observed at all frequencies and appeared to range from 3 to 8 dB. The role of
ethylbenzene in the observed losses cannot be ascertained from this study given that ethylbenzene was
only one of several solvents, most of which were present at mean concentrations 1.5–3.5 times higher
than ethylbenzene.
Neurological effects have been observed in several animals following acute-duration exposure to inhaled
ethylbenzene, although there is considerable variability in species sensitivity. In general, central nervous
system depression is associated with acute exposure to higher concentrations, whereas stimulation of the
motor nervous system is associated with lower concentrations. The most serious adverse neurological
effect associated with acute- and intermediate-duration inhalation exposure to ethylbenzene is ototoxicity,
characterized by deterioration in auditory thresholds and alterations of cochlear morphology.
Clinical signs of general central nervous system depression or increased motor activity have been
observed in animals acutely exposed to inhaled ethylbenzene. Moderate activation in motor behavior was
observed in rats following a 4-hour inhalation exposure to levels of ethylbenzene ranging from 400 to
1,500 ppm, whereas narcotic effects were observed at higher ethylbenzene concentrations (2,180–
5,000 ppm) (Molnar et al. 1986). This study is limited by a lack of methodological detail and appropriate
statistical analysis. Central nervous system depression (unconsciousness) and ataxia were observed in
guinea pigs exposed to 2,000 ppm ethylbenzene for acute-duration periods (Yant et al. 1930). Salivation,
prostration, and/or reduced activity were observed in rats and mice exposed to 2,400 or 1,200 ppm
ethylbenzene, respectively, for 4 days (Ethylbenzene Producers Association 1986a). However, rabbits
exposed to 2,400 ppm ethylbenzene for the same period showed no adverse behavioral effects. Exposure
of mice to ethylbenzene for 20 minutes to ≥2,000 ppm produced changes in posture; decreased arousal
and rearing; increased ease of handling; disturbances of gait, mobility, and righting reflex; decreased
forelimb grip strength; increased landing foot splay; and impaired psychomotor coordination (Tegeris and
Balster 1994). These acute effects were short-lived and more pronounced during exposure than after
exposure, with recovery beginning within minutes of removal from the exposure chamber. Sensorimotor
reactivity also decreased. Acute exposure of rats and mice to 245 and 342 ppm, respectively (Frantik et
al. 1994), resulted in a 30% depression of evoked electrical activity in the brain immediately after
exposure.
General signs of neurotoxicity have not been observed in animals exposed to inhaled ethylbenzene for
intermediate or chronic durations, although ethylbenzene concentrations evaluated in intermediate- and
68 ETHYLBENZENE
3. HEALTH EFFECTS
chronic-duration studies were lower than those evaluated in acute studies. No behavioral changes,
clinical signs of neurotoxicity or histopathological alterations of neurological tissues were observed in
rats or mice exposed to concentrations of up to 782 ppm or rabbits exposed to concentrations up to
1,610 ppm ethylbenzene for 4 weeks. Sporadic salivation was noted in rats at doses of ≥382 ppm (Cragg
et al. 1989). In a 90-day study (NTP 1992), rats and mice showed no adverse histopathological effects on
brain tissue at doses up to 975 ppm. No adverse effects were noted in the brain tissues of rats and mice
exposed to concentrations of ethylbenzene of up to 750 ppm for 2 years (NTP 1999).
Ototoxic effects of inhaled ethylbenzene have been observed following acute- or intermediate-duration
exposure of rats. Effects are characterized by deterioration in auditory thresholds and alterations of
cochlear morphology. Male rats exposed to ethylbenzene at 800 ppm, 8 hours/day for 5 days showed
significant deterioration in auditory thresholds (threshold shifts were 10–20 and 17–28 dB using two
methods) 1 and 4 weeks after the exposure had ceased (Cappaert et al. 1999). The magnitude of the
increase in thresholds did not change between assessments conducted on post-exposure weeks 1 and 4;
threshold shifts were evident at all tested frequencies (1–24 kHz). Eight to 11 weeks after exposure, a
significant loss (52–66%) of outer hair cells (OHCs) in the organ of Corti in the auditory region
corresponding to 11–21 kHz was observed. No loss of inner hair cells (IHCs) was found in the exposed
animals (Cappaert et al. 1999). Similarly, auditory threshold shifts (approximately 15–30 dB) and OHC
losses (25–75%) were observed 3–6 weeks after exposure in male rats exposed to 400 or 550 ppm
ethylbenzene, 8 hours/day for 5 days. Auditory thresholds and OHC counts were not affected in rats
exposed to 300 ppm ethylbenzene (Cappaert et al. 2000, 2001). Cappaert et al. (2002) demonstrated a
significant species difference in the susceptibility of rats and guinea pigs to the ototoxic effects of
ethylbenzene. Guinea pigs exposed to ethylbenzene at 2,500 ppm, 6 hours/day for 5 days did not show
auditory deficits or losses in OHCs. There was no loss of IHCs in either species (Cappaert et al. 2002).
Auditory deficits persisted unchanged throughout the 13-week exposure period and the 8-week post-
exposure recovery period in rats exposed to ≥400 ppm ethylbenzene (Gagnaire et al. 2007). Histological
assessments conducted after the 8-week recovery period showed significant losses in OHCs in rats
exposed to ≥200 ppm ethylbenzene, 6 hours/day, 6 days/week for 13 weeks (Gagnaire et al. 2007). IHC
losses (14–32%) were observed in rats exposed to 600 and 800 ppm ethylbenzene, but only occasionally
in rats exposed to 400 ppm (Gagnaire et al. 2007).
The highest NOAEL values and all reliable LOAEL values for neurological effects in each species and
duration category are recorded in Table 3-1 and plotted in Figure 3-1.
69 ETHYLBENZENE
3. HEALTH EFFECTS
3.2.1.5 Reproductive Effects
No studies were located regarding reproductive effects in humans following inhalation exposure to ethyl-
benzene.
No adverse effects on reproduction were observed in female rats and rabbits exposed to approximately
100 or 1,000 ppm ethylbenzene for 3 weeks prior to mating and throughout gestation (NIOSH 1981).
Reproductive function and outcome was assessed in a 2-generation reproductive toxicity study in rats
exposed to 25, 100, or 500 ppm ethylbenzene starting with a pre-mating exposure of ≥70 days and
continuing through gestation day 20, lactation day 5–21, and postnatal day 21 (Faber et al. 2006). On
lactational days 1–4 for F0 and F1 dams, inhalation exposure was discontinued and oral ethylbenzene (in
corn oil at doses of 0, 26, 90, or 342 mg/kg/day) was administered; inhalation exposure was re-initiated
on lactational day 5 and maintained for the remainder of the exposure period. Oral exposure on
lactational days 1–4 was intended to provide the same maternal blood concentrations as inhalation
exposure. Estrous cycle length was significantly reduced in F0 rats in the 500-ppm group (4.0 days vs.
4.4 days in controls), but was not altered in the F1 females. Reproductive parameters (mating or fertility
indices, gestation length, number of implantation sites, number of births/litter, and litter size) were not
affected in F0 or F1 females (or males, as appropriate) exposed to 25–500 ppm ethylbenzene.
No treatment-related histopathological changes were noted in the testes of rats, mice, or rabbits exposed
to concentrations as high as 2,400 ppm ethylbenzene for 4 days (Ethylbenzene Producers Association
1986a). No testicular histopathological abnormalities were reported in rats and mice exposed to 782 ppm
and rabbits exposed to ethylbenzene concentrations as high as 1,610 ppm for 4 weeks (Cragg et al. 1989).
NTP (1992) reported no effect on sperm or testicular morphology or on the length of the estrous cycle in
rats or mice exposed to 975 ppm ethylbenzene for 90 days. Mice showed a decrease in epididymal
weight in the 1,000-ppm group; however, this observation was not considered biologically significant
since there was no significant difference in spermatid counts, sperm motility, or weight of the caudal
epididymis among treated and control animals. Inhalation exposure of male monkeys and rabbits to
600 ppm ethylbenzene for 6 months produced degeneration of germinal epithelium in the testes of one
monkey and one rabbit (Wolf et al. 1956). No adverse histopathological effects were seen in the testes of
rats or guinea pigs exposed to concentrations up to 1,250 or 600 ppm, respectively, for 6–7 months (Wolf
et al. 1956). In a 2-generation reproduction study, no effects were observed on sperm number, motility,
and morphology in F0 and F1 rats exposed to 25–500 ppm ethylbenzene (Faber et al. 2006).
70 ETHYLBENZENE
3. HEALTH EFFECTS
The highest NOAEL values and all reliable LOAEL values for reproductive effects in each species for
acute-, intermediate-, and chronic-duration are recorded in Table 3-1 and plotted in Figure 3-1.
3.2.1.6 Developmental Effects
No studies were located regarding developmental effects in humans following inhalation exposure to
ethylbenzene.
The developmental effects of inhaled ethylbenzene have been studied in rats (NIOSH 1981; Ungváry and
Tátrai 1985), mice (Ungváry and Tátrai 1985), and rabbits (NIOSH 1981; Ungváry and Tátrai 1985)
exposed during gestation or pre-mating and gestation; rats exposed from pre-gestation through lactation
(Faber et al. 2006); and in a 2-generation reproduction study in rats (Faber et al. 2007). Results of studies
in rats indicate that ethylbenzene produces reduced fetal weight, skeletal anomalies, and anomalies and
delayed development of urogenital tract; skeletal and urogenital anomalies were observed in the presence
of maternal toxicity (Faber et al. 2006; NIOSH 1981; Ungváry and Tátrai 1985). Studies conducted by
Faber et al. (2006, 2007) and NIOSH (1981) are of high quality and guideline-compliant. However,
usefulness of the Ungváry and Tátrai (1985) study is hampered by incomplete descriptions of the results
and because an analysis of the results on a per litter basis was not provided.
In rats, continuous inhalation exposure to ethylbenzene on gestational days 7–15 to concentrations
ranging from 138 to 552 ppm resulted in fetal resorption and skeletal retardation (Ungváry and Tátrai
1985). Retarded skeletal development was observed in 13, 26, 30, and 35% of fetuses exposed to 138,
276, and 552 ppm ethylbenzene, respectively. Increased incidence of extra ribs and anomalies of the
urinary tract (specific effects not reported) were observed in 7% of fetuses at 552 ppm, compared to 1%
in controls. Maternal toxicity was reported to be moderate and dose-dependent, but data were not
presented. In this same study, the incidence of anomalies of the uropoietic apparatus (not specified) was
observed in the offspring of mice exposed to 115 ppm ethylbenzene on gestation days 6–15. Anomalies
of the uropoietic apparatus were not observed in other developmental studies (Faber et al. 2006, 2007;
Saillenfait et al. 2003, 2006, 2007). In rabbits continuously exposed to ethylbenzene on gestation days 7–
20, decreases in female fetal body weights were observed at 115 ppm and an increase in abortions
(3/3 does aborted compared to 0/60 in controls) were observed at 230 ppm. The Ungváry and Tátrai
(1985) study did not include sufficient details regarding the adverse fetal effects, dictating caution in the
interpretation of study findings.
71 ETHYLBENZENE
3. HEALTH EFFECTS
In a NIOSH sponsored study conducted by Andrews et al. (NIOSH 1981), increases in the incidences of
fetuses with extra ribs were observed in the offspring of rats exposed to 100 or 1,000 ppm ethylbenzene
through gestation day 19 or 1,000 ppm during pre-mating and gestation. The incidence of supernumerary
ribs was increased only in the offspring of rats exposed to 1,000 ppm during gestation. Reduced pup
crown-rump length and an increased incidence of supernumerary ribs were observed in the offspring of
rats exposed to 1,000 ppm during gestation, but not in the offspring of rats exposed to 1,000 ppm during
pre-mating and gestation. No other significant increases in major malformations or minor anomalies were
observed. There was some evidence of maternal toxicity (increased relative liver, kidney, and spleen
weights) in rats exposed to 1,000 ppm ethylbenzene during pre-mating and gestation or gestation only
(NIOSH 1981).
Statistically significant reductions in fetal body weight were observed in the offspring of pregnant rats
exposed to ≥1,000 ppm ethylbenzene during gestation (Saillenfait et al. 2003, 2006, 2007), but not in rats
exposed to 500 ppm (Saillenfait et al. 2003) or 250 ppm (Saillenfait et al. 2006, 2007). A significant
increase in the number of fetuses with fetal malformations (mostly skeletal variations) was observed in
the offspring of rats exposed to ≥1,000 ppm ethylbenzene (Saillenfait et al. 2003, 2006, 2007). On a per
litter basis, a significant increase in the incidence of fetal malformations was observed only at 2,000 ppm
(Saillenfait et al. 2003). Maternal toxicity was observed in rats exposed to ≥1,000 ppm, as indicated by
significant reductions in maternal weight gain compared to control animals (Saillenfait et al. 2003, 2006,
2007).
Survival from birth to postnatal days (PND) 4 and 21 was not affected in F1 or F2 offspring of pregnant
rats exposed to ethylbenzene at 25, 100, or 500 ppm during premating, mating, gestation, and lactation
(Faber et al. 2006). A statistically significant delay in balanopreputial separation was observed in F1
males in the 500 ppm group, although the mean age at separation in that group (44.7 days) was similar to
that observed in historical controls (44.8 days). No exposure-related macroscopic findings or changes in
organ weight in F1 pups necropsied on PND 21 were observed.
Results of a 2-generation reproduction study in rats show that the mean age at acquisition of vaginal
patency was significantly reduced in F1 females at 25, 100, and 500 ppm; however, the values in the
treated groups (33.3–33.9 days) were similar to the historical control value (33.4 days) in the conducting
laboratory (Faber et al. 2006). F2 generation pups (which were not exposed to ethylbenzene by
inhalation) did not show differences from controls in the age at preputial separation or vaginal patency
72 ETHYLBENZENE
3. HEALTH EFFECTS
(Faber et al. 2007). Developmental landmarks (pinna detachment, hair growth, incisor eruption, and eye
opening) were not affected in F1 male or female pups exposed to 25–500 pm ethylbenzene (Faber et al.
2006); however, in the F2 generation, statistically significant delays in hair growth were observed in
males and females in all exposure groups and eye opening was significantly delayed in males the 25 and
100 ppm groups, but not in the 500 ppm group (Faber et al. 2007). Neurodevelopmental tests conducted
on subsets of the F2 offspring (Faber et al. 2007) did not show statistically significant differences from
controls in a functional observational battery assessment or in fore- or hind-limb grip strength. Although
the data suggest an increase in motor activity in F2 males and females in the 25–500 ppm groups on
PNDs 13 and 17, there were no statistical differences in motor activity on PNDs 13, 17, and 21 between
exposed and control animals (Faber et al. 2007). A statistically significant increase in motor activity was
observed on PND 61 in F2 females in the 25 ppm group only. Startle response was not affected in F2 rats
of either sex on PND 20 or females on PND 60; F2 males showed statistically lower startle responses, but
this was attributed to highly variable and abnormal responses in some control animals. Swimming ability,
learning, and memory assessments conducted in a Biel water maze did not reveal any significant effects
in F2 animals in any of the exposure groups (Faber et al. 2007). No morphometric or histologic effects in
brains of F2 animals were observed from any exposure group on PND 21 or 72 (Faber et al. 2007).
Reduced fetal weight was observed in female rats exposed to 115 ppm during gestation (Ungváry and
Tátrai 1985). In the offspring of rabbits exposed to ethylbenzene, no treatment-related effects were
observed in fetal size, placental weight, or intrauterine growth retardation and there were no significant
incidences of major malformations, minor anomalies, or common variants observed in the absence of
maternal toxicity (NIOSH 1981).
The highest NOAEL values and all reliable LOAEL values for developmental effects in each species and
duration category are recorded in Table 3-1 and plotted in Figure 3-1.
3.2.1.7 Cancer
No association has been found between the occurrence of cancer in humans and occupational exposure to
ethylbenzene. No cases of malignancy were observed in workers exposed to ethylbenzene monitored for
20 years (Bardodej and Cirek 1988). No information on ethylbenzene concentrations was reported,
although an estimated concentration of 6.4 mg/m3 was derived as described above under hematological
effects (Section 3.2.1.3). However, no clear conclusions can be drawn from this study due to the lack of
measured ethylbenzene concentrations. Furthermore, the low exposure concentration limited the power
73 ETHYLBENZENE
3. HEALTH EFFECTS
of this study to detect any effect. No other studies were found regarding cancer effects in humans
exposed to ethylbenzene by inhalation.
Information concerning the carcinogenicity of ethylbenzene in animals comes from an NTP-sponsored
bioassay in male and female rats and mice exposed to 0, 75, 250, or 750 ppm ethylbenzene for up to
2 years (NTP 1999). NTP (1999) concluded that ethylbenzene showed clear evidence of carcinogenic
activity in male rats based on increased incidences of renal tubule neoplasms and testicular adenomas,
some evidence of carcinogenic activity in female rats based on increased incidences of renal tubule
adenomas, some evidence of carcinogenic activity in male mice based on increased incidences of
alveolar/bronchiolar neoplasms, and some evidence of carcinogenic activity in female mice based on
increased incidences of hepatocellular neoplasms (NTP 1999).
Pathological findings in male and female rats exposed to 750 ppm ethylbenzene showed significant
increases in the incidence of renal tubule adenoma and adenoma or carcinoma (combined) compared to
control animals. An extended histopathological evaluation of the kidneys showed significant increases in
the incidence of nephropathy and of renal tubular hyperplasia (a preneoplastic lesion) in male rats
exposed to 750 ppm; in female rats, nephropathy was observed at concentrations ≥75 ppm and renal
tubular hyperplasia was only observed at a concentration of 750 ppm. In a reevaluation of the
histopathology of rat kidneys from the NTP study, Hard (2002) confirmed the NTP (1999) findings and
suggested that the increase incidence of kidney tumors in rats in the high-dose group was related to a
chemical-induced exacerbation of chronic progressive nephropathy (CPN), with a minor contributing
factor in male rats being α2µ-globulin nephropathy. However, in an analysis of the association between
CPN and renal tubule cell neoplasms in male F344 rats, Seely et al. (2002) concluded that the association
between CPN and renal tubule cell neoplasms is marginal. Results of this analysis suggest that the
number of renal tubule cell neoplasms secondary to CPN would be few (Seely et al. 2002). The incidence
of interstitial cell adenoma in the testes of males exposed to 750 ppm was significantly greater than in the
control group and slightly exceeded the historical control range for inhalation studies. The incidence of
bilateral testicular adenoma was also significantly increased in males exposed to 750 ppm.
In male mice, the incidences of alveolar/bronchiolar adenoma and alveolar/bronchiolar adenoma or
carcinoma (combined) were significantly greater in males exposed to 750 ppm than in the controls. No
significant increased in the incidence of neoplastic lung lesions was observed in female rats. The
incidences of hepatocellular adenoma and hepatocellular adenoma or carcinoma (combined) were
74 ETHYLBENZENE
3. HEALTH EFFECTS
significantly greater in female mice exposed to 750 ppm than in the control group. Hepatocellular
adenomas or carcinomas were not observed in male mice.
3.2.2 Oral Exposure 3.2.2.1 Death
No studies were located regarding death in humans following oral exposure to ethylbenzene.
Lethality has been observed in laboratory animals following ingestion of ethylbenzene. The oral LD50 for
gavage administration of ethylbenzene was reported to be 4,769 mg/kg ethylbenzene in rats (Smyth et al.
1962). In another oral study with rats exposed to ethylbenzene, the LD50 was reported to be
approximately 3,500 mg/kg ethylbenzene (Wolf et al. 1956). The usefulness of these data is limited since
the study methodology was not provided.
An oral LD50 value for rats is recorded in Table 3-2 and plotted in Figure 3-2.
3.2.2.2 Systemic Effects
No studies were located describing respiratory, cardiovascular, gastrointestinal, hematological, musculo-
skeletal, hepatic, renal, endocrine, dermal, ocular, body weight, or metabolic effects in humans or gastro-
intestinal, musculoskeletal, endocrine, dermal, ocular, body weight, or metabolic effects in animals after
oral exposure to ethylbenzene.
The highest NOAEL values and all reliable LOAEL values are recorded in Table 3-2 and plotted in
Figure 3-2.
Respiratory Effects. No clinical signs of respiratory effects or histopathological findings in
respiratory tissues were observed in male and female rats exposed to 750 mg/kg/day by gavage for 4 or
13 weeks (Mellert et al. 2007). No respiratory effects were observed in female rats orally exposed to
680 mg/kg ethylbenzene by gavage for 6 months (Wolf et al. 1956). The utility of this study is limited
because of poor protocol description.
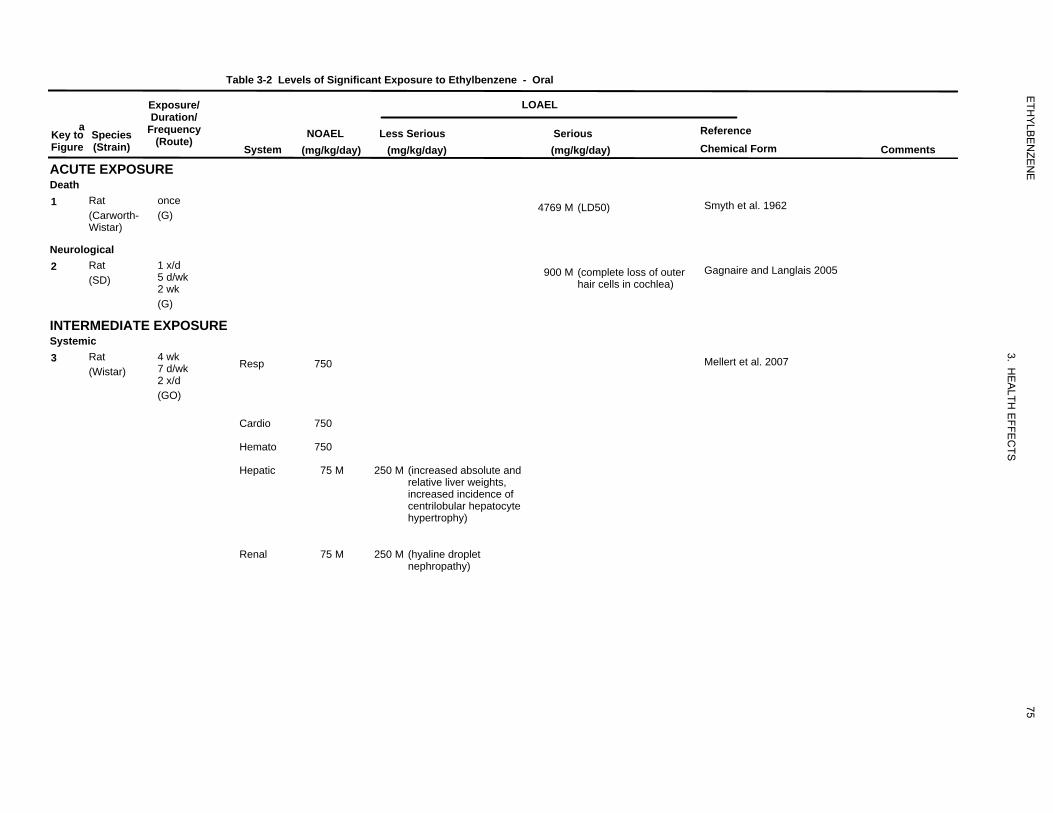
13
4769
963
900
981
750
750
750
75
250
75
250
ETH
YLB
EN
ZEN
E
3. HE
ALTH
EFFE
CTS
Table 3-2 Levels of Significant Exposure to Ethylbenzene - Oral
a Key to Figure
Species (Strain)
Exposure/ Duration/
Frequency (Route)
ACUTE EXPOSURE Death
System NOAEL
(mg/kg/day) Less Serious
(mg/kg/day)
LOAEL
Serious (mg/kg/day)
Reference Chemical Form Comments
1 Rat (Carworth-Wistar)
once (G)
4769 M (LD50) Smyth et al. 1962
Neurological 2 Rat
(SD) 1 x/d 5 d/wk 2 wk
900 M (complete loss of outer hair cells in cochlea)
Gagnaire and Langlais 2005
(G)
INTERMEDIATE EXPOSURE Systemic 3 Rat
(Wistar) 4 wk 7 d/wk 2 x/d (GO)
Resp 750 Mellert et al. 2007
Cardio 750
Hemato 750
Hepatic 75 M 250 M (increased absolute and relative liver weights, increased incidence of centrilobular hepatocyte hypertrophy)
Renal 75 M 250 M (hyaline droplet nephropathy)
75
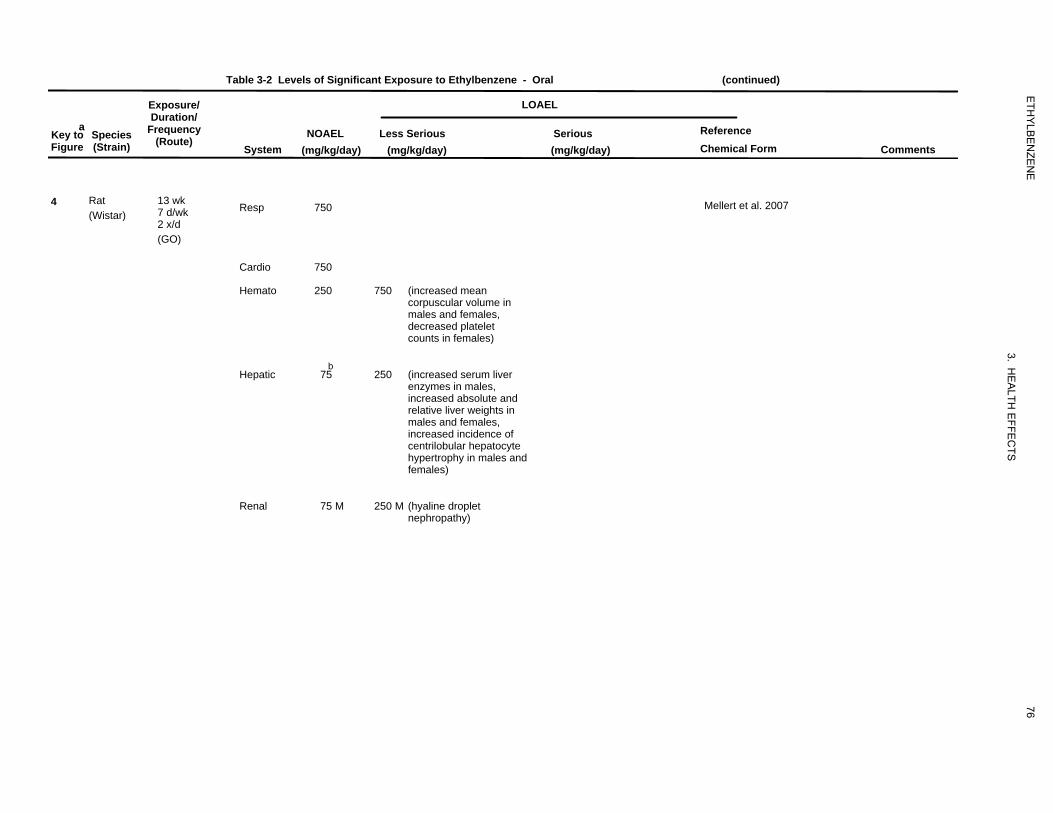
984
750
750
250
750
75
250
75
250
ETH
YLB
EN
ZEN
E
3. HE
ALTH
EFFE
CTS
Table 3-2 Levels of Significant Exposure to Ethylbenzene - Oral (continued)
a Key to Figure
Species (Strain)
Exposure/ Duration/
Frequency (Route)
System NOAEL
(mg/kg/day) Less Serious
(mg/kg/day)
LOAEL
Serious (mg/kg/day)
Reference Chemical Form Comments
4 Rat (Wistar)
13 wk 7 d/wk 2 x/d (GO)
Resp 750 Mellert et al. 2007
Cardio 750
Hemato 250 750 (increased mean corpuscular volume in males and females, decreased platelet counts in females)
Hepatic b
75 250 (increased serum liver enzymes in males, increased absolute and relative liver weights in males and females, increased incidence of centrilobular hepatocyte hypertrophy in males and females)
Renal 75 M 250 M (hyaline droplet nephropathy)
76
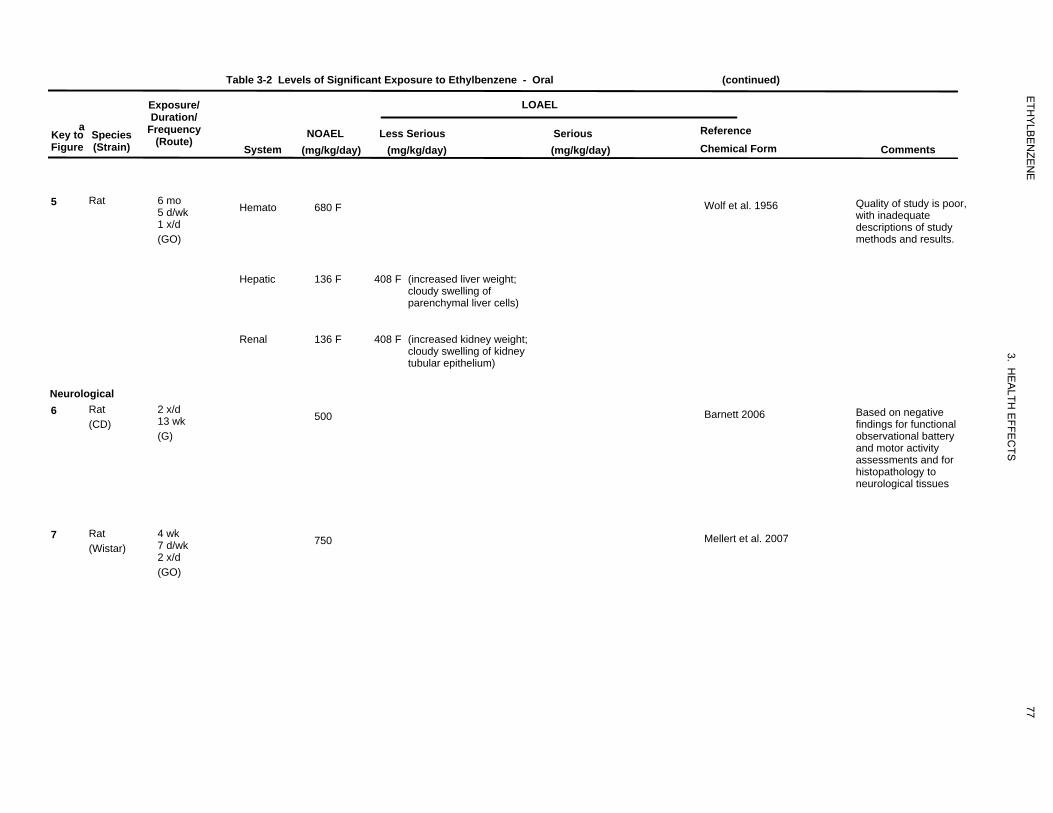
29
680
136
408
136
408
989
500
982
750
ETH
YLB
EN
ZEN
E
3. HE
ALTH
EFFE
CTS
Table 3-2 Levels of Significant Exposure to Ethylbenzene - Oral (continued)
a Key to Figure
Species (Strain)
Exposure/ Duration/
Frequency (Route)
System NOAEL
(mg/kg/day) Less Serious
(mg/kg/day)
LOAEL
Serious (mg/kg/day)
Reference Chemical Form Comments
5 Rat 6 mo 5 d/wk 1 x/d (GO)
Hemato 680 F Wolf et al. 1956 Quality of study is poor, with inadequate descriptions of study methods and results.
Hepatic 136 F 408 F (increased liver weight; cloudy swelling of parenchymal liver cells)
Renal 136 F 408 F (increased kidney weight; cloudy swelling of kidney tubular epithelium)
Neurological 6 Rat
(CD) 2 x/d 13 wk (G)
500 Barnett 2006 Based on negative findings for functional observational battery and motor activity assessments and for histopathology to neurological tissues
7 Rat (Wistar)
4 wk 7 d/wk 2 x/d (GO)
750 Mellert et al. 2007
77
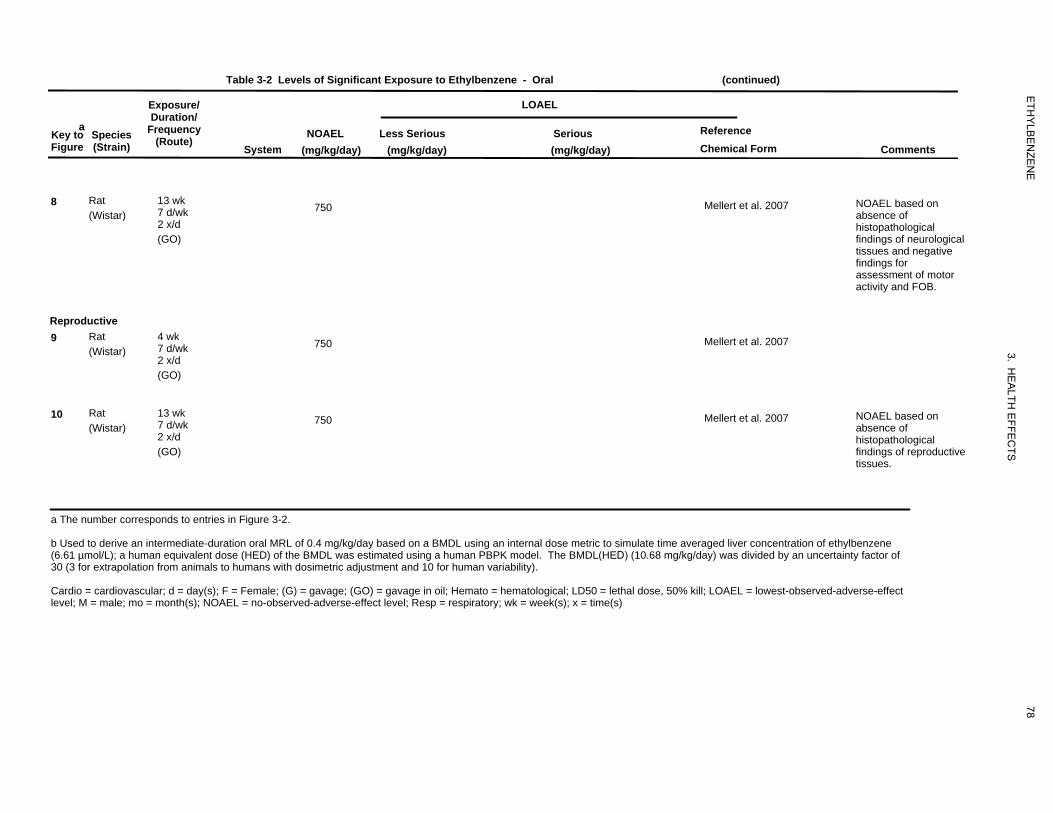
985
750
983
750
986
750
ETH
YLB
EN
ZEN
E
3. HE
ALTH
EFFE
CTS
Table 3-2 Levels of Significant Exposure to Ethylbenzene - Oral (continued)
a Key to Species Figure (Strain)
8 Rat (Wistar)
Reproductive 9 Rat
(Wistar)
10 Rat (Wistar)
Exposure/ Duration/
Frequency (Route)
System NOAEL
(mg/kg/day) Less Serious
(mg/kg/day)
LOAEL
Serious (mg/kg/day)
Reference Chemical Form Comments
13 wk 7 d/wk 2 x/d (GO)
750 Mellert et al. 2007 NOAEL based on absence of histopathological findings of neurological tissues and negative findings for assessment of motor activity and FOB.
4 wk 7 d/wk 2 x/d (GO)
750 Mellert et al. 2007
13 wk 7 d/wk 2 x/d (GO)
750 Mellert et al. 2007 NOAEL based on absence of histopathological findings of reproductive tissues.
a The number corresponds to entries in Figure 3-2.
b Used to derive an intermediate-duration oral MRL of 0.4 mg/kg/day based on a BMDL using an internal dose metric to simulate time averaged liver concentration of ethylbenzene (6.61 µmol/L); a human equivalent dose (HED) of the BMDL was estimated using a human PBPK model. The BMDL(HED) (10.68 mg/kg/day) was divided by an uncertainty factor of 30 (3 for extrapolation from animals to humans with dosimetric adjustment and 10 for human variability).
Cardio = cardiovascular; d = day(s); F = Female; (G) = gavage; (GO) = gavage in oil; Hemato = hematological; LD50 = lethal dose, 50% kill; LOAEL = lowest-observed-adverse-effect level; M = male; mo = month(s); NOAEL = no-observed-adverse-effect level; Resp = respiratory; wk = week(s); x = time(s)
78

Figure 3-2 Levels of Significant Exposure to Ethylbenzene - Oral
Acute (≤14 days)
Death
mg/kg/day Neurological
10000
1r
1000 2r
100
c-Cat -Humans f-Ferret n-Mink Cancer Effect Level-Animals Cancer Effect Level-Humans LD50/LC50d-Dog k-Monkey j-Pigeon o-Other LOAEL, More Serious-Animals LOAEL, More Serious-Humans Minimal Risk Levelr-Rat m-Mouse e-Gerbil LOAEL, Less Serious-Animals LOAEL, Less Serious-Humans for effectsp-Pig h-Rabbit s-Hamster NOAEL - Animals NOAEL - Humans other thanq-Cow a-Sheep g-Guinea Pig Cancer
ETH
YLB
EN
ZEN
E
3. HE
ALTH
EFFE
CTS
79
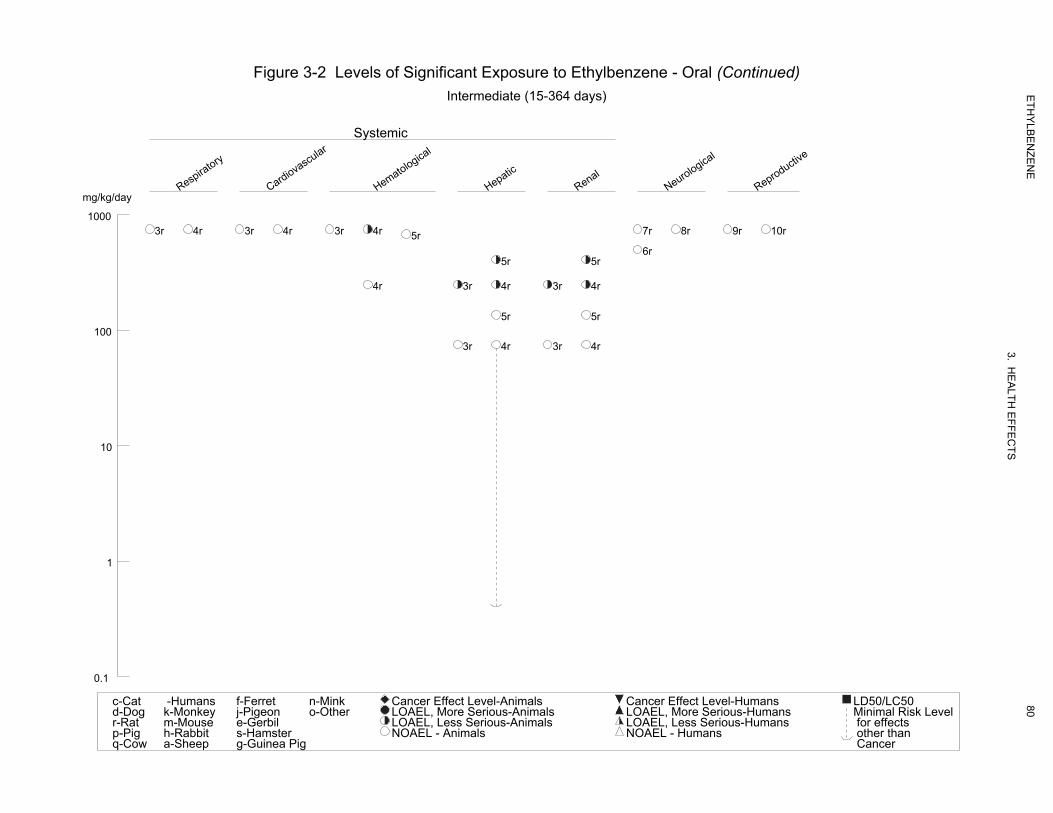
Figure 3-2 Levels of Significant Exposure to Ethylbenzene - Oral (Continued) Intermediate (15-364 days)
Systemic
Respiratory
Cardiovascular
Hematological
Hepatic
Renal
mg/kg/day Neurological
Reproductive
1000 3r 4r 3r 4r 3r 4r 7r 8r 9r 10r5r
6r 5r 5r
4r 3r 4r 3r 4r
5r 5r
100 3r 4r 3r 4r
10
1
0.1
c-Cat -Humans f-Ferret n-Mink Cancer Effect Level-Animals Cancer Effect Level-Humans LD50/LC50d-Dog k-Monkey j-Pigeon o-Other LOAEL, More Serious-Animals LOAEL, More Serious-Humans Minimal Risk Levelr-Rat m-Mouse e-Gerbil LOAEL, Less Serious-Animals LOAEL, Less Serious-Humans for effectsp-Pig h-Rabbit s-Hamster NOAEL - Animals NOAEL - Humans other thanq-Cow a-Sheep g-Guinea Pig Cancer
ETH
YLB
EN
ZEN
E
3. HE
ALTH
EFFE
CTS
80
81 ETHYLBENZENE
3. HEALTH EFFECTS
Cardiovascular Effects. No histopathological findings were made in cardiac tissue from male and
female rats exposed to 750 mg/kg/day by gavage for 4 or 13 weeks (Mellert et al 2007) or from female
rats exposed to 13.6–680 mg/kg via gavage for 6 months (Wolf et al. 1956)
Hematological Effects. Decreased platelet count was observed in females administered
750 mg/kg/day and increased mean corpuscular volume was observed in males and females exposed to
≥250 mg/kg/day ethylbenzene by gavage for 13 weeks (Mellert et al 2007). No effects on hematological
parameters were observed in rats treated for 4 weeks (Mellert et al. 2007). No adverse effects on bone
marrow counts or histopathology were reported in female rats orally exposed to 13.6–680 mg/kg
ethylbenzene by gavage for 6 months (Wolf et al. 1956). The usefulness of this study is limited by the
poorly described and limited results that were provided.
Hepatic Effects. Effects indicative of liver toxicity were observed in male and female rats exposed to
oral ethylbenzene for 4 and 13 weeks (Mellert et al. 2007). After 4 weeks of exposure, observed effects
consistent with hepatotoxicity included increased absolute and relative liver weights (≥250 mg/kg/day in
males and 750 mg/kg/day in females), increased incidence of hepatocyte centrilobular hypertrophy
(≥250 mg/kg/day in males and 750 mg/kg/day in females), and increase serum liver enzyme activity
(alanine aminotransferase) (750 mg/kg/day in males and females) (Mellert et al. 2007). After 13 weeks of
exposure, increased activity of serum liver enzymes (alanine aminotransferase and γ-glutamyl transferase)
in males (≥250 mg/kg/day) and females (750 mg/mg/day), increased absolute and relative liver weights
(≥250 mg/kg/day in males and females), and a dose-related increase in the incidence of centrilobular
hepatocyte hypertrophy (≥250 mg/kg/day in males and females) were observed. Increased bilirubin
(≤250 mg/kg/day in males and 750 mg/kg/day in females), total protein (750 mg/kg/day in females),
albumin (750 mg/kg/day in males and females), globulins (750 mg/kg/day in females), and cholesterol
(≤250 mg/kg/day in males and females), and decreased prothrombin time (750 mg/kg/day in males and
≥250 mg/kg/day in females) were considered by study investigators as adaptive effects in the liver. In
males in the 75 mg/kg/day group, relative liver weight was significantly increased by (4% compared to
controls); however, no histopathological changes, or increases in absolute liver or serum liver enzyme
activities were observed at this dosage. Given that ethylbenzene is a microsomal enzyme inducer, and the
absence of histopathology and other evidence of liver injury at the 75 mg/kg/day dosage, the small
increase in relative liver weight in male rats was at this dosage not considered evidence for an adverse
effect on the liver (Mellert et al. 2007). Histopathological changes characterized by cloudy swelling of
parenchymal cells of the liver and an increase in liver weight were observed in female rats administered
408 mg/kg/day for 6 months (Wolf et al. 1956). No other hepatic changes were reported. No liver effects
82 ETHYLBENZENE
3. HEALTH EFFECTS
were observed in female rats administered 136 mg/kg/day. No conclusions could be drawn from these
results because of serious weaknesses in the methodology and reporting of the data, including incidence
data and statistical analyses.
Renal Effects. Renal effects in males administered ethylbenzene by gavage for 13 weeks included
increased serum creatinine (750 mg/kg/day), increased incidences of transitional epithelial cells and
granular and epithelial cell casts in the urine (≥250 mg/kg/day), increased absolute and relative kidney
weights (≥250 mg/kg/day), and a dose-related increase in severity of hyaline droplet nephropathy
(≥250 mg/kg/day) (Mellert et al. 2007). Adverse renal effects in males were most likely related to
accumulation of α2µ-globulin accumulation, and, therefore, considered not relevant to humans. Similar
renal findings were observed in male rats exposed for 4 weeks (administered ethylbenzene by gavage for
13 weeks). Absolute kidney weight was significantly increased by 7 and 13% in females administered
250 and 750 mg/kg-day, respectively, compared to controls. However, since no histopathological
findings or alterations in urinalysis parameters were observed, increased kidney weight in females was
not considered evidence for renal toxicity in female rats. The only animal study that investigated renal
effects following ethylbenzene exposure involved female rats administered 13.6–680 mg/kg/body weight
ethylbenzene by gavage for 6 months (Wolf et al. 1956). Histopathological changes characterized as
cloudy swelling of the tubular epithelium in the kidney and an increase in kidney weight were observed at
the 408 mg/kg/day dose level. No other renal changes were reported. As in hepatic effects, no
conclusions could be drawn from these results because of serious weaknesses in the methodology and
reporting of the data (e.g., no data on the number of animals with renal effects). Furthermore, no
statistical analysis was performed.
3.2.2.3 Immunological and Lymphoreticular Effects
No studies were located regarding immunological effects in humans following oral exposure to ethyl-
benzene.
Absolute and relative thymus weights were significantly decreased in females treated with
≥250 mg/kg/day for 13 weeks, but no histopathological findings were observed (Mellert et al. 2007).
Therefore, effects were not considered adverse.
83 ETHYLBENZENE
3. HEALTH EFFECTS
3.2.2.4 Neurological Effects
No studies were located regarding neurological effects in humans following oral exposure to ethyl-
benzene.
Significant ototoxic effects were observed in male rats administered 900 mg/kg/day (the only dose tested)
by gavage for 2 weeks (Gagnaire and Langlais 2005). The authors reported an almost complete loss of
the three rows of OHCs in the organ of Corti 10 days after the last exposure to ethylbenzene. This study
did not have a control group to clearly establish the magnitude of the effects relative to unexposed
animals; nevertheless, this study showed that the losses observed in ethylbenzene-exposed animals were
among the highest observed among 21 organic solvents tested (Gagnaire and Langlais 2005). No
ethylbenzene-related behavioral changes were observed in female rats administered 13.6–680 mg/kg/day
ethylbenzene by gavage for 6 months (Wolf et al. 1956). No other parameters were investigated. The
utility of this study is limited because the monitored behavioral changes were not reported, and the study
protocol was poorly described.
In male and female rats exposed to 75–750 mg/kg/day ethylbenzene by gavage for 13 weeks, no
neurological effects were observed, based on negative results of motor activity tests and a functional
observational battery (FOB) (Mellert et al. 2007). Similarly, no neurological effects were observed in
male or female rats admininistered 50–500 mg/kg/day ethylbenzene by gavage for 13 weeks, based on
negative findings for FOB and motor activity assessments and for histopathology to neurological tissues
(Barnett 2006). However, assessments of ototoxicity were not conducted in these studies.
3.2.2.5 Reproductive Effects
No studies were located regarding reproductive effects in humans following oral exposure to
ethylbenzene.
The only available reproduction study reported that acute oral exposure to 500 or 1,000 mg/kg ethyl-
benzene decreases peripheral hormone levels and may block or delay the estrus cycle in female rats
during the diestrus stage (Ungváry 1986). Decreased levels of hormones, including luteinizing hormone,
progesterone, and 17 β-estradiol, were accompanied by uterine changes, which consisted of increased
stromal tissue with dense collagen bundles and reduced lumen. No dose response was noted. The study
is limited by the absence of statistical analysis of the data.
84 ETHYLBENZENE
3. HEALTH EFFECTS
No histopathological findings of reproductive tissues were observed in male and female rats exposed to
750 mg/kg/day by gavage for 4 or 13 weeks (Mellert et al. 2007).
3.2.2.6 Developmental Effects
No studies were located regarding developmental effects in humans or animals following oral exposure to
ethylbenzene.
3.2.2.7 Cancer
No studies were located regarding carcinogenic effects in humans following oral exposure to
ethylbenzene.
The carcinogenicity of ethylbenzene by the oral route has been evaluated in a chronic-duration study in
Sprague-Dawley rats (Maltoni et al. 1985). A statistically significant increase in total malignant tumors
was reported in females and in combined male and female groups exposed to 500 mg kg/day via gavage
for 104 weeks and observed until after week 141. No data on specific tumor type were presented, only
one dose was tested, and no information on survival was provided.
3.2.3 Dermal Exposure 3.2.3.1 Death
No studies were located regarding lethal effects in humans following only dermal exposure to ethyl-
benzene. Matsumoto et al. (1992) reported the case of a 44-year-old man who died 9 days after being
massively exposed to gasoline (which contained ethylbenzene) dermally and by inhalation for ≥10 hours.
The dermal LD50 in rabbits exposed to liquid ethylbenzene (applied to clipped skin subsequently covered
with an impervious plastic film) was calculated to be 15,433 mg/kg/body weight (Smyth et al. 1962). No
additional studies were located regarding death in animals following dermal exposure to ethylbenzene.
3.2.3.2 Systemic Effects
No studies were located regarding respiratory, cardiovascular, gastrointestinal, hematological,
musculoskeletal, hepatic, renal, endocrine, body weight, or metabolic effects in humans or animals after
dermal exposure to ethylbenzene.
85 ETHYLBENZENE
3. HEALTH EFFECTS
The systemic effects observed after dermal exposure to ethylbenzene are discussed below. The highest
NOAEL values and all reliable LOAEL values for each species and duration category are recorded in
Table 3-3.
Dermal Effects. No studies were located regarding dermal effects in humans following dermal
exposure to ethylbenzene.
Liquid ethylbenzene applied directly to the skin of an unspecified number of rabbits caused irritation
characterized by reddening, exfoliation, and blistering (Wolf et al. 1956). Mild dermal irritation (grade 2
on a scale of 10) was also noted in New Zealand White rabbits 24 hours after application of ethylbenzene
to clipped skin (Smyth et al. 1962).
Ocular Effects. Ocular effects observed in humans and animals after inhalation exposure are assumed
to be due to exposure of the mucous membranes of the eye to ethylbenzene vapor. Volunteers reported
eye irritation and burning, and profuse lacrimation, which gradually decreased with continued exposure to
1,000 ppm for 1–6 minutes (Yant et al. 1930). Upon entering the chamber with an ethylbenzene
concentration of 2,000 or 5,000 ppm, the volunteers also experienced severe eye irritation.
Cometto-Muñiz and Cain (1995) reported eye irritation in humans after exposure to ethylbenzene vapor.
Eye irritation was observed at 10,000 ppm.
Liquid ethylbenzene applied directly to the eyes of rabbits for an unspecified duration caused slight
irritation of conjunctival membranes (Wolf et al. 1956) and slight corneal injury (Smyth et al. 1962; Wolf
et al. 1956).
Irritant effects from exposure to ethylbenzene vapor have been reported in animals. Tegeris and Balster
(1994) reported lacrimation and palpebral closure in mice after 20 minutes of exposure to 2,000 ppm
ethylbenzene. Eye irritation was observed in guinea pigs exposed to 1,000 ppm for 8 minutes, and in
animals exposed to 2,000, 5,000, and 10,000 ppm for 480, 30, and 10 minutes, respectively (Yant et al.
1930). Lacrimation was observed in rats exposed to 1,200 ppm ethylbenzene and in mice and rabbits
exposed to 400 ppm ethylbenzene for 4 days (Ethylbenzene Producers Association 1986a). After 4 weeks
of exposure to 382 ppm, rats showed sporadic lacrimation, whereas mice and rabbits showed no ocular
effects at 782 and 1,610 ppm, respectively (Cragg et al. 1989). No ocular effects were seen in rats or
mice after a 13-week exposure to 975 ppm ethylbenzene (NTP 1992).
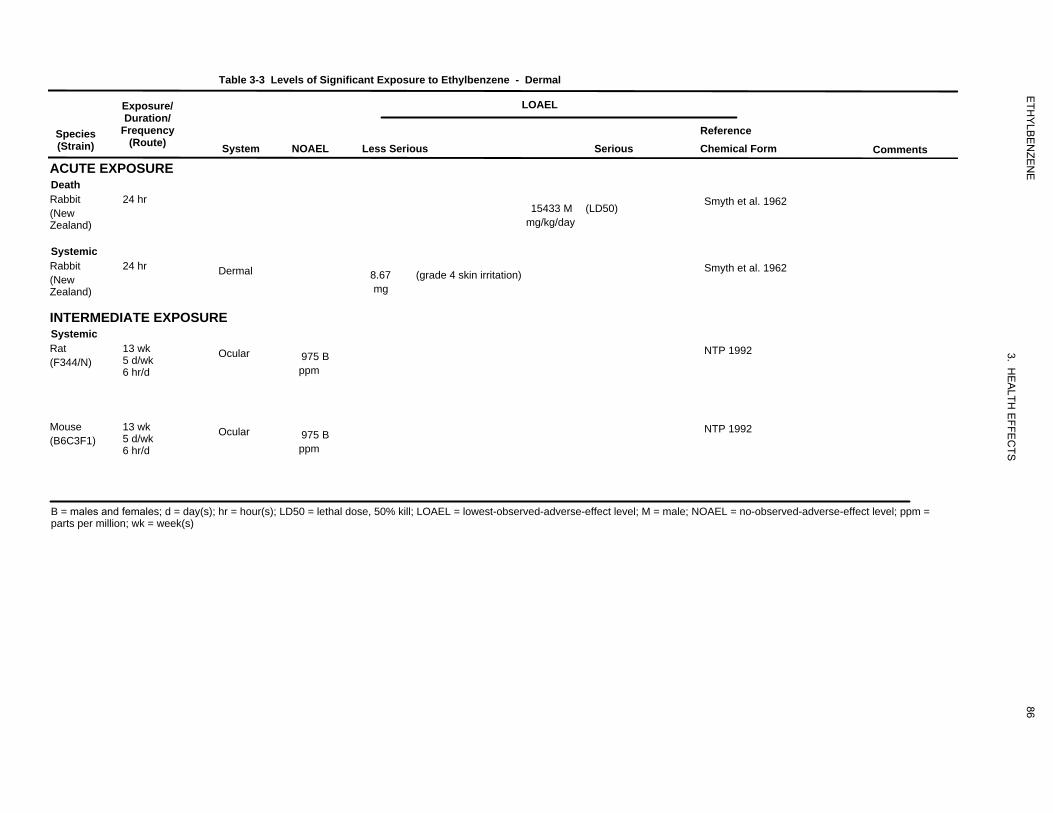
502 mg/kg/day
502
503 mg
503
902
ppm
902
903
ppm
903
ETH
YLB
EN
ZEN
E
3. HE
ALTH
EFFE
CTS
Table 3-3 Levels of Significant Exposure to Ethylbenzene - Dermal
Species (Strain)
Exposure/ Duration/
Frequency (Route)
ACUTE EXPOSURE Death
(New Zealand)
Rabbit 24 hr
System NOAEL Less Serious
LOAEL
15433 M mg/kg/day
Serious
(LD50)
Reference Chemical Form
Smyth et al. 1962
Comments
Systemic
(New Zealand)
Rabbit 24 hr Dermal 8.67 mg
(grade 4 skin irritation) Smyth et al. 1962
INTERMEDIATE EXPOSURE Systemic
(F344/N) Rat 13 wk
5 d/wk 6 hr/d
Ocular 975 B ppm
NTP 1992
(B6C3F1) Mouse 13 wk
5 d/wk 6 hr/d
Ocular 975 B ppm
NTP 1992
B = males and females; d = day(s); hr = hour(s); LD50 = lethal dose, 50% kill; LOAEL = lowest-observed-adverse-effect level; M = male; NOAEL = no-observed-adverse-effect level; ppm = parts per million; wk = week(s)
86
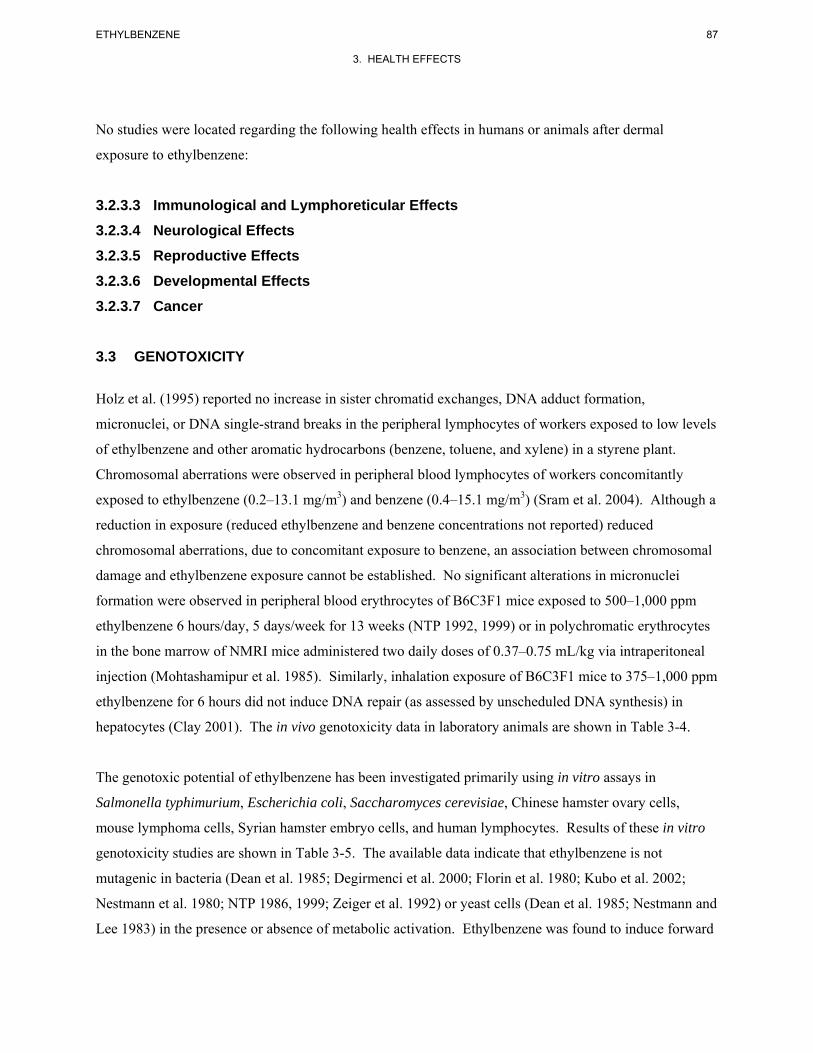
87 ETHYLBENZENE
3. HEALTH EFFECTS
No studies were located regarding the following health effects in humans or animals after dermal
exposure to ethylbenzene:
3.2.3.3 Immunological and Lymphoreticular Effects 3.2.3.4 Neurological Effects 3.2.3.5 Reproductive Effects 3.2.3.6 Developmental Effects 3.2.3.7 Cancer
3.3 GENOTOXICITY
Holz et al. (1995) reported no increase in sister chromatid exchanges, DNA adduct formation,
micronuclei, or DNA single-strand breaks in the peripheral lymphocytes of workers exposed to low levels
of ethylbenzene and other aromatic hydrocarbons (benzene, toluene, and xylene) in a styrene plant.
Chromosomal aberrations were observed in peripheral blood lymphocytes of workers concomitantly
exposed to ethylbenzene (0.2–13.1 mg/m3) and benzene (0.4–15.1 mg/m3) (Sram et al. 2004). Although a
reduction in exposure (reduced ethylbenzene and benzene concentrations not reported) reduced
chromosomal aberrations, due to concomitant exposure to benzene, an association between chromosomal
damage and ethylbenzene exposure cannot be established. No significant alterations in micronuclei
formation were observed in peripheral blood erythrocytes of B6C3F1 mice exposed to 500–1,000 ppm
ethylbenzene 6 hours/day, 5 days/week for 13 weeks (NTP 1992, 1999) or in polychromatic erythrocytes
in the bone marrow of NMRI mice administered two daily doses of 0.37–0.75 mL/kg via intraperitoneal
injection (Mohtashamipur et al. 1985). Similarly, inhalation exposure of B6C3F1 mice to 375–1,000 ppm
ethylbenzene for 6 hours did not induce DNA repair (as assessed by unscheduled DNA synthesis) in
hepatocytes (Clay 2001). The in vivo genotoxicity data in laboratory animals are shown in Table 3-4.
The genotoxic potential of ethylbenzene has been investigated primarily using in vitro assays in
Salmonella typhimurium, Escherichia coli, Saccharomyces cerevisiae, Chinese hamster ovary cells,
mouse lymphoma cells, Syrian hamster embryo cells, and human lymphocytes. Results of these in vitro
genotoxicity studies are shown in Table 3-5. The available data indicate that ethylbenzene is not
mutagenic in bacteria (Dean et al. 1985; Degirmenci et al. 2000; Florin et al. 1980; Kubo et al. 2002;
Nestmann et al. 1980; NTP 1986, 1999; Zeiger et al. 1992) or yeast cells (Dean et al. 1985; Nestmann and
Lee 1983) in the presence or absence of metabolic activation. Ethylbenzene was found to induce forward
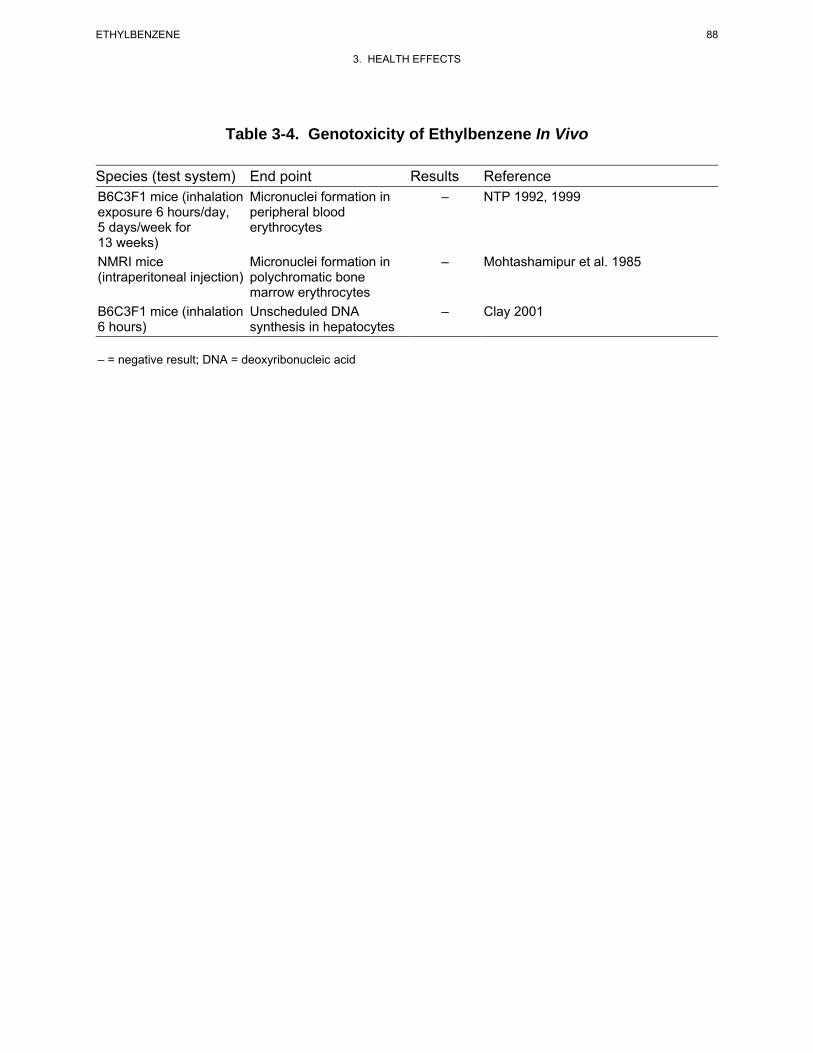
88 ETHYLBENZENE
3. HEALTH EFFECTS
Table 3-4. Genotoxicity of Ethylbenzene In Vivo
Species (test system) End point Results Reference B6C3F1 mice (inhalation Micronuclei formation in – NTP 1992, 1999 exposure 6 hours/day, peripheral blood 5 days/week for erythrocytes 13 weeks) NMRI mice Micronuclei formation in – Mohtashamipur et al. 1985 (intraperitoneal injection) polychromatic bone
marrow erythrocytes B6C3F1 mice (inhalation Unscheduled DNA – Clay 2001 6 hours) synthesis in hepatocytes
– = negative result; DNA = deoxyribonucleic acid
89 ETHYLBENZENE
3. HEALTH EFFECTS
Table 3-5. Genotoxicity of Ethylbenzene In Vitro
Results With Without
Species (test system) End point activation activation Reference Prokaryotic organisms:
Salmonella typhimurium Gene mutation – – Dean et al. 1985a; Florin et (plate incorporation assay) al. 1980b; Nestmann et al.
1980c
S. tymphimurium (plate Gene mutation – – NTP 1986d
incorporation assay; strains TA87, TA98, TA100, TA1537; TA1538) S. tymphimurium (plate Gene mutation – – Zeiger et al. 1992d (results incorporation assay; strains also published in NTP 1992, TA97, TA98, TA100, 1999) TA1535) Escherichia coli WP2, Gene mutation – – Dean et al. 1985a
WP2uvrA Eukaryotic organisms:
Saccharomyces cerevisiae Gene mutation – – Dean et al. 1985 JD1 gene conversion assay S. cerevisiae Dy, Gene mutation – No data Nestmann and Lee 1983 XV185-14C
Mammalian cells: Mouse lymphoma cells Gene mutation No data + McGregor et al. 1988
(results also published in NTP 1992, 1999)
Mouse lymphoma cells Gene mutation – – Seidel et al. 2006
Mouse lymphoma cells Gene mutation – – Wollny 2000
Rat liver (RL4) epithelial type Chromosome – – Dean et al. 1985 cells damage Chinese hamster ovary cells Chromosome – – NTP 1992, 1999
damage Syrian hamster embryo cells Micronuclei No data + Gibson et al. 1997
formation Human lymphocytes Sister chromatid Not ±e Norppa and Vainio 1983a
exchange applicable Chinese hamster ovary cells Sister chromatid – – NTP 1986, 1992, 1999
exchange Syrian hamster embryo cells Cell No data + Kerckaert et al. 1996
transformation
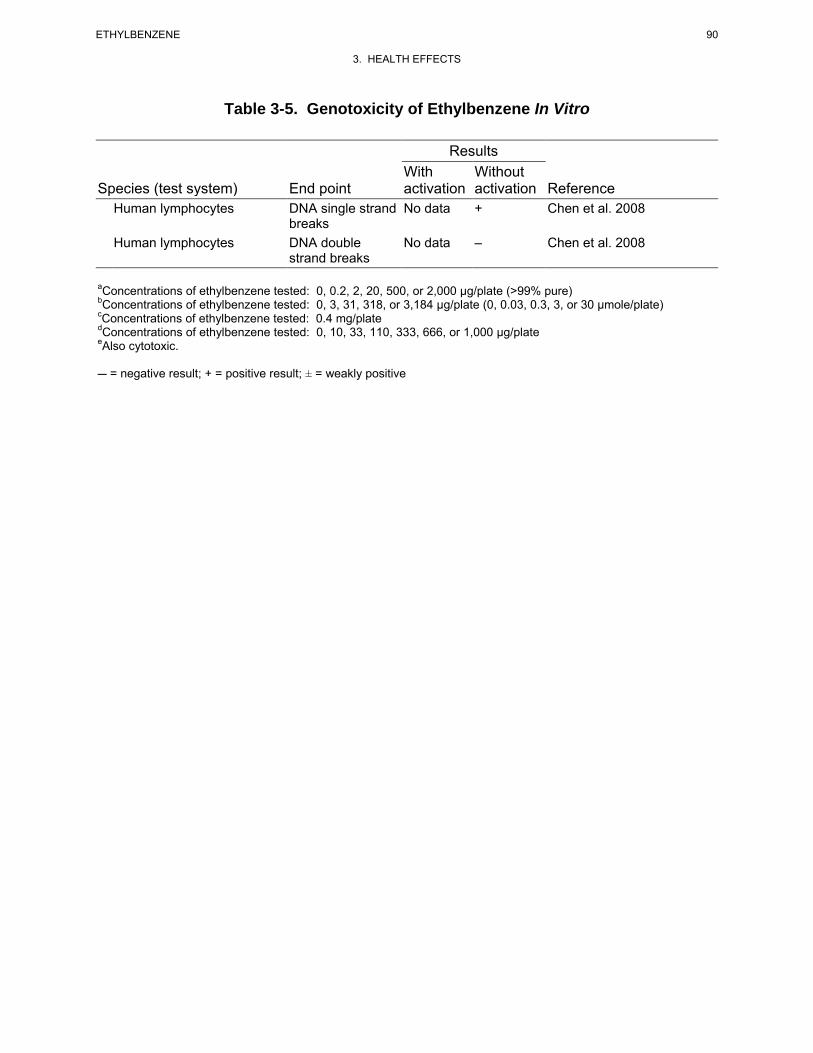
90 ETHYLBENZENE
3. HEALTH EFFECTS
Table 3-5. Genotoxicity of Ethylbenzene In Vitro
Results With Without
Species (test system) End point activation activation Reference Human lymphocytes DNA single strand No data + Chen et al. 2008
breaks Human lymphocytes DNA double No data – Chen et al. 2008
strand breaks
aConcentrations of ethylbenzene tested: 0, 0.2, 2, 20, 500, or 2,000 μg/plate (>99% pure)bConcentrations of ethylbenzene tested: 0, 3, 31, 318, or 3,184 μg/plate (0, 0.03, 0.3, 3, or 30 μmole/plate)cConcentrations of ethylbenzene tested: 0.4 mg/plate dConcentrations of ethylbenzene tested: 0, 10, 33, 110, 333, 666, or 1,000 μg/plateeAlso cytotoxic.
C = negative result; + = positive result; ± = weakly positive
91 ETHYLBENZENE
3. HEALTH EFFECTS
mutations in mouse lymphoma cells at 80 mg/L without metabolic activation (McGregor et al. 1988;
results also reported in NTP 1992, 1999); this concentration was near the lethal concentration of
100 mg/L. Similarly, no alterations in the occurrence of forward mutations in mouse lymphoma cells
(with or without activation) were observed at concentrations of ≤50 mg/L (Seidel et al. 2006). A third
study examining the occurrence of forward mutations in mouse lymphoma cells (Wollny 2000) found a
positive response at cytotoxic concentrations (34.4 and 68.8 µg/mL without metabolic activation and
825 µg/mL with activation); however, two replications of the experiment failed to find a positive
mutagenic response. A weak positive response was observed when ethylbenzene was tested for sister
chromatid exchanges in human lymphocytes (Norppa and Vainio 1983a); however, the positive response
was only observed at a cytotoxic concentration. Ethylbenzene also failed to induce sister-chromatid
exchanges in Chinese hamster ovary cells (NTP 1986, 1999) or chromosomal aberrations in Chinese
hamster cells (NTP 1986, 1999) or rat liver cells (Dean et al. 1985). A positive dose-related increase in
the occurrence of micronuclei formation were observed in Syrian hamster embryo cells tested at
ethylbenzene concentrations of 25–200 µg/mL (Gibson et al. 1997). A significant increase in
morphological cells transformations was also observed in Syrian hamster embryo cells exposed to 150 or
200 µg/mL for 7 days (Kerckaert et al. 1996); the 200 µg/mL concentration resulted in significant
cytotoxicity. In this same study, no significant alterations the percent cell transformations were observed
when the cells were incubated with ethylbenzene for 24 hours. A series of studies conducted by Chen et
al. (2008) evaluated the potential of ethylbenzene to induce DNA damage in human lymphocytes. A
significant increase in single strand breaks was observed at 100 and 200 µM; no alterations in double
strand breaks were found at 200 µM. The study also found a significant decrease in DNA damage in cells
pre-treated with spin traps, suggesting that the DNA damage may be due to the generation of free
radicals.
In general, the results of available in vivo and in vitro genotoxicity studies suggest that ethylbenzene is
not genotoxic. Excluding studies that found results at cytotoxic or near cytotoxic concentrations, a few
studies have found positive results. The significance of these positive findings is not known.
3.4 TOXICOKINETICS
Ethylbenzene is absorbed from the lungs, gastrointestinal tract, and through the skin. Absorbed
ethylbenzene is rapidly eliminated (blood t1/2 1 hour) by metabolism and excretion of metabolites. The
major metabolic pathways are side chain and ring hydroxylation with subsequent formation of
O-glucuronide and sulfate conjugates. Conjugates, mandelic acid and phenylglyoxylic acid are the
92 ETHYLBENZENE
3. HEALTH EFFECTS
primary excreted metabolites. The distribution of ethylbenzene to tissues has been modeled as a flow-
limited process (i.e., clearance from blood to tissues can be predicted by tissue blood flow) with rapid
equilibrium achieved between blood and tissues. Measured blood:tissue partition coefficients in the rat
are approximately as follows: fat, 36; liver, 2; and muscle, 0.6. These values predict the same order for
tissue concentrations for any given blood concentration; however, this order has not been verified
experimentally with simultaneously measured blood and tissue ethylbenzene concentrations in vivo.
3.4.1 Absorption 3.4.1.1 Inhalation Exposure
Inhalation studies in humans demonstrate that ethylbenzene is rapidly absorbed via this route (Bardodej
and Bardodejova 1970; Gromiec and Piotrowski 1984; Knecht et al. 2000; Tardif et al. 1997). A steady-
state blood:alveolar air concentration ratio of approximately 30 was achieved within 1 hour of initiating
exposure (Tardif et al. 1997). Volunteers exposed for 8 hours to ethylbenzene at concentrations of 23–
85 ppm were shown to retain 64% of the inspired vapor, with only trace amounts detected in expired air at
the end of the exposure period (Bardodej and Bardodejova 1970). Another inhalation study that involved
humans exposed to similar levels of ethylbenzene demonstrated mean retention rates of 49% (Gromiec
and Piotrowski 1984). The differences may be attributable to human variability in absorption rates
although they could also be due to differences in methodology.
An initial concentration of ethylbenzene in blood of 2.6 μg/mL and a half-life of 27.5 hours were
estimated in a 44-year-old man who died after a massive inhalation and dermal exposure of ≥10 hours to
gasoline (Matsumoto et al. 1992). This absorption value may have been slightly overestimated, however,
because possible contributions from dermal exposure were not addressed.
In a study conducted in Italy, blood concentrations of ethylbenzene in non-smoking policemen working as
traffic wardens showed no significant differences between before and after work shift values or from
blood ethylbenzene concentrations in policemen working indoors (Fustinoni et al. 1995). Indoor and
outdoor mean air concentrations (measured by personal air samplers) were 21 and 37 mg/m3, respectively.
Before and after shift blood ethylbenzene concentrations were 140 and 163 ng/L in indoor workers,
respectively, and were 158 and 184 ng/L in outdoor workers, respectively.
Ethylbenzene concentrations in whole blood collected from workers at the end of their work shifts
correlated significantly with the average concentrations of occupational exposure to ethylbenzene (Kawai
93 ETHYLBENZENE
3. HEALTH EFFECTS
et al. 1992). The maximum ethylbenzene concentration in air in the workplace was 5 ppm (Kawai et al.
1992).
Inhalation studies in animals exposed to ethylbenzene showed results similar to those found in humans
(Chin et al. 1980b; Freundt et al. 1989; Fuciarelli 2000; Romer et al.1986; Tardif et al. 1997). Harlan-
Wistar rats rapidly absorbed radiolabeled ethylbenzene during respiration, with a retention rate of 44%
(Chin et al. 1980b). This absorption value may have been slightly overestimated, however, because
possible contributions from dermal exposure were not addressed. Concentrations of ethylbenzene in the
blood of rats and guinea pigs exposed to ethylbenzene at 550 ppm for 8 hours reached 23 and 3 µg/mL,
respectively. Ethylbenzene concentrations in blood after the last of three daily exposures (8 hours each)
had diminished to 6 µg/mL in rats and to <2 µg/mL in guinea pigs (Cappaert et al. 2002). In mice,
steady-state blood ethylbenzene concentrations achieved within 2 hours of initiating inhalation exposures
were approximately 0.71 mg/L at 75 ppm, 2.3 mg/L at 200 ppm, and 20 mg/L at 500 ppm (Charest-Tardif
et al. 2006). These data indicate that the disposition of inhaled ethylbenzene between guinea pigs may be
different from that in rats and mice. Ethylbenzene concentrations in blood in adult rats and their offspring
increased at a rate that was greater than proportional to dose (Faber et al. 2006). Ethylbenzene levels in
maternal blood, collected on PND 22, after a 6-hour exposure to 25, 100, or 500 ppm, were 0.11, 0.56,
and 11 mg/L, respectively. The mean concentrations in the blood of pups (males/females), culled from
the dams sampled above, in the 25-, 100-, and 500-ppm groups were 0.021/0.025, 0.26/0.24, and
11.4/12.7 mg/mL, respectively (Faber et al. 2006).
No studies describing factors specifically affecting absorption of ethylbenzene following inhalation
exposure were available.
3.4.1.2 Oral Exposure
No studies were located regarding the absorption of ethylbenzene in humans following oral exposure.
Studies in animals, however, indicate that ethylbenzene is quickly and effectively absorbed by this route.
Recovery of ethylbenzene metabolites in the urine of rabbits administered a single dose of 593 mg/kg was
between 72 and 92% of the administered dose 24 hours following exposure (El Masry et al. 1956).
Similarly, 84% of the radioactivity from a single oral dose of 30 mg/kg ethylbenzene administered to
female rats was recovered within 48 hours (Climie et al. 1983). Ethylbenzene was detected at 0.49, 3.51,
and 18.28 mg/L in maternal blood of rats 1 hour after the last of four daily administrations of 26, 90, or
342 mg/kg/day (distributed over three equal doses), respectively; however, ethylbenzene was not detected
94 ETHYLBENZENE
3. HEALTH EFFECTS
(limit of detection: 0.006 mg/L) in blood of weanlings culled from the same dams (Faber et al. 2006). It
is unclear if the latter finding is due to low transfer of ethylbenzene to milk or if the 1-hour exposure-to-
sampling time-lapse was too long to allow detection of ethylbenzene.
3.4.1.3 Dermal Exposure
Studies in humans dermally exposed to liquid ethylbenzene demonstrate rapid absorption through the
skin, but absorption of ethylbenzene vapors through the skin appears to be minimal (Dutkiewicz and
Tyras 1967; Gromiec and Piotrowski 1984). Absorption rates of 24–33 mg/cm2/hour and 0.11–
0.23 mg/cm2/hour have been measured for male subjects exposed to liquid ethylbenzene and ethylbenzene
from aqueous solutions, respectively (Dutkiewicz and Tyras 1967). The average amounts of
ethylbenzene absorbed after volunteers immersed one hand for up to 2 hours in an aqueous solution of
112 or 156 mg/L ethylbenzene were 39.2 and 70.7 mg ethylbenzene, respectively. These results indicate
that skin absorption could be a major route of uptake of liquid ethylbenzene or ethylbenzene in water. In
contrast, ethylbenzene metabolite levels in urine following dermal exposure to 150–300 ppm (650–
1,300 mg/m3) ethylbenzene vapors for two hours did not differ from values taken prior to exposure,
indicating minimal, if any, dermal absorption of ethylbenzene vapors (Gromiec and Piotrowski 1984).
Susten et al. (1990) conducted in vivo percutaneous absorption studies of ethylbenzene in mice. Results
showed total absorption (sums of radioactivity found in the excreta, carcass, skin application site, and
expired breath) was 3.4% of the nominal dose. The total percentage recovered (includes wipe of skin
area, ethylbenzene 0.03%) was 95.2%. The amount of ethylbenzene absorbed at an estimated contact
time of 5 minutes was 148.55 μg with an absorption rate of 37 μg/cm2/minute.
The volumes of ethylbenzene absorbed in rats treated dermally for 24 hours with aqueous solutions of
ethylbenzene (neat [99% pure], saturated, 2/3 or 1/3 saturated), were 0.24, 0.20, 0.18, and 0.17 mL,
respectively (Morgan et al. 1991). Peak blood level during exposure to neat ethylbenzene was reported at
5.6 μg/mL, attained after 1 hour of exposure, which decreased during the remainder of the exposure
period. The concentration of ethylbenzene in the blood was highest after exposure to saturated aqueous
solutions, followed by the 2/3 and 1/3 saturated solutions.
Results of dermal penetration studies in excised rat skin indicate that the penetration rate of pure
ethylbenzene (Tsuruta 1982) is faster than that of ethylbenzene from JP-8 jet fuel (McDougal et al. 2000).
The penetration rates of pure liquid ethylbenzene following 3-, 4-, and 5-hour exposure durations in rat
95 ETHYLBENZENE
3. HEALTH EFFECTS
skin were approximately 2.38, 3.12, and 3.22 µg/cm2/hour (calculated by ATSDR from reported data on
exposure area, exposure time, and mass transfer); these rates are substantially lower than the rate of
dermal absorption determined for humans (Tsuruta 1982). This might be attributed to differences
between in vitro and in vivo testing and/or differences in rat versus human skin. McDougal et al. (2000)
reported an ethylbenzene flux of 0.377 µg/cm2/hour (0.0004 mg/cm2/hour) for ethylbenzene and a
permeability coefficient of 3.1x10⁻⁴ cm/hour during a 4-hour period in excised rat skin which had
received 2 mL of JP-8 fuel containing approximately 1,200 µg ethylbenzene/mL fuel (0.15% w/w). It
was recognized that the choice of vehicle (JP-8) could affect dermal penetration of ethylbenzene. The
steady state flux, permeability, and diffusivity values of ethylbenzene in pig skin treated with JP-8 ex vivo
were 1.04 µg/cm2/hour, 0.06x10⁻³ cm/hour, and 715x10-6 cm2/hour (Muhammad et al. 2005).
3.4.2 Distribution 3.4.2.1 Inhalation Exposure
In humans exposed for 2 hours to a mixture of industrial xylene containing 40.4% ethylbenzene, the
estimated solvent retention in adipose tissue was 5% of the total uptake (Engstrom and Bjurstrom 1978).
Since there was no indication of differences in turnover rates of chemicals within the mixture, it is likely
that the retention of ethylbenzene in adipose tissue was approximately 2% of the total uptake. No studies
were located concerning the distribution of ethylbenzene in humans following exposure to ethylbenzene
alone. However, studies by Pierce et al. (1996) suggest that in vitro, the partitioning of ethylbenzene
from air into human adipose tissue is similar to that observed in rats.
Studies conducted in rats and mice have shown that inhaled ethylbenzene accumulates in adipose tissue
(Elovaara et al. 1982; Engstrom et al. 1985; Fuciarelli 2000). In rats and mice exposed to 750 ppm
ethylbenzene for 6 hours/day, concentrations of ethylbenzene in mesenteric adipose were 20–60 times
higher than steady-state blood concentrations, whereas concentration in liver were similar to blood
(Fuciarelli 2000). Concentrations of ethylbenzene in perirenal adipose tissue were reported to increase,
although not linearly, with increasing concentrations of ethylbenzene (Engstrom et al. 1985) and in a
mixture of solvent vapors containing ethylbenzene (Elovaara et al. 1982). The less-than-linear increase of
ethylbenzene in adipose tissue with increasing dose was partially attributed to the induction of drug-
metabolizing enzymes occurring with increasing exposure concentrations, altered blood flow to adipose
tissue, changes in lung excretion, and changes in the distribution of ethylbenzene in different tissues.
Ethylbenzene was shown to be efficiently distributed throughout the body in rats following inhalation
exposure to radiolabeled ethylbenzene (Chin et al. 1980b). The highest amounts of radioactivity in
96 ETHYLBENZENE
3. HEALTH EFFECTS
tissues 42 hours after exposure to 230 ppm ethylbenzene for 6 hours were found in the carcass, liver, and
gastrointestinal tract, with lower amounts detected in the adipose tissue.
3.4.2.2 Oral Exposure
No studies were located regarding distribution of ethylbenzene in humans or animals following oral
exposure.
3.4.2.3 Dermal Exposure
No studies were located regarding distribution in humans following dermal exposure to ethylbenzene.
The percentages of absorbed doses following dermal application of [14C]-ethylbenzene in hairless mice
were: 15.5%, carcass; 4.5%, application site; 14.3%, expired breath; and 65.5%, excreta (Susten et al.
1990).
3.4.3 Metabolism
The metabolism of ethylbenzene has been studied in humans and other mammalian species. The data
demonstrate that ethylbenzene is metabolized mainly through hydroxylation and then through conjugation
reactions from which numerous metabolites have been isolated. Figure 3-3 summarizes the proposed
metabolic pathway for ethylbenzene in humans (Engstrom et al. 1984). The major urinary metabolites
have been identified (Kiese and Lenk 1974; Sullivan et al. 1976). Comparisons of in vitro data with data
from intact animals indicate that liver microsomal enzymes participate in ethylbenzene hydroxylation
(McMahon and Sullivan 1966; McMahon et al. 1969; Sams et al. 2004). In microsomes prepared from
human liver, hydroxylation of ethylbenzene to 1-phenylethanol is catalyzed by cytochrome P-450
isoforms CYP2E1 and CYP2B6 (Sams et al. 2004). Adrenal cortex may be a major site of extra-hepatic
ethylbenzene metabolism (Greiner et al. 1976). No significant qualitative differences in metabolism
between oral and inhalation routes were reported in humans or animals. The metabolism of ethylbenzene
has been found to vary with species, sex, and nutritional status. These differences are described below.
In humans exposed via inhalation, the major metabolites of ethylbenzene are mandelic acid
(approximately 64–71%) and phenylglyoxylic acid (approximately 19–25%) (Bardodej and Bardodejova
1970; Engstrom et al. 1984; Knecht et al. 2000; Jang et al. 2001; Tardif et al. 1997). Based on data from
human, animal, and in vitro studies, the metabolic pathway for ethylbenzene in humans was proposed
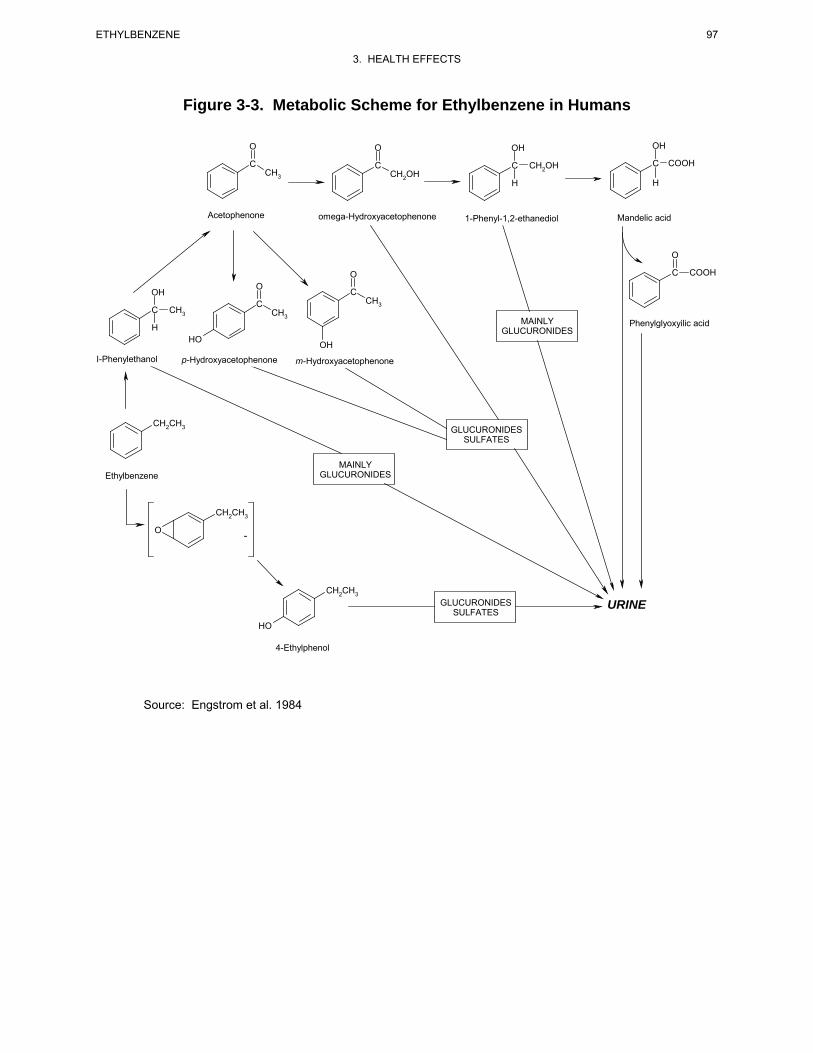
97 ETHYLBENZENE
3. HEALTH EFFECTS
Figure 3-3. Metabolic Scheme for Ethylbenzene in Humans
O O OH OH
C C C CH OH C COOH CH3 CH 2
2OH H H
Acetophenone omega-Hydroxyacetophenone 1-Phenyl-1,2-ethanediol Mandelic acid
O
O C COOH O
OH C CHC 3
C CH3 CH3 MAINLY Phenylglyoxyilic acid H GLUCURONIDES HO OH
I-Phenylethanol p-Hydroxyacetophenone m-Hydroxyacetophenone
CH2CH3 GLUCURONIDES SULFATES
MAINLY Ethylbenzene GLUCURONIDES
CH2CH3
O -
CH2CH3 GLUCURONIDES URINE
SULFATES HO
4-Ethylphenol
Source: Engstrom et al. 1984
98 ETHYLBENZENE
3. HEALTH EFFECTS
(Engstrom et al. 1984). This pathway is shown in Figure 3-3. Evidence indicates that the initial step in
this metabolic pathway is oxidation (hydroxylation) of the side chain of ethylbenzene to produce
1-phenylethanol. Microsomal preparations from rat liver have shown that the oxidation of ethylbenzene
proceeds with the incorporation of atmospheric oxygen, as opposed to oxygen from water molecules
(McMahon et al. 1969). Filipovic et al. (1992) have shown that cytochrome P-450(cam) from Pseudomonas
putida provides a useful metabolic model for ethylbenzene hydroxylation, converting ethylbenzene to
1-phenylethanol at 98%. 1-Phenylethanol is conjugated to glucuronide, which then is either excreted or
converted to subsequent metabolites. Oxidation of 1-phenylethanol yields acetophenone, which is both
excreted in the urine as a minor metabolite and further transformed. Continued oxidation of the side
chain leads to the sequential formation of 2-hydroxyacetophenone, 1-phenyl-1,2-ethanediol, mandelic
acid, and phenylglyoxylic acid. Minor pathways (e.g., ring hydroxylation) include glucuronide and
sulfate conjugation with hydroxylated derivatives to form glucuronides and sulfates that are excreted in
the urine. Analysis of urine from humans exposed to ethylbenzene via the inhalation route showed that
approximately 70 and 25% of the retained dose of ethylbenzene is excreted as mandelic acid and
phenylglyoxylic acid, respectively (Bardodej and Bardodejova 1970; Engstrom et al. 1984). Additional
metabolites detected in human urine include 1-phenylethanol (4%), p-hydroxyacetophenone (2.6%),
m-hydroxyacetophenone (1.6%), and trace amounts of 1-phenyl-1,2-ethanediol, acetophenone,
2-hydroxyacetophenone, and 4-ethylphenol. Following dermal exposure of humans, however, excretion
of mandelic acid was shown to be only 4.6% of the absorbed dose (Dutkiewicz and Tyras 1967), which
may indicate differences in the metabolic fate between inhalation and dermal exposure routes. However,
the small percentage of absorbed dose accounted for limits the interpretation. No animal data were
located which could confirm these metabolic differences following dermal exposure. Generally, ethyl-
benzene metabolites and intermediates are thought to be only slightly toxic, since no adverse effects from
human experimental exposure have been reported (Bardodej and Bardodejova 1970).
Qualitative and quantitative differences in the biotransformation of ethylbenzene in animals as compared
to humans have been reported (Bakke and Scheline 1970; Climie et al. 1983; El Masry et al. 1956;
Engstrom et al. 1984, 1985; Smith et al. 1954a, 1954b; Sollenberg et al. 1985). The major metabolites of
ethylbenzene differ from species to species, and different percentages of the metabolites are seen in
different species. The principal metabolic pathway in rats is believed to begin with oxidation
(hydroxylation) of the side chain as in humans (Climie et al. 1983; Engstrom et al. 1984, 1985; Smith et
al. 1954a). In rats exposed by inhalation or orally to ethylbenzene, the major metabolites were identified
as benzoic acids and glycine conjugates (e.g., hippuric acid; approximately 38%), 1-phenylethanol
(approximately 25%), and mandelic acid (approximately 15–23%), with phenylglyoxylic acid making up
99 ETHYLBENZENE
3. HEALTH EFFECTS
only 10% of the metabolites (Climie et al. 1983; Engstrom et al. 1984, 1985; Fuciarelli 2000). The
urinary excretion rate of mandelic acid in rats exposed to 250 ppm ethylbenzene, 6 hours/day for 15 days
was the same after the first exposure as it was after the last exposure. In contrast, excretion in the 1,000
ppm group was 2–5 times higher after the last exposure than it was after the first exposure (Saillenfait et
al. 2006). Both in vivo studies using rats and in vitro studies using rat liver microsomes showed that
4-ethylphenol was also produced from ethylbenzene, perhaps by rearrangement of corresponding arene
oxides (Bakke and Scheline 1970; Kaubisch et al. 1972). Kaubisch et al. (1972) also showed that
2-hydroxyethylbenzene was produced from ethylbenzene in vitro in the presence of rat liver microsomes.
The level of ethylbenzene exposure was shown to affect the metabolic pattern. This was thought to be
due either to selective enzymatic induction in the biotransformation of ethylbenzene or to delayed
excretion of certain metabolites with increasing doses.
Acetophenone was detected (quantitative data were not provided) in blood of rats and guinea pigs
exposed to ethylbenzene in air at 500 ppm, 8 hours/day for 3 days (Cappaert et al. 2002). Further
clarification of ethylbenzene metabolic pathways was provided by Sullivan et al. (1976). Using
intraperitoneally dosed rats, the authors demonstrated that the conversion of 1-phenylethanol to mandelic
acid initially involves oxidation to acetophenone. Acetophenone was considered to be the precursor of
mandelic acid, benzoylformic acid, and benzoic acid. A similar study in which rabbits were
intraperitoneally injected with a single dose of 250 mg ethylbenzene/kg body weight was conducted by
Kiese and Lenk (1974). This study showed that between 1 and 10% of the dose was excreted as
1-phenylethanol in the urine and <1% was excreted in the urine as 2-hydroxyacetophenone, p-hydroxy-
acetophenone, and m-hydroxyacetophenone.
Rabbits given an oral dose of ethylbenzene showed the major metabolic pathway to be hydroxylation of
the α-carbon to 1-phenylethanol, which is oxidized further to a number of intermediates and metabolites
(El Masry et al. 1956; Smith et al. 1954a). Many of these intermediates are subsequently conjugated to
glucuronides and sulfates and excreted. In rabbits, the most important metabolite is hippuric acid, which
is probably formed by oxidative decarboxylation of phenylglyoxylic acid (El Masri et al. 1958).
Oxidation of the methyl group of ethylbenzene was also shown to occur, as evidenced by the presence of
phenaceturic acid in the urine. A slight increase in the excretion of thioether suggests that glutathione
conjugation may also play a minor role.
The nutritional status of animals was demonstrated to have a marked effect on ethylbenzene metabolism
in rats (Nakajima and Sato 1979). The in vitro metabolic activity of liver microsomal enzymes on ethyl-
100 ETHYLBENZENE
3. HEALTH EFFECTS
benzene was shown to be significantly enhanced in fasted rats despite a marked loss of liver weight. No
significant increases in the microsomal protein and cytochrome P-450 contents were detected in fasted
rats compared with fed rats. In addition, the metabolic rate in fasted males was significantly higher than
in fasted females, but the difference in rates decreased following food deprivation for 3 days. These
results suggest possible sex differences in the rate of ethylbenzene metabolism. However, it is not known
if such differences exist in the normally fed rats.
Metabolism of ethylbenzene has not been studied in children or immature animals. However, some
members of two of the enzyme superfamilies involved in conjugation of phase I ethylbenzene metabolites
are known to be developmentally regulated. In humans, UDP glucuronosyltransferase activity does not
reach adult levels until about 6–18 months of age, although the development of this activity is isoform
specific. Activity of sulfotransferases seems to develop earlier, although again, it is isoform specific. The
activity of some sulfotransferase isoforms may even be greater during infancy and early childhood than in
adults (Leeder and Kearns 1997).
3.4.4 Elimination and Excretion 3.4.4.1 Inhalation Exposure
Excretion of ethylbenzene has been studied in humans and in a number of animal species. Ethylbenzene
has been shown to be rapidly metabolized and then eliminated from the body, primarily as urinary
metabolites. The major metabolic products have been previously described in Section 3.4.3.
Elimination of ethylbenzene has been studied in volunteers exposed by inhalation (Bardodej and
Bardodejova 1970; Dutkiewicz and Tyras 1967; Engstrom and Bjurstrom 1978; Gromiec and Piotrowski
1984; Knecht et al. 2000; Tardif et al. 1997; Yamasaki 1984) and in humans exposed by inhalation in the
occupational setting (Holz et al. 1995; Jang et al. 2001; Kawai et al. 1991, 1992; Ogata and Taguchi
1988). Elimination of ethylbenzene in exhaled air in volunteers exposed to 33 ppm ethylbenzene
exhibited multi-phasic kinetics with an early-phase half time of <1 hour (Tardif et al. 1997). This
elimination rate is similar to the rate of elimination of ethylbenzene from blood following cessation of
exposure (Knecht et al. 2000; Tardif et al. 1997) and is considerably faster than the rate of elimination
(i.e., urinary excretion) of the metabolites, mandelic acid (t1/2≈3–5 hours) and phenylgloxylic acid
(t1/2≈10–12 hours) (Gromiec and Piotrowski 1984; Knecht et al. 2000; Tardif et al. 1997). Elimination of
mandelic acid was reported to be biphasic, with half-lives of 3.1 hours for the rapid phase and 25 hours
for the slow phase (Gromiec and Piotrowski 1984). During the 8-hour exposure, 23% of the retained
101 ETHYLBENZENE
3. HEALTH EFFECTS
ethylbenzene was eliminated in the urine, and 14 hours following termination of exposure an additional
44% of the retained ethylbenzene was eliminated. The highest excretion rate of urinary metabolites in
humans exposed to ethylbenzene by inhalation occurred 6–10 hours after the beginning of exposure
(Gromiec and Piotrowski 1984; Yamasaki 1984).
Concentrations of ethylbenzene metabolites in before-shift and after-shift urine were significantly higher
in workers exposed to 85 to >921 ppm ethylbenzene in a styrene plant than in control workers exposed to
33.4–66.8 ppm (Holz et al. 1995).
A statistically significant correlation was observed between urinary excretion of mandelic acid and
ethylbenzene exposure in workers exposed to mixed solvents (including an ethylbenzene time-weighted
average [TWA] of 0.9 ppm) in a metal-coating factory (Kawai et al. 1991). No correlation was observed
between ethylbenzene exposure and phenylglyoxylic acid urinary excretion. In a study of chronic-
duration exposure at lower levels (2.1 and 2.3 ppm for geometric and arithmetic mean, respectively), no
significant correlation was observed between ethylbenzene exposure and urinary excretion of
phenylglyoxylic acid and mandelic acid (Kawai et al. 1992).
In animals, elimination of 14C-ethylbenzene following inhalation exposure is rapid and occurs primarily
via urinary excretion (Chin et al. 1980a, 1980b; Engstrom et al. 1984, 1985) and to a much lesser degree
via the feces, and expired “gasses” and carbon dioxide (Chin et al. 1980b). Rats exposed to 230 ppm
radiolabeled ethylbenzene for 6 hours via inhalation excreted virtually all of the radioactivity within
24 hours after the onset of exposure (Chin et al. 1980a, 1980b). Ninety-one percent of the radioactivity
was recovered, primarily in the form of urinary metabolites. In a similar inhalation experiment using rats
exposed to 300 or 600 ppm, urinary excretion was reported to be 83 and 59% of the absorbed dose within
48 hours after the onset of exposure, with 13% eliminated during the first 6 hours of exposure (Engstrom
et al. 1984).
Quantitative differences between species in the percentages of metabolites excreted in the urine were also
reported by Chin et al. (1980a). In this report, urinary metabolites in dogs and rats exposed to
ethylbenzene by inhalation were studied. Although similarities in the types of metabolites recovered
following inhalation exposure were reported, quantitative differences, albeit minor ones, were noted in the
ratio of metabolites present in the urine. These results were attributed to differences in metabolism
between dogs and rats.
102 ETHYLBENZENE
3. HEALTH EFFECTS
Elimination of inhaled ethylbenzene from blood, fat, liver, and lung tissue following inhalation exposures
is biphasic in rats and mice (Fuciarelli 2000). The terminal phase for blood is approximately 4–7 times
slower than the initial phase. For example, in male rats exposed to 75 ppm for 6 hours, the initial and
terminal elimination half-times were approximately 77 and 493 minutes, respectively. Blood elimination
kinetics of inhaled ethylbenzene are dependent on exposure concentration, with decreasing clearance of
ethylbenzene from blood in association with increasing exposure concentration. In female mice, rate
constants for ethylbenzene measured at the conclusion of 4-hour exposures to concentrations ranging
from 75 to 1,000 ppm were 0.21 minute-1 (t1/2=3.3 minute) at 75 ppm and 0.011 minute-1 (t1/2=63 minutes)
at 1,000 ppm; similar decreases in elimination rate were observed in male mice (Charest-Tardif et al.
2006). Elimination half-life values increased approximately 2-fold, with the 10-fold increase in exposure
concentration, and the ratio of the area under the curve (AUC) for ethylbenzene in blood/exposure
concentration increased 10–20-fold (Fucareli 2000). The concentration dependence on elimination is
consistent with a capacity limitation in metabolism of ethylbenzene. Elimination rates measured in mice
after 1 or 7 days of 4-hour exposures to 75 ppm ethylbenzene were similar; however, elimination rates
increased following 7 days of exposure to 750 ppm (e.g., 0.016 minute-1, t1/2=43.3 minutes, female mice),
compared to 1 day of exposure (0.061 minute-1, t1/2=11.4 minutes, female mice; Charest-Tardif et al.
2006). These observations are consistent with induction of metabolic clearance of ethylbenzene in
association with repeated exposures to 750 ppm. Elimination rates of ethylbenzene from blood were
faster in mice compared to rats. In rats exposed to 75 ppm ethylbenzene for 6 hours, the rate for the
initial phase of elimination was 0.00902 minute-1 (t1/2=76.8 minutes) in male rats and 0.0102 minute-1
(t1/2=68.1 minutes) in female rats. In mice the elimination rates were 0.0596 minute-1 (t1/2=11.6 minutes)
in male mice, and 0.109 minute-1 (t1/2=6.36 minutes) in female mice (Fuciarelli 2000).
3.4.4.2 Oral Exposure
No studies were located regarding the excretion of ethylbenzene metabolites in humans following oral
exposure to ethylbenzene.
Elimination of ethylbenzene and its metabolites in animals after oral exposure has been shown to be
similar to that following inhalation exposure. Female rats administered a single oral dose of 30 mg
radiolabeled ethylbenzene/kg/body weight showed very rapid elimination, mostly in the urine (Climie et
al. 1983). Eighty-two percent of the radioactivity was detected in the urine, while 1.5% was detected in
the feces. The major metabolites were mandelic acid (23%) and hippuric acid (34%), with 1-phenylethyl
glucuronide detected as a minor metabolite. Relatively minor metabolites (e.g., 4-ethylphenol, 2-phenyl-
103 ETHYLBENZENE
3. HEALTH EFFECTS
ethanol, 1-phenylethanol) were shown to be excreted in the urine of male rats exposed to a single oral
dose of 100 mg/kg ethylbenzene administered by gavage in oil (Bakke and Scheline 1970). No data on
the major metabolites were provided in this study.
In a similar study in which male rats were given single oral doses of 350 mg/kg/body weight ethyl-
benzene, the excretion of mandelic acid and phenylglyoxylic acid was detected in the first urine sample
after exposures. Peak concentration was reached within 17 hours, and ethylbenzene was virtually
eliminated 48 hours following the onset of exposure (Sollenberg et al. 1985).
As in inhalation experiments, quantitative and qualitative differences between species were shown to exist
in the percentages of metabolites excreted in the urine. Rabbits orally exposed to ethylbenzene excreted
large amounts of glucuronide conjugates in the urine (El Masry et al. 1956; Smith et al. 1954a, 1954b)
instead of mandelic acid, hippuric acid, and phenylglyoxylic acid, which are the major metabolites in rats
(see above). Glucuronide conjugates accounted for 32% of the administered dose, with mandelic acid
making up only 2% of the administered dose (El Masry et al. 1956). These results were confirmed in a
study by Smith et al. (1954a, 1954b), who detected 32% of a single oral dose of ethylbenzene
(433 mg/kg) administered to rabbits as glucuronide conjugates excreted in the urine.
3.4.4.3 Dermal Exposure
In humans, the pattern of excretion of ethylbenzene metabolite following dermal exposure has been
shown to differ significantly from the pattern in which humans have been exposed by inhalation. Dermal
absorption of ethylbenzene in aqueous solutions was estimated as the difference of the ethylbenzene
concentrations in solution before and after exposure. The urinary excretion of mandelic acid in humans
dermally exposed to ethylbenzene for 2 hours was only 4.6% of the absorbed ethylbenzene (Dutkiewicz
and Tyras 1967). Urine was collected periodically during the 2-hour exposure period and a 10-hour
follow-up. Interpretation is difficult due to the small percentage of absorbed dose accounted for. No
ethylbenzene was reported to be excreted in exhaled air. No further details on the excretion patterns were
provided.
Susten et al. (1990) conducted in vivo percutaneous absorption studies of ethylbenzene in Hairless mice.
Results showed total absorption (sums of radioactivity found in the excreta, carcass, skin application site,
and expired breath) was 3.4% of the nominal dose. The absorbed dose collected in expired breath during
the first 15 minutes of ethylbenzene application was 9.3%. The percentage of absorbed doses following
104 ETHYLBENZENE
3. HEALTH EFFECTS
dermal application of [14C]-ethylbenzene are as follows: 15.5% in the carcass; 4.5% at the application
site; 14.3% in expired breath; and 65.5% in excreta.
3.4.5 Physiologically Based Pharmacokinetic (PBPK)/Pharmacodynamic (PD) Models
Physiologically based pharmacokinetic (PBPK) models use mathematical descriptions of the uptake and
disposition of chemical substances to quantitatively describe the relationships among critical biological
processes (Krishnan et al. 1994). PBPK models are also called biologically based tissue dosimetry
models. PBPK models are increasingly used in risk assessments, primarily to predict the concentration of
potentially toxic moieties of a chemical that will be delivered to any given target tissue following various
combinations of route, dose level, and test species (Clewell and Andersen 1985). Physiologically based
pharmacodynamic (PBPD) models use mathematical descriptions of the dose-response function to
quantitatively describe the relationship between target tissue dose and toxic end points.
PBPK/PD models refine our understanding of complex quantitative dose behaviors by helping to
delineate and characterize the relationships between: (1) the external/exposure concentration and target
tissue dose of the toxic moiety, and (2) the target tissue dose and observed responses (Andersen and
Krishnan 1994; Andersen et al. 1987). These models are biologically and mechanistically based and can
be used to extrapolate the pharmacokinetic behavior of chemical substances from high to low dose, from
route to route, between species, and between subpopulations within a species. The biological basis of
PBPK models results in more meaningful extrapolations than those generated with the more conventional
use of uncertainty factors.
The PBPK model for a chemical substance is developed in four interconnected steps: (1) model
representation, (2) model parameterization, (3) model simulation, and (4) model validation (Krishnan and
Andersen 1994). In the early 1990s, validated PBPK models were developed for a number of
toxicologically important chemical substances, both volatile and nonvolatile (Krishnan and Andersen
1994; Leung 1993). PBPK models for a particular substance require estimates of the chemical substance-
specific physicochemical parameters, and species-specific physiological and biological parameters. The
numerical estimates of these model parameters are incorporated within a set of differential and algebraic
equations that describe the pharmacokinetic processes. Solving these differential and algebraic equations
provides the predictions of tissue dose. Computers then provide process simulations based on these
solutions.
105 ETHYLBENZENE
3. HEALTH EFFECTS
The structure and mathematical expressions used in PBPK models significantly simplify the true
complexities of biological systems. If the uptake and disposition of the chemical substance(s) are
adequately described, however, this simplification is desirable because data are often unavailable for
many biological processes. A simplified scheme reduces the magnitude of cumulative uncertainty. The
adequacy of the model is, therefore, of great importance, and model validation is essential to the use of
PBPK models in risk assessment.
PBPK models improve the pharmacokinetic extrapolations used in risk assessments that identify the
maximal (i.e., the safe) levels for human exposure to chemical substances (Andersen and Krishnan 1994).
PBPK models provide a scientifically sound means to predict the target tissue dose of chemicals in
humans who are exposed to environmental levels (for example, levels that might occur at hazardous waste
sites) based on the results of studies where doses were higher or were administered in different species.
Figure 3-4 shows a conceptualized representation of a PBPK model.
If PBPK models for ethylbenzene exist, the overall results and individual models are discussed in this
section in terms of their use in risk assessment, tissue dosimetry, and dose, route, and species
extrapolations.
Several models have been developed that simulate the kinetics of inhaled ethylbenzene in animals and
humans (Dennison et al. 2003; Haddad et al. 1999, 2000, 2001; Jang et al 2001; Nong et al. 2007; Tardif
et al. 1997). The Dennison et al. (2003) and Tardif et al. (1997) inhalation models have been incorporated
into models of gasoline component mixture models (Dennison et al. 2004, 2005; Haddad et al. 2001). An
extension of the Tardif et al. (1997) model has been reported that includes simulation of gastrointestinal
absorption (i.e., transfer of ingested ethylbenzene to liver) of ethylbenzene in rats (Faber et al. 2006). A
model of dermal absorption ethylbenzene in human has also been reported (Shatkin and Brown 1991).
Models that simulate kinetics of ingested ethylbenzene have not been reported. In general, all of the
inhalation models of have similar structures, with the major conceptual differences being the simulation
of metabolism and excretion of metabolites. The Nong et al. (2007) mouse model simulates metabolism
of ethylbenzene in liver, lung, and richly perfused tissues, whereas all other models attribute all
ethylbenzene metabolism to the liver. The Nong et al. (2007) mouse model also simulated changes in
ethylbenzene blood kinetics in mice that occurred with repeated exposure to ethylbenzene at exposure
concentrations >75 ppm. These changes were attributed to induction of cytochrome P450 and were
simulated as an increase in Vmax for metabolism of ethylbenzene in liver. The Jang et al. (2001) human
model simulates excretion of the ethylbenzene metabolite, mandelic acid, whereas other models do not
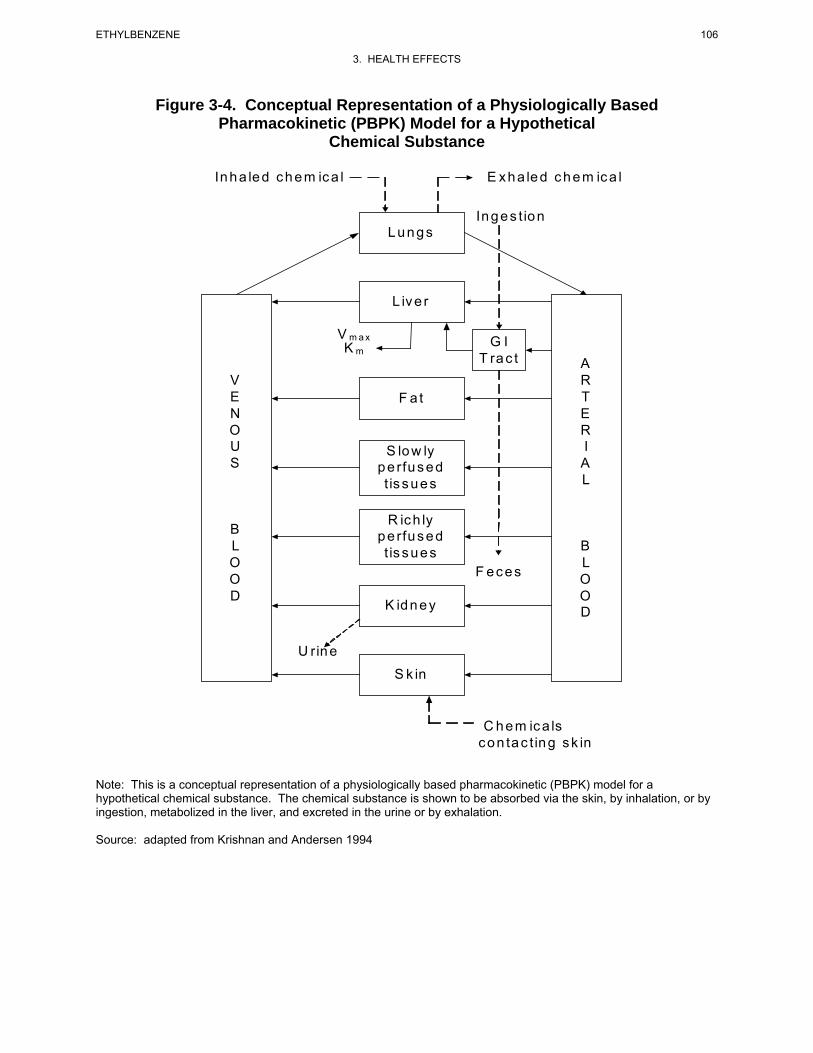
106 ETHYLBENZENE
3. HEALTH EFFECTS
Figure 3-4. Conceptual Representation of a Physiologically Based Pharmacokinetic (PBPK) Model for a Hypothetical
Chemical Substance
Lungs
L iv e r
F a t
S lo w ly pe rfus ed t is s ues
R ic h ly pe rfus ed t is s ues
K idney
S k in
V E N O U S
B L O O D
A R T E R I A L
B L O O D
V m a x K m
Inges t ion
Inha led c hem ic a l E x ha led c hem ic a l
G I T ra c t
F ec es
U rin e
C h e m ic a ls con tac t ing sk in
Note: This is a conceptual representation of a physiologically based pharmacokinetic (PBPK) model for a hypothetical chemical substance. The chemical substance is shown to be absorbed via the skin, by inhalation, or by ingestion, metabolized in the liver, and excreted in the urine or by exhalation.
Source: adapted from Krishnan and Andersen 1994
107 ETHYLBENZENE
3. HEALTH EFFECTS
simulate the urinary elimination pathway. The Tardif et al. (1997), Dennison et al. (2003), and Nong et
al. (2007) models are described in greater detail in the sections that follow. Complete documentation of
the Jang et al. (2001) model was not available for providing a detailed description of the model, although
it appears to be conceptually similar to the Tardif et al (1997) and Dennison et al. (2003) models.
The Tardif et al. (1997; Haddad et al. 1999, 2000, 2001) Model
Description of the Model. Tardif et al. (1997) developed a PBPK model for simulating the kinetics
of ethylbenzene, toluene, and xylene in blood following inhalation exposures to the individual chemicals
or the ternary mixture (in rats and humans). The structure of the model is essentially identical the generic
model depicted in Figure 3-4, with tissue compartments limited to lungs, liver, fat, richly perfused tissues
(RPT), and poorly perfused tissues (SPT). All metabolism was attributed to the liver and represented as
functions of the concentration of parent compound in liver venous blood, affinity constant (Km), and
maximum reaction velocity (Vmax). Transfers of parent compound between blood and tissues were
assumed to be flow-limited, with clearance represented by tissue blood flow (L/hour). Parameters for the
ethylbenzene model are presented in Table 3-6. Tissue: air partition coefficients for ethylbenzene were
derived from vial equilibrium studies of isolated rat tissues. Tissue:blood partition coefficients were
derived from measured tissue:air and blood:air partition coefficients (i.e., tissue:blood=tissue:air/
blood:air; Tardif et al. 1997). Metabolism parameter values for ethylbenzene were derived by fitting the
model to observations of blood ethylbenzene kinetics measured in rats during and following 4-hour
exposures to ethylbenzene in a dynamic exposure chamber (Tardif et al. 1996). Physiological parameters,
cardiac output (QC), alveolar ventilation rate (QP), and metabolism Vmax were allometrically scaled
across species (i.e., rat to human) as a function of body weight (BW, scaling factor=BW0.75). A blood:air
partition coefficient for humans was estimated from vial equilibrium measurements made on isolated
human blood; human tissue:blood partition coefficients were derived based on tissue:air coefficients for
the rat (Tardif et al. 1997).
Subsequent enhancements of the Tardif et al. (1997) model included simulation of kinetics of an inhaled
quaternary mixture that included benzene, ethylbenzene, toluene, and xylene (Haddad et al. 1999) or
mixtures of the latter quaternary mixture with dichloromethane (Haddad et al. 2000, 2001). In the
development of the quaternary mixture model, values for Vmax and Km for ethylbenzene were re-estimated
by fitting data on kinetics of ethylbenzene in venous blood following 4-hour exposures to ethylbenzene
(50, 100, or 200 ppm; Haddad et al. 1999; Tardif et al. 1997). The resulting estimates were similar to the
original estimates reported in Tardif et al. (1997): Vmax=6.39 mg/hour-kg) and Km=1.04 mg/L.
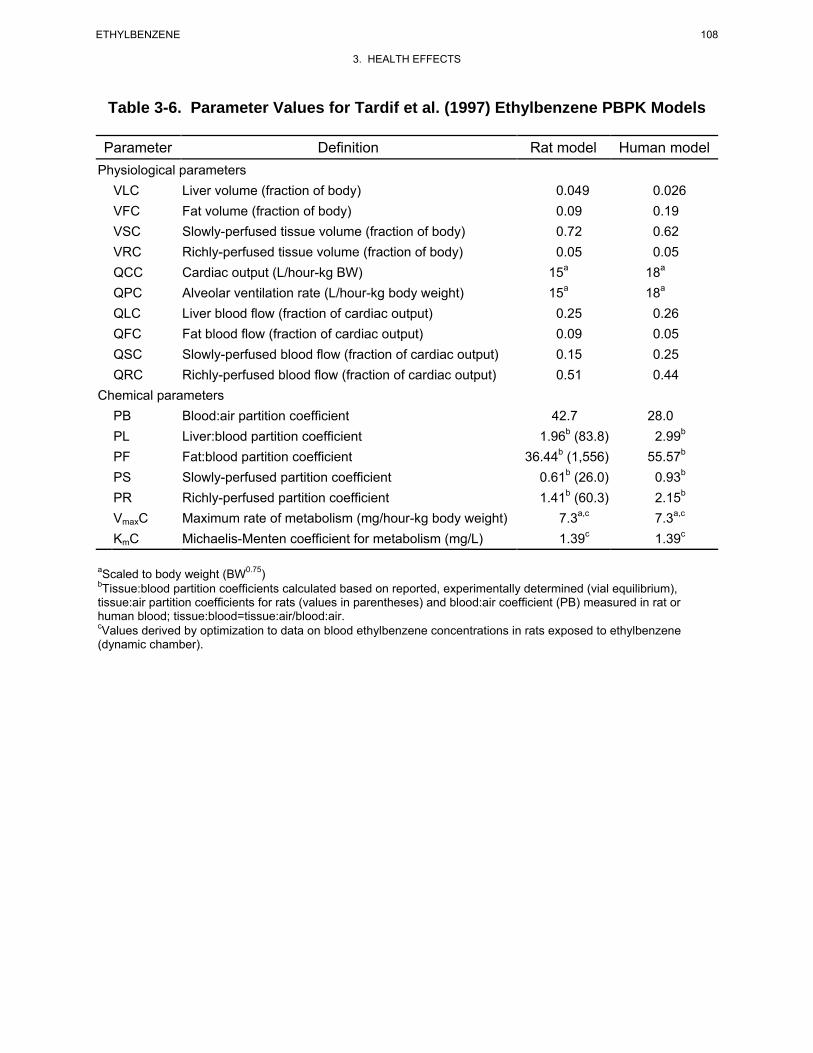
108 ETHYLBENZENE
3. HEALTH EFFECTS
Table 3-6. Parameter Values for Tardif et al. (1997) Ethylbenzene PBPK Models
Parameter Definition Rat model Human model Physiological parameters
VLC Liver volume (fraction of body) 0.049 0.026 VFC Fat volume (fraction of body) 0.09 0.19 VSC Slowly-perfused tissue volume (fraction of body) 0.72 0.62 VRC Richly-perfused tissue volume (fraction of body) 0.05 0.05 QCC Cardiac output (L/hour-kg BW) 15a 18a
QPC Alveolar ventilation rate (L/hour-kg body weight) 15a 18a
QLC Liver blood flow (fraction of cardiac output) 0.25 0.26 QFC Fat blood flow (fraction of cardiac output) 0.09 0.05 QSC Slowly-perfused blood flow (fraction of cardiac output) 0.15 0.25 QRC Richly-perfused blood flow (fraction of cardiac output) 0.51 0.44
Chemical parameters PB Blood:air partition coefficient 42.7 28.0 PL Liver:blood partition coefficient 1.96b (83.8) 2.99b
PF Fat:blood partition coefficient 36.44b (1,556) 55.57b
PS Slowly-perfused partition coefficient 0.61b (26.0) 0.93b
PR Richly-perfused partition coefficient 1.41b (60.3) 2.15b
VmaxC Maximum rate of metabolism (mg/hour-kg body weight) 7.3a,c 7.3a,c
KmC Michaelis-Menten coefficient for metabolism (mg/L) 1.39c 1.39c
aScaled to body weight (BW0.75)bTissue:blood partition coefficients calculated based on reported, experimentally determined (vial equilibrium), tissue:air partition coefficients for rats (values in parentheses) and blood:air coefficient (PB) measured in rat or human blood; tissue:blood=tissue:air/blood:air. cValues derived by optimization to data on blood ethylbenzene concentrations in rats exposed to ethylbenzene (dynamic chamber).
109 ETHYLBENZENE
3. HEALTH EFFECTS
Although the Tardiff et al. (1997) model was developed to simulate kinetics of inhaled ethylbenzene,
Faber et al. (2006) reported an extension of the model that includes simulation of gastrointestinal
absorption (i.e., transfer of ingested ethylbenzene to liver) of ethylbenzene in rats. The gastrointestinal
absorption rate constant of 0.18 hour-1 was estimated by iteratively adjusting the ate constant to achieve
agreement with observed blood ethylbenzene kinetics in following a gavage dose of ethylbenzene
(180 mg/kg), in corn oil, administered to adult female rats.
Validation of the Model. Optimization of the metabolism parameters against observed blood
kinetics of ethylbenzene in rats exposed for 4 hours to 100 or 200 ppm ethylbenzene achieved predicted
blood concentration of ethylbenzene that were within 1–2 standard deviations (SD) of the observations.
Most of the validation efforts reported in Tardif et al. (1997) were directed at exploring how well the
mixture model predicted observed blood kinetics of ethylbenzene, toluene, or xylene in rats during and
following exposures to binary or ternary mixtures of the chemicals. Interactions were simulated as
competitive, noncompetitive, or uncompetitive inhibition of metabolism, with the values of the inhibition
constants derived by fitting the model to observed blood kinetics during and following exposures to
binary mixtures. Although the mixture model achieved predictions similar to observations (i.e., within 1–
2 SD of observations), this outcome would have been highly influenced by the parameter values selected
for each of the individual chemicals, including fitted interaction constants. A more direct evaluation of
the ethylbenzene model was explored by comparing predictions of the human model (allometrically
scaled from the rat) to ethylbenzene concentrations in blood and in exhaled air observed in human
subjects who were exposed to ethylbenzene (33 ppm) for 7 hours/day on 4 different days (Tardif et al.
1991, 1997). Predicted blood and exhaled air concentrations of ethylbenzene (at steady-state and
following cessation of exposure) in subjects exposed to ethylbenzene were within 1–2 SD of
observations. The Tardif et al. (1997) model has been incorporated into a mixtures model of JP-8 vapor
and its components (Campbell and Fisher 2007). The model included simulations of the kinetics of m-
xylene and ethylbenzene, with other aromatic components of JP-8 vapor represented as a lumped
component. Interactions between m-xylene and ethylbenzene were simulated as competitive inhibition of
metabolism. The mixtures model predicted kinetics liver concentrations of ethylbenzene in rats during
and following 4-hour exposures to JP-8 vapor (380–2,700 mg/m3) that were similar to observed kinetics
(i.e., predicted liver concentrations were within 1–2 SD of observations).
Risk Assessment. The ethylbenzene model predicts blood kinetics of ethylbenzene and kinetics of
metabolism of ethylbenzene that occur in association with inhalation exposures. These predictions are
110 ETHYLBENZENE
3. HEALTH EFFECTS
potentially useful for predicting inhalation-derived internal doses of ethylbenzene in rats and/or humans
(e.g., blood concentrations, liver concentrations of parent compound, or amounts of total metabolites
formed in the liver), and for making extrapolations of these internal dose metrics across species. The
applicability any of the above dose metrics to risk assessment will depend on the mechanism for the
specific toxicity end point being assessed, and contribution of the parent compound and/or metabolism
metabolites to toxicity (see Section 3.5.2, Mechanisms of Toxicity).
The Tardif et al. (1997) ethylbenzene model has been incorporated into a mixtures model for
alkylbenzenes (ethylbenzene, toluene, m-xylene), benzene, and dichloromethane (DCM), (Haddad et al.
2001). This mixture model has been applied to the derivation of interaction coefficients for various
endpoints of dichloromethane toxicity (i.e., hypoxia, central nervous system effects, and cancer) based on
predictions of corresponding relevant DCM internal dose metrics (i.e., carboxyhemoglobin concentration,
area under concentration-time curve for DCM in richly perfused tissues; time-integrated amount of DCM
conjugated with GSH). Interactions were simulated as dose addition, with internal dose metrics
representing dose and the sole interaction mechanism assumed to be competitive inhibition of cytochrome
P-450-mediated metabolism of DCM. The Tardif et al. (1997) model also has been incorporated into a
mixtures model of JP-8 vapor and its components (Campbell and Fisher 2007). The model included
simulations of the kinetics of m-xylene and ethylbenzene, with other aromatic components of JP-8 vapor
represented as a lumped component. Interactions between m-xylene and ethylbenzene were simulated as
competitive inhibition of metabolism. The Tardif et al. (1997) mixtures model was also utilized to
evaluate occupational exposure limits for ethylbenzene, toluene, m-xylene for hypothetical exposures to
ternary mixtures of the chemicals (Dennison et al. 2005). These analyses demonstrate the potential utility
of the ethylbenzene model for predicting metabolic interactions with other chemicals that share a common
mechanism of metabolic elimination, and the potential impacts of such interactions on risk (e.g., hazard
index, cancer risk, occupation exposure limits).
Target Tissues. The Tardif et al. (1997) ethylbenzene model was calibrated and evaluated to predict
blood kinetics of ethylbenzene that occur in association with inhalation exposures. Essential to this
prediction is the accurate prediction of rates of metabolism of ethylbenzene, which, in the model, is
attributed solely to the liver. The model has potential utility for predicting, in addition to blood kinetics
of ethylbenzene, kinetics of concentrations of ethylbenzene in important toxicity target tissues, including
liver and richly perfused tissues (which includes kidney and central nervous system), and rates of
metabolism of ethylbenzene and total amount of metabolites formed in liver. The model does not
simulate, specifically, the kidney or central nervous system.
111 ETHYLBENZENE
3. HEALTH EFFECTS
Species Extrapolation. The Tardif et al. (1997) model was initially developed and calibrated to
simulate kinetics of inhaled ethylbenzene in the rat, and was allometrically scaled to the human. The
scaled human model was evaluated for predicting ethylbenzene blood concentrations observed in human
subjects who were exposed to ethylbenzene (33 ppm) for 7 hours/day on 4 different days (Tardif et al.
1991). Predicted blood concentrations of ethylbenzene in subjects exposed to ethylbenzene were within
1–2 SD of observations. Studies of the robustness of the model for predicting ethylbenzene kinetics in
other species (after allometric scaling to those species) were not located.
Interroute Extrapolation. The Tardiff et al. (1997) model was developed to simulate kinetics of
inhaled ethylbenzene in rats and humans. An extension of the model that includes a gastrointestinal
absorption rate constant enables simulation of gavage dosing in rats administered ethylbenzene in corn oil
(Faber et al. 2006). The gastrointestinal model has not been evaluated for applications to human oral
exposures. Studies that evaluated the model for predicting ethylbenzene kinetics following dermal
exposure were not located.
The Nong et al. (2007) Model
Description of the Model. Nong et al. (2007) developed a PBPK model for simulating the kinetics
of inhalation exposures of ethylbenzene in mice. The structure of the model is essentially identical to the
Tardif et al. (1997) model (Figure 3-4, with tissue compartments limited to lungs, liver, fat, richly
perfused tissues, and poorly perfused tissues), with the addition of metabolism of ethylbenzene in richly
and poorly perfused tissues (Km, Vmax). Parameter values are presented in Table 3-7. Values for Vmax in
naive (not induced) liver were derived my allometric scaling (BW0.75) of values estimated for the rat and
values for Km in liver were assumed to be the same as in the rat (Haddad et al. 2000). The value for Vmax
was subsequently optimized against data on venous blood kinetics in mice exposed to ethylbenzene
concentrations ranging from 75 to 1,000 ppm (Nong et al. 2007). The model overpredicted observations
in animals exposed to 750 ppm; adequate fit was achieved by upward adjustment of the Vmax by a factor
of 3. This adjustment achieved adequate fit to blood kinetics observed in animal repeatedly exposed
(12 days) to 75 or 750 ppm and was adopted to account for induction of cytochrome P450 in animals
exposed repeatedly to ethylbenzene at concentrations >75 ppm (Nong et al. 2007). The value for Vmax in
lung was derived from estimates made in in vitro preparation of mouse lung microsomes (Nong et al.
2007) and was scaled to lung weight. Values for Km in lung and Vmax and Km in richly perfused tissues
were derived by optimization against data on venous blood kinetics in mice exposed to ethylbenzene
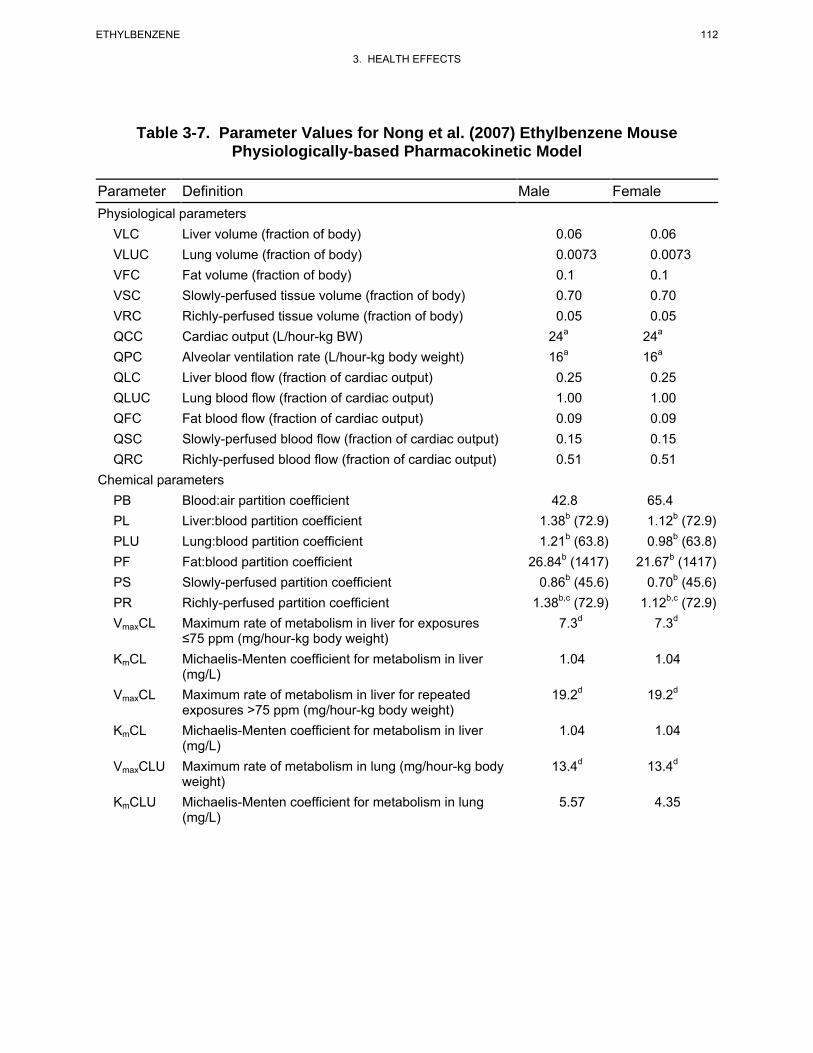
112 ETHYLBENZENE
3. HEALTH EFFECTS
Table 3-7. Parameter Values for Nong et al. (2007) Ethylbenzene Mouse Physiologically-based Pharmacokinetic Model
Parameter Definition Male Female Physiological parameters
VLC Liver volume (fraction of body) 0.06 0.06 VLUC Lung volume (fraction of body) 0.0073 0.0073 VFC Fat volume (fraction of body) 0.1 0.1 VSC Slowly-perfused tissue volume (fraction of body) 0.70 0.70 VRC Richly-perfused tissue volume (fraction of body) 0.05 0.05 QCC Cardiac output (L/hour-kg BW) 24a 24a
QPC Alveolar ventilation rate (L/hour-kg body weight) 16a 16a
QLC Liver blood flow (fraction of cardiac output) 0.25 0.25 QLUC Lung blood flow (fraction of cardiac output) 1.00 1.00 QFC Fat blood flow (fraction of cardiac output) 0.09 0.09 QSC Slowly-perfused blood flow (fraction of cardiac output) 0.15 0.15 QRC Richly-perfused blood flow (fraction of cardiac output) 0.51 0.51
Chemical parameters PB Blood:air partition coefficient 42.8 65.4 PL Liver:blood partition coefficient 1.38b (72.9) 1.12b (72.9) PLU Lung:blood partition coefficient 1.21b (63.8) 0.98b (63.8) PF Fat:blood partition coefficient 26.84b (1417) 21.67b (1417) PS Slowly-perfused partition coefficient 0.86b (45.6) 0.70b (45.6) PR Richly-perfused partition coefficient 1.38b,c (72.9) 1.12b,c (72.9) VmaxCL Maximum rate of metabolism in liver for exposures 7.3d 7.3d
≤75 ppm (mg/hour-kg body weight) KmCL Michaelis-Menten coefficient for metabolism in liver 1.04 1.04
(mg/L) VmaxCL Maximum rate of metabolism in liver for repeated 19.2d 19.2d
exposures >75 ppm (mg/hour-kg body weight) KmCL Michaelis-Menten coefficient for metabolism in liver 1.04 1.04
(mg/L) VmaxCLU Maximum rate of metabolism in lung (mg/hour-kg body 13.4d 13.4d
weight) KmCLU Michaelis-Menten coefficient for metabolism in lung 5.57 4.35
(mg/L)
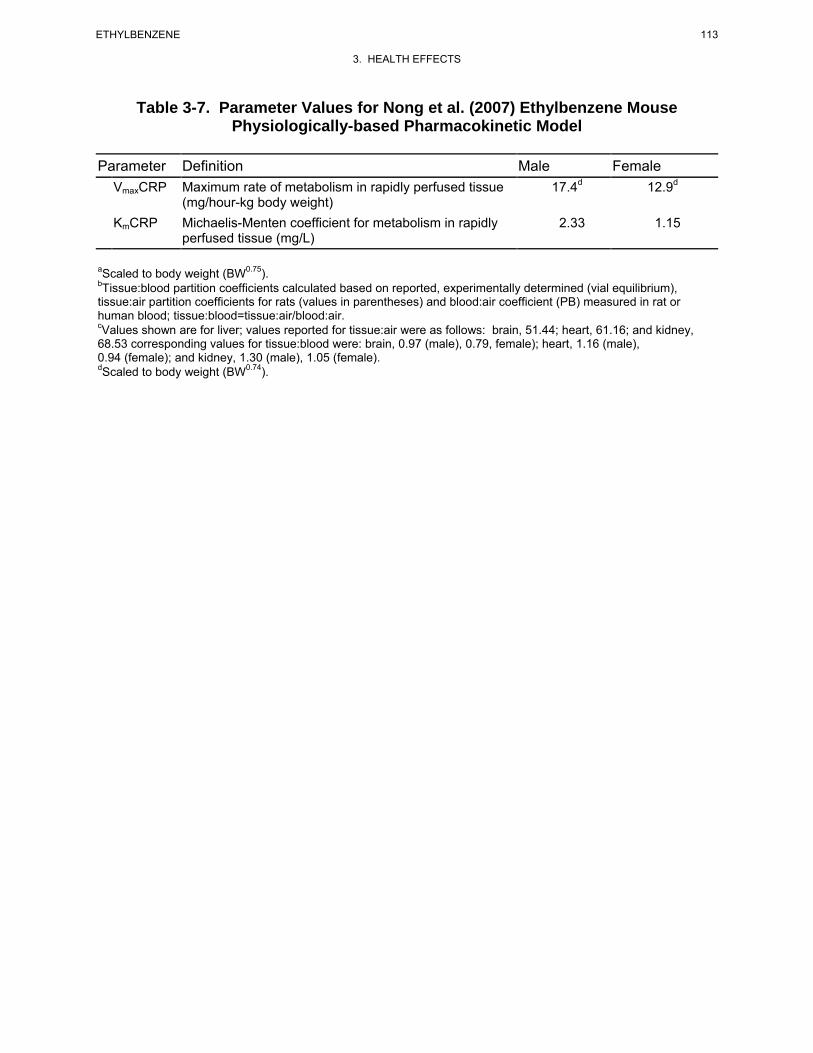
113 ETHYLBENZENE
3. HEALTH EFFECTS
Table 3-7. Parameter Values for Nong et al. (2007) Ethylbenzene Mouse Physiologically-based Pharmacokinetic Model
Parameter Definition Male Female VmaxCRP Maximum rate of metabolism in rapidly perfused tissue 17.4d 12.9d
(mg/hour-kg body weight) KmCRP Michaelis-Menten coefficient for metabolism in rapidly 2.33 1.15
perfused tissue (mg/L)
aScaled to body weight (BW0.75).bTissue:blood partition coefficients calculated based on reported, experimentally determined (vial equilibrium), tissue:air partition coefficients for rats (values in parentheses) and blood:air coefficient (PB) measured in rat or human blood; tissue:blood=tissue:air/blood:air. cValues shown are for liver; values reported for tissue:air were as follows: brain, 51.44; heart, 61.16; and kidney, 68.53 corresponding values for tissue:blood were: brain, 0.97 (male), 0.79, female); heart, 1.16 (male), 0.94 (female); and kidney, 1.30 (male), 1.05 (female).dScaled to body weight (BW0.74).
114 ETHYLBENZENE
3. HEALTH EFFECTS
concentrations ranging from 75 to 1,000 ppm (Nong et al. 2007). Tissue:air partition coefficients for
ethylbenzene were derived from vial equilibrium studies of isolated tissues, and included blood:air
coefficients determined in male (52.8±3 standard error [SE]) and female (65.4±5 SE) mice. Tissue:blood
partition coefficients for male and female mice were derived from measured gender-specific blood:air
partition coefficients and tissue:air coefficitent (i.e., tissue:blood=tissue:air/blood:air). Physiological
parameters, cardiac output (QC) and alveolar ventilation rate (QP), and metabolism Vmax were
allometrically scaled as a function of body weight.
Validation of the Model. Metabolism parameters were optimized against observed blood kinetics of
ethylbenzene in mice exposed for 4 hours to 75 or 1,000 ppm ethylbenzene. The optimized model was
evaluated against observations of blood, liver, lung, and fat concentrations of ethylbenzene in male or
female mice repeatedly exposed to 750 ppm ethylbenzene (12 days, 6 hours/day) and predictions were
within 1–2 SDs of the observations.
Risk Assessment. The Nong et al. (2007) model predicts blood kinetics of ethylbenzene and kinetics
of metabolism of ethylbenzene that occur in association with inhalation exposures. These predictions are
potentially useful for predicting inhalation-derived internal doses of ethylbenzene in mice and/or humans
(e.g., blood concentrations, liver concentrations of parent compound, or amounts of total metabolites
formed in the liver), and for making extrapolations of these internal dose metrics across species.
However, a human model that includes simulation of metabolism of ethylbenzene in lung and rapidly
perfused tissue has not been reported. The applicability any of the above dose metrics to risk assessment
will depend on the mechanism for the specific toxicity end point being assessed, and contribution of the
parent compound and/or metabolism metabolites to toxicity (see Section 3.5.2, Mechanisms of Toxicity).
Target Tissues. The Nong et al. (2007) ethylbenzene model was calibrated and evaluated to predict
blood, liver, lung, and fat kinetics of ethylbenzene that occur in association with inhalation exposures to
mice. The model has potential utility for predicting, in addition to blood kinetics of ethylbenzene,
kinetics of concentrations of ethylbenzene in important toxicity target tissues, including liver and richly
perfused tissues (which includes kidney and central nervous system), and rates of metabolism of
ethylbenzene and total amount of metabolites formed in liver, lung, and other rapidly perfused tissues
(e.g., brain, heart, kidney). The model does not simulate, specifically, the kidney or central nervous
system.
115 ETHYLBENZENE
3. HEALTH EFFECTS
Species Extrapolation. The Nong et al. (2007) model was initially developed and calibrated to
simulate ethylbenzene kinetics in the mouse. The model could be allometrically scaled to other species
(e.g., humans). Studies of the robustness of the model for predicting ethylbenzene kinetics in other
species (after allometric scaling to those species) were not located.
Interroute Extrapolation. The Nong et al. (2007) model was developed to simulate kinetics of
inhaled ethylbenzene. Studies that evaluated the model for predicting ethylbenzene kinetics following
oral or dermal exposure were not located.
The Dennison et al. (2003, 2004) Model
Description of the Model. Dennison et al. (2003, 2004) developed a PBPK model for simulating the
blood and elimination kinetics of components of gasoline, including benzene, ethylbenzene, n-hexane,
toluene, o-xylene, and other volatile components (represented as a single lumped composition) in rats.
The structure of the model is essentially identical the generic model depicted in Figure 3-4, with tissue
compartments limited to lungs, liver, fat, richly perfused tissues (RPT), and slowly perfused tissues
(SPT). All metabolism was attributed to the liver and represented as functions of the concentration of
parent compound in liver venous blood, affinity constant (Km), and maximum reaction velocity (Vmax).
Transfers of parent compound between blood and tissues were assumed to be flow-limited, with clearance
represented by tissue blood flow (L/hour). Parameters for the ethylbenzene portion of the model are
presented in Table 3-8. Partition coefficients for ethylbenzene were derived from vial equilibrium studies
of isolated rat tissues (Tardif et al. 1997). Metabolism parameter values for ethylbenzene were derived by
fitting the model to observations of blood ethylbenzene kinetics measured in rats during closed-chamber
exposure to ethylbenzene (approximately 2,000 ppm starting chamber concentration; Dennison et al.
2003). Physiological parameters, cardiac output (QC), and alveolar ventilation rate (QP), and metabolism
Vmax were allometrically scaled to body weight (BW, scaling factor=BW0.74)
Validation of the Model. Optimization of the metabolism parameters for rats against observed
closed chamber air concentration kinetics achieved predicted elimination kinetics of ethylbenzene that
were similar to observations (Dennison et al. 2003). Validation efforts reported in Dennison et al. (2004)
were directed at exploring how well the mixture model predicted observed closed chamber air kinetics of
ethylbenzene, toluene, or xylene during exposures of rats to gasoline (1, 10, 100, 1,000 ppm).
Interactions were simulated as competitive inhibition of metabolism, with the values of the inhibition
constants derived by fitting to chamber air concentration kinetics during exposures to binary mixtures.
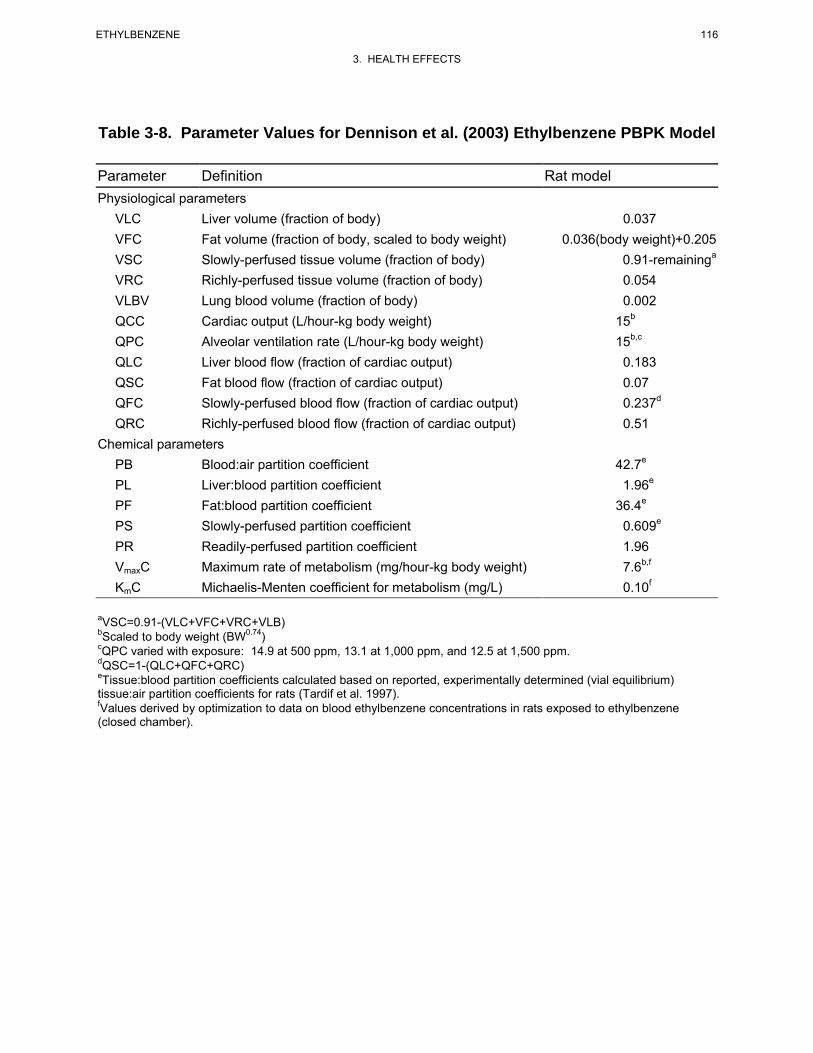
116 ETHYLBENZENE
3. HEALTH EFFECTS
Table 3-8. Parameter Values for Dennison et al. (2003) Ethylbenzene PBPK Model
Parameter Definition Rat model Physiological parameters
VLC Liver volume (fraction of body) 0.037 VFC Fat volume (fraction of body, scaled to body weight) 0.036(body weight)+0.205 VSC Slowly-perfused tissue volume (fraction of body) 0.91-remaininga
VRC Richly-perfused tissue volume (fraction of body) 0.054 VLBV Lung blood volume (fraction of body) 0.002 QCC Cardiac output (L/hour-kg body weight) 15b
QPC Alveolar ventilation rate (L/hour-kg body weight) 15b,c
QLC Liver blood flow (fraction of cardiac output) 0.183 QSC Fat blood flow (fraction of cardiac output) 0.07 QFC Slowly-perfused blood flow (fraction of cardiac output) 0.237d
QRC Richly-perfused blood flow (fraction of cardiac output) 0.51 Chemical parameters
PB Blood:air partition coefficient 42.7e
PL Liver:blood partition coefficient 1.96e
PF Fat:blood partition coefficient 36.4e
PS Slowly-perfused partition coefficient 0.609e
PR Readily-perfused partition coefficient 1.96 VmaxC Maximum rate of metabolism (mg/hour-kg body weight) 7.6b,f
KmC Michaelis-Menten coefficient for metabolism (mg/L) 0.10f
aVSC=0.91-(VLC+VFC+VRC+VLB) bScaled to body weight (BW0.74) cQPC varied with exposure: 14.9 at 500 ppm, 13.1 at 1,000 ppm, and 12.5 at 1,500 ppm.dQSC=1-(QLC+QFC+QRC) eTissue:blood partition coefficients calculated based on reported, experimentally determined (vial equilibrium) tissue:air partition coefficients for rats (Tardif et al. 1997).fValues derived by optimization to data on blood ethylbenzene concentrations in rats exposed to ethylbenzene (closed chamber).
117 ETHYLBENZENE
3. HEALTH EFFECTS
Although the mixture model achieved predictions similar to observations, this outcome would have been
highly influenced by the parameter values selected for each of the individual chemicals (or lumped
chemicals), including fitted interaction constants and, therefore, does not directly address the validity of
the ethylbenzene model.
Risk Assessment. The Dennison et al. (2003) ethylbenzene model predicts blood kinetics of
ethylbenzene and kinetics of metabolism of inhaled ethylbenzene. These predictions are potentially
useful for predicting internal doses of inhaled ethylbenzene in rats (e.g., blood concentrations, liver
concentrations of parent compound, or amounts of total metabolites formed in the liver). The
applicability any of the above dose metrics to risk assessment will depend on the mechanism for the
specific toxicity endpoint being assessed, and contribution of the parent compound and/or metabolism to
toxicity. Current knowledge of the mechanism of toxicity of ethylbenzene does not include an
understanding of the relative contributions of parent compound or metabolites as proximate toxic agents
in the major end points of ethylbenzene toxicity (i.e., kidney, liver, otic, cancer).
The Dennison et al. (2003) ethylbenzene model has been incorporated into a mixtures model for gasoline
(benzene, ethylbenzene, n-hexane, toluene, o-xylene, and other volatile components). In the mixtures
model, chemical interactions were attributed to competitive inhibition of metabolism and inhibition
constants were derived by fitting model predictions of closed chamber air concentration kinetics during
exposures to binary mixtures. The model was used to predict the effect of increasing exposure
concentration to gasoline on blood concentrations and amounts of individual mixture components
metabolized (Dennison et al. 2004).
Target Tissues. The Dennison et al. (2003) ethylbenzene model was calibrated and evaluated to
predict elimination (i.e., metabolism) kinetics of ethylbenzene that occur in association with inhalation
exposures. Essential to this prediction is the accurate prediction of rates of metabolism of ethylbenzene,
which, in the model, is attributed solely to the liver. The model has potential utility for predicting, in
addition to elimination kinetics of ethylbenzene, kinetics of concentrations of ethylbenzene in important
toxicity target tissues, including liver, richly perfused tissues (which includes kidney and central nervous
system), and rates of metabolism of ethylbenzene and total amount of metabolites formed in liver. The
model does not simulate, specifically, the kidney or central nervous system.
Species Extrapolation. The Dennison et al. (2003) ethylbenzene model was developed and
calibrated to simulate ethylbenzene kinetics in the rat; however, it could be allometrically scaled to the
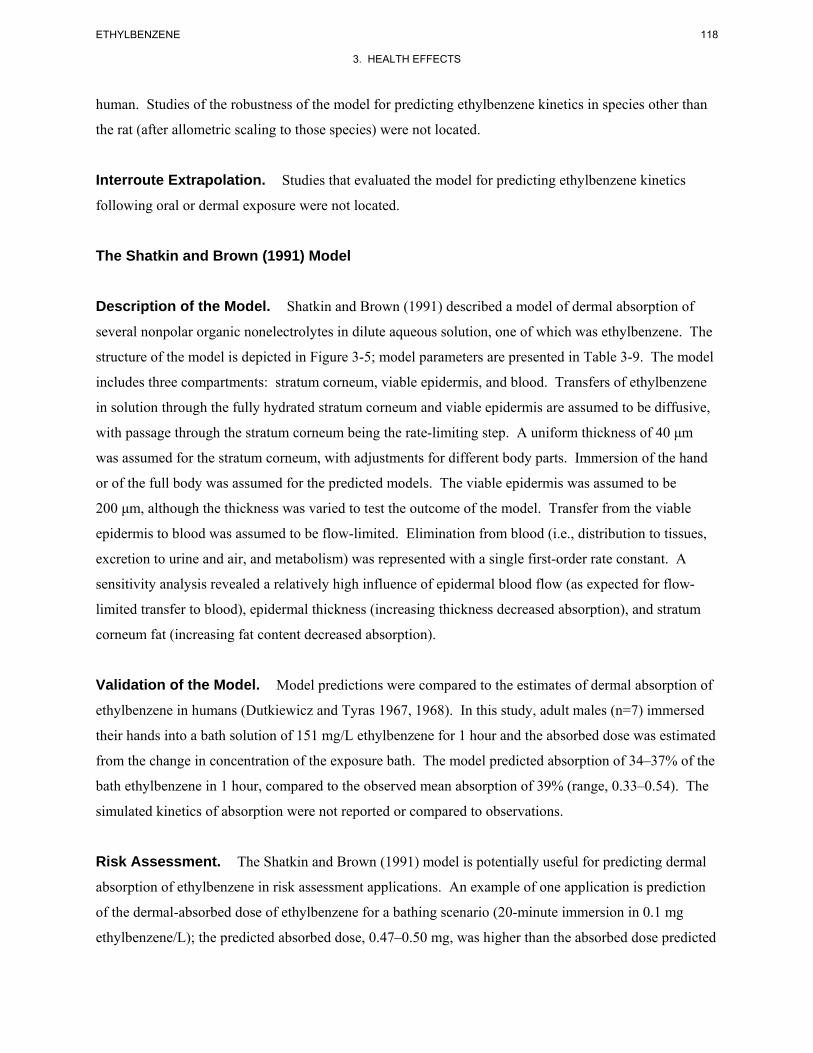
118 ETHYLBENZENE
3. HEALTH EFFECTS
human. Studies of the robustness of the model for predicting ethylbenzene kinetics in species other than
the rat (after allometric scaling to those species) were not located.
Interroute Extrapolation. Studies that evaluated the model for predicting ethylbenzene kinetics
following oral or dermal exposure were not located.
The Shatkin and Brown (1991) Model
Description of the Model. Shatkin and Brown (1991) described a model of dermal absorption of
several nonpolar organic nonelectrolytes in dilute aqueous solution, one of which was ethylbenzene. The
structure of the model is depicted in Figure 3-5; model parameters are presented in Table 3-9. The model
includes three compartments: stratum corneum, viable epidermis, and blood. Transfers of ethylbenzene
in solution through the fully hydrated stratum corneum and viable epidermis are assumed to be diffusive,
with passage through the stratum corneum being the rate-limiting step. A uniform thickness of 40 μm
was assumed for the stratum corneum, with adjustments for different body parts. Immersion of the hand
or of the full body was assumed for the predicted models. The viable epidermis was assumed to be
200 μm, although the thickness was varied to test the outcome of the model. Transfer from the viable
epidermis to blood was assumed to be flow-limited. Elimination from blood (i.e., distribution to tissues,
excretion to urine and air, and metabolism) was represented with a single first-order rate constant. A
sensitivity analysis revealed a relatively high influence of epidermal blood flow (as expected for flow-
limited transfer to blood), epidermal thickness (increasing thickness decreased absorption), and stratum
corneum fat (increasing fat content decreased absorption).
Validation of the Model. Model predictions were compared to the estimates of dermal absorption of
ethylbenzene in humans (Dutkiewicz and Tyras 1967, 1968). In this study, adult males (n=7) immersed
their hands into a bath solution of 151 mg/L ethylbenzene for 1 hour and the absorbed dose was estimated
from the change in concentration of the exposure bath. The model predicted absorption of 34–37% of the
bath ethylbenzene in 1 hour, compared to the observed mean absorption of 39% (range, 0.33–0.54). The
simulated kinetics of absorption were not reported or compared to observations.
Risk Assessment. The Shatkin and Brown (1991) model is potentially useful for predicting dermal
absorption of ethylbenzene in risk assessment applications. An example of one application is prediction
of the dermal-absorbed dose of ethylbenzene for a bathing scenario (20-minute immersion in 0.1 mg
ethylbenzene/L); the predicted absorbed dose, 0.47–0.50 mg, was higher than the absorbed dose predicted
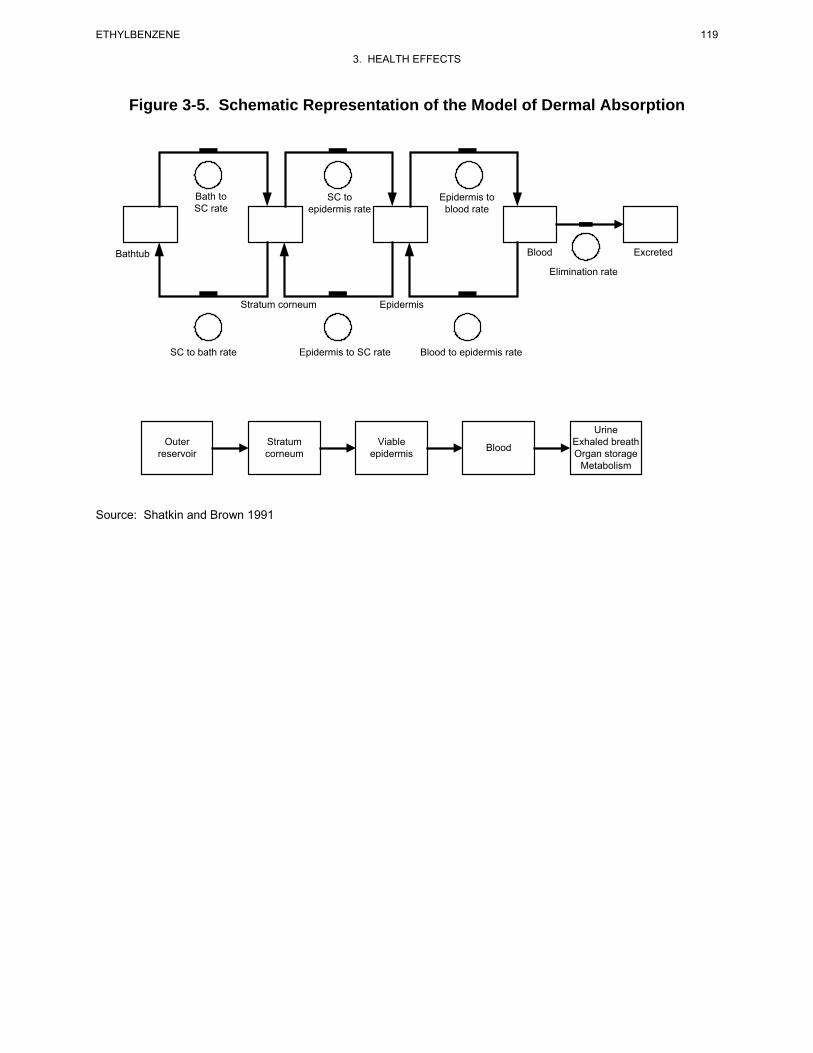
Figure 3-5. Schematic Representation of the Model of Dermal Absorption
Bath to SC to Epidermis to SC rate epidermis rate blood rate
Bathtub Blood Excreted
Elimination rate
Stratum corneum Epidermis
SC to bath rate Epidermis to SC rate Blood to epidermis rate
Urine Outer Stratum Viable Exhaled breath Blood reservoir corneum epidermis Organ storage
Metabolism
Source: Shatkin and Brown 1991
119 ETHYLBENZENE
3. HEALTH EFFECTS
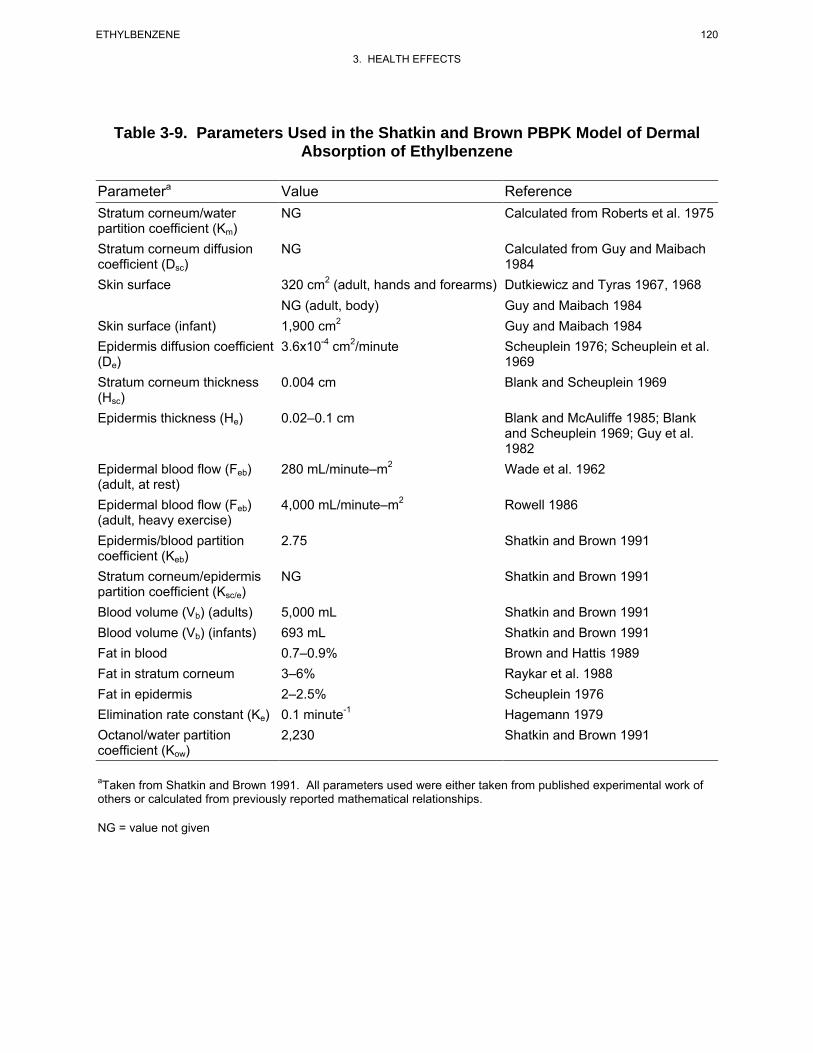
120 ETHYLBENZENE
3. HEALTH EFFECTS
Table 3-9. Parameters Used in the Shatkin and Brown PBPK Model of Dermal Absorption of Ethylbenzene
Parametera Value Reference Stratum corneum/water NG Calculated from Roberts et al. 1975 partition coefficient (Km) Stratum corneum diffusion NG Calculated from Guy and Maibach coefficient (Dsc) 1984 Skin surface 320 cm2 (adult, hands and forearms) Dutkiewicz and Tyras 1967, 1968
NG (adult, body) Guy and Maibach 1984 Skin surface (infant) 1,900 cm2 Guy and Maibach 1984 Epidermis diffusion coefficient 3.6x10⁻⁴ cm2/minute Scheuplein 1976; Scheuplein et al. (De) 1969 Stratum corneum thickness 0.004 cm Blank and Scheuplein 1969 (Hsc) Epidermis thickness (He) 0.02–0.1 cm Blank and McAuliffe 1985; Blank
and Scheuplein 1969; Guy et al. 1982
Epidermal blood flow (Feb) 280 mL/minute–m2 Wade et al. 1962 (adult, at rest) Epidermal blood flow (Feb) 4,000 mL/minute–m2 Rowell 1986 (adult, heavy exercise) Epidermis/blood partition 2.75 Shatkin and Brown 1991 coefficient (Keb) Stratum corneum/epidermis NG Shatkin and Brown 1991 partition coefficient (Ksc/e) Blood volume (Vb) (adults) 5,000 mL Shatkin and Brown 1991 Blood volume (Vb) (infants) 693 mL Shatkin and Brown 1991 Fat in blood 0.7–0.9% Brown and Hattis 1989 Fat in stratum corneum 3–6% Raykar et al. 1988 Fat in epidermis 2–2.5% Scheuplein 1976 Elimination rate constant (Ke) 0.1 minute -1 Hagemann 1979 Octanol/water partition 2,230 Shatkin and Brown 1991 coefficient (Kow)
aTaken from Shatkin and Brown 1991. All parameters used were either taken from published experimental work of others or calculated from previously reported mathematical relationships.
NG = value not given
121 ETHYLBENZENE
3. HEALTH EFFECTS
for ingestion of 2 L of water at the same concentration, or from inhalation during a 20-minute shower
(Shatkin and Brown 1991). The model may be useful in predicting absorbed doses of ethylbenzene
resulting from bathing, swimming, and other activities (Shatkin and Brown 1991).
Target Tissues. The Shatkin and Brown (1991) model was developed to simulate dermal absorption
of ethylbenzene (and other volatile organics); it does not predict concentrations of ethylbenzene in
specific tissues, other than skin. However, if the model were integrated into PBPK models of the
distribution and elimination of absorbed ethylbenzene (e.g., Dennison et al. 2003; Tardif et al. 1997), the
combined models might be useful for predicting internal doses of ethylbenzene associated with dermal
exposures.
Species Extrapolation. The Shatkin and Brown (1991) model was developed to simulate dermal
absorption of ethylbenzene in humans and has been evaluated with observations in humans. The major
physiological parameters in the model are scalable or could be determined in different species (e.g.,
dermal thickness, dermal fat content, dermal blood flow), and the chemical parameters could be evaluated
in other species (e.g., partition coefficients) or predicted from physical-chemical properties (e.g., diffusion
coefficients). These features improve the feasibility of scaling the model to other species.
Interroute Extrapolation. The Shatkin and Brown (1991) model, in combination with existing
PBPK ethylbenzene inhalation models (e.g., Dennison et al. 2003; Tardif et al. 1997), may have utility for
estimating dermal exposures (i.e., concentration, time) that would be expected to yield equivalent
absorbed doses from inhalation exposures.
3.5 MECHANISMS OF ACTION 3.5.1 Pharmacokinetic Mechanisms
Studies of the in vitro metabolism of ethylbenzene in microsomes prepared from human liver have
identified high and low affinity catalytic pathways for the initial hydroxylation to 1-phenylethanol (Sams
et al. 2004). In human liver microsomes, the high affinity pathway exhibited a lower Km and lower Vmax
(Km=8 M, Vmax=689 pmol/minute/mg protein) than the low affinity pathway (Km=391 M,
Vmax=3,039 pmol/min/mg protein) and was inhibited by diethyldithiocarbamate. Studies conducted in
microsomes prepared from insect cells expressing recombinant human isoforms of cytochrome P-450 also
revealed a relatively high affinity, low Vmax catalysis by CYP2E1and lower affinity, higher Vmax catalysis
122 ETHYLBENZENE
3. HEALTH EFFECTS
by CYP1A2 and CYP2B6, suggesting that the latter two isoforms may contribute to the low affinity
pathway observed in human liver microsome (Sams et al. 2004).
Blood kinetics of inhaled ethylbenzene have been successfully modeled with assumptions of flow-limited
transfer of ethylbenzene to tissues and capacity-limited elimination by metabolism (Dennison et al. 2003,
2004; Tardif et al. 1997, see Section 3.4.5). These models have been successfully scaled from the rat to
humans by applying species physiological parameter values (e.g., tissue volumes) and partition
coefficients (i.e., blood:air partition coefficient) and allometrically scaling flows (i.e., cardiac output,
alveolar ventilation rate) and metabolism parameters (i.e., Km, Vmax) to body weight (Tardif et al. 1997).
These studies suggest a general similarity of the distribution and elimination kinetics in rats and humans.
The robustness of these models for predicting ethylbenzene kinetics in other species has not been
reported; however, the blood elimination kinetics of inhaled ethylbenzene in the mouse show similarities
to that in the rat (e.g., nonlinearity of clearance with exposure concentration, similar elimination half-
times (Charest-Tardif et al. 2006; Tardif et al. 1997).
3.5.2 Mechanisms of Toxicity
Mechanisms of ototoxicity, toxicity to the liver and kidney, and carcinogenicity have not been identified.
However, studies on ethylbenzene and ethylbenzene metabolites provide some insights regarding the
potential roles of parent compound and metabolites in ethylbenzene-induced effects. As reviewed in
Section 3.2.1.4 (Inhalation Exposure, Neurological Effects), inhalation exposure of animals to
ethylbenzene produces hearing loss through irreversible loss of OHC in the organ of corti (Cappaert et al.
1999, 2000, 2001, 2002; Gagnaire and Langali 2005; Gagnaire et al. 2007). Cappaert et al. (2002)
attributed the lack of ototoxicity (based on auditory thresholds and histological assessment of cochlea) in
guinea pigs exposed to inhaled ethylbenzene to lower circulating levels of ethylbenzene, relative to levels
producing ototoxicity in rats. Results of a 3-month oral study on phenylglyoxylic acid, a major
ethylbenzene metabolite, show that this metabolite did not produce ototoxicity, based on
electrophysiological tests, in rats exposed to drinking water at approximately 293 mg/kg/day (Ladefoged
et al. 1998). Although this study provides supporting evidence that phenylglyoxylic acid is not ototoxic,
animals were not evaluated for OHC loss in this study. Furthermore, Pryor et al. (1991) proposed that
hearing loss caused by toluene, which is structurally similar to ethylbenzene, was caused by parent
compound, rather than metabolites; pretreatment of rats with phenobarbital, which induces cytochrome
P450 metabolism of toluene, prevented ototoxicity. Taken together, results of these studies suggest that
ethylbenzene, rather than metabolites, may be responsible for ototoxicity.
123 ETHYLBENZENE
3. HEALTH EFFECTS
Regarding possible mechanisms of carcinogenicity, results of the NTP (1999) bioassay on ethylbenzene
provided clear evidence of carcinogenicity in male rats based on renal tubule neoplasms, some evidence
in female rats based on renal tubule adenomas, some evidence in male mice based on alveolar/bronchiolar
neoplasms, and some evidence in female mice based on hepatocellular neoplasms; in addition, testicular
neoplasms were increased in male rats. In contrast, results of an NTP (1990) 2-year bioassay on
1-phenylethanol, a primary oxidative metabolite of ethylbenzene, provided some evidence of
carcinogenicity in male rats based on increased incidences of renal tubular cell adenomas and adenomas
or adenocarcinoma (combined), but no evidence of carcinogenicity in female rats or male or female mice.
These results suggest that carcinogenic activity of ethylbenzene may be, at least in part, attributed to the
parent compound and/or reactive oxidative metabolites in the 4-ethylphenol pathway, rather than the
1-phenylethanol pathway.
Ethylbenzene has been shown to exert adverse central nervous system effects on both humans (Yant et al.
1930) and animals (Cragg et al. 1989; Ethylbenzene Producers Association 1986a; Molnar et al. 1986;
Tegeris and Balster 1994; Yant et al. 1930). In vivo animal studies of ethylbenzene toxicity at the cellular
level indicate that changes in brain levels of dopamine and other biochemical alterations, and in evoked
electrical activity in the brain may be involved in ethylbenzene central nervous system toxicity
(Andersson et al. 1981; Frantik et al. 1994; Mutti et al. 1988; Romanelli et al. 1986).
The molecular mechanism(s) of ethylbenzene-induced ototoxicity has not been established. Results of a
recent in vitro study suggest that ototoxicity induced by low concentrations of ethylbenzene may be
mediated through nicotinic acetylcholine receptors (van Kleef et al. 2008). Using human heteromeric
α9α10 nicotinic acetylcholine receptors expressed in Xenopus oocytes, ethylbenzene inhibited
acetylchloline-mediated ion currents under conditions of low receptor occupancy. Based on in vitro
studies conducted with toluene, Cappaert et al. (2001) briefly speculated that increased intracellular
calcium levels might be responsible for the obliteration of outer hair cells exposed to solvents such as
ethylbenzene.
In vitro studies of the mechanism of toxicity have focused on the effect of ethylbenzene on cell
membranes, particularly that of the astrocyte (Engelke et al. 1993; Naskali et al. 1993, 1994; Sikkema et
al. 1995; Vaalavirta and Tähti 1995a, 1995b). In a review by Sikkema et al. (1995), changes in the
structure and integrity of the cell membrane after partitioning of ethylbenzene into the lipid bilayer may
be a mechanism of toxicity. Changes in the integrity of the cell membrane may subsequently affect the
124 ETHYLBENZENE
3. HEALTH EFFECTS
function of membrane, particularly as a barrier and in energy transduction, and in the formation of a
matrix for proteins and enzymes.
The work of Vaalavirta and Tähti (1995a, 1995b) and Naskali et al. (1993, 1994) has investigated the
effect of ethylbenzene on the membrane of the rat astrocyte, as an in vitro model for the membrane-
mediated effects of solvents on the central nervous system. Cultured astrocytes from the cerebella of
neonatal Sprague-Dawley rats were sensitive to the effects of ethylbenzene, as measured by the inhibition
of activity of Na+, K+-ATPase, and Mg++-ATPase (Vaalavirta and Tähti 1995a, 1995b). This effect was
found to be dose-dependent (Naskali et al. 1994). Inhibition of these membrane-bound enzymes that
regulate the ion channels of the membrane may disturb the ability of the cells to maintain homeostasis.
Experiments with rat synaptosome preparations, similar to those using microsomal preparations by
Engelke et al. (1993), showed that membrane fluidity was increased after exposure to ethylbenzene.
ATPase and acetylcholinesterase activity were also decreased, as seen in the astrocyte preparations.
3.5.3 Animal-to-Human Extrapolations
Species differences have been shown for ethylbenzene metabolism. In humans exposed via inhalation,
the major metabolites of ethylbenzene are mandelic acid (approximately 70% of the absorbed dose) and
phenylglyoxylic acid (approximately 25% of the absorbed dose), which are excreted in the urine
(Bardodej and Bardodejova 1970; Engstrom et al. 1984). Evidence indicates that the initial step in this
metabolic pathway is oxidation of the side chain of ethylbenzene to produce 1-phenylethanol. In rats
exposed by inhalation or orally to ethylbenzene, the major metabolites were identified as hippuric and
benzoic acids (approximately 38%), 1-phenylethanol (approximately 25%), and mandelic acid
(approximately 15–23%), with phenylglyoxylic acid making up only 10% of the metabolites (Climie et al.
1983; Engstrom et al. 1984, 1985). In rabbits, the most important metabolite is hippuric acid, which is
probably formed by oxidative decarboxylation of phenylglyoxylic acid (El Masri et al. 1958). Rabbits
have been shown to excrete higher levels of glucuonidated metabolites than do humans or rats (El Masry
et al. 1956; Smith et al. 1954a, 1954b). Thus, there are no animal models of ethylbenzene metabolism
that are completely consistent with human metabolism. However, of the experimental models
investigated, rats appear to be a more appropriate model than rabbits.
Models of the pharmacokinetic mechanisms and mechanisms of toxicity of ethylbenzene have focused on
cellular processes (see Sections 3.5.1 and 3.5.2, above). In these, humans and animals appear to be
similar. Although some species differences exist with respect to toxicity, adverse effects observed after
125 ETHYLBENZENE
3. HEALTH EFFECTS
ethylbenzene exposure in both humans and animals seem to be similar in scope (i.e., respiratory, hepatic,
renal, and neurological). Rats may be more sensitive than mice or rabbits (Cragg et al. 1989; NTP 1992).
Thus, the rat may be the most appropriate animal model for studying the mechanism of toxicity of
ethylbenzene as it relates to human health effects assessment.
3.6 TOXICITIES MEDIATED THROUGH THE NEUROENDOCRINE AXIS
Recently, attention has focused on the potential hazardous effects of certain chemicals on the endocrine
system because of the ability of these chemicals to mimic or block endogenous hormones. Chemicals
with this type of activity are most commonly referred to as endocrine disruptors. However, appropriate
terminology to describe such effects remains controversial. The terminology endocrine disruptors,
initially used by Thomas and Colborn (1992), was also used in 1996 when Congress mandated the EPA to
develop a screening program for “...certain substances [which] may have an effect produced by a
naturally occurring estrogen, or other such endocrine effect[s]...”. To meet this mandate, EPA convened a
panel called the Endocrine Disruptors Screening and Testing Advisory Committee (EDSTAC), and in
1998, the EDSTAC completed its deliberations and made recommendations to EPA concerning endocrine
disruptors. In 1999, the National Academy of Sciences released a report that referred to these same types
of chemicals as hormonally active agents. The terminology endocrine modulators has also been used to
convey the fact that effects caused by such chemicals may not necessarily be adverse. Many scientists
agree that chemicals with the ability to disrupt or modulate the endocrine system are a potential threat to
the health of humans, aquatic animals, and wildlife. However, others think that endocrine-active
chemicals do not pose a significant health risk, particularly in view of the fact that hormone mimics exist
in the natural environment. Examples of natural hormone mimics are the isoflavinoid phytoestrogens
(Adlercreutz 1995; Livingston 1978; Mayr et al. 1992). These chemicals are derived from plants and are
similar in structure and action to endogenous estrogen. Although the public health significance and
descriptive terminology of substances capable of affecting the endocrine system remains controversial,
scientists agree that these chemicals may affect the synthesis, secretion, transport, binding, action, or
elimination of natural hormones in the body responsible for maintaining homeostasis, reproduction,
development, and/or behavior (EPA 1997b). Stated differently, such compounds may cause toxicities that
are mediated through the neuroendocrine axis. As a result, these chemicals may play a role in altering,
for example, metabolic, sexual, immune, and neurobehavioral function. Such chemicals are also thought
to be involved in inducing breast, testicular, and prostate cancers, as well as endometriosis (Berger 1994;
Giwercman et al. 1993; Hoel et al. 1992).
126 ETHYLBENZENE
3. HEALTH EFFECTS
No studies were located regarding endocrine disruption in humans or animals after exposure to
ethylbenzene. Nishihara et al. (2000) concluded that ethylbenzene was not estrogenic as established in an
in vitro yeast two-hybrid assay. No additional in vitro studies were located regarding endocrine
disruption of ethylbenzene.
3.7 CHILDREN’S SUSCEPTIBILITY
This section discusses potential health effects from exposures during the period from conception to
maturity at 18 years of age in humans, when all biological systems will have fully developed. Potential
effects on offspring resulting from exposures of parental germ cells are considered, as well as any indirect
effects on the fetus and neonate resulting from maternal exposure during gestation and lactation.
Relevant animal and in vitro models are also discussed.
Children are not small adults. They differ from adults in their exposures and may differ in their
susceptibility to hazardous chemicals. Children’s unique physiology and behavior can influence the
extent of their exposure. Exposures of children are discussed in Section 6.6, Exposures of Children.
Children sometimes differ from adults in their susceptibility to hazardous chemicals, but whether there is
a difference depends on the chemical (Guzelian et al. 1992; NRC 1993). Children may be more or less
susceptible than adults to health effects, and the relationship may change with developmental age
(Guzelian et al. 1992; NRC 1993). Vulnerability often depends on developmental stage. There are
critical periods of structural and functional development during both prenatal and postnatal life, and a
particular structure or function will be most sensitive to disruption during its critical period(s). Damage
may not be evident until a later stage of development. There are often differences in pharmacokinetics
and metabolism between children and adults. For example, absorption may be different in neonates
because of the immaturity of their gastrointestinal tract and their larger skin surface area in proportion to
body weight (Morselli et al. 1980; NRC 1993); the gastrointestinal absorption of lead is greatest in infants
and young children (Ziegler et al. 1978). Distribution of xenobiotics may be different; for example,
infants have a larger proportion of their bodies as extracellular water, and their brains and livers are
proportionately larger (Altman and Dittmer 1974; Fomon 1966; Fomon et al. 1982; Owen and Brozek
1966; Widdowson and Dickerson 1964). The infant also has an immature blood-brain barrier (Adinolfi
1985; Johanson 1980) and probably an immature blood-testis barrier (Setchell and Waites 1975). Many
xenobiotic metabolizing enzymes have distinctive developmental patterns. At various stages of growth
and development, levels of particular enzymes may be higher or lower than those of adults, and
127 ETHYLBENZENE
3. HEALTH EFFECTS
sometimes unique enzymes may exist at particular developmental stages (Komori et al. 1990; Leeder and
Kearns 1997; NRC 1993; Vieira et al. 1996). Whether differences in xenobiotic metabolism make the
child more or less susceptible also depends on whether the relevant enzymes are involved in activation of
the parent compound to its toxic form or in detoxification. There may also be differences in excretion,
particularly in newborns who all have a low glomerular filtration rate and have not developed efficient
tubular secretion and resorption capacities (Altman and Dittmer 1974; NRC 1993; West et al. 1948).
Children and adults may differ in their capacity to repair damage from chemical insults. Children also
have a longer remaining lifetime in which to express damage from chemicals; this potential is particularly
relevant to cancer.
Certain characteristics of the developing human may increase exposure or susceptibility, whereas others
may decrease susceptibility to the same chemical. For example, although infants breathe more air per
kilogram of body weight than adults breathe, this difference might be somewhat counterbalanced by their
alveoli being less developed, which results in a disproportionately smaller surface area for alveolar
absorption (NRC 1993).
There are no data describing the effect of exposure to ethylbenzene in children. Respiratory and eye
irritation, and dizziness are the most prevalent signs of exposure to high levels of ethylbenzene (Yant et
al. 1930), and it is expected that children would also exhibit these effects, as well as other effects
observed in adults. Minor birth defects have occurred in newborn rats, but not rabbits, whose mothers
were exposed by breathing air contaminated with ethylbenzene (NIOSH 1981; Ungváry and Tátrai 1985).
These defects consisted of urinary tract anomalies (not specified) and supernumerary ribs.
Supernumerary ribs were observed in the presence of minimal maternal changes. Although
developmental effects were reported in the offspring of animals exposed to <500 ppm ethylbenzene
(Ungváry and Tátrai 1985) several longer duration studies have shown developmental effects at
biologically or statistically significant levels only in the offspring of rats exposed to >500 ppm
ethylbenzene (Faber et al. 2006, 2007; Saillenfait et al. 2003, 2006, 2007). Furthermore, the report by
Ungváry and Tátrai (1985) lacks pertinent experimental details, including specific data on the urinary
tract anomalies, dictating caution in the interpretation of study findings. Section 3.2.1.6, Developmental
Effects, contains a more detailed discussion of these results. It is not known whether these developmental
effects observed in animals would be observed in people. Ethylbenzene has been detected in human
breast milk at unspecified concentrations (Pellizzari et al. 1982), but no pharmacokinetic experiments
have been done to confirm that it is actually transferred to breast milk in mammals. No specific
information was found concerning ethylbenzene concentrations in placenta, cord blood, or amniotic fluid.
128 ETHYLBENZENE
3. HEALTH EFFECTS
Since there is no information about health effects in children, it is unknown whether they differ from
adults in their susceptibility to health effects from ethylbenzene. However, in general, the principle that
early-in-life exposures may increases susceptibility to carcinogens may apply to ethylbenzene (EPA
2005).
There is no specific information about the metabolism of ethylbenzene in children or immature adults.
However, since two of the enzyme families responsible for the conjugation and elimination of
ethylbenzene metabolites are developmentally regulated, it is possible that the activity of these enzymes
would differ in children or immature animals compared to adults. In humans, UDP
glucuronosyltransferase activity does not reach adult levels until about 6–18 months of age, although the
development of this activity is isoform specific. Activity of sulfotransferases (which is also isoform
specific) seems to develop earlier. The activity of some sulfotransferase isoforms may even be greater
during infancy and early childhood than in adulthood (Leeder and Kearns 1997). In addition, age-
dependence of elimination kinetics (e.g., glomerular filtration and tubular secretion of organic anion
metabolites of ethylbenzene), potentially, could contribute to age-related differences in sensitivity to
ethylbenzene.
3.8 BIOMARKERS OF EXPOSURE AND EFFECT
Biomarkers are broadly defined as indicators signaling events in biologic systems or samples. They have
been classified as markers of exposure, markers of effect, and markers of susceptibility (NAS/NRC
1989).
A biomarker of exposure is a xenobiotic substance or its metabolite(s) or the product of an interaction
between a xenobiotic agent and some target molecule(s) or cell(s) that is measured within a compartment
of an organism (NAS/NRC 1989). The preferred biomarkers of exposure are generally the substance
itself, substance-specific metabolites in readily obtainable body fluid(s), or excreta. However, several
factors can confound the use and interpretation of biomarkers of exposure. The body burden of a
substance may be the result of exposures from more than one source. The substance being measured may
be a metabolite of another xenobiotic substance (e.g., high urinary levels of phenol can result from
exposure to several different aromatic compounds). Depending on the properties of the substance (e.g.,
biologic half-life) and environmental conditions (e.g., duration and route of exposure), the substance and
all of its metabolites may have left the body by the time samples can be taken. It may be difficult to
identify individuals exposed to hazardous substances that are commonly found in body tissues and fluids
129 ETHYLBENZENE
3. HEALTH EFFECTS
(e.g., essential mineral nutrients such as copper, zinc, and selenium). Biomarkers of exposure to
ethylbenzene are discussed in Section 3.8.1.
Biomarkers of effect are defined as any measurable biochemical, physiologic, or other alteration within an
organism that, depending on magnitude, can be recognized as an established or potential health
impairment or disease (NAS/NRC 1989). This definition encompasses biochemical or cellular signals of
tissue dysfunction (e.g., increased liver enzyme activity or pathologic changes in female genital epithelial
cells), as well as physiologic signs of dysfunction such as increased blood pressure or decreased lung
capacity. Note that these markers are not often substance specific. They also may not be directly
adverse, but can indicate potential health impairment (e.g., DNA adducts). Biomarkers of effects caused
by ethylbenzene are discussed in Section 3.8.2.
A biomarker of susceptibility is an indicator of an inherent or acquired limitation of an organism's ability
to respond to the challenge of exposure to a specific xenobiotic substance. It can be an intrinsic genetic or
other characteristic or a preexisting disease that results in an increase in absorbed dose, a decrease in the
biologically effective dose, or a target tissue response. If biomarkers of susceptibility exist, they are
discussed in Section 3.10, Populations That Are Unusually Susceptible.
3.8.1 Biomarkers Used to Identify or Quantify Exposure to Ethylbenzene
Information on ethylbenzene concentrations in human tissue or fluids is available. Exposure to
ethylbenzene may be determined by the detection of mandelic acid and phenylglyoxylic acid in urine
(Bardodej and Bardodejova 1970) or by direct detection of ethylbenzene in whole human blood (Antoine
et al. 1986; Ashley et al. 1992; Cramer et al. 1988) or urine (Wang et al. 2007). However, mandelic acid
and phenylglyoxilic acid are also metabolites of styrene (Agency for Toxic Substances and Disease
Registry 1992).
The 1982 National Human Adipose Tissue Survey conducted by EPA measured ethylbenzene in 96% of
the 46 composite samples analyzed for volatile organic compounds (EPA 1986). A wet tissue
concentration range of not detected (detection limit=2 ng/g) to 280 ng/g was reported, but an average
concentration was not provided.
Numerous studies indicate that environmental exposures to ethylbenzene can result in detectable levels in
human tissues (Antoine et al. 1986; Cramer et al. 1988; Pellizzari et al. 1982; Wolff 1976; Wolff et
130 ETHYLBENZENE
3. HEALTH EFFECTS
al. 1977) and in expired air (Conkle et al. 1975; Engstrom and Bjurstrom 1978; EPA 1984e). Analysis of
blood specimens from a test population of 250 patients (Antoine et al. 1986) and composite samples
obtained from blood donations of laboratory personnel with potentially low-level exposure (Cramer et
al. 1988) indicated ethylbenzene concentrations in the blood to range from below detection limits to
59 ppb. Similarly, ethylbenzene was detected in 8 of 12 milk samples from lactating women living in
various urban areas of the United States with high probability of emissions of pollutants (Pellizzari et al.
1982). Subcutaneous fat samples taken from individuals exposed to an average of 1–3 ppm ethylbenzene
in the workplace contained ethylbenzene levels as high as 0.7 ppm (Wolff 1976; Wolff et al. 1977).
Studies examining the correlation of ethylbenzene concentrations in ambient air with concentrations
measured in expired or alveolar air have also been conducted (Conkle et al. 1975; Engstrom and
Bjurstrom 1978; EPA 1984e). Ethylbenzene concentrations in breath samples were reported to correlate
well with ethylbenzene concentrations in indoor samples taken with personal air monitors (EPA 1984e).
A correlation was also found between ethylbenzene uptake and ethylbenzene concentrations in alveolar
air during, but not after, inhalation exposure in volunteers (Engstrom and Bjurstrom 1978). Rates of
ethylbenzene expiration measured in volunteers with no known previous exposure to ethylbenzene ranged
from 0.78 to 14 μg/hour, with higher rates detected in smokers than in nonsmokers (Conkle et al. 1975).
3.8.2 Biomarkers Used to Characterize Effects Caused by Ethylbenzene
For more information on biomarkers for renal and hepatic effects of chemicals see ATSDR/CDC
Subcommittee Report on Biological Indicators of Organ Damage (Agency for Toxic Substances and
Disease Registry 1990) and for information on biomarkers for neurological effects see OTA (1990).
No specific biomarkers of effect for ethylbenzene were identified. Most of the information on humans is
from case reports in which the effects are general and non-specific, such as eye and throat irritation and
chest constriction (Yant et al. 1930).
3.9 INTERACTIONS WITH OTHER CHEMICALS
The metabolism of ethylbenzene includes pathways involving mono-oxygenases (e.g., cytochrome P-450)
and formation of glucuronide and sulfate conjugates. Therefore, the metabolism of ethylbenzene could be
markedly altered by inhibitors (e.g., carbon monoxide, SKF 525A) and inducers (e.g., phenobarbital,
described above) of drug-metabolizing enzymes (Gillette et al. 1974) and by the availability of
conjugation reactants (e.g., glucuronic acid, sulfate) that facilitate the excretion of ethylbenzene
131 ETHYLBENZENE
3. HEALTH EFFECTS
metabolites. Mono-oxygenases (MOs) are a class of enzymes involved in the detoxication of xenobiotics,
including ethylbenzene. Substances that induce or inhibit MO enzymes may alter the toxicity of ethyl-
benzene by increasing the rate of production of its metabolites. Compounds that affect glucuronic acid
availability could also affect the excretion rate of ethylbenzene metabolites.
Numerous studies have demonstrated interactions between ethylbenzene and chemicals that inhibit
cytochrome P-450 (e.g., carbon monoxide; Maylin et al. 1973), compete with ethylbenzene for
metabolism by cytochrome P-450 (e.g., alkylbenzenes, ethanol; Angerer and Lehnert 1979; Elovaara et al.
1984; Engstrom et al. 1984; Romer et al. 1986), or induce cytochrome P-450 (e.g. phenobarbital; Maylin
et al. 1973; McMahon and Sullivan 1966). Competitive inhibition of metabolism by alkylbenzenes,
including ethylbenzene, has been introduced into PBPK models of alkylbenzene mixtures and gasoline
component mixtures (Dennison et al. 2003, 2004; Haddad et al. 2001; Tardif et al. 1997).
3.10 POPULATIONS THAT ARE UNUSUALLY SUSCEPTIBLE
A susceptible population will exhibit a different or enhanced response to ethylbenzene than will most
persons exposed to the same level of ethylbenzene in the environment. Reasons may include genetic
makeup, age, health and nutritional status, and exposure to other toxic substances (e.g., cigarette smoke).
These parameters result in reduced detoxification or excretion of ethylbenzene, or compromised function
of organs affected by ethylbenzene. Populations who are at greater risk due to their unusually high
exposure to ethylbenzene are discussed in Section 6.7, Populations with Potentially High Exposures.
Even though ethylbenzene is not known to bioaccumulate (Aster 1995; Meylan et al. 1999; Nuns and
Benville 1979; Ogata et al. 1984), human and animal studies suggest that several factors can contribute to
an increased probability of adverse health effects following ethylbenzene exposure (NIOSH/OSHA
1978). Exposure to ethylbenzene has been shown to produce hearing loss and animals; therefore,
individuals with pre-existing hearing loss (e.g., congenital or infection-related) or individuals
participating in activities that may result in hearing loss (e.g., sharpshooting) may be more susceptible to
the ototoxic effects of ethylbenzene. Exposure of individuals with impaired pulmonary function to ethyl-
benzene in air has been shown to exacerbate symptoms because of ethylbenzene's irritant properties.
Because ethylbenzene is detoxified primarily in the liver and excreted by the kidney, individuals with
liver or kidney disease might be more susceptible to ethylbenzene toxicity, as would persons taking
medications or other drugs (e.g., alcohol) that are known hepatotoxins. Persons with dermatitis or other
132 ETHYLBENZENE
3. HEALTH EFFECTS
skin diseases may be at greater risk, since ethylbenzene is a defatting agent and may aggravate these
symptoms. Children’s susceptibility is discussed in Section 3.7.
In summary, groups that might be more susceptible to the toxic effects of ethylbenzene are individuals
with hearing loss and diseases of the respiratory system, liver, kidney, or skin; young children; fetuses;
pregnant women; and individuals taking certain medications such as hepatotoxic medications or drugs.
3.11 METHODS FOR REDUCING TOXIC EFFECTS
This section will describe clinical practice and research concerning methods for reducing toxic effects of
exposure to ethylbenzene. However, because some of the treatments discussed may be experimental and
unproven, this section should not be used as a guide for treatment of exposures to ethylbenzene. When
specific exposures have occurred, poison control centers and medical toxicologists should be consulted
for medical advice. The following texts provide specific information about treatment following exposures
to ethylbenzene:
Leikin JB, Poloucek FP. 2002. Poisoning and toxicology handbook. Hudson, OH: Lexi-Comp, Inc., 554.
Proctor NH, Hughes JP. 1978. Chemical hazards of the workplace. Philadelphia, PA: J.B. Lippincott Company, 251-252.
3.11.1 Reducing Peak Absorption Following Exposure
Human exposure to ethylbenzene can occur by inhalation, oral, or dermal contact. General
recommendations for reducing absorption of ethylbenzene following exposure include removing the
exposed individual from the contaminated area and removing the contaminated clothing. Removal of the
patient from the source of contamination is an initial priority along with proper ventilation and cardiac
monitoring. If the eyes and skin were exposed, they should be flushed with water. Emesis or lavage is
not recommended following oral exposure due to the risk of aspiration pneumonia (Leikin and Paloucek
2002). Activated charcoal may be administered to adsorb ethylbenzene (Leikin and Paloucek 2002).
Benzodiazepines may be used to control seizures (Leikin and Paloucek 2002). Administration of
catecholamines should be avoided due to the risk of ventricular arrhythmia (Leikin and Paloucek 2002).
133 ETHYLBENZENE
3. HEALTH EFFECTS
3.11.2 Reducing Body Burden
Following absorption into the blood, ethylbenzene is rapidly distributed throughout the body. The initial
stage of ethylbenzene metabolism in humans is the formation of 1-phenylethanol via hydroxylation of the
of the side chain. Further oxidation leads to the formation of mandelic acid and phenylglyoxylic acid, the
major urinary metabolites of ethylbenzene in humans. Detoxication pathways generally involve the
formation of glucuronide or sulfate conjugates of 1-phenylethanol or its subsequent metabolites. Urinary
excretion is the primary route of elimination of metabolized ethylbenzene. Studies in humans and
animals indicate that urinary excretion occurs in several phases, with half-lives of hours. Hence,
ethylbenzene and its metabolites have relatively short half-lives in the body, and while some of these
metabolites are clearly toxic, substantial body burdens are not expected.
No methods are currently used for reducing the body burden of ethylbenzene. It is possible that methods
could be developed to enhance the detoxication and elimination pathways.
3.11.3 Interfering with the Mechanism of Action for Toxic Effects
Treatments interfering with the mechanism of action for toxic effects have not been identified.
3.12 ADEQUACY OF THE DATABASE
Section 104(I)(5) of CERCLA, as amended, directs the Administrator of ATSDR (in consultation with the
Administrator of EPA and agencies and programs of the Public Health Service) to assess whether
adequate information on the health effects of ethylbenzene is available. Where adequate information is
not available, ATSDR, in conjunction with the National Toxicology Program (NTP), is required to assure
the initiation of a program of research designed to determine the health effects (and techniques for
developing methods to determine such health effects) of ethylbenzene.
The following categories of possible data needs have been identified by a joint team of scientists from
ATSDR, NTP, and EPA. They are defined as substance-specific informational needs that if met would
reduce the uncertainties of human health assessment. This definition should not be interpreted to mean
that all data needs discussed in this section must be filled. In the future, the identified data needs will be
evaluated and prioritized, and a substance-specific research agenda will be proposed.
134 ETHYLBENZENE
3. HEALTH EFFECTS
3.12.1 Existing Information on Health Effects of Ethylbenzene
The existing data on health effects of inhalation, oral, and dermal exposure of humans and animals to
ethylbenzene are summarized in Figure 3-6. The purpose of this figure is to illustrate the existing
information concerning the health effects of ethylbenzene. Each dot in the figure indicates that one or
more studies provide information associated with that particular effect. The dot does not necessarily
imply anything about the quality of the study or studies, nor should missing information in this figure be
interpreted as a “data need”. A data need, as defined in ATSDR’s Decision Guide for Identifying
Substance-Specific Data Needs Related to Toxicological Profiles (Agency for Toxic Substances and
Disease Registry 1989), is substance-specific information necessary to conduct comprehensive public
health assessments. Generally, ATSDR defines a data gap more broadly as any substance-specific
information missing from the scientific literature.
Figure 3-6 graphically describes the existing health effects information on ethylbenzene by route and
duration of exposure. Little information concerning humans exposed via inhalation to ethylbenzene is
available. Most of the information concerning health effects in humans is reported in occupational
studies, which are difficult to interpret given the limitations of the studies (e.g., simultaneous exposure to
other hazardous substances, unquantified exposure concentrations, and exposure probably occurring by a
combination of routes). No data were available concerning human health effects following oral exposures
to ethylbenzene. Dermal effects in humans exposed to ethylbenzene vapors include respiratory and
ocular irritation.
In animals, the lethality of ethylbenzene is documented for all routes of exposure. Systemic,
immunologic, neurologic, developmental, and reproductive effects have been reported following acute-,
intermediate-, or chronic-duration inhalation exposures to ethylbenzene. Limited data on the health
effects resulting from oral or dermal exposure to ethylbenzene were located.
3.12.2 Identification of Data Needs
In general, data on the toxic effects of ethylbenzene in humans and animals are limited. In many areas for
which studies have been conducted, the lack of reliable data precludes any definitive conclusions from
being drawn.
Acute-Duration Exposure. The database for acute-duration inhalation exposure to ethylbenzene is
largely composed of inhalation studies in laboratory animals with a limited number of human studies.
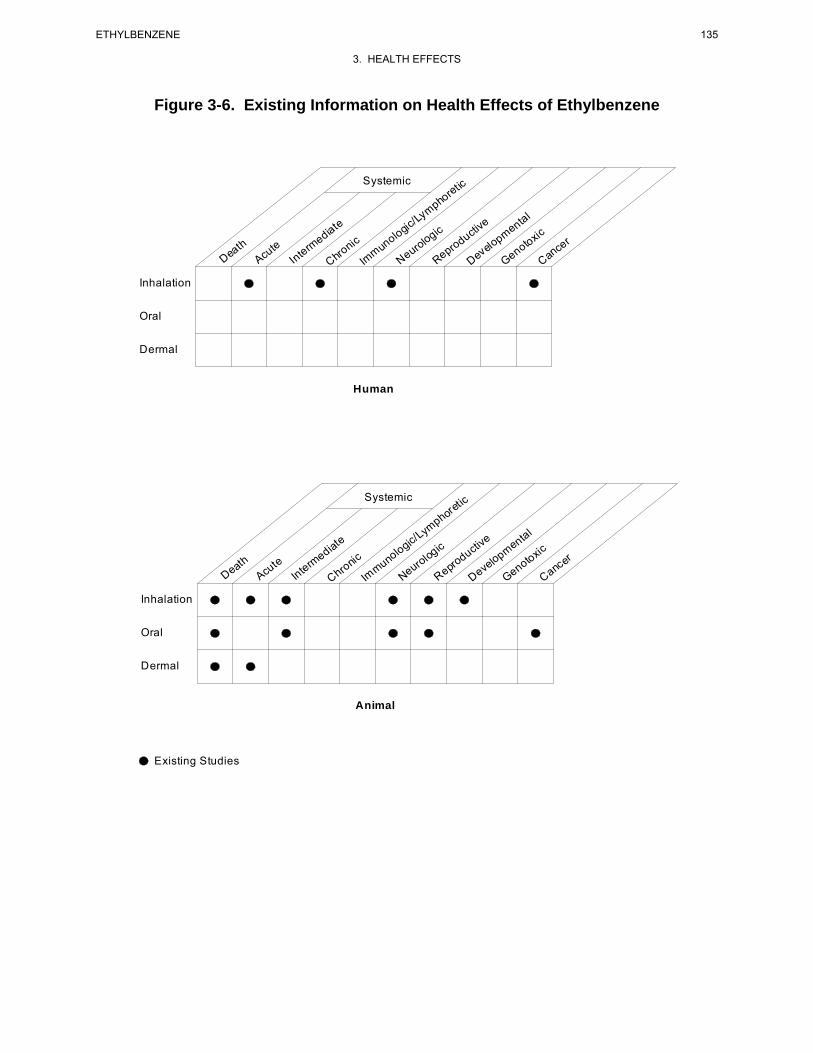
Figure 3-6. Existing Information on Health Effects of Ethylbenzene
Systemic tic re
homp
y/ e ate L
ic v edi g tiic ntal
c lo g cu m xic
th te e i o opn lo d to r
a u erm n pro eo mu ro vel n nce u oD h eAc t eN e Ge aIn r
C Im R D C
Inhalation
Oral
Dermal
Human
Systemic etic
r
homp
yte /L ive
ntal ic
dia g ege lo ic cto ic o u pm xth ic r
ute m n n lu uro d o toa er o pro l o ee ve nc
D Ac t nIn hr m e e aC m N R eD GeI C
Inhalation
Oral
Dermal
Animal
Existing Studies
135 ETHYLBENZENE
3. HEALTH EFFECTS
136 ETHYLBENZENE
3. HEALTH EFFECTS
The available acute-duration studies in humans (Sliwinska-Kowalska et al. 2001; Yant et al. 1930) and
animals (Andersson et al. 1981; Cappaert et al. 1999, 2000, 2001, 2002; Ethylbenzene Producers
Association 1986a; Molnar et al. 1986; Tegeris and Balster 1994; Yant et al. 1930) indicate that the
nervous system, and particularly the auditory system, is sensitive to the toxic effects of ethylbenzene.
The available reports and studies in humans are of limited use for dose-response assessment because
insufficient information was provided to clearly characterize the exposure to ethylbenzene or because
exposures were for mixtures of solvents, not ethylbenzene alone. Ethylbenzene is an acute ocular and
respiratory irritant in humans (Cometto-Muñiz and Cain 1995; Thienes and Haley 1972; Yant et al.
1930); however, animal studies suggest that acute sublethal inhalation exposures do not result in
pulmonary histopathology (Ethylbenzene Producers Association 1986a). Developmental and
reproductive effects were reported in animals exposed to ethylbenzene by inhalation during gestation
(Ungváry and Tátrai 1985); however, the latter study is limited by incomplete description of the results
and the absence of an analysis on a per litter basis. Increased organ weight (liver, kidneys) has been
observed in a number of studies in animals (Ethylbenzene Producers Association 1986a; Toftgard and
Nilsen 1982); however, no findings are made upon microscopic examination of the liver or kidneys
(Ethylbenzene Producers Association 1986a). An acute-duration inhalation MRL was derived based on
ototoxicity in animals. No studies describing acute-duration oral exposure of humans to ethylbenzene
were found in the literature. Although two animal studies have examined the acute oral toxicity of
ethylbenzene (Gagnaire and Langlais 2005; Ungvary 1986), they were not adequate for the derivation of
an acute-duration oral MRL. Mild irritation (Smyth et al. 1962), reddening, exfoliation, and blistering
(Wolf et al. 1956) have been reported in rabbits when ethylbenzene was applied directly on the skin.
Slight irritation of the eye (Wolf et al. 1956) and corneal injuries (Smyth et al. 1962; Wolf et al. 1956)
were observed in rabbits when ethylbenzene was instilled onto the eyes. There is a data need for
additional acute-duration oral and dermal toxicity studies in animals exposed to ethylbenzene.
Intermediate-Duration Exposure. The database of intermediate-duration inhalation studies
includes several studies in animals, but no studies in humans. It has been shown that the auditory system
is sensitive to the toxic effects of ethylbenzene after intermediate-duration inhalation exposure (Gagnaire
et al. 2007). Systemic effects have been observed at concentrations equal to or higher than those that
elicited ototoxic effects in rats. Effects at even higher concentrations include neurological and
hematological effects (Cragg et al. 1989; Wolf et al. 1956) and increased organ weight (Cragg et al. 1989;
Elovaara et al. 1985; NIOSH 1981; NTP 1992; Wolf et al. 1956). Organs showing increased weight did
not show treatment-related histopathological effects (Cragg et al. 1989; NTP 1992). Developmental
and/or reproductive effects have been reported in offspring of animals following intermediate-duration
137 ETHYLBENZENE
3. HEALTH EFFECTS
inhalation exposures to ethylbenzene during gestation (Faber et al. 2006, 2007; NIOSH 1981; Saillenfait
et al. 2003, 2006, 2007) at concentrations that were higher than those that elicited ototoxic effects. An
intermediate-duration inhalation MRL was derived based on the observed ototoxic effects in animals
(Gagnaire et al. 2007). The intermediate-duration oral database for ethylbenzene is limited to the critical
study by Mellert et al. (2007) evaluating the effects of oral exposure of rats to ethylbezene for 4 and 13
weeks, and a poorly reported 6-month exposure study in rats (Wolf et al. 1956). Results of the 13-week
gavage study in rats observed effects indicative of liver toxicity, including increased activity of serum
liver enzymes (alanine aminotransferase and γ-glutamyl transferase), increased absolute and relative liver
weights, and a dose-related increase in the incidence of centrilobular hepatocyte hypertrophy. Results of
the 4-week exposure study in rats are similar to those observed in the 13-week study, showing that the
liver is the primary target organ for oral ethylbenzene; effects consistent with hepatotoxicity, including
increased absolute and relative liver weights, increased incidence of hepatocyte centrilobular, and
increased serum liver enzyme activity (alanine aminotransferase) (Mellert et al. 2007). Wolf et al. (1956)
reported slight weight and histopathological effects in the liver and kidney of female rats. An
intermediate-duration oral MRL was derived based on the observed liver effects in animals exposed for
13 weeks (Mellert et al. 2007).
Chronic-Duration Exposure and Cancer. The database of chronic-duration/carcinogenicity
inhalation studies with ethylbenzene includes a chronic duration study in rats and mice (NTP 1999) and a
limited number of studies in humans. Hematological effects were observed in workers exposed to
solvents containing ethylbenzene (Angerer and Wulf 1985), but no hematological effects, liver lesions or
effects on liver function, or cases of malignancy were reported in a study of workers exposed chronically
(>20 years) to ethylbenzene (Bardodej and Cirek 1988). The severity of nephropathy was significantly
increased in female and male rats exposed to ≥75 or 750 ppm ethylbenzene, respectively, for 2 years
(NTP 1999). At higher concentrations rats showed significant increases in renal tubule hyperplasia; male
rats showed an increased incidence of interstitial cell adenoma in the testis. Effects observed in male or
female mice exposed to ethylbenzene for 2 years include an increased incidence of hyperplasia of the
pituitary gland pars distalis, increased incidence of follicular cell hyperplasia in the thyroid gland, an
increased incidence of syncytial alterations of the hepatocytes, hypertrophy, and hepatic necrosis, and an
increased incidence of eosinophilic foci (NTP 1999). Ethylbenzene showed clear evidence of
carcinogenic activity in male rats based on increased incidences of renal tubule neoplasms, some evidence
of carcinogenic activity in female rats based on increased incidences of renal tubule adenomas, some
evidence of carcinogenic activity in male mice based on increased incidences of alveolar/bronchiolar
neoplasms, and some evidence of carcinogenic activity in female mice based on increased incidences of
138 ETHYLBENZENE
3. HEALTH EFFECTS
hepatocellular neoplasms (NTP 1999). The 2-year inhalation study in rats suggests that an increase in the
severity of nephropathy in female rats is the most sensitive end point of ethylbenzene exposure. This end
point was selected to estimate a chronic-duration inhalation MRL. There is no need to conduct additional
carcinogenicity studies of ethylbenzene via inhalation. A statistically significant increase in total
malignant tumors was reported in female rats and in combined male and female groups exposed to 500
mg kg/day via gavage for 104 weeks (Maltoni et al. 1985). No data on specific tumor type were
presented, only one dose was tested, and no information on survival was provided. It might be useful to
conduct a toxicity and carcinogenicity study of ethylbenzene administered orally to at least two animal
species. It might be useful to conduct chronic-duration studies in at least two species with an emphasis in
ototoxic effects.
Genotoxicity. There are limited data on the genotoxicity of ethylbenzene in humans. Two studies
examined potential genotoxic effects in workers (Holz et al. 1995; Sram et al. 2004); the interpretation of
these results is limited by co-exposure to other chemicals (e.g., benzene, toluene, styrene). In vivo
genotoxicity studies in laboratory animals did not cause significant alterations in micronuclei formation
(Mohtashamipur et al. 1985; NTP 1992, 1999) or unscheduled DNA syntheseis (Clay 2001). Data are
available regarding the genotoxic potential of ethylbenzene from in vitro assays in bacteria, yeast, and
mammalian cell cultures (Dean et al. 1985; Degirmenci et al. 2000; Florin et al. 1980; Kubo et al. 2002;
Nestmann and Lee 1983; Nestmann et al. 1980; NTP 1986, 1999; Zeiger et al. 1992). The results
generally indicate that ethylbenzene is not mutagenic. Similarly, in vitro genotoxic assays in mammalian
cells were negative when noncytotoxic concentrations were used (Dean et al. 1985; McGregor et al. 1988;
NTP 1986, 1999; Seidel et al. 2006; Wollny 2000). However, some studies did not cause genotoxic
alterations at concentrations not associated with cytotoxicity (Chen et al. 2008; Gibson et al. 1997); it is
not known whether these positive results reflect a genotoxic response in a particular test system or
whether they are outliers. Independent confirmation or refutation of these studies, as well as further
genotoxicity studies, especially in mammalian systems, would help provide clarification of these
conflicting results.
Reproductive Toxicity. No studies were located regarding reproductive effects in humans following
inhalation exposure to ethylbenzene. Reproductive end points have been assessed after acute- (Ungváry
and Tátrai 1985) and intermediate-duration exposures of animals exposed during gestation (Saillenfait et
al. 2003, 2006, 2007) and in a two-generation reproductive toxicity study (Faber et al. 2006, 2007).
Effects on reproductive organs (Cragg et al. 1989; NTP 1992, 1999; Wolf et al. 1956) in animals exposed
to ethylbenzene have also been evaluated. The only available oral-exposure reproduction study reported
139 ETHYLBENZENE
3. HEALTH EFFECTS
decreased hormone levels and blockage or delay of the estrus cycle in female rats (Ungvary 1986).
Additional inhalation exposure reproductive toxicity studies are not deemed necessary at this time. It
might be useful to conduct additional oral exposure reproductive toxicity studies in at least two species.
Developmental Toxicity. No studies of developmental effects in humans following inhalation
exposure to ethylbenzene were located. The available studies have reported developmental effects in the
offspring of animals exposed to ethylbenzene during gestation (NIOSH 1981; Saillenfait et al. 2003,
2006, 2007; Ungváry and Tátrai 1985). The report by Ungváry and Tátrai (1985) has many deficiencies,
including poor reporting of the experimental conditions and poor description of the maternal and fetal
observations. Maternal toxicity has been generally reported at the highest doses tested (Saillenfait et al.
2003, 2006, 2007; Ungváry and Tátrai 1985). Biologically or statistically significant developmental or
neurodevelopmental effects were not observed in the offspring of animals in a two-generation inhalation
study (Faber et al. 2006, 2007). No studies were located regarding developmental effects in humans and
animals following oral or dermal exposure to ethylbenzene. A data need exists for oral and dermal
developmental toxicity studies.
Immunotoxicity. No studies were found regarding immunological effects in humans following
inhalation exposure to ethylbenzene. No effects on humoral immune function were observed in female
rats exposed to ethylbenzene vapor for 28 days (Stump 2004). Studies also were located that examined
organs of the immune system in animals after intermediate- (Cragg et al. 1989; NIOSH 1981; NTP 1992)
or chronic-duration (NTP 1999) exposure to ethylbenzene. No studies were located regarding
immunological effects in humans or animals following oral or dermal exposure to ethylbenzene. No
additional immunological studies are deemed to be necessary at this time.
Neurotoxicity. Human studies have established that acute exposure to ethylbenzene may result in
dizziness and vertigo (Yant et al. 1930) and that hearing loss is significantly increased in workers exposed
to solvent mixtures that include ethylbenzene (Sliwinska-Kowalska et al. 2001). The role of ethylbenzene
in the observed hearing losses cannot be ascertained from this study given that ethylbenzene was only one
of several solvents.
Animal studies indicate that the auditory system is the most sensitive target of ethylbenzene toxicity after
acute- (Cappaert et al. 1999, 2000, 2001, 2002) or intermediate-duration (Gagnaire et al. 2007) inhalation
exposures and after acute-duration oral exposures to ethylbenzene (Gagnaire and Langlais 2005). The
effects of ethylbenzene on the central nervous system have been assessed in animals after acute-duration
140 ETHYLBENZENE
3. HEALTH EFFECTS
exposure to ethylbenzene (Ethylbenzene Producers Association 1986a; Molnar et al. 1986; Tegeris and
Balster 1994; Yant et al. 1930). Neurobiochemical and electrical activity alterations have been reported
in animals after acute-duration exposure to ethylbenzene (Andersson et al. 1981; Frantik et al. 1994;
Mutti et al. 1988; Romanelli et al. 1986). No adverse histopathological findings were observed in brain
tissue of animals after intermediate- (NTP 1992) or chronic-duration (NTP 1999) exposure to
ethylbenzene. No studies were located regarding neurological effects in humans following oral exposure
to ethylbenzene. Ototoxicity is also observed in animals after acute-duration oral exposure to
ethylbenzene (Gagnaire and Langlais 2005). Additional studies are needed to establish the mechanism of
action by which ethylbenzene elicits ototoxicity, as no information establishing the mechanism of
ethylbenzene-induced ototoxicity was identified. Furthermore, due to the large differences between rats
and guinea pigs in susceptibility to ethylbenzene-induced ototoxicity, additional studies on hearing and
ear physiology in rodents are needed to evaluate which species is most similar to humans. No studies
were located regarding neurological effects in humans or animals following dermal exposure to
ethylbenzene. Additional inhalation studies are needed to establish an intermediate-duration NOAEL for
ototoxic effects. Additional studies are also needed to characterize the concentration-response pattern for
ototoxicity after acute- and intermediate-duration oral exposures to ethylbenzene.
Epidemiological and Human Dosimetry Studies. The few available epidemiological studies on
the health effects of ethylbenzene were primarily limited to occupational studies in which quantitative
estimates of exposure were lacking and other limitations (e.g., multiple exposure routes, simultaneous
exposure to other hazardous chemicals) were present. Studies using volunteers exposed to low concen-
trations of ethylbenzene have provided useful information on effects of acute-duration inhalation
exposure on the central nervous system (Yant et al. 1930). No studies were available in which humans
were exposed orally or dermally to ethylbenzene. Epidemiological studies conducted in populations
exposed to ethylbenzene alone may provide useful information on the effects of ethylbenzene in humans.
Emphasis should be placed in the detection of ototoxic effects as this end point is the most sensitive effect
observed in animal studies.
Biomarkers of Exposure and Effect. Sensitive methods are available for determining ethyl-
benzene and ethylbenzene metabolites in biological tissues and fluids. However, limited data are
available associating levels of ethylbenzene in human tissues and fluids with adverse health effects.
Additional animal or epidemiological studies evaluating the association between levels in tissue or fluids
and adverse health effects would be useful to devise more sensitive and more specific early biomarkers of
effect.
141 ETHYLBENZENE
3. HEALTH EFFECTS
Exposure. Exposure to ethylbenzene can be monitored through levels of ethylbenzene in breath, blood,
or tissue, or levels of its metabolites, mandelic or phenylglyoxylic acid in urine. A statistically significant
correlation was observed between urinary excretion of mandelic acid and ethylbenzene exposure in
workers exposed to mixed solvents (including an ethylbenzene TWA of 0.9 ppm) in a metal-coating
factory (Kawai et al. 1991). However, neither one of the metabolites is specific to ethylbenzene.
Additional studies to identify a biomarker or biomarkers of exposure specific to ethylbenzene are needed.
Effect. There are currently no known specific biomarkers of effect for ethylbenzene. Development of
methods to identify biomarkers that would indicate toxic effects, and the extent of those toxic effects after
exposure to ethylbenzene, would be helpful in managing health effects that occur after significant
exposure to ethylbenzene.
Absorption, Distribution, Metabolism, and Excretion. Ethylbenzene is absorbed by humans
following inhalation (Bardodej and Bardodejova 1970; Gromiec and Piotrowski 1984) and dermal
(Dutkiewicz and Tyras 1967) exposures. Absorption rates were 49–64% by inhalation. Dermal
absorption rates were in the range of 24–33 and 0.11–0.23 mg/cm2/hour for male subjects exposed to
liquid ethylbenzene and ethylbenzene from aqueous solutions, respectively (Dutkiewicz and Tyras 1967).
Animal data support these findings and indicate that absorption rates are high following oral exposures as
well (Climie et al. 1983; El Masry et al. 1956).
Only one study (Engstrom and Bjurstrom 1978) is available that outlines the distribution of ethylbenzene
in humans following inhalation exposure. This study indicates rapid distribution to adipose tissues
throughout the body. Inhalation studies in animals support these results (Elovaara et al. 1982; Engstrom
et al. 1985). Ethylbenzene is accumulated primarily in the intestine, liver, kidney, and fat, which provides
some basis for ethylbenzene-induced effects observed in the liver and kidney. No data on distribution of
ethylbenzene following dermal exposure were located. Such information would be useful because
absorption of liquid ethylbenzene via this route is rapid in humans and because the potential exists in
humans for dermal exposure.
The metabolism of ethylbenzene in humans and animals has been studied. Although some differences in
the metabolic pattern according to route of exposure, sex, nutritional status (Nakajima and Sato 1979),
and species (Bakke and Scheline 1970; Climie et al. 1983; El Masry et al. 1956; Engstrom et al. 1984,
1985; Smith et al. 1954a, 1954b; Sollenberg et al. 1985) have been documented, pharmacokinetic data
142 ETHYLBENZENE
3. HEALTH EFFECTS
show no significant differences in metabolism between oral and inhalation routes in either humans or
animals (Climie et al. 1983; Engstrom et al. 1984, 1985). Further studies that correlate these differences
in metabolism with differences in health effects would be useful. Data on metabolism following dermal
exposure are sparse, because it is difficult to accurately measure absorption of volatile compounds.
Additional data on metabolism following dermal exposure would be useful as these exposures could
occur both from contaminated soil or groundwater.
Ethylbenzene has been shown to be rapidly eliminated from the body following inhalation exposure
(primarily in the urine) in both humans and animals. These studies (Gromiec and Piotrowski 1984;
Yamasaki 1984) are sufficient to characterize the elimination of ethylbenzene following inhalation
exposure. A small number of studies in animals exposed orally and humans exposed dermally support
these findings. Further studies on elimination of ethylbenzene via these exposure routes would be useful,
especially because differences in the excretion patterns have been observed with different routes of
exposure.
PBPK models have been developed for predicting ethylbenzene kinetics (including metabolism) in rats
and humans exposed by inhalation (Dennison et al. 2003, 2004; Tardif et al. 1997) and in rats exposed to
gavage doses of ethylbenzene in corn oil (Faber et al. 2006).
Comparative Toxicokinetics. Quantitative and qualitative variations in the absorption, distribution,
metabolism, and excretion of ethylbenzene were observed depending on exposure routes, sex, nutritional
status, and species, as previously outlined. Further studies that focus on these differences and their
implications for human health would be useful. Additionally, in vitro studies using human tissue and
PBPK modeling would contribute significantly to the understanding of the kinetics of ethylbenzene, since
they would provide information on half-lives and saturation kinetics associated with the metabolism of
ethylbenzene.
Methods for Reducing Toxic Effects. No information was found that specifically addressed the
reduction of toxic effects after absorption of ethylbenzene. Development of clinical procedures for
minimizing the effects of ethylbenzene on the respiratory, hepatic, and renal systems, and the central
nervous system would be useful in situations where significant exposure had occurred.
143 ETHYLBENZENE
3. HEALTH EFFECTS
Children’s Susceptibility. Data needs relating to both prenatal and childhood exposures, and
developmental effects expressed either prenatally or during childhood, are discussed in detail in the
Developmental Toxicity subsection above.
There are no data describing the effects of ethylbenzene exposure in children or developing postnatal
animals. Data needs relating to development are discussed in more detail above under developmental
effects. In order to evaluate whether ethylbenzene presents a unique hazard to children, additional
information on the health effects, pharmacokinetics, metabolism, and mechanism of action in children is
needed. It is unknown whether children differ from adults in their susceptibility to health effects from
exposure to ethylbenzene. Pharmacokinetic studies investigating whether ethylbenzene or its active
metabolites cross the placenta or are transferred into breast milk would be useful. Studies to determine
whether there are specific biomarkers of exposure in children would be helpful in monitoring the
exposure of children to this chemical. In addition, information describing methods of reducing toxic
effects and decreasing body burden in children might be helpful.
Child health data needs relating to exposure are discussed in Section 6.8.1, Identification of Data Needs:
Exposures of Children.
3.12.3 Ongoing Studies
Ongoing studies pertaining to ethylbenzene have been identified and are shown in Table 3-10 (FEDRIP
2007). In addition, the American Chemistry Council is conducting investigations on the mode of action
of ethylbenzene-induced mouse lung tumors, including the role of ethylbenzene ring-oxidation to
cytotoxic quinine metabolites.
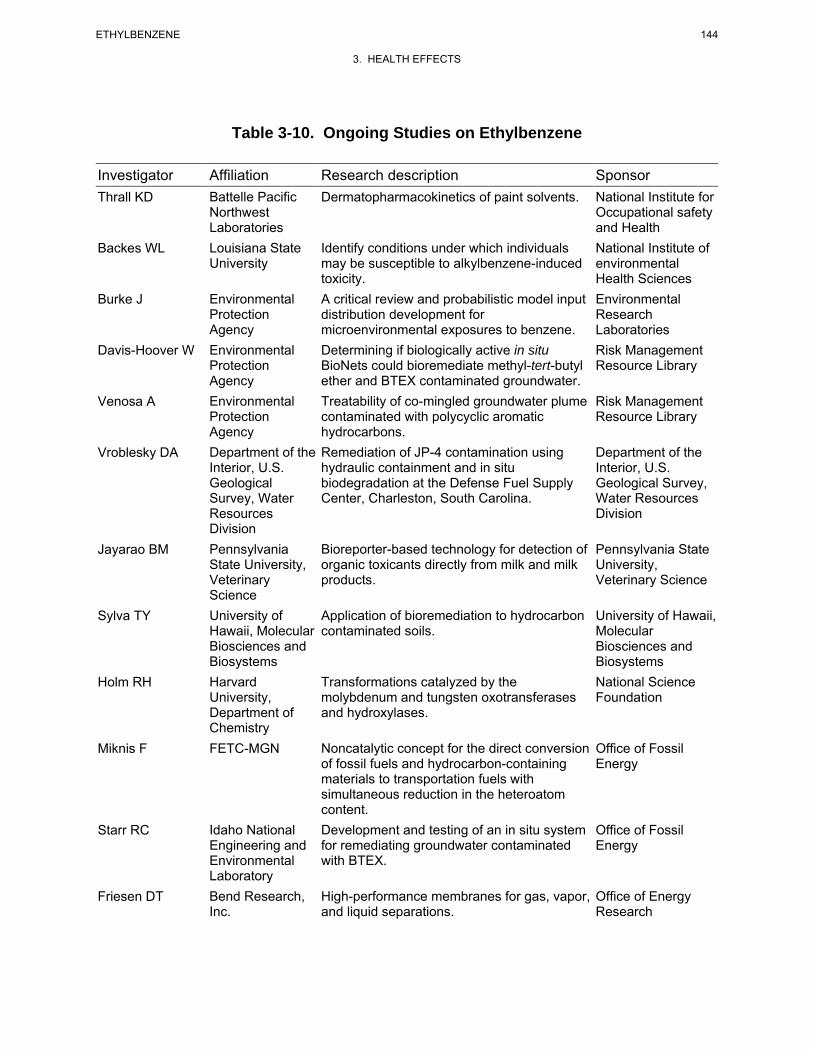
144 ETHYLBENZENE
3. HEALTH EFFECTS
Table 3-10. Ongoing Studies on Ethylbenzene
Investigator Affiliation Research description Sponsor Thrall KD
Backes WL
Burke J
Davis-Hoover W
Venosa A
Vroblesky DA
Jayarao BM
Sylva TY
Holm RH
Miknis F
Starr RC
Friesen DT
Battelle Pacific Northwest Laboratories Louisiana State University
Environmental Protection Agency Environmental Protection Agency Environmental Protection Agency Department of the Interior, U.S. Geological Survey, Water Resources Division Pennsylvania State University, Veterinary Science University of Hawaii, Molecular Biosciences and Biosystems Harvard University, Department of Chemistry FETC-MGN
Idaho National Engineering and Environmental Laboratory Bend Research, Inc.
Dermatopharmacokinetics of paint solvents.
Identify conditions under which individuals may be susceptible to alkylbenzene-induced toxicity. A critical review and probabilistic model input distribution development for microenvironmental exposures to benzene. Determining if biologically active in situ BioNets could bioremediate methyl-tert-butyl ether and BTEX contaminated groundwater. Treatability of co-mingled groundwater plume contaminated with polycyclic aromatic hydrocarbons. Remediation of JP-4 contamination using hydraulic containment and in situ biodegradation at the Defense Fuel Supply Center, Charleston, South Carolina.
Bioreporter-based technology for detection of organic toxicants directly from milk and milk products.
Application of bioremediation to hydrocarbon contaminated soils.
Transformations catalyzed by the molybdenum and tungsten oxotransferases and hydroxylases.
Noncatalytic concept for the direct conversion of fossil fuels and hydrocarbon-containing materials to transportation fuels with simultaneous reduction in the heteroatom content. Development and testing of an in situ system for remediating groundwater contaminated with BTEX.
High-performance membranes for gas, vapor, and liquid separations.
National Institute for Occupational safety and Health National Institute of environmental Health Sciences Environmental Research Laboratories Risk Management Resource Library
Risk Management Resource Library
Department of the Interior, U.S. Geological Survey, Water Resources Division
Pennsylvania State University, Veterinary Science
University of Hawaii, Molecular Biosciences and Biosystems National Science Foundation
Office of Fossil Energy
Office of Fossil Energy
Office of Energy Research
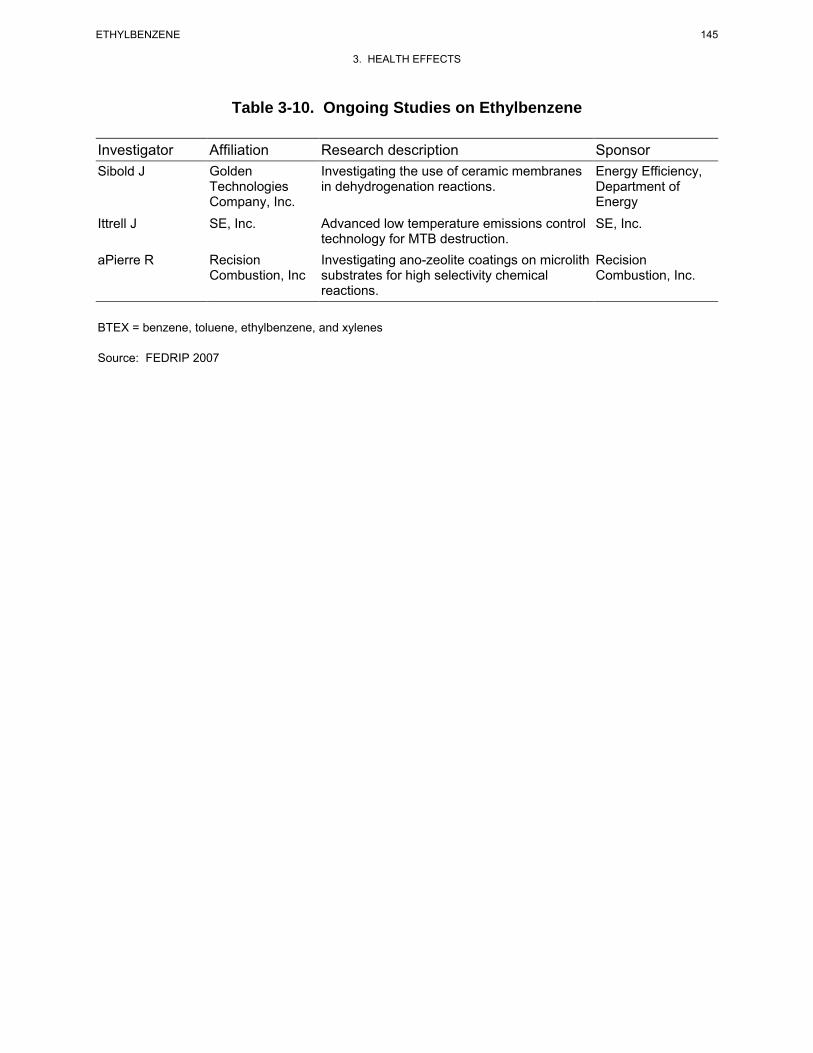
145 ETHYLBENZENE
3. HEALTH EFFECTS
Table 3-10. Ongoing Studies on Ethylbenzene
Investigator Affiliation Research description Sponsor Sibold J Golden
Technologies Company, Inc.
Investigating the use of ceramic membranes in dehydrogenation reactions.
Energy Efficiency, Department of Energy
Ittrell J SE, Inc. Advanced low temperature emissions control technology for MTB destruction.
SE, Inc.
aPierre R Recision Combustion, Inc
Investigating ano-zeolite coatings on microlith substrates for high selectivity chemical reactions.
Recision Combustion, Inc.
BTEX = benzene, toluene, ethylbenzene, and xylenes
Source: FEDRIP 2007

146 ETHYLBENZENE
3. HEALTH EFFECTS
This page is intentionally blank.
147 ETHYLBENZENE
4. CHEMICAL AND PHYSICAL INFORMATION
4.1 CHEMICAL IDENTITY
Ethylbenzene is an aromatic hydrocarbon that occurs naturally in petroleum and is a component of
aviation and automotive fuels. It is used as a solvent and in the production of synthetic rubber and
styrene. Information regarding the chemical identity of ethylbenzene is located in Table 4-1.
4.2 PHYSICAL AND CHEMICAL PROPERTIES
Ethylbenzene is a colorless liquid with an aromatic odor. Information regarding the physical and
chemical properties of ethylbenzene is located in Table 4-2. Ethylbenzene is a flammable and
combustible liquid. Vapors are heavier than air and may travel to a source of ignition and flash back.
Liquid ethylbenzene floats on water and may travel to a source of ignition and spread fire. Combustion
may produce irritants and toxic gases (HSDB 2009; NFPA 1994). Ethylbenzene may accumulate static
electricity and will react with oxidizing materials (HSDB 2009; NFPA 1994).
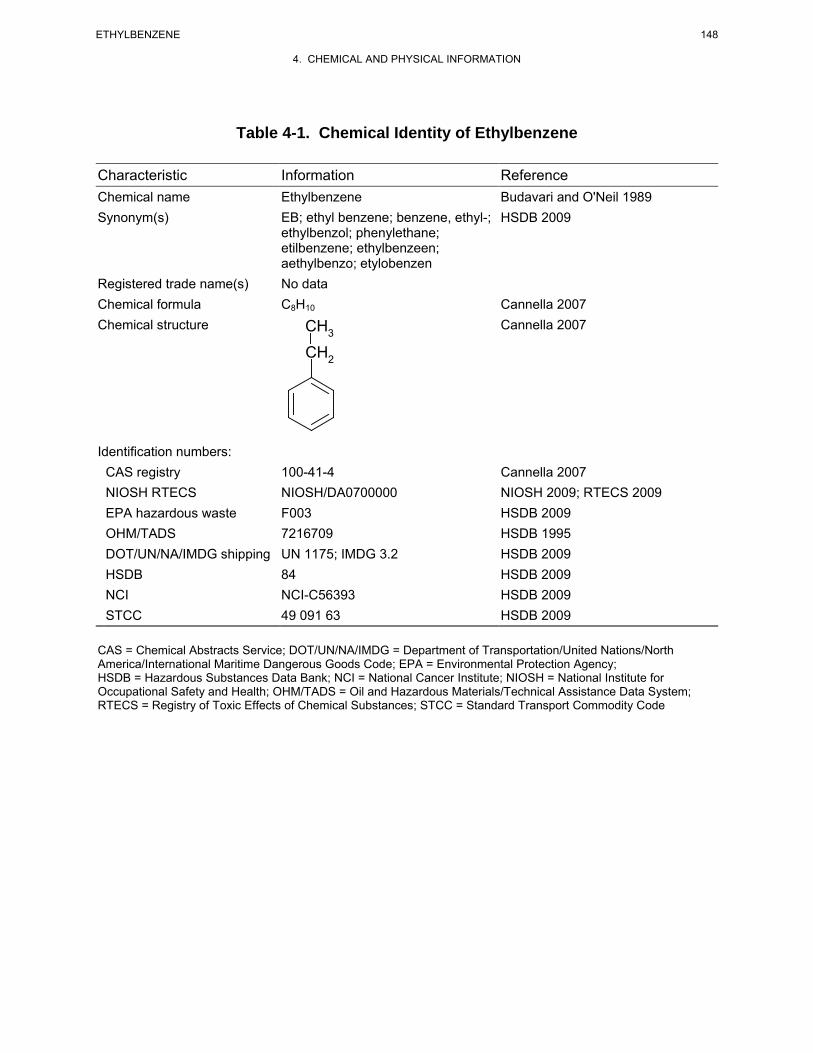
Table 4-1. Chemical Identity of Ethylbenzene
Characteristic Information Reference Chemical n ame Ethylbenzene Budavari and O'Neil 1989 Synonym(s) EB; ethyl benzene; benzene, ethyl-; HSDB 2009
ethylbenzol; phenylethane; etilbenzene; ethylbenzeen; aethylbenzo; etylobenzen
Registered trade name(s) No data Chemical formula C8H10 Cannella 2007 Chemical structure CH Cannella 2007
3
CH2
Identification numbers: CAS registry 100-41-4 Cannella 2007 NIOSH R TECS NIOSH/DA0700000 NIOSH 2 009; RTECS 2009 EPA hazardous waste F003 HSDB 2009 OHM/TADS 7216709 HSDB 1995 DOT/UN/NA/IMDG shipping UN 1175; IMDG 3.2 HSDB 2009 HSDB 84 HSDB 2009 NCI NCI-C56393 HSDB 2009 STCC 49 091 63 HSDB 2009 CAS = Chemical Abstracts Service; DOT/UN/NA/IMDG = Department of Transportation/United Nations/North America/International Maritime Dangerous Goods Code; EPA = Environmental Protection Agency; HSDB = Hazardous Substances Data Bank; NCI = National Cancer Institute; NIOSH = National Institute for Occupational Safety and Health; OHM/TADS = Oil and Hazardous Materials/Technical Assistance Data System; RTECS = Registry of Toxic Effects of Chemical Substances; STCC = Standard Transport Commodity Code
148 ETHYLBENZENE
4. CHEMICAL AND PHYSICAL INFORMATION
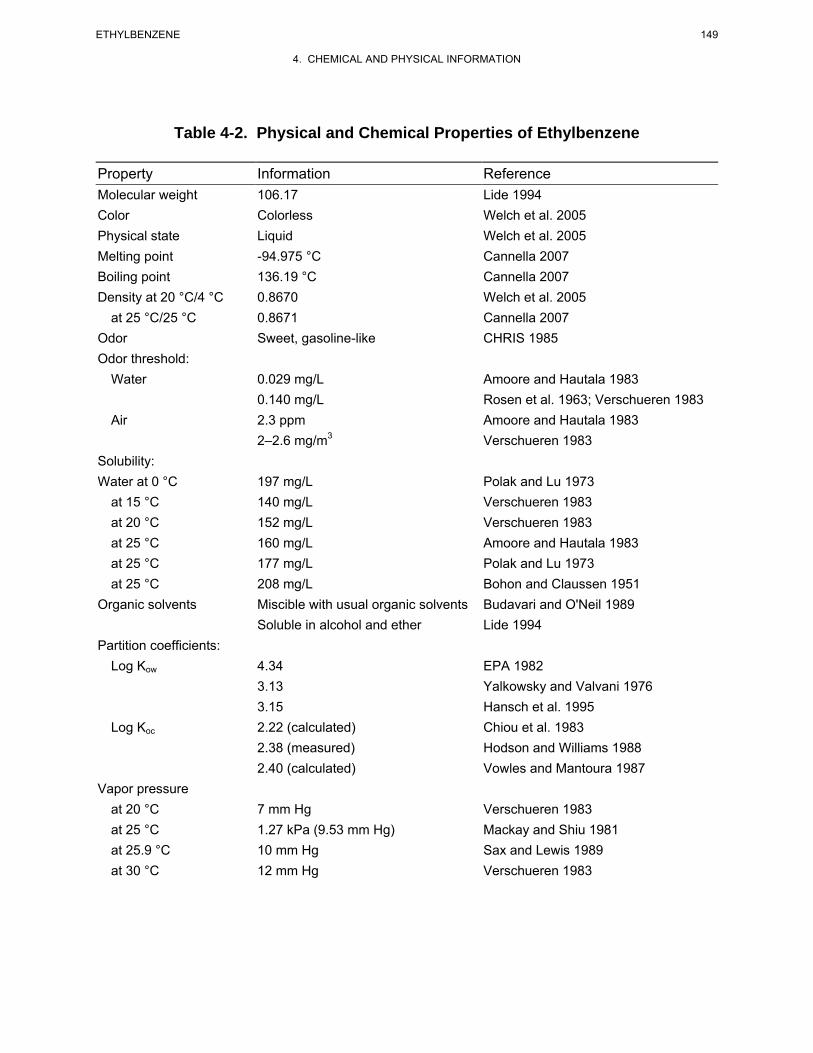
149 ETHYLBENZENE
4. CHEMICAL AND PHYSICAL INFORMATION
Table 4-2. Physical and Chemical Properties of Ethylbenzene
Property Information Reference Molecular weight 106.17 Lide 1994 Color Colorless Welch et al. 2005 Physical state Liquid Welch et al. 2005 Melting point -94.975 °C Cannella 2007 Boiling point 136.19 °C Cannella 2007 Density at 20 °C/4 °C 0.8670 Welch et al. 2005
at 25 °C/25 °C 0.8671 Cannella 2007 Odor Sweet, gasoline-like CHRIS 1985 Odor threshold:
Water 0.029 mg/L Amoore and Hautala 1983 0.140 mg/L Rosen et al. 1963; Verschueren 1983
Air 2.3 ppm Amoore and Hautala 1983 2–2.6 mg/m3 Verschueren 1983
Solubility: Water at 0 °C 197 mg/L Polak and Lu 1973
at 15 °C 140 mg/L Verschueren 1983
at 20 °C 152 mg/L Verschueren 1983
at 25 °C 160 mg/L Amoore and Hautala 1983
at 25 °C 177 mg/L Polak and Lu 1973
at 25 °C 208 mg/L Bohon and Claussen 1951
Organic solvents Miscible with usual organic solvents Budavari and O'Neil 1989 Soluble in alcohol and ether Lide 1994
Partition coefficients: Log Kow 4.34 EPA 1982
3.13 Yalkowsky and Valvani 1976 3.15 Hansch et al. 1995
Log Koc 2.22 (calculated) Chiou et al. 1983
2.38 (measured) Hodson and Williams 1988 2.40 (calculated) Vowles and Mantoura 1987
Vapor pressure at 20 °C 7 mm Hg Verschueren 1983 at 25 °C 1.27 kPa (9.53 mm Hg) Mackay and Shiu 1981 at 25.9 °C 10 mm Hg Sax and Lewis 1989 at 30 °C 12 mm Hg Verschueren 1983
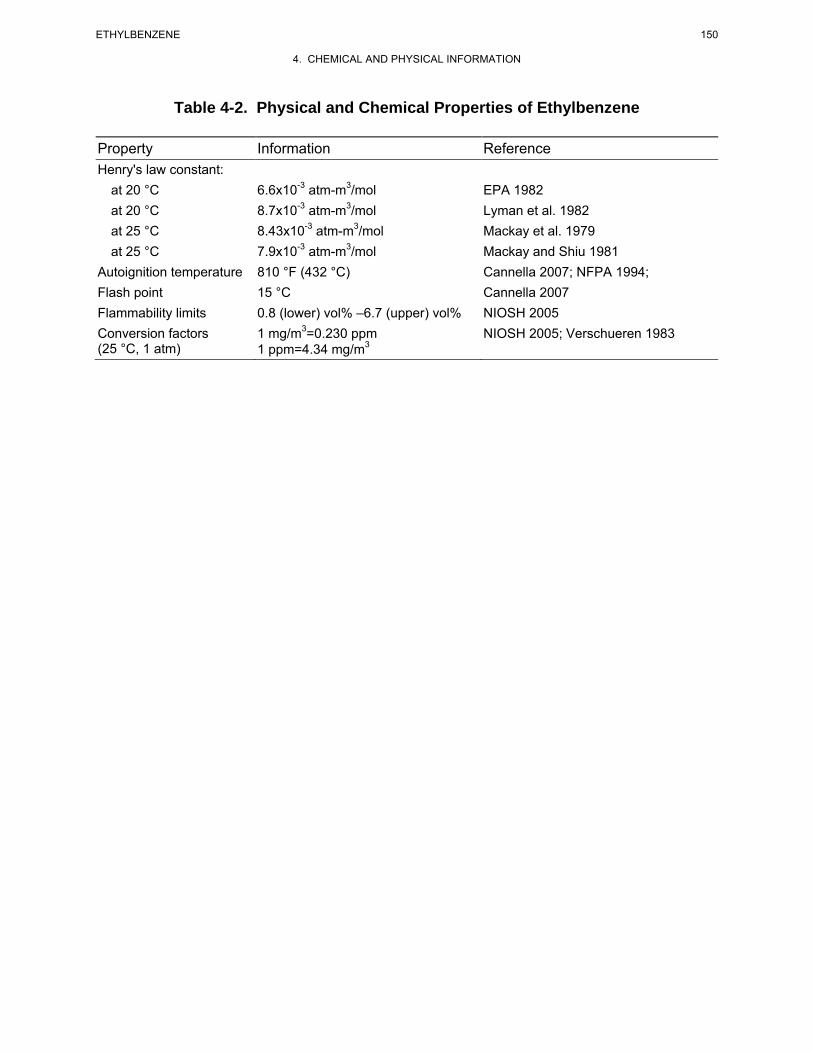
150 ETHYLBENZENE
4. CHEMICAL AND PHYSICAL INFORMATION
Table 4-2. Physical and Chemical Properties of Ethylbenzene
Property Information Reference Henry's law constant:
at 20 °C 6.6x10⁻³ atm-m3/mol EPA 1982 at 20 °C 8.7x10⁻³ atm-m3/mol Lyman et al. 1982 at 25 °C 8.43x10⁻³ atm-m3/mol Mackay et al. 1979 at 25 °C 7.9x10⁻³ atm-m3/mol Mackay and Shiu 1981
Autoignition temperature 810 °F (432 °C) Cannella 2007; NFPA 1994; Flash point 15 °C Cannella 2007 Flammability limits 0.8 (lower) vol% –6.7 (upper) vol% NIOSH 2005 Conversion factors 1 mg/m3=0.230 ppm NIOSH 2005; Verschueren 1983 (25 °C, 1 atm) 1 ppm=4.34 mg/m3
151 ETHYLBENZENE
5. PRODUCTION, IMPORT/EXPORT, USE, AND DISPOSAL
5.1 PRODUCTION
Ethylbenzene is primarily produced by the alkylation of benzene with ethylene in liquid-phase slurry
reactors promoted with aluminum chloride catalysts or by vapor-phase reaction of benzene with dilute
ethylene-containing feedstock with a boron trifluoride catalyst supported on alumina (Cannella 2007;
Clayton and Clayton 1981; HSDB 2009; Welch et al. 2005; Ransley 1984). Newer versions of the
method employ synthetic zeolites in fixed-bed reactors as catalysts for alkylation in the liquid phase or
narrow pore synthetic zeolites in fixed-bed reactors in the vapor phase (Welch et al. 2005). Other
methods of manufacturing ethylbenzene include preparation from acetophenone, dehydrogenation of
naphthenes, catalytic cyclization and aromatization, separation from mixed xylenes via fractionation,
reaction of ethylmagnesium bromide and chlorobenzene, extraction from coal oil, and recovery from
benzene-toluene-xylene (BTX) processing(Clayton and Clayton 1981; HSDB 2009; Ransley 1984; Welch
et al. 2005). Commercial grades of ethylbenzene may contain small amounts of m-xylene, p-xylene,
cumene, and toluene (HSDB 2009).
Ethylbenzene is traditionally ranked as one of the top 50 chemicals produced in the United States.
Table 5-1 shows the historical production volumes of ethylbenzene from 1983 to 2005 (C&EN 1994a,
1994b, 1995, 2006; Kirschner 1995).
Table 5-2 lists the facilities in each state that manufacture or process ethylbenzene, the intended use, and
the range of maximum amounts of ethylbenzene that are stored on site. There are currently
3,755 facilities that produce, process, or use ethylbenzene in the United States. The data listed in
Table 5-2 are derived from the Toxics Release Inventory (TRI06 2008). These data should be used with
caution however since only certain types of facilities are required to report (EPA 1995d). Therefore, this
is not an exhaustive list.
Currently, there are eight major producers of ethylbenzene in the United States, with a combined annual
production capacity of approximately 15.8 billion pounds (SRI 2006). These producers and their
respective plant locations are provided in Table 5-3.
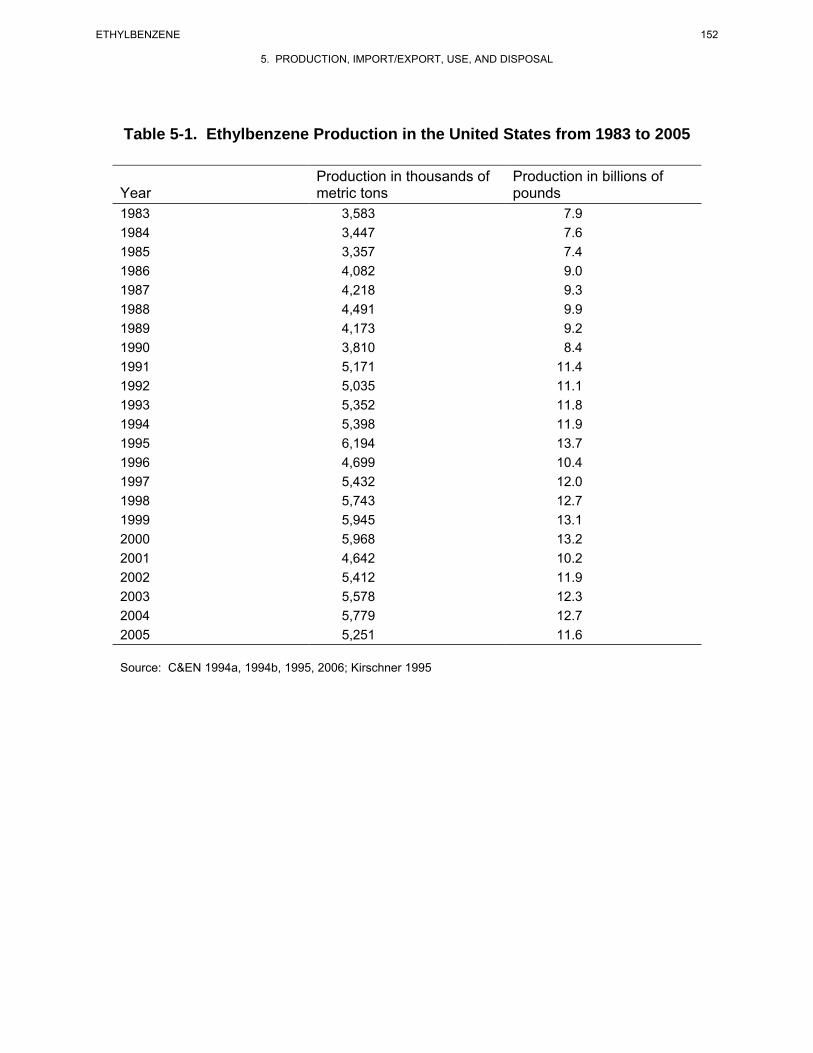
152 ETHYLBENZENE
5. PRODUCTION, IMPORT/EXPORT, USE, AND DISPOSAL
Table 5-1. Ethylbenzene Production in the United States from 1983 to 2005
Production in thousands of Production in billions of Year metric tons pounds 1983 3,583 7.9 1984 3,447 7.6 1985 3,357 7.4 1986 4,082 9.0 1987 4,218 9.3 1988 4,491 9.9 1989 4,173 9.2 1990 3,810 8.4 1991 5,171 11.4 1992 5,035 11.1 1993 5,352 11.8 1994 5,398 11.9 1995 6,194 13.7 1996 4,699 10.4 1997 5,432 12.0 1998 5,743 12.7 1999 5,945 13.1 2000 5,968 13.2 2001 4,642 10.2 2002 5,412 11.9 2003 5,578 12.3 2004 5,779 12.7 2005 5,251 11.6
Source: C&EN 1994a, 1994b, 1995, 2006; Kirschner 1995
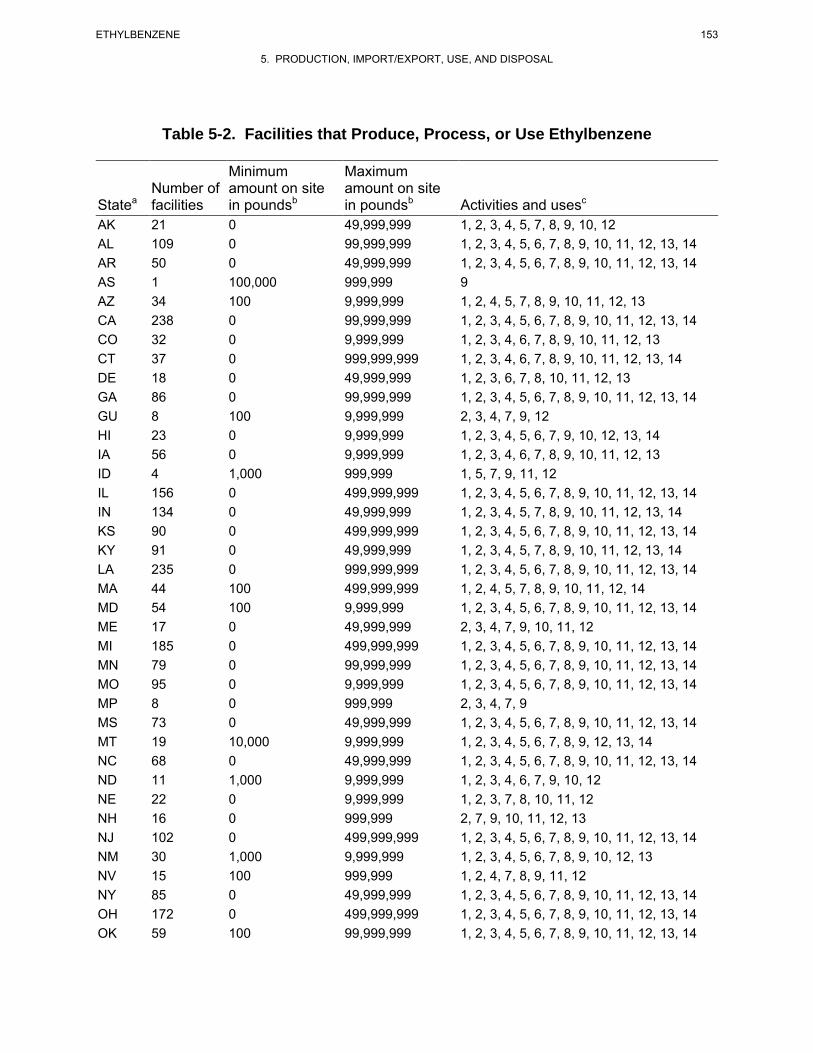
153 ETHYLBENZENE
5. PRODUCTION, IMPORT/EXPORT, USE, AND DISPOSAL
Table 5-2. Facilities that Produce, Process, or Use Ethylbenzene
Minimum Maximum Number of amount on site amount on site
Statea facilities in poundsb in poundsb Activities and usesc
AK 21 0 49,999,999 1, 2, 3, 4, 5, 7, 8, 9, 10, 12 AL 109 0 99,999,999 1, 2, 3, 4, 5, 6, 7, 8, 9, 10, 11, 12, 13, 14 AR 50 0 49,999,999 1, 2, 3, 4, 5, 6, 7, 8, 9, 10, 11, 12, 13, 14 AS 1 100,000 999,999 9 AZ 34 100 9,999,999 1, 2, 4, 5, 7, 8, 9, 10, 11, 12, 13 CA 238 0 99,999,999 1, 2, 3, 4, 5, 6, 7, 8, 9, 10, 11, 12, 13, 14 CO 32 0 9,999,999 1, 2, 3, 4, 6, 7, 8, 9, 10, 11, 12, 13 CT 37 0 999,999,999 1, 2, 3, 4, 6, 7, 8, 9, 10, 11, 12, 13, 14 DE 18 0 49,999,999 1, 2, 3, 6, 7, 8, 10, 11, 12, 13 GA 86 0 99,999,999 1, 2, 3, 4, 5, 6, 7, 8, 9, 10, 11, 12, 13, 14 GU 8 100 9,999,999 2, 3, 4, 7, 9, 12 HI 23 0 9,999,999 1, 2, 3, 4, 5, 6, 7, 9, 10, 12, 13, 14 IA 56 0 9,999,999 1, 2, 3, 4, 6, 7, 8, 9, 10, 11, 12, 13 ID 4 1,000 999,999 1, 5, 7, 9, 11, 12 IL 156 0 499,999,999 1, 2, 3, 4, 5, 6, 7, 8, 9, 10, 11, 12, 13, 14 IN 134 0 49,999,999 1, 2, 3, 4, 5, 7, 8, 9, 10, 11, 12, 13, 14 KS 90 0 499,999,999 1, 2, 3, 4, 5, 6, 7, 8, 9, 10, 11, 12, 13, 14 KY 91 0 49,999,999 1, 2, 3, 4, 5, 7, 8, 9, 10, 11, 12, 13, 14 LA 235 0 999,999,999 1, 2, 3, 4, 5, 6, 7, 8, 9, 10, 11, 12, 13, 14 MA 44 100 499,999,999 1, 2, 4, 5, 7, 8, 9, 10, 11, 12, 14 MD 54 100 9,999,999 1, 2, 3, 4, 5, 6, 7, 8, 9, 10, 11, 12, 13, 14 ME 17 0 49,999,999 2, 3, 4, 7, 9, 10, 11, 12 MI 185 0 499,999,999 1, 2, 3, 4, 5, 6, 7, 8, 9, 10, 11, 12, 13, 14 MN 79 0 99,999,999 1, 2, 3, 4, 5, 6, 7, 8, 9, 10, 11, 12, 13, 14 MO 95 0 9,999,999 1, 2, 3, 4, 5, 6, 7, 8, 9, 10, 11, 12, 13, 14 MP 8 0 999,999 2, 3, 4, 7, 9 MS 73 0 49,999,999 1, 2, 3, 4, 5, 6, 7, 8, 9, 10, 11, 12, 13, 14 MT 19 10,000 9,999,999 1, 2, 3, 4, 5, 6, 7, 8, 9, 12, 13, 14 NC 68 0 49,999,999 1, 2, 3, 4, 5, 6, 7, 8, 9, 10, 11, 12, 13, 14 ND 11 1,000 9,999,999 1, 2, 3, 4, 6, 7, 9, 10, 12 NE 22 0 9,999,999 1, 2, 3, 7, 8, 10, 11, 12 NH 16 0 999,999 2, 7, 9, 10, 11, 12, 13 NJ 102 0 499,999,999 1, 2, 3, 4, 5, 6, 7, 8, 9, 10, 11, 12, 13, 14 NM 30 1,000 9,999,999 1, 2, 3, 4, 5, 6, 7, 8, 9, 10, 12, 13 NV 15 100 999,999 1, 2, 4, 7, 8, 9, 11, 12 NY 85 0 49,999,999 1, 2, 3, 4, 5, 6, 7, 8, 9, 10, 11, 12, 13, 14 OH 172 0 499,999,999 1, 2, 3, 4, 5, 6, 7, 8, 9, 10, 11, 12, 13, 14 OK 59 100 99,999,999 1, 2, 3, 4, 5, 6, 7, 8, 9, 10, 11, 12, 13, 14
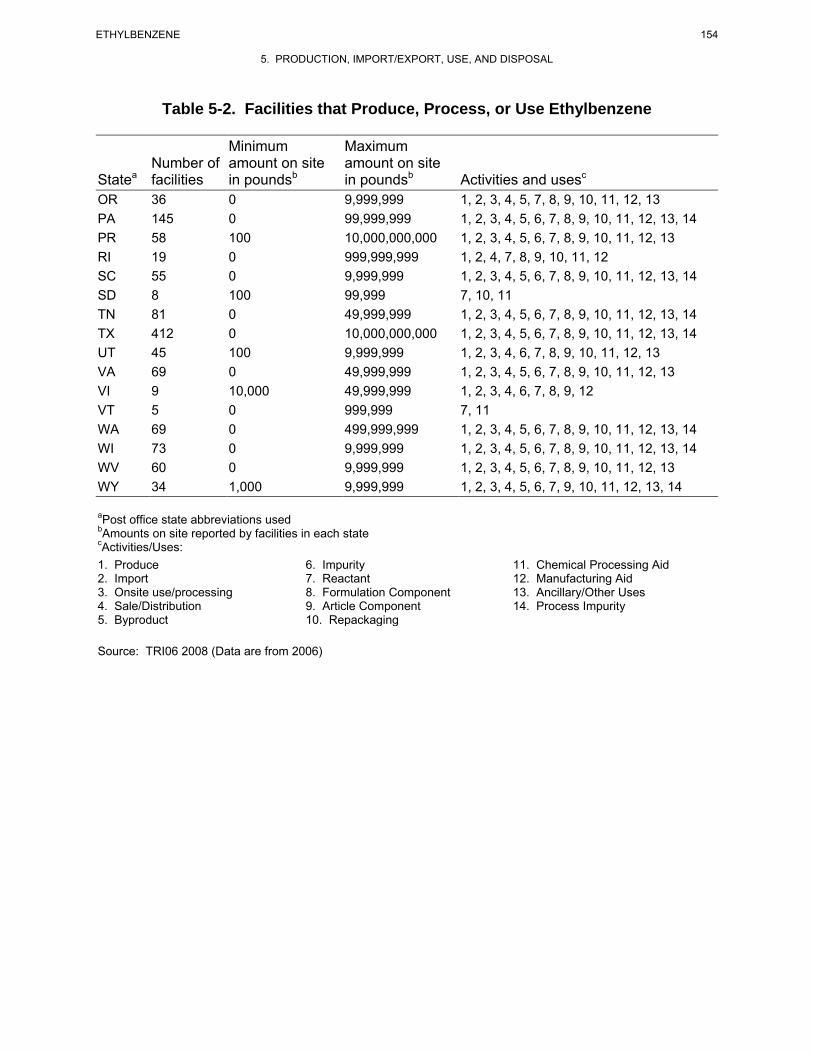
154 ETHYLBENZENE
5. PRODUCTION, IMPORT/EXPORT, USE, AND DISPOSAL
Table 5-2. Facilities that Produce, Process, or Use Ethylbenzene
Minimum Maximum Number of amount on site amount on site
Statea facilities in poundsb in poundsb Activities and usesc
OR 36 0 9,999,999 1, 2, 3, 4, 5, 7, 8, 9, 10, 11, 12, 13 PA 145 0 99,999,999 1, 2, 3, 4, 5, 6, 7, 8, 9, 10, 11, 12, 13, 14 PR 58 100 10,000,000,000 1, 2, 3, 4, 5, 6, 7, 8, 9, 10, 11, 12, 13 RI 19 0 999,999,999 1, 2, 4, 7, 8, 9, 10, 11, 12 SC 55 0 9,999,999 1, 2, 3, 4, 5, 6, 7, 8, 9, 10, 11, 12, 13, 14 SD 8 100 99,999 7, 10, 11 TN 81 0 49,999,999 1, 2, 3, 4, 5, 6, 7, 8, 9, 10, 11, 12, 13, 14 TX 412 0 10,000,000,000 1, 2, 3, 4, 5, 6, 7, 8, 9, 10, 11, 12, 13, 14 UT 45 100 9,999,999 1, 2, 3, 4, 6, 7, 8, 9, 10, 11, 12, 13 VA 69 0 49,999,999 1, 2, 3, 4, 5, 6, 7, 8, 9, 10, 11, 12, 13 VI 9 10,000 49,999,999 1, 2, 3, 4, 6, 7, 8, 9, 12 VT 5 0 999,999 7, 11 WA 69 0 499,999,999 1, 2, 3, 4, 5, 6, 7, 8, 9, 10, 11, 12, 13, 14 WI 73 0 9,999,999 1, 2, 3, 4, 5, 6, 7, 8, 9, 10, 11, 12, 13, 14 WV 60 0 9,999,999 1, 2, 3, 4, 5, 6, 7, 8, 9, 10, 11, 12, 13 WY 34 1,000 9,999,999 1, 2, 3, 4, 5, 6, 7, 9, 10, 11, 12, 13, 14
aPost office state abbreviations used bAmounts on site reported by facilities in each state cActivities/Uses: 1. Produce 6. Impurity 11. Chemical Processing Aid 2. Import 7. Reactant 12. Manufacturing Aid 3. Onsite use/processing 8. Formulation Component 13. Ancillary/Other Uses 4. Sale/Distribution 9. Article Component 14. Process Impurity 5. Byproduct 10. Repackaging
Source: TRI06 2008 (Data are from 2006)
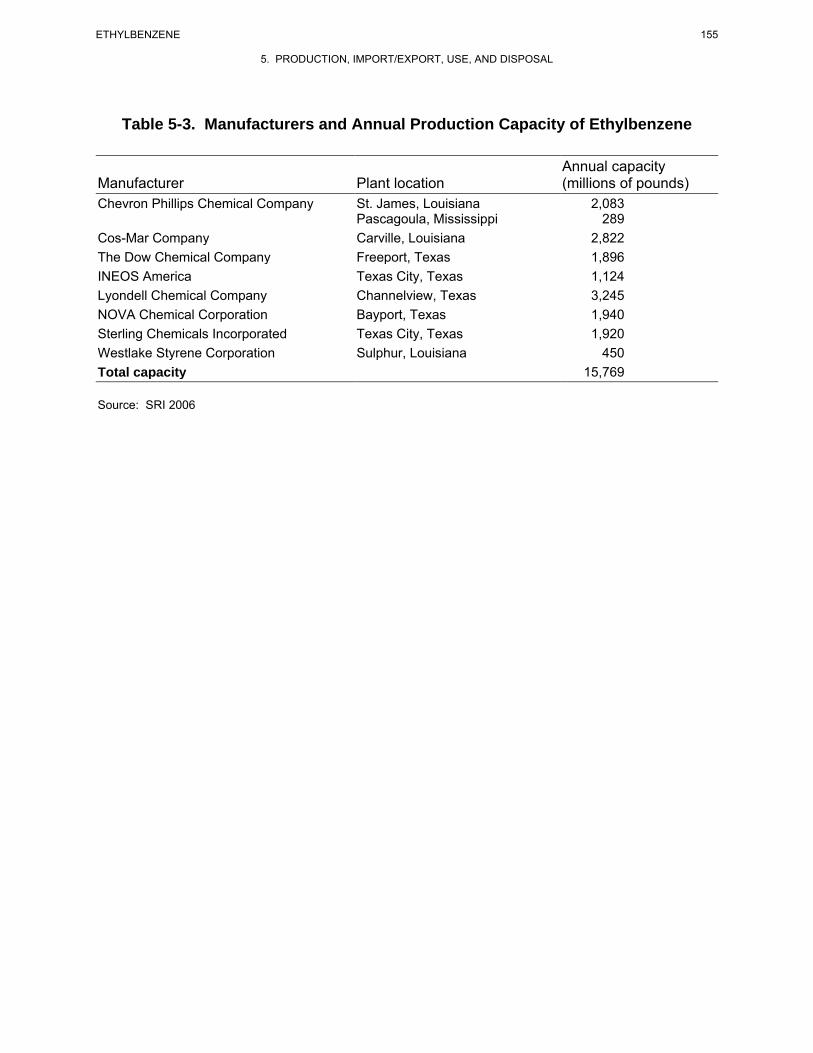
155 ETHYLBENZENE
5. PRODUCTION, IMPORT/EXPORT, USE, AND DISPOSAL
Table 5-3. Manufacturers and Annual Production Capacity of Ethylbenzene
Annual capacity Manufacturer Plant location (millions of pounds) Chevron Phillips Chemical Company St. James, Louisiana 2,083
Pascagoula, Mississippi 289 Cos-Mar Company Carville, Louisiana 2,822 The Dow Chemical Company Freeport, Texas 1,896 INEOS America Texas City, Texas 1,124 Lyondell Chemical Company Channelview, Texas 3,245 NOVA Chemical Corporation Bayport, Texas 1,940 Sterling Chemicals Incorporated Texas City, Texas 1,920 Westlake Styrene Corporation Sulphur, Louisiana 450 Total capacity 15,769
Source: SRI 2006
156 ETHYLBENZENE
5. PRODUCTION, IMPORT/EXPORT, USE, AND DISPOSAL
5.2 IMPORT/EXPORT
According to the Chemical Marketing Reporter, import volumes were negligible in 2002 and were
4.95x10⁷ kg (109 million pounds) in 2003 (CMR 2004). Import volumes for ethylbenzene have been
relatively small as compared to annual production, typically representing ≤1% of the annual domestic
production volume.
U.S. exports for 2002 and 2003 were reported as 1.86x10⁷ kg (41 million pounds) and 1.50x10⁷ kg
(33 million pounds), respectively (CMR 2004). Export volumes for ethylbenzene have been relatively
small, typically representing ≤1% of the annual domestic production volume.
5.3 USE
Ethylbenzene is used primarily as a precursor in the production of styrene (ACGIH 2002; Cannella 2007;
Ransley 1984; Verschueren 1983). It is estimated that >99% of the ethylbenzene manufactured in the
United States is ultimately used in styrene production, while the remainder is exported or sold in solvent
applications (CMR 2004; HSDB 2009; Welch et al. 2005). Ethylbenzene is also used as a solvent, a
constituent of asphalt and of naphtha, and in fuels (ACGIH 2002; Verschueren 1983) as well as in the
manufacture of acetophenone, cellulose acetate, diethylbenzene, ethyl anthraquinone, ethylbenzene
sulfonic acids, propylene oxide, and α-methylbenzyl alcohol (HSDB 2000; Verschueren 1983; Welch et
al. 2005).
5.4 DISPOSAL
Regulations governing the treatment and disposal of wastes containing ethylbenzene are detailed in
Chapter 8. Recommended methods for the disposal of ethylbenzene include burial in a landfill and rotary
kiln incineration, liquid injection incineration, and fluidized bed incineration (EPA 1981d; HSDB 2009).
Ethylbenzene may be disposed of by adsorbing it in vermiculite, dry sand, earth, or a similar material and
then by burial in a secured sanitary landfill or by atomizing in a suitable combustion chamber (IRPTC
1985). Ethylbenzene is a good candidate for liquid injection incineration at a temperature range of 650–
1,600 °C and a residence time of 0.1–2 seconds; a candidate for rotary kiln incineration at a temperature
range of 820–1,600 °C and a residence time of seconds for gases and liquids and hours for solids; and a
good candidate for fluidized bed incineration at a temperature range of 450–980 °C and a residence time
of seconds for gases and liquids, and longer for solids (HSDB 2009).
157 ETHYLBENZENE
5. PRODUCTION, IMPORT/EXPORT, USE, AND DISPOSAL
The following waste water treatment technologies have been investigated for disposal of ethylbenzene;
biological treatment, air and steam stripping, or activated carbon treatment (HSDB 2009). Spent ethyl-
benzene solvents and still bottoms from the recovery of these solvents are designated hazardous wastes
and, as such, are subject to the Resource Conservation and Recovery Act (RCRA) of 1976 handling and
record-keeping requirements (EPA 1992c).
According to the TRI, in 2006, an estimated 141,972 pounds (64,455 kg) were transferred off-site, which
includes releases to publicly owned treatment works (POTWs) (TRI06 2008). No additional information
was located on the trends in disposal methods related to ethylbenzene.

158 ETHYLBENZENE
5. PRODUCTION, IMPORT/EXPORT, USE, AND DISPOSAL
This page is intentionally blank.
159 ETHYLBENZENE
6. POTENTIAL FOR HUMAN EXPOSURE
6.1 OVERVIEW
Ethylbenzene has been identified in at least 829 of the 1,689 hazardous waste sites that have been
proposed for inclusion on the EPA National Priorities List (NPL) (HazDat 2007). However, the number
of sites evaluated for ethylbenzene is not known. The frequency of these sites can be seen in Figure 6-1.
Of these sites, 825 are located within the United States, 2 are located in the Commonwealth of Puerto
Rico, and 2 are located in the Virgin Islands (not shown).
Ethylbenzene is an aromatic hydrocarbon naturally present in crude petroleum. It is also a combustion
byproduct of biomass. It is widely distributed in the environment because of human activities such as the
use of fuels and solvents (which account for the bulk of emissions) and through chemical manufacturing
and production activities. Because of its volatile nature, ethylbenzene tends to partition to the atmosphere
when it is released to the environment; therefore, exposure to this chemical is most likely to occur by
inhalation. However, it is also present in trace amounts in some water supplies and food items. Thus,
ingestion also may be an important exposure pathway in some cases. Exposures from contaminated water
may also occur via inhalation and dermal absorption during showering and other household activities
(Beavers et al. 1996).
Physical, chemical, and biological processes can remove ethylbenzene from the medium of concern and
reduce human exposures. In the atmosphere, ethylbenzene exists primarily in the vapor phase. Vapor
phase ethylbenzene is removed from air by reacting with photochemically produced hydroxyl radicals,
with an approximate half-life of 2 days. Photolytic transformations may also take place in surface water
in the presence of naturally occurring humic materials (sensitized photolysis). Biologically induced
transformations take place largely in soil and surface water in the presence of oxygen; however, anaerobic
degradation can also occur in soil, sediment, and groundwater, but at a much slower rate than aerobic
biodegradation. Although chemical transformations can result in reduced exposures to ethylbenzene in
the atmosphere, one toxic by-product of ethylbenzene photodegradation, peroxyacetylnitrate (PAN), may
be of concern. Ethylbenzene, as well as a variety of other hydrocarbons, has been implicated in the
atmospheric formation of PAN in smog (Yanagihara et al. 1977).
The kinetics of partitioning and/or transformation processes are site-specific and depend upon many
external factors. For example, the extent of biodegradation observed in an environmental medium
depends upon the type and population of microorganisms present, the concentration of ethylbenzene, the
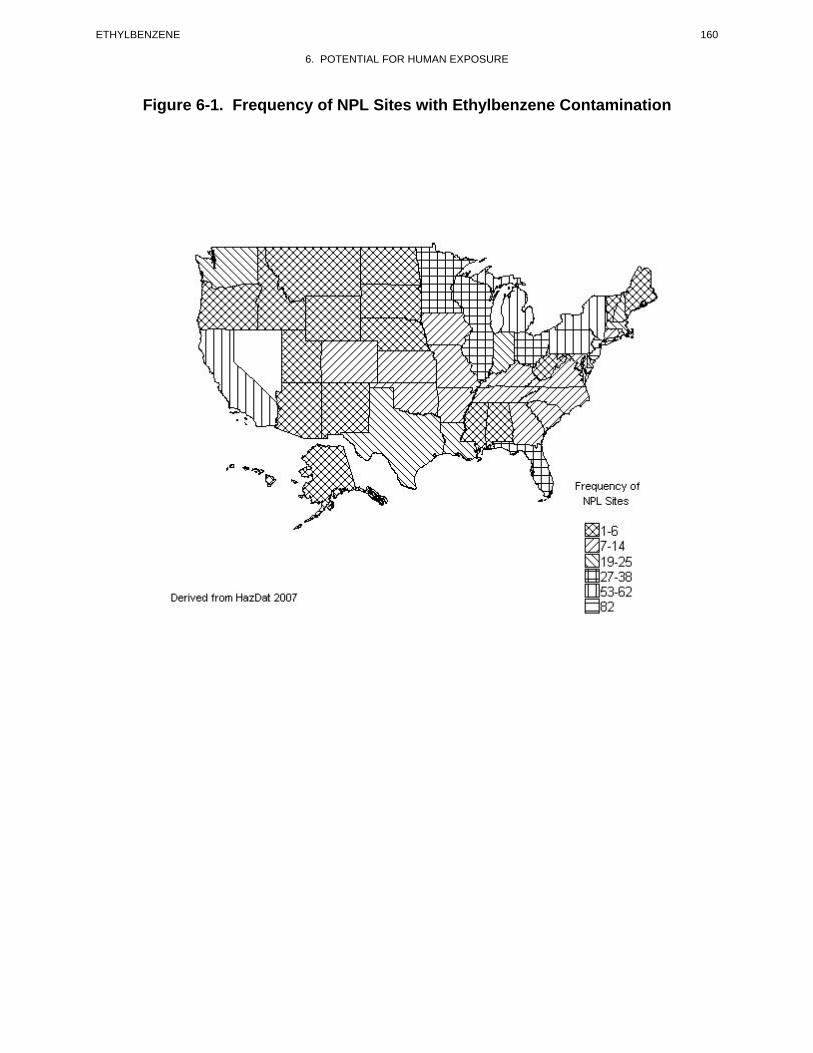
160 ETHYLBENZENE
6. POTENTIAL FOR HUMAN EXPOSURE
Figure 6-1. Frequency of NPL Sites with Ethylbenzene Contamination
161 ETHYLBENZENE
6. POTENTIAL FOR HUMAN EXPOSURE
presence of other compounds that may act as a substrate, and the presence or absence of oxygen.
Biodegradation in soil will also compete with transport processes such as volatilization and infiltration to
groundwater. Because ethylbenzene migration is only moderately retarded by adsorption onto soil,
leaching of the compound to an anaerobic environment (groundwater) before biotransformation in soil is
possible and may allow ethylbenzene to persist in an aquifer.
Although information is limited on dietary exposures, ethylbenzene does not appear to significantly
bioaccumulate in aquatic or terrestrial food chains, and human exposure through this route is not likely to
be of concern.
Exposure of the general population to ethylbenzene is possible through contact with gasoline, automobile
emissions, solvents, pesticides, printing ink, varnishes, coatings, and paints. Cigarette smoke also has
been identified as a source of exposure to this chemical. Ethylbenzene is widely present at low
concentrations in rural, suburban, and urban atmospheres with the highest concentrations generally
detected in areas of gasoline stations, tunnels, highways, and parking lots. Ethylbenzene is also present in
indoor air. Very often ethylbenzene levels in indoor air exceed the levels typically found in outdoor air
(Dodson et al. 2008). Occupational exposures are expected within the petroleum industry; within
industries using solvents, paints, and coatings; and during the manufacture and handling of ethylbenzene
and styrene (which is manufactured from ethylbenzene).
Several groups within the general population may have potentially higher exposures to ethylbenzene by
inhalation, oral, or dermal contact with contaminated drinking water or soil. These groups include
individuals living near manufacturing and processing facilities, petroleum refineries, and hazardous waste
disposal sites and those working or residing in high traffic areas. Exposures associated with the
consumption of contaminated drinking water as well as with inhalation and dermal exposure during
showering and bathing in contaminated water would be expected for individuals that derive their primary
drinking water supply from residential wells downgradient of uncontrolled landfills, hazardous waste
sites, and leaking underground storage tanks that are contaminated with ethylbenzene. Individuals living
near these sites may also be exposed via dermal contact with, or ingestion of soil contaminated with
ethylbenzene.
162 ETHYLBENZENE
6. POTENTIAL FOR HUMAN EXPOSURE
6.2 RELEASES TO THE ENVIRONMENT
The Toxics Release Inventory (TRI) data should be used with caution because only certain types of
facilities are required to report (EPA 2005). This is not an exhaustive list. Manufacturing and processing
facilities are required to report information to the TRI only if they employ 10 or more full-time
employees; if their facility is included in Standard Industrial Classification (SIC) Codes 10 (except 1011,
1081, and 1094), 12 (except 1241), 20–39, 4911 (limited to facilities that combust coal and/or oil for the
purpose of generating electricity for distribution in commerce), 4931 (limited to facilities that combust
coal and/or oil for the purpose of generating electricity for distribution in commerce), 4939 (limited to
facilities that combust coal and/or oil for the purpose of generating electricity for distribution in
commerce), 4953 (limited to facilities regulated under RCRA Subtitle C, 42 U.S.C. section 6921 et seq.),
5169, 5171, and 7389 (limited S.C. section 6921 et seq.), 5169, 5171, and 7389 (limited to facilities
primarily engaged in solvents recovery services on a contract or fee basis); and if their facility produces,
imports, or processes ≥25,000 pounds of any TRI chemical or otherwise uses >10,000 pounds of a TRI
chemical in a calendar year (EPA 2005).
6.2.1 Air
Estimated releases of 4,586,441 pounds (~2,081 metric tons) of ethylbenzene to the atmosphere from
1,485 domestic manufacturing and processing facilities in 2006, accounted for about 82% of the estimated
total environmental releases from facilities required to report to the TRI (TRI06 2008). These releases are
summarized in Table 6-1.
The majority of ethylbenzene releases to the environment occur to the atmosphere. Because of its
frequent use, and production in manufacturing operations, ethylbenzene is an important industrial
chemical. Ethylbenzene is consistently ranked among the top 50 chemicals produced in the United States,
with total production ranging from approximately 11 to 13 billion pounds annually (C&EN 1995, 2006;
Kirschner 1995). In 2005, 11.6 billion pounds of ethylbenzene were produced by U.S. manufacturers
(C&EN 2006). Its release can occur during manufacturing, processing, and handling. In 1978, emissions
of ethylbenzene in the United States from catalytic reformate production alone were estimated at over
2 million pounds (Fishbein 1985). Ethylbenzene is also released to the air during processing of crude oil
(Bratveit et al. 2007). Fuels and solvents, however, are considered to account for the bulk of emissions
(Fishbein 1985). Exposure to ethylbenzene increases in areas high traffic areas (Smith et al. 2008).
Ethylbenzene has been measured from tail pipe emissions of gasoline-powered vehicles at a weighted
average rate of 12 mg/km (considering both catalyst and noncatalyst equipped cars) (Hampton et al.
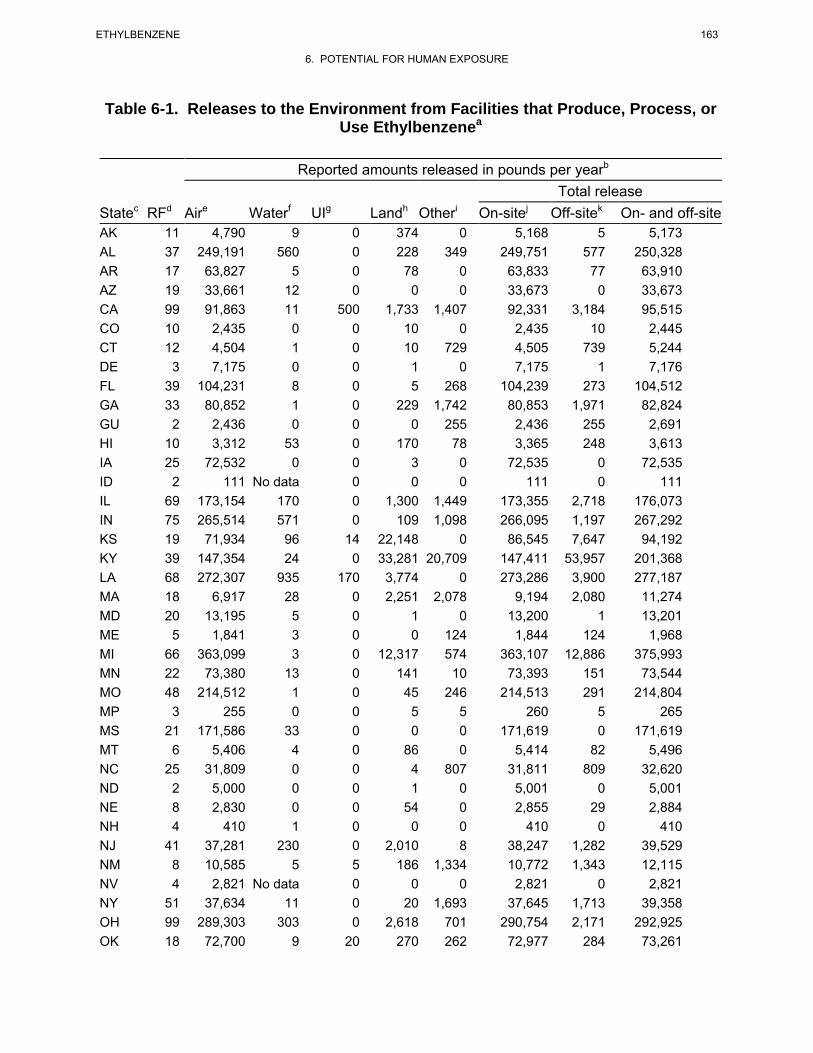
163 ETHYLBENZENE
6. POTENTIAL FOR HUMAN EXPOSURE
Table 6-1. Releases to the Environment from Facilities that Produce, Process, or Use Ethylbenzenea
Reported amounts released in pounds per yearb
Total release Statec RFd Aire Waterf UIg Landh Otheri On-sitej Off-sitek On- and off-site AK 11 4,790 9 0 374 0 5,168 5 5,173 AL 37 249,191 560 0 228 349 249,751 577 250,328 AR 17 63,827 5 0 78 0 63,833 77 63,910 AZ 19 33,661 12 0 0 0 33,673 0 33,673 CA 99 91,863 11 500 1,733 1,407 92,331 3,184 95,515 CO 10 2,435 0 0 10 0 2,435 10 2,445 CT 12 4,504 1 0 10 729 4,505 739 5,244 DE 3 7,175 0 0 1 0 7,175 1 7,176 FL 39 104,231 8 0 5 268 104,239 273 104,512 GA 33 80,852 1 0 229 1,742 80,853 1,971 82,824 GU 2 2,436 0 0 0 255 2,436 255 2,691 HI 10 3,312 53 0 170 78 3,365 248 3,613 IA 25 72,532 0 0 3 0 72,535 0 72,535 ID 2 111 No data 0 0 0 111 0 111 IL 69 173,154 170 0 1,300 1,449 173,355 2,718 176,073 IN 75 265,514 571 0 109 1,098 266,095 1,197 267,292 KS 19 71,934 96 14 22,148 0 86,545 7,647 94,192 KY 39 147,354 24 0 33,281 20,709 147,411 53,957 201,368 LA 68 272,307 935 170 3,774 0 273,286 3,900 277,187 MA 18 6,917 28 0 2,251 2,078 9,194 2,080 11,274 MD 20 13,195 5 0 1 0 13,200 1 13,201 ME 5 1,841 3 0 0 124 1,844 124 1,968 MI 66 363,099 3 0 12,317 574 363,107 12,886 375,993 MN 22 73,380 13 0 141 10 73,393 151 73,544 MO 48 214,512 1 0 45 246 214,513 291 214,804 MP 3 255 0 0 5 5 260 5 265 MS 21 171,586 33 0 0 0 171,619 0 171,619 MT 6 5,406 4 0 86 0 5,414 82 5,496 NC 25 31,809 0 0 4 807 31,811 809 32,620 ND 2 5,000 0 0 1 0 5,001 0 5,001 NE 8 2,830 0 0 54 0 2,855 29 2,884 NH 4 410 1 0 0 0 410 0 410 NJ 41 37,281 230 0 2,010 8 38,247 1,282 39,529 NM 8 10,585 5 5 186 1,334 10,772 1,343 12,115 NV 4 2,821 No data 0 0 0 2,821 0 2,821 NY 51 37,634 11 0 20 1,693 37,645 1,713 39,358 OH 99 289,303 303 0 2,618 701 290,754 2,171 292,925 OK 18 72,700 9 20 270 262 72,977 284 73,261
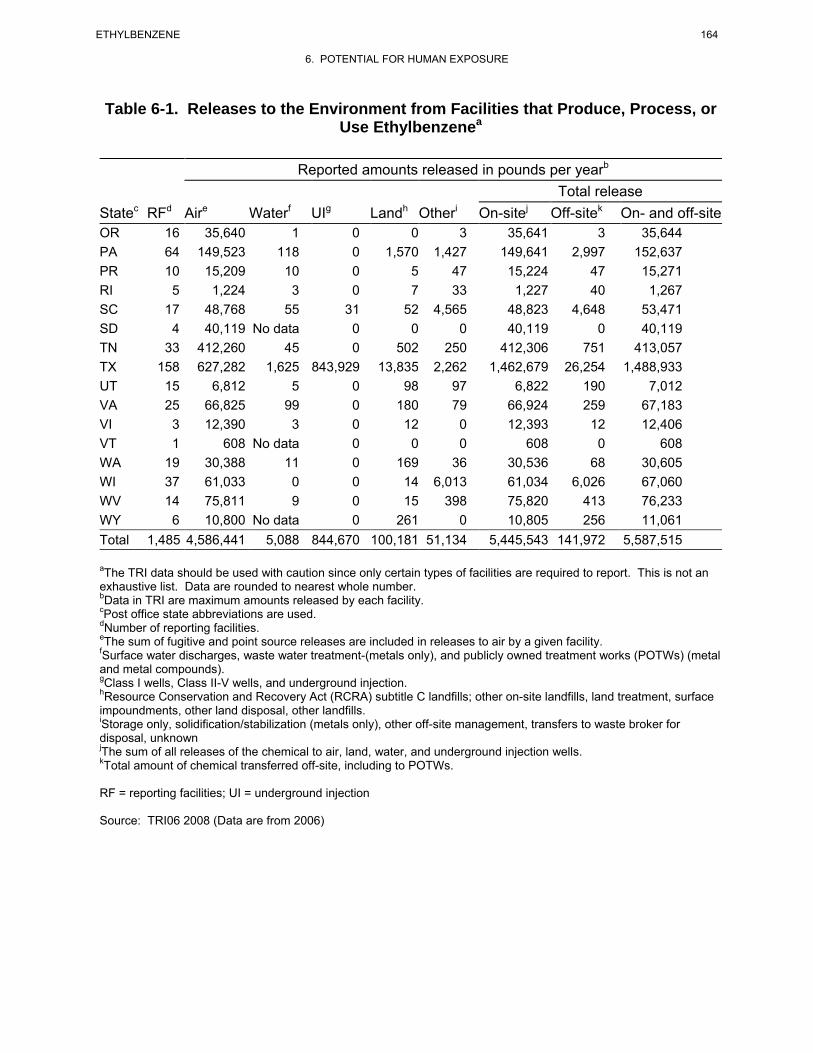
164 ETHYLBENZENE
6. POTENTIAL FOR HUMAN EXPOSURE
Table 6-1. Releases to the Environment from Facilities that Produce, Process, or Use Ethylbenzenea
Reported amounts released in pounds per yearb
Total release Statec RFd Aire Waterf UIg Landh Otheri On-sitej Off-sitek On- and off-site OR 16 35,640 1 0 0 3 35,641 3 35,644 PA 64 149,523 118 0 1,570 1,427 149,641 2,997 152,637 PR 10 15,209 10 0 5 47 15,224 47 15,271 RI 5 1,224 3 0 7 33 1,227 40 1,267 SC 17 48,768 55 31 52 4,565 48,823 4,648 53,471 SD 4 40,119 No data 0 0 0 40,119 0 40,119 TN 33 412,260 45 0 502 250 412,306 751 413,057 TX 158 627,282 1,625 843,929 13,835 2,262 1,462,679 26,254 1,488,933 UT 15 6,812 5 0 98 97 6,822 190 7,012 VA 25 66,825 99 0 180 79 66,924 259 67,183 VI 3 12,390 3 0 12 0 12,393 12 12,406 VT 1 608 No data 0 0 0 608 0 608 WA 19 30,388 11 0 169 36 30,536 68 30,605 WI 37 61,033 0 0 14 6,013 61,034 6,026 67,060 WV 14 75,811 9 0 15 398 75,820 413 76,233 WY 6 10,800 No data 0 261 0 10,805 256 11,061 Total 1,485 4,586,441 5,088 844,670 100,181 51,134 5,445,543 141,972 5,587,515
aThe TRI data should be used with caution since only certain types of facilities are required to report. This is not an exhaustive list. Data are rounded to nearest whole number. bData in TRI are maximum amounts released by each facility. cPost office state abbreviations are used. dNumber of reporting facilities.eThe sum of fugitive and point source releases are included in releases to air by a given facility. fSurface water discharges, waste water treatment-(metals only), and publicly owned treatment works (POTWs) (metal and metal compounds). gClass I wells, Class II-V wells, and underground injection.hResource Conservation and Recovery Act (RCRA) subtitle C landfills; other on-site landfills, land treatment, surface impoundments, other land disposal, other landfills.iStorage only, solidification/stabilization (metals only), other off-site management, transfers to waste broker for disposal, unknownjThe sum of all releases of the chemical to air, land, water, and underground injection wells.kTotal amount of chemical transferred off-site, including to POTWs.
RF = reporting facilities; UI = underground injection
Source: TRI06 2008 (Data are from 2006)
165 ETHYLBENZENE
6. POTENTIAL FOR HUMAN EXPOSURE
1983). Exposures to ethylbenzene can also occur while individuals are traveling in the passenger
compartment of automobiles, and the chemical has been found at much higher concentrations during
automobile engine malfunctions (Lawryk and Weisel 1996; Lawryk et al. 1995). Starting gasoline-
powered vehicles in attached garages can contribute to increased indoor ethylbenzene exposure (Dodson
et al. 2008). Emissions from gasoline-powered vehicles were found to be somewhat higher than from
diesel trucks (Hampton et al. 1983). Similarly, ethylbenzene has been measured in jet fuel emissions
(Katzman and Libby 1975) and has been reported in waste incinerator stack emissions (Jay and Steiglitz
1995; Junk and Ford 1980). Ethylbenzene has also been shown to be released into the atmosphere from
volatile organic compound (VOC)-laden waste water in municipal sewer systems (Quigley and Corsi
1995).
Emissions of ethylbenzene can arise from transport of hot asphalt from a manufacturing plant to a paving
site and from subsequent road paving operations. Kitto et al. (1997) measured the emissions of volatile
organic compounds from Type I and Type II hot asphalts. At 150 °C, the concentration of the ethyl-
benzene emissions from Type I asphalt was 800 μg/m3; at 200 °C, the concentration was 2,200 μg/m3, an
increase by a factor of 2.8. At 150 °C, the concentration of the ethylbenzene emissions from Type II
asphalt was 7,000 μg/m3; at 200 °C, the concentration was 21,000 μg/m3, an increase by a factor of 3.
Mukund et al. (1996) conducted chemical mass balance source apportionment modeling on a data set of
142 3-hour integrated air samples collected at six different sites in three separate campaigns during the
summer of 1989 in Columbus, Ohio. The contributions (± standard error) to the observed atmospheric
levels of ethylbenzene from the sources considered, expressed as percentage of measured average
concentration, were: 55±11 from vehicle exhaust; 0.7±0.2 from gasoline vapor; 0±3 from natural gas;
20±4 from industrial solvents; and 0±1 from the dry cleaning/degreasing/waste water composite source.
These five sources contributed an estimated 76±12% of the measured average concentration of 1.1 μg/m3.
Ethylbenzene releases to the air especially in indoor environments can occur with the use of consumer
products such as pesticides, liquid process photocopiers and plotters, solvents, carpet glue, paints,
varnishes, automotive products, adhesives, and fabric and leather treatments that contain ethylbenzene
(Hodgson et al. 1991; Lillo et al. 1990; NAS 1980; Otson et al. 1994; Sack et al. 1992; Wallace et al.
1987b). Indoor exposure to ethylbenzene may also result from the start-up of gasoline-powered engines
in attached garages (Dodson et al. 2008). Ethylbenzene (in addition to other aromatic hydrocarbons, such
as benzene, styrene, and xylenes) has also been measured in cigarette smoke (Barrefors and Petersson
1993; Wallace et al. 1986, 1987c). An analysis of indoor air in a home using gasoline-contaminated tap
166 ETHYLBENZENE
6. POTENTIAL FOR HUMAN EXPOSURE
water found that exposures to ethylbenzene could occur via inhalation during showering and other
household activities (Beavers et al. 1996). Ethylbenzene concentrations in the shower area were often
one to two orders of magnitude higher than in other areas of the home. Ethylbenzene has been identified
in air samples collected at 121 of the 829 NPL hazardous waste sites respectively, where it was detected
in some environmental media (HazDat 2007).
6.2.2 Water
Estimated releases of 5,088 pounds (~2.3 metric tons) of ethylbenzene to surface water from
1,485 domestic manufacturing and processing facilities in 2006, accounted for <1% of the estimated total
environmental releases from facilities required to report to the TRI (TRI06 2008). An additional
141,972 pounds (~64.4 metric tons) were transferred off-site or released to publicly owned treatment
works (POTWs) (TRI06 2008). These releases are summarized in Table 6-1.
Releases to water can occur as a result of industrial discharges (Snider and Manning 1982), fuel spillage
(Gschwend et al. 1982; Tester and Harker 1981), leaking petroleum pipelines or underground storage
tanks (Cotruvo 1985), landfill leachate (Barker 1987; Beavers et al. 1996; Chen and Zoltek 1995;
Hallbourg et al. 1992), and the inappropriate disposal of wastes containing ethylbenzene (Eiceman et al.
1986). Ethylbenzene has been detected in both surface water and groundwater (EPA 2007i; Jin et al.
2007). Ethylbenzene emissions to oceans occur as a result of offshore oil production, hydrocarbon
venting, oil field brines, and tanker oil spills (Sauer et al. 1978). Sauer and Tyler (1995) reported that
ethylbenzene was one of the most commonly detected VOCs in motor vehicle waste fluids released from
routine vehicle maintenance shops entering catch basins and septic tanks in Wisconsin. Ethylbenzene
was detected at a mean concentration of 11 ppb (range 3–98 ppb) in catch basin waste water, 1.5 ppb
(range 7–23 ppb) in septic tank effluent, and 8 ppb (range 9–53 ppb) in septic tank sludge.
Ethylbenzene has been identified in surface water at 123 sites and groundwater collected at 557 of the
829 NPL hazardous waste sites respectively, where it was detected in some environmental media (HazDat
2007).
6.2.3 Soil
Estimated releases of 100,181 pounds (~45.4 metric tons) of ethylbenzene to soils from 1,485 domestic
manufacturing and processing facilities in 2006, accounted for about 2% of the estimated total
environmental releases from facilities required to report to the TRI (TRI06 2008). An additional
167 ETHYLBENZENE
6. POTENTIAL FOR HUMAN EXPOSURE
844,670 pounds (~383.2 metric tons), constituting about 15% of the total environmental emissions, were
released via underground injection (TRI06 2008). These releases are summarized in Table 6-1.
Ethylbenzene can be released to soils through the spilling of gasoline and other fuels (Sauer and Tyler
1995; Tester and Harker 1981); through the disposal of solvents and household products such as paint,
cleaning and degreasing solvents, varnishes, and pesticides; through emissions from leaking underground
or aboveground storage tanks, well pumping units, or pipelines(Cotruvo 1985; Soukup et al. 2007); and
leaching from landfills or contaminated industrial sites (Barker 1987; Soukup et al. 2007).
Ethylbenzene has been identified in soil and sediment samples collected at 469 and 144 of the 829 NPL
hazardous waste sites respectively, where it was detected in some environmental media (HazDat 2007).
6.3 ENVIRONMENTAL FATE 6.3.1 Transport and Partitioning
The large vapor pressure and Henry’s law constant of ethylbenzene (Table 4-2) suggests a moderate to
strong tendency for ethylbenzene to partition into the atmosphere where it will exist predominantly in the
vapor phase (Eisenreich et al. 1981; Mackay 1979; Masten et al. 1994). Depending upon site-specific
conditions, releases to surface soil can result in substantial losses to the atmosphere in addition to
subsurface infiltration. Since it has a moderately high vapor pressure, ethylbenzene will evaporate fairly
rapidly from dry soil. Vapor phase transport will occur from subsurface releases (i.e., from leaking
underground storage tanks) and during migration through unsaturated soil pore spaces (Rhue et al. 1988).
Atmospheric reaction with hydroxyl radicals can limit the atmospheric transport of ethylbenzene (Dewulf
and van Langenhove 1997).
The large Henry's law constant (Table 4-2), which measures partitioning between water and air, indicates
that a significant proportion of ethylbenzene will partition from water into air (Mackay 1979; Masten et
al. 1994). Ethylbenzene dissolved in surface water, soil pore water, or groundwater will thus migrate into
an available atmospheric compartment until its saturated vapor concentration is reached. The
volatilization half-life of ethylbenzene in a constructed wetland (length=228 m, width=60 m, depth=0.5–
1.5 m) located in Phoenix, Arizona ranged from approximately 40 to 200 hours (Keefe et al. 2004).
Based on log Koc values in the range of 2.2–2.4 (Table 4-2) and using the classification scheme of Swann
et al. (1983), ethylbenzene is classified as having moderate mobility in soils. Sorption and retardation by
168 ETHYLBENZENE
6. POTENTIAL FOR HUMAN EXPOSURE
soil organic carbon content will occur to a moderate extent, but sorption is not significant enough to
completely prevent migration in most soils. Particularly in soils with low organic carbon content,
ethylbenzene will tend to leach into groundwater. Mobility is also possible in aquifers that contain very
little solid-phase organic matter, a condition common to sand and gravel aquifers (Ptacek et al. 1984).
Sorption and desorption experiments performed by Dewulf et al. (1996) demonstrated that the sorption
process of ethylbenzene on marine sediments is reversible and that the sorption is even lower than
expected from the log Kow data and the organic carbon content of the sediment. They concluded that the
marine sediment compartment is not an important sink for the VOCs investigated when they are released
to water.
When ethylbenzene is part of a complex mixture of hydrocarbons associated with a petroleum spill or
leak, the proportion of ethylbenzene that will bind to soil versus the amount that will migrate toward
groundwater depends primarily on the type of soil, the biological environment in the soil, the particular
petroleum product in which the ethylbenzene is dissolved, the size of the spill, and the amount of rainfall
(Stokman 1987; Soukup et al. 2007). For example, the solubility of ethylbenzene varies in accordance
with the presence of other petroleum products (Ptacek et al. 1984). While the pure compound solubility
of ethylbenzene in water is 180 mg/L, its solubility in water equilibrated with JP-jet fuel is 10.6 mg/L
(Burris and MacIntyre 1984). Potter (1993) also reported that the equilibrium aqueous solubility of
ethylbenzene was 2.4 mg/L with gasoline, 0.18 mg/L with diesel fuel, and 0.007 mg/L with #6 fuel oil
equilibrated with groundwater. Both of these authors calculated the solubility concentrations of
ethylbenzene in water equilibrated with various petroleum products. In addition, solvent spills of
chemicals such as ethylbenzene may enhance the mobility of other organic chemicals, which do strongly
adsorb to soil (Rao et al. 1985). No information was found concerning bioavailability of ethylbenzene
from soil for human dermal or oral uptake.
Boyd et al. (1990) reported that corn residues high in organic matter that were left on the surface of a no
tillage field, adsorbed a significantly greater amount of ethylbenzene as compared with surface soil. The
authors suggested that the highly lipophilic plant cuticle appears to be the sorptive component. Kango
and Quinn (1989) also reported that humic acid adsorbed higher amounts of ethylbenzene and xylenes
ranging from 40 to 77 times greater than soil.
Once in the atmosphere, ethylbenzene will be transported until it is removed by physical or chemical
processes. Physical removal processes, which involve partitioning into clouds or rainwater, are relevant
to ethylbenzene, which has been measured in Los Angeles rainwater (Kawamura and Kaplan 1983). The
169 ETHYLBENZENE
6. POTENTIAL FOR HUMAN EXPOSURE
concentrations of several dissolved organic chemicals in rainwater and in the atmosphere during rainfall
events were measured by Ligocki et al. (1985). The authors found that the concentration of ethylbenzene
in rain water was approximately equal to the inverse of the dimensionless Henry's law constant
(Table 4-2) at atmospheric temperatures. This indicates that ethylbenzene is removed from the
atmosphere through precipitation, but it can re-enter the atmospheric environment upon evaporation.
In comparison to chemicals such as polychlorinated biphenyls (PCBs), DDT, and other chlorinated
pesticides, which are of great concern with respect to bioaccumulation, ethylbenzene does not
significantly bioaccumulate in aquatic food chains. A measured bioconcentration factor (BCF) of 15 was
reported for ethylbenzene in goldfish (Ogata et al. 1984). A BCF value of 53 was estimated in fish, using
a log Kow of 3.15 and a regression derived equation (Meylan et al. 1999). A 3% weighted average lipid
content in fish and shellfish was assumed by EPA in the calculation. The calculated BCF is a theoretical
value based on known constants, and is a conservative estimate of the bioconcentration of this chemical in
fish. A calculated BCF of 167 was also estimated for fathead minnows (Pimephales promelas) (ASTER
1995). In a shellfish study, the ethylbenzene concentration in clam tissue was 5 times higher than that
measured in water after an 8-day continuous-flow exposure to the water-soluble fraction of Cook Inlet
crude oil (Nunes and Benville 1979).
Ethylbenzene has also been found to partition into human tissues; primarily as a result of inhalation
exposures (see Section 6.5). Ethylbenzene has been detected in human adipose tissue (Sections 3.4.2.1
and 3.8.1), blood (Section 3.4.1.1), and in breast milk (Section 3.7). No information was located
concerning the bioavailability of ethylbenzene from contaminated soil or sediment either with respect to
dermal exposure or oral intake via consumption of soil particles from unwashed hands.
6.3.2 Transformation and Degradation 6.3.2.1 Air
Ethylbenzene undergoes atmospheric transformations through reaction with photochemically generated
hydroxyl radicals (Atkinson et al. 1978; Ohta and Ohyama 1985; Ravishankara et al. 1978), NO3 radicals
(Atkinson et al. 1987), and atomic oxygen (Grovenstein and Mosher 1970; Herron and Huie 1973). Gas
phase reactions with ozone and structurally similar molecules such as toluene have been observed
(Atkinson and Carter 1984). The predominant degradation pathway for ethylbenzene in the atmosphere
occurs via reaction with hydroxyl radicals and nitrate radicals (which are only present during non daylight
hours), with the other degradation mechanisms being of only minor importance. The rate constant for the
170 ETHYLBENZENE
6. POTENTIAL FOR HUMAN EXPOSURE
vapor phase reaction of ethylbenzene with photochemically generated hydroxyl radicals was measured as
7.1x10⁻¹² cm3 per molecule-second (Kwok and Atkinson 1994). This corresponds to an atmospheric half-
life of approximately 2 days using a hydroxyl radical concentration of 5x10⁵ hydroxyl radicals per cm3.
The rate constant for the degradation of ethylbenzene with nitrate radicals was measured as 6x10-16 cm3
per molecule-second (Atkinson et al. 1987). Using a nighttime nitrate radical concentration of
5x10⁸ nitrate radicals per cm3, a half-life of approximately 26 days is estimated. Atmospheric degradation
occurs more rapidly during summer months as opposed to winter since the concentration of hydroxyl
radicals in the atmosphere peaks during summer (Ravishankara et al. 1978; Singh et al. 1981), and is also
faster under photochemical smog conditions (Dilling et al. 1976). Oxidation by-products from the
reaction with hydroxyl radicals and nitrogen oxides include ethylphenols, benzaldehyde, acetophenone,
and m- and p-nitroethylbenzene (Hoshino et al. 1978). The major degradation pathways for ethylbenzene
in the atmosphere are summarized in Figure 6-2.
Experiments conducted with various hydrocarbons on the formation of photochemical aerosols or the
haze associated with smog revealed that aromatics such as ethylbenzene produced only low yields of
aerosol when compared with more reactive compounds such as alkenes (O'Brien et al. 1975). The
formation of PAN is related to the photoreactivity of the reacting hydrocarbon. The photoreactivity of
ethylbenzene is intermediate relative to other atmospheric hydrocarbons, and it is less reactive than
gasoline, toluene, and alkenes such as propene (Yanagihara et al. 1977).
6.3.2.2 Water
In surface water, transformations of ethylbenzene may occur through two primary processes—
photooxidation and biodegradation. Since ethylbenzene does not contain hydrolysable functional groups
at environmental pH (pH 5–9), hydrolysis is not considered an important environmental fate process.
Although ethylbenzene does not absorb light in the environmental ultraviolet spectrum, it is capable of
undergoing photooxidation in water through an indirect reaction with other light-absorbing molecules, a
process known as sensitized photolysis. The compounds 1-methylphenyl ketone (acetophenone),
1-phenylethanol, and benzaldehyde were identified as degradation products from the laboratory
photooxidation of ethylbenzene in both distilled water and seawater with anthraquinone used as a
sensitizer (Ehrhardt and Petrick 1984). In the environment, similar degradation is expected to occur in the
presence of ubiquitous, naturally occurring humic material sensitizers. The major degradation pathways
for ethylbenzene in water are summarized in Figure 6-3.
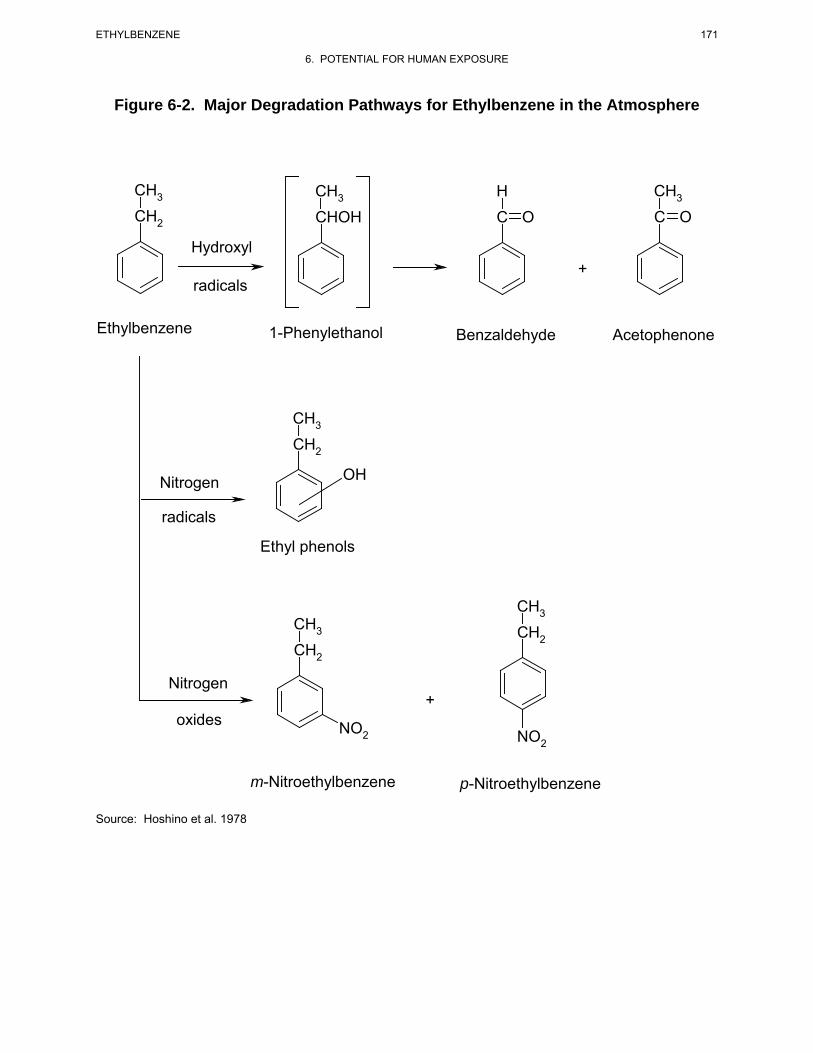
Figure 6-2. Major Degradation Pathways for Ethylbenzene in the Atmosphere
CH3 CH3 H CH3
CH2 CHOH C O C O
Hydroxyl +
radicals
Ethylbenzene 1-Phenylethanol Benzaldehyde Acetophenone
CH3
CH2
OHNitrogen
radicals
Ethyl phenols
CH3 CH3 CH2 CH2
Nitrogen +
oxides NO2 NO2
m-Nitroethylbenzene p-Nitroethylbenzene Source: Hoshino et al. 1978
171 ETHYLBENZENE
6. POTENTIAL FOR HUMAN EXPOSURE
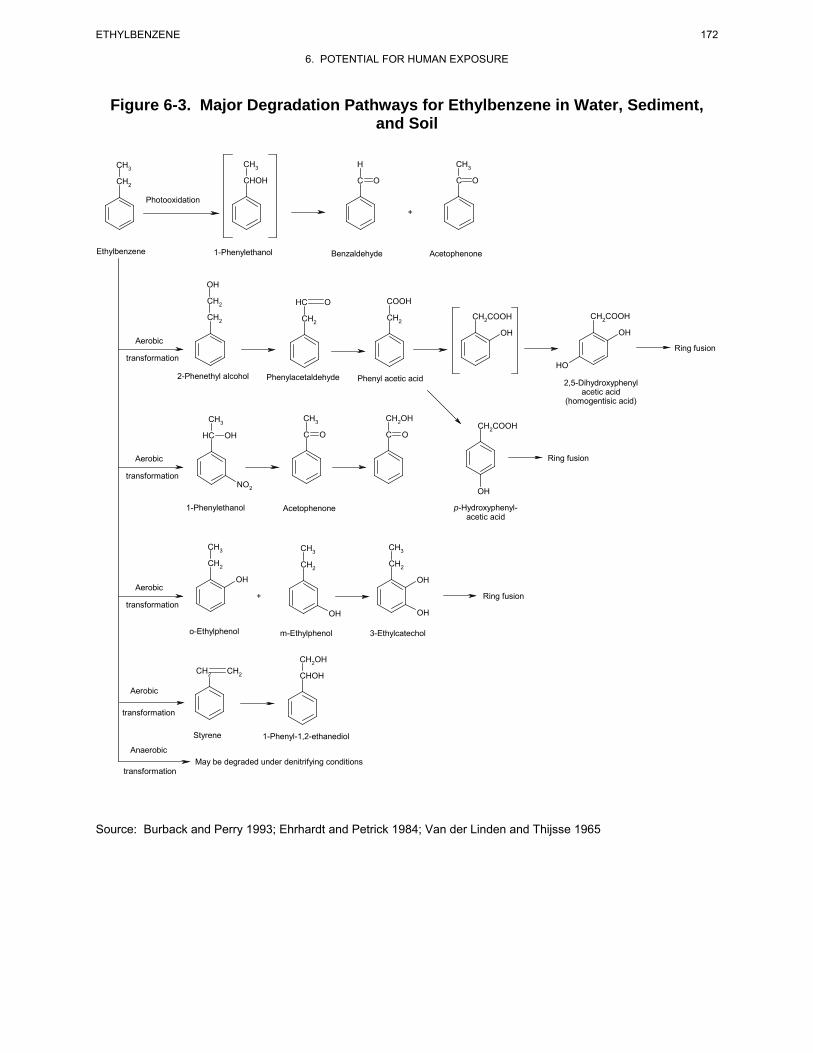
Figure 6-3. Major Degradation Pathways for Ethylbenzene in Water, Sediment, and Soil
CH3 CH3 H CH3
CH2 CHOH C O C O
Photooxidation +
Ethylbenzene 1-Phenylethanol Benzaldehyde Acetophenone
OH
CH2 HC O COOH
CH C C2 CH H2COOH H2COOH
2 CH2
OH OH Aerobic
Ring fusion transformation
HO
2-Phenethyl alcohol Phenylacetaldehyde Phenyl acetic acid o-Hydroxyphenol- 2,5-Dihydroxyphenyl acetic acid acetic acid
(homogentisic acid)
CH3 CH3 CH2OH CH2COOH
HC OH C O C O
Aerobic Ring fusion
transformation NO2 OH
1-Phenylethanol Acetophenone p-Hydroxyphenylacetic acid
CH3 CH3 CH3
CH2 CH2 CH2
OH OH Aerobic
+ Ring fusion transformation
OH OH
o-Ethylphenol m-Ethylphenol 3-Ethylcatechol
CH2OH CH2 CH2 CHOH
Aerobic
transformation
Styrene 1-Phenyl-1,2-ethanediol Anaerobic
May be degraded under denitrifying conditions transformation
Source: Burback and Perry 1993; Ehrhardt and Petrick 1984; Van der Linden and Thijsse 1965
172 ETHYLBENZENE
6. POTENTIAL FOR HUMAN EXPOSURE
173 ETHYLBENZENE
6. POTENTIAL FOR HUMAN EXPOSURE
Biodegradation in aerobic surface water will compete with sensitized photolysis and transport processes
such as volatilization. Volatilization and biodegradation of ethylbenzene in seawater have been observed
by Gschwend et al. (1982), Masten et al. (1994), and Wakeham et al. (1983). Migration from surface
water to subsurface soil with low amounts of oxygen or to aquifers with lower microbial populations,
however, will limit the rate of transformation. No significant disappearance of ethylbenzene during
11 weeks of incubation with bacteria under low oxygen (anoxic) conditions was observed by Bouwer and
McCarty (1983). Slow degradation of ethylbenzene was reported in anaerobic aquifer materials known to
support methanogenesis, although a long acclimation period or lag time was required (Wilson et al. 1986).
Less than 1% of the initial concentration of ethylbenzene remained after 120 weeks, indicating that, given
sufficient time, ethylbenzene will be essentially completely biodegraded.
Laboratory microcosm tests were conducted to determine optimum conditions for ethylbenzene bio-
degradation by aquifer microorganisms under denitrifying condition (Hutchins 1991). Ethylbenzene was
degraded to <5 μg/L when present as a sole source substrate and stoichiometric calculations indicated that
nitrate removal was sufficient to account for 70–80% of the compound being mineralized. Bio-
degradation did not occur without the presence of nitrate, and nitrate removal was minimal without the
presence of the ethylbenzene over a 55-day incubation period. In a laboratory microcosm containing
aquifer material and groundwater from the North Bay site in Ontario, Canada, no significant loss of ethyl-
benzene was observed compared to unamended controls over a period of 187 days. In another experiment
conducted at the North Bay site that used in situ biodegradation columns, ethylbenzene was completely
degraded in at least 1 of the 8 in situ columns in <100 days (Acton and Barker 1992). In all cases, the
authors attributed the ethylbenzene attenuation to biodegradation by methanogenic and fermentative
bacteria. In another study using a laboratory scale flow-through aquifer column system, low dissolved
oxygen (<1 mg/L) conditions were initiated with the nitrate-amended column influent in order to mimic
contaminated groundwater conditions distal from a nutrient injection well (Anid et al. 1993). The authors
reported that 40% of the ethylbenzene was removed after several months of operation. In a similar study,
using batch incubations seeded with four different aquifer materials, ethylbenzene was not degraded
within 4 months in any of the denitrifying enrichments tested, even though nitrate reduction occurred.
Burback and Perry (1993) reported than Mycobacterium vaccae can catabolize a number of major
groundwater pollutants, including ethylbenzene. At a concentration of 100 ppm, ethylbenzene was not
measurably degraded; however, at 50 ppm, 80% of the added ethylbenzene was degraded. A product
peak of 4-ethylphenol was detected as well as a small amount of 1-phenylethanol.
174 ETHYLBENZENE
6. POTENTIAL FOR HUMAN EXPOSURE
The contrast between biodegradation rates in the presence or absence of oxygen was demonstrated by a
biofilm reactor study designed to simulate an aquifer (Bouwer and McCarty 1984). Continuous-flow
laboratory column studies under aerobic and methanogenic conditions were performed with mixed
bacterial cultures on glass beads. In the aerobic biofilm column, 99% of the ethylbenzene initially present
was degraded within a 20-minute detention time, while under methanogenic (anaerobic) conditions, only
7% was degraded within a 2-day detention time.
6.3.2.3 Sediment and Soil
Biodegradation of ethylbenzene by aerobic soil microbes has been reported by various researchers. The
common soil microorganism Pseudomonas putida is able to utilize ethylbenzene as a sole source of
carbon and energy (Fukuda et al. 1989; Gibson et al. 1973). In some instances, co-oxidation or co-
metabolism was observed (i.e., ethylbenzene was degraded by Nocardia sp. in the presence of other
compounds that are more readily metabolized by the microorganism) (Jamison et al. 1970;
Van der Linden and Thijsse 1965). Yadav and Reddy (1993) reported that the white-rot fungus
Phanerochaete chrysosporium efficiently degraded ethylbenzene as well as other benzene, toluene, ethyl-
benzene, and xylenes (BTEX) compounds when these chemicals were added either individually or as a
composite mixture. In addition, substantially greater degradation of all the BTEX compounds was
observed in static rather than in shaken liquid cultures. Furthermore, degradation was greater at 25 °C
than at 37 °C, but pH variations between 4.5 and 7 had little effect on the extent of the degradation. Chen
and Taylor (1995) reported that two thermophilic bacterial strains, Thermus aquaticus and an unidentified
Thermus sp. degraded ethylbenzene (in a mixture with other BTEX chemicals) by 18% after 45 days of
incubation at 70 °C and by 32% after 45 days of incubation at 60 °C, respectively. Zappi et al. (1996)
reported that ethylbenzene degraded rapidly in a pilot scale bioslurry reactor under aerobic conditions.
The initial concentration (0.35 mg/kg) was degraded by 94% in 2 days.
Biotic transformations by aerobic soil microbes involve oxidation of the ethyl side chain to form pheny-
lacetic acid (Van der Linden and Thijsse 1965) and 1-phenylethanol (Bestetti and Galli 1984); ring
hydroxylation to form 2,3-dihydroxy-1-ethylbenzene (Gibson et al. 1973), 2-hydroxyphenlacetic acid,
4-hydroxyphenylacetic acid, and 2,5- and 3,4-dihydroxyphenylacetic acid (Van der Linden and Thijsse
1965); and ultimate ring cleavage to form straight chain carboxylic acids such as fumaric and acetoacetic
acids (Van der Linden and Thijsse 1965). The major degradation pathways for ethylbenzene are
summarized in Figure 6-3.
175 ETHYLBENZENE
6. POTENTIAL FOR HUMAN EXPOSURE
Anaerobic degradation of ethylbenzene based on observations from studies conducted under anaerobic
conditions in other media and as discussed above (Bouwer and McCarty 1983, 1984; Wilson et al. 1986),
would be much slower than that observed under aerobic conditions. Ramanand et al. (1995) studied the
biodegradation of several organic pollutants including ethylbenzene in soil columns under denitrifying
conditions. These authors reported that one of the significant factors governing biodegradation is the
availability of suitable electron acceptors. The biodegradation of ethylbenzene, toluene, and xylenes has
been demonstrated in laboratory samples obtained from subsurface habitats or in pure cultures under
dinitrifying conditions (Hutchins 1991; Hutchins et al. 1991). Ramanand et al. (1995) reported that soil
column bacteria, after sufficient acclimation time, metabolized 100–500 μM of toluene and ethylbenzene
in <6 days under denitrifying conditions. These compounds were successfully degraded under anoxic
conditions by the addition of nitrate and by stimulating the indigenous soil denitrifying bacteria.
The kinetics of biodegradation appear to be site specific, and depend upon factors such as the type and
population of microbes present, the environmental temperature, the concentration of ethylbenzene, the
presence of other compounds that may act as a substrate, and the amount of oxygen and electron
acceptors present. Biodegradation in soil will also compete with migration processes such as
volatilization and infiltration to groundwater.
6.4 LEVELS MONITORED OR ESTIMATED IN THE ENVIRONMENT
Reliable evaluation of the potential for human exposure to ethylbenzene depends in part on the reliability
of supporting analytical data from environmental samples and biological specimens. Concentrations of
ethylbenzene in unpolluted atmospheres and in pristine surface waters are often so low as to be near the
limits of current analytical methods. In reviewing data on ethylbenzene levels monitored or estimated in
the environment, it should also be noted that the amount of chemical identified analytically is not
necessarily equivalent to the amount that is bioavailable. The analytical methods available for monitoring
ethylbenzene in a variety of environmental media are detailed in Chapter 7.
6.4.1 Air
Ambient air levels of volatile organic compounds, including ethylbenzene, were monitored as a part of a
multi-media study known as the Lower Rio Grande Valley Environmental Scoping Study. Monitoring
was performed at a “central” site and at a “border” site in the Brownsville, Texas, air shed in the spring
and summer of 1993. The median ambient concentration of ethylbenzene at the central site was
0.80 μg/m3 (0.18 ppbv) (n=22; range=0.20–1.7 μg/m3 [0.046–0.39 ppbv]) in the spring and 0.4 μg/m3
176 ETHYLBENZENE
6. POTENTIAL FOR HUMAN EXPOSURE
(0.09 ppb) (n=14; range=0.2–1.0 μg/m3 [0.04–0.2 ppbv]) in the summer. These concentrations are either
lower or comparable to those found in previous EPA and other monitoring investigations (Ellenson et al.
1997). The median indoor concentration of ethylbenzene for nine Rio Grande Valley residences
measured in the spring was 1.00 μg/m3 (0.230 ppbv) compared to a median outdoor concentration of
0.70 μg/m3 (0.16 ppbv); in the summer, the median indoor concentration of ethylbenzene for five
residences was 1.40 μg/m3 (0.321 ppbv) compared to a median outdoor concentration of 0.35 μg/m3
(0.080 ppbv) (Mukerjee et al. 1997). The mean indoor concentration of ethylbenzene at the homes of
46 high school students residing in New York City was 3.57 μg/m3 (0.821 ppbv) in the winter months as
compared to a mean indoor concentration of 1.99 μg/m3 (0.458 ppbv) during the summer months (Kinney
et al. 2002). The corresponding mean outdoor levels of ethylbenzene were 1.27 (0.292 ppbv) and
1.88 μg/m3 (0.432 ppbv) in the winter and summer months, respectively.
An update of the 1980 National Ambient Volatile Organic Compounds (VOC) database prepared for EPA
summarized concentrations of ethylbenzene by site type (EPA 1988c). Median values are reported
because they are less biased by a few high or low concentrations and, thus, may better represent the data
than would average values. The median indoor concentration of ethylbenzene detected at 95 locations
was 1.0 ppbv (4.4 μg/m3) (mean 2.9 ppbv), while personal air monitoring of 1,650 individuals found a
median concentration of 1.3 ppbv (5.6 μg/m3) (mean 3.2 ppbv).
Of particular interest is that personal air monitoring of indoor air found higher concentrations of ethyl-
benzene than those observed in outdoor air. This was also observed during the Total Exposure
Assessment Methodology (TEAM) Study conducted by EPA between 1979 and 1985 in an effort to
measure exposures to 20 VOCs in personal air, outdoor air, and drinking water. The major cause for the
higher personal air concentrations was felt to be the presence of ethylbenzene sources in the home. In the
TEAM study, tobacco smoke was reported to be a main source of exposure to volatile aromatic
compounds such as ethylbenzene (Wallace et al. 1987a, 1987c). Based on the results of a stepwise
regression carried out on data collected during the fall in New Jersey from 352 participants, overnight
geometric mean ethylbenzene exposures of persons living in homes with smokers were approximately
1.5 times the geometric mean exposures of persons living in homes without smokers. The amount of
ethylbenzene measured in mainstream smoke of a single cigarette containing 16 mg of tar and nicotine
was 8 μg (Wallace et al. 1987c). Wallace et al. (1989) reported that a maximum outdoor air concentration
of ethylbenzene of 7.4 μg/m3 (1.7 ppbv) was detected in nine outdoor samples collected at each of three
houses while maximum indoor air concentrations at these same residences ranged from 5 to 110 μg/m3
177 ETHYLBENZENE
6. POTENTIAL FOR HUMAN EXPOSURE
(1–25.3 ppbv). Mean personal exposures averaged 28 μg/m3 (6.4 ppbv) (range 4.6–144 μg/m3 [1.0–
33.1 ppbv]) and the personal/outdoor ratio for ethylbenzene was 16.
The poor quality of indoor air has been linked to a number of symptoms (headache; nausea; irritation of
the eyes, mucous membranes, and respiratory system; drowsiness; fatigue; and general malaise) which
have been defined as "sick building" syndrome. Kostiainen (1995) identified over 200 VOCs in the
indoor air of 26 normal houses. Ethylbenzene was detected in 100% of the houses studied at an average
concentration of 3.2 μg/m3 [0.74 ppbv] (median 2.41 μg/m3 [0.554 ppbv], minimum 0.62 μg/m3
[0.14 ppbv], and maximum 10.54 μg/m3 [2.42 ppbv] concentration). The median concentration of ethyl-
benzene (2.41 μg/m3 [0.554 ppbv]) in these normal houses was lower in all but one case than ethyl-
benzene concentrations detected in houses with "sick building" syndrome where the concentrations
ranged from 2.25 to 747.24 μg/m3 (0.517–172 ppbv).
A nationwide study of indoor air concentration of 26 VOCs was conducted in Canada in 1991 (Fellin and
Otson 1994). These authors reported that mean indoor ethylbenzene concentrations were 6.46 μg/m3
(1.48 ppbv), 8.15 μg/m3 (1.87 ppbv), 4.35 μg/m3 (1.00 ppbv) , and 13.98 μg/m3 (3.21 ppbv) in the winter,
spring, summer and fall months, respectively and that the concentrations declined with an increase in
ambient air temperature. At ≤0, 0–15, and ≥15 °C, the mean ethylbenzene concentrations were
12.76 μg/m3 (2.93 ppbv), 7.78 μg/m3 (1.79 ppbv), and 6.46 μg/m3 (1.48 ppbv), respectively. These
authors concluded that indoor sources of ethylbenzene (primarily from household products) are likely to
have a more significant influence on indoor air concentrations than climatic variables.
Concentrations of ethylbenzene were measured in soil gas, and indoor and outdoor air of a home located
near a landfill in California (Hodgson et al. 1992). During the first sampling in September, ethylbenzene
concentrations were not detected in soil gas or outdoor air, but were detected at 0.6 ppbv (3 μg/m3) in
basement air. In October, ethylbenzene concentrations averaged 3.3 ppbv (14 μg/m3) in soil gas, 0.8 ppbv
(4 μg/m3) in basement air, and 0.7 ppbv (3 μg/m3) in bedroom air. In this study, the authors found that the
existence of soil gas contamination alone is not sufficient to result in significantly elevated indoor
exposures. The entry rate of ethylbenzene and VOCs form the soil into the house was low. The limited
entry that occurred at the conditions of the study was apparently the result of diffusive and advective flux
of VOC through the cement blocks used in the basement wall construction. The authors suggest that there
is a general need to identify variables associated with residential sites with the highest potential for
significantly elevated indoor exposures resulting from soil gas contamination.
178 ETHYLBENZENE
6. POTENTIAL FOR HUMAN EXPOSURE
Indoor VOC concentrations were analyzed in 12 California office buildings as part of the California
Healthy Building Study (Daisey et al. 1994). These authors reported that ethylbenzene was detected at a
geometric mean of 0.50 μg/m3 (0.11 ppbv) (range 0.27–0.98 μg/m3 [0.062–0.22 ppbv]). These authors
also reported that an estimated 82% of indoor air concentrations were contributed from motor vehicle
emissions. Hodgson et al. (1991) reported that concentrations of ethylbenzene in indoor air of a new
office building ranged from 7 to 18.7 μg/m3 (2–4.30 ppbv) over the course of a 14-month sampling
period. Furthermore, ethylbenzene indoor air concentrations were higher than those in outdoor air and
that the dominant source of VOCs in the building was liquid-process photocopiers and plotters which
emitted a characteristic mixture of C10–C11 isoparaffinic hydrocarbons.
VOC concentrations were monitored both indoors and outdoors, including garages, basements, and
common spaces, for 55 Boston area residences as part of the Boston Exposure Assessment in
Microenvironmental (BEAM) study. Indoor and outdoor arithmetic mean ethylbenzene concentrations of
2.4 and 0.42 μg/m3, respectively, were reported. Arithmetic mean ethylbenzene concentrations in
garages, basements, and common hallways were 35, 4.1, and 2.1 μg/m3, respectively. VOC
concentrations also varied seasonally, tending to be higher in summer than winter (arithmetic mean
ethylbenzene concentrations of 0.06 and 0.04 μg/m3, respectively). Attached garages attributed to
approximately 20–40% of gasoline-associated indoor VOC concentrations, while basements contributed
approximately 10–20% and common hallways contributed 5–10% of indoor concentrations (Dodson et al.
2008).
Wadden et al. (1995) reported average VOC concentrations for indoor air monitored in a sheetfed offset
printing shop. These authors reported mean ethylbenzene concentrations ranging from 0.27 to
0.84 mg/m3 (0.062–0.19 ppmv) based on 12 1-hour samples.
Levels of ethylbenzene monitored in ambient air show great variation (Jonsson et al. 1985). Generally,
air concentrations are much lower in rural areas than in urban areas, where vehicle emissions are thought
to be a major contributor of ethylbenzene to ambient air. Ethylbenzene concentrations range from below
detection limits in rural areas to 100 μg/m3 (23.0 ppbv) on busy urban streets (Jonsson et al. 1985). Kelly
et al. (1994) reported a median concentration of ethylbenzene of 1.1 μg/m3 (0.25 ppbv) for 8,723 samples
collected from 93 locations throughout the United States.
Ambient air concentrations reported for Deer Park, Texas suggest a correlation between high traffic areas
and VOC concentrations. The mean ethylbenzene concentration for 12 sites was 0.51 μg/m3 (0.12 ppbv).
179 ETHYLBENZENE
6. POTENTIAL FOR HUMAN EXPOSURE
High correlations between toluene, ethylbenzene, and xylenes suggest petroleum-related sources (Smith
et al. 2008).
Median outdoor air concentrations of ethylbenzene for 6 remote and 122 rural locations are reported as
0.156 and 0.013 ppbv (0.679 and 0.056 μg/m3), respectively (EPA 1988c). Median concentrations of
0.62 ppbv (2.7 μg/m3) were reported for 886 suburban and 1,532 urban locations. The daily median
concentration of ethylbenzene considering all site types including source dominated areas and workplace
air was 0.60 ppbv (2.6 μg/m3). Table 6-2 lists some monitoring results reported for ethylbenzene in
various cities.
Ethylbenzene concentrations at four locations along U.S. Highway 70 near Raleigh, North Carolina,
during the month of May were reported to range from 10 to 16 ppbv (44–70 μg/m3) that were corrected to
include upwind concentrations (Zweidinger et al. 1988).
Concentrations of ethylbenzene were measured in two tunnels: the Fort McHenry Tunnel in Baltimore,
Maryland (June 18–24, 1992) and the Tuscarora Mountain Tunnel in Pennsylvania (September 2–8,
1992) (Zielinska et al. 1996). These authors reported minimum and maximum ethylbenzene
concentrations (on a carbon basis) for the Fort McHenry Tunnel of 6.3 and 89.2 ppbC (0.79 and
11.2 ppbv) for bore #3, respectively, and 0.5 and 114.1 ppbC (0.06 and 14.26 ppbv) for bore #4,
respectively, and concentrations for the Tuscarora Tunnel of 1.2 and 11.1 ppbC (0.15 and 6.04 ppbv) ,
respectively. The total number of light-duty vehicles (LDV) and heavy-duty vehicles (HDV) that passed
through each tunnel was 12,273 LDV and 187 HDV for bore #3 and 11,788 LDV and 2,417 HDV for
bore #4 of the Fort McHenry Tunnel and 4,887 LDV and 1,041 HDV for the Tuscarora Tunnel.
Ethylbenzene is released during processing of crude oil. Bratveit et al. (2007) reported air concentrations
ranging from an average of 0.01–0.09 ppm of ethylbenzene over a 12-hour period, with individual
measurements reported as high as 1.11 ppm (Bratveit et al. 2007).
Ethylbenzene and other VOCs have been found to be removed from waste water in municipal sewers and
were emitted to the ambient atmosphere prior to entering a downstream waste water treatment facility in
Toronto, Ontario (Quigley and Corsi 1995). These authors measured concentrations of ethylbenzene
during four monitoring events and found that concentrations ranged from not detectable to 5 ppm.
Headspace concentrations of ethylbenzene exhibited a significant weekday/weekend trend. Significant
emissions of all VOCs monitored occurred during three of the four monitoring events. Ethylbenzene had
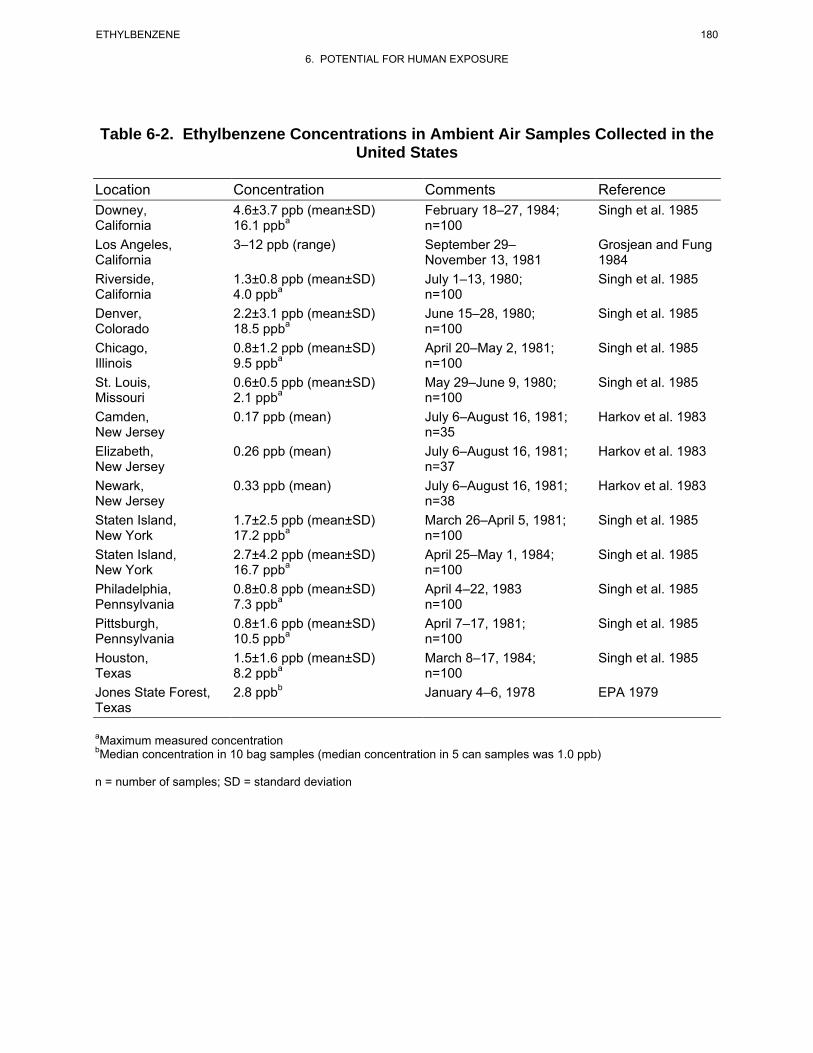
180 ETHYLBENZENE
6. POTENTIAL FOR HUMAN EXPOSURE
Table 6-2. Ethylbenzene Concentrations in Ambient Air Samples Collected in the United States
Location Concentration Comments Reference Downey, California
4.6±3.7 ppb (mean±SD) 16.1 ppba
February 18–27, 1984; n=100
Singh et al. 1985
Los Angeles, 3–12 ppb (range) September 29– Grosjean and Fung California November 13, 1981 1984 Riverside, California
1.3±0.8 ppb (mean±SD) 4.0 ppba
July 1–13, 1980; n=100
Singh et al. 1985
Denver, Colorado
2.2±3.1 ppb (mean±SD) 18.5 ppba
June 15–28, 1980; n=100
Singh et al. 1985
Chicago, Illinois
0.8±1.2 ppb (mean±SD) 9.5 ppba
April 20–May 2, 1981; n=100
Singh et al. 1985
St. Louis, Missouri
0.6±0.5 ppb (mean±SD) 2.1 ppba
May 29–June 9, 1980; n=100
Singh et al. 1985
Camden, 0.17 ppb (mean) July 6–August 16, 1981; Harkov et al. 1983 New Jersey n=35 Elizabeth, 0.26 ppb (mean) July 6–August 16, 1981; Harkov et al. 1983 New Jersey n=37 Newark, 0.33 ppb (mean) July 6–August 16, 1981; Harkov et al. 1983 New Jersey n=38 Staten Island, New York
1.7±2.5 ppb (mean±SD) 17.2 ppba
March 26–April 5, 1981; n=100
Singh et al. 1985
Staten Island, New York
2.7±4.2 ppb (mean±SD) 16.7 ppba
April 25–May 1, 1984; n=100
Singh et al. 1985
Philadelphia, Pennsylvania
0.8±0.8 ppb (mean±SD) 7.3 ppba
April 4–22, 1983 n=100
Singh et al. 1985
Pittsburgh, Pennsylvania
0.8±1.6 ppb (mean±SD) 10.5 ppba
April 7–17, 1981; n=100
Singh et al. 1985
Houston, Texas
1.5±1.6 ppb (mean±SD) 8.2 ppba
March 8–17, 1984; n=100
Singh et al. 1985
Jones State Forest, 2.8 ppbb January 4–6, 1978 EPA 1979 Texas
aMaximum measured concentration bMedian concentration in 10 bag samples (median concentration in 5 can samples was 1.0 ppb)
n = number of samples; SD = standard deviation
181 ETHYLBENZENE
6. POTENTIAL FOR HUMAN EXPOSURE
the second highest emissions during all periods and ranged from 7 to 14 g/hour (62–130 kg/year) for
event 1 and from 1 to 13 g/hour (9–115 kg/year) for event 2. Ethylbenzene emissions at five municipal
treatment facilities ranged from 0.08 to 93 g/day (0.003–3.9 g/hour). Results of this study suggest that
sewers that accept VOC-laden waste water, and that are characterized by significant ventilation and drop
structures, can be significant sources of VOC emissions (including ethylbenzene) relative to municipal
waste water treatment facilities.
Assmuth and Kalevi (1992) reported that ethylbenzene was detected in municipal solid waste landfill gas
at minimum and maximum concentrations of 6.6–7.6 mg/m3 (1.5–1.7 ppmv), <0.1–9.6 mg/m3 (<0.02–
2.2 ppmv), 0.2–1.2 mg/m3 (0.04–0.28 ppmv), and 85–98 mg/m3 (20–22 ppmv) at four different landfill
sites in Finland. Concentrations of ethylbenzene measured in a biogas collection system at the Miron
Quarry Municipal Waste Landfill Site in Montreal, Quebec ranged from 2 to 36 mg/m3 (0.5–8.3 ppmv)
(Goldberg et al. 1995).
6.4.2 Water
The median ethylbenzene concentration in ambient surface waters in the United States in 1980–1982 was
<5.0 μg/L (ppb) according to EPA's STORET water quality database (Staples et al. 1985). The chemical
was detected in 10% of the 1,101 samples collected during that period. Ethylbenzene was also detected in
7.4% of the 1,368 industrial effluent samples collected during 1980–1982 at a median concentration of
<3.0 μg/L (ppb). More recent data from the STORET database indicated that ethylbenzene was only
detected in 15 out of 548 surface water samples obtained from January 2005 to March 2007, at a
maximum concentration of 2 ppb (EPA 2007i).
From 1989 to 1993, New York City municipal waste waters were analyzed to determine the frequency of
detection of organic priority pollutants, including ethylbenzene (Stubin et al. 1996). Ethylbenzene was
detected in 14 of 84 (17%) influent samples at concentrations ranging from 1 to 11 μg/L (ppb) and in only
1 of 84 (1%) effluent samples at a concentration of 2 μg/L (ppb).
Ethylbenzene and other VOCs have been detected in waste water in municipal sewers prior to entering a
downstream waste water treatment facility in Toronto, Ontario (Quigley and Corsi 1995). These authors
measured concentrations of ethylbenzene in waste water during several monitoring events and found that
concentrations ranged from 0.059 to 0.086 mg/L (ppm) in one event and from 7 to 11 mg/L (ppm) in
another event. The authors also determined that the stripping efficiency across two drop structures with
182 ETHYLBENZENE
6. POTENTIAL FOR HUMAN EXPOSURE
waste water fall heights of 1.4–3 meters within the sewer system removed 31–36% of the ethylbenzene in
the waste water. Results of this study suggest that sewers that accept VOC-laden waste water, and that
are characterized by significant ventilation and drop structures, can be significant sources of VOC
emissions (including ethylbenzene) relative to municipal waste water treatment facilities.
As part of EPA's Nationwide Urban Runoff Program, ethylbenzene was measured in 4% of the municipal
runoff samples collected in 15 cities throughout the United States (Cole et al. 1984). The measured ethyl-
benzene concentration range was 1–2 μg/L (ppb). Ethylbenzene was detected in 41 out of 249 (16.5%)
storm water runoff samples collected at 46 different sampling locations in North Carolina over a 1-year
period (Borden et al. 2002). The mean, median, and maximum ethylbenzene levels were 0.10, 0.07, and
0.36 μg/L (ppb), respectively.
Ethylbenzene was measured in seawater at an average concentration of 0.011 μg/L (ppb) and a
concentration range of 0.0018–0.022 μg/L (ppb) over a 15-month observation period at Vineyard Sound,
Massachusetts (Gschwend et al. 1982). Ethylbenzene also has been reported in surface waters of the Gulf
of Mexico at a concentration range of 0.0004–0.0045 μg/L (ppb) (Sauer et al. 1978).
Ethylbenzene has been detected in a relatively remote location (Mt. Mitchell, North Carolina) in cloud
water at a mean concentration of 170 ng/L (range 0–450 ng/L) (Aneja 1993). The average concentration
of ethylbenzene in precipitation was 34 ng/L. Ethylbenzene has also been detected in snow samples from
two remote sites in the province of Québec, Canada (Kos and Ariya 2006). Ethylbenzene levels reported
in μg/L±3σ were: 2.65±1.28 (Resolute Bay); 0.22±0.02 (Gaspé Peninsula); and 0.31±0.06 (Gaspé
Peninsula).
From 1989 to 1990 and from 1992 to 1993, ethylbenzene was monitored in wetland-treated leachate water
at a municipal solid waste landfill in central Florida (Chen and Zoltek 1995). During the first sampling
period, ethylbenzene was detected in surface water samples ranging from 0.06 to 0.09 ppb and in
groundwater samples ranging from 0.06 to 9.75 ppb. During the second sampling period (1992–1993),
ethylbenzene was not detected in surface water samples, but was detected in groundwater samples at
concentrations ranging from below detection limits to 10.55 ppb. Ethylbenzene was detected in a study of
three landfills in central Florida (Hallbourg et al. 1992). These authors reported concentrations of ethyl-
benzene in groundwater of 1.63–9.75, <1–83.8, and <1–8.6 μg/L (ppb) at the three different landfill sites.
The mean concentration of ethylbenzene detected in landfill leachate from these disposal areas was
17.5 μg/L.
183 ETHYLBENZENE
6. POTENTIAL FOR HUMAN EXPOSURE
Ethylbenzene was measured in all three drinking water plants sampled as part of the New Orleans Area
Water Supply Study conducted by EPA in 1974 (Keith et al. 1976). The reported concentrations were
1.6, 1.8, and 2.3 μg/L (ppb). The 1982 Ground Water Supply Survey conducted by EPA reported ethyl-
benzene in only 3 out of 466 random samples at a mean concentration of 0.8 μg/L (ppb) and a maximum
concentration of 1.1 μg/L (ppb) (Cotruvo 1985). Chemical monitoring of 617 private and 1,174 public
groundwater wells in the state of Wisconsin revealed that ethylbenzene was detected in 3 community and
12 private wells. The concentration of ethylbenzene detected exceeded the state's recommended drinking
water advisory limit of 1,400 μg/L (ppb) in 9 of the 12 private wells, but no exceedences were observed
in the public wells (Krill and Sonzongni 1986).
Ethylbenzene was infrequently detected in a comprehensive survey conducted by the United States
Geological Survey (USGS) of volatile organic compounds in private and public groundwater wells used
for drinking water (USGS 2006). Ethylbenzene was identified in 18 out of 3,497 aquifer samples at a
median concentration of 0.035 μg/L for the 18 samples having positive detections. In an analysis of
domestic groundwater wells, the median concentration of ethylbenzene was reported as 0.041 μg/L for
samples having positive detections. Ethylbenzene was identified in 7 out of 1,083 samples obtained from
public wells across the United States at a median concentration of 0.32 μg/L for samples having positive
detections.
Although ethylbenzene does not appear to be a frequent contaminant in public water supplies, private
residential wells near landfills, hazardous waste sites, or gas stations are more likely to contain detectable
levels of this compound. Ethylbenzene was listed as one of the 58 most frequently detected chemicals
associated with groundwater contamination near superfund sites (Knox and Canter 1994). Ethylbenzene
was listed as having a medium priority with respect to its frequency of occurrence. Ethylbenzene has
been detected in wells downgradient from landfills in Southern Ontario at concentrations ranging from
12 to 74 μg/L (ppb) (Barker 1987). Ethylbenzene was detected at levels of 1–22, 1–5, and <1 μg/L in
groundwater 0–37, 50–114, and 170–254 meters, respectively, downgradient from a municipal landfill
located in Grindsted, Denmark (Baun et al. 2000). Ethylbenzene was detected in groundwater from a
representative monitoring well on a former gas-compressor site near South Lovedale, Oklahoma at a
concentration of 220 μg/L (Jin et al. 2007).
Borden and Yanoschak (1990) compared ground and surface water quality impacts associated with North
Carolina sanitary landfills. These authors found that ethylbenzene was detected at ≈25% of the waste
184 ETHYLBENZENE
6. POTENTIAL FOR HUMAN EXPOSURE
water effluents (receiving secondary treatment) and only 3% of the groundwater sampled in the vicinity
of sanitary landfill sites. Groundwater monitoring at 479 hazardous waste disposal sites indicated that
ethylbenzene, like the other 9 VOCs monitored, was detected at more than 100 of the 479 sites tested
(Plumb 1991). Ethylbenzene was also one of the VOCs detected in groundwater samples from hazardous
waste sites in all 10 EPA regions. Rosenfeld and Plumb (1991) reported that ethylbenzene was detected
in groundwater at 19% of wood-treatment industry sites based on its frequency of detection and average
concentration. Groundwater near an underground coal gasification site in northeastern Wyoming
contained concentrations of ethylbenzene ranging from 92 to 400 μg/L (ppb) (Stuermer et al. 1982).
Groundwater samples near a fuel spill in the Great Ouse Basin in Great Britain contained ethylbenzene
concentrations as high as 1,110 μg/L (ppb) (Tester and Harker 1981).
6.4.3 Sediment and Soil
The median ethylbenzene concentration (dry weight) detected in sediment in the United States in 1980–
1982 was 5 μg/kg (ppb) according to EPA's STORET water quality database (Staples et al. 1985). The
compound was detected in 11% of 350 sediment samples analyzed. More recent data from the STORET
database indicated that ethylbenzene was identified, but not quantified, in 25 out of 68 sediment samples
obtained from January 2005 to March 2007 (EPA 2007i).
Ethylbenzene concentrations were analyzed in contaminated soil samples obtained from the site of a
former crude oil and natural gas production facility near Los Angeles, California. Concentrations ranged
from the limit of detection (0.005 mg/kg) to 160 mg/kg. Subsurface samples were collected from
trenches, boreholes, and excavations; the highest concentrations were found in samples obtained through
a borehole (Soukup et al. 2007).
6.4.4 Other Environmental Media
Data from the FDA Total Diet Study Market Basket Surveys collected between September 1991 and
October 2003 indicate that ethylbenzene was detected in 82 different food items at a maximum
concentration of 0.129 ppm (FDA 2006b). In a previous Market Basket Survey, ethylbenzene was
identified in 15 out of 234 table-ready food items at an average concentration of 0.0146 ppm and a range
of 0.00637–0.0387 ppm (Heikes et al. 1995). Trace concentrations of ethylbenzene have been reported in
split peas (0.013 mg/kg [ppm]), lentils (0.005 mg/kg [ppm]), and beans (mean concentration 0.005 mg/kg
[ppm]; maximum concentration 0.011 mg/kg [ppm]) (Lovegren et al. 1979). Ethylbenzene was reported
as one of 227 organic chemicals present in roasted filbert nuts (Kinlin et al. 1972). Gorna-Binkul et al.
185 ETHYLBENZENE
6. POTENTIAL FOR HUMAN EXPOSURE
(1996) reported concentrations of ethylbenzene in orange peel (0.0236 μg/g [ppm] dry weight) and in
parsley leaves (0.2567 μg/g [ppm] dry weight). The author reported that the differences in concentrations
of the VOCs were dependent on the plant species and the morphological part of the plant analyzed. In
underground parts (i.e., roots and bulbs) not directly exposed to polluted ambient air during growth, no
VOC concentrations were detected. Biedermann et al. (1995) reported concentrations of several VOCs in
extra virgin olive oil collected in northwest Italy. These authors measured ethylbenzene levels in raw
olives of 6 μg/kg (ppb), which increased with time as they were milled to 25 μg/kg (ppb). Levels in the
finished olive oils ranged from 11 to 27 μg/kg (ppb) depending on the preparation method used. These
authors reported that while some of the ethylbenzene was accumulated in the olives in the orchards, a
larger proportion was accumulated as a result of exposure of the oil to air in the milling areas. Ethyl-
benzene concentrations in olive oil increased from 6 to 235 ppb after 2 days of exposure. The authors
concluded that the production process increased the concentration of ethylbenzene in the oil as a result of
uptake from the air that was likely to be contaminated with gasoline vapors associated with small vehicles
used to move the olives from area to area within the olive oil mill.
Ethylbenzene was also found to migrate from thermoset polyester cooking containers (composed of cross-
linking chains of styrene) into belly pork during cooking (Gramshaw and Vandenburg 1995). Migration
ranged from <6 to 34 μg/kg for ethylbenzene. The authors also found that the migration measured during
the second use of the cookware was generally higher than that during the first use. These authors also
reported that ethylbenzene concentrations in food cooked in foil-covered dishes was higher than that in
the same food cooked uncovered. This was especially true for ethylbenzene that was more volatile than
the styrene tested. Ehret-Henry et al. (1994) also reported migration of ethylbenzene from polystyrene
containers into dairy products. Concentrations of ethylbenzene were 2–4 μg/kg for yogurt and 4 μg/kg for
chocolate dessert.
Sack et al. (1992) conducted a survey of VOCs in 1,159 household items, including automotive products,
household cleaners and polishes, paint related products, fabric and leather treatments, cleaners for
electronic equipment, oils, greases, and lubricants, adhesive-related products, and miscellaneous products.
Ethylbenzene was detected in 157 of 658 (24%) of the products tested. The highest mean ethylbenzene
concentrations and percentage of products in each category in which ethylbenzene was detected are as
follows; 7.2% w/w (wet weight) in 7.5% of automotive products, 2.4% w/w in 47.8% of paint-related
products, and 1.0% w/w in 11.8% of fabric and leather treatments.
186 ETHYLBENZENE
6. POTENTIAL FOR HUMAN EXPOSURE
Hodgson et al. (1996) determined the contribution of environmental tobacco smoke (ETS) to
concentrations of VOCs in smoking environments. These authors reported that the average emission
factor for ethylbenzene for six brands of cigarettes was 101 μg/cigarette (range 83–142 μg/cigarette). The
average concentration of ethylbenzene in five smoking areas ranged from 1.3 to 8.7 μg/m3 (0.3–2 ppbv).
Martin et al. (1997) determined the ETS yield of selected analytes, including ethylbenzene, for the 50 top-
selling U.S. cigarette brand styles in 1991 and for the University of Kentucky Research cigarette, K1R4F.
The ETS was generated by smokers in an environmental test chamber. The ethylbenzene concentrations
measured were 8.68 μg/m3 for full flavor cigarettes, 8.24 μg/m3 for full flavor low tar cigarettes, and
8.72 μg/m3 for ultra-low-tar cigarettes. The mean ethylbenzene concentration for all cigarettes was
8.50 μg/m3. The mean ethylbenzene yields by tar category weighted by market share were
81.18 μg/cigarette for full flavor cigarettes, 76.79 μg/cigarette for full flavor low tar cigarettes, and
81.66 μg/cigarette for ultra low tar cigarettes. The mean ethylbenzene yield for all cigarettes was
79.57 μg/cigarette.
Ethylbenzene was not detected (at a detection limit of 0.025 mg/kg [ppm] wet weight) in any of the
97 biota samples collected from all STORET stations in 1980–1983 (Staples et al. 1985). Ethylbenzene
was detected at low concentrations (0.8 ng/g [0.8 ppb]) in oyster tissue, but not in clam tissue from Lake
Pontchartrain at Passes, Louisiana (Ferrario et al. 1985). The highest average ethylbenzene concentration
measured in tissue of bottomfish from Commencement Bay in Tacoma, Washington was reported as
0.01 mg /kg (ppm) (Nicola et al. 1987).
6.5 GENERAL POPULATION AND OCCUPATIONAL EXPOSURE
The highest exposure to ethylbenzene for the general public is most likely to occur via inhalation
associated with the use of self-service gasoline pumps or while driving a gasoline-powered motor vehicle
especially in high traffic areas or in tunnels (Lawryk et al. 1995; Smith et al. 2008). Backer et al. (1997)
performed a study that measured exposures associated with the pumping two different blends of fuel
under cold conditions in Fairbanks, Alaska. The subjects in the study had significantly higher levels of
gasoline components in their blood after pumping gasoline than before. The changes in VOC levels in
blood were similar whether the individuals pumped regular or oxygenated gasoline. Prior to pumping
regular gasoline, the median concentration of ethylbenzene in blood was 0.10 ppb (n=26) with a range of
0.02–0.73 ppb; after pumping, the median concentration was 0.16 ppb with a range of 0.06–1.40 ppb.
Before pumping an oxygenated fuel blend that was 10% ethanol, the median concentration of
187 ETHYLBENZENE
6. POTENTIAL FOR HUMAN EXPOSURE
ethylbenzene in blood was 0.11 ppb (n=22) with a range of 0.04–0.55 ppb; after pumping, the ethanol
blend, the median concentration was 0.16 ppb with a range of 0.06–0.64 ppb.
Janasik et al (2008) studied ethylbenzene exposure in six male volunteers who were subjected to an
exposure chamber containing ethylbenzene as well as toluene, xylene, and mesitylene at concentrations
emulating Polish occupational exposure standards of 100 mg/m3. Blood and urine samples obtained from
the volunteers were analyzed. Ethylbenzene concentrations in the blood ranged from 20 to 200 μg/L,
while urine concentrations ranged from 1 to 152 μg/L (Janasik et al. 2008).
Lawryk and Weisel (1996) measured in-vehicle concentrations of selected gasoline-derived volatile
organic compounds on 113 commutes through suburban New Jersey and 33 New Jersey/New York
commutes. In a typical suburban commute, the mean in-vehicle concentration of ethylbenzene was
11.5±18.8 μg/m3 (2.64±4.32 ppbv; n=52) under low ventilation conditions and 8.5±11.2 μg/m3
(1.9±2.57 ppbv; n=43) under high ventilation conditions. On the New Jersey turnpike and in the Lincoln
Tunnel, the mean in-vehicle concentrations of ethylbenzene were 8.8±10.8 μg/m3 (2.0±2.48 ppbv; n=32)
and 14.3±10.2 μg/m3 (3.29±2.34 ppbv; n=32), respectively.
Ethylbenzene is ubiquitous in urban and rural atmosphere resulting from vehicular and industrial
emissions (EPA 1988c). Tobacco smoke also provides a general source of exposure to ethylbenzene in
indoor air (Wallace et al. 1987c). Wallace et al. (1989) also reported that two activities, painting and the
use of automotive products (carburetor cleaner), led to increased indoor exposure to ethylbenzene by
100-fold. Indoor exposure to ethylbenzene may also be increased resulting from the start-up of gasoline-
powered engines in attached garages (Dodson et al. 2008). Information on exposure from foods is
limited, but is not likely to be a significant source of ethylbenzene for the general population.
Human exposure to styrene and ethylbenzene was assessed by considering inhalation exposure (including
cigarette smoking) and food intake (Tang et al. 2000). The daily exposure to ethylbenzene for the general
population was calculated as 1.8 μg/kg bodyweight/day, with up to 99% of the exposure due to inhalation
routes and only 1–2% caused by food consumption.
One-half of the household drinking water used in the United States is supplied by groundwater, and
contamination of groundwater by petroleum products is an increasingly common problem (Beavers et al.
1996). Beavers et al. (1996) conducted a study in a New England household that used groundwater
contaminated by gasoline from a leaking underground storage tank. A total daily dose of 379 μg
188 ETHYLBENZENE
6. POTENTIAL FOR HUMAN EXPOSURE
ethylbenzene (204 μg ingested and 175 μg inhaled) was estimated for an exposed subject compared to a
median daily dose of 32 μg for unexposed subjects. Of the 175 μg inhaled by the exposed subject, 108 μg
was attributed to shower activities. The exposed subject and the three non-exposed subjects all were
smokers.
The 1982 National Human Adipose Tissue Survey conducted by EPA measured ethylbenzene in 96% of
the 46 composite samples analyzed for VOCs (EPA 1986). A wet tissue concentration range of not
detected (detection limit=2 ng/g) to 280 ng/g (ppb) was reported, but an average concentration was not
provided.
Ethylbenzene has been detected in breast milk samples collected from 8 of 12 women from various cities
in the United States; however, the concentrations were not reported (Pellizzari et al. 1982). The
12 women sampled in the study were residents of Bayonne, New Jersey (6 women), Jersey City, New
Jersey (2 women), Bridgeville, Pennsylvania (2 women), and Baton Rouge, Louisiana (2 women).
Mean and median concentrations of ethylbenzene detected in 631 blood samples from participants in the
Third National Health and Nutrition Examination Survey (NHANES III 1998–1994 data) were 0.11 and
0.06 ppb (95 percentile value of 0.25 ppb), respectively (Ashley et al. 1994). In an earlier study (Ashley
et al. 1992), these authors reported a mean ethylbenzene concentration of 0.12 ppb in 13 blood samples.
Hajimiragha et al. (1989) conducted a study of 13 nonsmokers and 14 smokers with no known
occupational or hobby-related exposure to volatile organic hydrocarbons. These authors reported a mean
and median ethylbenzene concentration of 651 ng/L (0.651 ppb) and 431 ng/L (0.431 ppb) for the
nonsmokers and 837 ng/L (0.837 ppb) and 533 ng/L (0.533 ppb) for the smokers. Ethylbenzene
concentrations tended to occur at higher concentrations in the blood of smokers than in nonsmokers;
however, the difference was not significant. Ashley et al. (1995) also reported that smoking elevated the
blood levels of ethylbenzene and was highly correlated with blood levels of 2,5-dimethylfuran. These
authors reported a mean concentration of 0.10 ng/mL (ppb) (median 0.048 ng/mL; range from below
detection limit to 2.7 ng/mL) for nonsmokers and a mean concentration of 0.17 ng/mL (ppb) (median
0.16 ng/mL; range 0.036–0.88 ng/mL) for smokers. To aid in understanding the kinetics of uptake and
elimination of volatile organics (including ethylbenzene), Ashley and Prah (1997) measured blood
concentrations before, during, and after exposure of five individuals to a mixture of volatile organics in a
controlled chamber. The half-lives of the compounds measured were <0.5 hour, but the elimination time
courses were multiexponential and suggested that, with repeated exposure, bioaccumulation may occur in
humans.
189 ETHYLBENZENE
6. POTENTIAL FOR HUMAN EXPOSURE
Occupational exposure to ethylbenzene in the petroleum industry has been reported in a study that
measured ethylbenzene concentrations in air for 49–56 workers during the summer of 1984 (Rappaport et
al. 1987). The average air concentrations of ethylbenzene measured over the full work shift for gasoline
service station attendants, transport drivers, and outdoor refinery personnel were comparable at 0.063,
0.079, and 0.079 mg/m3, respectively (14.5, 18.2, and 18.2 ppbv, respectively). The authors noted that
exposures of service station attendants were significantly lower when vapor recovery systems were
present. Crude oil process operators at an offshore processing plant near Norway were found to be
exposed to 0.01–0.09 ppm of ethylbenzene in air during a full 12-hour work shift. Short-term exposure to
ethylbenzene was dependent upon the specific work task and ranged from <0.01 to 1.11 ppm. Workers
on the flotation package were found to be exposed to the highest ethylbenzene concentrations (Bratveit et
al. 2007).
Personal air monitoring of 35 varnish workers (spraymen) has revealed an average ethylbenzene
concentrations of 4.0 ppm, while the average concentration in blood was 61.4 μg/L (Angerer and Wulf
1985). Concentrations of ethylbenzene were monitored in auto paint shops in Spain that used organic
solvents (de Medinilla and Espigares 1988). These authors reported air concentrations of ethylbenzene
ranging from 0.50 to 125.0 mg/m3 (0.12–28.75 ppmv).
The indoor air of screen printing plant workrooms located directly below houses in Amsterdam, Holland
was found to contain median TWA concentrations of ethylbenzene ranging from <0.03 mg/m3 (7 ppbv) to
1.30 mg/m3 (299 ppbv) and maximum TWA concentrations ranging from 0.11 mg/m3 (25 ppbv) to
3.21 mg/m3 (738 ppbv) (Verhoeff et al. 1988).
Spray-painting and gluing operations can also result in exposure to ethylbenzene; personal air monitoring
of workers measured average exposures of approximately 0.50 ppmv (2.2 mg/m3) (Whitehead et al.
1984). Most of the operations measured during the study were performed in ventilation hoods.
Holz et al. (1995) reported that ethylbenzene air concentrations detected from air sampling in all areas of
a styrene production facility located in the former German Democratic Republic ranged from 365 to
2,340 μg/m3 (0.08–0.53 ppmv).
According to the National Occupational Exposure Study (NOES) conducted by NIOSH from 1981 to
1983, an estimated 201,838 workers were potentially exposed to ethylbenzene in the workplace (NIOSH
190 ETHYLBENZENE
6. POTENTIAL FOR HUMAN EXPOSURE
1990). The NOES database does not contain information on the frequency, concentration, or duration of
occupational exposure to any of the chemicals listed. The survey provides only estimates of the numbers
of workers for whom potential exposure in the workplace is an issue.
The Occupational Safety and Health Administration (OSHA) has set a Permissible Exposure Limit (PEL)
based on a TWA of 100 ppm (≈435 mg/m3 at 1 atm and 25 °C) in the workplace (OSHA 1974). The
American Conference of Governmental Industrial Hygienists also recommends a Threshold Limit Value
(TLV-TWA) of 100 ppm (≈435 mg/m3) for occupational exposures (ACGIH 1992). The recommended
exposure limit (REL) for occupational exposures (TWA) set by the NIOSH is also 100 ppm
(≈435 mg/m3) for ethylbenzene based on a 10-hour average workday and a 40-hour workweek (NIOSH
2005).
6.6 EXPOSURES OF CHILDREN
This section focuses on exposures from conception to maturity at 18 years in humans. Differences from
adults in susceptibility to hazardous substances are discussed in Section 3.7, Children’s Susceptibility.
Children are not small adults. A child’s exposure may differ from an adult’s exposure in many ways.
Children drink more fluids, eat more food, breathe more air per kilogram of body weight, and have a
larger skin surface in proportion to their body volume. A child’s diet often differs from that of adults.
The developing human’s source of nutrition changes with age: from placental nourishment to breast milk
or formula to the diet of older children who eat more of certain types of foods than adults. A child’s
behavior and lifestyle also influence exposure. Children crawl on the floor, put things in their mouths,
sometimes eat inappropriate things (such as dirt or paint chips), and spend more time outdoors. Children
also are closer to the ground, and they do not use the judgment of adults to avoid hazards (NRC 1993).
Children can be exposed to ethylbenzene by inhalation in urban and rural atmospheres contaminated by
vehicular and industrial emissions. Tobacco smoke also provides a general source for exposure of
children to ethylbenzene in indoor air, especially in the homes where one or both parents smoke.
Children may also be exposed to ethylbenzene-containing consumer products, such as carpet glues,
paints, and varnishes. Household activities, such as painting, can lead to short-term exposures to higher
levels of ethylbenzene if ventilation is inadequate. The limited information available on exposure from
foods indicates that food is not likely to be a significant source of ethylbenzene for children.
191 ETHYLBENZENE
6. POTENTIAL FOR HUMAN EXPOSURE
Ethylbenzene is heavier than air, and since young children are closer to the ground or floor because of
their height, during accidental exposures they may be exposed to more ethylbenzene vapors than adults.
A 2- year monitoring study (2000–2001) involving 134 children aged 6–10 was conducted in
Minneapolis, Minnesota in order to assess exposure to VOCs, including ethylbenzene (Sexton et al.
2005). The distribution of ethylbenzene measured in the blood of these children (416 samples) is
provided in Table 6-3. Comparing these data to monitoring results from NHANES III, the levels of
ethylbenzene in children’s blood is approximately 2 or more times lower than in non-occupationally
exposed adults (Sexton et al. 2005). Ethylbenzene has been detected in breast milk samples collected
from 8 of 12 women from various cities in the United States; however, the concentrations were not
reported (Pellizzari et al. 1982). The 12 women sampled in the study were residents of Bayonne, New
Jersey (6 women); Jersey City, New Jersey (2 women); Bridgeville, Pennsylvania (2 women); and Baton
Rouge, Louisiana (2 women). No direct pharmacokinetic experiments have been done to investigate
whether significant amounts of ethylbenzene are transferred to breast milk in mammals. No studies were
located that expressed the level of ethylbenzene or its metabolites in amniotic fluid, meconium, cord
blood or neonatal blood.
Although no data were found in the literature, it is possible that children playing near hazardous waste
sites could be dermally exposed to ethylbenzene in soil or orally exposed by hand-to-mouth activity
and/or soil pica. Ethylbenzene, however, is only moderately adsorbed by soil. Since it has a moderately
high vapor pressure, it will evaporate fairly rapidly from dry soil. However, under certain soil conditions,
ethylbenzene may persist for longer periods of time; it has been detected in soil samples collected at
469 of the 829 NPL hazardous waste sites where it has been detected in some environmental media
(HazDat 2007). It was also detected in high concentrations in soil at a former crude oil and natural gas
production facility, which was being considered for redevelopment (Soukup et al. 2007). No information
was found concerning dermal and oral bioavailability of ethylbenzene in soil.
In the home, intentionally sniffing solvents could lead to high levels of exposure. Household products
containing ethylbenzene, such as gasoline, paints, and glue, are widely available to children. Radhouame
et al. (2008) studied inhalant abuse among 40 male and 4 female children and young adults (aged 11–
23 years) suspected of drug abuse in Tunisia. Solvent metabolites were measured in urine samples to
indicate exposure to VOC compounds through sniffing of various products. The authors concluded that
the particular children in the study abused substances that ultimately resulted in high toluene and hexane
exposures, as opposed to those resulting in high ethylbenzene exposure (Chakroun et al. 2008). However,
abuse of household products could still be a concern for exposure of children to ethylbenzene.
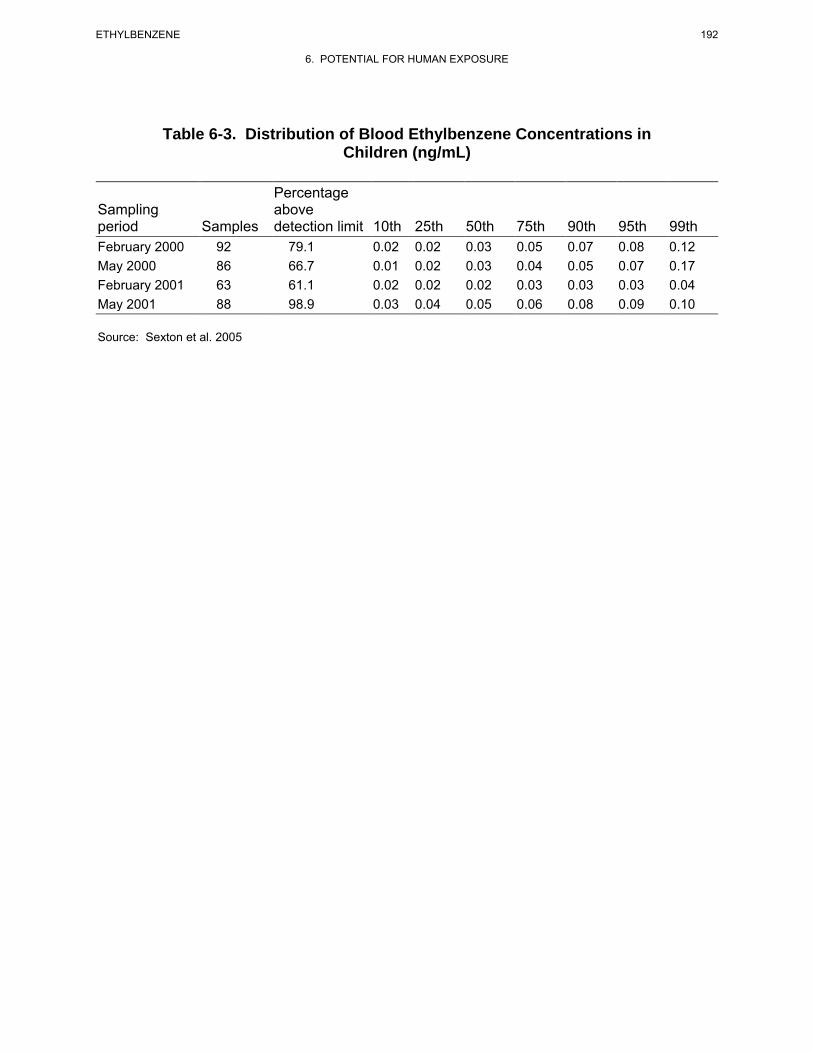
192 ETHYLBENZENE
6. POTENTIAL FOR HUMAN EXPOSURE
Table 6-3. Distribution of Blood Ethylbenzene Concentrations in Children (ng/mL)
Percentage Sampling above period Samples detection limit 10th 25th 50th 75th 90th 95th 99th February 2000 92 79.1 0.02 0.02 0.03 0.05 0.07 0.08 0.12 May 2000 86 66.7 0.01 0.02 0.03 0.04 0.05 0.07 0.17 February 2001 63 61.1 0.02 0.02 0.02 0.03 0.03 0.03 0.04 May 2001 88 98.9 0.03 0.04 0.05 0.06 0.08 0.09 0.10
Source: Sexton et al. 2005
193 ETHYLBENZENE
6. POTENTIAL FOR HUMAN EXPOSURE
No information was found concerning differences in the weight-adjusted intakes of ethylbenzene by
children.
No exposures of children to ethylbenzene by contamination of workers’ homes were found in the
Workers’ Home Contamination Study conducted under the Worker’s Family Protection Act (NIOSH
1995).
6.7 POPULATIONS WITH POTENTIALLY HIGH EXPOSURES
In addition to individuals who are occupationally exposed to ethylbenzene (see Section 6.5), there are
several groups within the general population that may receive potentially high exposures (higher than
background levels) to ethylbenzene. These populations include individuals living in proximity to sites
where ethylbenzene is produced or used in manufacturing or sites where ethylbenzene is disposed, and
includes individuals living near the 829 NPL hazardous waste sites where ethylbenzene has been detected
in some environmental media (HazDat 2007). Ethylbenzene has been detected in air and groundwater at
121 and 557 NPL hazardous waste sites, respectively.
Individuals living or working near petroleum refineries or chemical manufacturing plants may receive
higher inhalation exposures than those experienced by the general population. Residents living in the
vicinity of gasoline stations, high traffic areas, tunnels, parking lots, and highways may also receive a
higher than average inhalation exposure since ethylbenzene is a component of gasoline (Smith et al.
2008). Residential wells downgradient of leaking underground storage tanks, landfills, and hazardous
waste sites contaminated with petroleum products and solvents may contain high levels of ethylbenzene.
If these residential wells are the primary source of drinking water, this may pose a risk to human health
via consumption of contaminated water as well as increased inhalation of and dermal contact with ethyl-
benzene during showering and bathing. A study of indoor air in a home using gasoline-contaminated
drinking water found that exposures to ethylbenzene could occur via inhalation during showering and
other household activities (Beavers et al. 1996). Ethylbenzene concentrations in shower air were often
one to two orders of magnitude higher than non-shower air. These authors reported a total daily
household dose of ethylbenzene of 379 μg, with 204 μg derived from ingestion of drinking water and 175
μg derived from inhalation (108 μg from shower-related inhalation and 67 μg from non-shower-related
inhalation) to the exposed subject living in the home. The daily dose of ethylbenzene for an unexposed
smoker by comparison was estimated to be 32 μg.
194 ETHYLBENZENE
6. POTENTIAL FOR HUMAN EXPOSURE
6.8 ADEQUACY OF THE DATABASE
Section 104(i)(5) of CERCLA, as amended, directs the Administrator of ATSDR (in consultation with the
Administrator of EPA and agencies and programs of the Public Health Service) to assess whether
adequate information on the health effects of ethylbenzene is available. Where adequate information is
not available, ATSDR, in conjunction with NTP, is required to assure the initiation of a program of
research designed to determine the health effects (and techniques for developing methods to determine
such health effects) of ethylbenzene.
The following categories of possible data needs have been identified by a joint team of scientists from
ATSDR, NTP, and EPA. They are defined as substance-specific informational needs that if met would
reduce the uncertainties of human health assessment. This definition should not be interpreted to mean
that all data needs discussed in this section must be filled. In the future, the identified data needs will be
evaluated and prioritized, and a substance-specific research agenda will be proposed.
6.8.1 Identification of Data Needs
Physical and Chemical Properties. The physical and chemical properties of ethylbenzene are well
characterized (see Table 4-2) and allow prediction of the transport and transformation of the compound in
the environment (Amoore and Hautala 1983; Bohon and Claussen 1951; Chiou et al. 1983; EPA 1982;
Hansch and Leo 1979; Hodson and Williams 1988; Mackay and Shiu 1981; Polak and Lu 1973; Sutton
and Calder 1975; Verschueren 1983). No additional studies are needed at the present time.
Production, Import/Export, Use, Release, and Disposal. According to the Emergency
Planning and Community Right-to-Know Act of 1986, 42 U.S.C. Section 11023, industries are required
to submit substance release and off-site transfer information to the EPA. The TRI, which contains this
information for 2006, became available in May of 2008. This database is updated yearly and should
provide a list of industrial production facilities and emissions.
Ethylbenzene has numerous uses (ACGIH 2002; Ransley 1984; Verschueren 1983), and production of the
chemical has steadily increased since 1983 (C&EN 1994a, 1994b, 1995, 2006; Kirschner 1995). Releases
occur from a variety of common sources including manufacturing and production (TRI06 2008), fuels,
automobile exhaust, and fumes from paints, varnishes, solvents, carpet glue, and hot asphalt (Fishbein
1985; Hampton et al. 1983; Junk and Ford 1980; Katzman and Libby 1975; Kitto et al. 1997; Mukund et
al. 1996; NAS 1980; Wallace et al. 1987b). Ethylbenzene also is released from waste waters to the
195 ETHYLBENZENE
6. POTENTIAL FOR HUMAN EXPOSURE
atmosphere in municipal sewer systems (Quigley and Corsi 1995). Therefore, the potential for human
exposure to ethylbenzene is considerable. The medium most likely to be contaminated is air, although
ethylbenzene has also been detected in trace amounts in water supplies. Some ethylbenzene-containing
wastes are designated as hazardous and are subject to EPA handling and recordkeeping requirements.
Recommended methods for the disposal of ethylbenzene include burial in a landfill and rotary kiln
incineration, liquid injection incineration, and fluidized bed incineration (EPA 1981d). No data need is
identified at this time.
Environmental Fate. Ethylbenzene is primarily partitioned to and transported in air (Dewulf and
van Langenhove 1997; Eisenreich et al. 1981; Mackay 1979; Masten et al. 1994). The partitioning and
transport processes in water, soil, and aquatic life are also well characterized (ASTER 1995; Dewulf et al.
1996; Kawamura and Kaplan 1983; Ligocki et al. 1985; Swann et al. 1983). Transformation and
degradation processes have also been well characterized in air (Atkinson and Carter 1984; Atkinson et al.
1978; Grovenstein and Mosher 1970; Herron and Huie 1973; Hoshino et al. 1978; O'Brien et al. 1975;
Ohta and Ohyama 1985; Ravishankara et al. 1978; Yanagihara et al. 1977), water (Acton and Barker
1992; Anid et al. 1993; Bouwer and McCarty 1984; Burback and Perry 1993; Ehrhardt and Petrick 1984;
Gschwend et al. 1982; Hutchins 1991; Masten et al. 1994; Wakeham et al. 1983; Wilson et al. 1986), and
in soil and sediment (Bestetti and Galli 1984; Chen and Taylor 1995; Hutchins 1991; Hutchins et al.
1991; Jamison et al. 1970; Ramanand et al. 1995; Van der Linden and Thijsse 1965; Yadav and Reddy
1993; Zappi et al. 1996). No data need is identified at this time.
Bioavailability from Environmental Media. Ethylbenzene is absorbed following inhalation, oral,
and dermal exposures. Information is available on its absorption from air and water, but little data exist
regarding dermal bioavailability and absorption from soil and food. Due to its large vapor pressure and
Henry’s law constant, ethylbenzene is expected to volatilize fairly rapidly from soil surfaces. Based on
the moderate affinity of ethylbenzene for soil, especially soils with relatively high organic carbon content,
the amount of ethylbenzene in bioavailable form in soil is expected to be low to moderate. Because of the
low BCF values calculated for ethylbenzene, food chain bioaccumulation would not be expected to be
significant sources of ethylbenzene exposure. No data need is identified at this time.
Food Chain Bioaccumulation. Limited data suggests that ethylbenzene does not bioconcentrate in
aquatic organisms (Ogata et al. 1984), and is not likely to bioaccumulate in aquatic or terrestrial food
chains. However, little information on food residues in commercially important fish and shellfish species
196 ETHYLBENZENE
6. POTENTIAL FOR HUMAN EXPOSURE
is currently available. Additional monitoring data regarding the levels of ethylbenzene would be helpful
for several commercially important fish and shellfish species.
Exposure Levels in Environmental Media. Reliable monitoring data for the levels of
ethylbenzene in contaminated media at hazardous waste sites are needed so that the information obtained
on levels of ethylbenzene in the environment can be used in combination with the known body burden of
ethylbenzene to assess the potential risk of adverse health effects in populations living in the vicinity of
hazardous waste sites.
An extensive amount of atmospheric monitoring data exists (EPA 1988c; Goldberg et al. 1995; Kinney et
al. 2002; Kostiainen 1995; Mukerjee et al. 1997; Quigley and Corsi 1995; Wallace et al. 1987a, 1987c;
Zielinska et al. 1996; Zweidinger et al. 1988). Ethylbenzene has also been detected in surface water and
groundwater (Barker 1987; Borden and Yanoschak 1990; Chen and Zoltek 1995; Cole et al. 1984;
Cotruvo 1985; Gschwend et al. 1982; Krill and Sonzongni 1986; Quigley and Corsi 1995; Staples et al.
1985; Stubin et al. 1996; Stuermer et al. 1982; Tester and Harker 1981), sediment (Staples et al. 1985), a
limited number of foodstuffs (Ferrario et al. 1985; Górna-Binkul et al. 1996; Kinlin et al. 1972; Lovegren
et al. 1979; Nicola et al. 1987), and in cigarette smoke (Hodgson et al. 1996; Martin et al. 1997; Wallace
1986; Wallace et al. 1987c). Continued monitoring data at or around hazardous waste sites are needed in
order to assess human exposure for populations residing in these areas.
Exposure Levels in Humans. Ethylbenzene and its metabolites have been detected in human blood
(Angerer and Wulf 1985; Ashley et al. 1994), urine (Bardodej and Bardodevova 1970; Dutkiewicz and
Tyras 1967; Engstrom and Bjurstrom 1978; Gromiec and Piotrowski 1984; Kiese and Lenk 1974;
Sullivan et al. 1976; Yamasaki 1984), breast milk (Pellizzari et al. 1982), and adipose tissue (Engstrom
and Bjurstrom 1978; EPA 1986). Most of the monitoring data have come from occupational studies of
specific worker populations exposed by inhalation. Members of the general population can be exposed to
ethylbenzene through inhalation of fumes while pumping gas, riding in gasoline-powered vehicles, and
routinely starting vehicles in enclosed garages (Backer et al. 1997; Dodson et al. 2008; Lawryk and
Weisel 1996; Lawryk et al. 1995), as well as exposure to ethylbenzene-containing consumer products
(Hodgson et al. 1991; Lillo et al. 1990; NAS 1980; Otson et al. 1994; Sack et al. 1992; Wallace et al.
1987b). Additional information regarding the general population’s exposure to ethylbenzene would be
useful. Dietary intake is expected to be insignificant as compared to inhalation exposure (Tang et al.
2000). Oral exposures are likely to be low, except for the consumption of contaminated drinking water
by populations living in the vicinity of hazardous waste sites, leaking underground storage tanks, or
197 ETHYLBENZENE
6. POTENTIAL FOR HUMAN EXPOSURE
municipal landfills. This information is necessary for assessing the need to conduct health studies on
these populations.
Exposures of Children. Children are exposed to ethylbenzene by the same routes that affect adults.
Biomonitoring data suggest that blood levels of ethylbenzene are lower in children than non--
occupationally exposed adults (Sexton et al. 2005). Ethylbenzene has been detected in breast milk
samples collected from 8 or 12 women from various cities in the United States; however, the
concentrations were not reported (Pellizzari et al. 1982). There do not appear to be any childhood
specific means to decrease exposure to ethylbenzene, aside from educating children about the dangers of
inhalant abuse (Chakroun et al. 2008). A data need exists to determine current ethylbenzene residues and
their sources in breast milk of members of the general population.
Child health data needs relating to susceptibility are discussed in Section 3.12.2, Identification of Data
Needs: Children’s Susceptibility.
Exposure Registries. No exposure registries for ethylbenzene were located. This substance is not
currently one of the compounds for which a sub-registry has been established in the National Exposure
Registry. The substance will be considered in the future when chemical selection is made for sub-
registries to be established. The information that is amassed in the National Exposure Registry facilitates
the epidemiological research needed to assess adverse health outcomes that may be related to exposure to
this substance.
6.8.2 Ongoing Studies
The Federal Research in Progress (FEDRIP 2007) database provides additional information obtainable
from a few ongoing studies that may fill in some of the data needs identified in Section 6.8.1. These
studies are summarized in Table 6-4.
As part of the Third National Health and Nutrition Evaluation Survey (NHANES III), the Environmental
Health Laboratory Sciences Division of the National Center for Environmental Health, Centers for
Disease Control and Prevention, will be analyzing human blood samples for ethylbenzene and other
volatile organic compounds. These data will give an indication of the frequency of occurrence and
background levels of these compounds in the general population.
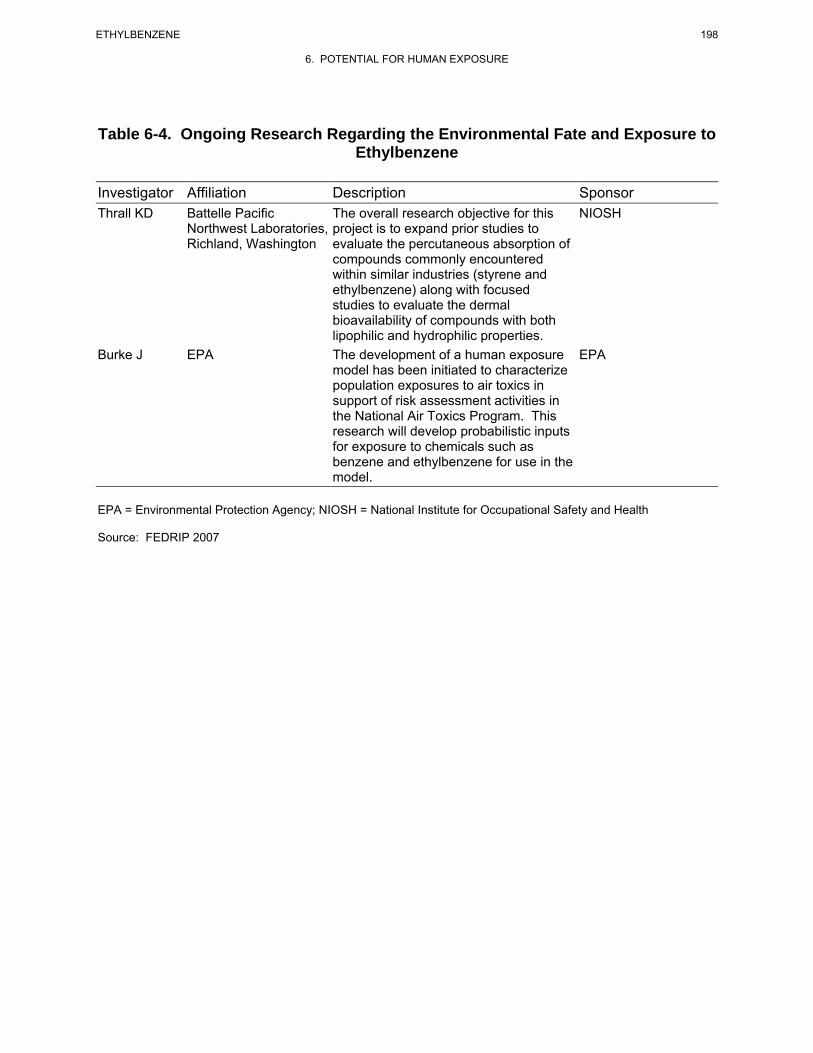
198 ETHYLBENZENE
6. POTENTIAL FOR HUMAN EXPOSURE
Table 6-4. Ongoing Research Regarding the Environmental Fate and Exposure to Ethylbenzene
Investigator Affiliation Description Sponsor Thrall KD Battelle Pacific The overall research objective for this NIOSH
Northwest Laboratories, project is to expand prior studies to Richland, Washington evaluate the percutaneous absorption of
compounds commonly encountered within similar industries (styrene and ethylbenzene) along with focused studies to evaluate the dermal bioavailability of compounds with both lipophilic and hydrophilic properties.
Burke J EPA The development of a human exposure EPA model has been initiated to characterize population exposures to air toxics in support of risk assessment activities in the National Air Toxics Program. This research will develop probabilistic inputs for exposure to chemicals such as benzene and ethylbenzene for use in the model.
EPA = Environmental Protection Agency; NIOSH = National Institute for Occupational Safety and Health
Source: FEDRIP 2007
199 ETHYLBENZENE
7. ANALYTICAL METHODS
The purpose of this chapter is to describe the analytical methods that are available for detecting,
measuring, and/or monitoring ethylbenzene, its metabolites, and other biomarkers of exposure and effect
to ethylbenzene. The intent is not to provide an exhaustive list of analytical methods. Rather, the
intention is to identify well-established methods that are used as the standard methods of analysis. Many
of the analytical methods used for environmental samples are the methods approved by federal agencies
and organizations such as EPA and the National Institute for Occupational Safety and Health (NIOSH).
Other methods presented in this chapter are those that are approved by groups such as the Association of
Official Analytical Chemists (AOAC) and the American Public Health Association (APHA).
Additionally, analytical methods are included that modify previously used methods to obtain lower
detection limits and/or to improve accuracy and precision.
7.1 BIOLOGICAL MATERIALS
Ethylbenzene can be determined in biological fluids, and tissues, and breath using a variety of analytical
methods. Representative methods are summarized in Table 7-1. Most analytical methods for biological
fluids and tissues use headspace gas chromatographic (GC) analysis. Breath samples are usually
collected on adsorbent traps or in sampling bags or canisters, and then analyzed by GC.
The headspace method involves equilibrium of volatile analytes such as ethylbenzene between a liquid or
solid sample phase and the gaseous phase. The gaseous phase is then analyzed by GC. There are two
main types of headspace methodology: static (equilibrium) headspace and dynamic headspace, which is
usually called the "purge-and-trap" method (Seto 1994). The static headspace technique is relatively
simple, but may be less sensitive than the purge-and-trap method. The purge-and-trap method, while
providing increased sensitivity, requires more complex instrumentation and may result in artifact
formation (Seto 1994). Generally, an inert gas such as helium is passed over the biological sample at
elevated temperature, and the purged volatile organic compound (VOC) is trapped onto an adsorbent
polymeric resin (Tenax). The organic compound is thermally desorbed from the adsorbent followed by
identification and quantitation using various detectors; flame ionization detection (FID) and mass
spectrometry (MS) are used most often. Other sample preparation methods have been used, but less
frequently. Solvent extraction permits concentration, thereby increasing sensitivity, but the extraction
solvent can interfere with analysis. Direct aqueous injection is a very rapid method, but sensitivity is low
and matrix effects can be a serious problem.
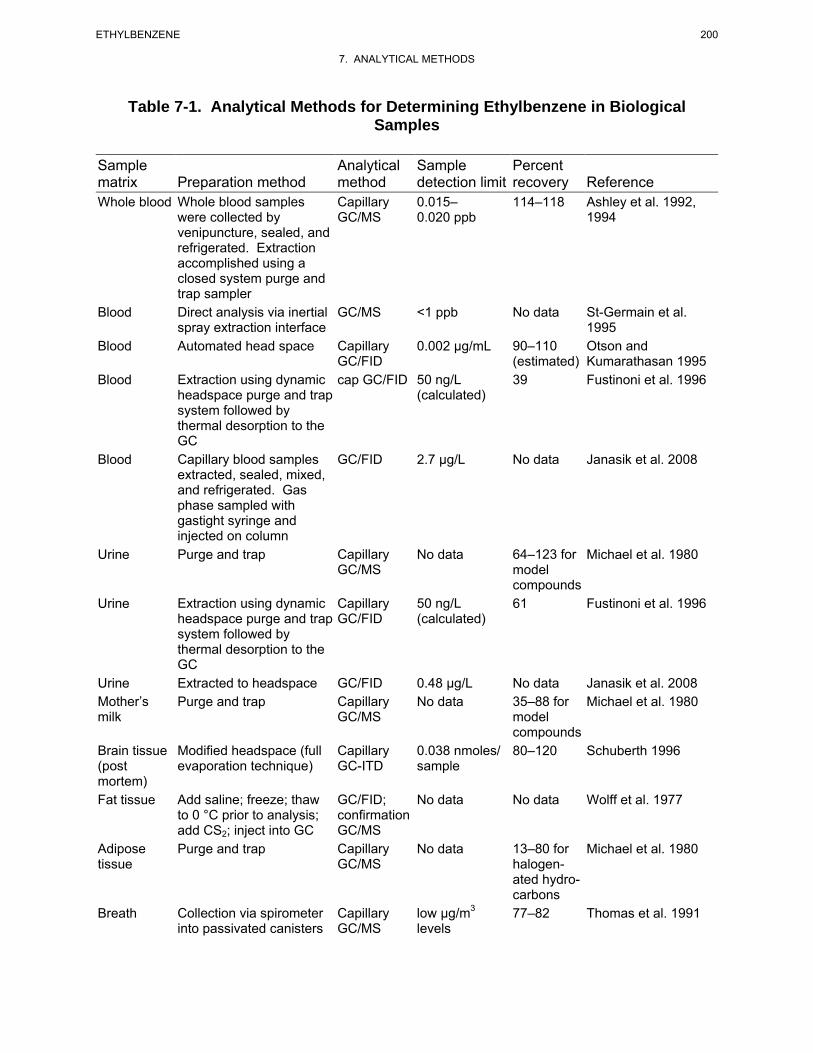
200 ETHYLBENZENE
7. ANALYTICAL METHODS
Table 7-1. Analytical Methods for Determining Ethylbenzene in Biological Samples
Sample Analytical Sample Percent matrix Preparation method method detection limit recovery Reference Whole blood Whole blood samples Capillary 0.015– 114–118 Ashley et al. 1992,
were collected by GC/MS 0.020 ppb 1994 venipuncture, sealed, and refrigerated. Extraction accomplished using a closed system purge and trap sampler
Blood Direct analysis via inertial GC/MS <1 ppb No data St-Germain et al. spray extraction interface 1995
Blood Automated head space Capillary 0.002 μg/mL 90–110 Otson and GC/FID (estimated) Kumarathasan 1995
Blood Extraction using dynamic cap GC/FID 50 ng/L 39 Fustinoni et al. 1996 headspace purge and trap (calculated) system followed by thermal desorption to the GC
Blood Capillary blood samples GC/FID 2.7 μg/L No data Janasik et al. 2008 extracted, sealed, mixed, and refrigerated. Gas phase sampled with gastight syringe and injected on column
Urine Purge and trap Capillary No data 64–123 for Michael et al. 1980 GC/MS model
compounds Urine Extraction using dynamic Capillary 50 ng/L 61 Fustinoni et al. 1996
headspace purge and trap GC/FID (calculated) system followed by thermal desorption to the GC
Urine Extracted to headspace GC/FID 0.48 μg/L No data Janasik et al. 2008 Mother’s Purge and trap Capillary No data 35–88 for Michael et al. 1980 milk GC/MS model
compounds Brain tissue Modified headspace (full Capillary 0.038 nmoles/ 80–120 Schuberth 1996 (post evaporation technique) GC-ITD sample mortem) Fat tissue Add saline; freeze; thaw GC/FID; No data No data Wolff et al. 1977
to 0 °C prior to analysis; confirmation add CS2; inject into GC GC/MS
Adipose Purge and trap Capillary No data 13–80 for Michael et al. 1980 tissue GC/MS halogen
ated hydrocarbons
Breath Collection via spirometer Capillary low μg/m3 77–82 Thomas et al. 1991 into passivated canisters GC/MS levels
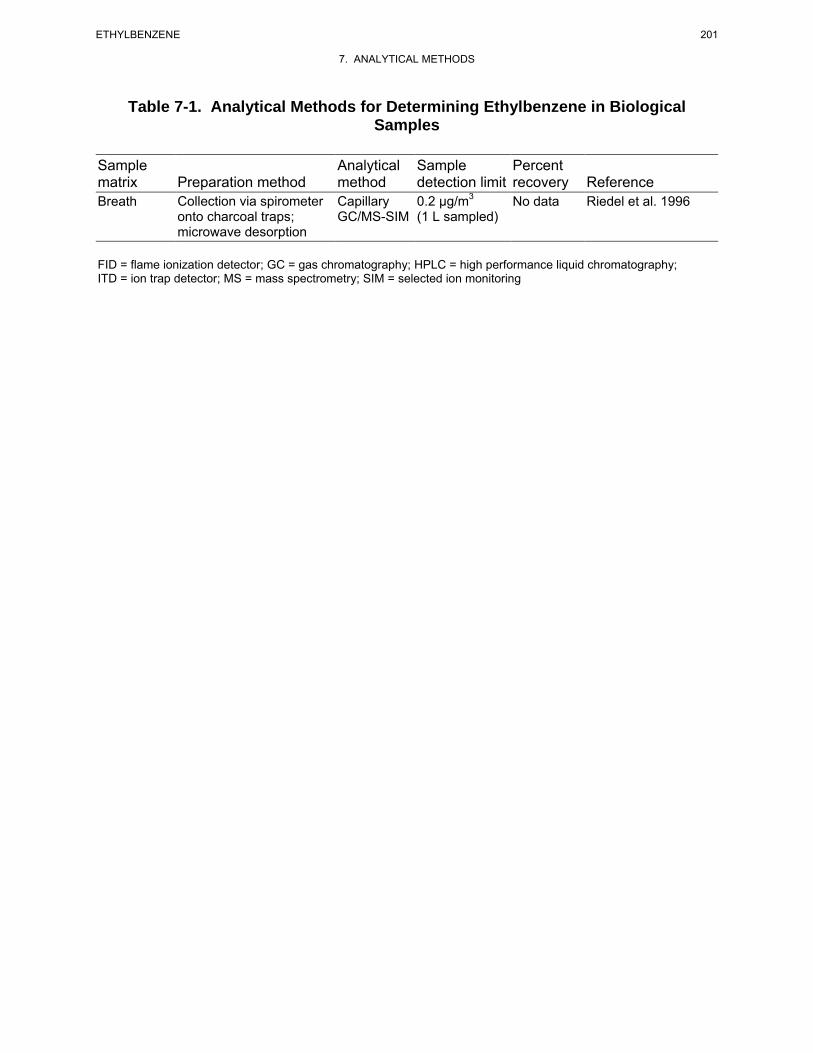
201 ETHYLBENZENE
7. ANALYTICAL METHODS
Table 7-1. Analytical Methods for Determining Ethylbenzene in Biological Samples
Sample Analytical Sample Percent matrix Preparation method method detection limit recovery Reference Breath Collection via spirometer Capillary 0.2 μg/m3 No data Riedel et al. 1996
onto charcoal traps; GC/MS-SIM (1 L sampled) microwave desorption
FID = flame ionization detector; GC = gas chromatography; HPLC = high performance liquid chromatography; ITD = ion trap detector; MS = mass spectrometry; SIM = selected ion monitoring
202 ETHYLBENZENE
7. ANALYTICAL METHODS
A spirometer is usually used for the collection of breath samples. The device is used to provide clean air
for inhalation and a mechanism for pumping exhaled breath into the collection media (Pellizzari et al.
1985). The breath samples are collected into Tedlar bags with subsequent adsorption onto Tenax traps
(Pellizzari et al. 1985) or into passivated stainless steel canisters (Thomas et al. 1991). The Tenax traps
are analyzed by thermal desorption GC techniques, and canister samples are analyzed by GC as well.
A sensitive and reliable method for identification and quantitation of ethylbenzene in samples of whole
blood taken from humans following exposure to VOCs has been developed by Ashley and coworkers at
the Centers for Disease Control and Prevention (Ashley et al. 1992, 1994). The method involves purge-
and-trap of a 10-mL blood sample with analysis by capillary GC/MS. Anti-foam procedures were used,
as well as special efforts to remove background levels of VOCs from reagents and equipment (Ashley et
al. 1992). The method is sensitive enough (ppt levels) to determine background levels of VOCs in the
population and provides adequate accuracy (114–118% recovery) and precision (16–44% relative
standard deviation [RSD]) for monitoring ethylbenzene in the population. Using GC/FID to analyze
capillary blood samples, Janasik et al. (2008) achieved a detection limit of 2.7 μg/L for ethylbenzene.
Few methods are available for the determination of ethylbenzene in body fluids and tissues other than
blood. A modified dynamic headspace method for determination of ethylbenzene in urine, mother's milk,
and adipose tissue has been reported (Michael et al. 1980). Volatiles swept from the sample are analyzed
by capillary GC/FID. Acceptable recovery was reported for model compounds, but detection limits were
not reported (Michael et al. 1980). Ethylbenzene in brain tissue may be determined using a headspace,
capillary/ion trap detector (ITD) technique (Schuberth 1996). Recovery was good (80–120%) as was
precision (≈20% RSD); the detection limit was reported as 4 ng/sample (0.038 nmoles) (Schuberth 1996).
Janasik et al. (2008) achieved a detection limit of 0.48 μg/L for detection of ethylbenzene in urine using
GC/FID. Biological monitoring for exposure to VOCs can also be based on identification of metabolites
in urine, as analyzed by GC (Janasik et al. (2008). Sensitive, reliable methods are available for measuring
ethylbenzene in breath. Exhaled breath is collected using a spirometer. The exhaled breath is collected
into Tedlar bags for later transfer to adsorption tubes (Wallace et al. 1982), into passivated canisters
(Thomas et al. 1991), or directly onto adsorbent traps (Riedel et al. 1996). The spirometer system, using
adsorption onto Tenax traps and analysis by thermal desorption/capillary GC/MS techniques, was field-
tested over the course of a very large exposure study (EPA 1987). The quantitation limit was ≈1 μg/m3,
recovery was 91–100%, and the precision for duplicate samples was ≤30% RSD (EPA 1987). Advances
in the methodology include development of a more compact system with collection in 1.8-L canisters
203 ETHYLBENZENE
7. ANALYTICAL METHODS
(Thomas et al. 1992). Recovery of ethylbenzene is 92–104%, precision for duplicate samples is <3%
RSD, and the detection limit was estimated as 3 μg/m3 for ethylbenzene (Thomas et al. 1992).
7.2 ENVIRONMENTAL SAMPLES
Methods are available for determining ethylbenzene in a variety of environmental matrices. A summary
of representative methods is shown in Table 7-2. Validated methods, approved by agencies and
organizations such as EPA, ASTM, APHA, and NIOSH, are available for air, water, and solid waste
matrices. Gas chromatography is the most widely used analytical technique for quantifying
concentrations of ethylbenzene in environmental matrices. Various detection devices used for GC include
FID, MS, and the photoionization detector (PID). Because of the complexity of the sample matrix and the
low concentration of VOCs in most environmental media, sample preconcentration is generally required
prior to GC analysis. Air samples may be collected and concentrated on adsorbent or in canisters for
subsequent analysis. Methods suitable for determining trace amounts of ethylbenzene in aqueous and
other environmental media include three basic approaches to the pretreatment of the sample: gas purge-
and-trap technique, headspace gas analysis, and extraction with organic solvent.
Gas purge-and-trap is the most widely used method for the isolation and concentration of VOCs in
environmental samples (Lesage 1993). The purge-and-trap technique offers advantages over other
techniques in that it allows facile isolation and concentration of target compounds, thereby improving
overall limits of detection and recovery of sample. Detection limits of <1 μg of ethylbenzene per liter of
sample have been achieved (APHA 1995c; EPA 1984c, 1991b, 1992a). A serious drawback of this
technique, particularly for quantitative analysis, is interference by impurities found in the stripping gas
(EPA 1994c).
A purge-and-trap method with GC/FID analysis (Otson and Williams 1982) or GC/MS (Otson and Chan
1987) has been reported for the analysis and quantitation of ethylbenzene in environmental samples.
Detection limits of <0.1 μg/L for GC/FID analysis and 0.1 μg/L were reported. Accuracy was also good,
74–88% (Otson and Chan 1987; Otson and Williams 1982).
Extraction with organic solvents (liquid-liquid extraction) provides a simple, rapid screening method for
semi-quantitative determination of ethylbenzene in aqueous samples containing limited number of VOCs,
but is less effective for aqueous samples containing large numbers of VOCs. Furthermore, interference
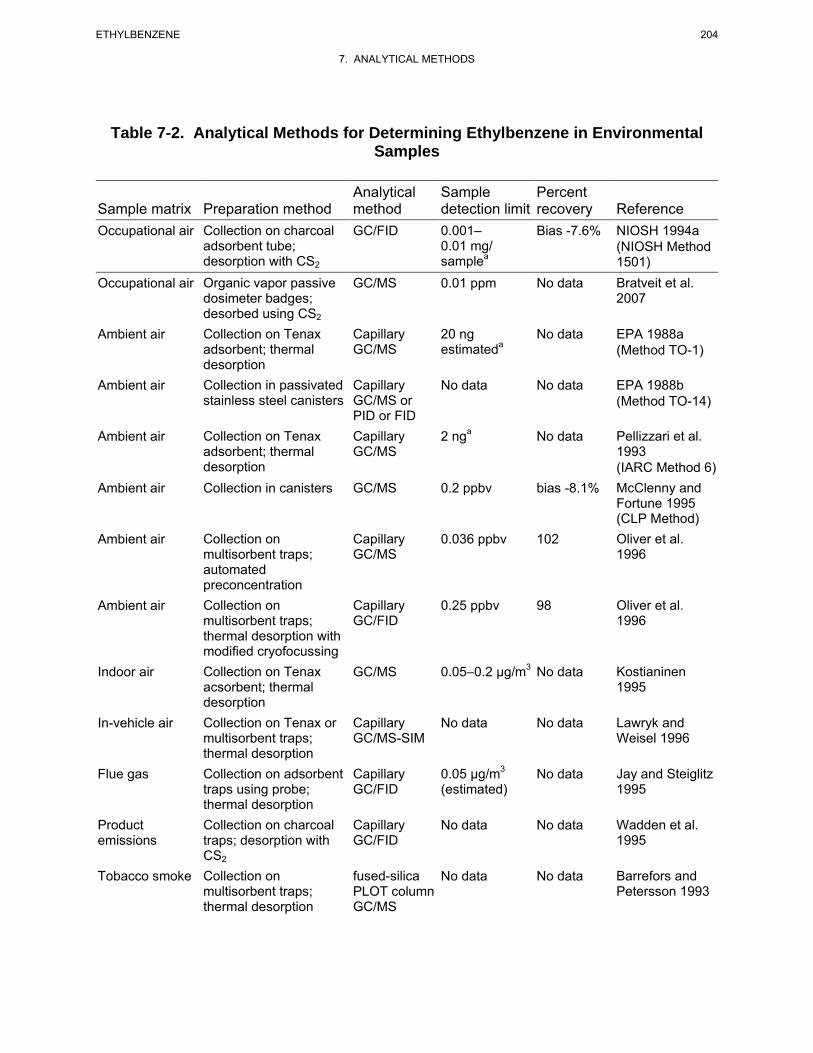
204 ETHYLBENZENE
7. ANALYTICAL METHODS
Table 7-2. Analytical Methods for Determining Ethylbenzene in Environmental Samples
Analytical Sample Percent Sample matrix Preparation method method detection limit recovery Reference Occupational air Collection on charcoal GC/FID 0.001– Bias -7.6% NIOSH 1994a
adsorbent tube; desorption with CS2
0.01 mg/ samplea
(NIOSH Method 1501)
Occupational air Organic vapor passive GC/MS 0.01 ppm No data Bratveit et al. dosimeter badges; 2007 desorbed using CS2
Ambient air Collection on Tenax adsorbent; thermal
Capillary GC/MS
20 ng estimateda
No data EPA 1988a (Method TO-1)
desorption Ambient air Collection in passivated Capillary No data No data EPA 1988b
stainless steel canisters GC/MS or PID or FID
(Method TO-14)
Ambient air Collection on Tenax Capillary 2 nga No data Pellizzari et al. adsorbent; thermal GC/MS 1993 desorption (IARC Method 6)
Ambient air Collection in canisters GC/MS 0.2 ppbv bias -8.1% McClenny and Fortune 1995 (CLP Method)
Ambient air Collection on Capillary 0.036 ppbv 102 Oliver et al. multisorbent traps; GC/MS 1996 automated preconcentration
Ambient air Collection on Capillary 0.25 ppbv 98 Oliver et al. multisorbent traps; GC/FID 1996 thermal desorption with modified cryofocussing
Indoor air Collection on Tenax GC/MS 0.05–0.2 μg/m3 No data Kostianinen acsorbent; thermal 1995 desorption
In-vehicle air Collection on Tenax or Capillary No data No data Lawryk and multisorbent traps; GC/MS-SIM Weisel 1996 thermal desorption
Flue gas Collection on adsorbent Capillary 0.05 μg/m3 No data Jay and Steiglitz traps using probe; GC/FID (estimated) 1995 thermal desorption
Product Collection on charcoal Capillary No data No data Wadden et al. emissions traps; desorption with GC/FID 1995
CS2
Tobacco smoke Collection on fused-silica No data No data Barrefors and multisorbent traps; PLOT column Petersson 1993 thermal desorption GC/MS
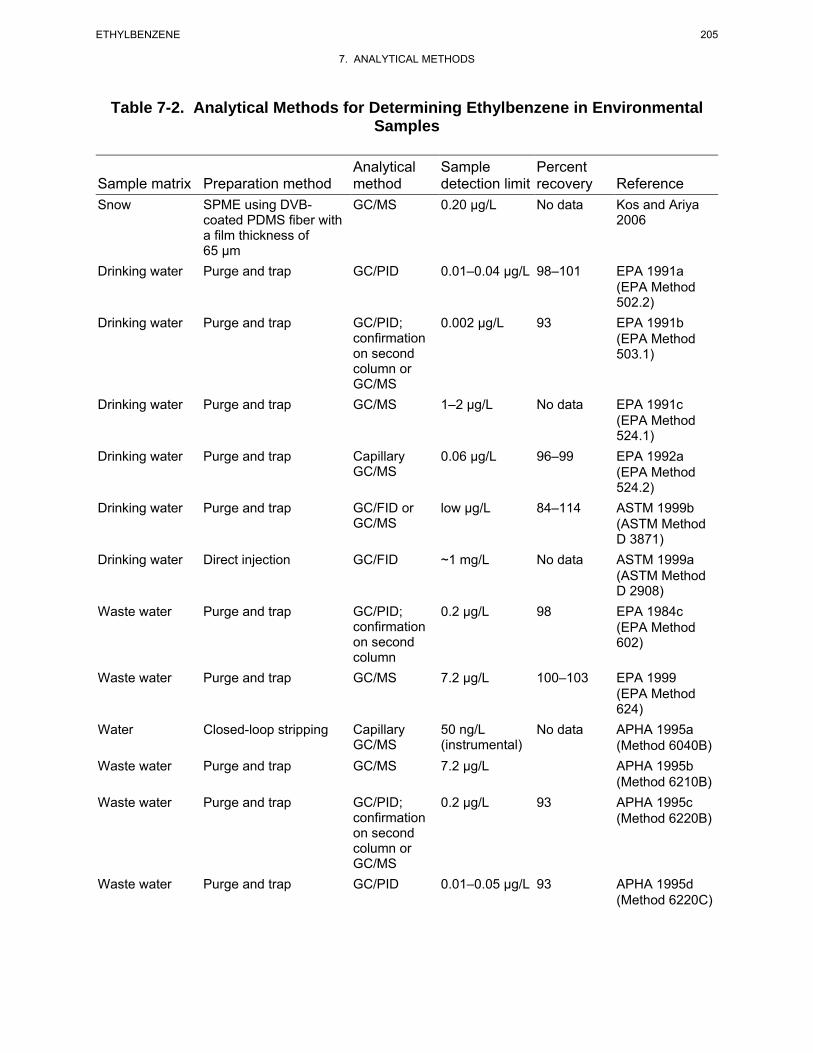
205 ETHYLBENZENE
7. ANALYTICAL METHODS
Table 7-2. Analytical Methods for Determining Ethylbenzene in Environmental Samples
Analytical Sample Percent Sample matrix Preparation method method detection limit recovery Reference Snow SPME using DVB GC/MS 0.20 μg/L No data Kos and Ariya
coated PDMS fiber with 2006 a film thickness of 65 μm
Drinking water Purge and trap GC/PID 0.01–0.04 μg/L 98–101 EPA 1991a (EPA Method 502.2)
Drinking water Purge and trap GC/PID; 0.002 μg/L 93 EPA 1991b confirmation on second column or
(EPA Method 503.1)
GC/MS Drinking water Purge and trap GC/MS 1–2 μg/L No data EPA 1991c
(EPA Method 524.1)
Drinking water Purge and trap Capillary 0.06 μg/L 96–99 EPA 1992a GC/MS (EPA Method
524.2) Drinking water Purge and trap GC/FID or low μg/L 84–114 ASTM 1999b
GC/MS (ASTM Method D 3871)
Drinking water Direct injection GC/FID ~1 mg/L No data ASTM 1999a (ASTM Method D 2908)
Waste water Purge and trap GC/PID; 0.2 μg/L 98 EPA 1984c confirmation on second column
(EPA Method 602)
Waste water Purge and trap GC/MS 7.2 μg/L 100–103 EPA 1999 (EPA Method 624)
Water Closed-loop stripping Capillary 50 ng/L No data APHA 1995a GC/MS (instrumental) (Method 6040B)
Waste water Purge and trap GC/MS 7.2 μg/L APHA 1995b (Method 6210B)
Waste water Purge and trap GC/PID; 0.2 μg/L 93 APHA 1995c confirmation on second
(Method 6220B)
column or GC/MS
Waste water Purge and trap GC/PID 0.01–0.05 μg/L 93 APHA 1995d (Method 6220C)
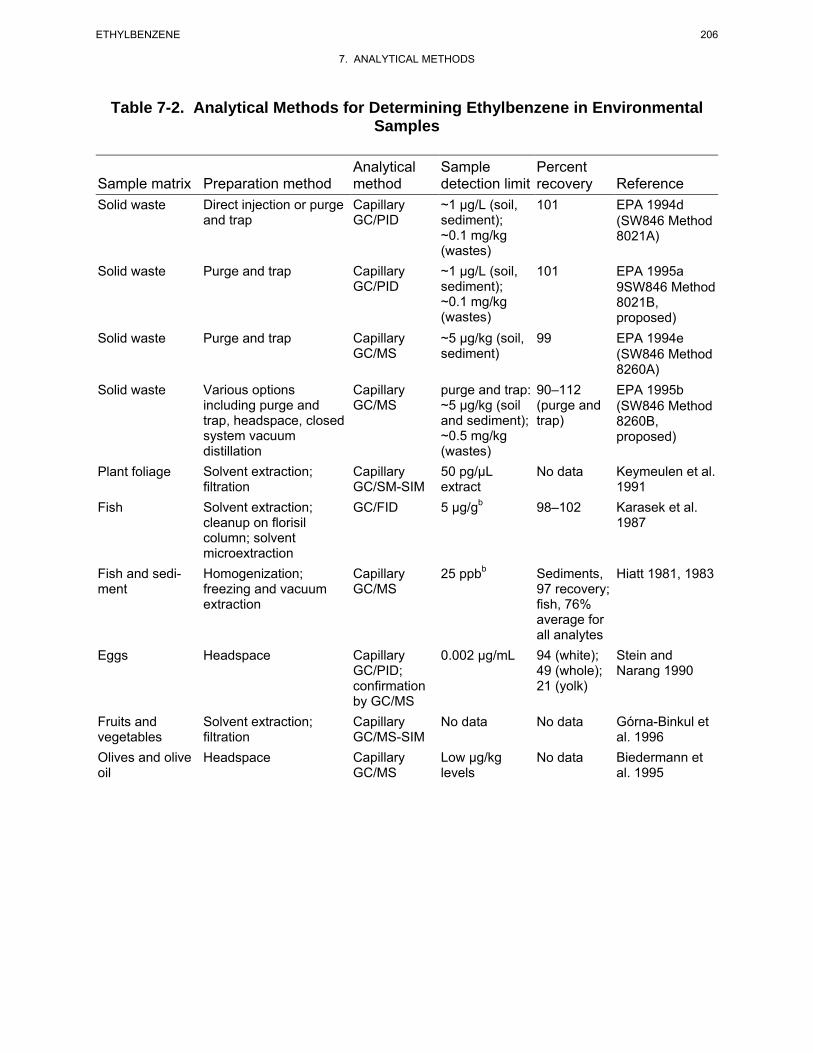
206 ETHYLBENZENE
7. ANALYTICAL METHODS
Table 7-2. Analytical Methods for Determining Ethylbenzene in Environmental Samples
Sample matrix Preparation method Analytical method
Sample detection limit
Percent recovery Reference
Solid waste Direct injection or purge and trap
Capillary GC/PID
~1 μg/L (soil, sediment); ~0.1 mg/kg (wastes)
101 EPA 1994d (SW846 Method 8021A)
Solid waste Purge and trap Capillary GC/PID
~1 μg/L (soil, sediment); ~0.1 mg/kg (wastes)
101 EPA 1995a 9SW846 Method 8021B, proposed)
Solid waste Purge and trap Capillary GC/MS
~5 μg/kg (soil, sediment)
99 EPA 1994e (SW846 Method 8260A)
Solid waste Various options including purge and trap, headspace, closed system vacuum distillation
Capillary GC/MS
purge and trap: ~5 μg/kg (soil and sediment); ~0.5 mg/kg (wastes)
90–112 (purge and trap)
EPA 1995b (SW846 Method 8260B, proposed)
Plant foliage Solvent extraction; filtration
Capillary GC/SM-SIM
50 pg/μL extract
No data Keymeulen et al. 1991
Fish Solvent extraction; cleanup on florisil column; solvent microextraction
GC/FID 5 μg/gb 98–102 Karasek et al. 1987
Fish and sediment
Homogenization; freezing and vacuum extraction
Capillary GC/MS
25 ppbb Sediments, 97 recovery; fish, 76% average for all analytes
Hiatt 1981, 1983
Eggs Headspace Capillary GC/PID; confirmation by GC/MS
0.002 μg/mL 94 (white); 49 (whole); 21 (yolk)
Stein and Narang 1990
Fruits and vegetables
Solvent extraction; filtration
Capillary GC/MS-SIM
No data No data Górna-Binkul et al. 1996
Olives and olive oil
Headspace Capillary GC/MS
Low μg/kg levels
No data Biedermann et al. 1995
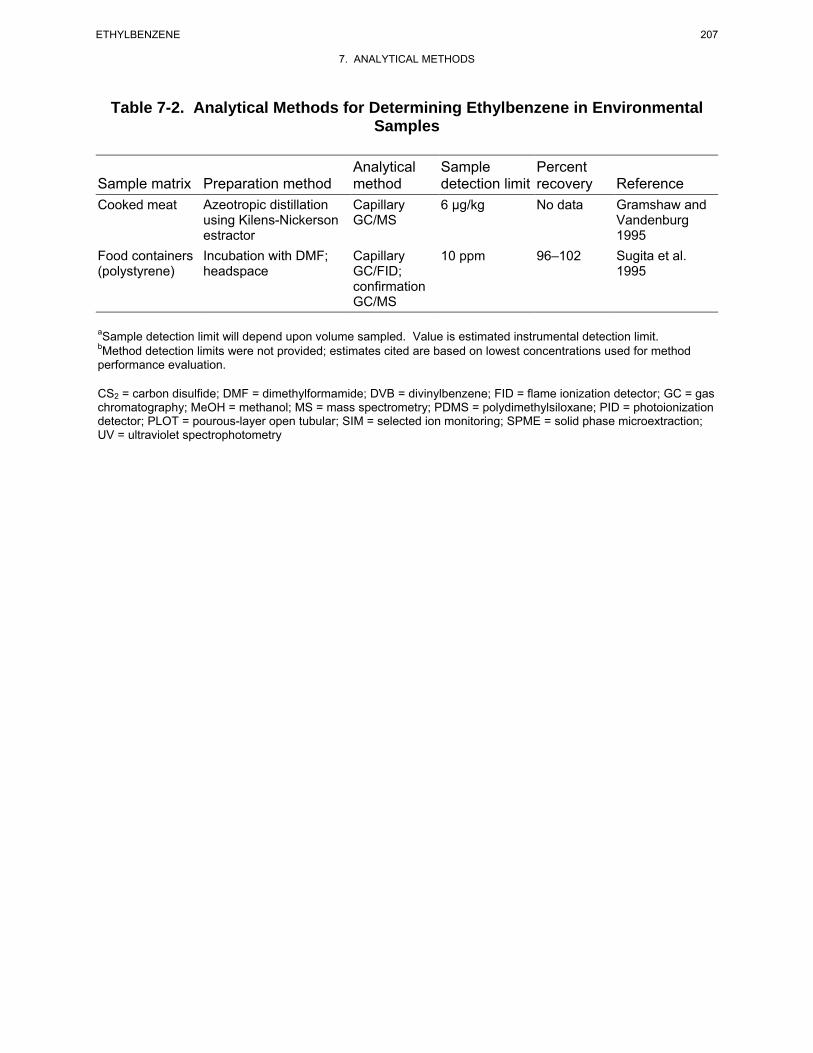
207 ETHYLBENZENE
7. ANALYTICAL METHODS
Table 7-2. Analytical Methods for Determining Ethylbenzene in Environmental Samples
Sample matrix Preparation method Analytical method
Sample detection limit
Percent recovery Reference
Cooked meat Azeotropic distillation using Kilens-Nickerson estractor
Capillary GC/MS
6 μg/kg No data Gramshaw and Vandenburg 1995
Food containers (polystyrene)
Incubation with DMF; headspace
Capillary GC/FID; confirmation
10 ppm 96–102 Sugita et al. 1995
GC/MS
aSample detection limit will depend upon volume sampled. Value is estimated instrumental detection limit.bMethod detection limits were not provided; estimates cited are based on lowest concentrations used for method performance evaluation.
CS2 = carbon disulfide; DMF = dimethylformamide; DVB = divinylbenzene; FID = flame ionization detector; GC = gas chromatography; MeOH = methanol; MS = mass spectrometry; PDMS = polydimethylsiloxane; PID = photoionization detector; PLOT = pourous-layer open tubular; SIM = selected ion monitoring; SPME = solid phase microextraction; UV = ultraviolet spectrophotometry
208 ETHYLBENZENE
7. ANALYTICAL METHODS
from the organic extraction solvent (hexane) makes it more difficult to completely identify all
components (Karasek et al. 1987; Otson and Williams 1981).
Ethylbenzene may be determined in occupational air using collection on multisorbent cartridges, solvent
desorption and analysis by GC/FID (NIOSH 1994a). Accuracy is very good (-7.6% bias); detection limits
depend upon the amount of air sampled. Ambient air samples may also be collected on adsorbent traps
(EPA 1988a; Pellizzari et al. 1993) or in stainless steel canisters (EPA 1988b; McClenny and Fortune
1995). Recovery for Tenax traps is very good, ranging from 91 to 100% (EPA 1987), and detection limits
of 0.01 ppm have been reported (Bratveil et al. 2007). Little information on accuracy is available for
multisorbent traps, but good recovery (102%) has been reported (Oliver et al. 1996). Bias of -8.1% for
canister collection has been reported (McClenny and Fortune 1995). Detection limits depend upon the
amount of air sampled, but values in the sub-ppb range have been reported (Kostiainen 1995; McClenny
and Fortune 1995; Oliver et al. 1996). Organic vapor passive dosimeter badges may be used to determine
personal exposure; the hydrocarbons are desorbed and analyzed by GC with GC/MS. Detection levels of
0.01 ppm for ethylbenzene have been reported (Bratveit et al. 2007). Purge-and-trap methodology is used
most often for determination of ethylbenzene in water and hazardous wastes (Lesage 1993). The method
was developed by Bellar and Lichtenberg (1974) for waste water. An inert gas is bubbled through the
sample to strip out volatile components. The analytes in the gas stream are adsorbed onto sorbent traps,
then thermally desorbed into the GC column. Very low detection limits for drinking water are reported
for the purge-and-trap method with GC/PID (0.002–0.04 μg/L) (EPA 1991b). Accuracy is very good
(93–101% recovery) (EPA 1991b). While the method is quite selective, confirmation using a second GC
column or GC/MS is recommended (EPA 1991b). A sensitive (0.06 μg/L) and reliable method (96–99%
recovery; <10% RSD) for drinking water uses capillary column GC/MS (EPA 1992a). Purge-and-trap
methodology with analysis by GC/PID or GC/MS is used for waste waters (APHA 1995b, 1995c, 1995d;
EPA 1984c, 1999). The detection limits are lower for GC/PID (0.2 μg/L) (EPA 1984c) than for GC/MS
(7.2 μg/L) (EPA 1984b), but confirmation on a second column is recommended (EPA 1984c) when PID
is used. Recovery and precision are very good (98–103% recovery; ≤10% RSD) (EPA 1984c, 1999).
Soil, sediment, and solid waste samples are difficult to analyze. Volatilization during sample handling
and homogenization can result in ethylbenzene losses. The wet sample is usually dispersed in a solvent,
then added to water for purge-and-trap/GC analysis (EPA 1994c; Minnich et al. 1997) or analyzed by
high performance liquid chromatography (HPLC) (Dawson et al. 2008). Capillary GC/PID or GC/MS
analysis provides detection limits in the low ppb range for soil and sediment and in the sub-ppm range for
209 ETHYLBENZENE
7. ANALYTICAL METHODS
solid wastes (EPA 1994d, 1994e, 1995a, 1995b). Minnich et al. (1997) reported detection limits as low as
1.7 ng/g using the GC method.
Few methods are available for the determination of ethylbenzene in fish and biota. A method for the
determination of ethylbenzene in fish at low ppm levels using solvent extraction with GC/FID analysis
has been reported (Karasek et al. 1987). A procedure to identify and quantify ethylbenzene in fish
samples by vacuum distillation with capillary column GC/MS has been reported (Hiatt 1981, 1983).
Recovery of 98–102% from spiked fish tissue was reported, but detection limits were not reported (Hiatt
1981). Purge-and-trap/capillary GC/MS has also been used for the determination of ethylbenzene in fish.
Performance data for fish tissue samples were not reported (Dreisch and Munson 1983).
Few methods are available for the determination of ethylbenzene in food. Available methods involve
solvent extraction (Górna-Binkul et al. 1996), headspace purge (Biedermann et al. 1995), and azeotropic
distillation (Gramshaw and Vandenburg 1995) followed by capillary GC/MS or GC/PID analysis.
Detection limits are in the low μg/kg range (Biedermann et al. 1995; Gramshaw and Vandenburg 1995).
Little performance data are available. Recoveries from 21% (egg yolk) to 94% (egg white) were reported
for headspace/capillary GC/PID analysis of eggs (Stein and Narang 1990).
Screening methods and field-portable methods may be useful analytical tools. Soil screening for
petroleum hydrocarbons, including ethylbenzene, can be conducted using immunoassay procedures (EPA
1995e). Sensitivity is in the ppm range. Solid phase microextraction (SPME) has been tested as a
screening method for water (Shirey 1995). The method is used in conjunction with capillary GC
techniques. Portable GCs have been used for field monitoring of air (Berkley et al. 1991), water (Driscoll
and Atwood 1993), soil (Driscoll and Atwood 1993), and hazardous waste (Overton et al. 1995). There
are several studies that compare portable GC methods with laboratory methods (Berkley et al. 1991;
Driscoll and Atwood 1993).
7.3 ADEQUACY OF THE DATABASE
Section 104(i)(5) of CERCLA, as amended, directs the Administrator of ATSDR (in consultation with the
Administrator of EPA and agencies and programs of the Public Health Service) to assess whether
adequate information on the health effects of ethylbenzene is available. Where adequate information is
not available, ATSDR, in conjunction with NTP, is required to assure the initiation of a program of
210 ETHYLBENZENE
7. ANALYTICAL METHODS
research designed to determine the health effects (and techniques for developing methods to determine
such health effects) of ethylbenzene.
The following categories of possible data needs have been identified by a joint team of scientists from
ATSDR, NTP, and EPA. They are defined as substance-specific informational needs that if met would
reduce the uncertainties of human health assessment. This definition should not be interpreted to mean
that all data needs discussed in this section must be filled. In the future, the identified data needs will be
evaluated and prioritized, and a substance-specific research agenda will be proposed.
7.3.1 Identification of Data Needs
Methods for Determining Biomarkers of Exposure and Effect.
Exposure. Exposure to ethylbenzene can be determined by the detection of mandelic acid and
phenylglycolic acid in urine or by direct detection of ethylbenzene in human blood. Environmental
exposures to ethylbenzene can result in detectable levels in human tissues. Existing methods for the
determination of ethylbenzene in blood have the sensitivity necessary (0.008–0.012 ppb) (Ashley et al.
1992) to detect and measure low to trace levels of ethylbenzene in blood that might be present in the
general population, as well as concentrations of ethylbenzene that might be associated with specific health
effects. Methods for measurement of ethylbenzene in exhaled breath are sensitive enough (low μg/m3)
(Thomas et al. 1991) to provide background levels of ethylbenzene in the general population as well as to
measure exposure. Additional performance information would be helpful, as would further development
of a portable breath collection system. Information on levels of ethylbenzene in tissues is limited and the
existing methods are not as well characterized. Improvements in the sensitivity of the methods for
measuring concentrations of ethylbenzene in tissues and additional performance data would be helpful.
Methods for measuring metabolites and biomarkers for ethylbenzene are shown in Table 7-3. Methods
exist for measuring ppm levels of ethylbenzene metabolites in urine (Ogata and Taguchi 1987, 1988;
Sollenberg et al. 1985). They are sufficiently sensitive for measuring occupational exposure to
ethylbenzene. These analytical methods are reliable and precise, but may not be sensitive enough to
measure non-occupational exposure. Improvements in the sensitivity of the methods for measuring
concentrations of ethylbenzene in tissues, and improvements in the sensitivity for measurement of
metabolites in urine would allow better assessment of the correlation between levels in these media and
observed health effects.
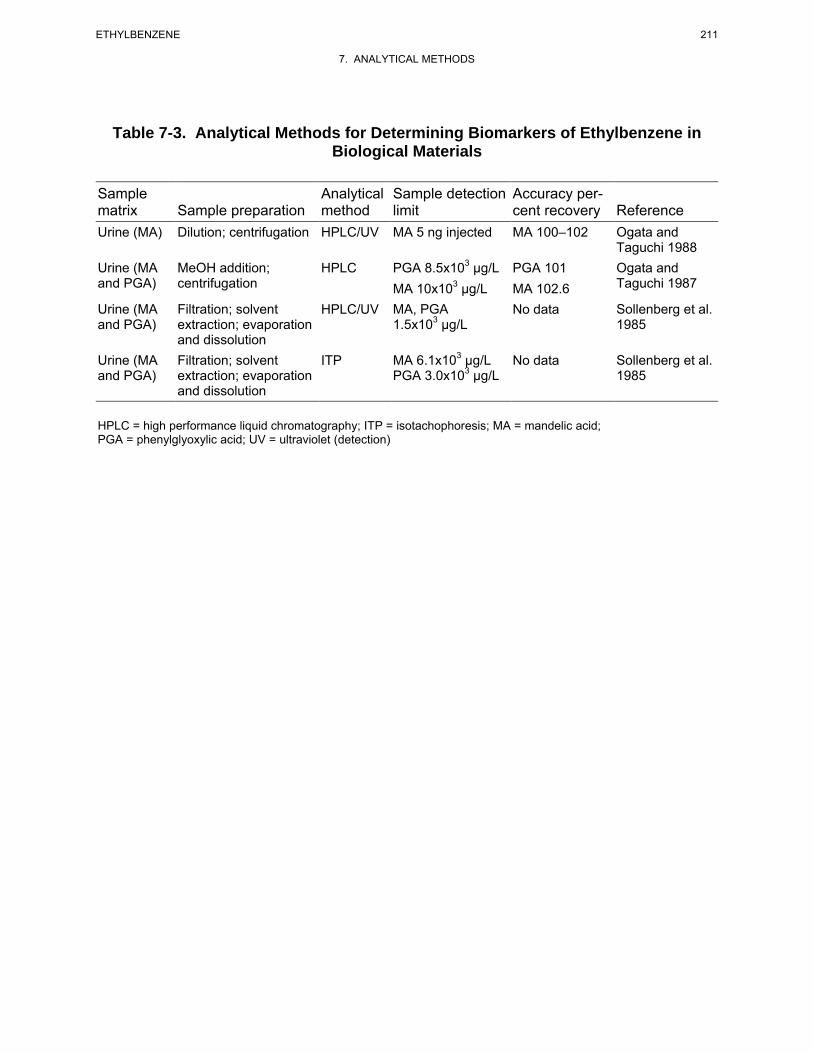
211 ETHYLBENZENE
7. ANALYTICAL METHODS
Table 7-3. Analytical Methods for Determining Biomarkers of Ethylbenzene in Biological Materials
Sample Analytical Sample detection Accuracy per-matrix Sample preparation method limit cent recovery Reference Urine (MA) Dilution; centrifugation HPLC/UV MA 5 ng injected MA 100–102 Ogata and
Taguchi 1988 Urine (MA MeOH addition; HPLC PGA 8.5x10³ μg/L PGA 101 Ogata and and PGA) centrifugation MA 10x103 μg/L MA 102.6 Taguchi 1987
Urine (MA and PGA)
Filtration; solvent extraction; evaporation
HPLC/UV MA, PGA 1.5x10³ μg/L
No data Sollenberg et al. 1985
and dissolution Urine (MA and PGA)
Filtration; solvent extraction; evaporation
ITP MA 6.1x10³ μg/L PGA 3.0x10³ μg/L
No data Sollenberg et al. 1985
and dissolution
HPLC = high performance liquid chromatography; ITP = isotachophoresis; MA = mandelic acid; PGA = phenylglyoxylic acid; UV = ultraviolet (detection)
212 ETHYLBENZENE
7. ANALYTICAL METHODS
Effect. No specific biomarkers of effect for ethylbenzene were identified.
Methods for Determining Parent Compounds and Degradation Products in Environmental Media. Sensitive methods are available for measuring background levels of ethylbenzene in air, water,
and wastes, the media of most concern for exposure of the general population and those populations
located near hazardous waste sites. Few methods are available for measuring levels of ethylbenzene in
fish, plants and biota. Detection limits in the low ppb range have been reported (Dreisch and Munson
1983; Hiatt 1981; Karasek et al. 1987; Keymeulen et al. 1991), but other performance data are generally
lacking. Few methods are available for measuring levels of ethylbenzene in food. Little performance
data are available for the available methods. Although several good analytical methods are available for
detecting ethylbenzene in some environmental media, validated, reliable methods for measuring
ethylbenzene in fish and foods are needed. These would be helpful in evaluating the potential for human
exposure and health effects that might result from ethylbenzene contamination.
Methods for detecting environmental degradation products of ethylbenzene in environmental media are
summarized in Table 7-4. Although methods are available for detecting major environmental degradation
products (1-phenylethanol, acetophenone, benzaldehyde, for example) in reaction mixtures, it is not
known whether these methods have the sensitivity and specificity for application to environmental media.
Sensitive, reliable methods for determining degradation products in air, water, and waste would be
helpful.
7.3.2 Ongoing Studies
The Environmental Health Laboratory Sciences Division of the National Center for Environmental
Health, Centers for Disease Control and Prevention, is developing methods for the analysis of
ethylbenzene and other volatile organic compounds in blood. These methods use purge and trap
methodology, high-resolution gas chromatography, and magnetic sector mass spectrometry, which give
detection limits in the low ppt range.
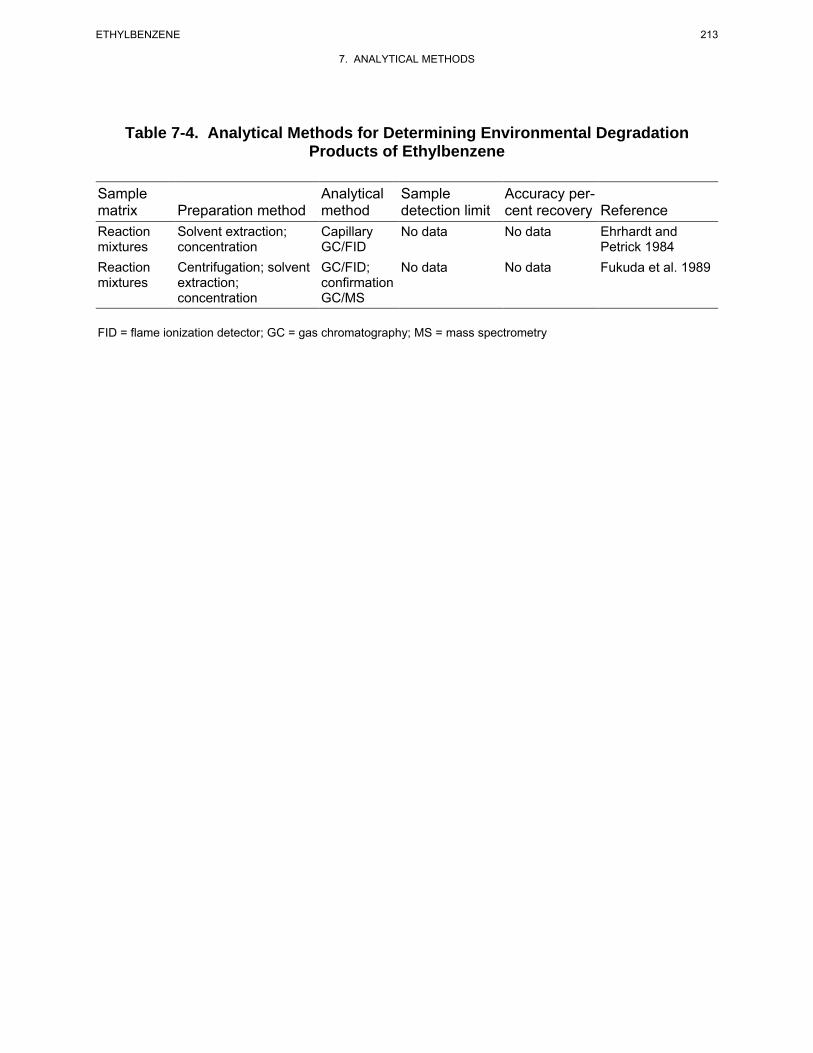
213 ETHYLBENZENE
7. ANALYTICAL METHODS
Table 7-4. Analytical Methods for Determining Environmental Degradation Products of Ethylbenzene
Sample matrix Preparation method
Analytical method
Sample detection limit
Accuracy percent recovery Reference
Reaction mixtures
Solvent extraction; concentration
Capillary GC/FID
No data No data Ehrhardt and Petrick 1984
Reaction mixtures
Centrifugation; solvent extraction; concentration
GC/FID; confirmation GC/MS
No data No data Fukuda et al. 1989
FID = flame ionization detector; GC = gas chromatography; MS = mass spectrometry

214 ETHYLBENZENE
7. ANALYTICAL METHODS
This page is intentionally blank.
215 ETHYLBENZENE
8. REGULATIONS, ADVISORIES, AND GUIDELINES
MRLs are substance specific estimates, which are intended to serve as screening levels, are used by
ATSDR health assessors and other responders to identify contaminants and potential health effects that
may be of concern at hazardous waste sites.
ATSDR has derived an acute-duration inhalation MRL of 5 ppm for ethylbenzene based on a BMCL for
auditory threshold shifts observed in rats exposed to ethylbenzene 8 hours/day for 5 days (Cappaert et al.
2000). The BMCL was estimated using an internal dose metric to simulate time averaged arterial blood
concentration of ethylbenzene; a human equivalent concentration (HEC) of the BMCL was estimated
using a human PBPK model. This BMCLHEC of 154.26 ppm was divided by an uncertainty factor of
30 (3 for animal to human extrapolation with dosimetric adjustment and 10 for human variability).
ATSDR has derived an intermediate-duration inhalation MRL of 2 ppm for ethylbenzene based on a
BMCL for auditory threshold shifts observed in rats exposed to ethylbenzene 6 hours/day, 6 days/week
for 4–13 weeks (Gagnaire et al. 2007). The BMCL was estimated using an internal dose metric to
simulate time averaged arterial blood concentration of ethylbenzene; a HEC of the BMCL was estimated
using a human PBPK model. This BMCLHEC of 63.64 ppm divided by an uncertainty factor of 30 (3 for
animal to human extrapolation with dosimetric adjustment and 10 for human variability).
ATSDR has derived a chronic-duration inhalation MRL of 0.06 ppm for ethylbenzene based on a LOAEL
for a significant increase in the severity of nephropathy in female rats exposed to ethylbenzene by
inhalation for 6 hours/day, 5 days/week for 104 weeks (NTP 1999). Using a PBPK model, an internal
dose metric (time averaged arterial blood concentration of ethylbenzene, MCA) of the LOAEL of 75 ppm
was simulated. The HEC of this LOAELMCA (17.45 ppm) was divided an uncertainty factor of 300
(10 for use of a LOAEL, 3 for animal to human extrapolation with dosimetric adjustment, and 10 for
human variability).
The EPA inhalation reference concentration (RfC) (verified in 1991) for ethylbenzene is 1 mg/m3
(equivalent to 0.23 ppm), based on developmental toxicity seen in rats and rabbits exposed to
4,340 mg/m3 (Hardin et al. 1981; IRIS 2007; NIOSH 1981).
ATSDR has derived an intermediate-duration oral MRL of 0.4 mg/kg/day for ethylbenzene based on a
BMDL for hepatotoxicity (centrilobular hepatocyte hypertrophy) in male rats exposed to ethylbenzene by
216 ETHYLBENZENE
8. REGULATIONS, ADVISORIES, AND GUIDELINES
gavage for 13 weeks (Mellert et al. 2007). The BMDL was estimated using an internal dose metric to
simulate time averaged liver concentrations of ethylbenzene; a HED of the BMDL was estimated using a
human PBPK model. This BMDLHED of 10.68 mg/kg/day was divided by an uncertainty factor of 30
(3 for animal to human extrapolation with dosimetric adjustment and 10 for human variability).
The EPA oral reference dose (RfD) for ethylbenzene is 0.1 mg/kg/day, based on the LOAEL for liver and
kidney toxicity in rats administered 291 mg/kg/day ethylbenzene via gavage 5 days/week for 182 days
(Wolf et al. 1956). The RfD was calculated by dividing the NOAEL of 97 mg/kg/day by an uncertainty
factor of 1,000 (10 for use of a subchronic study, 10 for interspecies extrapolation, and 10 for intraspecies
variability).
The international and national regulations, advisories, and guidelines regarding ethylbenzene in air, water,
and other media are summarized in Table 8-1.
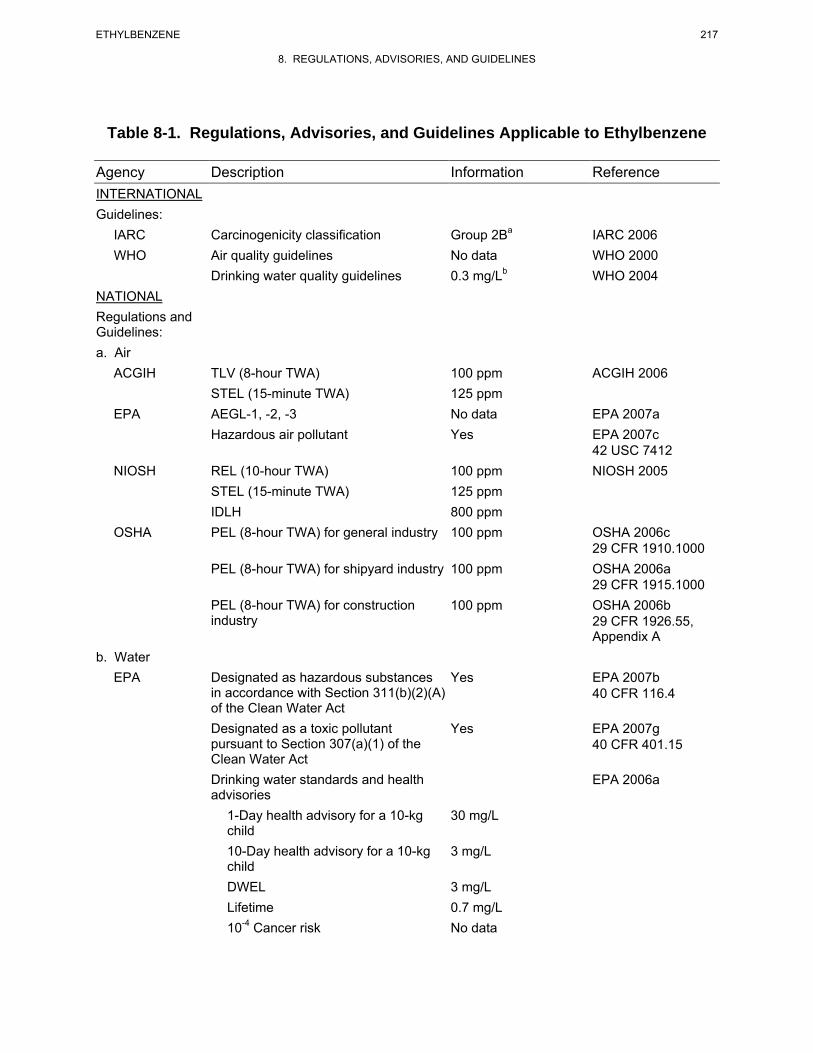
217 ETHYLBENZENE
8. REGULATIONS, ADVISORIES, AND GUIDELINES
Table 8-1. Regulations, Advisories, and Guidelines Applicable to Ethylbenzene
Agency Description Information Reference INTERNATIONAL Guidelines:
IARC Carcinogenicity classification Group 2Ba IARC 2006 WHO Air quality guidelines
Drinking water quality guidelines No data 0.3 mg/Lb
WHO 2000 WHO 2004
NATIONAL Regulations and Guidelines: a. Air
ACGIH TLV (8-hour TWA) 100 ppm ACGIH 2006 STEL (15-minute TWA) 125 ppm
EPA AEGL-1, -2, -3 No data EPA 2007a Hazardous air pollutant Yes EPA 2007c
42 USC 7412 NIOSH REL (10-hour TWA) 100 ppm NIOSH 2005
STEL (15-minute TWA) 125 ppm IDLH 800 ppm
OSHA PEL (8-hour TWA) for general industry 100 ppm OSHA 2006c 29 CFR 1910.1000
PEL (8-hour TWA) for shipyard industry 100 ppm OSHA 2006a 29 CFR 1915.1000
PEL (8-hour TWA) for construction industry
100 ppm OSHA 2006b 29 CFR 1926.55, Appendix A
b. Water EPA Designated as hazardous substances
in accordance with Section 311(b)(2)(A) of the Clean Water Act
Yes EPA 2007b 40 CFR 116.4
Designated as a toxic pollutant pursuant to Section 307(a)(1) of the Clean Water Act
Yes EPA 2007g 40 CFR 401.15
Drinking water standards and health advisories
EPA 2006a
1-Day health advisory for a 10-kg child
30 mg/L
10-Day health advisory for a 10-kg child
3 mg/L
DWEL 3 mg/L Lifetime 10-4 Cancer risk
0.7 mg/L No data
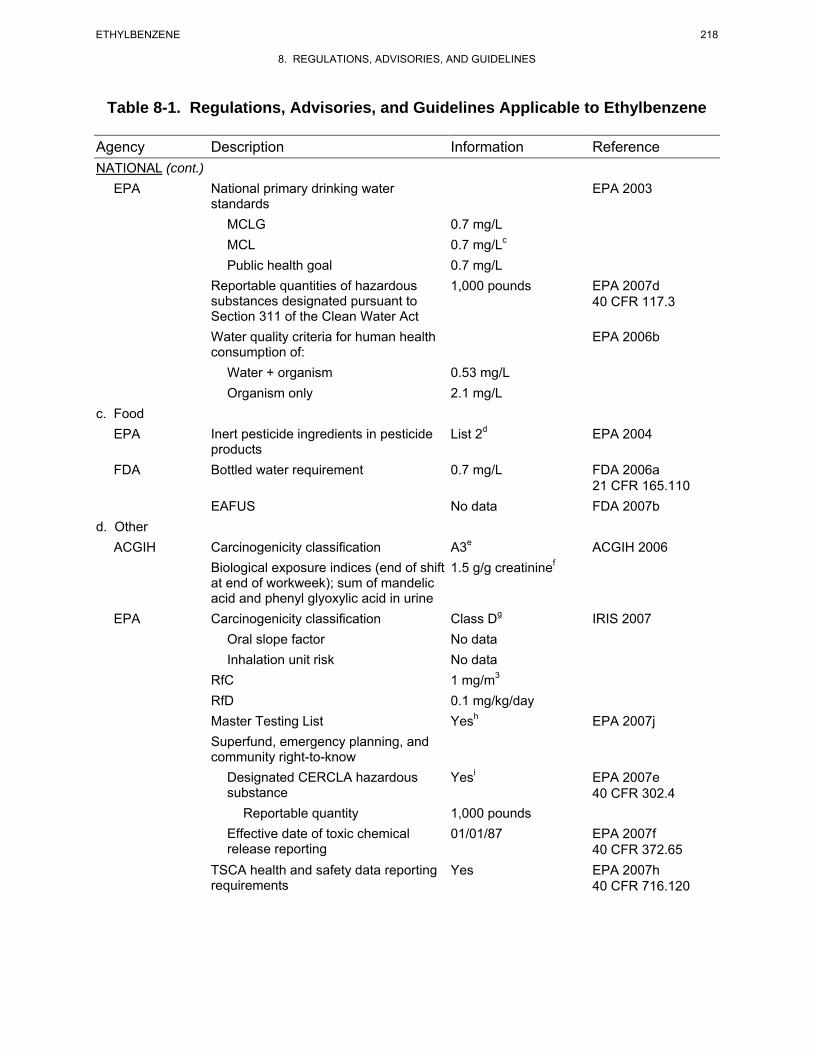
218 ETHYLBENZENE
8. REGULATIONS, ADVISORIES, AND GUIDELINES
Table 8-1. Regulations, Advisories, and Guidelines Applicable to Ethylbenzene
Agency Description Information Reference NATIONAL (cont.)
EPA National primary drinking water standards
EPA 2003
MCLG 0.7 mg/L MCL 0.7 mg/Lc
Public health goal 0.7 mg/L Reportable quantities of hazardous substances designated pursuant to Section 311 of the Clean Water Act
1,000 pounds EPA 2007d 40 CFR 117.3
Water quality criteria for human health consumption of:
EPA 2006b
Water + organism 0.53 mg/L Organism only 2.1 mg/L
c. Food EPA Inert pesticide ingredients in pesticide
products List 2d EPA 2004
FDA Bottled water requirement 0.7 mg/L FDA 2006a 21 CFR 165.110
EAFUS No data FDA 2007b d. Other
ACGIH Carcinogenicity classification A3e
Biological exposure indices (end of shift at end of workweek); sum of mandelic acid and phenyl glyoxylic acid in urine
1.5 g/g creatininef ACGIH 2006
EPA Carcinogenicity classification Class Dg IRIS 2007 Oral slope factor No data Inhalation unit risk No data
RfC 1 mg/m3
RfD Master Testing List
0.1 mg/kg/day Yesh EPA 2007j
Superfund, emergency planning, and community right-to-know
Designated CERCLA hazardous substance
Yesi EPA 2007e 40 CFR 302.4
Reportable quantity 1,000 pounds Effective date of toxic chemical release reporting
01/01/87 EPA 2007f 40 CFR 372.65
TSCA health and safety data reporting requirements
Yes EPA 2007h 40 CFR 716.120
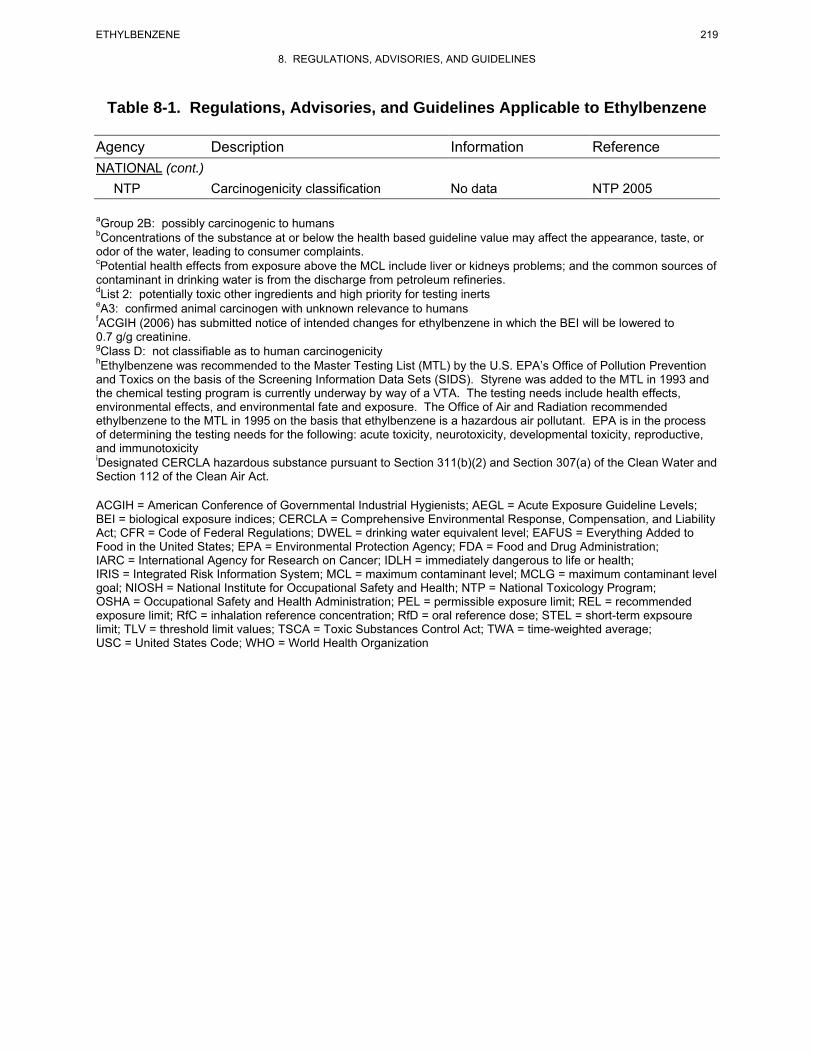
219 ETHYLBENZENE
8. REGULATIONS, ADVISORIES, AND GUIDELINES
Table 8-1. Regulations, Advisories, and Guidelines Applicable to Ethylbenzene
Agency Description Information Reference NATIONAL (cont.)
NTP Carcinogenicity classification No data NTP 2005
aGroup 2B: possibly carcinogenic to humans bConcentrations of the substance at or below the health based guideline value may affect the appearance, taste, or odor of the water, leading to consumer complaints. cPotential health effects from exposure above the MCL include liver or kidneys problems; and the common sources of contaminant in drinking water is from the discharge from petroleum refineries.dList 2: potentially toxic other ingredients and high priority for testing inerts eA3: confirmed animal carcinogen with unknown relevance to humans fACGIH (2006) has submitted notice of intended changes for ethylbenzene in which the BEI will be lowered to 0.7 g/g creatinine. gClass D: not classifiable as to human carcinogenicity hEthylbenzene was recommended to the Master Testing List (MTL) by the U.S. EPA’s Office of Pollution Prevention and Toxics on the basis of the Screening Information Data Sets (SIDS). Styrene was added to the MTL in 1993 and the chemical testing program is currently underway by way of a VTA. The testing needs include health effects, environmental effects, and environmental fate and exposure. The Office of Air and Radiation recommended ethylbenzene to the MTL in 1995 on the basis that ethylbenzene is a hazardous air pollutant. EPA is in the process of determining the testing needs for the following: acute toxicity, neurotoxicity, developmental toxicity, reproductive, and immunotoxicityiDesignated CERCLA hazardous substance pursuant to Section 311(b)(2) and Section 307(a) of the Clean Water and Section 112 of the Clean Air Act.
ACGIH = American Conference of Governmental Industrial Hygienists; AEGL = Acute Exposure Guideline Levels; BEI = biological exposure indices; CERCLA = Comprehensive Environmental Response, Compensation, and Liability Act; CFR = Code of Federal Regulations; DWEL = drinking water equivalent level; EAFUS = Everything Added to Food in the United States; EPA = Environmental Protection Agency; FDA = Food and Drug Administration; IARC = International Agency for Research on Cancer; IDLH = immediately dangerous to life or health; IRIS = Integrated Risk Information System; MCL = maximum contaminant level; MCLG = maximum contaminant level goal; NIOSH = National Institute for Occupational Safety and Health; NTP = National Toxicology Program; OSHA = Occupational Safety and Health Administration; PEL = permissible exposure limit; REL = recommended exposure limit; RfC = inhalation reference concentration; RfD = oral reference dose; STEL = short-term expsoure limit; TLV = threshold limit values; TSCA = Toxic Substances Control Act; TWA = time-weighted average; USC = United States Code; WHO = World Health Organization

220 ETHYLBENZENE
8. REGULATIONS, ADVISORIES, AND GUIDELINES
This page is intentionally blank.
_______________________
221 ETHYLBENZENE
9. REFERENCES
Abraham MH, Ibrahim A, Acree WE. 2005. Air to blood distribution of volatile organic compounds: A linear free energy analysis. Chem Res Toxicol 18(5):904-911.
ACGIH. 1992. 1992-1993 Threshold limit values for chemical substances and physical agents and biological exposure indices. Cincinnati, OH: American Conference of Governmental Industrial Hygienists, 21.
ACGIH. 2002. Ethylbenzene. Documentation of the threshold limit values for chemical substances and physical agents and biological exposure indices. 7th ed. Cincinnati, OH: American Conference of Governmental Industrial Hygienists.
ACGIH. 2006. Ethylbenzene. Threshold limit values for chemical substances and physical agents and biological exposure indices. Cincinnati, OH: American Conference of Governmental Industrial Hygienists, 29, 104.
Acton DW, Barker JF. 1992. In situ biodegradation potential of aromatic hydrocarbons in anaerobic groundwaters. J Contam Hydrol 9:325-352.
Adinolfi M. 1985. The development of the human blood-CSF-brain barrier. Dev Med Child Neurol 27(4):532-537.
Adlercreutz H. 1995. Phytoestrogens: Epidemiology and a possible role in cancer protection. Environ Health Perspect Suppl 103(7):103-112.
Agency for Toxic Substances and Disease Registry. 1989. Decision guide for identifying substance-specific data needs related to toxicological profiles; Notice. Agency for Toxic Substances and Disease Registry, Division of Toxicology. Fed Regist 54(174):37618-37634.
Agency for Toxic Substances and Disease Registry. 1990. Biomarkers of organ damage or dysfunction for the renal, hepatobiliary and immune systems. Subcommittee on Biomarkers of Organ Damage and Dysfunction. Atlanta, GA: Agency for Toxic Substances and Disease Registry.
Agency for Toxic Substances and Disease Registry. 1992. Toxicological profile for styrene. Agency for Toxic Substances and Disease Registry. http://www.atsdr.cdc.gov/toxprofiles/tp53.pdf. August 02, 2007.
Agency for Toxic Substances and Disease Registry. 1995. Toxicological profile for gasoline. Agency for Toxic Substances and Disease Registry. http://www.atsdr.cdc.gov/toxprofiles/tp72.html. August 14, 2007.
Altman PL, Dittmer DS. 1974. Biological handbooks: Biology data book. Vol. III. 2nd ed. Bethesda, MD: Federation of American Societies for Experimental Biology, 1987-2008, 2041.
*Not cited in text
222 ETHYLBENZENE
9. REFERENCES
American Chemistry Council. 2007. Voluntary children's chemical evaluation program (VCCEP). Tier I pilot submission for ethylbenzene. American Chemistry Council. Toxicology Excellence for Risk Assessment. http://www.tera.org/Peer/VCCEP/Ethylbenzene/VCCEP%20Ethylbenzene%20Revised%20Doc%20-august%2010%202007.pdf. February 10, 2009.
*Amoore JE, Hautala E. 1983. Odor as an aid to chemical safety: Odor thresholds compared with threshold limit values and volatilities for 214 industrial chemicals in air and water dilution. J Appl Toxicol 3:272-290.
Andersen ME, Krishnan K. 1994. Relating in vitro to in vivo exposures with physiologically based tissue dosimetry and tissue response models. In: Salem H, ed. Animal test alternatives: Refinement, reduction, replacement. New York: Marcel Dekker, Inc., 9-25.
Andersen ME, MacNaughton MG, Clewell HJ, et al. 1987. Adjusting exposure limits for long and short exposure periods using a physiological pharmacokinetic model. Am Ind Hyg Assoc J 48(4):335-343.
Andersson K, Fuxe K, Nilsen OG, et al. 1981. Production of discrete changes in dopamine and noradrenaline levels and turnover in various parts of the rat brain following exposure to xylene, ortho-, meta-, and para-xylene, and ethylbenzene. Toxicol Appl Pharmacol 60:535-548.
Aneja VP. 1993. Organic compounds in cloud water and their deposition at a remote continental site. J Air Waste Manage Assoc 43:1239-1244.
Angerer J, Lehnert G. 1979. Occupational chronic exposure to organic solvents. Int Arch Occup Environ Health 43:145-150.
Angerer J, Wulf H. 1985. Occupational chronic exposure to organic solvents. XI. Alkylbenzene exposure of varnish workers: Effects on hematopoietic system. Int Arch Occup Environ Health 56:307-321.
Anid PJ, Alvarez PJJ, Vogel TM. 1993. Biodegradations of monoaromatic hydrocarbons in aquifer columns amended with hydrogen peroxide and nitrate. Wat Res 27(4):685-691.
Antoine SR, DeLeon IR, O'Dell-Smith RM. 1986. Environmentally significant volatile organic pollutants in human blood. Bull Environ Contam Toxicol 36:364-371.
APHA. 1995a. Method 6040 B. Closed-loop stripping, gas chromatography/mass spectrometric analysis. In: Eaton AD, Clesceri LS, Greenberg AE, eds. Standard methods for the examination of water and wastewater. Washington, DC: American Public Health Association. American Water Works Association. Water Environmental Federation, 6-7 to 6-16.
APHA. 1995b. Method 6210 B. Purge and trap packed-column gas chromatographic/mass spectrometric method I. In: Eaton AD, Clesceri LS, Greenberg AE, eds. Standard methods for the examination of water and wastewater. Washington, DC: American Public Health Association. American Water Works Association. Water Environmental Federation, 6-17 to 6-25.
APHA. 1995c. Method 6220 B. Purge and trap gas chromatographic method I. In: Eaton AD, Clesceri LS, Greenberg AE, eds. Standard methods for the examination of water and wastewater. Washington, DC: American Public Health Association. American Water Works Association. Water Environmental Federation, 6-39 to 6-41.
223 ETHYLBENZENE
9. REFERENCES
APHA. 1995d. Method 6220 C. Purge and trap gas chromatographic method II. In: Eaton AD, Clesceri LS, Greenberg AE, eds. Standard methods for the examination of water and wastewater. Washington, DC: American Public Health Association. American Water Works Association. Water Environmental Federation, 6-42 to 6-46.
Ashley DL, Prah JD. 1997. Time dependence of blood concentrations during and after exposure to a mixture of volatile organic compounds. Arch Environ Health 52(1):26-33.
Ashley DL, Bonin MA, Cardinali FL. 1992. Determining volatile organic compounds in human blood from a large sample production by using purge and trap gas chromatography-mass spectrometry. Anal Chem 64(9):1021-1029.
Ashley DL, Bonin MA, Cardinali FL, et al. 1994. Blood concentration of volatile organic compounds in a nonoccupationally exposed U.S. population and in groups with suspected exposure. Clin Chem 40(7):1401-1409.
Ashley DL, Bonin MA, Hamar B, et al. 1995. Removing the smoking confounder from blood volatile organic compounds measurements. Environ Res 7(1):39-45.
Assmuth T, Kalevi K. 1992. Concentrations and toxicological significance of trace organic compounds in municipal solid waste landfill gas. Chemosphere 24(9):1207-1216.
ASTER. 1995. ASTER (Assessment Tools for the Evaluation of Risk) ecotoxicity profile. Duluth, MN: U.S. Environmental Protection Agency, Environmental Research Laboratory.
ASTM. 1999a. D 2908-91. Standard practice for measuring volatile organic matter in water by aqueous-injection gas chromatography. In: Allen RF, Baldini NC, Donofrio et al., eds. 1999 Annual book of ASTM standards. Vol. 11.02. Section 11: Water and environmental technology, 168-173.
ASTM. 1999b. D 3871-84. Standard test method for purgeable organic compounds in water using headspace sampling. In: Allen RF, Baldini NC, Donofrio PE, et al., eds. 1999 Annual book of ASTM standards. Vol. 11.02. Section 11: Water and environmental technology, 348-358.
Atkinson R, Carter WPL. 1984. Kinetics and mechanisms of the gas-phase reactions of ozone with organic compounds under atmospheric conditions. Chem Rev 84:437-470.
Atkinson R, Aschmann SM, Winer AM. 1987. Kinetics of the reactions of NO3 radicals with a series of aromatic compounds. Environ Sci Technol 21:1123-1126.
Atkinson R, Darnall KR, Pitts JN. 1978. Rate constraints for reaction of OH radicals and ozone with cresols at 300±1 K. J Phys Chem 82:2759-2761.
Backer LC, Egeland GM, Ashley DL, et al. 1997. Exposure to regular gasoline and ethanol oxyfuel during refueling in Alaska. Environ Health Perspect 105(8):850-855.
*Backes WL, Sequeira DJ, Cawley GF, et al. 1993. Relationship between hydrocarbon structure and induction of P450: Effects on protein levels and enzyme activities. Xenobiotica 23(12):1353-1366.
Bakke OM, Scheline RR. 1970. Hydroxylation of aromatic hydrocarbons in the rat. Toxicol Appl Pharmacol 16:691-700.
224 ETHYLBENZENE
9. REFERENCES
Bardodej Z, Bardodejova E. 1970. Biotransformation of ethylbenzene, styrene, and alpha-methylstyrene in man. Am Ind Hyg Assoc J 31:206-209.
Bardodej Z, Cirek A. 1988. Long-term study on workers occupationally exposed to ethylbenzene. J Hyg Epidemiol Microbiol Immunol 32:1-5.
Barker JF. 1987. Volatile aromatic and chlorinated organic contaminants in groundwater at six Ontario landfills. Water Pollut Res J Can 22:33-48.
Barnes DG, Dourson M. 1988. Reference dose (RfD): Description and use in health risk assessments. U.S. Environmental Protection Agency. Regul Toxicol Pharmacol 8:471-486.
Barnett JF. 2006. Oral (gavage) subchronic neurotoxicity study of ethylbenezene in rats with recovery group. Arlington, VA: American Chemistry Council.
Barrefors G, Petersson G. 1993. Assessment of ambient volatile hydrocarbons from tobacco smoke and from vehicle emissions. J Chromatogr 643(1/2):71-76.
Baun A, Jensen SD, Bjerg PL, et al. 2000. Toxicity of organic chemical pollution in groundwater downgradient of a landfill (Grindsted, Denmark). Environ Sci Technol 34:1647-1652.
Beavers JD, Himmelstein JS, Hammond SK, et al. 1996. Exposure in a household using gasoline-contaminated water: A pilot study. J Occup Environ Med 38(1):35-38.
Bellar TA, Lichtenberg JJ. 1974. Determining volatile organics at microgram-per-liter levels by gas chromatography. J Am Water Works Assoc 66:739-744.
Berger GS, ed. 1994. Epidemiology of endometriosis. In: Endometriosis: Advanced management and surgical techniques. New York, NY: Springer-Verlag, 3-7.
Berkley RE, Varns JL, Pleil J. 1991. Comparison of portable gas chromatographs and passivated canisters for field sampling airborne toxic organic vapors in the United States and the USSR. Environ Sci Technol 25(8):1439-1444.
*Bernard AM, De Russis R, Normand J-C, et al. 1989. Evaluation of the subacute nephrotoxicity of cyclohexane and other industrial solvents in the female Sprague-Dawley rat. Toxicol Lett 45(2/3):271-280.
Bestetti G, Galli E. 1984. Plasmid-coded degradation of ethylbenzene and 1-phenylethanol in Pseudomonas fluorescens. FEMS Microbiology Letters 21:165-168.
*Bevan MAJ, Proctor CJ, Baker-Rogers J. 1991. Exposure to carbon monoxide, respirable suspended particulates, and volatile organic compounds while commuting by bicycle. Environ Sci Technol 25(4):788-791.
Biedermann M, Grob K, Morchio G. 1995. On the origin of benzene, toluene, ethylbenzene and xylene in extra virgin olive oil. Z Lebensm Unters Forsch 200:266-272.
Blank IH, McAuliffe DJ. 1985. Penetration of benzene through human skin. J Invest Dermatol 84:522-526.
225 ETHYLBENZENE
9. REFERENCES
Blank IH, Scheuplein RJ. 1969. Transport into and within the skin. Brit J Dermatol 81(Supp 4):4-10.
Bohon RL, Claussen WF. 1951. The solubility of aromatic hydrocarbons in water. J Am Chem Soc 73:1571-1578.
Borden RC, Yanoschak TM. 1990. Ground and surface water quality impacts of North Carolina sanitary landfills. Water Resour Bull 26(2):269-277.
Borden RC, Black DC, McBleif KV. 2002. MTBE and aromatic hydrocarbons in North Carolina stormwater runoff. Environ Pollut 118:141-152.
Bouwer EJ, McCarty PL. 1983. Transformations of halogenated organic compounds under dinitrification conditions. Appl Environ Microbiol 45:1295-1299.
Bouwer EJ, McCarty PL. 1984. Modeling of trace organics biotransformation in the subsurface. Ground Water 22:433-440.
Boyd SA, Xiangcan J, Lee J-F. 1990. Sorption of nonionic organic compounds by corn residues from a no-tillage field. J Environ Qual 19:734-738.
Bratveit M, Kirkeleit J, Hollund BE, et al. 2007. Biological monitoring of benzene exposure for process operators during ordinary activity in the upstream petroleum industry. Ann Occup Hyg 51(5):487-494.
Brown HS, Hattis D. 1989. The role of skin absorption as a route of exposure for volatile organic compounds (VOCs) in household tap water: A simulated kinetic approach. J Am Coll Toxicol 8(5):839-851.
Budavari S, O’Neil MJ. 1989. Ethylbenzene. In: The Merck index. An encyclopedia of chemicals, drugs, and biologicals. 11th ed. Rahway, NJ: Merck & Co., Inc., 595.
Burback BL, Perry JJ. 1993. Biodegradation and biotransformation of groundwater pollutant mixtures by Mycobacterium vaccae. Applied and Environmental Microbiology 59(4):1025-1029.
Burri J, Crockett R, Hany R, et al. 2004. Gasoline composition determined by 1H NMR spectroscopy. Fuel 83(2):187-193.
Burris DR, MacIntyre WG. 1984. Water solubility behavior of hydrocarbon mixtures implications for petroleum dissolution. In: Vandermeulen JH, Hrudey SE, eds. Oil in freshwater: Chemistry, biology, countermeasure technology. New York, NY: Pergamon Press, 85-93.
C&EN. 1994a. Production by the U.S. chemical industry: Growth continues in chemical production. Chem Eng News 72(27):30-36.
C&EN. 1994b. Top 50 chemicals production rose modestly last year. Chem Eng News 72(15):12-15.
C&EN. 1995. Production soared in most chemical sectors. Chem Eng News 73(26):38-42.
C&EN. 2006. Production: Growth is the norm. Output of chemicals increased across most products and in most countries. Chem Eng News. July 10, 2006.
226 ETHYLBENZENE
9. REFERENCES
Campbell JL, Fisher JW. 2007. A PBPK modeling assessment of the competitive metabolic interactions of JP-8 vapor with two constituents, m-xylene and ethylbenzene. Inhal Toxicol 19(3):265-273.
Cannella WJ. 2007. Xylenes and ethylbenzene. Kirk-Othmer encyclopedia of chemical technology. http://mrw.interscience.wiley.com/emrw/9780471238966/kirk/article/xylecann.a01/current/pdf. February 18, 2010.
Cappaert NLM, Klis SFL, Baretta AB, et al. 2000. Ethyl benzene-induced ototoxicity in rats: A dose-dependent mid-frequency hearing loss. J Assoc Res Otolaryngol 1(4):292-299.
Cappaert NLM, Klis SFL, Muijser H, et al. 1999. The ototoxic effects of ethyl benzene in rats. Hear Res 137:91-102.
Cappaert NLM, Klis SFL, Muijser H, et al. 2001. Simultaneous exposure to ethyl benzene and noise: Synergistic effects on outer hair cells. Hear Res 162(1-2):67-79.
Cappaert NLM, Klis SFL, Muijser H, et al. 2002. Differential susceptibility of rats and guinea pigs to the ototoxic effects of ethyl benzene. Neurotoxicol Teratol 24(4):503-510.
Chakroun R, Faidi F, Hedhili A, et al. 2008. Inhalant abuse detection and evaluation in young Tunisians. J Forensic Sci 53(1):232-237.
*Chan C, Lin S, Her G. 1994. Office worker's exposure to volatile organic compounds while commuting and working in Taipei City. Atmos Environ 28(14):2351-2359.
Charest-Tardif G, Tardif R, Krishnan K. 2006. Inhalation pharmacokinetics of ethylbenzene in B6C3F1 mice. Toxicol Appl Pharmacol 210(1-2):63-69.
Chen C, Taylor RT. 1995. Thermophilic biodegradation of BTEX by two Thermus species. Biotechnol Bioeng 48:614-624.
Chen CS, Zoltek J. 1995. Organic priority pollutants in wetland-treated leachates at a landfill in central Florida. Chemosphere 31(6):3455-3464.
Chen CS, Hseu YC, Liang SH, et al. 2008. Assessment of genotoxicity of methyl-tert-butyl ether, benzene, toluene, ethylbenzene, and xylene to human lymphocytes using comet assay. J Hazard Mater 153(1-2):351-356.
Chin BH, McKelvey JA, Calisti LJ, et al. 1980a. A comparison of in vivo and in vitro (tissue explant) techniques: Metabolic profile of ethylbenzene in the rat and the dog. Bull Environ Contam Toxicol 25:241-245.
Chin BJ, McKelvey JA, Tyler TR, et al. 1980b. Absorption, distribution, and excretion of ethylbenzene, ethylcyclohexane, and methylethylbenzene isomers in rats. Bull Environ Contam Toxicol 24:477-483.
Chiou CT, Porter PE, Schmedding DW. 1983. Partition equilibria of nonionic organic compounds between soil organic matter and water. Environ Sci Technol 17:227-231.
Clay P. 2001. Ethylbenzene: In vivo mouse liver unscheduled DNA synthesis assay. Brussels, Belgium: CEFIC Styrene Steering Committee.
227 ETHYLBENZENE
9. REFERENCES
Clayton GD, Clayton FE, eds. 1981. Patty's industrial hygiene and toxicology. Vol. 2B. 3rd ed. New York, NY: John Wiley & Sons, Inc., 3303-3307.
Clewell HJ, Andersen M. 1985. Risk assessment extrapolations and physiological modeling. Toxicol Ind Health 1(4):111-131.
Climie IJG, Hutson DH, Stoydin G. 1983. The metabolism of ethylbenzene hydroperoxide in the rat. Xenobiotica 13:611-618.
CMR. 2004. Ethylbenzene. Chemical Market Reporter. Jun 14, 2007.
Cole RH, Frederick RE, Healy RP, et al. 1984. Preliminary findings of the priority pollutant monitoring project of the nationwide urban runoff program. J Water Pollut Control Fed 56:898-908.
Cometto-Muñiz JE, Cain WS. 1995. Relative sensitivity of the ocular trigeminal, nasal trigeminal and olfactory systems to airborne chemicals. Chemical Senses 20(2):191-198.
Conkle JP, Camp BJ, Welch BE. 1975. Trace composition of human respiratory gas. Arch Environ Health 30:290-295.
Cotruvo JA. 1985. Organic micropollutants in drinking water: An overview. Sci Total Environ 47:7-26.
Cragg ST, Clarke EA, Daly IW, et al. 1989. Subchronic inhalation toxicity of ethylbenzene in mice, rats, and rabbits. Fundam Appl Toxicol 13(3):399-408.
Cramer PH, Boggess KE, Hosenfeld JM, et al. 1988. Determination of organic chemicals in human whole blood: Preliminary method development for volatile organics. Bull Environ Contam Toxicol 40:612-618.
Daisey JM, Hodgson AT, Fisk WJ, et al. 1994. Volatile organic compounds in twelve California office buildings: Classes, concentrations and sources. Atmos Environ 28(22):3557-3562.
Dawson JJC, Iroegbu CO, Maciel H, et al. 2008. Application of luminescent biosensors for monitoring the degradation and toxicity of BTEX compounds in soils. J Appl Microbiol 104(1):141-151.
Dean BJ, Brooks TM, Hodson-Walker G, et al. 1985. Genetic toxicology testing of 41 industrial chemicals. Mutat Res 153:57-77.
De Ceaurriz JC, Micillino JC, Bonnet P, et al. 1981. Sensory irritation caused by various industrial airborne chemicals. Toxicol Lett (Amst) 9:137-144.
Degirmenci E, Ono Y, Kawara O, et al. 2000. Genotoxicity analysis and hazardousness prioritization of a group of chemicals. Water Sci Technol 42(7-8):125-131.
de Medinilla J, Espirgares M. 1988. Contamination by organic solvents in auto paint shops. Am Occup Hyg 31(4):509-513.
Dennison JE, Andersen ME, Clewell HJ, et al. 2004. Development of a physiologically based pharmacokinetic model for volatile fractions of gasoline using chemical lumping analysis. Environ Sci Technol 38(21):5674-5681.
228 ETHYLBENZENE
9. REFERENCES
Dennison JE, Andersen ME, Yang RSH. 2003. Characterization of the pharmacokinetics of gasoline using PBPK modeling with a complex mixtures chemical lumping approach. Inhal Toxicol 15:961-986.
Dennison JE, Bigelow PL, Mumtaz MM, et al. 2005. Evaluation of potential toxicity from co-exposure to three CNS depressants (toluene, ethylbenzene, and xylene) under resting and working conditions using PBPK modeling. J Occup Environ Hyg 2(3):127-135.
Dewulf J, Dewettinck T, De Visscher A, et al. 1996. Sorption of chlorinated C1- and C2-hydrocarbons and monocyclic aromatic hydrocarbons on sea sediment. Water Research 30 (12):3130-3138.
Dilling WL, Bredeweg CJ, Tefertiller NB. 1976. Organic photochemistry. XIII. Simulated atmospheric photodecomposition rates of methylene chloride, 1,1,1-trichloroethane, trichloroethylene, tetrachloroethylene, and other compounds. Environ Sci Technol 10:351-356.
Dodson RE, Levy JI, Spengler JD, et al. 2008. Influence of basements, garages, and common hallways on indoor residential volatile organic compound concentrations. Atmos Environ 42(7):1569-1581.
Dreisch FA, Munson TO. 1983. Purge-and-trap analysis using fused silica capillary column GC/MS. J Chromatogr Sci 21:111-118.
Driscoll N, Atwood ES. 1993. Application of gas chromatography with photoionization and electron-capture detectors for field screening of semi volatiles in soil and water. J Chromatogr 642:435-443.
Dutkiewicz T, Tyras H. 1967. A study of the skin absorption of ethylbenzene in man. Brit J Ind Med 24:330-332.
Dutkiewicz T, Tyras H. 1968. Skin absorption of toluene, styrene, and xylene by man. Brit J Ind Med 24:243.
Ehret-Henry J, Ducruet V, Luciani A, et al. 1994. Styrene and ethylbenzene migration from polystyrene into dairy products by dynamic purge-and-trap gas chromatography. J Food Sci 59(5):990-1001.
Ehrhardt M, Petrick G. 1984. On the sensitized photo-oxidation of alkylbenzenes in seawater. Mar Chem 15:47-58.
Eiceman GA, McConnon JT, Zaman M, et al. 1986. Hydrocarbons and aromatic hydrocarbons in groundwater surrounding an earthen waste disposal pit for produced water in the Duncan oil field of New Mexico. Int J Environ Anal Chem 24:143-162.
Eisenreich SJ, Looney BB, Thornton JD. 1981. Airborne organic contaminants in the Great Lakes ecosystem. Environ Sci Technol 15(1):30-38.
Ellenson WD, Mukerjee S, Stevens RK, et al. 1997. An environmental scoping study in the lower Rio Grande Valley of Texas: II. Assessment of transboundary pollution transport and other activities by air quality monitoring. Environ Int 23(5):643-655.
El Masri AM, Smith JN, Williams RT. 1958. The metabolism of alkylbenzenes: Phenylacetylene and phenylethylene (styrene). Biochem J 68(2):199-204.
El Masry AM, Smith JN, Williams RT. 1956. The metabolism of alkylbenzenes: n-Propylbenzene and n-butylbenzene with further observations on ethylbenzene. Biochem J 64:50-56.
229 ETHYLBENZENE
9. REFERENCES
Elovaara E, Engstrom K, Nickels J, et al. 1985. Biochemical and morphological effects of long-term inhalation exposure of rats to ethylbenzene. Xenobiotica 15:299-308.
$$Elovaara E, Engstrom K, Vainio H, et al. 1982. Unaltered metabolism of m-xylene in the presence of ethylbenzene. In: Hietanen E, Laitinen M, Hanninen O, eds. Cytochrome P-450, biochemistry, biophysics and environmental implications. Amsterdam, The Netherlands: Elsevier Biomedical Press, 765-768.
Elovaara E, Engstrom K, Vainio H. 1984. Metabolism and disposition of simultaneously inhaled m-xylene and ethylbenzene in the rat. Toxicol Appl Pharmacol 75:466-478.
Engelke M, Bergmann U, Diehl HA. 1993. Fluidity of the microsomal membrane and cytochrome P450 reduction kinetics of pig liver microsomes as a consequence of organic solvent impact. Xenobiotica 23(1):71-78.
Engstrom J, Bjurstrom R. 1978. Exposure to xylene and ethylbenzene. II. Concentration in subcutaneous adipose tissue. Scand J Work Environ Health 4:195-203.
Engstrom K, Elovaara E, Aitio A. 1985. Metabolism of ethylbenzene in the rat during long-term intermittent inhalation exposure. Xenobiotica 15:281-286.
Engstrom K, Riihimaki V, Laine A. 1984. Urinary disposition of ethylbenzene and m-xylene in man following separate and combined exposure. Int Arch Occup Environ Health 54:355-363.
*Engstrom KM. 1984. Metabolism of inhaled ethylbenzene in rats. Scand J Work Environ Health 10:83-87.
EPA. 1981. Engineering handbook for hazardous waste incineration. Cincinnati, OH: U.S. Environmental Protection Agency, Office of Solid Waste. PB81248163.
EPA. 1982. Aquatic fate process data for organic priority pollutants. Washington, DC: U.S. Environmental Protection Agency, Office of Water Regulations and Standards, Monitoring and Data Support Division. EPA440481014.
*EPA. 1984a. Application for permit to discharge wastewater: Existing manufacturing, commercial, mining, and silvicultural operations. U.S. Environmental Protection Agency. Code of Federal Regulations. 40 CFR 125.
EPA. 1984b. Health effects assessment for ethylbenzene. Cincinnati, OH: U.S. Environmental Protection Agency, Environmental Criteria and Assessment Office. EPA540186008.
EPA. 1984c. Method 602: Purgeable aromatics. Guidelines establishing test procedures for the analysis of pollutants under the Clean Water Act; final rule and interim final rule and proposed rule. U.S. Environmental Protection Agency. Fed Regist 49(209):40-48.
*EPA. 1984d. Method 624. Guidelines establishing test procedures for the analysis of pollutants under the Clean Water Act; final rule and interim final rule and proposed rule. U.S. Environmental Protection Agency. 40 CFR Part 136.
230 ETHYLBENZENE
9. REFERENCES
EPA. 1984e. Analyses of exhaled breath of 355 urban residents for volatile organic compounds. Indoor Air. Vol. 4. Chemical characterization and personal exposure. Proceedings of the 3rd International Conference on Indoor Air Quality and Climate held in Stockholm on August 20-24, 1984. U.S. Environmental Protection Agency. PB85104214, 15-20.
EPA. 1986. Broad scan analysis of the FY82 national human adipose tissue survey specimens. Vol. I. Executive summary. Washington, DC: U.S. Environmental Protection Agency, Office of Toxic Substances. EPA566586035.
EPA. 1987. Project summary. The total exposure assessment methodology (TEAM) study: Summary and analysis. U.S. Environmental Protection Agency, Office of Research and Development. EPA600687002.
EPA. 1988a. Method T01-1. Method for the determination of volatile organic compounds in ambient air using tenax adsorption and gas chromatography mass spectrometry (GC/MS). Compendium of Methods for the Determination of Toxic Organic Compounds in Ambient Air. U.S. Environmental Protection Agency. EPA600489017.
EPA. 1988b. Method T014-1. Determination of volatile organic compounds (VOCs) in ambient air using SUMMA passivated conister sampling and gas chromatographic analysis. Compendium of Methods for the determination of toxic organic compounds in ambient air. U.S. Environmental Protection Agency. EPA600489017.
EPA. 1988c. National ambient volatile organic compounds (VOCs) data base update. Research Triangle Park, NC: U.S. Environmental Protection Agency, Atmospheric Sciences Research Laboratory. EPA600388010A.
EPA. 1990a. Interim methods for development of inhalation reference concentrations. Washington, DC: U.S. Environmental Protection Agency, Office of Health and Environmental Assessment, Office of Research and Development, Environmental Criteria and Assessment Office. EPA600890066A. PB90238890.
*EPA. 1990b. Standards of performance for volatile organic compounds (VOC) emissions from synthetic organic chemical manufacturing industry (SOCMI) distillation operation. U.S. Environmental Protection Agency. Code of Federal Regulations. 40 CFR 60.667.
EPA. 1991a. Method 502.2. Volatile organic compounds in water by purge and trap capillary column gas chromatograpy with photoionization and electrolytic conductivity detectors in series. Methods for the determination of organic compounds in drinking water. U.S. Environmental Protection Agency. EPA600488039.
EPA. 1991b. Method 503.1. Volatile aromatic and unsaturated organic compounds in water by purge and trap gas chromatography. Methods for the determination of organic compounds in drinking water. U.S. Environmental Protection Agency. EPA600488039.
EPA. 1991c. Method 524.1. Measurement of purgeable organic compounds in water by packed column gas chromatography/mass spectrometry. Revision 3.0. In: Methods for the determination of organic compounds in drinking water. Cincinnati, OH: U.S. Environmental Protection Agency, 253-282. EPA600488039. PB91231480.
231 ETHYLBENZENE
9. REFERENCES
EPA. 1991d. Alpha2u-Globulin: Association with chemically induced renal toxicity and neoplasia in the male rat. Washington, DC: U.S. Environmental Protection Agency. EPA625391019F.
EPA. 1992a. Method 524.2. Measurement of purgeable organic compounds in water by capillary column gas chromatography mass spectrometry. Methods for the determination of organic compounds in drinking water. Supplement II. U.S. Environmental Protection Agency. EPA600R92129.
*EPA. 1992b. National air toxics information clearinghouse: NATICH data base report on state, local and EPA air toxics activities. Research Triangle Park, NC: U.S. Environmental Protection Agency, Office of Air Quality Planning and Standards, Emissions Standards Division. EPA453R92008.
EPA. 1992c. Hazardous wastes from non-specific sources. U.S. Environmental Protection Agency. Code of Federal Regulations. 40 CFR 261.31.
*EPA. 1994a. National emissions standards for organic hazardous air pollutants from synthetic organic chemical manufacturing industry. U.S. Environmental Protection Agency. Code of Federal Regulations. 40 CFR 63.106.
EPA. 1994c. Measurement of reformulated gasoline fuel parameters. U.S. Environmental Protection Agency. Code of Federal Regulations. 40 CFR 80.46.
EPA. 1994d. Method 8021A. Halogenated volatiles by gas chromatography using photoionization and electrolytic conductivity detectors in series: Capillary column technique. SW-846. Final update II. 3rd ed. U.S. Environmental Protection Agency.
EPA. 1994e. Method 8260A. Volatile organic compounds by gas chromatography mass spectrometry (GC/MS): Capillary column technique. Method Status Table SW-846, 3rd ed., Updates I, II, IIA and IIB. U.S. Environmental Protection Agency.
EPA. 1995a. Method 8021B. Halogenated volatiles by gas chromatography using photoionization and electrolytic conductivity detectors in series: Capillary column technique. SW-846. Final update IIB. 3rd ed. U.S. Environmental Protection Agency.
EPA. 1995b. Method 8260B. Volatile organic compounds by gas chromatography mass spectrometry (GC/MS): Capillary column technique. SW-846. Final update IIB. 3rd ed. U.S. Environmental Protection Agency.
EPA. 1995c. Drinking water regulations and health advisories. Washington, DC: U.S. Environmental Protection Agency, Office of Water.
EPA. 1995d. Toxic chemical release inventory. Reporting form R and instructions. Section 313 of the Emergency Planning and Community Right-to-Know Act. Washington, DC: U.S. Environmental Protection Agency, Office of Pollution Prevention and Toxics.
EPA. 1995e. Method 4030: Soil screening for petroleum hydrocarbons by immunoassay. In: Test methods for evaluating solid waste, physical/chemical methods. Final update IIB. 3rd ed. U.S. Environmental Protection Agency. SW-846. http://www.epa.gov/epaoswer/hazwaste/test/pdfs/4030.pdf. August 15, 2007.
*EPA. 1997a. Land disposal restrictions: Correction of tables; treatment standards for hazardous wastes and universal treatment standards. U.S. Environmental Protection Agency. Fed Regist 62:7502-7600.
232 ETHYLBENZENE
9. REFERENCES
EPA. 1997b. Special report on environmental endocrine disruption: An effects assessment and analysis. Washington, DC: U.S. Environmental Protection Agency, Risk Assessment Forum. EPA630R96012.
EPA. 1999. Method 624: Purgeables. In: Methods and guidance for the analysis of water: Version 2. U.S. Environmental Protection Agency. PB99500209. http://infotrek.er.usgs.gov/docs/nemi/method_pdf/5249.pdf. August 13, 2007.
EPA. 2000. Benchmark dose technical guidance document. Washington, DC: U.S. Environmental Protection Agency. EPA630R00001.
EPA. 2003. National primary drinking water regulations. Washington, DC: U.S. Environmental Protection Agency, Office of Ground Water and Drinking Water. EPA816F03016. http://www.epa.gov/safewater/mcl.html. March 07, 2006.
EPA. 2004. Inert pesticide ingredients in pesticide products. Washington, DC: U.S. Environmental Protection Agency. http://www.epa.gov/opprd001/inerts/lists.html. April 11, 2007.
EPA. 2005. Toxic chemical release inventory reporting forms and instructions: Revised 2004 version. Section 313 of the Emergency Planning and Community Right-to-Know Act (Title III of the Superfund Amendments and Reauthorization Act of 1986). U.S. Environmental Protection Agency. Office of Environmental Information. EPA260B05001.
EPA. 2006a. Drinking water standards and health advisories. Washington, DC: Office of Water, U.S. Environmental Protection Agency. EPA822R04005. http://epa.gov/waterscience/criteria/drinking/. April 11, 2007.
EPA. 2006b. National recommended water quality criteria. Washington, DC: U.S. Environmental Protection Agency, Office of Water, Office of Science and Technology. http://www.epa.gov/waterscience/criteria/wqcriteria.html. March 07, 2006.
EPA. 2007a. Acute exposure guideline levels (AEGLs) Washington, DC: Office of Pollution Prevention and Toxics, U.S. Environmental Protection Agency. http://www.epa.gov/oppt/aegl/pubs/compiled.pdf. April 11, 2007.
EPA. 2007b. Designated as hazardous substances in accordance with Section 311(b)(2)(A) of the Clean Water Act. Code of Federal Regulations. 40 CFR 116.4. Washington, DC: U.S. Environmental Protection Agency. http://www.epa.gov/epacfr40/chapt-I.info/chi-toc.htm. April 11, 2007.
EPA. 2007c. Hazardous air pollutants. Clean Air Act. United States Code. 42 USC 7412. Washington, DC: U.S. Environmental Protection Agency. http://www.epa.gov/ttn/atw/orig189.html. April 11, 2007.
EPA. 2007d. Reportable quantities of hazardous substances designated pursuant to Section 311 of the Clean Water Act. Code of Federal Regulations. 40 CFR 117.3. Washington, DC: U.S. Environmental Protection Agency. http://www.epa.gov/epacfr40/chapt-I.info/chi-toc.htm. April 11, 2007.
EPA. 2007e. Superfund, emergency planning, and community right-to-know programs. Designation, reportable quantities, and notifications. Code of Federal Regulations. 40 CFR 302.4. Washington, DC: U.S. Environmental Protection Agency. http://www.epa.gov/epacfr40/chapt-I.info/chi-toc.htm. April 11, 2007.
233 ETHYLBENZENE
9. REFERENCES
EPA. 2007f. Superfund, emergency planning, and community right-to-know programs. Toxic chemical release reporting. U.S. Environmental Protection Agency. Code of Federal Regulations. 40 CFR 372.65. http://www.epa.gov/epacfr40/chapt-I.info/chi-toc.htm. April 11, 2007.
EPA. 2007g. Toxic pollutants designated pursuant to Section 307(a)(1) of the Clean Water Act. U.S. Environmental Protection Agency. Code of Federal Regulations. 40 CFR 401.15. http://www.epa.gov/epacfr40/chapt-I.info/chi-toc.htm. April 11, 2007.
EPA. 2007h. Toxic Substances Control Act. Health and Safety Data Reporting. Substances and listed mixtures to which this subpart applies. U.S. Environmental Protection Agency. Code of Federal Regulations. 40 CFR 716.120. http://www.epa.gov/epacfr40/chapt-I.info/chi-toc.htm. April 11, 2007.
EPA. 2007i. Ethylbenzene. Modernized STORET system: Regular results by project (stormodb): Characteristic search by CAS number. U.S. Environmental Protection Agency. http://www.epa.gov/storet/dbtop.html. April 02, 2007.
EPA. 2007j. Master testing list. Washington, DC: U.S. Environmental Protection Agency, Office of Pollution Prevention and Toxics. http://www.epa.gov/opptintr/chemtest/pubs/mtl.htm. May 10, 2007.
Ethylbenzene Producers Association. 1986a. A four day inhalation study of ethylbenzene in the rat, mouse, and rabbit. Ethylbenzene Producers Association. Submitted to the U.S. Environmental Protection Agency under TSCA Section 8D. OTS0513170.
*Ethylbenzene Producers Association. 1986b. A four week inhalation study of ethylbenzene in the rat, mouse, and rabbit. Ethylbenzene Producers Association. Submitted to the U.S. Environmental Protection Agency under TSCA Section 8d. OTS0513173.
*Etkina EI, Etkina IA. 1995. Chemical mixtures exposure and children's health. Chemosphere 31(1):2463-2474.
Faber WD, Roberts LSG, Stump DG, et al. 2006. Two generation reproduction study of ethylbenzene by inhalation in Crl-CD rats. Birth Defects Res B Dev Reprod Toxicol 77(1):10-21.
Faber WD, Roberts LSG, Stump DG, et al. 2007. Inhalation developmental neurotoxicity study of ethylbenzene in Crl-CD rats. Birth Defects Res B Dev Reprod Toxicol 80:34-48.
FDA. 2006a. Beverages. Bottled water. U.S. Food and Drug Administration. Code of Federal Regulations. 21 CFR 165.110. http://www.accessdata.fda.gov/scripts/cdrh/cfdocs/cfcfr/CFRSearch.cfm. April 11, 2007.
FDA. 2006b. Total diet study. Market baskets 1991-1993 through 2003-2004. U.S. Food and Drug Administration, 1-126.
FDA. 2007. Everything added to food in the United States (EAFUS) Washington, DC: U.S. Food and Drug Administration. http://vm.cfsan.fda.gov/~dms/eafus.html. April 11, 2007.
FEDRIP. 2007. Ethylbenzene. Federal Research in Progress database. Springfield, VA: National Technical Information Service.
Fellin P, Otson R. 1994. Assessment of the influence of climatic factors on concentration levels of volatile organic compounds (VOCs) in Canadian homes. Atmos Environ 28(22):3581-3586.
234 ETHYLBENZENE
9. REFERENCES
Ferrario JB, Lawler GC, DeLeon IR, et al. 1985. Volatile organic pollutants in biota and sediments of Lake Pontchartrain. Bull Environ Contam Toxicol 34:246-255.
Filipovic D, Paulsen MD, Loida PJ, et al. 1992. Ethylbenzene hydroxylation by cytochrome P450cam. Biochem Biophys Res Commun 189(1):488-495.
Fishbein L. 1985. An overview of environmental and toxicological aspects of aromatic hydrocarbons. IV. Ethylbenzene. Sci Total Environ 44:269-287.
Florin I, Rutberg L, Curvall M, et al. 1980. Screening of tobacco smoke constituents for mutagenicity using the Ames test. Toxicology 18:219-232.
Fomon SJ. 1966. Body composition of the infant: Part 1: The male reference infant. In: Faulkner F, ed. Human development. Philadelphia, PA: WB Saunders, 239-246.
Fomon SJ, Haschke F, Ziegler EE, et al. 1982. Body composition of reference children from birth to age 10 years. Am J Clin Nutr 35:1169-1175.
*Fouchecourt MO, Riviere JL. 1996. Activities of liver and lung cytochrome p450-dependent monooxygenases and antioxidant enzymes in laboratory and wild Norway rats exposed to reference and contaminated soils. Toxicology 30(4):513-522.
Frantik E, Hornychova M, Horvath M. 1994. Relative acute neurotoxicity of solvents: Isoeffective air concentrations of 48 compounds evaluated in rats and mice. Environ Res 66(2):173-185.
Freundt KJ, Romer KG, Federsel RJ. 1989. Decrease of inhaled toluene, ethyl benzene, m-xylene, or mesitylene in rat blood after combined exposure to ethyl acetate. Bull Environ Contam Toxicol 42:495-498.
Fuciarelli AF. 2000. Ethylbenzene two-week repeated-dose inhalation toxicokinetic study report. Research Triangle Park, NC: National Institute of Environmental Health Services.
Fukuda M, Nishi T, Igarashi M, et al. 1989. Degradation of ethylbenzene by Pseudomonas putida harboring OCT plasmid. Agric Biol Chem 53(12):3293-3299.
Fustinoni S, Buratti M, Giampiccolo R. 1995. Biological and environmental monitoring of exposure to airborne benzene and other aromatic hydrocarbons in Milan traffic wardens. Toxicol Lett 77:387-392.
Fustinoni S, Buratti M, Giampiccolo R, et al. 1996. Biological monitoring of airborne aromatic hydrocarbon exposure: A gas chromatographic procedure for the determination of benzene, toluene, ethylbenzene and xylenes in blood and urine. Med Lav 87(1):63-75.
Gagnaire F, Langlais C. 2005. Relative ototoxicity of 21 aromatic solvents. Arch Toxicol 79(6):346-354.
Gagnaire F, Langlais C, Grossmann S, et al. 2007. Ototoxicity in rats exposed to ethylbenzene and to two technical xylene vapours for 13 weeks. Arch Toxicol 81(2):127-143.
Gargas ML, Burgess RJ, Voisard DE, et al. 1989. Partition coefficients of low-molecular-weight volatile chemicals in various liquids and tissues. Toxicol Appl Pharmacol 98:87-99.
235 ETHYLBENZENE
9. REFERENCES
*Gerarde HW, Linden NJ. 1956. Toxicological studies on hydrocarbons. II. A comparative study of the effect of benzene and certain mono-n-alkylbenzenes on hemopoiesis and bone marrow metabolism in rats. AMA Arch Ind Health 13:468-474.
*Gerarde HW, Linden NJ. 1963. Toxicological studies on hydrocarbons: IX. The aspiration hazard and toxicity of hydrocarbons and hydrocarbon mixtures. Arch Environ Health 6:329-341.
*Gershbein LL. 1975. Liver regeneration as influenced by the structure of aromatic and heterocyclic compounds. Res Commun Chem Pathol Pharmacol 11:445-466.
Gibson DP, Brauninger R, Shaffi HS, et al. 1997. Induction of micronuclei in Syrian hamster embryo cells: Comparison to results in the SHE cell transformation assay for national toxicology program test chemicals. Mutat Res 392(1-2):61-70.
Gibson DT, Geschwendt B, Yeh WK, et al. 1973. Initial reactions in the oxidation of ethylbenzene by Pseudomonas putida. Biochemistry 12:1520-1528.
Gillette JR, Mitchell JR, Brodie BB. 1974. Biochemical mechanisms of drug toxicity. Ann Rev Pharmacol 14:271-288.
Giwercman A, Carlsen E, Keiding N, et al. 1993. Evidence for increasing incidence of abnormalities of the human testis: A review. Environ Health Perspect Suppl 101(2):65-71.
Goldberg MS, Al-Homsi N, Goulet L, et al. 1995. Incidence of cancer among persons living near municipal solid waste landfill site in Montreal, Quebec. Arch Environ Health 50(6):416-424.
Górna-Binkul A, Keymeulen R, Van Langenhove H, et al. 1996. Determination of monocyclic aromatic hydrocarbons in fruit and vegetables by gas chromatography-mass spectrometry. J Chromatogr A 734(2):297-302.
Gossel TA, Bricker JD. 1994. Principles of clinical toxicology. 3rd ed. New York, NY: Raven Press, 124-126.
Gramshaw JW, Vandenburg HJ. 1995. Compositional analysis of samples of thermoset polyester and migration of ethylbenzene and styrene from thermoset polyester into pork during cooking. Food Addit Contam 12(2):223-234.
Greiner JW, Kramer RE, Robinson DA, et al. 1976. Interaction of aromatic hydrocarbons and drugs with adrenal microsomal cytochrome P-450 in the guinea pig. Biochem Pharmacol 25(8):951-955.
Gromiec JP, Piotrowski JK. 1984. Urinary mandelic-acid as an exposure test for ethylbenzene. Int Arch Occup Environ Health 55(1):61-72.
Grosjean D, Fung K. 1984. Hydrocarbons and carbonyls in Los Angeles air. J Air Pollut Control Assoc 34:537-543.
Grovenstein E, Mosher AJ. 1970. Reaction of atomic oxygen with aromatic hydrocarbons [Letter]. J Am Chem Soc 92:3810-3812.
236 ETHYLBENZENE
9. REFERENCES
Gschwend PM, Zafirlou OC, Mantoura RFC, et al. 1982. Volatile organic compounds at a coastal site. 1. Seasonal variations. Environ Sci Technol 16:31-38.
*Gut IY, Terelius E, Frantik I, et al. 1993. Exposure to various benzene derivatives differently induces cytochromes P450 2B1 and P450 2E1 in rat liver. Arch Toxicol 67(4):237-243.
Guy RH, Maibach HI. 1984. Correction factors for determining body exposure from forearm percutaneous absorption data. J Appl Toxicol 4(1):26-28.
Guzelian PS, Henry CJ, Olin SS. 1992. Similarities and differences between children and adults: Implications for risk assessment. Washington, DC: International Life Sciences Institute Press.
Haddad S, Béliveau M, Tardif R, et al. 2001. A PBPK modeling-based approach to account for interactions in the health risk assessment of chemical mixtures. Toxicol Sci 63:125-131.
Haddad S, Charest-Tardif G, Tardif R, et al. 2000. Validation of a physiological modeling framework for simulating the toxicokinetics of chemicals in mixtures. Toxicol Appl Pharmacol 167:199-209.
Haddad S, Tardif R, Charest-Tardif G, et al. 1999. Physiological modeling of the toxicokinetic interactions in a quaternary mixture of aromatic hydrocarbons. Toxicol Appl Pharmacol 161:249-257.
Hajimiragha H, Ewers U, Brockhaus A, et al. 1989. Levels of benzene and other volatile aromatic compounds in the blood of non-smokers and smokers. Int Arch Occup Environ Health 61(8):513-518.
Hallbourg RR, Delfino JJ, Miller WL. 1992. Organic priority pollutants in groundwater and surface water at three landfills in north central Florida. Water Air Soil Pollut 65:307-322.
Hampton CV, Pierson WR, Schuetzle D, et al. 1983. Hydrocarbon gases emitted from vehicles on the road. 2. Determination of emission rates from diesel and spark-ignition vehicles. Environ Sci Technol 17:699-708.
Hansch C, Leo A. 1979. Substituent constants for correlation analysis in chemistry and biology. New York, NY: John Wiley & Sons, 232.
Hansch C, Leo A, Hoekman D. 1995. Exploring QSAR hydrophobic, electronic, and steric constants. Washington, DC: American Chemical Society, 43.
*Hansen LF, Nielsen GD. 1994. Sensory irritation effects of n-propanol and ethylbenzene after pretreatment with capsaicin or indomethacin. Pharmacol Toxicol 75(3-4):154-161.
Hard GC. 2002. Significance of the renal effects of ethylbenzene in rodents for assessing human carcinogenic risk. Toxicol Sci 69:30-41.
Hardin B, Bond G, Sikov M, et al. 1981. Testing of selected workplace chemicals for teratogenic potential. Scand J Work Environ Health 4:66-75.
Harkov R, Kebbekus B, Bozzelli JW, et al. 1983. Measurement of selected volatile organic compounds at three locations in New Jersey during the summer season. J Air Pollut Control Assoc 33:1177-1183.
237 ETHYLBENZENE
9. REFERENCES
HazDat. 2007. Ethylbenzene. HazDat Database: ATSDR’s Hazardous Substance Release and Health Effects Database. Atlanta, GA: Agency for Toxic Substances and Disease Registry. http://www.atsdr.cdc.gov/hazdat.html. April 02, 2007.
Heikes DL, Jensen SR, Fleming-Jones ME. 1995. Purge and trap extraction with GC-MS determination of volatile organic compounds in table-ready foods. J Agric Food Chem 43:2869-2875.
Herron JT, Huie RE. 1973. Rate constants for the reactions of atomic oxygen (O3P) with organic compounds in the gas phase. J Phys Chem Ref Data 2(3):467-518.
Hiatt MH. 1981. Analysis of fish and sediment for volatile priority pollutants. Anal Chem 53:1541-1543.
Hiatt MH. 1983. Determination of volatile organic compounds in fish samples by vacuum distillation and fused silica capillary gas chromatography-mass spectrometry. Anal Chem 55:506-516.
Hodgson AT, Daisey JM, Grot RA. 1991. Sources and source strengths of volatile organic compounds in a new office building. J Air Waste Manage Assoc 41(11):1461-1468.
Hodgson AT, Daisey JM, Mahanama KRR, et al. 1996. Use of volatile tracers to determine the contribution of environmental tobacco smoke to concentrations of volatile organic compounds in smoking environment. Environ Int 22(3):295-307.
Hodgson AT, Garbesi K, Sextro RG, et al. 1992. Soil-gas contamination and entry volatile organic compounds into a house near a landfill. J Air Waste Manage Assoc 42(3):277-283.
Hodson J, Williams NA. 1988. The estimation of the adsorption coefficient (Koc) for soils by high performance liquid chromatography. Chemosphere 17:67-77.
Hoel DG, Davis DL, Miller AB, et al. 1992. Trends in cancer mortality in 15 industrialized countries, 1969-1986. J Natl Cancer Inst 84(5):313-320.
Holz O, Scherer G, Brodtmeier S, et al. 1995. Determination of low level exposure to volatile aromatic hydrocarbons and genotoxic effects in workers at a styrene plant. Environ Med 52(6):420-428.
Hoshino M, Akimoto H, Okuda M. 1978. Photochemical oxidation of benzene, toluene, and ethylbenzene initiated by hydroxyl radicals in the gas phase. Bull Chem Soc Jpn 51:718-724.
HSDB. 2009. Ethylbenzene. Hazardous Substances Data Bank. National Library of Medicine. http://toxnet.nlm.nih.gov. March 3, 2009.
Hutchins SR. 1991. Optimizing BTEX biodegradation under denitrifying conditions. Environ Toxicol Chem 10:1437-1448.
Hutchins SR, Sewell GW, Kovacs DA, et al. 1991. Biodegradation of aromatic hydrocarbons by aquifer microorganisms under denitrifying conditions. Environ Sci Technol 25:68-76.
IARC. 2006. Agents reviewed by the IARC Monographs. Volumes 1–96. Lyon, France: International Agency for Research on Cancer. http://monographs.iarc.fr/ENG/Classification/index.php. April 11, 2007.
238 ETHYLBENZENE
9. REFERENCES
*Imaoka S, Funae Y. 1991. Induction of cytochrome P450 isozymes in rat liver by methyl n-alkyl ketones and n-alkylbenzenes. Effects of hydrophobicity of inducers on inducibility of cytochrome Biochem Pharmacol 450(42):143-150.
IRIS. 2007. Ethylbenzene. Integrated Risk Information System. Washington, DC: U.S. Environmental Protection Agency. http://www.epa.gov/iris/subst/index.html. April 11, 2007.
Ivanov SV. 1962. [Toxicology of ethylbenzene.] Tr Voronezh Gos Med Inst 47:80-82. (Russian).
Jamison VW, Raymond RL, Hudson JO. 1970. Hydrocarbon cooxidation by Nocardia corallina strain V-49. Develop Ind Microbiol 12:99-105.
Janasik B, Jakubowski M, Jalowiecki P. 2008. Excretion of unchanged volatile organic compounds (toluene, ethylbenzene, xylene and mesitylene) in urine as a result of experimental human volunteer exposure. Int Arch Occup Environ Health 81(4):443-449.
Jang JY, Droz PO, Kim S. 2001. Biological monitoring of workers exposed to ethylbenzene and co-exposed to xylene. Int Arch Occup Environ Health 74:31-37.
Jay K, Steiglitz L. 1995. Identification and quantification of volatile organic components in emissions of waste incineration plants. Chemosphere 30(7):1249-1260.
Jin S, Fallgren PH, Bilgin AA, et al. 2007. Bioremediation of benzene, ethylbenzene, and xylenes in groundwater under iron-amended, sulfate-reducing conditions. Environ Toxicol Chem 26(2):249-253.
Johanson CE. 1980. Permeability and vascularity of the developing brain: Cerebellum vs. cerebral cortex. Brain Res 190:3-16.
*Johanson G, Filser JG. 1992. Experimental data from closed chamber gas uptake studies in rodents suggest lower uptake rate of chemical than calculated from literature values on alveolar ventilation. Arch Toxicol 66(4):291-295.
Jonsson A, Persson KA, Grigoriadis V. 1985. Measurements of some low molecular-weight oxygenated, aromatic, and chlorinated hydrocarbons in ambient air and in vehicle emissions. Environ Int 11:383-392.
Junk GA, Ford CS. 1980. A review of organic emissions from selected combustion processes. Chemosphere 9:187-230.
Kango RY, Quinn JG. 1989. Adsorption studies of xylenes and ethylbenzene on soil and humic acid by a purge and trap gas chromatographic method. Chemosphere 19(8/9):1269-1276.
Karasek FW, Charbonneua GM, Reuel GJ, et al. 1987. Determination of organic compounds leached from municipal incinerator fly ash by water at different pH levels. Anal Chem 59:1027-1031.
Katzman H, Libby WF. 1975. Hydrocarbon emissions from jet engines operated at simulated high altitude supersonic flight conditions. Atmos Environ 9:839-842.
Kaubisch N, Daly JW, Jerina DM. 1972. Arene oxides as intermediate in the oxidative metabolism of aromatic compounds. Isomerization of methyl-substituted arene oxides. Biochemistry 11:3080-3088.
239 ETHYLBENZENE
9. REFERENCES
Kawai T, Mizunuma K, Yasugi T, et al. 1991. Urinary methylhippuric acid isomer levels after occupational exposure to a xylene mixture. Int Arch Occup Environ Health 63(1):69-75.
Kawai T, Yasugi T, Mizunuma K, et al. 1992. Comparative evaluation of urinalysis and blood analysis as means of detecting exposure to organic solvents at low concentrations. Int Arch Occup Environ Health 64(4):223-234.
Kawamura K, Kaplan IR. 1983. Organic compounds in the rainwater of Los Angeles. Environ Sci Tech 17:497-501.
Keefe SH, Barber LB, Runkel RL, et al. 2004. Fate of volatile organic compounds in constructed wastewater treatment wetlands. Environ Sci Technol 38(7):2209-2216.
Keith LH, Garrison AW, Allen FR, et al. 1976. Identification of organic compounds in drinking water from thirteen U.S. cities. In: Identification and analysis of organic pollutants in water. Ann Arbor, MI: Ann Arbor Science Publishers, Inc., 329-373.
Kelly TJ, Mukund R, Spicer CW, et al. 1994. Concentrations and transformations of hazardous air pollutants. Environ Sci Technol 28(8):378A-387A.
Kerckaert GA, Brauninger R, LeBoeuf RA, et al. 1996. Use of the syrian hamster embryo cell transformation assay for carcinogenicity prediction of chemicals currently being tested by the national toxicology program in rodent bioassays. Environ Health Perspect 104(supp 5):1075-1084.
Keymeulen R, Van Langenhove H, Schamp N. 1991. Determination of monocyclic aromatic hydrocarbons in plant cuticles by gas chromatography-mass spectrometry. J Chromatogr 541:83-88.
Kiese M, Lenk W. 1974. Hydroxyacetophenones: Urinary metabolites of ethylbenzene and acetophenone. Xenobiotica 4:337-343.
Kinlin TE, Muraldihara R, Pittet AO, et al. 1972. Volatile components of roasted filberts. J Agric Food Chem 20:1021.
Kinney PL, Chillrud SN, Ramstrom S, et al. 2002. Exposures to multiple air toxics in New York City. Environ Health Perspect 110(Suppl 4):539-546.
Kirschner EM. 1995. Production of top 50 chemicals increased substantially in 1994. Chem Eng News 73(15):16-22.
Kitto AM, Pirbazari M, Badriyha BN, Ravindran V, Tyner R, Synolakis CE. 1997. Emissions of volatile and semi-volatile organic compounds and particulate matter from hot asphalts. Environ Technol 18(2):121-138.
Knecht U, Reske A, Woitowitz H. 2000. Biological monitoring of standardized exposure to ethylbenzene: Evaluation of a biological tolerance (BAT) value. Arch Toxicol 73:632-640.
Knox RC, Canter LW. 1996. Prioritization of ground water contaminants and sources. Water Air Soil Pollut 88:205-226.
Komori M, Nishio K, Kitada M et al. 1990. Fetus-specific expression of a form of cytochrome P-450 in human livers. Biochemistry 29:4430-4433.
240 ETHYLBENZENE
9. REFERENCES
Kos G, Ariya PA. 2006. Determination of a wide range of volatile and semivolatile organic compounds in snow by use of solid-phase micro-extraction (SPME). Anal Bioanal Chem 385:57-66.
Kostiainen R. 1995. Volatile organic compounds in the indoor air of normal and sick houses. Atmos Environ 29(6):693-702.
Krill RM, Sonzongni WC. 1986. Chemical monitoring of Wisconsin's groundwater. J Am Water Works Assoc 78:70-75.
Krishnan K, Andersen ME. 1994. Physiologically-based pharmacokinetic modeling in toxicology. In: Wallace Hayes, ed. Principles and Methods of Toxicology. 3rd ed. New York, NY: Raven Press, Ltd., 149-188.
Krishnan K, Andersen ME, Clewell HJ, et al. 1994. Physiologically based pharmacokinetic modeling of chemical mixtures. In: Yang RSH, ed. Toxicology of chemical mixtures: Case studies, mechanisms, and novel approaches. San Diego, CA: Academic Press, 399-437.
Kubo T, Urano K, Utsumi H. 2002. Mutagenicity characteristics of 255 environmental chemicals. J Health Sci 48(6):545-554.
Kwok ESC, Atkinson R. 1994. Estimation of hydroxyl radical reaction rate constants for gas-phase organic compounds using a structure-reactivity relationship: An update. Riverside CA: University of California. CMAARC8.0OR.
Ladefoged O, Lam HR, Ostergaard G, et al. 1998. Toxicity of the styrene metabolite, phenylglyoxylic acid, in rats after three months of oral dosing. Neurotoxicology 19(4-5):721-738.
Lawryk NJ, Weisel CP. 1996. Concentration of volatile organic compounds in the passenger compartments of automobiles. Environ Sci Technol 30:810-816.
Lawryk NJ, Lioy PJ, Weisel CP. 1995. Exposure to volatile organic compounds in the passenger compartment of automobiles during periods of normal and malfunctioning operation. J Expo Anal Environ Epidemiol 5(4):511-531.
Leeder JS, Kearns GL. 1997. Pharmacogenetics in pediatrics: Implications for practice. Pediatr Clin North Am 44(1):55-77.
Leikin JB, Poloucek FP. 2002. Ethylbenzene. In: Poisoning and toxicology handbook. Hudson, OH: Lexi-Comp, Inc., 554.
Lesage S. 1993. Methods for the analysis of hazardous wastes. J Chromatogr 642:65-74.
Leung HW. 1993. Physiologically-based pharmacokinetic modelling. In: Ballantine B, Marro T, Turner T, eds. General and Applied Toxicology. Vol. 1. New York, NY: Stockton Press, 153-164.
Lide DR, ed. 1994. CRC handbook of chemistry and physics. 75th ed. Boca Raton, FL: CRC Press, Inc., 3-47, 6-62, 15-46, 16-26.
Ligocki MP, Leuenberger C, Pankow JF. 1985. Trace organic compounds in rain-II. Gas scavenging of neutral organic compounds. Atmos Environ 19:1609-1617.
241 ETHYLBENZENE
9. REFERENCES
Lillo RS, Morris JW, Caldwell JM, et al. 1990. Atmosphere contamination following repainting of a human hyperbaric chamber complex. Undersea Biomed Res 17(5):437-449.
Livingston AL. 1978. Forage plant estrogens. J Toxicol Environ Health 4(2-3):301-324.
*Lofgren L, Persson K, Stromvall A-M. 1991. Exposure of commuters to volatile aromatic hydrocarbons from petrol exhaust. Sci Total Environ 108(3):225-233.
Lovegren NV, Fisher GS, Legendre MG, et al. 1979. Volatile constituents of dried legumes. J Agric Food Chem 27:851-853.
Lyman WJ, Reehl WF, Rosenblatt DH. 1982. Handbook of chemical property estimation methods. New York, NY: McGraw-Hill Book Company, 15-25.
Mackay D. 1979. Finding fugacity feasible. Environ Sci Technol 13(10):1218-1223.
Mackay D, Shiu WY. 1981. A critical review of Henry's law constants for chemicals of environmental interest. J Phys Chem Ref Data 19:1175-1199.
Mackay D, Shiu WY, Sutherland RP. 1979. Determination of air-water Henry's law constants for hydrophobic pollutants. Environ Sci Technol 13:333-337.
Maltoni C, Ciliberti A, Pinto C, et al. 1997. Results of long-term experimental carcinogenicity studies of the effects of gasoline, correlated fuels, and major gasoline aromatics on rats. Ann N Y Acad Sci 837:15-52.
Maltoni C, Conti B, Cotti G, et al. 1985. Experimental studies on benzene carcinogenicity at the Bologna Institute of Oncology: Current results and ongoing research. Am J Ind Med 7:415-446.
Martin P, Heavner DL, Nelson PR, et al. 1997. Environmental tobacco smoke (ets): A market cigarette study. Environ Int 23(1):75-90.
Masten LW, Boeri RL, Walker JD. 1994. Strategies employed to determine the acute aquatic toxicity of Ethylbenzene, a highly volatile, poorly water-soluble chemical. Ecotoxicol Environ Safety 27:335-348.
Matsumoto T, Koga M, Sata T, et al. 1992. The changes of gasoline compounds in blood in a case of gasoline intoxication. J Toxicol Clin Toxicol 30(4):653-662.
Maylin GA, Cooper MJ, Anders MW. 1973. Effect of phenobarbital treatment on the stereochemistry of the in vitro metabolism of ethylbenzene. J Med Chem 16:606-610.
Mayr U, Butsch A, Schneider S. 1992. Validation of two in vitro test systems for estrogenic activities with zearalenone, phytoestrogens and cereal extracts. Toxicology 74(2-3):135-149.
McClenny WA, Fortune CR. 1995. Superfund contract laboratory program method evaluation--ambient air volatile organic compounds from canisters. J Environ Sci Health A 30(4):901-919.
McDougal JN, Pollard DL, Weisman W, et al. 2000. Assessment of skin absorption and penetration of JP-8 jet fuel and its components. Toxicol Sci 55:247-255.
242 ETHYLBENZENE
9. REFERENCES
McGregor DB, Brown A, Cattanach P, et al. 1988. Responses of the L5178Y tk+/tk- mouse lymphoma cell forward mutation assay: III. 72 Coded chemicals. Environ Mol Mutag 12:85-154.
McMahon RE, Sullivan HR. 1966. Microsomal hydroxylation of ethylbenzene. Stereospecificity and the effect. Life Sci 5:921-926.
McMahon RE, Sullivan HR, Craig JC, et al. 1969. The microsomal oxygenation of ethylbenzene: Isotopic, stereochemical, and induction studies. Arch Biochem Biophys 132:575-577.
Mellert W, Deckhardt K, Kaufmann W, et al. 2007. Ethylbenzene: 4- and 13-week rat oral toxicity. Arch Toxicol 81:361-370.
Meylan WM, Howard PH, Boethling RS, et al. 1999. Improved method for estimating bioconcentration/bioaccumulation factor from octanol/water partition coefficient. Environ Toxicol Chem 18(4):664-672.
Michael LC, Erickson MD, Parks SP. 1980. Volatile environmental pollutants in biological matrices with a headspace purge technique. Anal Chem 52:1836-1841.
*Mickiewicz W, Rzeczycki W. 1988. Effect of styrene and other alkyl benzene derivatives on oxidation of FAD- and NAD-linked substrates in rat liver mitochondria. Biochem Pharmacol 37(23):4439-4444.
Midorikawa K, Uchida T, Okamoto Y, et al. 2004. Metabolic activation of carcinogenic ethylbenzene leads to oxidative DNA damage. Chem Biol Interact 150:271-281.
Minnich MM, Zimmerman JH, Schumacher BA. 1997. Long-term study of volatile organic compound recovery from ampulated, dry, fortified soils. J Environ Qual 26(1):108-114.
Mohtashamipur E, Norpoth K, Woelke U, et al. 1985. Effects of ethylbenzene, toluene, and xylene on the induction of micronuclei in bone marrow polychromatic erythrocytes of mice. Arch Toxicol 58:106-109.
Molnar J, Paksy KA, Naray M. 1986. Changes in the rat's motor behaviour during 4-hour inhalation exposure to prenarcotic concentrations of benzene and its derivatives. Acta Physiol Hung 67:349-354.
Morgan DL, Cooper SW, Carlock DL, et al. 1991. Dermal absorption of neat and aqueous volatile organic chemicals in the Fischer 344 rat. Environ Res 55(1):51-63.
Morselli PL, Franco-Morselli R, Bossi L. 1980. Clinical pharmacokinetics in newborns and infants: Age related differences and therapeutic implications. Clin Pharmacokinet 5:485-527.
Moscato G, Biscaldi G, Cottica D, et al. 1987. Occupational asthma due to styrene: Two case reports. J Occup Med 29:957-960.
Muhammad F, Monteiro-Riviere NA, Baynes RE, et al. 2005. Effect of in vivo jet fuel exposure on subsequent in vitro dermal absorption of individual aromatic and aliphatic hydrocarbon fuel constituents. J Toxicol Environ Health 68:719-737.
Mukerjee S, Ellenson WD, Lewis RG, et al. 1997. An environmental scoping study in the Lower Rio Grande Valley of Texas: III. Residential microenvironmental monitoring for air, house dust, and soil. Environ Int 23(5):657-673.
243 ETHYLBENZENE
9. REFERENCES
Mukund R, Kelly TJ, Spicer CW. 1996. Source attribution of ambient air toxic and other VOCs in Columbus, Ohio. Atmos Environ 30(20):3457-3470.
Mutti A, Falzoi H, Romanelli A, et al. 1988. Brain dopamine as a target for solvent toxicity: Effects of some monocyclic aromatic hydrocarbons. Toxicology 49:77-82.
Nakajima T, Sato A. 1979. Enhanced activity of liver drug-metabolizing enzymes for aromatic and chlorinated hydrocarbons following food deprivation. Toxicol Appl Pharmacol 50:549-556.
NAS. 1980. The alkyl benzenes. Washington, DC: National Academy of Sciences, I-16, IV-1 to IV-88.
NAS/NRC. 1989. Report of the oversight committee. Biologic markers in reproductive toxicology. Washington, DC: National Academy of Sciences, National Research Council, National Academy Press, 15-35.
Naskali L, Engelke M, Tahti H, et al. 1993. The effects of selected organic solvents on rat synaptosomal membrane fluidity and integral enzyme activities. Neurosci Res Commun 13(1):27-35.
Naskali L, Oksanen H, Tahti H. 1994. Astrocytes as targets for CNS effects of organic solvents in vitro. Neurotoxicology 15(3):609-612.
Nestmann ER, Lee EG. 1983. Mutagenicity of constituents of pulp and papermill effluent in growing cells of Saccharomyces cerevisiae. Mutat Res 119:273-280.
Nestmann ER, Lee EG, Matula TI, et al. 1980. Mutagenicity of constituents identified in pulp and paper mill effluents using the Salmonella/mammalian-microsome assay. Mutat Res 79:203-212.
NFPA. 1994. Ethylbenzene. Fire protection guide to hazardous materials. 11th ed. Quincy, MA: National Fire Protection Association, 49-65, 325-348.
Nicola RM, Branchflower R, Pierce D. 1987. Chemical contaminants in bottomfish. J Environ Health 49:342-347.
Nielsen GD, Alarie Y. 1982. Sensory irritation, pulmonary irritation, and respiratory stimulation by airborne benzene and alkylbenzenes: Prediction of safe industrial exposure levels and correlation with their thermodynamic properties. Toxicol Appl Pharmacol 65:459-477.
NIOSH. 1981. Teratologic assessment of ethylbenzene and 2-ethoxyethanol. Cincinnatti, OH: National Institute for Occupational Safety and Health. PB83208074.
NIOSH. 1990. Ethylbenzene. Estimated numbers of employees potentially exposed to specific agents by 2-digit Standard Industrial Classification (SIC). National Occupational Exposure Survey conducted from 1981-1983. Centers for Disease Control. National Institute for Occupational Safety and Health. http://www.cdc.gov/noes/. August 22, 2007.
NIOSH. 1994a. Method 1501. NIOSH manual of analytical methods. Washington, DC: U.S. Department of Health, Education, and Welfare, Public Health Service, Center for Disease Control, National Institute for Occupational Safety and Health.
244 ETHYLBENZENE
9. REFERENCES
*NIOSH. 1994b. Ethylbenzene. NIOSH pocket guide to chemical hazards. U.S. Department of Health, Education, and Welfare, Public Health Service, Center for Disease Control, National Institute for Occupational Safety and Health, 132-133.
NIOSH. 1995. Report to Congress on workers' home contamination study conducted under the worker's family Protection Act (29 U.S.C. 671a). DHHS (NIOSH) Publication No. 95-123. PB96192000HEF.
NIOSH. 2005. Ethylbenzene. NIOSH pocket guide to chemical hazards. Atlanta, GA: National Institute for Occupational Safety and Health, Centers for Disease Control and Prevention. http://www.cdc.gov/niosh/npg/ April 11, 2007.
NIOSH. 2009. NIOSH pocket guide to chemical hazards. RTECS. Benzene, ethyl- National Institute for Occupational Safety and Health. http://www.cdc.gov/niosh/rtecs/daaae60.html. February 18, 2010.
NIOSH/OSHA. 1978. Occupational health guidelines for ethyl benzene. Washington, DC: National Institute for Occupational Safety and Health. Occupational Safety and Health Administration.
Nishihara T, Nishikawa J, Kanayama T, et al. 2000. Estrogenic activities of 517 chemicals by yeast two-hybrid assay. J Health Sci 46(4):282-298.
Nong A, Charest-Tardif G, Tardif R, et al. 2007. Physiologically based modeling of the inhalation pharmacokinetics of ethylbenzene in B6C3F1 mice. J Toxicol Environ Health A 70(21):1838-1848.
Norppa H, Vainio H. 1983a. Induction of sister-chromatid exchanges by styrene analogues in cultured human lymphocytes. Mutat Res 116:379-387.
NRC. 1993. Pesticides in the diets of infants and children. National Research Council, Washington DC: National Academy Press. PB93216091.
NTP. 1986. Toxicology and carcinogenesis studies of xylenes (mixed) (60% m-xylene, 14% p-xylene, 9%-xylene, and 17% ethylbenzene) in F334/N rats and B6C3F1 mice (gavage studies). Research Triangle Park, NC: National Toxicology Program. NTP TR 327.
NTP. 1990. Toxicology and carcinogenesis studies of a-methylbenzyl alcohol in F344/N Rats and B6C3F1 mice (gavage studies) Research Triangle Park, NC: National Toxicology Program. No. 369.
NTP. 1992. Toxicity studies of ethylbenzene in F344/N rats and B6C3F1 mice (inhalation studies). Research Triangle Park, NC: National Toxicology Program. NTP Tox 10. http://inmagic.syrres.com/esc-images/NTIS/NTP/TOX010.pdf. August 02, 2007.
NTP. 1999. NTP technical report on the toxicology and carcinogenesis studies of ethylbenzene in F344/N rats and B6C3F1 mice (inhalation studies). Research Triangle Park, NC: National Toxicology Program, U.S. Department of Health and Human Services. NTP TR 466.
NTP. 2005. Report on carcinogens. 11 ed. Research Triangle Park, NC: U.S. Department of Health and Human Services, Public Health Service National Toxicology Program. http://ntp-server.niehs.nih.gov/ntp/roc/toc11.html. March 08, 2006.
Nunes P, Benville PE. 1979. Uptake and depuration of petroleum hydrocarbons in the Manila clam, Tapes semidecussata reeve. Bull Environ Contam Toxicol 21:719-726.
245 ETHYLBENZENE
9. REFERENCES
Ogata M, Taguchi T. 1987. Quantitation of urinary metabolites of toluene, xylene, styrene, ethyl-benzene, benzene and phenol by automated high-performance liquid chromatography. Int Arch Occup Environ Health 59:263-272.
Ogata M, Taguchi T. 1988. Simultaneous determination of urinary creatinine and metabolites of toluene, xylene, styrene, ethylbenzene and phenol by automated high performance liquid chromatography. Environ Health 61(1/2):131-140.
Ogata M, Fujisawa K, Ogino Y, et al. 1984. Partition coefficients as a measure of bioconcentration potential of crude oil compounds in fish and shellfish. Bull Environ Contam Toxicol 33:561-567.
Ohta T, Ohyama T. 1985. A set of rate constants for the reactions of OH radicals with aromatic hydrocarbons. Bull Chem Soc Jpn 58:3029-3030.
Oliver KD, Adams JR, Daughtrey EH, et al. 1996. Technique for monitoring toxic VOCs in air: Sorbent preconcentration, closed-cycle cooler cryofocusing and GC/MS analysis. Environ Sci Technol 30:1939-1945.
OSHA. 2006a. Air contaminants. Occupational safety and health standards for shipyard employment. Occupational Safety and Health Administration. Code of Federal Regulations. 29 CFR 1915.1000 http://www.osha.gov/comp-links.html. April 11, 2007.
OSHA. 2006b. Gases, vapors, fumes, dusts, and mists. Safety and health regulations for construction. Occupational Safety and Health Administration. Code of Federal Regulations. 29 CFR 1926.55, Appendix A. http://www.osha.gov/comp-links.html. April 11, 2007.
OSHA. 2006c. Limits for air contaminants. Occupational safety and health standards. Occupational Safety and Health Administration. Code of Federal Regulations. 29 CFR 1910.1000. http://www.osha.gov/comp-links.html. April 11, 2007.
OTA. 1990. Neurotoxicity: Identifying and controlling poisons of the nervous system. Washington, DC: Office of Technology Assessment. OTABA438.
Otson R, Chan C. 1987. Sample handling and analysis for 51 volatile organics by an adapted purge and trap GC-MS technique. Int J Environ Anal Chem 30:275-287.
Otson R, Kumarathasan P. 1995. An automated head space analysis method for xylenes and ethylbenzene in blood and water. Chemosphere 30(6):1109-1123.
Otson R, Williams DT. 1981. Evaluation of a liquid-liquid extraction technique for water pollutants. J Chromatogr 212:187-198.
Otson R, Williams DT. 1982. Headspace chromatographic determination of water pollutants. Anal Chem 54:942-946.
Otson R, Fellin P, Tran Q. 1994. VOCs in representative Canadian residences. Atmos Environ 28(22):3563-3569.
Overton EB, Stewart M, Carney R. 1995. Instrumental consideration for reliable fieldable VOC analyses. J Hazard Mater 43:77-89.
246 ETHYLBENZENE
9. REFERENCES
Owen GM, Brozek J. 1966. Influence of age, sex, and nutrition on body composition during childhood and adolescence. In: Falkner F, ed. Human development. Philadelphia, PA: Saunders, 222-238.
Pellizzari ED, Hartwell TD, Harris BSH, et al. 1982. Purgeable organic compounds in mother's milk. Bull Environ Contam Toxicol 28:322-328.
Pellizzari ED, Sheldon L, Keever J, et al. 1993. Determination of airborne organic compounds using tenax GC and gas chromatography mass spectrometry. Environmental carcinogens selected methods of analysis. Vol 7. IARC Publication No. 68. Lyon, France: International Agency for the Research on Cancer, 196-210.
Pellizzari ED, Zweidinger RA, Sheldon LS. 1985. Method 23: Breath sampling. Environmental carcinogens selected methods of analysis. Vol 7. IARC Publication No. 68. Lyon, France: International Agency for the Research of Cancer, 399-411.
Pierce CH, Dills RL, Silvey GW, et al. 1996. Partition coefficients between human blood or adipose tissue and air for aromatic solvents. Scand J Work Environ Health 22:112-118.
Plumb RH. 1991. The occurrence of Appendix IX organic constituents in disposal site ground water. Ground Water Monit Rev 11(2):157-164.
Polak J, Lu BCY. 1973. Mutual solubilities of hydrocarbons and water at 0 and 25 C. Can J Chem 51:4018-4023.
Potter TL. 1993. Analysis of petroleum contaminated soil and water: An overview. In: Calabrese EJ, Kostecki PT, eds. Principles and practices for petroleum contaminated soils. Boca Raton, FL: Lewis Publishers, 1-14.
Proctor NH, Hughes JP. 1978. Ethylbenzene. In: Chemical hazards of the workplace. Philadelphia, PA: J.B. Lippincott Company, 251-252.
Pryor G, Rebert C, Kassay K, et al. 1991. The hearing loss associated with exposure to toluene is not caused by a metabolite. Brain Res Bull 27:109-113.
Ptacek CJ, Cherry JA, Gillham RW. 1984. Mobility of dissolved petroleum derived hydrocarbon in sand aquifers. In: Vandermeulen JH, Hrudey SE, eds. Oil in freshwater: Chemistry, biology, countermeasure technology. New York, NY: Pergamon Press, 195-212.
Pyykko K, Paavilainen S, Metsa-Ketela T, et al. 1987. The increasing and decreasing effects of aromatic hydrocarbon solvents on pulmonary and hepatic cytochrome P-450 in the rat. Pharmacol Toxicol 60:288-293.
Quigley CJ, Corsi RL. 1995. Emissions of VOCs from a municipal sewer. J Air Waste Manage Assoc 45:395-403.
Ramanand K, Balba MT, Duffy J. 1995. Biodegradation of select organic pollutants in soil columns under denitrifying conditions. Haz Waste Haz Mater 12(1):27-36.
Ransley DL. 1984. Xylenes and ethylbenzene. In: Grayson M, ed. Kirk-Othmer encyclopedia of chemical technology. Vol. 24. New York, NY: John Wiley & Sons, 709-744.
247 ETHYLBENZENE
9. REFERENCES
Rao PSC, Hornsley AG, Kilcrease DF, et al. 1985. Sorption and transport of hydrophobic organic chemicals in aqueous and mixed solvent systems: Model development and preliminary evaluation. J Environ Qual 14:376-382
Rappaport SM, Selvin S, Waters MA. 1987. Exposure to hydrocarbon components of gasoline in the petroleum industry. Appl Ind Hyg 2:148-154.
Ravishankara AR, Wagner S, Fischer S, et al. 1978. A kinetics study of the reactions of hydroxyl with several aromatic and olefinic compounds. Int J Chem Kinet 10:783-804.
Raykar PV, Fung MC, Anderson BD. 1988. The role of protein and lipid domains in the uptake of solutes by human stratum corneum. Pharmacol Res 5(3):140-150.
Rhue RD, Rao PSC, Smith RE. 1988. Vapor-phase adsorption of alkyl benzenes and water on soils and clays. Chemosphere 17:727-741.
Riedel K, Ruppert T, Conze C, et al. 1996. Determination of benzene and alkylated benzenes in ambient and exhaled air by microwave desorption coupled with gas chromatography-mass spectrometry. J Chromatogr A 719(2):383-389.
*Roberfroid M, Poncelet F, Lambotte-Vandepaer M, et al. 1978. Acute biotoxic effect of styrene on rat liver. Correlation with enzyme-mediated mutagenicity of benzpyrene and acrylonitrile. Scand J Work Environ Health 4:163-168.
Roberts MS, Triggs EJ, Anderson RA. 1975. Permeability of solutes through biological membranes measured by a desorption technique. Nature 257:225-227.
Romanelli A, Falzoi M, Mutti A, et al. 1986. Effects of some monocyclic aromatic solvents and their metabolites on brain dopamine in rabbits. J Appl Toxicol 6(6):431-435.
Romer KG, Federsel RJ, Freundt KJ. 1986. Rise of inhaled toluene, ethyl benzene, m-xylene, or mesitylene in rat blood after treatment with ethanol. Bull Environ Contam Toxicol 37:874-876.
Rosen AA, Skeel RT, Ettinger MB. 1963. Relationship of river water odor to specific organic contaminants. J Water Pollut Cont Fed 35:777-782.
Rosenfeld JK, Plumb RH. 1991. Ground water contamination at wood treatment facilities. Ground Water Monit Rev 11:133-140.
Rowell LB. 1986. Human circulation, regulation during physical stress. New York, NY: Oxford University Press, Inc., 96-98
RTECS. 2009. Ethylbenzene. Registry of Toxic Effects on Chemical Substances. National Institute of Occupational Safety and Health. MDL Information Systems, Inc. February 18, 2010.
Sack TM, Steele DH, Hammerstrom K, et al. 1992. A survey of household products for volatile organic compounds. Atmos Environ 26A(6):1063-1070.
248 ETHYLBENZENE
9. REFERENCES
Saillenfait AM, Gallissot F, Morel G, et al. 2003. Developmental toxicities of ethylbenzene, ortho-, meta-, para-xylene and technical xylenes in rats following inhalation exposure. Food Chem Toxicol 41:415-429.
Saillenfait AM, Gallissot F, Sabate JP, et al. 2006. Developmental toxicity of combined ethylbenzene and methylethylketone administered by inhalation to rats. Food Chem Toxicol 44(8):1287-1298.
Saillenfait AM, Gallissot F, Sabate JP, et al. 2007. Developmental toxic effects of ethylbenzene to toluene alone and in combination with butyl acetate in rats after inhalation exposure. J Appl Toxicol 27(1):32-42.
Sams C, Loizou GD, Crocker J, et al. 2004. Metabolism of ethylbenzene by human liver microsomes and recombinant human cytochrome P450s (CYP). Toxicol Lett 147(3):253-260.
Sauer PA, Tyler EJ. 1995. Heavy metal and volatile organic chemical removal and treatment in on-site wastewater infiltration systems. I. Catch basins and septic tanks. Water Air Soil Pollut 89:221-232.
Sauer TC, Sackett WM, Jeffrey LM. 1978. Volatile liquid hydrocarbons in the surface coastal waters of the Gulf of Mexico. Mar Chem 7:1-16.
Sax NI, Lewis RJ. 1989. Dangerous properties of industrial materials. Vol. II. 7th ed. New York, NY: Van Nostrand Reinhold, 1601.
Scheuplein RJ. 1976. Permeability of the skin: A review of some major concepts. J Invest Dermatol 67:672-676.
Schuberth J. 1996. A full evaporation headspace technique with capillary GC and ITD: A means for quantitating volatile organic compounds in biological samples. J Chromatogr Sci 34(7):314-319.
Seely JC, Haseman JK, Nyska A, et al. 2002. Effect of chronic progressive nephropathy on the incidence of renal tubule cell neoplasms in control male F344 rats. Toxicol Pathol 30(6):681-686.
*Sequeira DJ, Eyer CS, Cawley GF, et al. 1992. Ethylbenzene-mediated induction of cytochrome P450 isozymes in male and female rats. Biochem Pharmacol 44(6):1171-1182.
Seidel SD, Schisler MR, Kleinert KM. 2006. Evaluation of ethylbenzene in the mouse lymphoma (L5178Y TK+/-) forward mutation assay. Arlington, VA: American Chemistry Council.
Setchell BP, Waites GMH. 1975. The blood-testis barrier. In: Creep RO, Astwood EB, Geiger SR, eds. Handbook of physiology: Endocrinology V. Washington, DC: American Physiological Society, 143-172.
Seto Y. 1994. Determination of volatile substances in biological samples by headspace gas chromatography. J Chromatogr A 674:25-62.
Sexton K, Adgate JL, Church TR, et al. 2005. Children's exposure to volatile organic compounds as determined by longitudinal measurements in blood. Environ Health Perspect 113(3):342-349.
Shatkin JA, Brown HS. 1991. Pharmacokinetics of the dermal route of exposure to volatile organic chemicals in water: A computer simulation model. Environ Res 56(1):90-108.
249 ETHYLBENZENE
9. REFERENCES
Shirey RE. 1995. Rapid analysis of environmental samples using solid-phase microextraction (SPME) and narrow bore capillary columns. J High Resol Chromatogr 18(8):495-499.
Sikkema J, De Bont J AM, Poolman B. 1995. Mechanisms of membrane toxicity of hydrocarbons. Microbiol Rev 59(2):201-222.
Singh HB, Salas LJ, Cantrell BK, et al. 1985. Distribution of aromatic hydrocarbons in the ambient air. Atmos Environ 19:1911-1919.
Singh HG, Salas LJ, Smith AJ, et al. 1981. Measurements of some potentially hazardous organic chemicals in urban environments. Atmos Environ 15:601-612.
Sliwinska-Kowalska M, Zamyslowska-Szmytke E, Szymczak W, et al. 2001. Hearing loss among workers exposed to moderate concentrations of solvents. Scand J Work Environ Health 27(5):335-342.
Smith JN, Smithies RH, Williams RT. 1954a. The metabolism of alkylbenzenes. Stereochemical aspects of the biological hydroxylation of ethylbenzene to methylphenylcarbinol. Biochem J 56:320-324.
Smith JN, Smithies RH, Williams RT. 1954b. The metabolism of alkylbenzenes. (a) Glucuronic acid excretion following the administration of alkylbenzenes. (b) Elimination of toluene in the expired air of rabbits. Biochem J 56:317-320.
Smith LA, Stock TH, Chung KC, et al. 2007. Spatial analysis of volatile organic compounds from a community-based air toxics monitoring network in Deer Park, Texas, USA. Environ Monit Assess 128(1-3):369-379.
Smyth H, Carpenter CP, Weil CS, et al. 1962. Range finding toxicity data: List VI. Am Ind Hyg Assoc J 23:95-107.
Snider EH, Manning FS. 1982. A survey of pollutant emission levels in wastewaters and residuals from the petroleum refining industry. Environ Int 7:237-258.
Sollenberg J, Smallwood AW, Lowry LK. 1985. Determination of mandelic and phenylglyoxylic acids in rat urine by high- performance liquid chromatography and by isotachophoresis. J Chromatogr 343:175-178.
Soukup DA, Ulery AL, Jones S. 2007. Distribution of petroleum and aromatic hydrocarbons at a former crude oil and natural gas production facility. Soil Sediment Contam 16(2):143-158.
Sram RJ, Beskid O, Binkova B, et al. 2004. Cytogenic analysis using fluorescence in situ hybridization (FISH) to evaluate occupational exposure to carcinogens. Toxicol Lett 149:335-344.
SRI. 2006. Ethylbenzene. Directory of chemical producers: United States of America. Menlo Park, CA: SRI International, 593.
Staples CA, Werner AF, Hoogheem TJ. 1985. Assessment of priority pollutant concentrations in the United States using STORET database. Environ Toxicol Chem 4:131-142.
St-Germain F, Mamer O, Brunet J, et al. 1995. Volatile organic compound analysis by an inertial spray extraction interface coupled to an ion trap mass spectrometer. Anal Chem 67:4536-4541.
250 ETHYLBENZENE
9. REFERENCES
Stein VB, Narang RS. 1990. A simplified method for the determination of volatiles in eggs using headspace analysis with a photoionization detector. Arch Environ Contam Toxicol 19:593-596.
Stokman SK. 1987. Estimations of concentrations of soluble petroleum hydrocarbons migrating into ground water from contaminated soil sources. Proceedings of the NWWA/API conference on petroleum hydrocarbons and organic chemicals in groundwater: Prevention, detection and restoration, Houston, Texas, November 1987. Dublin, OH: National Water Well Association, 541-558.
Stott WT, Johnson KA, Bahnemann R, et al. 2003. Evaluation of potential modes of action of inhaled ethylbenzene in rats and mice. Toxicol Sci 71:53-66.
Stubin AI, Brosnan TM, Porter KD, et al. 1996. Organic priority pollutants in New York City municipal wastewaters: 1989-1993. Water Environ Res 68(6):1037-1044.
Stuermer DH, Ng DJ, Morris CJ. 1982. Organic contaminants in groundwater near an underground coal gasification site in northeastern Wyoming. Environ Sci Technol 16:582-587.
Stump DG. 2004. A 28-day inhalation splenic antibody formation study of ethylbenzene in rats. Arlington, VA: American Chemistry Council.:1-398.
Sugita T, Ishiwata H, Kawamura Y, et al. 1995. Headspace gas chromatographic analysis of residual volatile substances in polystyrene food containers. J Food Hyg Soc Jpn 36(2):263-268. (Japanese).
Sullivan HR, Miller WM, McMahon RE. 1976. Reaction pathways of in vivo stereoselective conversion of ethylbenzene to (-)-mandelic acid. Xenobiotica 6:49-54.
Susten AS, Niemeier RW, Simon SD. 1990. In vivo percutaneous absorption studies of volatile organic solvents in hairless mice. II. Toluene, ethylbenzene and aniline. J Appl Toxicol 10(3):217-225.
Sutton C, Calder JA. 1975. Solubility of alkylbenzenes in distilled and seawater 25.0°C. J Chem Eng Data 20:320-322.
Swann RL, Laskowski DA, McCall PJ, et al. 1983. A rapid method for the estimation of the environmental parameters octanol/water partition coefficient, soil sorption constant, water to air ratio, and water solubility. Residue Rev 85:17-28.
Tang W, Hemm I, Eisenbrand G. 2000. Estimation of human exposure to styrene and ethylbenzene. Toxicology 144:39-50.
*Tanii H, Huang J, Hashimoto K. 1995. Structure-acute toxicity relationship of aromatic hydrocarbons in mice. Toxicol Lett 76(1):27-31.
Tardif R, Charest-Tardif G, Brodeur J. 1996. Comparison of the influence of binary mixtures versus a ternary mixture of inhaled aromatic hydrocarbons on their blood kinetics in the rat. Arch Toxicol 70(7):405-13.
Tardif R, Charest-Tarif G, Brodeur J, et al. 1997. Physiologically based pharmacokinetic modeling of a ternary mixture of alkyl benzenes in rats and humans. Toxicol Appl Pharmacol 144:120-134.
Tardif R, Laparé S, Plaa GL, et al. 1991. Effect of simultaneous exposure to toluene and xylene on their respective biological exposure indices in humans. Int Arch Occup Environ Health 63:279-284.
251 ETHYLBENZENE
9. REFERENCES
Tegeris JS, Balster RL. 1994. A comparison of the acute behavioral effects of alkylbenzenes using a functional observational battery in mice. Fundam Appl Toxicol 22(2):240-250.
Tester DJ, Harker RJ. 1981. Groundwater pollution investigations in the Great Ouse Basin. Water Pollut Control 80:614-631.
Thienes C, Haley TJ. 1972. Clinical toxicology. 5th ed. Philadelphia, PA: Lea and Febiger, 126-127.
Thomas K, Colborn T. 1992. Organochlorine endocrine disruptors in human tissue. In: Colborn T, Clement C, eds. Chemically induced alterations in sexual and functional development: The wildlife/human connection. Princeton, NJ: Princeton Scientific Publishing, 65-394.
Thomas KW, Pellizzari ED, Cooper SD. 1991. A canister-based method for collection and GC/MS analysis of volatile organic compounds in human breath. J Anal Toxicol 15(2):54-59.
Thomas KW, Pellizzari ED, Raymer JH, et al. 1992. Kinetics of low-level volatile organic compounds in breath - I. Experimental design and data quality. J Exp Anal Environ Epidemiol 2(2):45-66.
Toftgard R, Nilsen OG. 1982. Effects of xylene and xylene isomers on cytochrome P-450 and in vitro enzymatic activities in rat liver kidney and lung. Toxicology 23:197-212.
TRI06. 2008. TRI explorer: Providing access to EPA’s toxics release inventory data. Washington, DC: Office of Information Analysis and Access. Office of Environmental Information. U.S. Environmental Protection Agency. Toxics Release Inventory. http://www.epa.gov/triexplorer/. April 23, 2008.
Tsuruta H. 1982. Percutaneous absorption of organic solvents: III. On the penetration rates of hydrophobic solvents through excised rat skin. Ind Health 20:335-346.
Ungvary G. 1986. Solvent effects on reproduction: Experimental toxicity. Prog Clin Biol Res 220:169-177.
Ungváry G, Tátrai E. 1985. On the embryotoxic effects of benzene and its alkyl derivatives in mice, rats and rabbits. Arch Toxicol Suppl 8:425-430.
USGS. 2006. Volatile organic compounds in the Nation’s ground water and drinking-water supply wells. Reston, VA: U.S. Department of the Interior, U.S. Geological Survey.
Vaalavirta L, Tähti H. 1995a. Astrocyte membrane Na+, K(+)-ATPase and Mg(2+)-ATPase as targets of organic solvent impact. Life Sci 57(24):2223-2230.
Vaalavirta L, Tähti H. 1995b. Effects of selected organic solvents on the astrocyte membrane ATPase in vitro. Clin Exper Pharmacol Physiol 22(4):293-294.
Van der Linden AC, Thijsse GJE. 1965. The mechanisms of microbial oxidations of petroleum hydrocarbons. Adv Enzymol 27:469-546.
van Kleef RGDM, Henk PM, Vijverberg HPM, et al. 2008. Selective inhibition of human heteromeric alpha9alpha10 nicotinic acetylcholine receptors at a low agonist concentration by low concentrations of ototoxic organic solvents. Toxicol In Vitro 22(6):1568-1572.
252 ETHYLBENZENE
9. REFERENCES
Verhoeff AP, Suk J, Van Wijnen JH. 1988. Residential indoor air contamination by screen printing plants. Int Arch Occup Environ Health 60:201-209.
Verschueren K. 1983. Handbook of environmental data on organic chemicals. 2nd ed. New York, NY: Van Nostrand Reinhold Co., 628-630.
Vieira I, Sonnier M, Cresteil T. 1996. Developmental expression of CYP2E1 in the human liver: Hypermethylation control of gene expression during the neonatal period. Eur J Biochem 238(2):476-483.
Vowles PD, Mantoura RFC. 1987. Sediment-water partition coefficients and HPLC retention factors of aromatic hydrocarbons. Chemosphere 16:109-116.
Wadden RA, Scheff PA, Franke JE, et al. 1995. VOC emission rates and emission factors for a sheet fed offset printing shop. Am Ind Hyg Assoc J 56:368-376.
Wade OL, Bishop JM, Donald KW. 1962. Cardiac output and regional blood flow. Oxford: Blackwell Scientific Publications, 86-107.
Wakeham SG, Davis AC, Karas JL. 1983. Mesocosm experiments to determine the fate and persistence of volatile organic compound in coastal seawater. Environ Sci Technol 17:611-617.
Wallace L, Pellizzari E, Hartwell T, et al. 1986. Concentrations of 20 volatile organic compounds in the air and drinking water of 350 residents of New Jersey compared with concentrations in their exhaled breath. J Occup Med 28:603-608.
Wallace L, Pellizzari E, Hartwell TD, et al. 1987c. Exposures to benzene and other volatile compounds from active and passive smoking. Arch Environ Health 42:272-279.
Wallace L, Zweidinger R, Erickson M, et al. 1982. Monitoring individual exposure measurements of volatile organic compounds in breathing-zone air, drinking water, and exhaled breath. Environ Int 8:269-282.
Wallace LA. 1986. Personal exposures, indoor and outdoor air concentrations, and exhaled breath concentrations of selected volatile organic compounds measured for 600 residents of New Jersey, North Dakota, North Carolina and California. Toxicol Environ Chem 12:215-236.
Wallace LA, Pellizzari ED, Hartwell TD, et al. 1987a. The TEAM study: Personal exposures to toxic substances in air, drinking water, and breath of 400 residents of New Jersey, North Carolina, and North Dakota. Environ Res 43:290-307.
Wallace LA, Pellizzari ED, Hartwell TD, et al. 1989. The influence of personal activities on exposure to volatile organic compounds 1.2. Environ Res 50(1):37-55.
Wallace LA, Pellizzari E, Leaderer B, et al. 1987b. Emissions of volatile organic compounds from building materials and consumer products. Atmos Environ 21:385-393.
Wang BL, Takigawa T, Takeuchi A, et al. 2007. Unmetabolized VOCs in urine as biomarkers of low level exposure in indoor environments. J Occup Health 49(2):104-110.
253 ETHYLBENZENE
9. REFERENCES
Welch VA, Fallon KJ, Gelbke H-P. 2005. Ethylbenzene. Ullmann's encyclopedia of industrial chemistry. Weinheim: VCH Verlag GmbH & Co. http://www.mrw.interscience.wiley.com/emrw/9783527306732/ueic/article/a10_035/current/pdf. March 29, 2007.
West JR, Smith HW, Chasis H. 1948. Glomerular filtration rate, effective renal blood flow, and maximal tubular excretory capacity in infancy. J Pediat 32:10-18.
Whitehead LW, Ball GL, Fine LJ, et al. 1984. Solvent vapor exposures in booth spray painting and spray glueing, and associated operations. Am Ind Hyg Assoc J 45:767-772.
WHO. 2000. Air quality guidelines. 2nd ed. Geneva, Switzerland: World Health Organization. http://www.euro.who.int/Document/AIQ/AirQualRepMtg.pdf. March 08, 2006.
WHO. 2004. Guidelines for drinking-water quality. Vol. 1. Recommendations. 3rd ed. Geneva, Switzerland: World Health Organization. http://www.who.int/water_sanitation_health/dwq/gdwq3/en/. March 08, 2006.
Widdowson EM, Dickerson JWT. 1964. Chemical composition of the body. In: Comar CL, Bronner F, eds. Mineral metabolism: An advanced treatise. Volume II: The elements Part A. New York: Academic Press, 1-247.
Wilson BH, Smith GB, Rees JF. 1986. Biotransformations of selected alkylbenzenes and halogenated aliphatic hydrocarbons in methanogenic aquifer material: A microcosm study. Environ Sci Technol 20:997-1002.
Wolf MA, Rowe VK, McCollister DD, et al. 1956. Toxicological studies of certain alkylated benzenes and benzene: Experiments on laboratory animals. AMA Arch Ind Health 14:387-398.
Wolff MS. 1976. Evidence for existence in human tissues of monomers for plastics and rubber manufacture. Environ Health Perspect 17:183-187.
Wolff MS, Daum SM, Lorimer WV, et al. 1977. Styrene and related hydrocarbons in subcutaneous fat from polymerization workers. J Toxicol Environ Health 2:997-1005.
Wollny H. 2000. Cell mutation assay at the thymidine kinase locus (TK +/-) in mouse lymphoma L5178Y cells (soft agar method) with ethylbenzene. Brussels, Belgium: CEFIC.
*Wrbitzky R, Goen T, Letzel S, et al. 1995. Internal exposure of waste incineration workers to organic and inorganic substances. Int Arch Occup Environ Health 68(1):13-21.
Yadav JS, Reddy CA. 1993. Degradation of benzene, toluene, ethylbenzene, and xylenes (BTEX) by the lignin-degrading basidiomycete Phanerochaete chrysosporium. Appl Environ Microbiol 59(3):756-762.
Yalkowsky SH, Valvani SC. 1976. Partition coefficients and surface areas of some alkylbenzenes. J Med Chem 19:727-728.
Yamasaki Y. 1984. [The determination of urinary metabolites of ethylbenzene by high- performance liquid chromatography]. Okayama Igakkai Zasshi 96:531-535. (Japanese)
254 ETHYLBENZENE
9. REFERENCES
Yanagihara S, Shimada I, Shinoyama E, et al. 1977. Photochemical reactivities of hydrocarbons. In: Kasuga S, eds. Proceedings of the 4th International Clean Air Congress. Tokyo: Japanese Union of Air Pollution Prevention Associations, 472-477.
Yant WP, Schrenk HH, Waite CP, et al. 1930. Acute response of guinea pigs to vapors of some new commercial organic compounds. II. Ethylbenzene. Pub Health Rep 45:1241-1250.
*Yuan W, Cawley GF, Eyer CS, et al. 1994. Induction of P450 3A by ethylbenzene without altering RNA levels. Biochem Biophys Res Commun 202(3):1259-1265.
*Yuan W, White T B, White J W, et al. 1995. Relationship between hydrocarbon structure and induction of P450: Effect on RNA levels. Xenobiotica 25(1):9-16.
Zappi ME, Rogers BA, Teeter CL, et al. 1996. Bioslurry treatment of a soil contaminated with low concentration of total petroleum hydrocarbons. J Hazard Mater 46:1-12.
Zeiger E, Anderson B, Haworth S, et al. 1992. Salmonella mutagenicity tests: V. Results from the testing of 311 chemicals. Environ Mol Mutagen 19(Supplement 21):2-141.
Ziegler EE, Edwards BB, Jensen RL et al. 1978. Absorption and retention of lead by infants. Pediatr Res 12:29-34.
Zielinska B, Sagebiel JC, Harshfield G, et al. 1996. Volatile organic compounds up to C20 emitted from motor vehicles; measurement methods. Atmos Environ 30(12):2269-2286.
Zweidinger RB, Sigsby JE, Tejada SB, et al. 1988. Detailed hydrocarbon and aldehyde mobile source emissions from roadway studies. Environ Sci Technol 22:956-962.
255 ETHYLBENZENE
10. GLOSSARY
Absorption—The taking up of liquids by solids, or of gases by solids or liquids.
Acute Exposure—Exposure to a chemical for a duration of 14 days or less, as specified in the Toxicological Profiles.
Adsorption—The adhesion in an extremely thin layer of molecules (as of gases, solutes, or liquids) to the surfaces of solid bodies or liquids with which they are in contact.
Adsorption Coefficient (Koc)—The ratio of the amount of a chemical adsorbed per unit weight of organic carbon in the soil or sediment to the concentration of the chemical in solution at equilibrium.
Adsorption Ratio (Kd)—The amount of a chemical adsorbed by sediment or soil (i.e., the solid phase) divided by the amount of chemical in the solution phase, which is in equilibrium with the solid phase, at a fixed solid/solution ratio. It is generally expressed in micrograms of chemical sorbed per gram of soil or sediment.
Benchmark Dose (BMD)—Usually defined as the lower confidence limit on the dose that produces a specified magnitude of changes in a specified adverse response. For example, a BMD10 would be the dose at the 95% lower confidence limit on a 10% response, and the benchmark response (BMR) would be 10%. The BMD is determined by modeling the dose response curve in the region of the dose response relationship where biologically observable data are feasible.
Benchmark Dose Model—A statistical dose-response model applied to either experimental toxicological or epidemiological data to calculate a BMD.
Bioconcentration Factor (BCF)—The quotient of the concentration of a chemical in aquatic organisms at a specific time or during a discrete time period of exposure divided by the concentration in the surrounding water at the same time or during the same period.
Biomarkers—Broadly defined as indicators signaling events in biologic systems or samples. They have been classified as markers of exposure, markers of effect, and markers of susceptibility.
Cancer Effect Level (CEL)—The lowest dose of chemical in a study, or group of studies, that produces significant increases in the incidence of cancer (or tumors) between the exposed population and its appropriate control.
Carcinogen—A chemical capable of inducing cancer.
Case-Control Study—A type of epidemiological study that examines the relationship between a particular outcome (disease or condition) and a variety of potential causative agents (such as toxic chemicals). In a case-controlled study, a group of people with a specified and well-defined outcome is identified and compared to a similar group of people without outcome.
Case Report—Describes a single individual with a particular disease or exposure. These may suggest some potential topics for scientific research, but are not actual research studies.
Case Series—Describes the experience of a small number of individuals with the same disease or exposure. These may suggest potential topics for scientific research, but are not actual research studies.
256 ETHYLBENZENE
10. GLOSSARY
Ceiling Value—A concentration of a substance that should not be exceeded, even instantaneously.
Chronic Exposure—Exposure to a chemical for 365 days or more, as specified in the Toxicological Profiles.
Cohort Study—A type of epidemiological study of a specific group or groups of people who have had a common insult (e.g., exposure to an agent suspected of causing disease or a common disease) and are followed forward from exposure to outcome. At least one exposed group is compared to one unexposed group.
Cross-sectional Study—A type of epidemiological study of a group or groups of people that examines the relationship between exposure and outcome to a chemical or to chemicals at one point in time.
Data Needs—Substance-specific informational needs that if met would reduce the uncertainties of human health assessment.
Developmental Toxicity—The occurrence of adverse effects on the developing organism that may result from exposure to a chemical prior to conception (either parent), during prenatal development, or postnatally to the time of sexual maturation. Adverse developmental effects may be detected at any point in the life span of the organism.
Dose-Response Relationship—The quantitative relationship between the amount of exposure to a toxicant and the incidence of the adverse effects.
Embryotoxicity and Fetotoxicity—Any toxic effect on the conceptus as a result of prenatal exposure to a chemical; the distinguishing feature between the two terms is the stage of development during which the insult occurs. The terms, as used here, include malformations and variations, altered growth, and in utero death.
Environmental Protection Agency (EPA) Health Advisory—An estimate of acceptable drinking water levels for a chemical substance based on health effects information. A health advisory is not a legally enforceable federal standard, but serves as technical guidance to assist federal, state, and local officials.
Epidemiology—Refers to the investigation of factors that determine the frequency and distribution of disease or other health-related conditions within a defined human population during a specified period.
Genotoxicity—A specific adverse effect on the genome of living cells that, upon the duplication of affected cells, can be expressed as a mutagenic, clastogenic, or carcinogenic event because of specific alteration of the molecular structure of the genome.
Half-life—A measure of rate for the time required to eliminate one half of a quantity of a chemical from the body or environmental media.
Immediately Dangerous to Life or Health (IDLH)—The maximum environmental concentration of a contaminant from which one could escape within 30 minutes without any escape-impairing symptoms or irreversible health effects.
Immunologic Toxicity—The occurrence of adverse effects on the immune system that may result from exposure to environmental agents such as chemicals.
257 ETHYLBENZENE
10. GLOSSARY
Immunological Effects—Functional changes in the immune response.
Incidence—The ratio of individuals in a population who develop a specified condition to the total number of individuals in that population who could have developed that condition in a specified time period.
Intermediate Exposure—Exposure to a chemical for a duration of 15–364 days, as specified in the Toxicological Profiles.
In Vitro—Isolated from the living organism and artificially maintained, as in a test tube.
In Vivo—Occurring within the living organism.
Lethal Concentration(LO) (LCLO)—The lowest concentration of a chemical in air that has been reported to have caused death in humans or animals.
Lethal Concentration(50) (LC50)—A calculated concentration of a chemical in air to which exposure for a specific length of time is expected to cause death in 50% of a defined experimental animal population.
Lethal Dose(LO) (LDLO)—The lowest dose of a chemical introduced by a route other than inhalation that has been reported to have caused death in humans or animals.
Lethal Dose(50) (LD50)—The dose of a chemical that has been calculated to cause death in 50% of a defined experimental animal population.
Lethal Time(50) (LT50)—A calculated period of time within which a specific concentration of a chemical is expected to cause death in 50% of a defined experimental animal population.
Lowest-Observed-Adverse-Effect Level (LOAEL)—The lowest exposure level of chemical in a study, or group of studies, that produces statistically or biologically significant increases in frequency or severity of adverse effects between the exposed population and its appropriate control.
Lymphoreticular Effects—Represent morphological effects involving lymphatic tissues such as the lymph nodes, spleen, and thymus.
Malformations—Permanent structural changes that may adversely affect survival, development, or function.
Minimal Risk Level (MRL)—An estimate of daily human exposure to a hazardous substance that is likely to be without an appreciable risk of adverse noncancer health effects over a specified route and duration of exposure.
Modifying Factor (MF)—A value (greater than zero) that is applied to the derivation of a Minimal Risk Level (MRL) to reflect additional concerns about the database that are not covered by the uncertainty factors. The default value for a MF is 1.
Morbidity—State of being diseased; morbidity rate is the incidence or prevalence of disease in a specific population.
Mortality—Death; mortality rate is a measure of the number of deaths in a population during a specified interval of time.
258 ETHYLBENZENE
10. GLOSSARY
Mutagen—A substance that causes mutations. A mutation is a change in the DNA sequence of a cell’s DNA. Mutations can lead to birth defects, miscarriages, or cancer.
Necropsy—The gross examination of the organs and tissues of a dead body to determine the cause of death or pathological conditions.
Neurotoxicity—The occurrence of adverse effects on the nervous system following exposure to a chemical.
No-Observed-Adverse-Effect Level (NOAEL)—The dose of a chemical at which there were no statistically or biologically significant increases in frequency or severity of adverse effects seen between the exposed population and its appropriate control. Effects may be produced at this dose, but they are not considered to be adverse.
Octanol-Water Partition Coefficient (Kow)—The equilibrium ratio of the concentrations of a chemical in n-octanol and water, in dilute solution.
Odds Ratio (OR)—A means of measuring the association between an exposure (such as toxic substances and a disease or condition) that represents the best estimate of relative risk (risk as a ratio of the incidence among subjects exposed to a particular risk factor divided by the incidence among subjects who were not exposed to the risk factor). An OR of greater than 1 is considered to indicate greater risk of disease in the exposed group compared to the unexposed group.
Organophosphate or Organophosphorus Compound—A phosphorus-containing organic compound and especially a pesticide that acts by inhibiting cholinesterase.
Permissible Exposure Limit (PEL)—An Occupational Safety and Health Administration (OSHA) allowable exposure level in workplace air averaged over an 8-hour shift of a 40-hour workweek.
Pesticide—General classification of chemicals specifically developed and produced for use in the control of agricultural and public health pests.
Pharmacokinetics—The dynamic behavior of a material in the body, used to predict the fate (disposition) of an exogenous substance in an organism. Utilizing computational techniques, it provides the means of studying the absorption, distribution, metabolism, and excretion of chemicals by the body.
Pharmacokinetic Model—A set of equations that can be used to describe the time course of a parent chemical or metabolite in an animal system. There are two types of pharmacokinetic models: data-based and physiologically-based. A data-based model divides the animal system into a series of compartments, which, in general, do not represent real, identifiable anatomic regions of the body, whereas the physiologically-based model compartments represent real anatomic regions of the body.
Physiologically Based Pharmacodynamic (PBPD) Model—A type of physiologically based dose-response model that quantitatively describes the relationship between target tissue dose and toxic end points. These models advance the importance of physiologically based models in that they clearly describe the biological effect (response) produced by the system following exposure to an exogenous substance.
259 ETHYLBENZENE
10. GLOSSARY
Physiologically Based Pharmacokinetic (PBPK) Model—Comprised of a series of compartments representing organs or tissue groups with realistic weights and blood flows. These models require a variety of physiological information: tissue volumes, blood flow rates to tissues, cardiac output, alveolar ventilation rates, and possibly membrane permeabilities. The models also utilize biochemical information, such as air/blood partition coefficients, and metabolic parameters. PBPK models are also called biologically based tissue dosimetry models.
Prevalence—The number of cases of a disease or condition in a population at one point in time.
Prospective Study—A type of cohort study in which the pertinent observations are made on events occurring after the start of the study. A group is followed over time.
q1*—The upper-bound estimate of the low-dose slope of the dose-response curve as determined by the multistage procedure. The q1* can be used to calculate an estimate of carcinogenic potency, the incremental excess cancer risk per unit of exposure (usually μg/L for water, mg/kg/day for food, and μg/m3 for air).
Recommended Exposure Limit (REL)—A National Institute for Occupational Safety and Health (NIOSH) time-weighted average (TWA) concentration for up to a 10-hour workday during a 40-hour workweek.
Reference Concentration (RfC)—An estimate (with uncertainty spanning perhaps an order of magnitude) of a continuous inhalation exposure to the human population (including sensitive subgroups) that is likely to be without an appreciable risk of deleterious noncancer health effects during a lifetime. The inhalation reference concentration is for continuous inhalation exposures and is appropriately expressed in units of mg/m3 or ppm.
Reference Dose (RfD)—An estimate (with uncertainty spanning perhaps an order of magnitude) of the daily exposure of the human population to a potential hazard that is likely to be without risk of deleterious effects during a lifetime. The RfD is operationally derived from the no-observed-adverse-effect level (NOAEL, from animal and human studies) by a consistent application of uncertainty factors that reflect various types of data used to estimate RfDs and an additional modifying factor, which is based on a professional judgment of the entire database on the chemical. The RfDs are not applicable to nonthreshold effects such as cancer.
Reportable Quantity (RQ)—The quantity of a hazardous substance that is considered reportable under the Comprehensive Environmental Response, Compensation, and Liability Act (CERCLA). Reportable quantities are (1) 1 pound or greater or (2) for selected substances, an amount established by regulation either under CERCLA or under Section 311 of the Clean Water Act. Quantities are measured over a 24-hour period.
Reproductive Toxicity—The occurrence of adverse effects on the reproductive system that may result from exposure to a chemical. The toxicity may be directed to the reproductive organs and/or the related endocrine system. The manifestation of such toxicity may be noted as alterations in sexual behavior, fertility, pregnancy outcomes, or modifications in other functions that are dependent on the integrity of this system.
Retrospective Study—A type of cohort study based on a group of persons known to have been exposed at some time in the past. Data are collected from routinely recorded events, up to the time the study is undertaken. Retrospective studies are limited to causal factors that can be ascertained from existing records and/or examining survivors of the cohort.
260 ETHYLBENZENE
10. GLOSSARY
Risk—The possibility or chance that some adverse effect will result from a given exposure to a chemical.
Risk Factor—An aspect of personal behavior or lifestyle, an environmental exposure, or an inborn or inherited characteristic that is associated with an increased occurrence of disease or other health-related event or condition.
Risk Ratio—The ratio of the risk among persons with specific risk factors compared to the risk among persons without risk factors. A risk ratio greater than 1 indicates greater risk of disease in the exposed group compared to the unexposed group.
Short-Term Exposure Limit (STEL)—The American Conference of Governmental Industrial Hygienists (ACGIH) maximum concentration to which workers can be exposed for up to 15 minutes continually. No more than four excursions are allowed per day, and there must be at least 60 minutes between exposure periods. The daily Threshold Limit Value-Time Weighted Average (TLV-TWA) may not be exceeded.
Standardized Mortality Ratio (SMR)—A ratio of the observed number of deaths and the expected number of deaths in a specific standard population.
Target Organ Toxicity—This term covers a broad range of adverse effects on target organs or physiological systems (e.g., renal, cardiovascular) extending from those arising through a single limited exposure to those assumed over a lifetime of exposure to a chemical.
Teratogen—A chemical that causes structural defects that affect the development of an organism.
Threshold Limit Value (TLV)—An American Conference of Governmental Industrial Hygienists (ACGIH) concentration of a substance to which most workers can be exposed without adverse effect. The TLV may be expressed as a Time Weighted Average (TWA), as a Short-Term Exposure Limit (STEL), or as a ceiling limit (CL).
Time-Weighted Average (TWA)—An allowable exposure concentration averaged over a normal 8-hour workday or 40-hour workweek.
Toxic Dose(50) (TD50)—A calculated dose of a chemical, introduced by a route other than inhalation, which is expected to cause a specific toxic effect in 50% of a defined experimental animal population.
Toxicokinetic—The absorption, distribution, and elimination of toxic compounds in the living organism.
Uncertainty Factor (UF)—A factor used in operationally deriving the Minimal Risk Level (MRL) or Reference Dose (RfD) or Reference Concentration (RfC) from experimental data. UFs are intended to account for (1) the variation in sensitivity among the members of the human population, (2) the uncertainty in extrapolating animal data to the case of human, (3) the uncertainty in extrapolating from data obtained in a study that is of less than lifetime exposure, and (4) the uncertainty in using lowest-observed-adverse-effect level (LOAEL) data rather than no-observed-adverse-effect level (NOAEL) data. A default for each individual UF is 10; if complete certainty in data exists, a value of 1 can be used; however, a reduced UF of 3 may be used on a case-by-case basis, 3 being the approximate logarithmic average of 10 and 1.
Xenobiotic—Any chemical that is foreign to the biological system.
A-1 ETHYLBENZENE
APPENDIX A. ATSDR MINIMAL RISK LEVELS AND WORKSHEETS
The Comprehensive Environmental Response, Compensation, and Liability Act (CERCLA) [42 U.S.C.
9601 et seq.], as amended by the Superfund Amendments and Reauthorization Act (SARA) [Pub. L. 99–
499], requires that the Agency for Toxic Substances and Disease Registry (ATSDR) develop jointly with
the U.S. Environmental Protection Agency (EPA), in order of priority, a list of hazardous substances most
commonly found at facilities on the CERCLA National Priorities List (NPL); prepare toxicological
profiles for each substance included on the priority list of hazardous substances; and assure the initiation
of a research program to fill identified data needs associated with the substances.
The toxicological profiles include an examination, summary, and interpretation of available toxicological
information and epidemiologic evaluations of a hazardous substance. During the development of
toxicological profiles, Minimal Risk Levels (MRLs) are derived when reliable and sufficient data exist to
identify the target organ(s) of effect or the most sensitive health effect(s) for a specific duration for a
given route of exposure. An MRL is an estimate of the daily human exposure to a hazardous substance
that is likely to be without appreciable risk of adverse noncancer health effects over a specified duration
of exposure. MRLs are based on noncancer health effects only and are not based on a consideration of
cancer effects. These substance-specific estimates, which are intended to serve as screening levels, are
used by ATSDR health assessors to identify contaminants and potential health effects that may be of
concern at hazardous waste sites. It is important to note that MRLs are not intended to define clean-up or
action levels.
MRLs are derived for hazardous substances using the no-observed-adverse-effect level/uncertainty factor
approach. They are below levels that might cause adverse health effects in the people most sensitive to
such chemical-induced effects. MRLs are derived for acute (1–14 days), intermediate (15–364 days), and
chronic (365 days and longer) durations and for the oral and inhalation routes of exposure. Currently,
MRLs for the dermal route of exposure are not derived because ATSDR has not yet identified a method
suitable for this route of exposure. MRLs are generally based on the most sensitive chemical-induced end
point considered to be of relevance to humans. Serious health effects (such as irreparable damage to the
liver or kidneys, or birth defects) are not used as a basis for establishing MRLs. Exposure to a level
above the MRL does not mean that adverse health effects will occur.
MRLs are intended only to serve as a screening tool to help public health professionals decide where to
look more closely. They may also be viewed as a mechanism to identify those hazardous waste sites that
A-2 ETHYLBENZENE
APPENDIX A
are not expected to cause adverse health effects. Most MRLs contain a degree of uncertainty because of
the lack of precise toxicological information on the people who might be most sensitive (e.g., infants,
elderly, nutritionally or immunologically compromised) to the effects of hazardous substances. ATSDR
uses a conservative (i.e., protective) approach to address this uncertainty consistent with the public health
principle of prevention. Although human data are preferred, MRLs often must be based on animal studies
because relevant human studies are lacking. In the absence of evidence to the contrary, ATSDR assumes
that humans are more sensitive to the effects of hazardous substance than animals and that certain persons
may be particularly sensitive. Thus, the resulting MRL may be as much as 100-fold below levels that
have been shown to be nontoxic in laboratory animals.
Proposed MRLs undergo a rigorous review process: Health Effects/MRL Workgroup reviews within the
Division of Toxicology and Environmental Medicine, expert panel peer reviews, and agency-wide MRL
Workgroup reviews, with participation from other federal agencies and comments from the public. They
are subject to change as new information becomes available concomitant with updating the toxicological
profiles. Thus, MRLs in the most recent toxicological profiles supersede previously published levels.
For additional information regarding MRLs, please contact the Division of Toxicology and
Environmental Medicine, Agency for Toxic Substances and Disease Registry, 1600 Clifton Road NE,
Mailstop F-62, Atlanta, Georgia 30333.
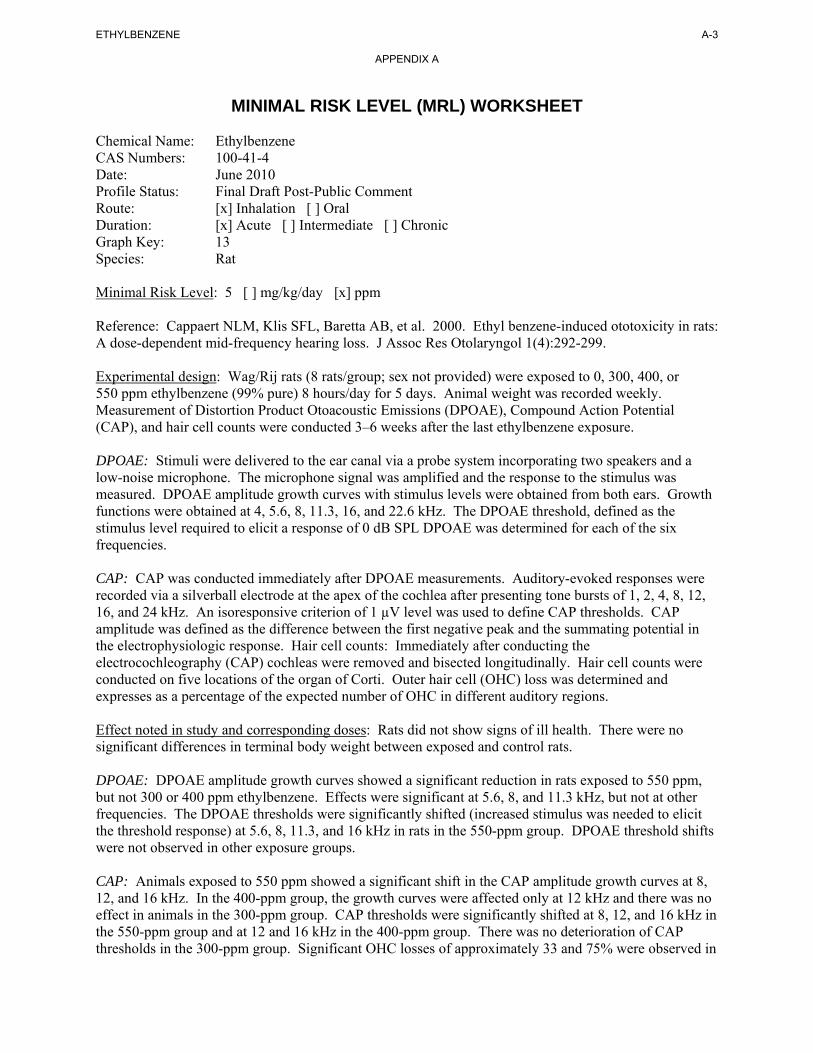
A-3 ETHYLBENZENE
APPENDIX A
MINIMAL RISK LEVEL (MRL) WORKSHEET
Chemical Name: Ethylbenzene CAS Numbers: 100-41-4 Date: June 2010 Profile Status: Final Draft Post-Public Comment Route: [x] Inhalation [ ] Oral Duration: [x] Acute [ ] Intermediate [ ] Chronic Graph Key: 13 Species: Rat
Minimal Risk Level: 5 [ ] mg/kg/day [x] ppm
Reference: Cappaert NLM, Klis SFL, Baretta AB, et al. 2000. Ethyl benzene-induced ototoxicity in rats: A dose-dependent mid-frequency hearing loss. J Assoc Res Otolaryngol 1(4):292-299.
Experimental design: Wag/Rij rats (8 rats/group; sex not provided) were exposed to 0, 300, 400, or 550 ppm ethylbenzene (99% pure) 8 hours/day for 5 days. Animal weight was recorded weekly. Measurement of Distortion Product Otoacoustic Emissions (DPOAE), Compound Action Potential (CAP), and hair cell counts were conducted 3–6 weeks after the last ethylbenzene exposure.
DPOAE: Stimuli were delivered to the ear canal via a probe system incorporating two speakers and a low-noise microphone. The microphone signal was amplified and the response to the stimulus was measured. DPOAE amplitude growth curves with stimulus levels were obtained from both ears. Growth functions were obtained at 4, 5.6, 8, 11.3, 16, and 22.6 kHz. The DPOAE threshold, defined as the stimulus level required to elicit a response of 0 dB SPL DPOAE was determined for each of the six frequencies.
CAP: CAP was conducted immediately after DPOAE measurements. Auditory-evoked responses were recorded via a silverball electrode at the apex of the cochlea after presenting tone bursts of 1, 2, 4, 8, 12, 16, and 24 kHz. An isoresponsive criterion of 1 µV level was used to define CAP thresholds. CAP amplitude was defined as the difference between the first negative peak and the summating potential in the electrophysiologic response. Hair cell counts: Immediately after conducting the electrocochleography (CAP) cochleas were removed and bisected longitudinally. Hair cell counts were conducted on five locations of the organ of Corti. Outer hair cell (OHC) loss was determined and expresses as a percentage of the expected number of OHC in different auditory regions.
Effect noted in study and corresponding doses: Rats did not show signs of ill health. There were no significant differences in terminal body weight between exposed and control rats.
DPOAE: DPOAE amplitude growth curves showed a significant reduction in rats exposed to 550 ppm, but not 300 or 400 ppm ethylbenzene. Effects were significant at 5.6, 8, and 11.3 kHz, but not at other frequencies. The DPOAE thresholds were significantly shifted (increased stimulus was needed to elicit the threshold response) at 5.6, 8, 11.3, and 16 kHz in rats in the 550-ppm group. DPOAE threshold shifts were not observed in other exposure groups.
CAP: Animals exposed to 550 ppm showed a significant shift in the CAP amplitude growth curves at 8, 12, and 16 kHz. In the 400-ppm group, the growth curves were affected only at 12 kHz and there was no effect in animals in the 300-ppm group. CAP thresholds were significantly shifted at 8, 12, and 16 kHz in the 550-ppm group and at 12 and 16 kHz in the 400-ppm group. There was no deterioration of CAP thresholds in the 300-ppm group. Significant OHC losses of approximately 33 and 75% were observed in
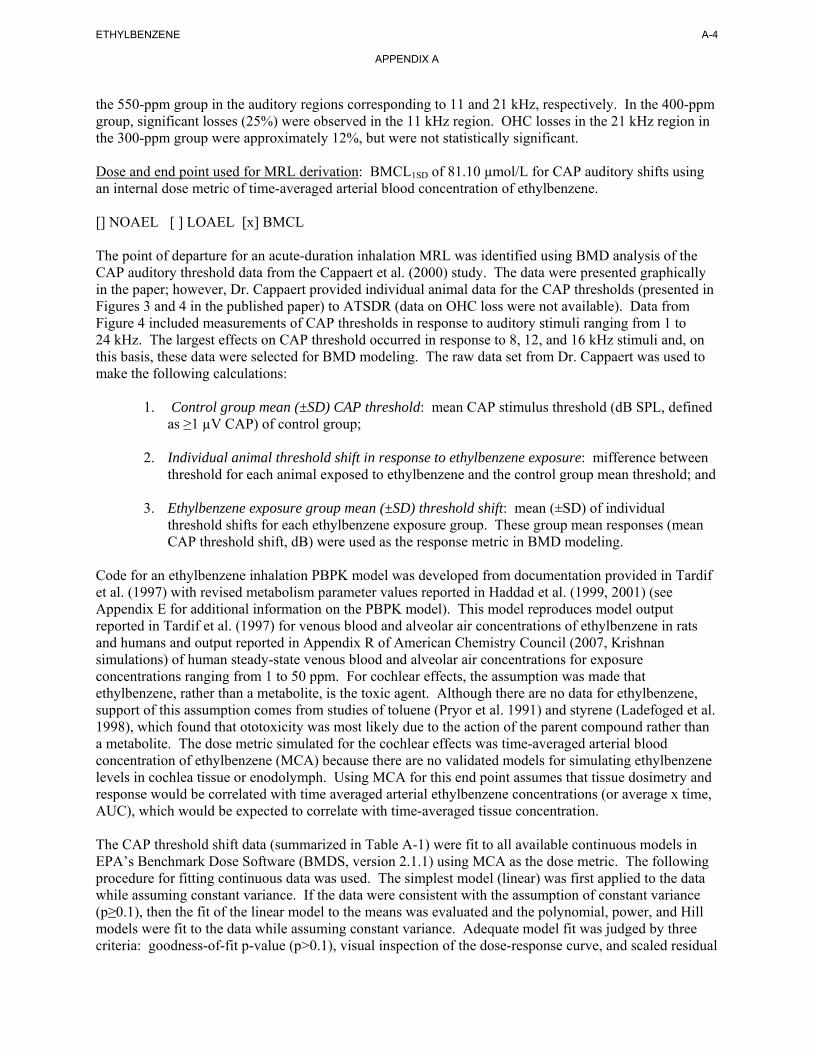
A-4 ETHYLBENZENE
APPENDIX A
the 550-ppm group in the auditory regions corresponding to 11 and 21 kHz, respectively. In the 400-ppm group, significant losses (25%) were observed in the 11 kHz region. OHC losses in the 21 kHz region in the 300-ppm group were approximately 12%, but were not statistically significant.
Dose and end point used for MRL derivation: BMCL1SD of 81.10 µmol/L for CAP auditory shifts using an internal dose metric of time-averaged arterial blood concentration of ethylbenzene.
[] NOAEL [ ] LOAEL [x] BMCL
The point of departure for an acute-duration inhalation MRL was identified using BMD analysis of the CAP auditory threshold data from the Cappaert et al. (2000) study. The data were presented graphically in the paper; however, Dr. Cappaert provided individual animal data for the CAP thresholds (presented in Figures 3 and 4 in the published paper) to ATSDR (data on OHC loss were not available). Data from Figure 4 included measurements of CAP thresholds in response to auditory stimuli ranging from 1 to 24 kHz. The largest effects on CAP threshold occurred in response to 8, 12, and 16 kHz stimuli and, on this basis, these data were selected for BMD modeling. The raw data set from Dr. Cappaert was used to make the following calculations:
1. Control group mean (±SD) CAP threshold: mean CAP stimulus threshold (dB SPL, defined as ≥1 µV CAP) of control group;
2. Individual animal threshold shift in response to ethylbenzene exposure: mifference between threshold for each animal exposed to ethylbenzene and the control group mean threshold; and
3. Ethylbenzene exposure group mean (±SD) threshold shift: mean (±SD) of individual threshold shifts for each ethylbenzene exposure group. These group mean responses (mean CAP threshold shift, dB) were used as the response metric in BMD modeling.
Code for an ethylbenzene inhalation PBPK model was developed from documentation provided in Tardif et al. (1997) with revised metabolism parameter values reported in Haddad et al. (1999, 2001) (see Appendix E for additional information on the PBPK model). This model reproduces model output reported in Tardif et al. (1997) for venous blood and alveolar air concentrations of ethylbenzene in rats and humans and output reported in Appendix R of American Chemistry Council (2007, Krishnan simulations) of human steady-state venous blood and alveolar air concentrations for exposure concentrations ranging from 1 to 50 ppm. For cochlear effects, the assumption was made that ethylbenzene, rather than a metabolite, is the toxic agent. Although there are no data for ethylbenzene, support of this assumption comes from studies of toluene (Pryor et al. 1991) and styrene (Ladefoged et al. 1998), which found that ototoxicity was most likely due to the action of the parent compound rather than a metabolite. The dose metric simulated for the cochlear effects was time-averaged arterial blood concentration of ethylbenzene (MCA) because there are no validated models for simulating ethylbenzene levels in cochlea tissue or enodolymph. Using MCA for this end point assumes that tissue dosimetry and response would be correlated with time averaged arterial ethylbenzene concentrations (or average x time, AUC), which would be expected to correlate with time-averaged tissue concentration.
The CAP threshold shift data (summarized in Table A-1) were fit to all available continuous models in EPA’s Benchmark Dose Software (BMDS, version 2.1.1) using MCA as the dose metric. The following procedure for fitting continuous data was used. The simplest model (linear) was first applied to the data while assuming constant variance. If the data were consistent with the assumption of constant variance (p≥0.1), then the fit of the linear model to the means was evaluated and the polynomial, power, and Hill models were fit to the data while assuming constant variance. Adequate model fit was judged by three criteria: goodness-of-fit p-value (p>0.1), visual inspection of the dose-response curve, and scaled residual
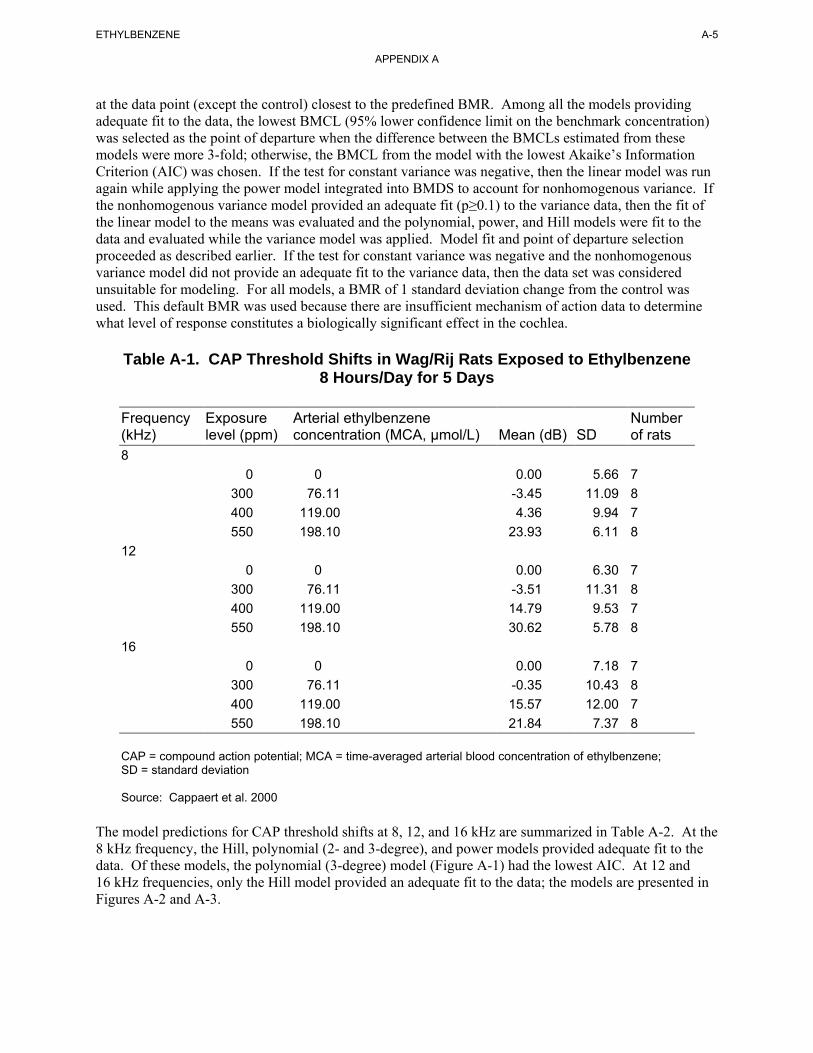
A-5 ETHYLBENZENE
APPENDIX A
at the data point (except the control) closest to the predefined BMR. Among all the models providing adequate fit to the data, the lowest BMCL (95% lower confidence limit on the benchmark concentration) was selected as the point of departure when the difference between the BMCLs estimated from these models were more 3-fold; otherwise, the BMCL from the model with the lowest Akaike’s Information Criterion (AIC) was chosen. If the test for constant variance was negative, then the linear model was run again while applying the power model integrated into BMDS to account for nonhomogenous variance. If the nonhomogenous variance model provided an adequate fit (p≥0.1) to the variance data, then the fit of the linear model to the means was evaluated and the polynomial, power, and Hill models were fit to the data and evaluated while the variance model was applied. Model fit and point of departure selection proceeded as described earlier. If the test for constant variance was negative and the nonhomogenous variance model did not provide an adequate fit to the variance data, then the data set was considered unsuitable for modeling. For all models, a BMR of 1 standard deviation change from the control was used. This default BMR was used because there are insufficient mechanism of action data to determine what level of response constitutes a biologically significant effect in the cochlea.
Table A-1. CAP Threshold Shifts in Wag/Rij Rats Exposed to Ethylbenzene 8 Hours/Day for 5 Days
Frequency Exposure Arterial ethylbenzene Number (kHz) level (ppm) concentration (MCA, µmol/L) Mean (dB) SD of rats 8
0 0 0.00 5.66 7 300 76.11 -3.45 11.09 8 400 119.00 4.36 9.94 7 550 198.10 23.93 6.11 8
12 0 0 0.00 6.30 7
300 76.11 -3.51 11.31 8 400 119.00 14.79 9.53 7 550 198.10 30.62 5.78 8
16 0 0 0.00 7.18 7
300 76.11 -0.35 10.43 8 400 119.00 15.57 12.00 7 550 198.10 21.84 7.37 8
CAP = compound action potential; MCA = time-averaged arterial blood concentration of ethylbenzene; SD = standard deviation
Source: Cappaert et al. 2000
The model predictions for CAP threshold shifts at 8, 12, and 16 kHz are summarized in Table A-2. At the 8 kHz frequency, the Hill, polynomial (2- and 3-degree), and power models provided adequate fit to the data. Of these models, the polynomial (3-degree) model (Figure A-1) had the lowest AIC. At 12 and 16 kHz frequencies, only the Hill model provided an adequate fit to the data; the models are presented in Figures A-2 and A-3.
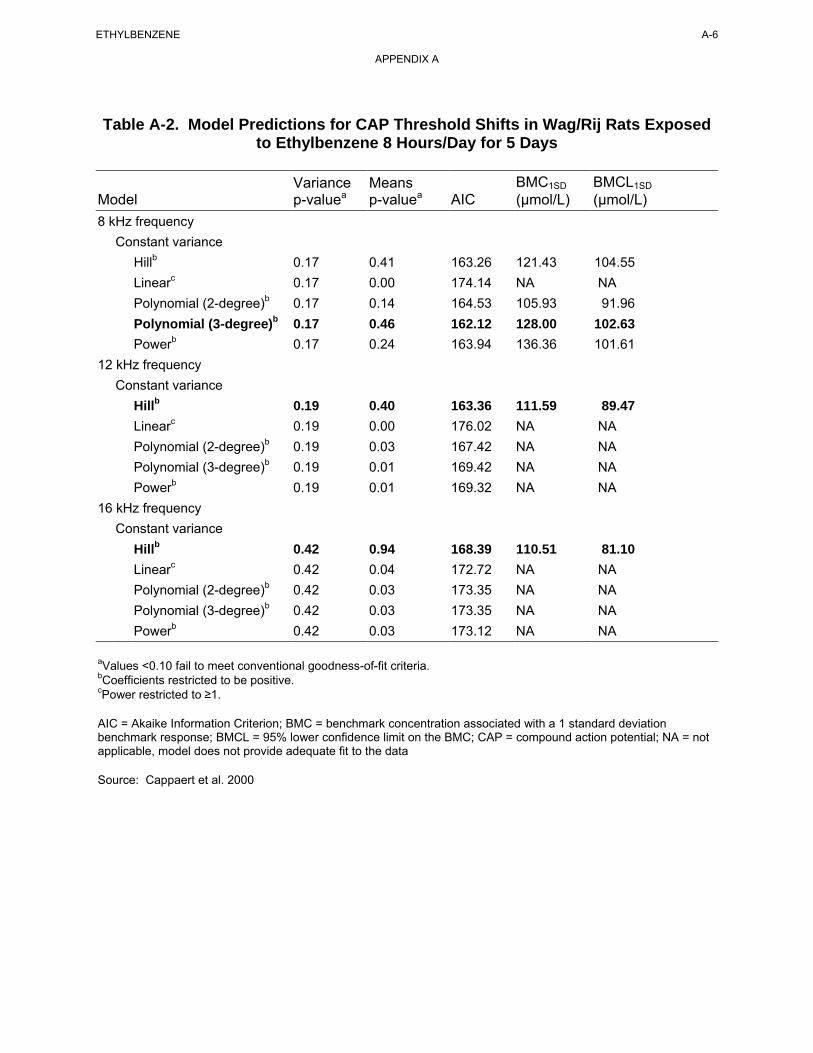
A-6 ETHYLBENZENE
APPENDIX A
Table A-2. Model Predictions for CAP Threshold Shifts in Wag/Rij Rats Exposed to Ethylbenzene 8 Hours/Day for 5 Days
Variance Means BMC1SD BMCL1SD Model p-valuea p-valuea AIC (µmol/L) (µmol/L) 8 kHz frequency
Constant variance Hillb 0.17 0.41 163.26 121.43 104.55 Linearc 0.17 0.00 174.14 NA NA Polynomial (2-degree)b 0.17 0.14 164.53 105.93 91.96 Polynomial (3-degree)b 0.17 0.46 162.12 128.00 102.63 Powerb 0.17 0.24 163.94 136.36 101.61
12 kHz frequency Constant variance
Hillb 0.19 0.40 163.36 111.59 89.47 Linearc 0.19 0.00 176.02 NA NA Polynomial (2-degree)b 0.19 0.03 167.42 NA NA Polynomial (3-degree)b 0.19 0.01 169.42 NA NA Powerb 0.19 0.01 169.32 NA NA
16 kHz frequency Constant variance
Hillb 0.42 0.94 168.39 110.51 81.10 Linearc 0.42 0.04 172.72 NA NA Polynomial (2-degree)b 0.42 0.03 173.35 NA NA Polynomial (3-degree)b 0.42 0.03 173.35 NA NA Powerb 0.42 0.03 173.12 NA NA
aValues <0.10 fail to meet conventional goodness-of-fit criteria.bCoefficients restricted to be positive. cPower restricted to ≥1.
AIC = Akaike Information Criterion; BMC = benchmark concentration associated with a 1 standard deviation benchmark response; BMCL = 95% lower confidence limit on the BMC; CAP = compound action potential; NA = not applicable, model does not provide adequate fit to the data
Source: Cappaert et al. 2000
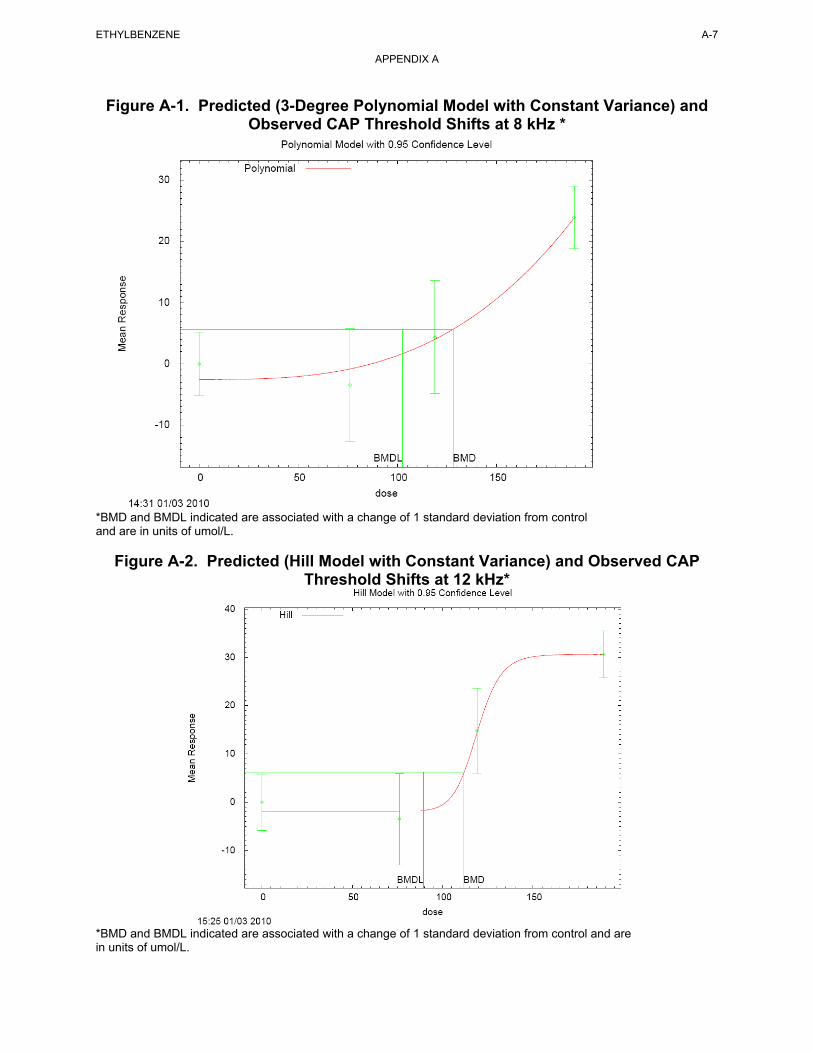
Figure A-1. Predicted (3-Degree Polynomial Model with Constant Variance) and Observed CAP Threshold Shifts at 8 kHz *
*BMD and BMDL indicated are associated with a change of 1 standard deviation from control and are in units of umol/L.
Figure A-2. Predicted (Hill Model with Constant Variance) and Observed CAP Threshold Shifts at 12 kHz*
*BMD and BMDL indicated are associated with a change of 1 standard deviation from control and are in units of umol/L.
A-7 ETHYLBENZENE
APPENDIX A
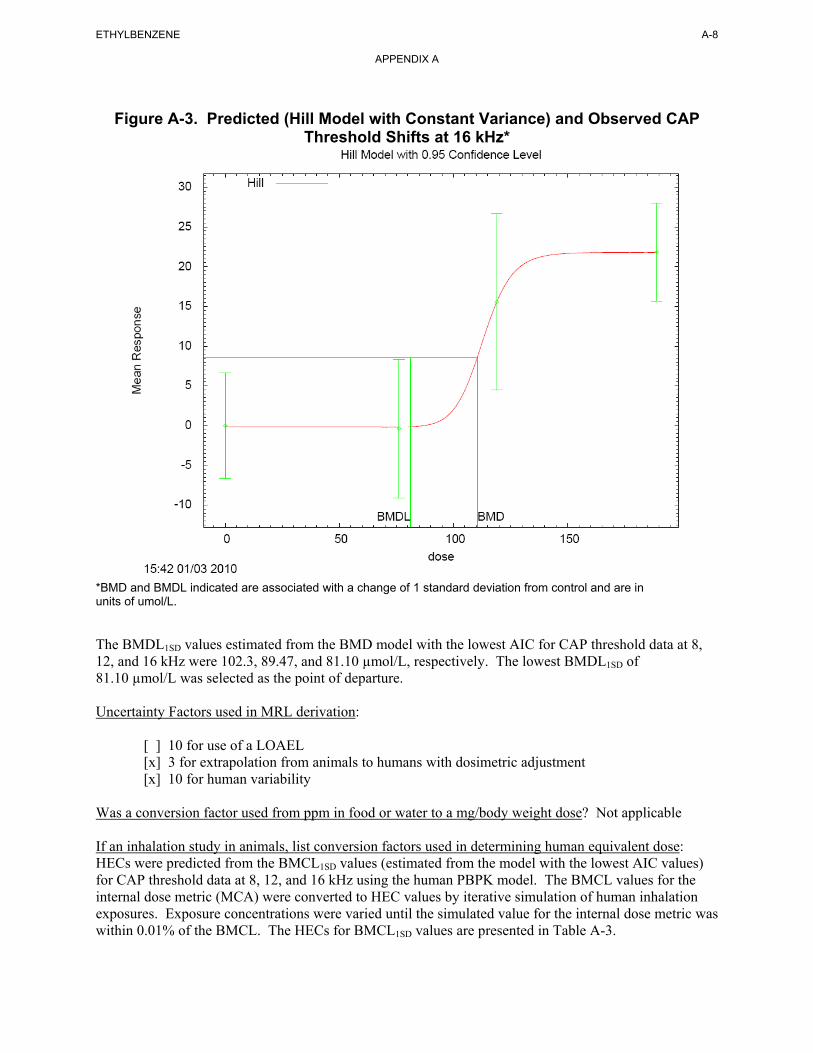
Figure A-3. Predicted (Hill Model with Constant Variance) and Observed CAP Threshold Shifts at 16 kHz*
*BMD and BMDL indicated are associated with a change of 1 standard deviation from control and are in units of umol/L.
A-8 ETHYLBENZENE
APPENDIX A
The BMDL1SD values estimated from the BMD model with the lowest AIC for CAP threshold data at 8, 12, and 16 kHz were 102.3, 89.47, and 81.10 µmol/L, respectively. The lowest BMDL1SD of 81.10 µmol/L was selected as the point of departure.
Uncertainty Factors used in MRL derivation:
[ ] 10 for use of a LOAEL [x] 3 for extrapolation from animals to humans with dosimetric adjustment [x] 10 for human variability
Was a conversion factor used from ppm in food or water to a mg/body weight dose? Not applicable
If an inhalation study in animals, list conversion factors used in determining human equivalent dose: HECs were predicted from the BMCL1SD values (estimated from the model with the lowest AIC values) for CAP threshold data at 8, 12, and 16 kHz using the human PBPK model. The BMCL values for the internal dose metric (MCA) were converted to HEC values by iterative simulation of human inhalation exposures. Exposure concentrations were varied until the simulated value for the internal dose metric was within 0.01% of the BMCL. The HECs for BMCL1SD values are presented in Table A-3.
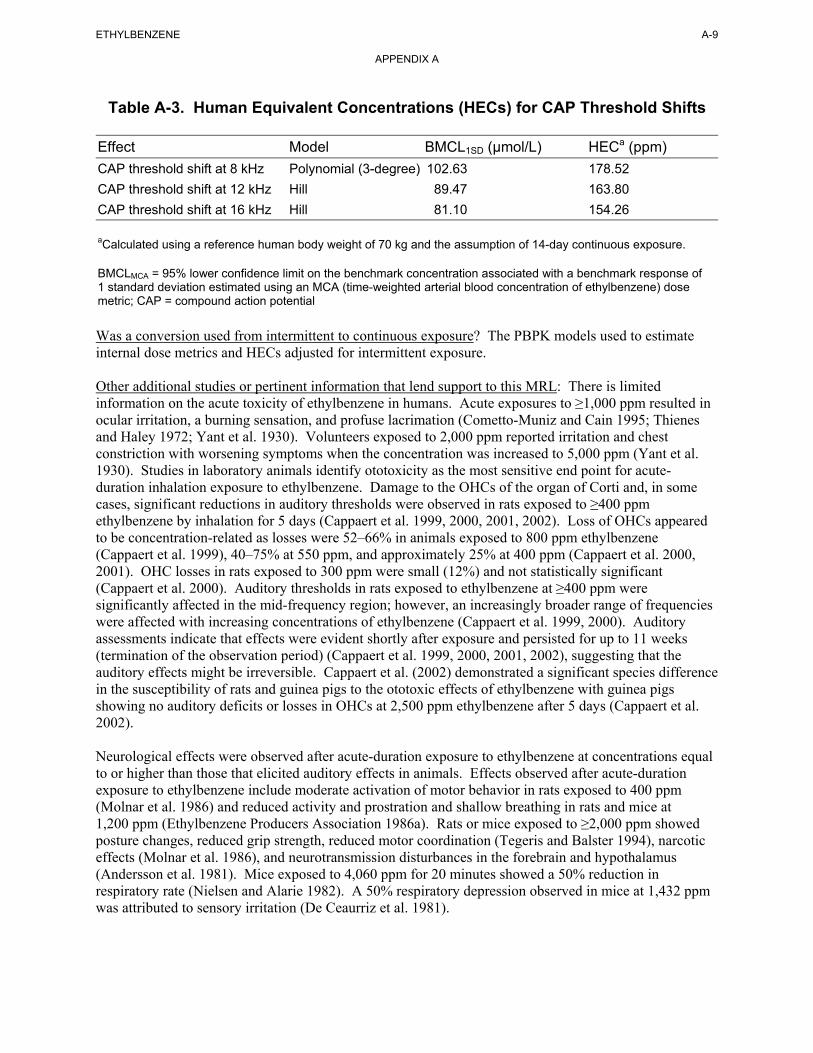
A-9 ETHYLBENZENE
APPENDIX A
Table A-3. Human Equivalent Concentrations (HECs) for CAP Threshold Shifts
Effect Model BMCL1SD (µmol/L) HECa (ppm)
CAP threshold shift at 8 kHz Polynomial (3-degree) 102.63 178.52
CAP threshold shift at 12 kHz Hill 89.47 163.80
CAP threshold shift at 16 kHz Hill 81.10 154.26
aCalculated using a reference human body weight of 70 kg and the assumption of 14-day continuous exposure.
BMCLMCA = 95% lower confidence limit on the benchmark concentration associated with a benchmark response of 1 standard deviation estimated using an MCA (time-weighted arterial blood concentration of ethylbenzene) dose metric; CAP = compound action potential
Was a conversion used from intermittent to continuous exposure? The PBPK models used to estimate internal dose metrics and HECs adjusted for intermittent exposure.
Other additional studies or pertinent information that lend support to this MRL: There is limited information on the acute toxicity of ethylbenzene in humans. Acute exposures to ≥1,000 ppm resulted in ocular irritation, a burning sensation, and profuse lacrimation (Cometto-Muniz and Cain 1995; Thienes and Haley 1972; Yant et al. 1930). Volunteers exposed to 2,000 ppm reported irritation and chest constriction with worsening symptoms when the concentration was increased to 5,000 ppm (Yant et al. 1930). Studies in laboratory animals identify ototoxicity as the most sensitive end point for acute-duration inhalation exposure to ethylbenzene. Damage to the OHCs of the organ of Corti and, in some cases, significant reductions in auditory thresholds were observed in rats exposed to ≥400 ppm ethylbenzene by inhalation for 5 days (Cappaert et al. 1999, 2000, 2001, 2002). Loss of OHCs appeared to be concentration-related as losses were 52–66% in animals exposed to 800 ppm ethylbenzene (Cappaert et al. 1999), 40–75% at 550 ppm, and approximately 25% at 400 ppm (Cappaert et al. 2000, 2001). OHC losses in rats exposed to 300 ppm were small (12%) and not statistically significant (Cappaert et al. 2000). Auditory thresholds in rats exposed to ethylbenzene at ≥400 ppm were significantly affected in the mid-frequency region; however, an increasingly broader range of frequencies were affected with increasing concentrations of ethylbenzene (Cappaert et al. 1999, 2000). Auditory assessments indicate that effects were evident shortly after exposure and persisted for up to 11 weeks (termination of the observation period) (Cappaert et al. 1999, 2000, 2001, 2002), suggesting that the auditory effects might be irreversible. Cappaert et al. (2002) demonstrated a significant species difference in the susceptibility of rats and guinea pigs to the ototoxic effects of ethylbenzene with guinea pigs showing no auditory deficits or losses in OHCs at 2,500 ppm ethylbenzene after 5 days (Cappaert et al. 2002).
Neurological effects were observed after acute-duration exposure to ethylbenzene at concentrations equal to or higher than those that elicited auditory effects in animals. Effects observed after acute-duration exposure to ethylbenzene include moderate activation of motor behavior in rats exposed to 400 ppm (Molnar et al. 1986) and reduced activity and prostration and shallow breathing in rats and mice at 1,200 ppm (Ethylbenzene Producers Association 1986a). Rats or mice exposed to ≥2,000 ppm showed posture changes, reduced grip strength, reduced motor coordination (Tegeris and Balster 1994), narcotic effects (Molnar et al. 1986), and neurotransmission disturbances in the forebrain and hypothalamus (Andersson et al. 1981). Mice exposed to 4,060 ppm for 20 minutes showed a 50% reduction in respiratory rate (Nielsen and Alarie 1982). A 50% respiratory depression observed in mice at 1,432 ppm was attributed to sensory irritation (De Ceaurriz et al. 1981).
ETHYLBENZENE A-10
APPENDIX A
Increased liver weight was reported after acute-duration exposure in rats exposed to ≥400 ppm ethylbenzene (Ethylbenzene Producers Association 1986a; Toftgard and Nilsen 1982), but not in mice at 1,200 ppm or rabbits at 2,400 ppm (Ethylbenzene Producers Association 1986a). At these same levels and exposure durations, induction of microsomal enzymes and related ultrastructural changes (e.g., proliferation of the smooth endoplasmic reticulum) were observed. These effects occurred in the absence of histopathological changes to the liver. Therefore, the effects on the liver appear to be related to induction of microsomal enzymes in smooth endoplasmic reticulum. An increase in relative kidney weight was also observed in rats exposed to ≥1,200 ppm (Ethylbenzene Producers Association 1986a; Toftgard and Nilsen 1982), but not in mice at 1,200 ppm or rabbits at 2,400 ppm (Ethylbenzene Producers Association 1986a). However, increased kidney weights occurred in the absence of histological changes (Ethylbenzene Producers Association 1986a). No histopathological alterations were observed in the lungs of surviving rats, mice, or rabbits exposed to 1,200, 400, or 2,400 ppm ethylbenzene, respectively, for 4 days (Ethylbenzene Producers Association 1986a).
Agency Contacts (Chemical Managers): Jessilynn Taylor, Henry Abadin, Heraline Hicks
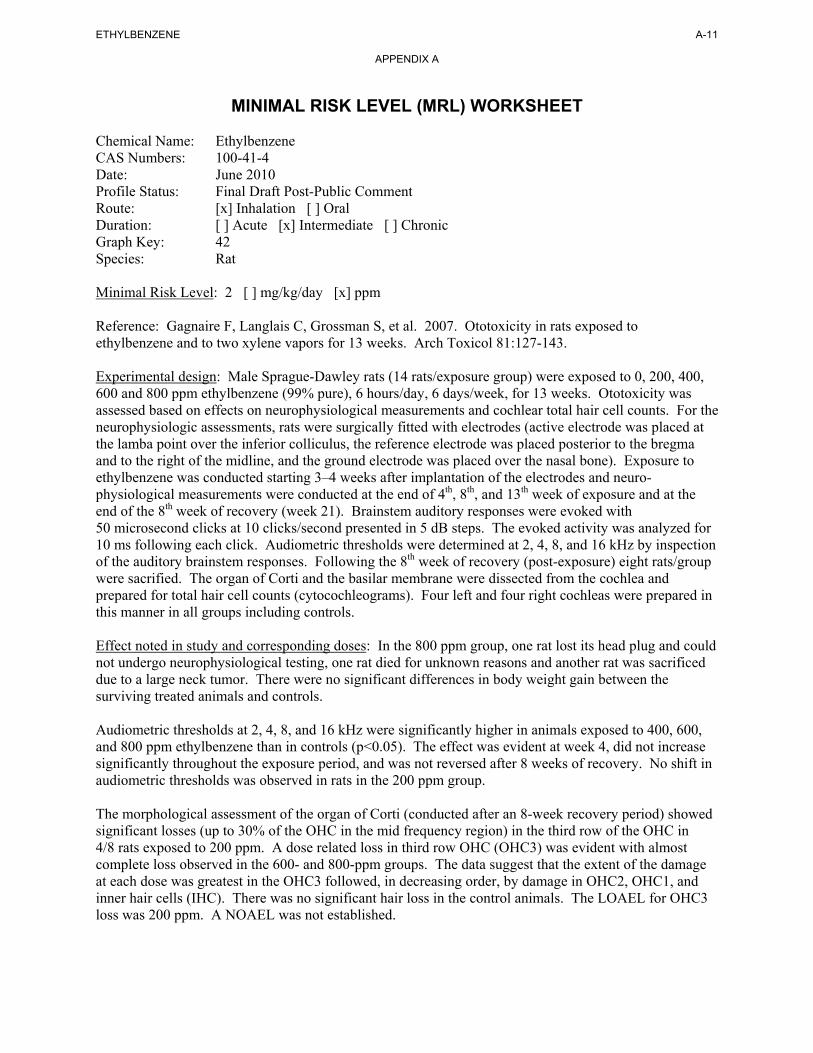
ETHYLBENZENE A-11
APPENDIX A
MINIMAL RISK LEVEL (MRL) WORKSHEET
Chemical Name: Ethylbenzene CAS Numbers: 100-41-4 Date: June 2010 Profile Status: Final Draft Post-Public Comment Route: [x] Inhalation [ ] Oral Duration: [ ] Acute [x] Intermediate [ ] Chronic Graph Key: 42 Species: Rat
Minimal Risk Level: 2 [ ] mg/kg/day [x] ppm
Reference: Gagnaire F, Langlais C, Grossman S, et al. 2007. Ototoxicity in rats exposed to ethylbenzene and to two xylene vapors for 13 weeks. Arch Toxicol 81:127-143.
Experimental design: Male Sprague-Dawley rats (14 rats/exposure group) were exposed to 0, 200, 400, 600 and 800 ppm ethylbenzene (99% pure), 6 hours/day, 6 days/week, for 13 weeks. Ototoxicity was assessed based on effects on neurophysiological measurements and cochlear total hair cell counts. For the neurophysiologic assessments, rats were surgically fitted with electrodes (active electrode was placed at the lamba point over the inferior colliculus, the reference electrode was placed posterior to the bregma and to the right of the midline, and the ground electrode was placed over the nasal bone). Exposure to ethylbenzene was conducted starting 3–4 weeks after implantation of the electrodes and neurophysiological measurements were conducted at the end of 4th, 8th, and 13th week of exposure and at the end of the 8th week of recovery (week 21). Brainstem auditory responses were evoked with 50 microsecond clicks at 10 clicks/second presented in 5 dB steps. The evoked activity was analyzed for 10 ms following each click. Audiometric thresholds were determined at 2, 4, 8, and 16 kHz by inspection of the auditory brainstem responses. Following the 8th week of recovery (post-exposure) eight rats/group were sacrified. The organ of Corti and the basilar membrane were dissected from the cochlea and prepared for total hair cell counts (cytocochleograms). Four left and four right cochleas were prepared in this manner in all groups including controls.
Effect noted in study and corresponding doses: In the 800 ppm group, one rat lost its head plug and could not undergo neurophysiological testing, one rat died for unknown reasons and another rat was sacrificed due to a large neck tumor. There were no significant differences in body weight gain between the surviving treated animals and controls.
Audiometric thresholds at 2, 4, 8, and 16 kHz were significantly higher in animals exposed to 400, 600, and 800 ppm ethylbenzene than in controls (p<0.05). The effect was evident at week 4, did not increase significantly throughout the exposure period, and was not reversed after 8 weeks of recovery. No shift in audiometric thresholds was observed in rats in the 200 ppm group.
The morphological assessment of the organ of Corti (conducted after an 8-week recovery period) showed significant losses (up to 30% of the OHC in the mid frequency region) in the third row of the OHC in 4/8 rats exposed to 200 ppm. A dose related loss in third row OHC (OHC3) was evident with almost complete loss observed in the 600- and 800-ppm groups. The data suggest that the extent of the damage at each dose was greatest in the OHC3 followed, in decreasing order, by damage in OHC2, OHC1, and inner hair cells (IHC). There was no significant hair loss in the control animals. The LOAEL for OHC3 loss was 200 ppm. A NOAEL was not established.
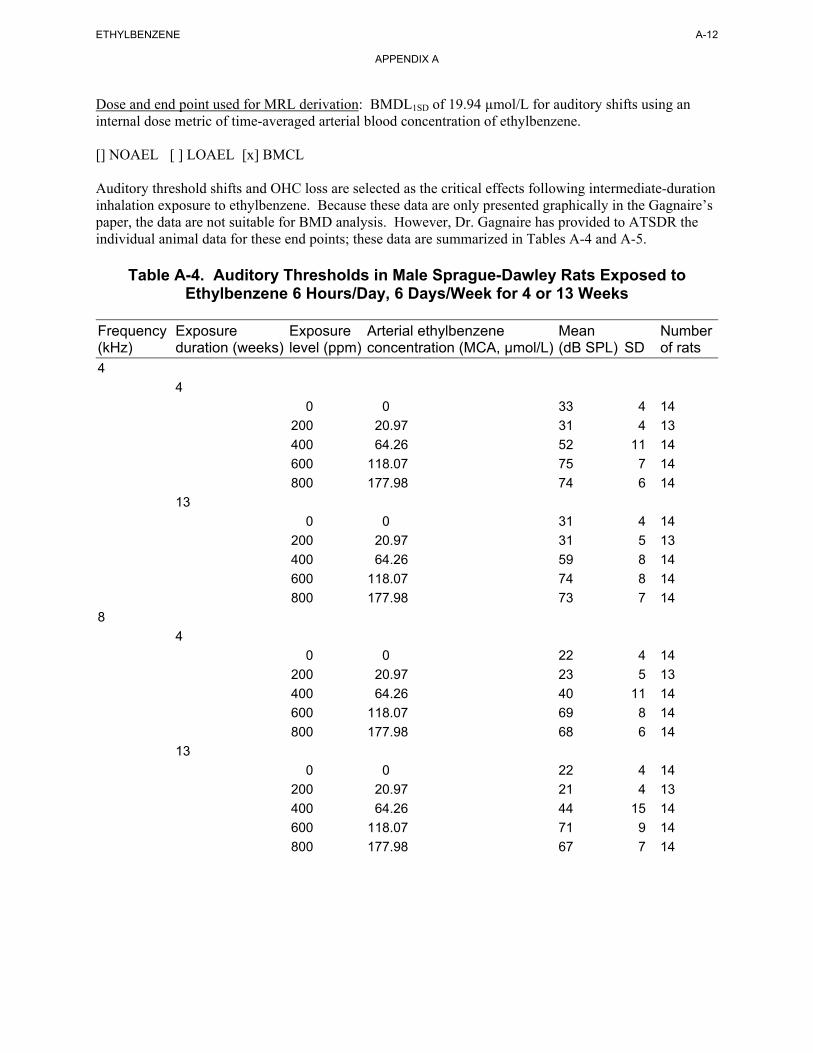
ETHYLBENZENE A-12
APPENDIX A
Dose and end point used for MRL derivation: BMDL1SD of 19.94 µmol/L for auditory shifts using an internal dose metric of time-averaged arterial blood concentration of ethylbenzene.
[] NOAEL [ ] LOAEL [x] BMCL
Auditory threshold shifts and OHC loss are selected as the critical effects following intermediate-duration inhalation exposure to ethylbenzene. Because these data are only presented graphically in the Gagnaire’s paper, the data are not suitable for BMD analysis. However, Dr. Gagnaire has provided to ATSDR the individual animal data for these end points; these data are summarized in Tables A-4 and A-5.
Table A-4. Auditory Thresholds in Male Sprague-Dawley Rats Exposed to Ethylbenzene 6 Hours/Day, 6 Days/Week for 4 or 13 Weeks
Frequency Exposure Exposure Arterial ethylbenzene Mean Number (kHz) duration (weeks) level (ppm) concentration (MCA, µmol/L) (dB SPL) SD of rats 4
4
0 0 33 4 14
200 20.97 31 4 13
400 64.26 52 11 14
600 118.07 75 7 14
800 177.98 74 6 14
13
0 0 31 4 14
200 20.97 31 5 13
400 64.26 59 8 14
600 118.07 74 8 14
800 177.98 73 7 14
8
4
0 0 22 4 14
200 20.97 23 5 13
400 64.26 40 11 14
600 118.07 69 8 14
800 177.98 68 6 14
13
0 0 22 4 14
200 20.97 21 4 13
400 64.26 44 15 14
600 118.07 71 9 14
800 177.98 67 7 14
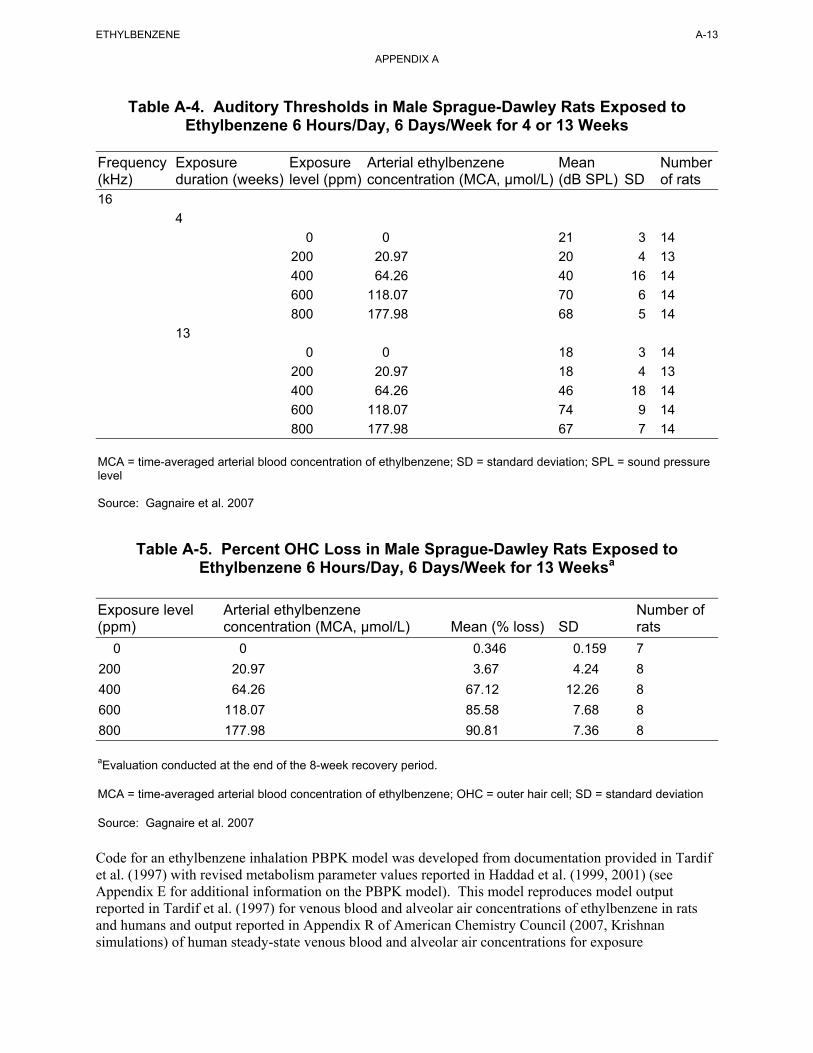
ETHYLBENZENE A-13
APPENDIX A
Table A-4. Auditory Thresholds in Male Sprague-Dawley Rats Exposed to Ethylbenzene 6 Hours/Day, 6 Days/Week for 4 or 13 Weeks
Frequency Exposure Exposure Arterial ethylbenzene Mean Number (kHz) duration (weeks) level (ppm) concentration (MCA, µmol/L) (dB SPL) SD of rats 16
4
0 0 21 3 14
200 20.97 20 4 13
400 64.26 40 16 14
600 118.07 70 6 14
800 177.98 68 5 14
13
0 0 18 3 14
200 20.97 18 4 13
400 64.26 46 18 14
600 118.07 74 9 14
800 177.98 67 7 14
MCA = time-averaged arterial blood concentration of ethylbenzene; SD = standard deviation; SPL = sound pressure level
Source: Gagnaire et al. 2007
Table A-5. Percent OHC Loss in Male Sprague-Dawley Rats Exposed to Ethylbenzene 6 Hours/Day, 6 Days/Week for 13 Weeksa
Exposure level Arterial ethylbenzene Number of (ppm) concentration (MCA, µmol/L) Mean (% loss) SD rats
0 0 0.346 0.159 7
200 20.97 3.67 4.24 8
400 64.26 67.12 12.26 8
600 118.07 85.58 7.68 8
800 177.98 90.81 7.36 8
aEvaluation conducted at the end of the 8-week recovery period.
MCA = time-averaged arterial blood concentration of ethylbenzene; OHC = outer hair cell; SD = standard deviation
Source: Gagnaire et al. 2007
Code for an ethylbenzene inhalation PBPK model was developed from documentation provided in Tardif et al. (1997) with revised metabolism parameter values reported in Haddad et al. (1999, 2001) (see Appendix E for additional information on the PBPK model). This model reproduces model output reported in Tardif et al. (1997) for venous blood and alveolar air concentrations of ethylbenzene in rats and humans and output reported in Appendix R of American Chemistry Council (2007, Krishnan simulations) of human steady-state venous blood and alveolar air concentrations for exposure
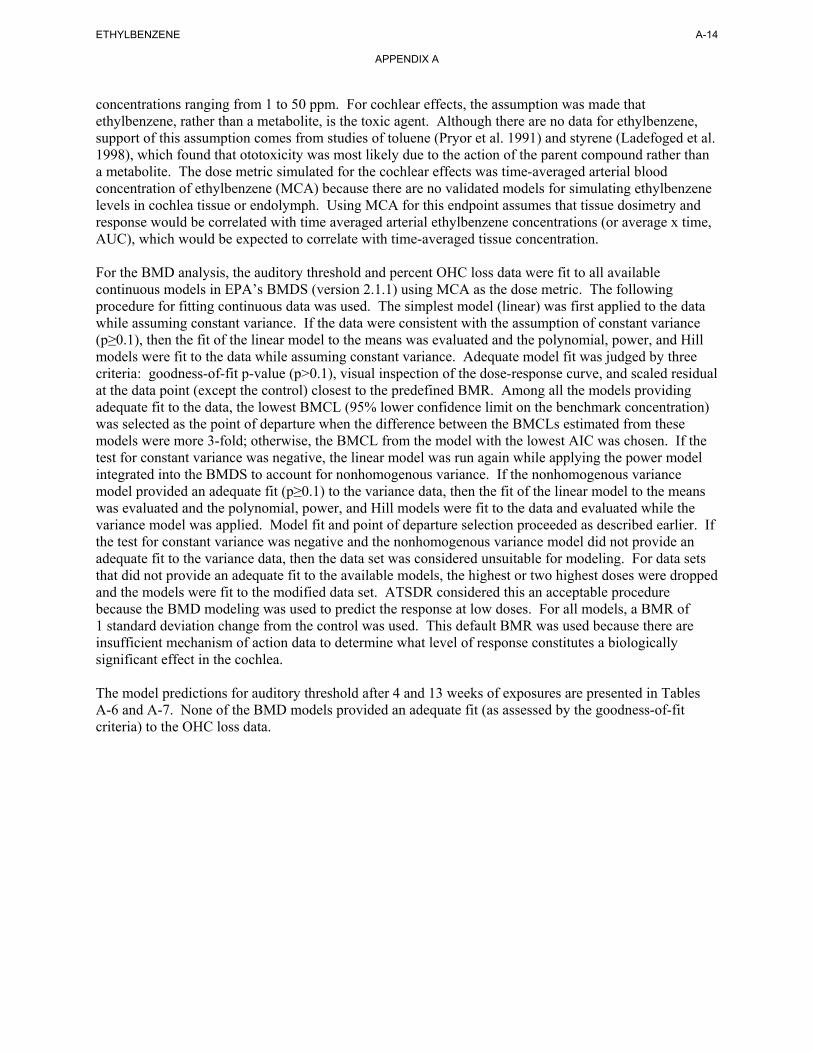
ETHYLBENZENE A-14
APPENDIX A
concentrations ranging from 1 to 50 ppm. For cochlear effects, the assumption was made that ethylbenzene, rather than a metabolite, is the toxic agent. Although there are no data for ethylbenzene, support of this assumption comes from studies of toluene (Pryor et al. 1991) and styrene (Ladefoged et al. 1998), which found that ototoxicity was most likely due to the action of the parent compound rather than a metabolite. The dose metric simulated for the cochlear effects was time-averaged arterial blood concentration of ethylbenzene (MCA) because there are no validated models for simulating ethylbenzene levels in cochlea tissue or endolymph. Using MCA for this endpoint assumes that tissue dosimetry and response would be correlated with time averaged arterial ethylbenzene concentrations (or average x time, AUC), which would be expected to correlate with time-averaged tissue concentration.
For the BMD analysis, the auditory threshold and percent OHC loss data were fit to all available continuous models in EPA’s BMDS (version 2.1.1) using MCA as the dose metric. The following procedure for fitting continuous data was used. The simplest model (linear) was first applied to the data while assuming constant variance. If the data were consistent with the assumption of constant variance (p≥0.1), then the fit of the linear model to the means was evaluated and the polynomial, power, and Hill models were fit to the data while assuming constant variance. Adequate model fit was judged by three criteria: goodness-of-fit p-value (p>0.1), visual inspection of the dose-response curve, and scaled residual at the data point (except the control) closest to the predefined BMR. Among all the models providing adequate fit to the data, the lowest BMCL (95% lower confidence limit on the benchmark concentration) was selected as the point of departure when the difference between the BMCLs estimated from these models were more 3-fold; otherwise, the BMCL from the model with the lowest AIC was chosen. If the test for constant variance was negative, the linear model was run again while applying the power model integrated into the BMDS to account for nonhomogenous variance. If the nonhomogenous variance model provided an adequate fit (p≥0.1) to the variance data, then the fit of the linear model to the means was evaluated and the polynomial, power, and Hill models were fit to the data and evaluated while the variance model was applied. Model fit and point of departure selection proceeded as described earlier. If the test for constant variance was negative and the nonhomogenous variance model did not provide an adequate fit to the variance data, then the data set was considered unsuitable for modeling. For data sets that did not provide an adequate fit to the available models, the highest or two highest doses were dropped and the models were fit to the modified data set. ATSDR considered this an acceptable procedure because the BMD modeling was used to predict the response at low doses. For all models, a BMR of 1 standard deviation change from the control was used. This default BMR was used because there are insufficient mechanism of action data to determine what level of response constitutes a biologically significant effect in the cochlea.
The model predictions for auditory threshold after 4 and 13 weeks of exposures are presented in Tables A-6 and A-7. None of the BMD models provided an adequate fit (as assessed by the goodness-of-fit criteria) to the OHC loss data.
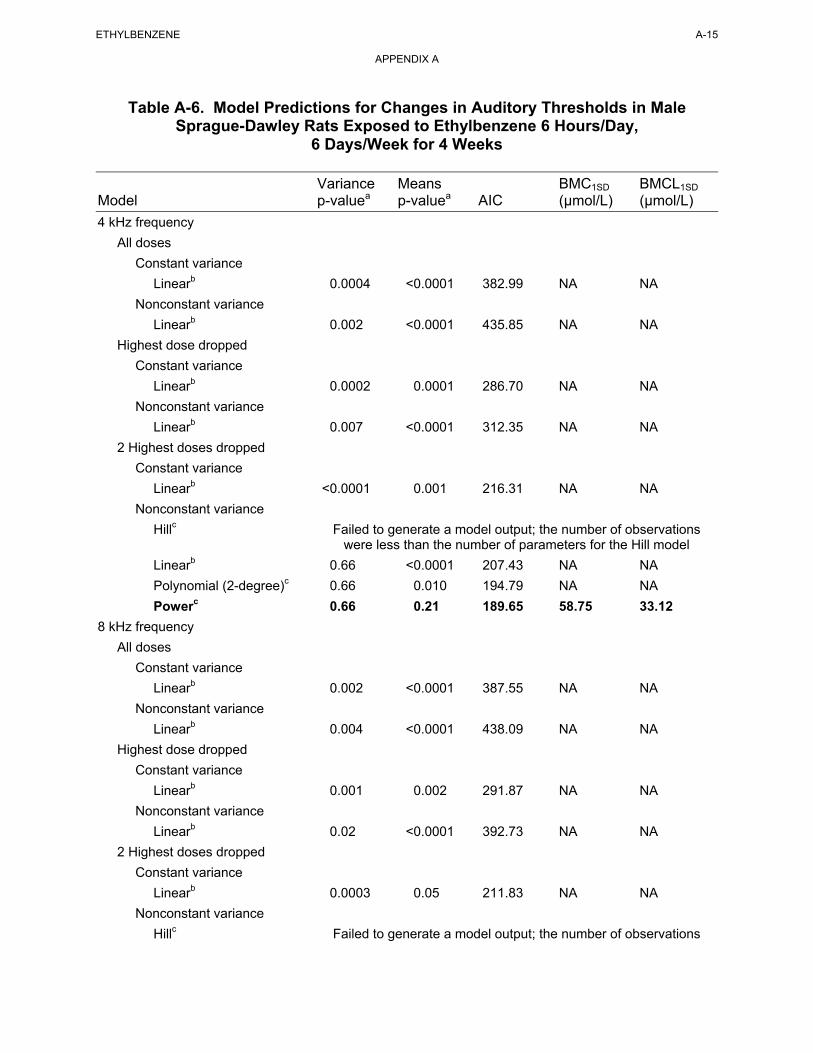
ETHYLBENZENE A-15
APPENDIX A
Table A-6. Model Predictions for Changes in Auditory Thresholds in Male Sprague-Dawley Rats Exposed to Ethylbenzene 6 Hours/Day,
6 Days/Week for 4 Weeks
Variance Means BMC1SD BMCL1SD
Model p-valuea p-valuea AIC (µmol/L) (µmol/L)
4 kHz frequency
All doses
Constant variance
Linearb 0.0004 <0.0001 382.99 NA NA
Nonconstant variance
Linearb 0.002 <0.0001 435.85 NA NA
Highest dose dropped
Constant variance
Linearb 0.0002 0.0001 286.70 NA NA
Nonconstant variance
Linearb 0.007 <0.0001 312.35 NA NA
2 Highest doses dropped
Constant variance
Linearb <0.0001 0.001 216.31 NA NA
Nonconstant variance
Hillc Failed to generate a model output; the number of observations were less than the number of parameters for the Hill model
Linearb 0.66 <0.0001 207.43 NA NA
Polynomial (2-degree)c 0.66 0.010 194.79 NA NA
Powerc 0.66 0.21 189.65 58.75 33.12
8 kHz frequency
All doses
Constant variance
Linearb 0.002 <0.0001 387.55 NA NA
Nonconstant variance
Linearb 0.004 <0.0001 438.09 NA NA
Highest dose dropped
Constant variance
Linearb 0.001 0.002 291.87 NA NA
Nonconstant variance
Linearb 0.02 <0.0001 392.73 NA NA
2 Highest doses dropped
Constant variance
Linearb 0.0003 0.05 211.83 NA NA
Nonconstant variance
Hillc Failed to generate a model output; the number of observations
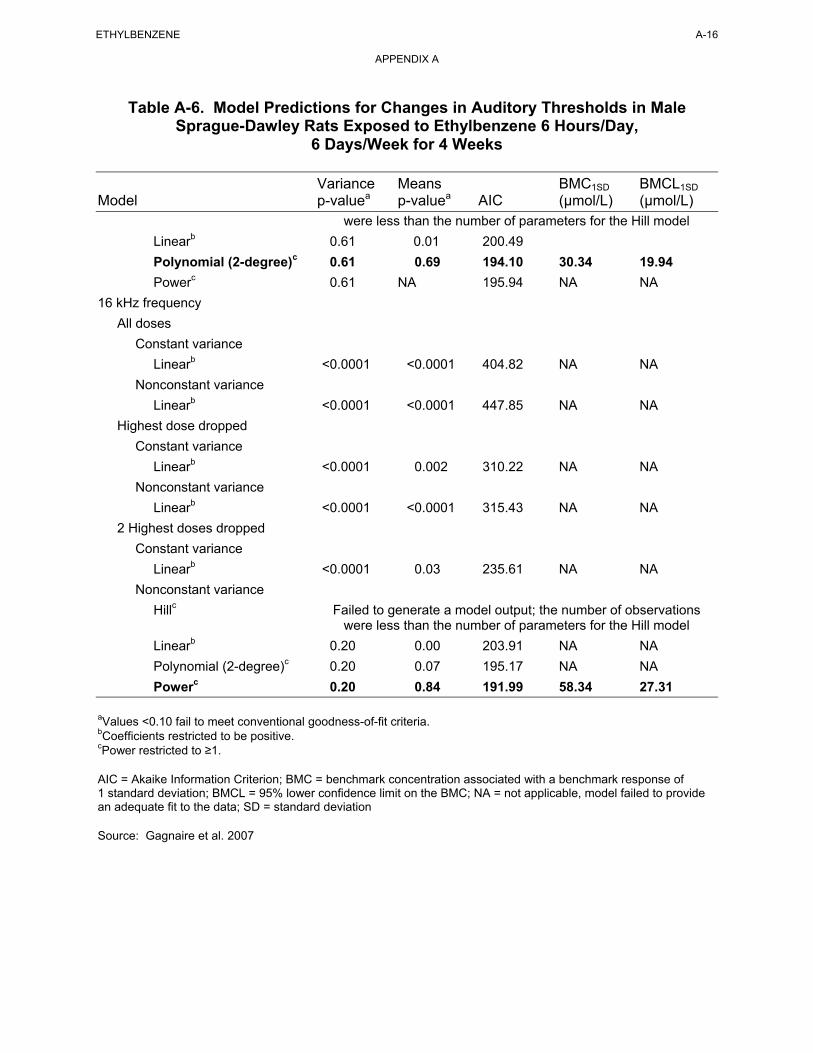
ETHYLBENZENE A-16
APPENDIX A
Table A-6. Model Predictions for Changes in Auditory Thresholds in Male Sprague-Dawley Rats Exposed to Ethylbenzene 6 Hours/Day,
6 Days/Week for 4 Weeks
Variance Means BMC1SD BMCL1SD
Model p-valuea p-valuea AIC (µmol/L) (µmol/L) were less than the number of parameters for the Hill model
Linearb 0.61 0.01 200.49
Polynomial (2-degree)c 0.61 0.69 194.10 30.34 19.94
Powerc 0.61 NA 195.94 NA NA
16 kHz frequency
All doses
Constant variance
Linearb <0.0001 <0.0001 404.82 NA NA
Nonconstant variance
Linearb <0.0001 <0.0001 447.85 NA NA
Highest dose dropped
Constant variance
Linearb <0.0001 0.002 310.22 NA NA
Nonconstant variance
Linearb <0.0001 <0.0001 315.43 NA NA
2 Highest doses dropped
Constant variance
Linearb <0.0001 0.03 235.61 NA NA
Nonconstant variance
Hillc Failed to generate a model output; the number of observations were less than the number of parameters for the Hill model
Linearb 0.20 0.00 203.91 NA NA
Polynomial (2-degree)c 0.20 0.07 195.17 NA NA
Powerc 0.20 0.84 191.99 58.34 27.31
aValues <0.10 fail to meet conventional goodness-of-fit criteria. bCoefficients restricted to be positive. cPower restricted to ≥1.
AIC = Akaike Information Criterion; BMC = benchmark concentration associated with a benchmark response of 1 standard deviation; BMCL = 95% lower confidence limit on the BMC; NA = not applicable, model failed to provide an adequate fit to the data; SD = standard deviation
Source: Gagnaire et al. 2007
ETHYLBENZENE A-17
APPENDIX A
Table A-7. Model Predictions for Changes in Auditory Thresholds in Male Sprague-Dawley Rats Exposed to Ethylbenzene 6 Hours/Day,
6 Days/Week for 13 Weeks
Variance Means BMC1SD BMCL1SD
Model p-valuea p-valuea AIC (µmol/L) (µmol/L)
4 kHz frequency
All doses
Constant variance
Linearb 0.05 <0.0001 385.41 NA NA
Nonconstant variance
Hillc 0.64 0.93 322.34 54.91 28.59
Linearb 0.64 <0.0001 437.05 NA NA
Polynomial (2-degree)c 0.64 0.0001 419.18 NA NA
Polynomial (3-degree)c 0.64 <0.0001 419.88 NA NA
Polynomial (4-degree)c 0.64 <0.0001 414.64 NA NA
Powerc 0.64 <0.0001 375.90 NA NA
8 kHz frequency
All doses
Constant variance
Linearb <0.0001 <0.0001 408.00 NA NA
Nonconstant variance
Linearb <0.0001 <0.0001 447.64 NA NA
Highest dose dropped
Constant variance
Linearb <0.0001 0.01 310.79 NA NA
Nonconstant variance
Linearb 0.001 <0.0001 402.37 NA NA
2 Highest doses dropped
Constant variance
Linearb <0.0001 0.01 233.73 NA NA
Nonconstant variance
Hillc Failed to generate a model output, the number of observations were less than the number of parameters for the Hill model
Linearb 0.78 <0.0001 213.91 NA NA
Polynomial (2-degree)c 0.78 0.03 201.59 NA NA
Powerc 0.78 0.54 197.02 58.29 29.71
16 kHz frequency
All doses
Constant variance
Linearb <0.0001 <0.0001 434.87 NA NA
Nonconstant variance
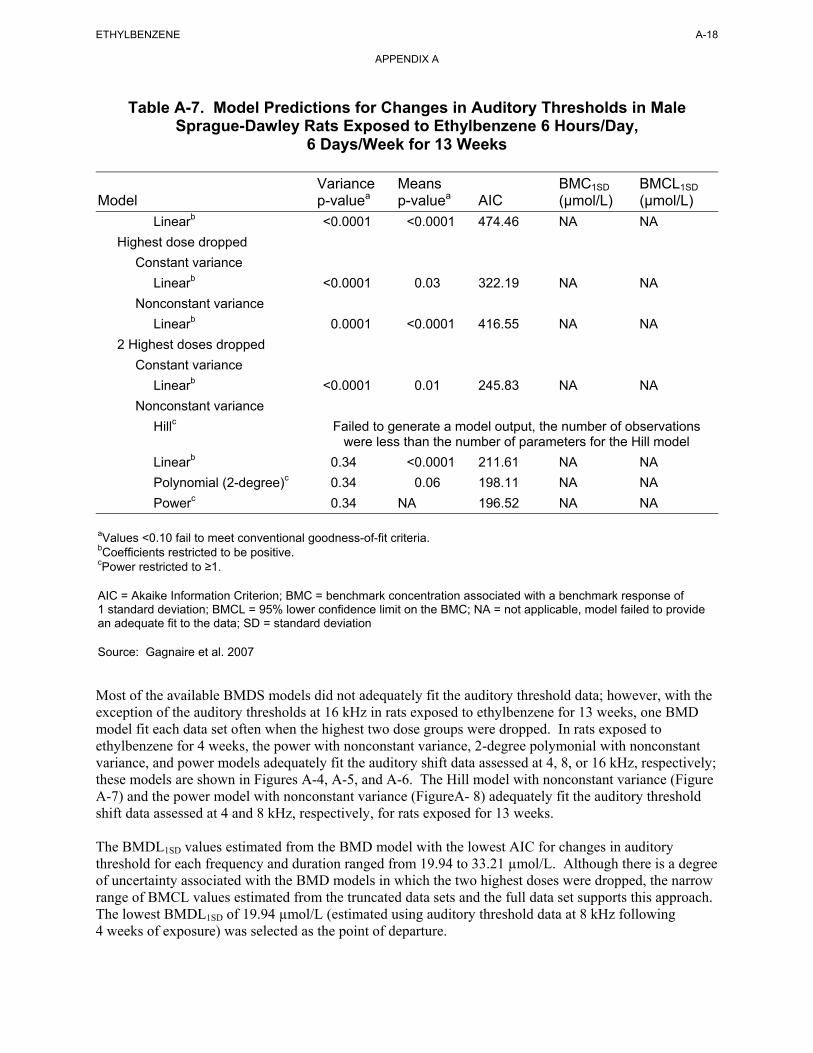
ETHYLBENZENE A-18
APPENDIX A
Table A-7. Model Predictions for Changes in Auditory Thresholds in Male Sprague-Dawley Rats Exposed to Ethylbenzene 6 Hours/Day,
6 Days/Week for 13 Weeks
Variance Means BMC1SD BMCL1SD
Model p-valuea p-valuea AIC (µmol/L) (µmol/L)
Linearb <0.0001 <0.0001 474.46 NA NA
Highest dose dropped
Constant variance
Linearb <0.0001 0.03 322.19 NA NA
Nonconstant variance
Linearb 0.0001 <0.0001 416.55 NA NA
2 Highest doses dropped
Constant variance
Linearb <0.0001 0.01 245.83 NA NA
Nonconstant variance
Hillc Failed to generate a model output, the number of observations were less than the number of parameters for the Hill model
Linearb 0.34 <0.0001 211.61 NA NA
Polynomial (2-degree)c 0.34 0.06 198.11 NA NA
Powerc 0.34 NA 196.52 NA NA
aValues <0.10 fail to meet conventional goodness-of-fit criteria. bCoefficients restricted to be positive. cPower restricted to ≥1.
AIC = Akaike Information Criterion; BMC = benchmark concentration associated with a benchmark response of 1 standard deviation; BMCL = 95% lower confidence limit on the BMC; NA = not applicable, model failed to provide an adequate fit to the data; SD = standard deviation
Source: Gagnaire et al. 2007
Most of the available BMDS models did not adequately fit the auditory threshold data; however, with the exception of the auditory thresholds at 16 kHz in rats exposed to ethylbenzene for 13 weeks, one BMD model fit each data set often when the highest two dose groups were dropped. In rats exposed to ethylbenzene for 4 weeks, the power with nonconstant variance, 2-degree polymonial with nonconstant variance, and power models adequately fit the auditory shift data assessed at 4, 8, or 16 kHz, respectively; these models are shown in Figures A-4, A-5, and A-6. The Hill model with nonconstant variance (Figure A-7) and the power model with nonconstant variance (FigureA- 8) adequately fit the auditory threshold shift data assessed at 4 and 8 kHz, respectively, for rats exposed for 13 weeks.
The BMDL1SD values estimated from the BMD model with the lowest AIC for changes in auditory threshold for each frequency and duration ranged from 19.94 to 33.21 µmol/L. Although there is a degree of uncertainty associated with the BMD models in which the two highest doses were dropped, the narrow range of BMCL values estimated from the truncated data sets and the full data set supports this approach. The lowest BMDL1SD of 19.94 µmol/L (estimated using auditory threshold data at 8 kHz following 4 weeks of exposure) was selected as the point of departure.
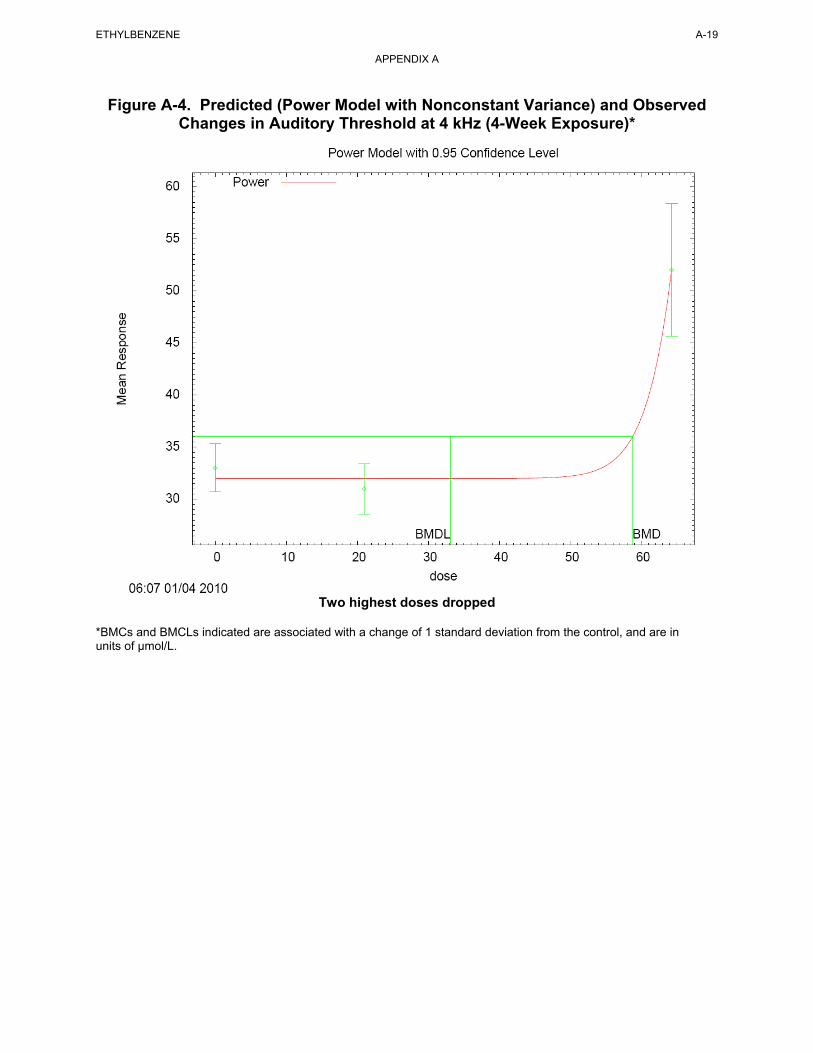
Figure A-4. Predicted (Power Model with Nonconstant Variance) and Observed Changes in Auditory Threshold at 4 kHz (4-Week Exposure)*
Two highest doses dropped
*BMCs and BMCLs indicated are associated with a change of 1 standard deviation from the control, and are in units of µmol/L.
ETHYLBENZENE A-19
APPENDIX A
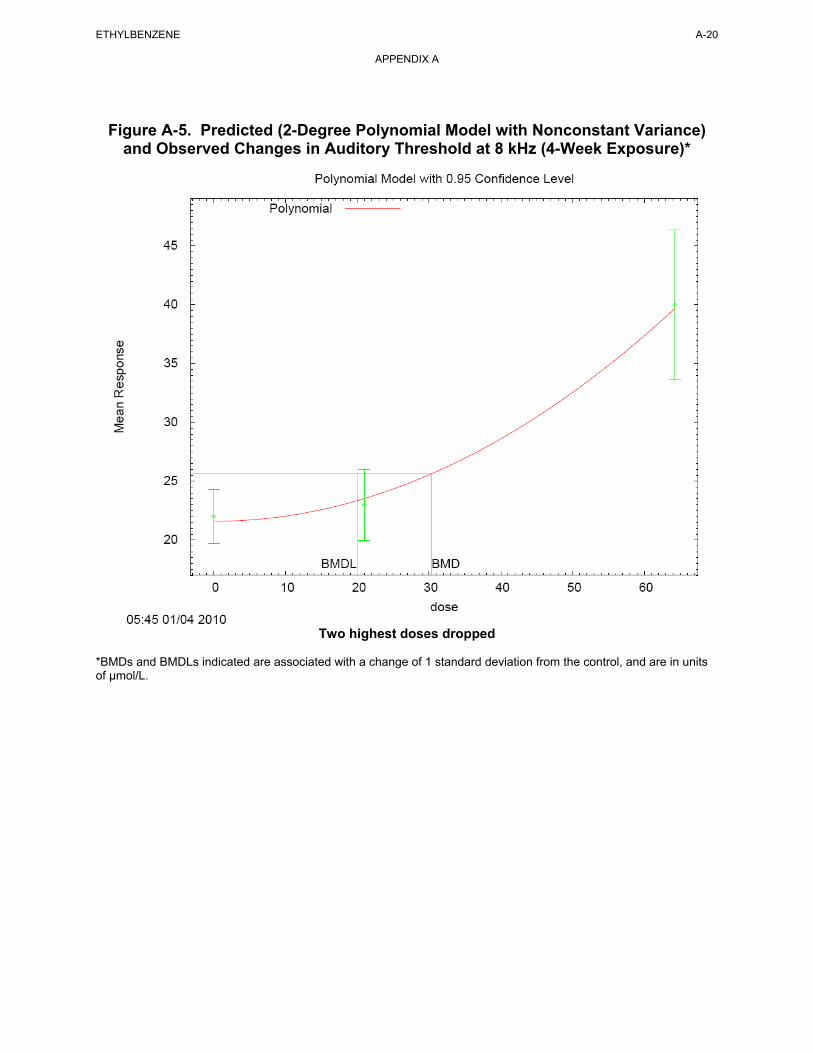
Figure A-5. Predicted (2-Degree Polynomial Model with Nonconstant Variance) and Observed Changes in Auditory Threshold at 8 kHz (4-Week Exposure)*
Two highest doses dropped
*BMDs and BMDLs indicated are associated with a change of 1 standard deviation from the control, and are in units of µmol/L.
ETHYLBENZENE A-20
APPENDIX A
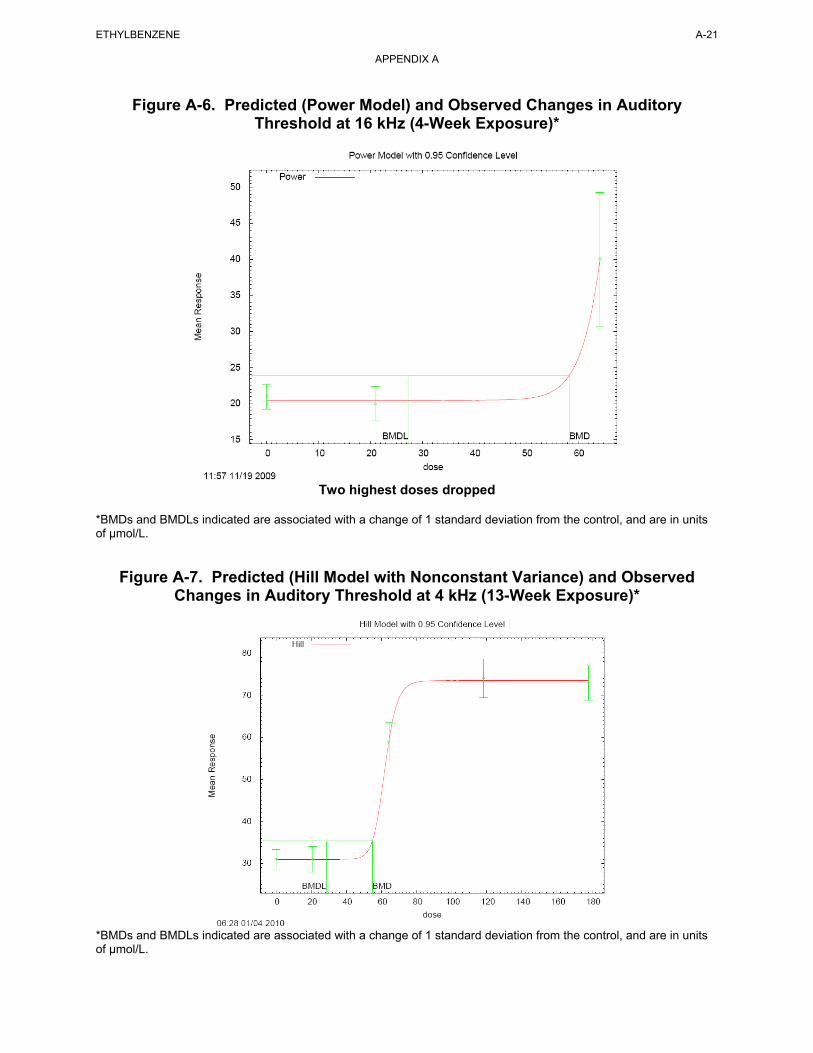
Figure A-6. Predicted (Power Model) and Observed Changes in Auditory Threshold at 16 kHz (4-Week Exposure)*
Two highest doses dropped
*BMDs and BMDLs indicated are associated with a change of 1 standard deviation from the control, and are in units of µmol/L.
Figure A-7. Predicted (Hill Model with Nonconstant Variance) and Observed Changes in Auditory Threshold at 4 kHz (13-Week Exposure)*
*BMDs and BMDLs indicated are associated with a change of 1 standard deviation from the control, and are in units of µmol/L.
ETHYLBENZENE A-21
APPENDIX A
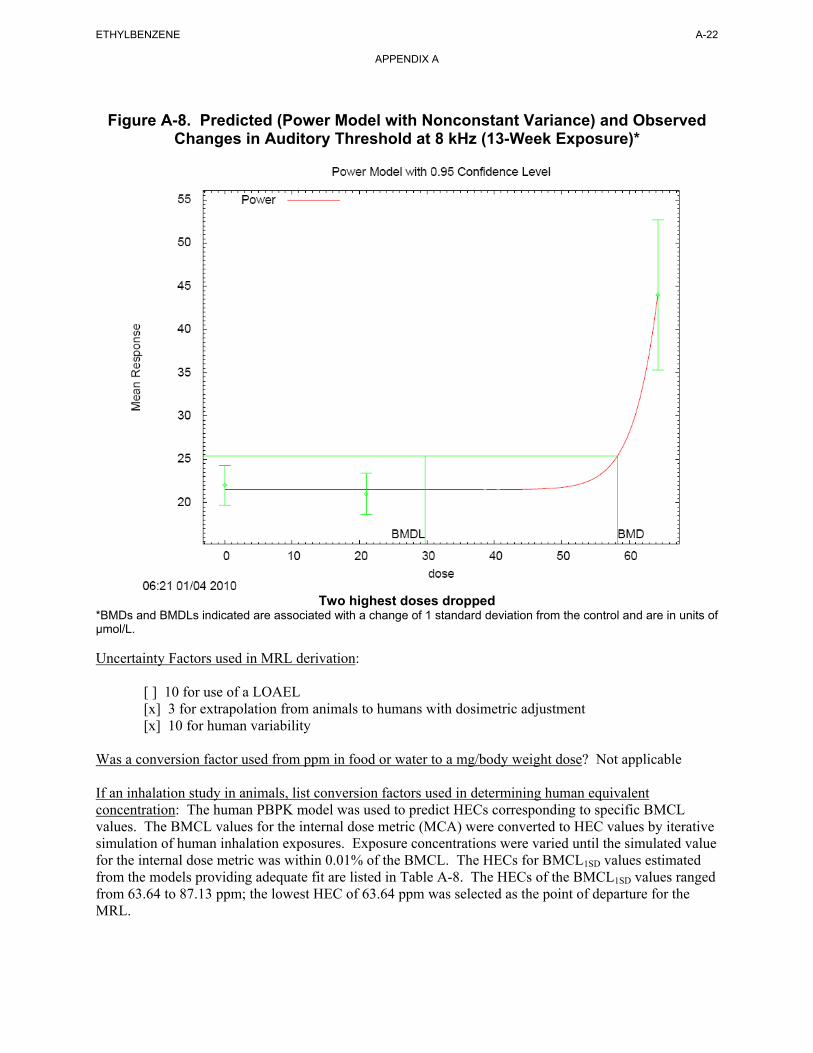
Figure A-8. Predicted (Power Model with Nonconstant Variance) and Observed
Changes in Auditory Threshold at 8 kHz (13-Week Exposure)*
Two highest doses dropped
*BMDs and BMDLs indicated are associated with a change of 1 standard deviation from the control and are in units of µmol/L.
ETHYLBENZENE A-22
APPENDIX A
Uncertainty Factors used in MRL derivation:
[ ] 10 for use of a LOAEL [x] 3 for extrapolation from animals to humans with dosimetric adjustment [x] 10 for human variability
Was a conversion factor used from ppm in food or water to a mg/body weight dose? Not applicable
If an inhalation study in animals, list conversion factors used in determining human equivalent concentration: The human PBPK model was used to predict HECs corresponding to specific BMCL values. The BMCL values for the internal dose metric (MCA) were converted to HEC values by iterative simulation of human inhalation exposures. Exposure concentrations were varied until the simulated value for the internal dose metric was within 0.01% of the BMCL. The HECs for BMCL1SD values estimated from the models providing adequate fit are listed in Table A-8. The HECs of the BMCL1SD values ranged from 63.64 to 87.13 ppm; the lowest HEC of 63.64 ppm was selected as the point of departure for the MRL.
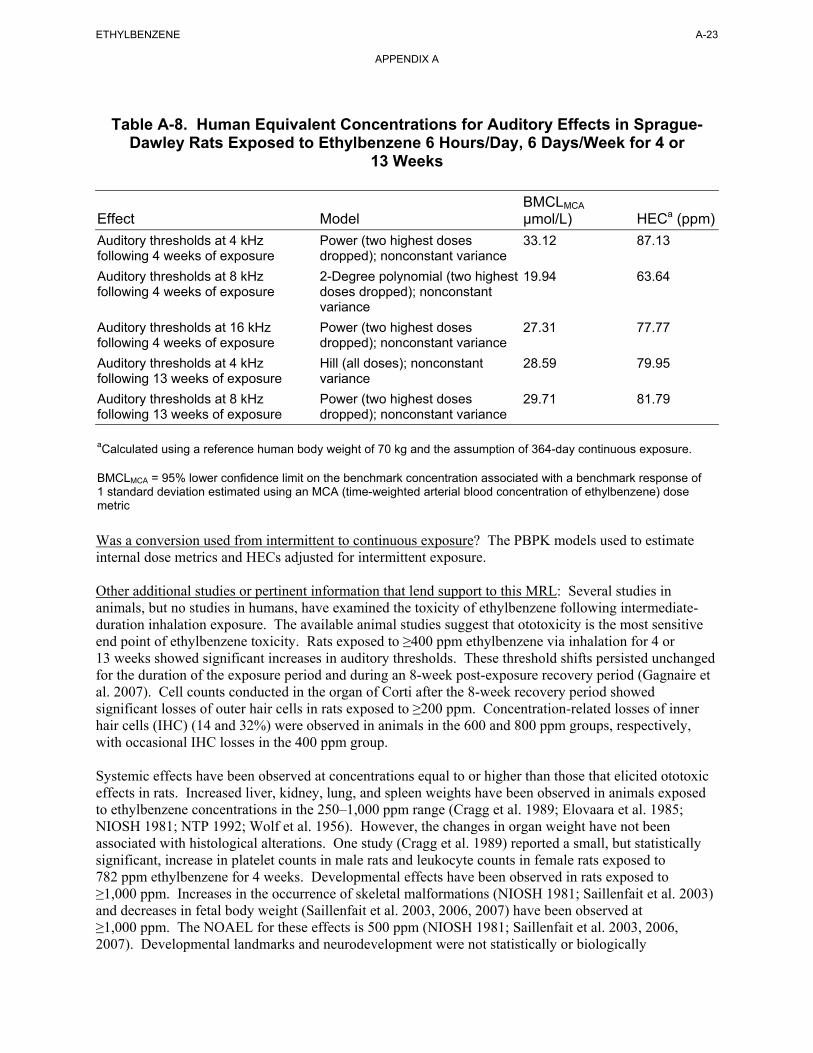
ETHYLBENZENE A-23
APPENDIX A
Table A-8. Human Equivalent Concentrations for Auditory Effects in Sprague-Dawley Rats Exposed to Ethylbenzene 6 Hours/Day, 6 Days/Week for 4 or
13 Weeks
BMCLMCA
Effect Model µmol/L) HECa (ppm)
Auditory thresholds at 4 kHz Power (two highest doses 33.12 87.13 following 4 weeks of exposure dropped); nonconstant variance
Auditory thresholds at 8 kHz 2-Degree polynomial (two highest 19.94 63.64 following 4 weeks of exposure doses dropped); nonconstant
variance
Auditory thresholds at 16 kHz Power (two highest doses 27.31 77.77 following 4 weeks of exposure dropped); nonconstant variance
Auditory thresholds at 4 kHz Hill (all doses); nonconstant 28.59 79.95 following 13 weeks of exposure variance
Auditory thresholds at 8 kHz Power (two highest doses 29.71 81.79 following 13 weeks of exposure dropped); nonconstant variance
aCalculated using a reference human body weight of 70 kg and the assumption of 364-day continuous exposure.
BMCLMCA = 95% lower confidence limit on the benchmark concentration associated with a benchmark response of 1 standard deviation estimated using an MCA (time-weighted arterial blood concentration of ethylbenzene) dose metric
Was a conversion used from intermittent to continuous exposure? The PBPK models used to estimate internal dose metrics and HECs adjusted for intermittent exposure.
Other additional studies or pertinent information that lend support to this MRL: Several studies in animals, but no studies in humans, have examined the toxicity of ethylbenzene following intermediate-duration inhalation exposure. The available animal studies suggest that ototoxicity is the most sensitive end point of ethylbenzene toxicity. Rats exposed to ≥400 ppm ethylbenzene via inhalation for 4 or 13 weeks showed significant increases in auditory thresholds. These threshold shifts persisted unchanged for the duration of the exposure period and during an 8-week post-exposure recovery period (Gagnaire et al. 2007). Cell counts conducted in the organ of Corti after the 8-week recovery period showed significant losses of outer hair cells in rats exposed to ≥200 ppm. Concentration-related losses of inner hair cells (IHC) (14 and 32%) were observed in animals in the 600 and 800 ppm groups, respectively, with occasional IHC losses in the 400 ppm group.
Systemic effects have been observed at concentrations equal to or higher than those that elicited ototoxic effects in rats. Increased liver, kidney, lung, and spleen weights have been observed in animals exposed to ethylbenzene concentrations in the 250–1,000 ppm range (Cragg et al. 1989; Elovaara et al. 1985; NIOSH 1981; NTP 1992; Wolf et al. 1956). However, the changes in organ weight have not been associated with histological alterations. One study (Cragg et al. 1989) reported a small, but statistically significant, increase in platelet counts in male rats and leukocyte counts in female rats exposed to 782 ppm ethylbenzene for 4 weeks. Developmental effects have been observed in rats exposed to ≥1,000 ppm. Increases in the occurrence of skeletal malformations (NIOSH 1981; Saillenfait et al. 2003) and decreases in fetal body weight (Saillenfait et al. 2003, 2006, 2007) have been observed at ≥1,000 ppm. The NOAEL for these effects is 500 ppm (NIOSH 1981; Saillenfait et al. 2003, 2006, 2007). Developmental landmarks and neurodevelopment were not statistically or biologically

ETHYLBENZENE A-24
APPENDIX A
significantly affected in the offspring of rats exposed to up to 500 ppm ethylbenzene in a two-generation reproductive toxicity study (Faber et al. 2006, 2007).
Agency Contacts (Chemical Managers): Jessilynn Taylor, Henry Abadin, Heraline Hicks
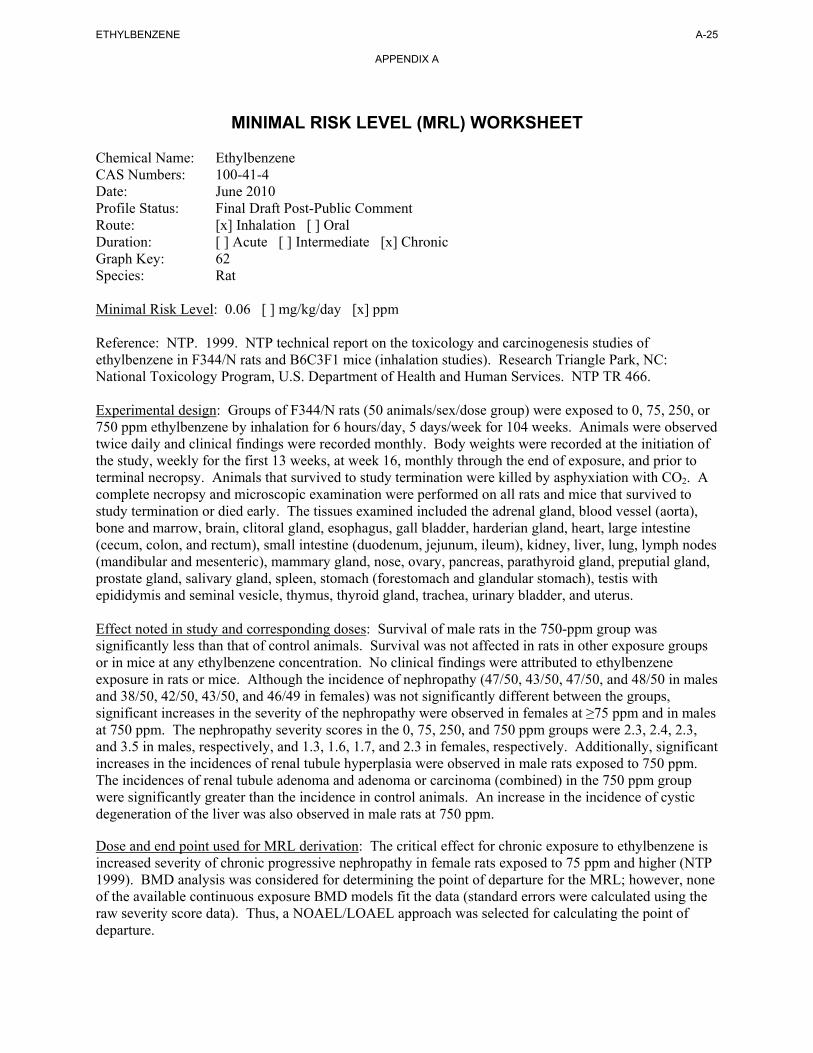
ETHYLBENZENE A-25
APPENDIX A
MINIMAL RISK LEVEL (MRL) WORKSHEET
Chemical Name: Ethylbenzene CAS Numbers: 100-41-4 Date: June 2010 Profile Status: Final Draft Post-Public Comment Route: [x] Inhalation [ ] Oral Duration: [ ] Acute [ ] Intermediate [x] Chronic Graph Key: 62 Species: Rat
Minimal Risk Level: 0.06 [ ] mg/kg/day [x] ppm
Reference: NTP. 1999. NTP technical report on the toxicology and carcinogenesis studies of ethylbenzene in F344/N rats and B6C3F1 mice (inhalation studies). Research Triangle Park, NC: National Toxicology Program, U.S. Department of Health and Human Services. NTP TR 466.
Experimental design: Groups of F344/N rats (50 animals/sex/dose group) were exposed to 0, 75, 250, or 750 ppm ethylbenzene by inhalation for 6 hours/day, 5 days/week for 104 weeks. Animals were observed twice daily and clinical findings were recorded monthly. Body weights were recorded at the initiation of the study, weekly for the first 13 weeks, at week 16, monthly through the end of exposure, and prior to terminal necropsy. Animals that survived to study termination were killed by asphyxiation with CO2. A complete necropsy and microscopic examination were performed on all rats and mice that survived to study termination or died early. The tissues examined included the adrenal gland, blood vessel (aorta), bone and marrow, brain, clitoral gland, esophagus, gall bladder, harderian gland, heart, large intestine (cecum, colon, and rectum), small intestine (duodenum, jejunum, ileum), kidney, liver, lung, lymph nodes (mandibular and mesenteric), mammary gland, nose, ovary, pancreas, parathyroid gland, preputial gland, prostate gland, salivary gland, spleen, stomach (forestomach and glandular stomach), testis with epididymis and seminal vesicle, thymus, thyroid gland, trachea, urinary bladder, and uterus.
Effect noted in study and corresponding doses: Survival of male rats in the 750-ppm group was significantly less than that of control animals. Survival was not affected in rats in other exposure groups or in mice at any ethylbenzene concentration. No clinical findings were attributed to ethylbenzene exposure in rats or mice. Although the incidence of nephropathy (47/50, 43/50, 47/50, and 48/50 in males and 38/50, 42/50, 43/50, and 46/49 in females) was not significantly different between the groups, significant increases in the severity of the nephropathy were observed in females at ≥75 ppm and in males at 750 ppm. The nephropathy severity scores in the 0, 75, 250, and 750 ppm groups were 2.3, 2.4, 2.3, and 3.5 in males, respectively, and 1.3, 1.6, 1.7, and 2.3 in females, respectively. Additionally, significant increases in the incidences of renal tubule hyperplasia were observed in male rats exposed to 750 ppm. The incidences of renal tubule adenoma and adenoma or carcinoma (combined) in the 750 ppm group were significantly greater than the incidence in control animals. An increase in the incidence of cystic degeneration of the liver was also observed in male rats at 750 ppm.
Dose and end point used for MRL derivation: The critical effect for chronic exposure to ethylbenzene is increased severity of chronic progressive nephropathy in female rats exposed to 75 ppm and higher (NTP 1999). BMD analysis was considered for determining the point of departure for the MRL; however, none of the available continuous exposure BMD models fit the data (standard errors were calculated using the raw severity score data). Thus, a NOAEL/LOAEL approach was selected for calculating the point of departure.
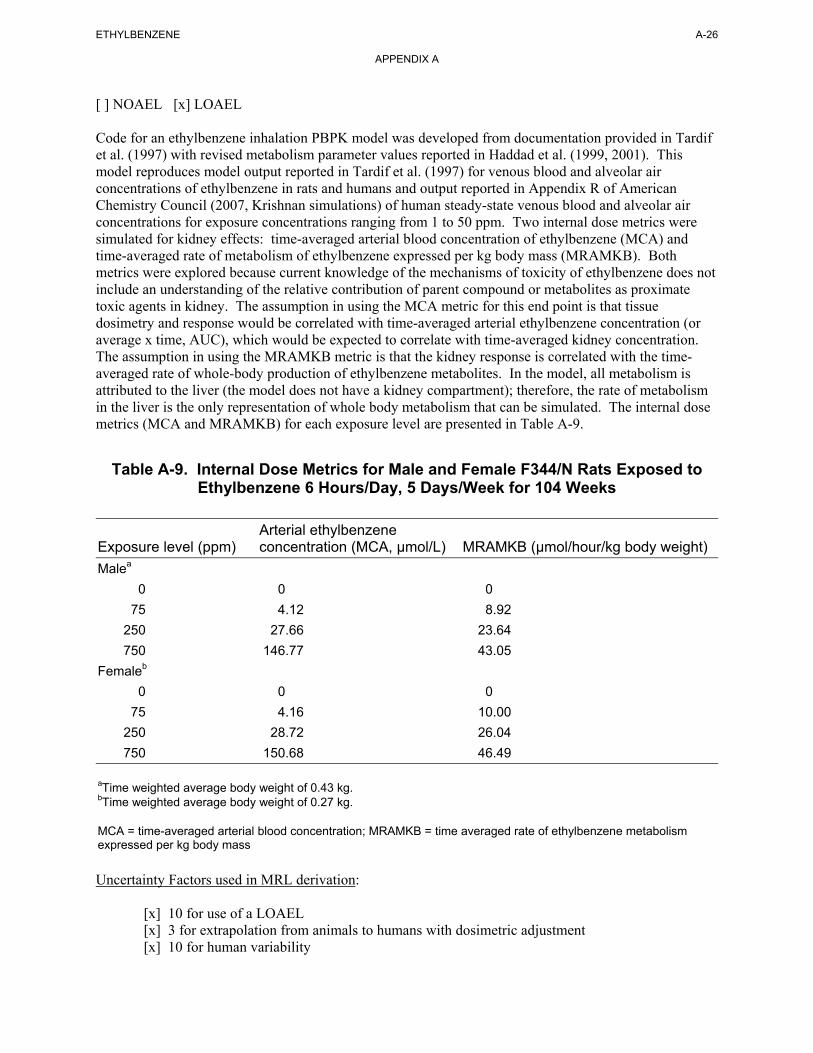
ETHYLBENZENE A-26
APPENDIX A
[ ] NOAEL [x] LOAEL
Code for an ethylbenzene inhalation PBPK model was developed from documentation provided in Tardif et al. (1997) with revised metabolism parameter values reported in Haddad et al. (1999, 2001). This model reproduces model output reported in Tardif et al. (1997) for venous blood and alveolar air concentrations of ethylbenzene in rats and humans and output reported in Appendix R of American Chemistry Council (2007, Krishnan simulations) of human steady-state venous blood and alveolar air concentrations for exposure concentrations ranging from 1 to 50 ppm. Two internal dose metrics were simulated for kidney effects: time-averaged arterial blood concentration of ethylbenzene (MCA) and time-averaged rate of metabolism of ethylbenzene expressed per kg body mass (MRAMKB). Both metrics were explored because current knowledge of the mechanisms of toxicity of ethylbenzene does not include an understanding of the relative contribution of parent compound or metabolites as proximate toxic agents in kidney. The assumption in using the MCA metric for this end point is that tissue dosimetry and response would be correlated with time-averaged arterial ethylbenzene concentration (or average x time, AUC), which would be expected to correlate with time-averaged kidney concentration. The assumption in using the MRAMKB metric is that the kidney response is correlated with the time-averaged rate of whole-body production of ethylbenzene metabolites. In the model, all metabolism is attributed to the liver (the model does not have a kidney compartment); therefore, the rate of metabolism in the liver is the only representation of whole body metabolism that can be simulated. The internal dose metrics (MCA and MRAMKB) for each exposure level are presented in Table A-9.
Table A-9. Internal Dose Metrics for Male and Female F344/N Rats Exposed to Ethylbenzene 6 Hours/Day, 5 Days/Week for 104 Weeks
Arterial ethylbenzene Exposure level (ppm) concentration (MCA, µmol/L) MRAMKB (µmol/hour/kg body weight)
Malea
0 0 0
75 4.12 8.92
250 27.66 23.64
750 146.77 43.05
Femaleb
0 0 0
75 4.16 10.00
250 28.72 26.04
750 150.68 46.49
aTime weighted average body weight of 0.43 kg. bTime weighted average body weight of 0.27 kg.
MCA = time-averaged arterial blood concentration; MRAMKB = time averaged rate of ethylbenzene metabolism expressed per kg body mass
Uncertainty Factors used in MRL derivation:
[x] 10 for use of a LOAEL [x] 3 for extrapolation from animals to humans with dosimetric adjustment [x] 10 for human variability
ETHYLBENZENE A-27
APPENDIX A
Was a conversion factor used from ppm in food or water to a mg/body weight dose? Not applicable.
If an inhalation study in animals, list conversion factors used in determining human equivalent concentration: The human PBPK model was used to predict HECs corresponding to LOAELMCA and LOAELMRAMKB in female rats. The MCA and MRAMKB dose metrics were converted to HEC values by iterative simulation of human inhalation exposures. Exposure concentrations were varied until the simulated value for the internal dose metric was within 0.01% of the LOAEL. The HECs were 17.45 ppm for the MCA dose metric and 52.68 ppm for the MRAMKB dose metric. Because there is limited information to determine whether the observed renal toxicity in female rats exposed to ethylbenzene is due to ethylbenzene or its metabolites, the lowest HEC value (17.45 ppm) was selected as the point of departure for the MRL.
Was a conversion used from intermittent to continuous exposure? The PBPK models used to estimate internal dose metrics and HECs adjusted for intermittent exposure.
Other additional studies or pertinent information that lend support to this MRL: The chronic toxicity of inhaled ethylbenzene has been examined humans and in 2-year bioassays in rats and mice conducted by NTP (1999). Hematological effects (increased average number of lymphocytes and decreased hemoglobin) were observed in workers exposed to solvents containing ethylbenzene (Angerer and Wulf 1985). In rats, concentration-related increases in the severity of nephropathy were observed in female rats exposed to ≥75 ppm and in male rats exposed to 750 ppm (NTP 1999). Increases in the incidence of renal tubule hyperplasia were also observed in male and female rats exposed to 750 ppm. The lowest LOAEL identified in mice was 250 ppm for hyperplasia of pituitary gland pars distalis observed in females; at 750 ppm, thyroid follicular cell hyperplasia was observed in male and female mice and hypertrophy and necrosis of the liver were observed in male mice.
Agency Contacts (Chemical Managers): Jessilynn Taylor, Henry Abadin, Heraline Hicks
ETHYLBENZENE A-28
APPENDIX A
MINIMAL RISK LEVEL (MRL) WORKSHEET
Chemical Name: Ethylbenzene CAS Numbers: 100-41-4 Date: June 2010 Profile Status: Final Draft Post-Public Comment Route: [ ] Inhalation [x] Oral Duration: [ ] Acute [x] Intermediate [ ] Chronic Graph Key: 4 Species: Rat
Minimal Risk Level: 0.4 [x ] mg/kg/day [ ] ppm
Reference: Mellert W, Deckardt K, Kauffmann W, et al. 2007. Ethylbenzene: 4- and 13-week rat oral toxicity. Arch Toxicol 81:361-370.
Experimental design: Groups of 10 male and 10 female Wister rats were administered ethylbenzene (no vehicle) by oral gavage at doses of 0, 75, 250, or 750 mg/kg/day for 13 weeks. The total daily dose of ethylbenzene was administered as split morning/evening half doses. Animals were examined daily for mortality and clinical signs. Food and water consumption and body weights were recorded weekly. A detailed clinical examination [ophthalmology and a functional observational battery (FOB)] and assessment of motor activity were conducted during the last week of treatment. After 13 weeks, urinalysis was conducted and blood samples were obtained and analyzed for hematology and clinical chemistry; organ weights were recorded and gross histopathologic examinations of the liver, kidney, and pancreas were conducted on animals in all groups. A comprehensive histopathological examination of tissues was performed in the control and 750 mg/kg/day groups.
Effect noted in study and corresponding doses: Clinical signs (post-dosing salivation) in treated animals were observed in all animals administered ≥250 mg/kg/day and in one animal administered 75 mg/kg/day. Terminal body weight in males was significantly decreased by 14% compared to controls in the 750 mg/kg/day group. Mean corpuscular volume was increased in males and females and platelet count was reduced in females treated with 750 mg/kg/day. Effects indicative of liver toxicity included increased activity of serum liver enzymes (alanine aminotransferase and γ-glutamyl transferase) in males (≥250 mg/kg/day) and females (750 mg/mg/day), increased absolute and relative liver weights (≥250 mg/kg/day in males and females), and a dose-related increase in the incidence of centrilobular hepatocyte hypertrophy (≥250 mg/kg/day in males and females) (Table A-10). Increased bilirubin (≤250 mg/kg/day in males and 750 mg/kg/day in females), total protein (750 mg/kg/day in females), albumin (750 mg/kg/day in males and females), globulins (750 mg/kg/day in females), and cholesterol (≤250 mg/kg/day in males and females), and decreased prothrombin time (750 mg/kg/day in males and ≥250 mg/kg/day in females) were considered by study investigators as adaptive effects in the liver. In males in the 75 mg/k/day group, relative liver weight was significantly increased by (4% compared to controls); however, no histopathological changes or increases in absolute liver or serum liver enzyme activities were observed at this dosage. Given that ethylbenzene is a microsomal enzyme inducer and the absence of histopathology and other evidence of liver injury at the 75 mg/kg/day dosage, the small increase in relative liver weight in male rats at this dosage was not considered indicative of an adverse effect on the liver.
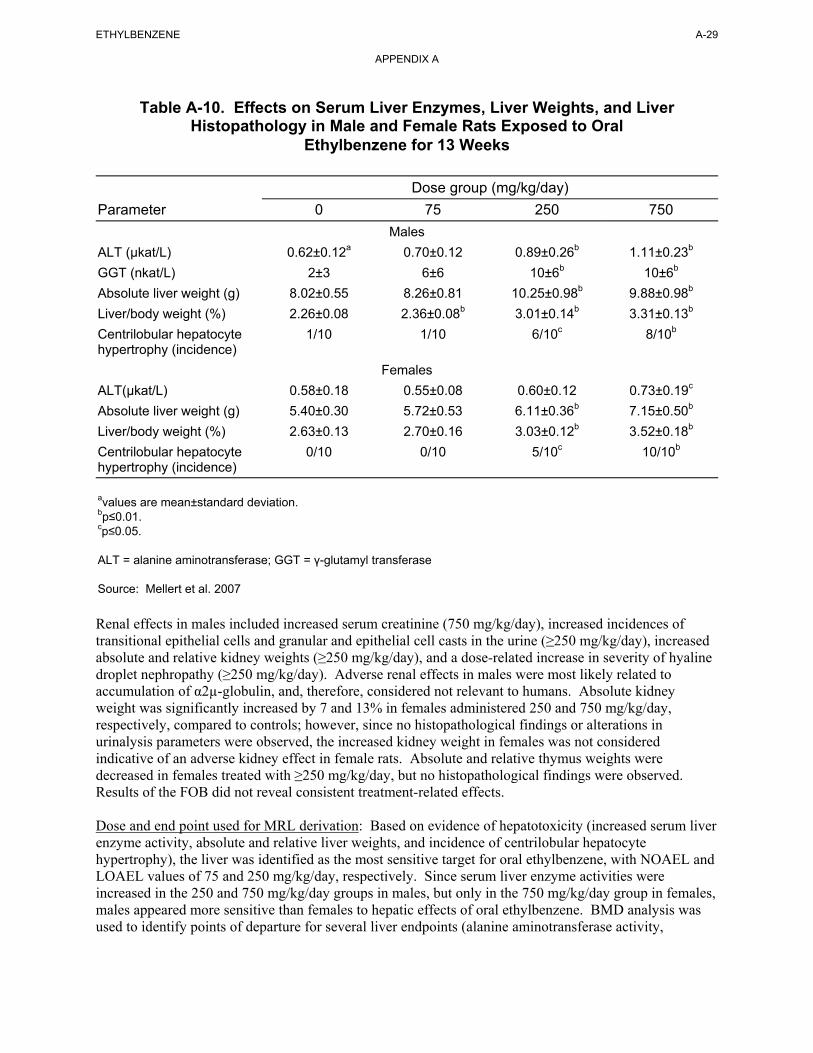
ETHYLBENZENE A-29
APPENDIX A
Table A-10. Effects on Serum Liver Enzymes, Liver Weights, and Liver Histopathology in Male and Female Rats Exposed to Oral
Ethylbenzene for 13 Weeks
Dose group (mg/kg/day)
Parameter 0 75 250 750
Males
ALT (µkat/L) 0.62±0.12a 0.70±0.12 0.89±0.26b 1.11±0.23b
GGT (nkat/L) 2±3 6±6 10±6b 10±6b
Absolute liver weight (g) 8.02±0.55 8.26±0.81 10.25±0.98b 9.88±0.98b
Liver/body weight (%) 2.26±0.08 2.36±0.08b 3.01±0.14b 3.31±0.13b
Centrilobular hepatocyte 1/10 1/10 6/10c 8/10b
hypertrophy (incidence)
Females
ALT(µkat/L) 0.58±0.18 0.55±0.08 0.60±0.12 0.73±0.19c
Absolute liver weight (g) 5.40±0.30 5.72±0.53 6.11±0.36b 7.15±0.50b
Liver/body weight (%) 2.63±0.13 2.70±0.16 3.03±0.12b 3.52±0.18b
Centrilobular hepatocyte 0/10 0/10 5/10c 10/10b
hypertrophy (incidence)
avalues are mean±standard deviation. bp≤0.01. cp≤0.05.
ALT = alanine aminotransferase; GGT = γ-glutamyl transferase
Source: Mellert et al. 2007
Renal effects in males included increased serum creatinine (750 mg/kg/day), increased incidences of transitional epithelial cells and granular and epithelial cell casts in the urine (≥250 mg/kg/day), increased absolute and relative kidney weights (≥250 mg/kg/day), and a dose-related increase in severity of hyaline droplet nephropathy (≥250 mg/kg/day). Adverse renal effects in males were most likely related to accumulation of α2µ-globulin, and, therefore, considered not relevant to humans. Absolute kidney weight was significantly increased by 7 and 13% in females administered 250 and 750 mg/kg/day, respectively, compared to controls; however, since no histopathological findings or alterations in urinalysis parameters were observed, the increased kidney weight in females was not considered indicative of an adverse kidney effect in female rats. Absolute and relative thymus weights were decreased in females treated with ≥250 mg/kg/day, but no histopathological findings were observed. Results of the FOB did not reveal consistent treatment-related effects.
Dose and end point used for MRL derivation: Based on evidence of hepatotoxicity (increased serum liver enzyme activity, absolute and relative liver weights, and incidence of centrilobular hepatocyte hypertrophy), the liver was identified as the most sensitive target for oral ethylbenzene, with NOAEL and LOAEL values of 75 and 250 mg/kg/day, respectively. Since serum liver enzyme activities were increased in the 250 and 750 mg/kg/day groups in males, but only in the 750 mg/kg/day group in females, males appeared more sensitive than females to hepatic effects of oral ethylbenzene. BMD analysis was used to identify points of departure for several liver endpoints (alanine aminotransferase activity,
ETHYLBENZENE A-30
APPENDIX A
γ-glutamyl transferase activity, absolute liver weight, relative liver weight, and centrolobular hepatocyte hypertrophy) using the two internal dose metrics.
[ ] NOAEL [ ] LOAEL [X] BMDL
To determine the point of departure for derivation of the intermediate-duration MRL, a PBPK model was used to estimate internal dose metrics and data sets for serum liver enzymes, absolute and relative liver weight, and centrilobular hepatocyte hypertrophy (Table A-10) in male rats were evaluated for suitability for BMD modeling. Code for an ethylbenzene inhalation PBPK model was developed from documentation provided in Tardif et al. (1997) with revised metabolism parameter values reported in Haddad et al. (1999, 2001). This model reproduces model output reported in Tardif et al. (1997) for venous blood and alveolar air concentrations of ethylbenzene in rats and humans and output reported in Appendix R of American Chemistry Council (2007, Krishnan simulations) of human steady-state venous blood and alveolar air concentrations for exposure concentrations ranging from 1 to 50 ppm. The model was extended to implement first-order gastrointestinal absorption kinetics as described in Faber et al. (2006). For liver effects, the model simulated two internal dose metrics: time-averaged concentration of ethylbenzene in liver (MCL) and time-averaged rate of metabolism of ethylbenzene in liver (MRAMKL). The assumption of using the MCL metric is that the liver response is correlated with the time-averaged concentration of ethylbenzene in liver. The assumption in using the MRAMKL metric is that the liver response is correlated with the time-averaged rate of production of ethylbenzene metabolites in liver. Both metrics were explored because current knowledge of the mechanism of toxicity of ethylbenzene does not include an understanding of the relative contributions of parent compound or metabolites as proximate toxic agents in liver.
Data for changes in alanine aminotransferase and γ-glutamyl transferase, absolute liver weight and relative liver weight were analyzed using all available continuous variable models in EPA BMDS (version 2.1.1). BMDs and the 95% lower confidence limit on the BMD (BMDLs) associated with a BMR of 1 standard deviation change from the control were calculated for all models. The data were fit to BMD models using the MCL and MRAMKL internal dose metrics. The following procedure for fitting continuous data was used. The simplest model (linear) was first applied to the data while assuming constant variance. If the data were consistent with the assumption of constant variance (p≥0.1), then the fit of the linear model to the means was evaluated and the polynomial, power and Hill models were fit to the data while assuming constant variance. Adequate model fit was judged by three criteria: goodness-of-fit p-value (p>0.1), visual inspection of the dose-response curve, and scaled residual at the data point (except the control) closest to the predefined BMR. Among all the models providing adequate fit to the data, the lowest BMCL (95% lower confidence limit on the benchmark concentration) was selected as the point of departure when the difference between the BMCLs estimated from these models were more 3-fold; otherwise, the BMCL from the model with the lowest AIC was chosen. If the test for constant variance was negative, the linear model was run again while applying the power model integrated into the BMDS to account for nonhomogenous variance. If the nonhomogenous variance model provided an adequate fit (p≥0.1) to the variance data, then the fit of the linear model to the means was evaluated and the polynomial, power and Hill models are fit to the data and evaluated while the variance model is applied. Model fit and point of departure selection proceeded as described earlier. If the test for constant variance was negative and the nonhomogenous variance model did not provide an adequate fit to the variance data, then the data set was considered unsuitable for modeling.
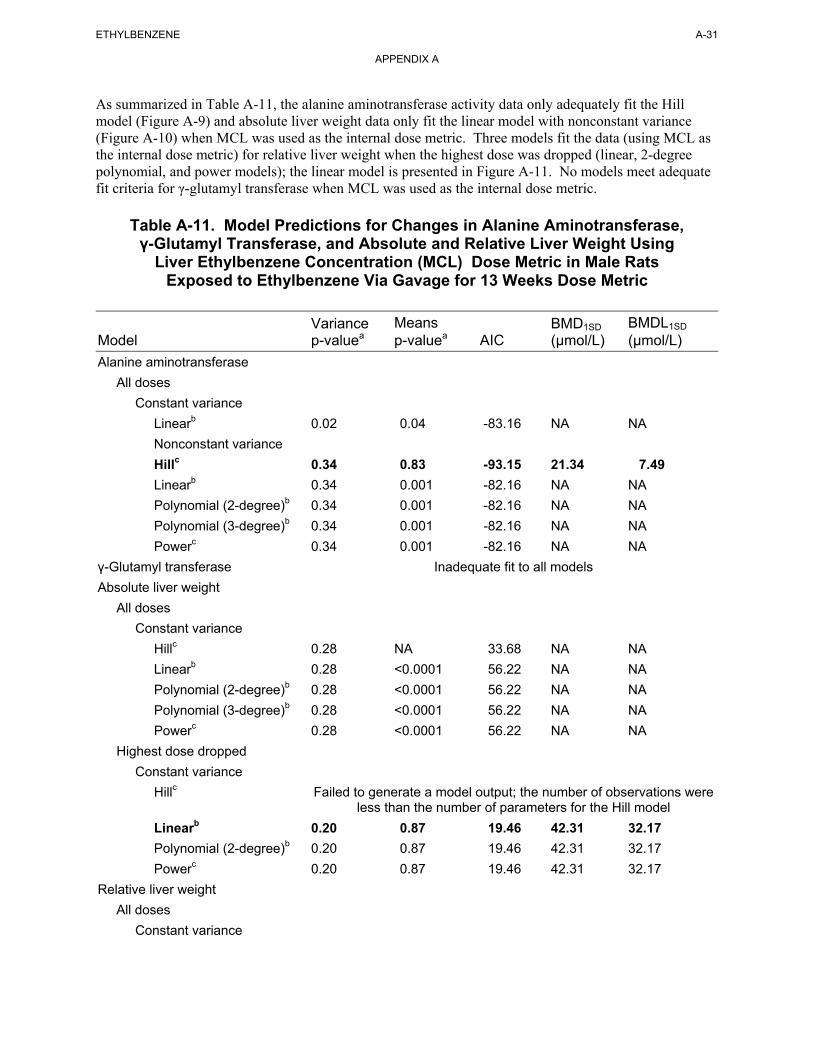
ETHYLBENZENE A-31
APPENDIX A
As summarized in Table A-11, the alanine aminotransferase activity data only adequately fit the Hill model (Figure A-9) and absolute liver weight data only fit the linear model with nonconstant variance (Figure A-10) when MCL was used as the internal dose metric. Three models fit the data (using MCL as the internal dose metric) for relative liver weight when the highest dose was dropped (linear, 2-degree polynomial, and power models); the linear model is presented in Figure A-11. No models meet adequate fit criteria for γ-glutamyl transferase when MCL was used as the internal dose metric.
Table A-11. Model Predictions for Changes in Alanine Aminotransferase, γ-Glutamyl Transferase, and Absolute and Relative Liver Weight Using
Liver Ethylbenzene Concentration (MCL) Dose Metric in Male Rats Exposed to Ethylbenzene Via Gavage for 13 Weeks Dose Metric
Variance Means BMD1SD BMDL1SD
Model p-valuea p-valuea AIC (µmol/L) (µmol/L)
Alanine aminotransferase
All doses
Constant variance
Linearb 0.02 0.04 -83.16 NA NA
Nonconstant variance
Hillc 0.34 0.83 -93.15 21.34 7.49
Linearb 0.34 0.001 -82.16 NA NA
Polynomial (2-degree)b 0.34 0.001 -82.16 NA NA
Polynomial (3-degree)b 0.34 0.001 -82.16 NA NA
Powerc 0.34 0.001 -82.16 NA NA
γ-Glutamyl transferase Inadequate fit to all models
Absolute liver weight
All doses
Constant variance
Hillc 0.28 NA 33.68 NA NA
Linearb 0.28 <0.0001 56.22 NA NA
Polynomial (2-degree)b 0.28 <0.0001 56.22 NA NA
Polynomial (3-degree)b 0.28 <0.0001 56.22 NA NA
Powerc 0.28 <0.0001 56.22 NA NA
Highest dose dropped
Constant variance
Hillc Failed to generate a model output; the number of observations were less than the number of parameters for the Hill model
Linearb 0.20 0.87 19.46 42.31 32.17
Polynomial (2-degree)b 0.20 0.87 19.46 42.31 32.17
Powerc 0.20 0.87 19.46 42.31 32.17
Relative liver weight
All doses
Constant variance
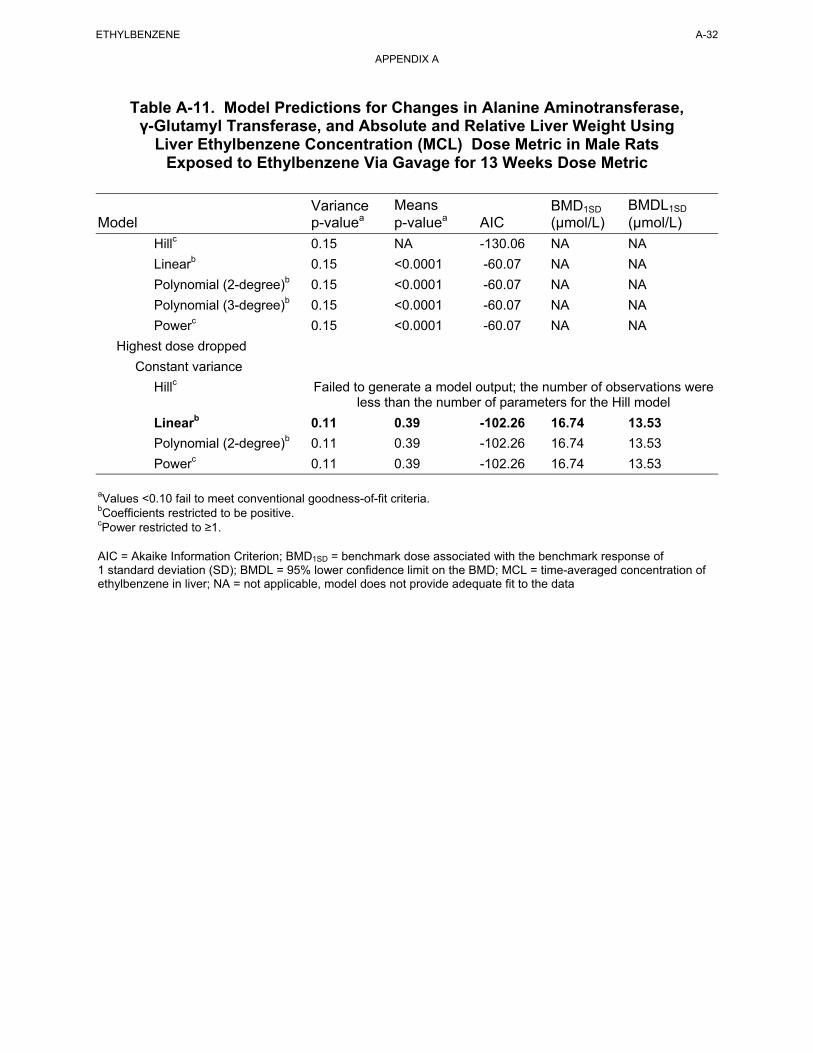
ETHYLBENZENE A-32
APPENDIX A
Table A-11. Model Predictions for Changes in Alanine Aminotransferase, γ-Glutamyl Transferase, and Absolute and Relative Liver Weight Using
Liver Ethylbenzene Concentration (MCL) Dose Metric in Male Rats Exposed to Ethylbenzene Via Gavage for 13 Weeks Dose Metric
Variance Means BMD1SD BMDL1SD
Model p-valuea p-valuea AIC (µmol/L) (µmol/L)
Hillc 0.15 NA -130.06 NA NA
Linearb 0.15 <0.0001 -60.07 NA NA
Polynomial (2-degree)b 0.15 <0.0001 -60.07 NA NA
Polynomial (3-degree)b 0.15 <0.0001 -60.07 NA NA
Powerc 0.15 <0.0001 -60.07 NA NA
Highest dose dropped
Constant variance
Hillc Failed to generate a model output; the number of observations were less than the number of parameters for the Hill model
Linearb 0.11 0.39 -102.26 16.74 13.53
Polynomial (2-degree)b 0.11 0.39 -102.26 16.74 13.53
Powerc 0.11 0.39 -102.26 16.74 13.53
aValues <0.10 fail to meet conventional goodness-of-fit criteria. bCoefficients restricted to be positive. cPower restricted to ≥1.
AIC = Akaike Information Criterion; BMD1SD = benchmark dose associated with the benchmark response of 1 standard deviation (SD); BMDL = 95% lower confidence limit on the BMD; MCL = time-averaged concentration of ethylbenzene in liver; NA = not applicable, model does not provide adequate fit to the data
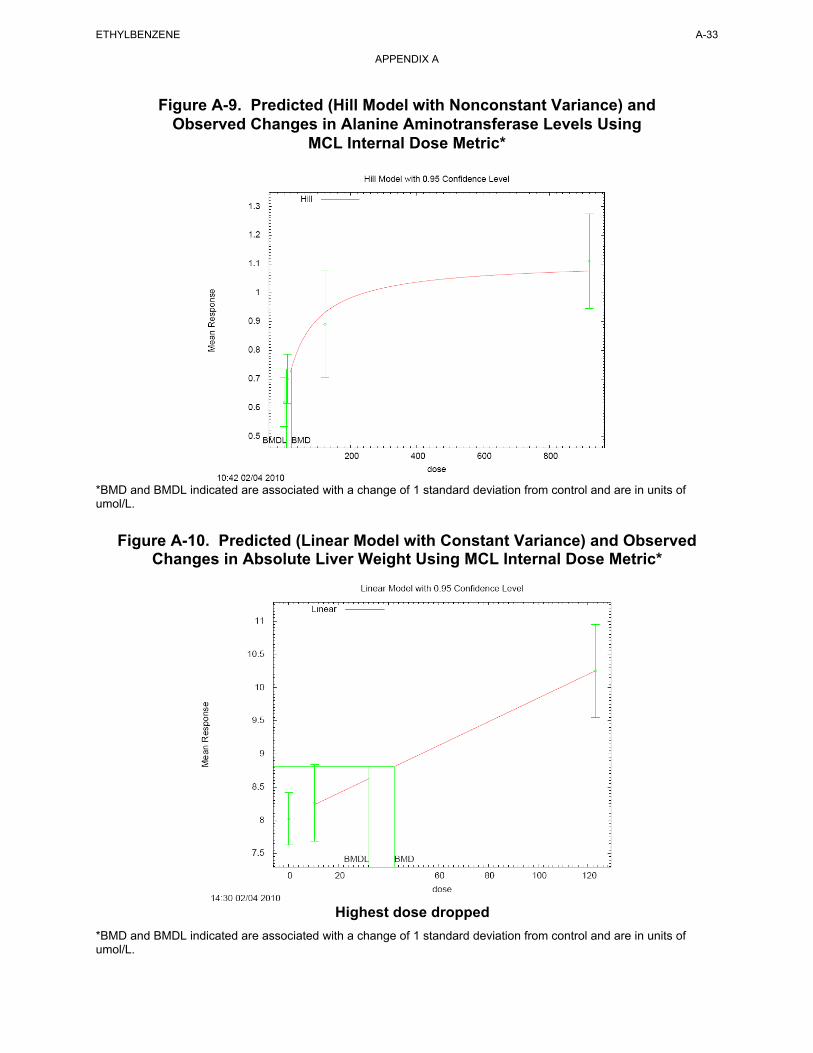
Figure A-9. Predicted (Hill Model with Nonconstant Variance) and Observed Changes in Alanine Aminotransferase Levels Using
MCL Internal Dose Metric*
*BMD and BMDL indicated are associated with a change of 1 standard deviation from control and are in units of umol/L.
Figure A-10. Predicted (Linear Model with Constant Variance) and Observed Changes in Absolute Liver Weight Using MCL Internal Dose Metric*
Highest dose dropped
*BMD and BMDL indicated are associated with a change of 1 standard deviation from control and are in units of umol/L.
ETHYLBENZENE A-33
APPENDIX A
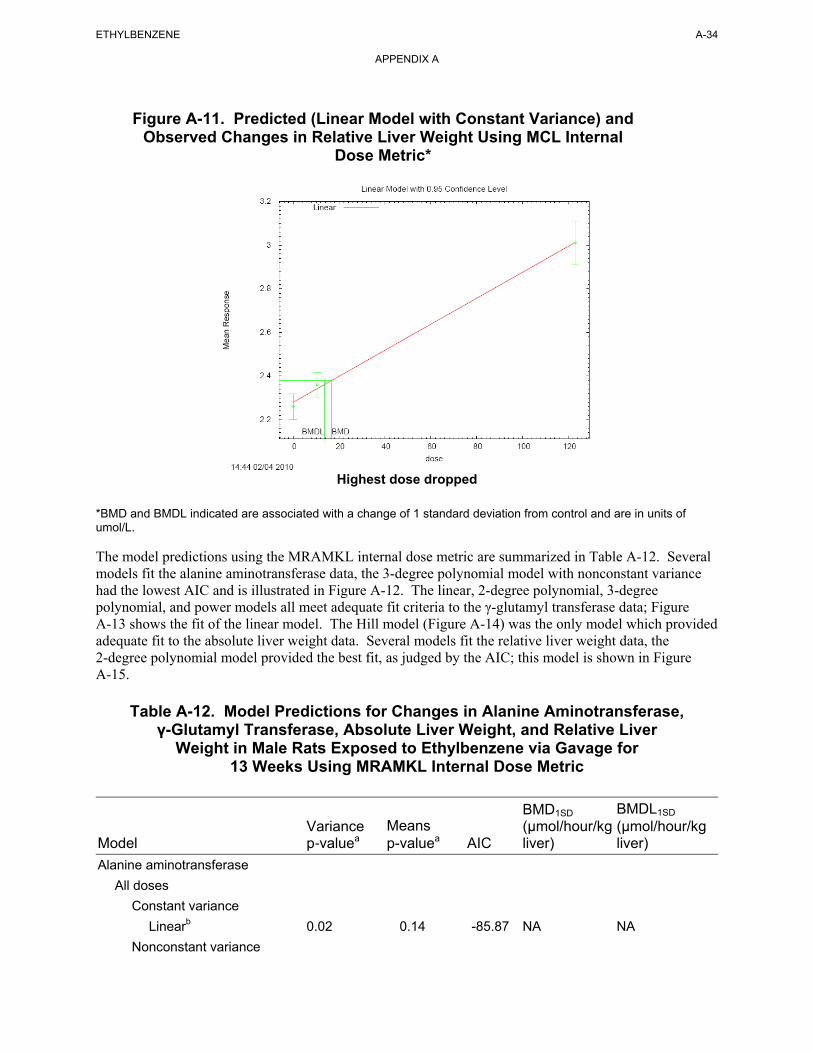
Figure A-11. Predicted (Linear Model with Constant Variance) and Observed Changes in Relative Liver Weight Using MCL Internal
Dose Metric*
ETHYLBENZENE A-34
APPENDIX A
Highest dose dropped
*BMD and BMDL indicated are associated with a change of 1 standard deviation from control and are in units of umol/L.
The model predictions using the MRAMKL internal dose metric are summarized in Table A-12. Several models fit the alanine aminotransferase data, the 3-degree polynomial model with nonconstant variance had the lowest AIC and is illustrated in Figure A-12. The linear, 2-degree polynomial, 3-degree polynomial, and power models all meet adequate fit criteria to the γ-glutamyl transferase data; Figure A-13 shows the fit of the linear model. The Hill model (Figure A-14) was the only model which provided adequate fit to the absolute liver weight data. Several models fit the relative liver weight data, the 2-degree polynomial model provided the best fit, as judged by the AIC; this model is shown in Figure A-15.
Table A-12. Model Predictions for Changes in Alanine Aminotransferase, γ-Glutamyl Transferase, Absolute Liver Weight, and Relative Liver
Weight in Male Rats Exposed to Ethylbenzene via Gavage for 13 Weeks Using MRAMKL Internal Dose Metric
Model
Alanine aminotransferase
Variance p-valuea
Means p-valuea AIC
BMD1SD
(µmol/hour/kg liver)
BMDL1SD
(µmol/hour/kg liver)
All doses
Constant variance
Linearb 0.02 0.14 -85.87 NA NA
Nonconstant variance
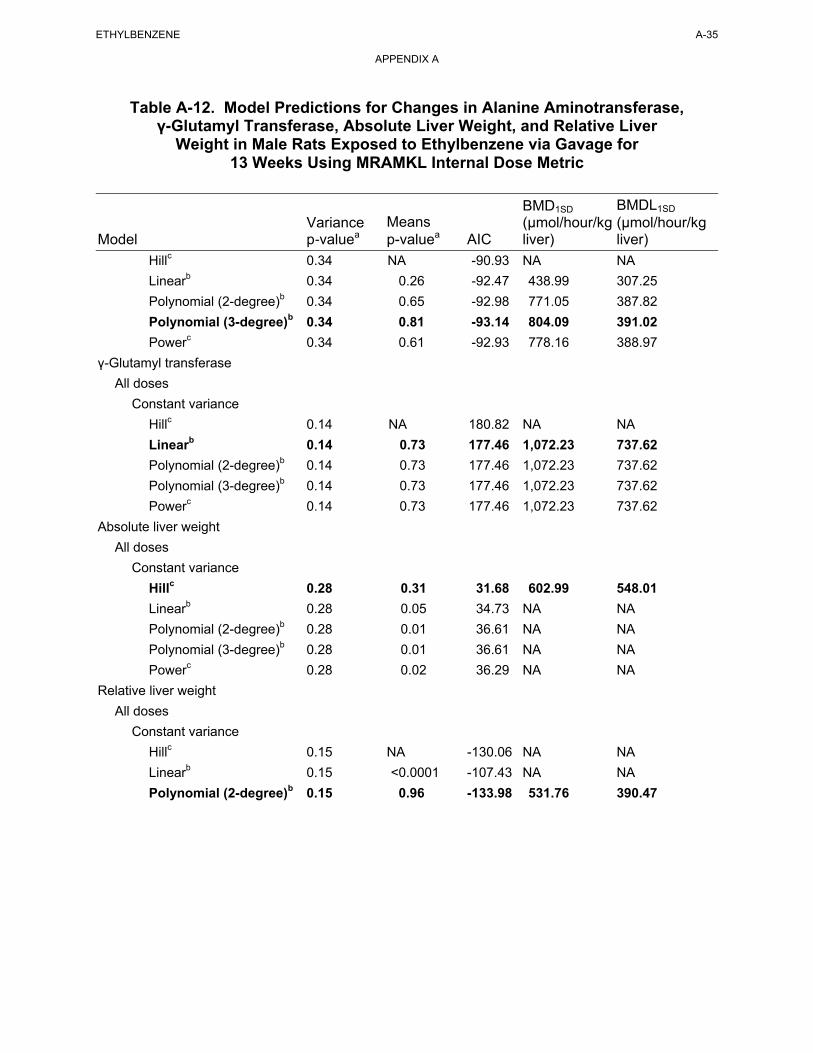
ETHYLBENZENE A-35
APPENDIX A
Table A-12. Model Predictions for Changes in Alanine Aminotransferase, γ-Glutamyl Transferase, Absolute Liver Weight, and Relative Liver
Weight in Male Rats Exposed to Ethylbenzene via Gavage for 13 Weeks Using MRAMKL Internal Dose Metric
BMD1SD BMDL1SD
Variance Means (µmol/hour/kg (µmol/hour/kg Model p-valuea p-valuea AIC liver) liver)
Hillc 0.34 NA -90.93 NA NA
Linearb 0.34 0.26 -92.47 438.99 307.25
Polynomial (2-degree)b 0.34 0.65 -92.98 771.05 387.82
Polynomial (3-degree)b 0.34 0.81 -93.14 804.09 391.02
Powerc 0.34 0.61 -92.93 778.16 388.97
γ-Glutamyl transferase
All doses
Constant variance
Hillc 0.14 NA 180.82 NA NA
Linearb 0.14 0.73 177.46 1,072.23 737.62
Polynomial (2-degree)b 0.14 0.73 177.46 1,072.23 737.62
Polynomial (3-degree)b 0.14 0.73 177.46 1,072.23 737.62
Powerc 0.14 0.73 177.46 1,072.23 737.62
Absolute liver weight
All doses
Constant variance
Hillc 0.28 0.31 31.68 602.99 548.01
Linearb 0.28 0.05 34.73 NA NA
Polynomial (2-degree)b 0.28 0.01 36.61 NA NA
Polynomial (3-degree)b 0.28 0.01 36.61 NA NA
Powerc 0.28 0.02 36.29 NA NA
Relative liver weight
All doses
Constant variance
Hillc 0.15 NA -130.06 NA NA
Linearb 0.15 <0.0001 -107.43 NA NA
Polynomial (2-degree)b 0.15 0.96 -133.98 531.76 390.47
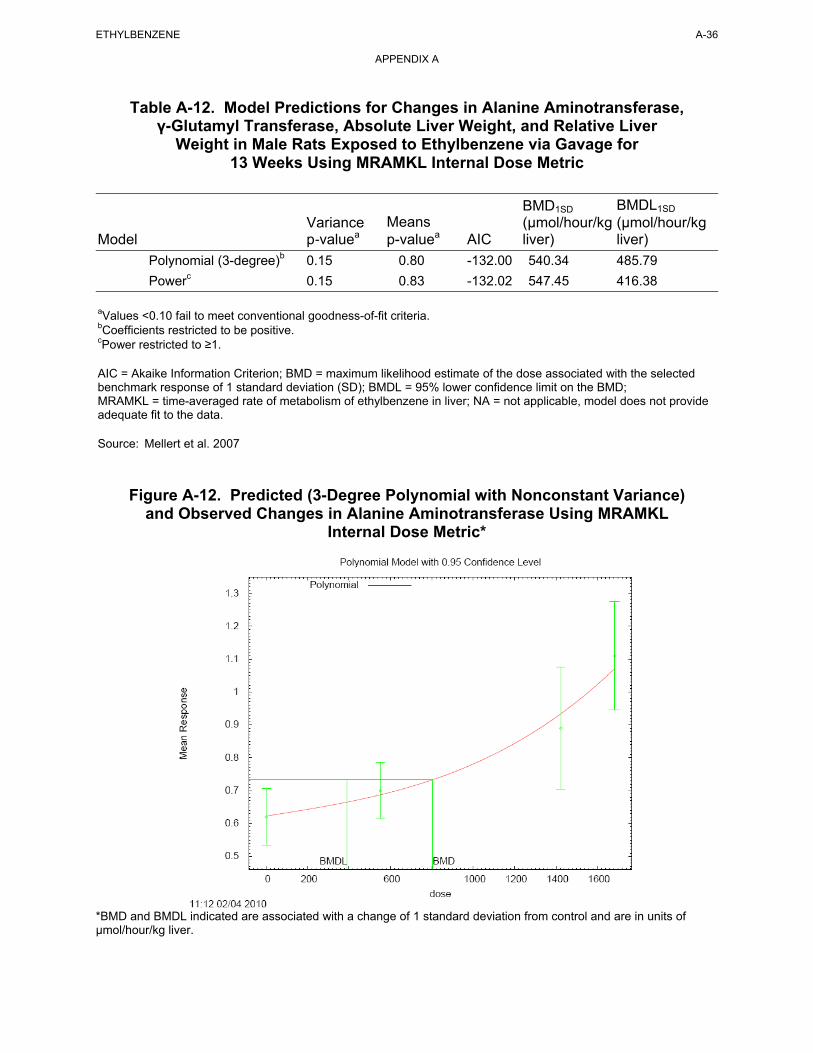
Figure A-12. Predicted (3-Degree Polynomial with Nonconstant Variance) and Observed Changes in Alanine Aminotransferase Using MRAMKL
Internal Dose Metric*
*BMD and BMDL indicated are associated with a change of 1 standard deviation from control and are in units of µmol/hour/kg liver.
ETHYLBENZENE A-36
APPENDIX A
Table A-12. Model Predictions for Changes in Alanine Aminotransferase, γ-Glutamyl Transferase, Absolute Liver Weight, and Relative Liver
Weight in Male Rats Exposed to Ethylbenzene via Gavage for 13 Weeks Using MRAMKL Internal Dose Metric
BMD1SD BMDL1SD
Variance Means (µmol/hour/kg (µmol/hour/kg Model p-valuea p-valuea AIC liver) liver)
Polynomial (3-degree)b 0.15 0.80 -132.00 540.34 485.79
Powerc 0.15 0.83 -132.02 547.45 416.38
aValues <0.10 fail to meet conventional goodness-of-fit criteria. bCoefficients restricted to be positive. cPower restricted to ≥1.
AIC = Akaike Information Criterion; BMD = maximum likelihood estimate of the dose associated with the selected benchmark response of 1 standard deviation (SD); BMDL = 95% lower confidence limit on the BMD; MRAMKL = time-averaged rate of metabolism of ethylbenzene in liver; NA = not applicable, model does not provide adequate fit to the data.
Source: Mellert et al. 2007
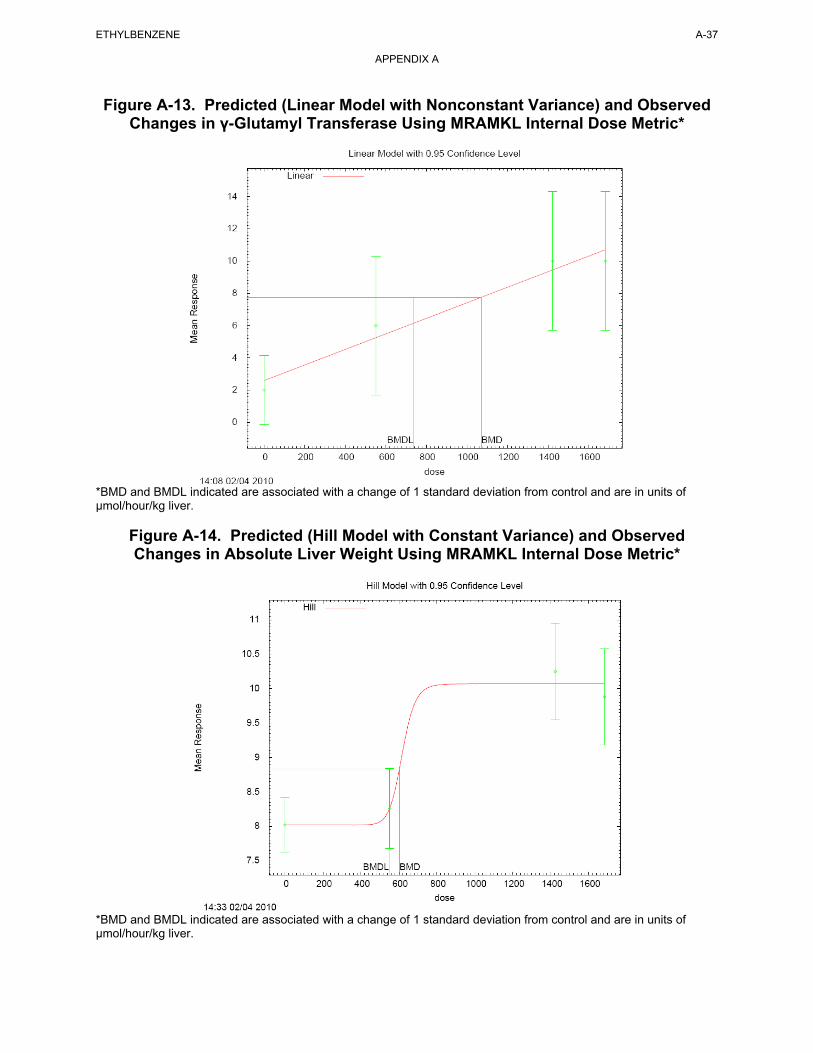
Figure A-13. Predicted (Linear Model with Nonconstant Variance) and Observed Changes in γ-Glutamyl Transferase Using MRAMKL Internal Dose Metric*
*BMD and BMDL indicated are associated with a change of 1 standard deviation from control and are in units of µmol/hour/kg liver.
Figure A-14. Predicted (Hill Model with Constant Variance) and Observed Changes in Absolute Liver Weight Using MRAMKL Internal Dose Metric*
*BMD and BMDL indicated are associated with a change of 1 standard deviation from control and are in units of µmol/hour/kg liver.
ETHYLBENZENE A-37
APPENDIX A
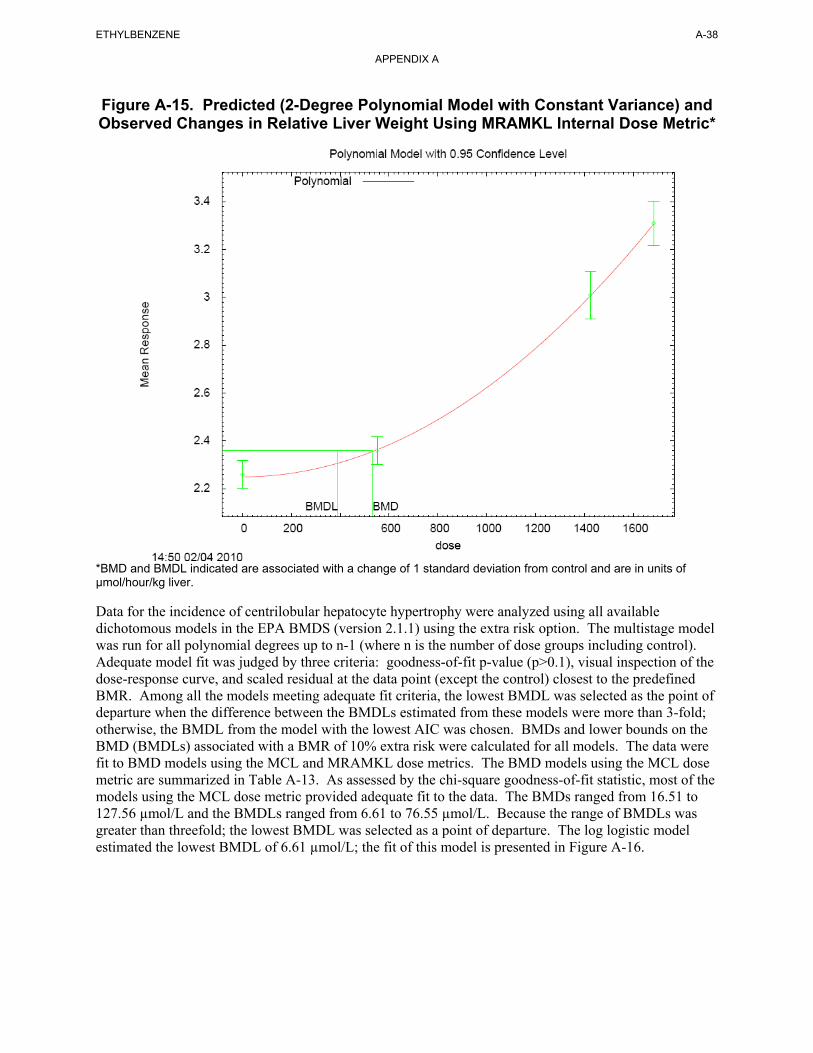
Figure A-15. Predicted (2-Degree Polynomial Model with Constant Variance) and Observed Changes in Relative Liver Weight Using MRAMKL Internal Dose Metric*
*BMD and BMDL indicated are associated with a change of 1 standard deviation from control and are in units of µmol/hour/kg liver.
ETHYLBENZENE A-38
APPENDIX A
Data for the incidence of centrilobular hepatocyte hypertrophy were analyzed using all available dichotomous models in the EPA BMDS (version 2.1.1) using the extra risk option. The multistage model was run for all polynomial degrees up to n-1 (where n is the number of dose groups including control). Adequate model fit was judged by three criteria: goodness-of-fit p-value (p>0.1), visual inspection of the dose-response curve, and scaled residual at the data point (except the control) closest to the predefined BMR. Among all the models meeting adequate fit criteria, the lowest BMDL was selected as the point of departure when the difference between the BMDLs estimated from these models were more than 3-fold; otherwise, the BMDL from the model with the lowest AIC was chosen. BMDs and lower bounds on the BMD (BMDLs) associated with a BMR of 10% extra risk were calculated for all models. The data were fit to BMD models using the MCL and MRAMKL dose metrics. The BMD models using the MCL dose metric are summarized in Table A-13. As assessed by the chi-square goodness-of-fit statistic, most of the models using the MCL dose metric provided adequate fit to the data. The BMDs ranged from 16.51 to 127.56 µmol/L and the BMDLs ranged from 6.61 to 76.55 µmol/L. Because the range of BMDLs was greater than threefold; the lowest BMDL was selected as a point of departure. The log logistic model estimated the lowest BMDL of 6.61 µmol/L; the fit of this model is presented in Figure A-16.
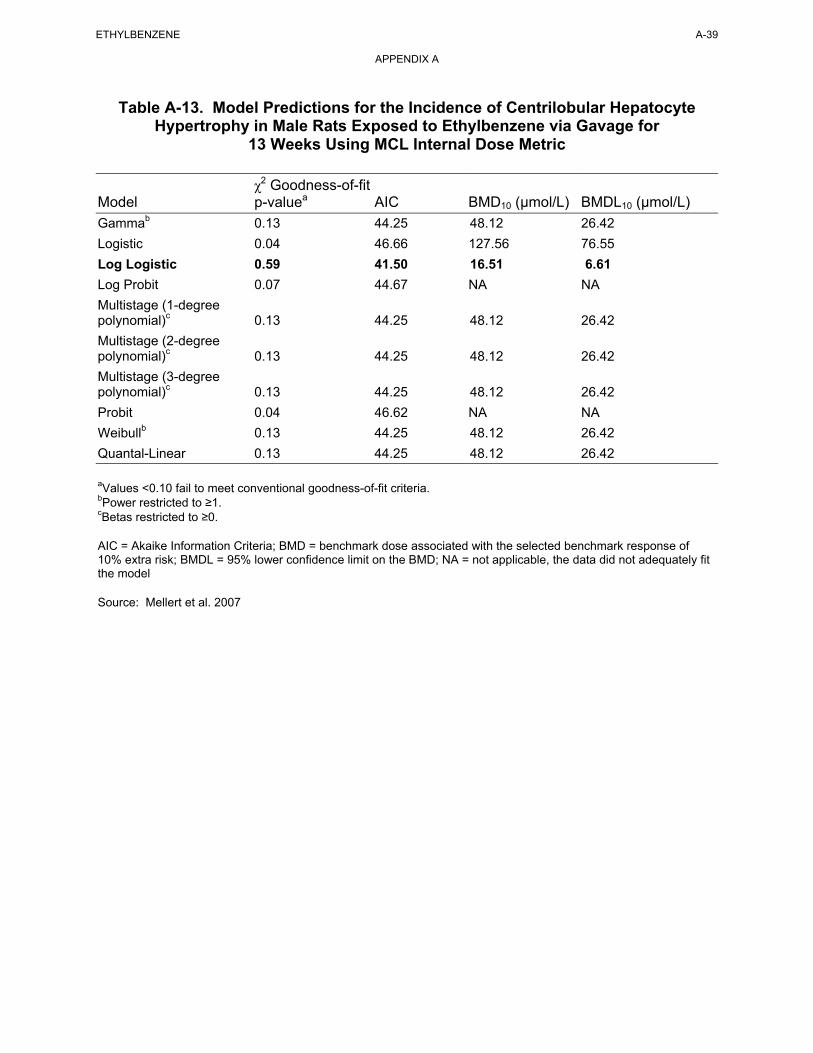
ETHYLBENZENE A-39
APPENDIX A
Table A-13. Model Predictions for the Incidence of Centrilobular Hepatocyte Hypertrophy in Male Rats Exposed to Ethylbenzene via Gavage for
13 Weeks Using MCL Internal Dose Metric
Model
Gammab
χ2 Goodness-of-fit p-valuea AIC
0.13 44.25
BMD10 (µmol/L)
48.12
BMDL10 (µmol/L)
26.42
Logistic
Log Logistic
Log Probit
Multistage (1-degree polynomial)c
Multistage (2-degree polynomial)c
Multistage (3-degree polynomial)c
Probit
0.04
0.59
0.07
0.13
0.13
0.13
0.04
46.66
41.50
44.67
44.25
44.25
44.25
46.62
127.56
16.51
NA
48.12
48.12
48.12
NA
76.55
6.61
NA
26.42
26.42
26.42
NA
Weibullb 0.13 44.25 48.12 26.42
Quantal-Linear 0.13 44.25 48.12 26.42
aValues <0.10 fail to meet conventional goodness-of-fit criteria. bPower restricted to ≥1. cBetas restricted to ≥0.
AIC = Akaike Information Criteria; BMD = benchmark dose associated with the selected benchmark response of 10% extra risk; BMDL = 95% lower confidence limit on the BMD; NA = not applicable, the data did not adequately fit the model
Source: Mellert et al. 2007
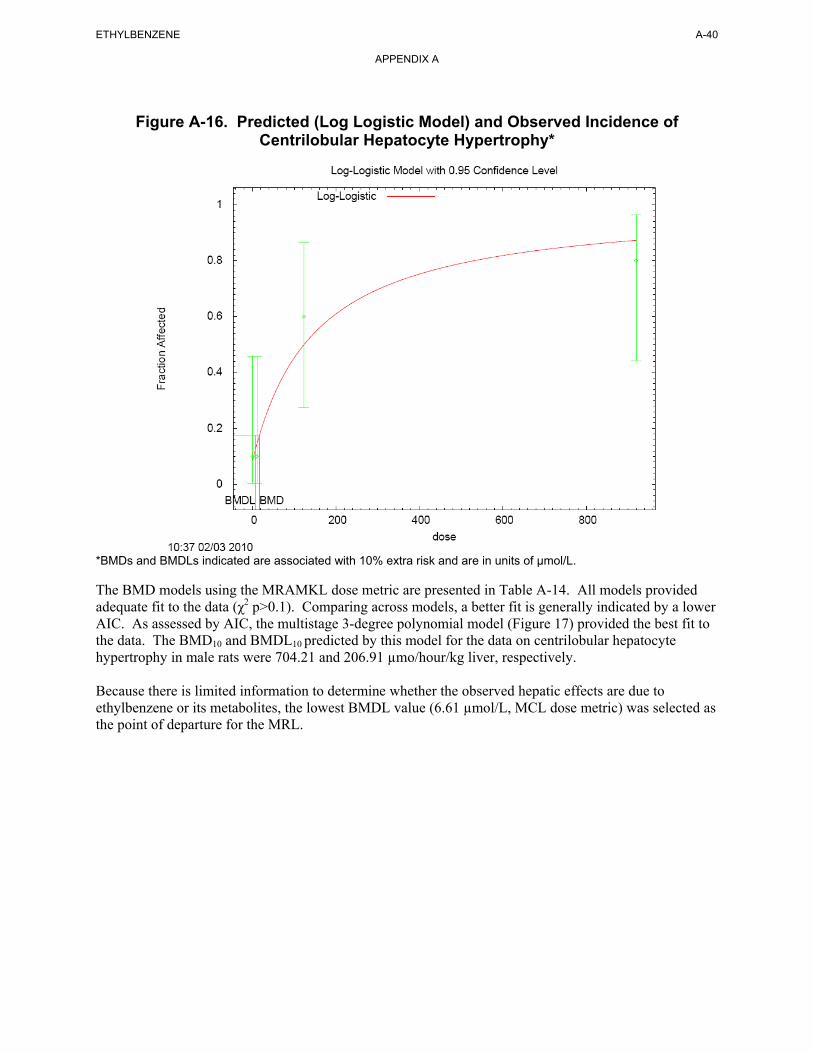
Figure A-16. Predicted (Log Logistic Model) and Observed Incidence of
Centrilobular Hepatocyte Hypertrophy*
*BMDs and BMDLs indicated are associated with 10% extra risk and are in units of µmol/L. The BMD models using the MRAMKL dose metric are presented in Table A-14. All models provided adequate fit to the data (χ2 p>0.1). Comparing across models, a better fit is generally indicated by a lower AIC. As assessed by AIC, the multistage 3-degree polynomial model (Figure 17) provided the best fit to the data. The BMD10 and BMDL10 predicted by this model for the data on centrilobular hepatocyte hypertrophy in male rats were 704.21 and 206.91 µmo/hour/kg liver, respectively. Because there is limited information to determine whether the observed hepatic effects are due to ethylbenzene or its metabolites, the lowest BMDL value (6.61 µmol/L, MCL dose metric) was selected as the point of departure for the MRL.
ETHYLBENZENE A-40
APPENDIX A
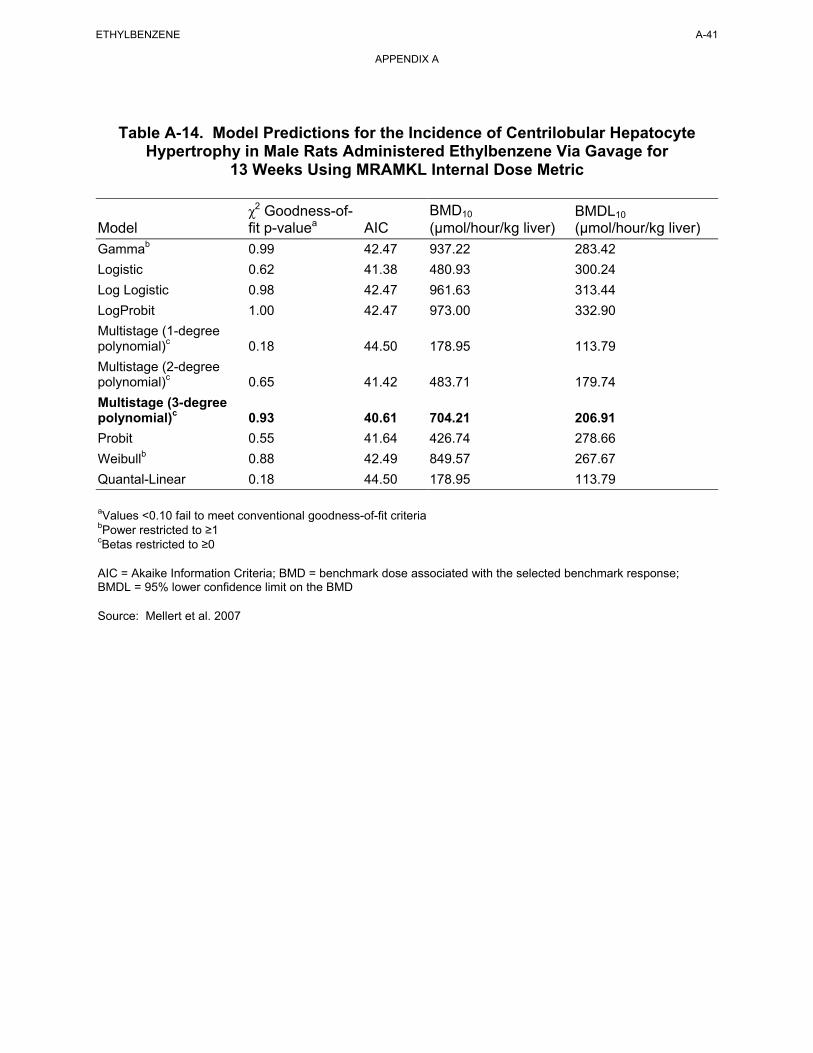
ETHYLBENZENE A-41
APPENDIX A
Table A-14. Model Predictions for the Incidence of Centrilobular Hepatocyte Hypertrophy in Male Rats Administered Ethylbenzene Via Gavage for
13 Weeks Using MRAMKL Internal Dose Metric
Model
Gammab
χ2 Goodness-offit p-valuea
0.99
AIC
42.47
BMD10
(µmol/hour/kg liver)
937.22
BMDL10
(µmol/hour/kg liver)
283.42
Logistic
Log Logistic
LogProbit
Multistage (1-degree polynomial)c
Multistage (2-degree polynomial)c
Multistage (3-degree polynomial)c
Probit
0.62
0.98
1.00
0.18
0.65
0.93
0.55
41.38
42.47
42.47
44.50
41.42
40.61
41.64
480.93
961.63
973.00
178.95
483.71
704.21
426.74
300.24
313.44
332.90
113.79
179.74
206.91
278.66
Weibullb 0.88 42.49 849.57 267.67
Quantal-Linear 0.18 44.50 178.95 113.79
aValues <0.10 fail to meet conventional goodness-of-fit criteriabPower restricted to ≥1 cBetas restricted to ≥0
AIC = Akaike Information Criteria; BMD = benchmark dose associated with the selected benchmark response; BMDL = 95% lower confidence limit on the BMD
Source: Mellert et al. 2007
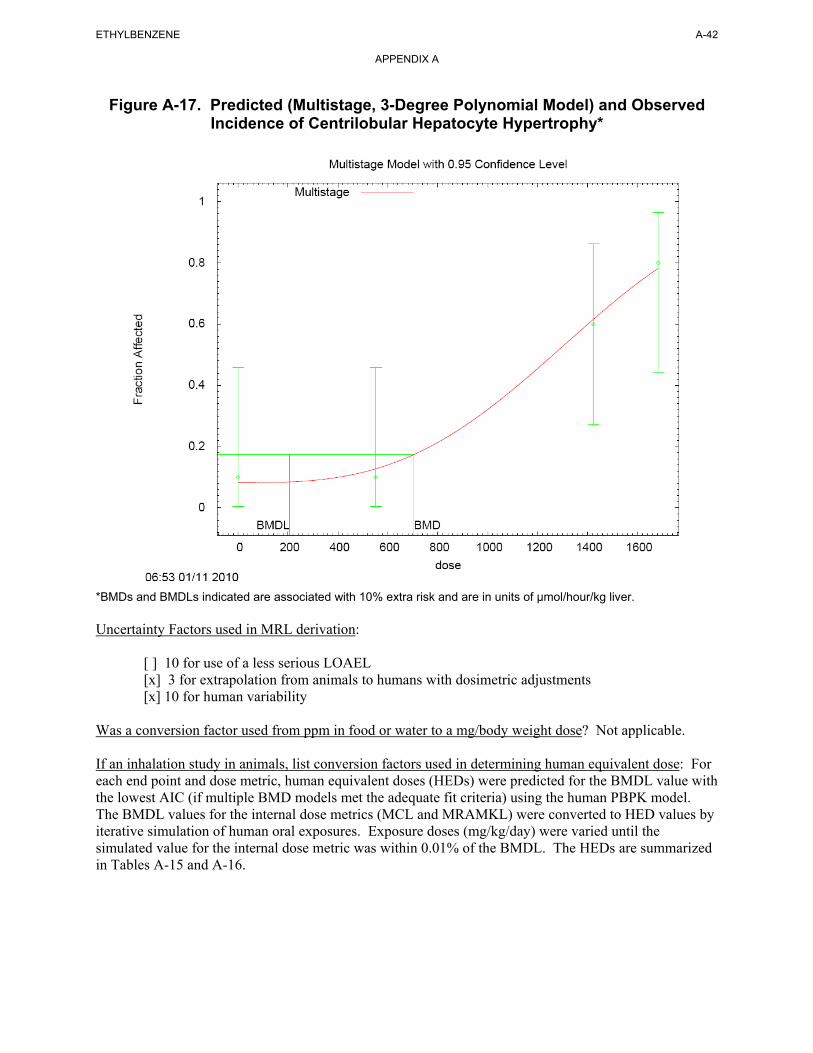
Figure A-17. Predicted (Multistage, 3-Degree Polynomial Model) and Observed Incidence of Centrilobular Hepatocyte Hypertrophy*
*BMDs and BMDLs indicated are associated with 10% extra risk and are in units of µmol/hour/kg liver. Uncertainty Factors used in MRL derivation: [ ] 10 for use of a less serious LOAEL [x] 3 for extrapolation from animals to humans with dosimetric adjustments [x] 10 for human variability
ETHYLBENZENE A-42
APPENDIX A
Was a conversion factor used from ppm in food or water to a mg/body weight dose? Not applicable.
If an inhalation study in animals, list conversion factors used in determining human equivalent dose: For each end point and dose metric, human equivalent doses (HEDs) were predicted for the BMDL value with the lowest AIC (if multiple BMD models met the adequate fit criteria) using the human PBPK model. The BMDL values for the internal dose metrics (MCL and MRAMKL) were converted to HED values by iterative simulation of human oral exposures. Exposure doses (mg/kg/day) were varied until the simulated value for the internal dose metric was within 0.01% of the BMDL. The HEDs are summarized in Tables A-15 and A-16.
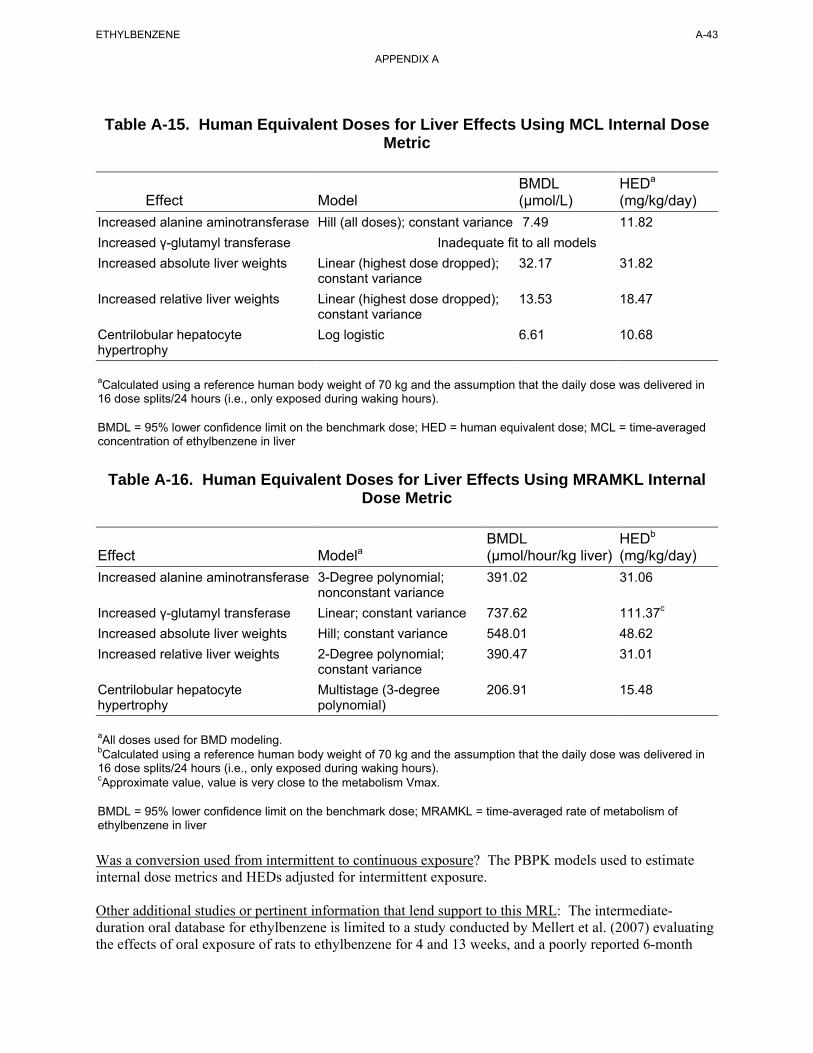
ETHYLBENZENE A-43
APPENDIX A
Table A-15. Human Equivalent Doses for Liver Effects Using MCL Internal Dose Metric
BMDL HEDa
Effect Model (µmol/L) (mg/kg/day) Increased alanine aminotransferase Hill (all doses); constant variance 7.49 11.82 Increased γ-glutamyl transferase Inadequate fit to all models Increased absolute liver weights Linear (highest dose dropped); 32.17 31.82
constant variance Increased relative liver weights Linear (highest dose dropped); 13.53 18.47
constant variance Centrilobular hepatocyte Log logistic 6.61 10.68 hypertrophy
aCalculated using a reference human body weight of 70 kg and the assumption that the daily dose was delivered in 16 dose splits/24 hours (i.e., only exposed during waking hours).
BMDL = 95% lower confidence limit on the benchmark dose; HED = human equivalent dose; MCL = time-averaged concentration of ethylbenzene in liver
Table A-16. Human Equivalent Doses for Liver Effects Using MRAMKL Internal Dose Metric
BMDL HEDb
Effect Modela (µmol/hour/kg liver) (mg/kg/day) Increased alanine aminotransferase 3-Degree polynomial;
nonconstant variance 391.02 31.06
Increased γ-glutamyl transferase Linear; constant variance 737.62 111.37c
Increased absolute liver weights Hill; constant variance 548.01 48.62 Increased relative liver weights 2-Degree polynomial;
constant variance 390.47 31.01
Centrilobular hepatocyte hypertrophy
Multistage (3-degree polynomial)
206.91 15.48
aAll doses used for BMD modeling.bCalculated using a reference human body weight of 70 kg and the assumption that the daily dose was delivered in 16 dose splits/24 hours (i.e., only exposed during waking hours). cApproximate value, value is very close to the metabolism Vmax.
BMDL = 95% lower confidence limit on the benchmark dose; MRAMKL = time-averaged rate of metabolism of ethylbenzene in liver
Was a conversion used from intermittent to continuous exposure? The PBPK models used to estimate internal dose metrics and HEDs adjusted for intermittent exposure.
Other additional studies or pertinent information that lend support to this MRL: The intermediate-duration oral database for ethylbenzene is limited to a study conducted by Mellert et al. (2007) evaluating the effects of oral exposure of rats to ethylbenzene for 4 and 13 weeks, and a poorly reported 6-month
ETHYLBENZENE A-44
APPENDIX A
exposure study in rats (Wolf et al. 1956). The 4- and 13-week studies by Mellert et al. (2007) found effects consistent with hepatotoxicity including increased absolute and relative liver weights, increased incidence of hepatocyte centrilobular hypertrophy, and increased serum liver enzyme activities in rats administered ≥250 mg/kg/day. Kidney effects, including increases in increases in relative kidney weight and hyaline droplet nephropathy were observed in males administered ≥250 mg/kg/day; however, these effects were most likely secondary to increases accumulation of accumulation of α2µ-globulin accumulation, and, therefore, considered not relevant to humans. Wolf et al. (1956) also reported liver effects (characterized by cloudy swelling of parenchymal cells of the liver and an increase in liver weight were observed in female rats administered 408 mg/kg/day by gavage for 6 months (Wolf et al. 1956). No other hepatic changes were reported. However, this study was poorly reported and did not provide adequate descriptions of study methods or results.
Although no additional data are available regarding the effects of intermediate oral exposure to ethylbenzene, results of an acute-duration oral study indicate that ethylbenzene is ototoxic (Gagnaire and Langlais 2005). In male rats administered 900 mg/kg/day (the only dose tested) by gavage for 2 weeks, an almost complete loss of the three rows of OHCs in the organ of Corti was observed in male rats (Gagnaire and Langlais 2005). The 4- and 13-week oral studies by Mellert et al. (2007) did not examine the cochlea or measure auditory function.
Acute (Cappaert et al. 1999, 2000, 2001, 2002) and intermediate (Gagnaire et al. 2007) inhalation studies and an acute oral study (Gagnaire and Langlais 2005) have identified ototoxicity as a sensitive effect of ethylbenzene exposure. Although intermediate-duration oral studies have not examined this potential endpoint, a comparison of the human equivalent dose for liver effects following oral exposure and the human equivalent concentration for ototoxicity following inhalation exposure can be made using the PBPK model developed for MRL derivation. The human PBPK model predicts that the HED (10.68 mg/kg/day) would result in an internal dose of 1.92 µmol/L for MCA (the relevant internal dose metric for ototoxicicty). The HEC that corresponds to an MCA of 1.92 µmol/L is 8.37 ppm. Therefore, the HED of 10.68 mg/kg/day would be equivalent to human equivalent air concentration of 8.37 ppm. This air concentration is about 8-fold lower than the HEC of 63.64 ppm used to derive the intermediate-duration inhalation MRL, suggesting that the liver is a more sensitive target of oral toxicity than the cochlea.
Agency Contacts (Chemical Managers): Jessilynn Taylor, Henry Abadin, Heraline Hicks
B-1 ETHYLBENZENE
APPENDIX B. USER'S GUIDE
Chapter 1
Public Health Statement
This chapter of the profile is a health effects summary written in non-technical language. Its intended audience is the general public, especially people living in the vicinity of a hazardous waste site or chemical release. If the Public Health Statement were removed from the rest of the document, it would still communicate to the lay public essential information about the chemical.
The major headings in the Public Health Statement are useful to find specific topics of concern. The topics are written in a question and answer format. The answer to each question includes a sentence that will direct the reader to chapters in the profile that will provide more information on the given topic.
Chapter 2
Relevance to Public Health
This chapter provides a health effects summary based on evaluations of existing toxicologic, epidemiologic, and toxicokinetic information. This summary is designed to present interpretive, weight-of-evidence discussions for human health end points by addressing the following questions:
1. What effects are known to occur in humans?
2. What effects observed in animals are likely to be of concern to humans?
3. What exposure conditions are likely to be of concern to humans, especially around hazardous waste sites?
The chapter covers end points in the same order that they appear within the Discussion of Health Effects by Route of Exposure section, by route (inhalation, oral, and dermal) and within route by effect. Human data are presented first, then animal data. Both are organized by duration (acute, intermediate, chronic). In vitro data and data from parenteral routes (intramuscular, intravenous, subcutaneous, etc.) are also considered in this chapter.
The carcinogenic potential of the profiled substance is qualitatively evaluated, when appropriate, using existing toxicokinetic, genotoxic, and carcinogenic data. ATSDR does not currently assess cancer potency or perform cancer risk assessments. Minimal Risk Levels (MRLs) for noncancer end points (if derived) and the end points from which they were derived are indicated and discussed.
Limitations to existing scientific literature that prevent a satisfactory evaluation of the relevance to public health are identified in the Chapter 3 Data Needs section.
Interpretation of Minimal Risk Levels
Where sufficient toxicologic information is available, ATSDR has derived MRLs for inhalation and oral routes of entry at each duration of exposure (acute, intermediate, and chronic). These MRLs are not meant to support regulatory action, but to acquaint health professionals with exposure levels at which adverse health effects are not expected to occur in humans.
B-2 ETHYLBENZENE
APPENDIX B
MRLs should help physicians and public health officials determine the safety of a community living near a chemical emission, given the concentration of a contaminant in air or the estimated daily dose in water. MRLs are based largely on toxicological studies in animals and on reports of human occupational exposure.
MRL users should be familiar with the toxicologic information on which the number is based. Chapter 2, "Relevance to Public Health," contains basic information known about the substance. Other sections such as Chapter 3 Section 3.9, "Interactions with Other Substances,” and Section 3.10, "Populations that are Unusually Susceptible" provide important supplemental information.
MRL users should also understand the MRL derivation methodology. MRLs are derived using a modified version of the risk assessment methodology that the Environmental Protection Agency (EPA) provides (Barnes and Dourson 1988) to determine reference doses (RfDs) for lifetime exposure.
To derive an MRL, ATSDR generally selects the most sensitive end point which, in its best judgement, represents the most sensitive human health effect for a given exposure route and duration. ATSDR cannot make this judgement or derive an MRL unless information (quantitative or qualitative) is available for all potential systemic, neurological, and developmental effects. If this information and reliable quantitative data on the chosen end point are available, ATSDR derives an MRL using the most sensitive species (when information from multiple species is available) with the highest no-observed-adverse-effect level (NOAEL) that does not exceed any adverse effect levels. When a NOAEL is not available, a lowest-observed-adverse-effect level (LOAEL) can be used to derive an MRL, and an uncertainty factor (UF) of 10 must be employed. Additional uncertainty factors of 10 must be used both for human variability to protect sensitive subpopulations (people who are most susceptible to the health effects caused by the substance) and for interspecies variability (extrapolation from animals to humans). In deriving an MRL, these individual uncertainty factors are multiplied together. The product is then divided into the inhalation concentration or oral dosage selected from the study. Uncertainty factors used in developing a substance-specific MRL are provided in the footnotes of the levels of significant exposure (LSE) tables.
Chapter 3
Health Effects
Tables and Figures for Levels of Significant Exposure (LSE)
Tables and figures are used to summarize health effects and illustrate graphically levels of exposure associated with those effects. These levels cover health effects observed at increasing dose concentrations and durations, differences in response by species, MRLs to humans for noncancer end points, and EPA's estimated range associated with an upper- bound individual lifetime cancer risk of 1 in 10,000 to 1 in 10,000,000. Use the LSE tables and figures for a quick review of the health effects and to locate data for a specific exposure scenario. The LSE tables and figures should always be used in conjunction with the text. All entries in these tables and figures represent studies that provide reliable, quantitative estimates of NOAELs, LOAELs, or Cancer Effect Levels (CELs).
The legends presented below demonstrate the application of these tables and figures. Representative examples of LSE Table 3-1 and Figure 3-1 are shown. The numbers in the left column of the legends correspond to the numbers in the example table and figure.
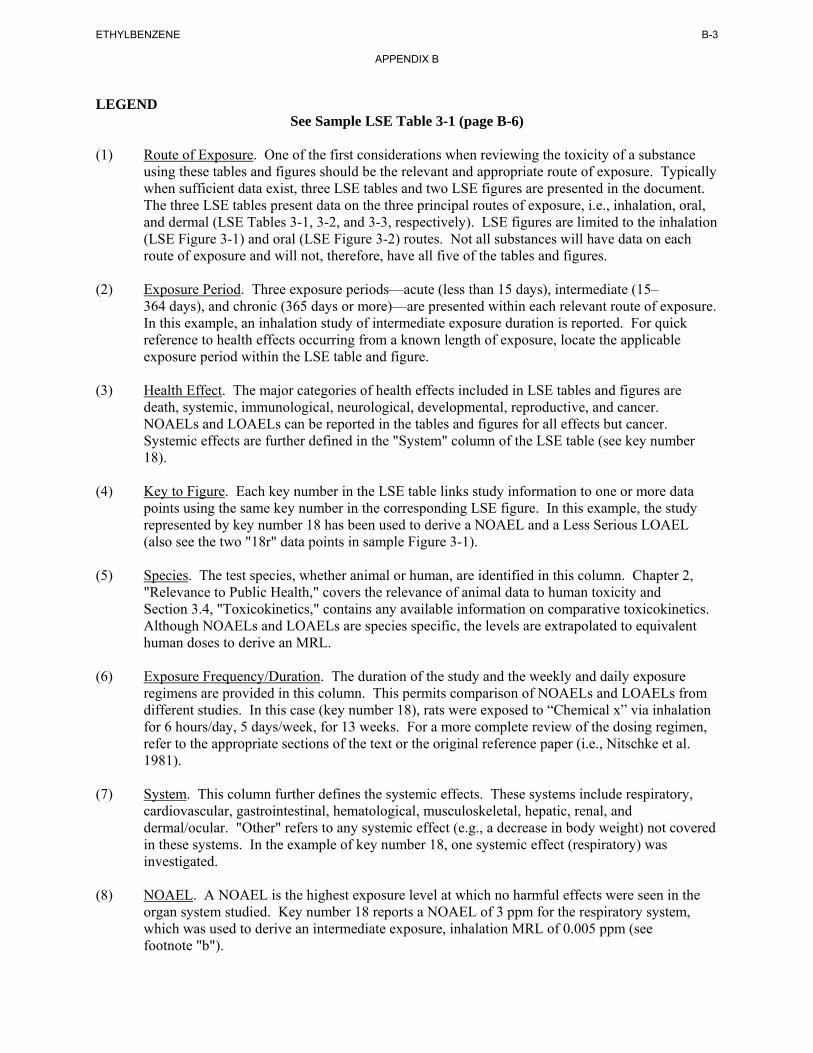
B-3 ETHYLBENZENE
APPENDIX B
LEGEND See Sample LSE Table 3-1 (page B-6)
(1) Route of Exposure. One of the first considerations when reviewing the toxicity of a substance using these tables and figures should be the relevant and appropriate route of exposure. Typically when sufficient data exist, three LSE tables and two LSE figures are presented in the document. The three LSE tables present data on the three principal routes of exposure, i.e., inhalation, oral, and dermal (LSE Tables 3-1, 3-2, and 3-3, respectively). LSE figures are limited to the inhalation (LSE Figure 3-1) and oral (LSE Figure 3-2) routes. Not all substances will have data on each route of exposure and will not, therefore, have all five of the tables and figures.
(2) Exposure Period. Three exposure periods—acute (less than 15 days), intermediate (15– 364 days), and chronic (365 days or more)—are presented within each relevant route of exposure. In this example, an inhalation study of intermediate exposure duration is reported. For quick reference to health effects occurring from a known length of exposure, locate the applicable exposure period within the LSE table and figure.
(3) Health Effect. The major categories of health effects included in LSE tables and figures are death, systemic, immunological, neurological, developmental, reproductive, and cancer. NOAELs and LOAELs can be reported in the tables and figures for all effects but cancer. Systemic effects are further defined in the "System" column of the LSE table (see key number 18).
(4) Key to Figure. Each key number in the LSE table links study information to one or more data points using the same key number in the corresponding LSE figure. In this example, the study represented by key number 18 has been used to derive a NOAEL and a Less Serious LOAEL (also see the two "18r" data points in sample Figure 3-1).
(5) Species. The test species, whether animal or human, are identified in this column. Chapter 2, "Relevance to Public Health," covers the relevance of animal data to human toxicity and Section 3.4, "Toxicokinetics," contains any available information on comparative toxicokinetics. Although NOAELs and LOAELs are species specific, the levels are extrapolated to equivalent human doses to derive an MRL.
(6) Exposure Frequency/Duration. The duration of the study and the weekly and daily exposure regimens are provided in this column. This permits comparison of NOAELs and LOAELs from different studies. In this case (key number 18), rats were exposed to “Chemical x” via inhalation for 6 hours/day, 5 days/week, for 13 weeks. For a more complete review of the dosing regimen, refer to the appropriate sections of the text or the original reference paper (i.e., Nitschke et al. 1981).
(7) System. This column further defines the systemic effects. These systems include respiratory, cardiovascular, gastrointestinal, hematological, musculoskeletal, hepatic, renal, and dermal/ocular. "Other" refers to any systemic effect (e.g., a decrease in body weight) not covered in these systems. In the example of key number 18, one systemic effect (respiratory) was investigated.
(8) NOAEL. A NOAEL is the highest exposure level at which no harmful effects were seen in the organ system studied. Key number 18 reports a NOAEL of 3 ppm for the respiratory system, which was used to derive an intermediate exposure, inhalation MRL of 0.005 ppm (see footnote "b").
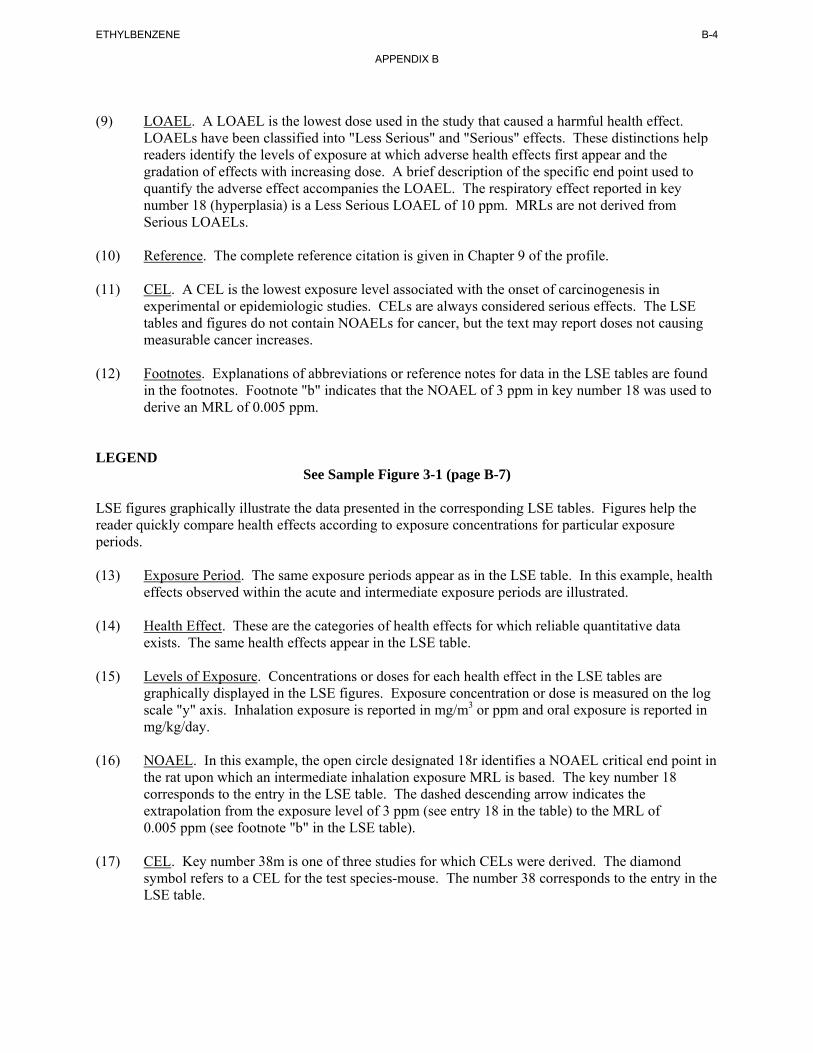
B-4 ETHYLBENZENE
APPENDIX B
(9) LOAEL. A LOAEL is the lowest dose used in the study that caused a harmful health effect. LOAELs have been classified into "Less Serious" and "Serious" effects. These distinctions help readers identify the levels of exposure at which adverse health effects first appear and the gradation of effects with increasing dose. A brief description of the specific end point used to quantify the adverse effect accompanies the LOAEL. The respiratory effect reported in key number 18 (hyperplasia) is a Less Serious LOAEL of 10 ppm. MRLs are not derived from Serious LOAELs.
(10) Reference. The complete reference citation is given in Chapter 9 of the profile.
(11) CEL. A CEL is the lowest exposure level associated with the onset of carcinogenesis in experimental or epidemiologic studies. CELs are always considered serious effects. The LSE tables and figures do not contain NOAELs for cancer, but the text may report doses not causing measurable cancer increases.
(12) Footnotes. Explanations of abbreviations or reference notes for data in the LSE tables are found in the footnotes. Footnote "b" indicates that the NOAEL of 3 ppm in key number 18 was used to derive an MRL of 0.005 ppm.
LEGEND See Sample Figure 3-1 (page B-7)
LSE figures graphically illustrate the data presented in the corresponding LSE tables. Figures help the reader quickly compare health effects according to exposure concentrations for particular exposure periods.
(13) Exposure Period. The same exposure periods appear as in the LSE table. In this example, health effects observed within the acute and intermediate exposure periods are illustrated.
(14) Health Effect. These are the categories of health effects for which reliable quantitative data exists. The same health effects appear in the LSE table.
(15) Levels of Exposure. Concentrations or doses for each health effect in the LSE tables are graphically displayed in the LSE figures. Exposure concentration or dose is measured on the log scale "y" axis. Inhalation exposure is reported in mg/m3 or ppm and oral exposure is reported in mg/kg/day.
(16) NOAEL. In this example, the open circle designated 18r identifies a NOAEL critical end point in the rat upon which an intermediate inhalation exposure MRL is based. The key number 18 corresponds to the entry in the LSE table. The dashed descending arrow indicates the extrapolation from the exposure level of 3 ppm (see entry 18 in the table) to the MRL of 0.005 ppm (see footnote "b" in the LSE table).
(17) CEL. Key number 38m is one of three studies for which CELs were derived. The diamond symbol refers to a CEL for the test species-mouse. The number 38 corresponds to the entry in the LSE table.

B-5 ETHYLBENZENE
APPENDIX B
(18) Estimated Upper-Bound Human Cancer Risk Levels. This is the range associated with the upper-bound for lifetime cancer risk of 1 in 10,000 to 1 in 10,000,000. These risk levels are derived from the EPA's Human Health Assessment Group's upper-bound estimates of the slope of the cancer dose response curve at low dose levels (q1*).
(19) Key to LSE Figure. The Key explains the abbreviations and symbols used in the figure.
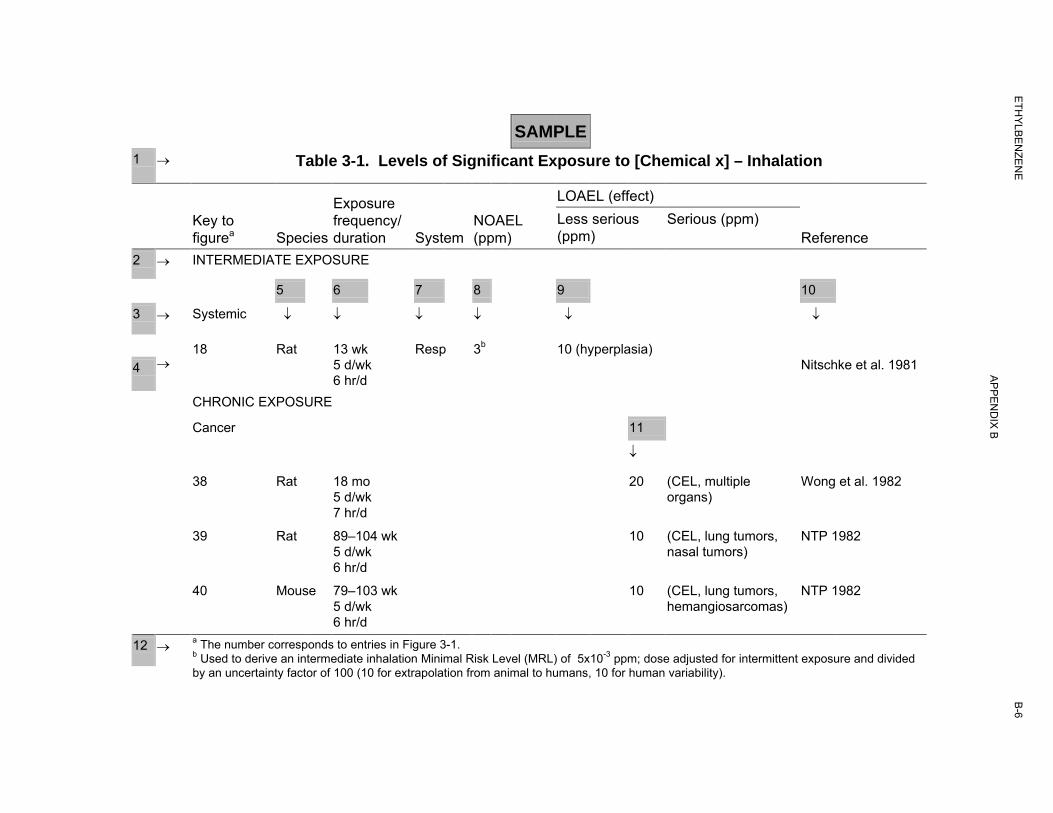
B-6
SAMPLE
1 → Table 3-1. Levels of Significant Exposure to [Chemical x] – Inhalation
LOAEL (effect) Exposure Key to frequency/ NOAEL Less serious Serious (ppm) figurea Species duration System (ppm) (ppm) Reference
2
3
4
→ INTERMEDIATE EXPOSURE
5 6 7 8 9 10
→ Systemic ↓ ↓ ↓ ↓ ↓ ↓
18 Rat 13 wk Resp 3b 10 (hyperplasia) → 5 d/wk Nitschke et al. 1981
6 hr/d CHRONIC EXPOSURE
Cancer 11
↓
38 Rat 18 mo 20 (CEL, multiple Wong et al. 1982 5 d/wk organs) 7 hr/d
39 Rat 89–104 wk 10 (CEL, lung tumors, NTP 1982 5 d/wk nasal tumors) 6 hr/d
40 Mouse 79–103 wk 10 (CEL, lung tumors, NTP 1982 5 d/wk hemangiosarcomas) 6 hr/d
12 → a The number corresponds to entries in Figure 3-1. b Used to derive an intermediate inhalation Minimal Risk Level (MRL) of 5x10⁻³ ppm; dose adjusted for intermittent exposure and divided by an uncertainty factor of 100 (10 for extrapolation from animal to humans, 10 for human variability).
ETH
YLBE
NZE
NE
AP
PE
ND
IX B
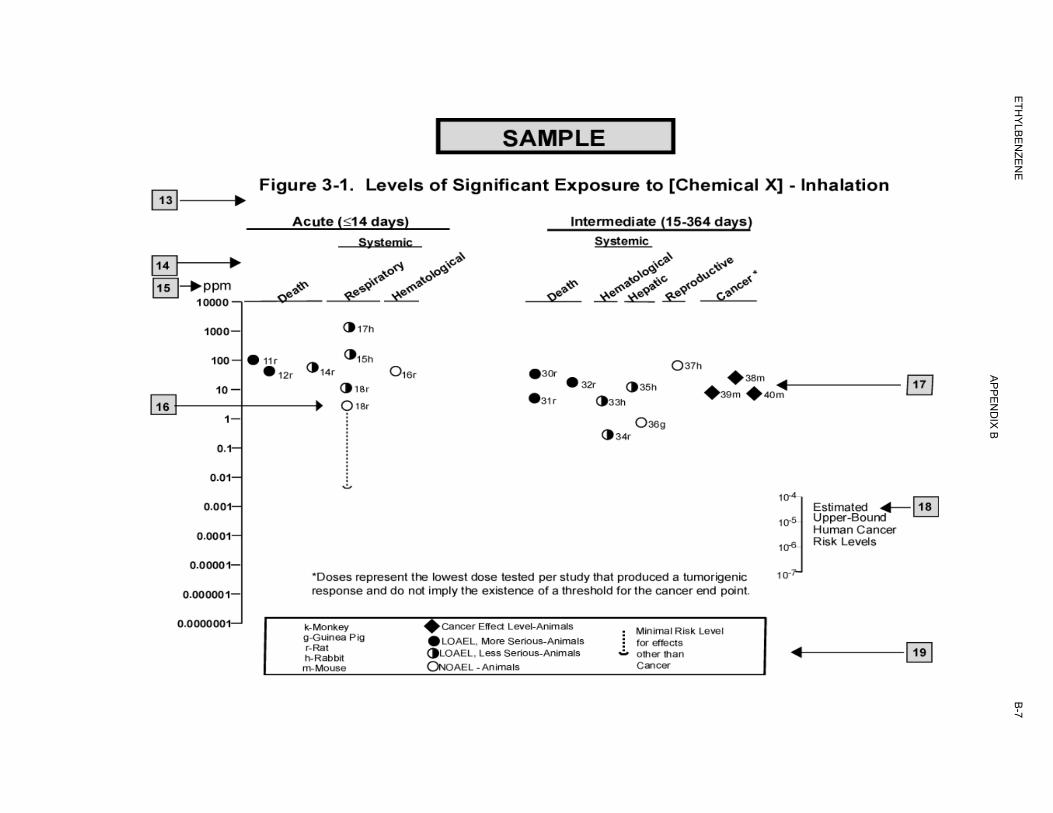
B-7
ETH
YLBE
NZE
NE
AP
PE
ND
IX B

B-8 ETHYLBENZENE
APPENDIX B
This page is intentionally blank.
C-1 ETHYLBENZENE
APPENDIX C. ACRONYMS, ABBREVIATIONS, AND SYMBOLS
ACGIH American Conference of Governmental Industrial Hygienists ACOEM American College of Occupational and Environmental Medicine ADI acceptable daily intake ADME absorption, distribution, metabolism, and excretion AED atomic emission detection AFID alkali flame ionization detector AFOSH Air Force Office of Safety and Health ALT alanine aminotransferase AML acute myeloid leukemia AOAC Association of Official Analytical Chemists AOEC Association of Occupational and Environmental Clinics AP alkaline phosphatase APHA American Public Health Association AST aspartate aminotransferase atm atmosphere ATSDR Agency for Toxic Substances and Disease Registry AWQC Ambient Water Quality Criteria BAT best available technology BCF bioconcentration factor BEI Biological Exposure Index BMD/C benchmark dose or benchmark concentration BMDX dose that produces a X% change in response rate of an adverse effect BMDLX 95% lower confidence limit on the BMDX BMDS Benchmark Dose Software BMR benchmark response BSC Board of Scientific Counselors C centigrade CAA Clean Air Act CAG Cancer Assessment Group of the U.S. Environmental Protection Agency CAS Chemical Abstract Services CDC Centers for Disease Control and Prevention CEL cancer effect level CELDS Computer-Environmental Legislative Data System CERCLA Comprehensive Environmental Response, Compensation, and Liability Act CFR Code of Federal Regulations Ci curie CI confidence interval CL ceiling limit value CLP Contract Laboratory Program cm centimeter CML chronic myeloid leukemia CPSC Consumer Products Safety Commission CWA Clean Water Act DHEW Department of Health, Education, and Welfare DHHS Department of Health and Human Services DNA deoxyribonucleic acid DOD Department of Defense DOE Department of Energy DOL Department of Labor
C-2 ETHYLBENZENE
APPENDIX C
DOT Department of Transportation DOT/UN/ Department of Transportation/United Nations/
NA/IMDG North America/Intergovernmental Maritime Dangerous Goods Code DWEL drinking water exposure level ECD electron capture detection ECG/EKG electrocardiogram EEG electroencephalogram EEGL Emergency Exposure Guidance Level EPA Environmental Protection Agency F Fahrenheit F1 first-filial generation FAO Food and Agricultural Organization of the United Nations FDA Food and Drug Administration FEMA Federal Emergency Management Agency FIFRA Federal Insecticide, Fungicide, and Rodenticide Act FPD flame photometric detection fpm feet per minute FR Federal Register FSH follicle stimulating hormone g gram GC gas chromatography gd gestational day GLC gas liquid chromatography GPC gel permeation chromatography HPLC high-performance liquid chromatography HRGC high resolution gas chromatography HSDB Hazardous Substance Data Bank IARC International Agency for Research on Cancer IDLH immediately dangerous to life and health ILO International Labor Organization IRIS Integrated Risk Information System Kd adsorption ratio kg kilogram kkg metric ton Koc organic carbon partition coefficient Kow octanol-water partition coefficient L liter LC liquid chromatography LC50 lethal concentration, 50% kill LCLo lethal concentration, low LD50 lethal dose, 50% kill LDLo lethal dose, low LDH lactic dehydrogenase LH luteinizing hormone LOAEL lowest-observed-adverse-effect level LSE Levels of Significant Exposure LT50 lethal time, 50% kill m meter MA trans,trans-muconic acid MAL maximum allowable level mCi millicurie
C-3 ETHYLBENZENE
APPENDIX C
MCL maximum contaminant level MCLG maximum contaminant level goal MF modifying factor MFO mixed function oxidase mg milligram mL milliliter mm millimeter mmHg millimeters of mercury mmol millimole mppcf millions of particles per cubic foot MRL Minimal Risk Level MS mass spectrometry NAAQS National Ambient Air Quality Standard NAS National Academy of Science NATICH National Air Toxics Information Clearinghouse NATO North Atlantic Treaty Organization NCE normochromatic erythrocytes NCEH National Center for Environmental Health NCI National Cancer Institute ND not detected NFPA National Fire Protection Association ng nanogram NHANES National Health and Nutrition Examination Survey NIEHS National Institute of Environmental Health Sciences NIOSH National Institute for Occupational Safety and Health NIOSHTIC NIOSH's Computerized Information Retrieval System NLM National Library of Medicine nm nanometer nmol nanomole NOAEL no-observed-adverse-effect level NOES National Occupational Exposure Survey NOHS National Occupational Hazard Survey NPD nitrogen phosphorus detection NPDES National Pollutant Discharge Elimination System NPL National Priorities List NR not reported NRC National Research Council NS not specified NSPS New Source Performance Standards NTIS National Technical Information Service NTP National Toxicology Program ODW Office of Drinking Water, EPA OERR Office of Emergency and Remedial Response, EPA OHM/TADS Oil and Hazardous Materials/Technical Assistance Data System OPP Office of Pesticide Programs, EPA OPPT Office of Pollution Prevention and Toxics, EPA OPPTS Office of Prevention, Pesticides and Toxic Substances, EPA OR odds ratio OSHA Occupational Safety and Health Administration OSW Office of Solid Waste, EPA OTS Office of Toxic Substances
C-4 ETHYLBENZENE
APPENDIX C
OW Office of Water OWRS Office of Water Regulations and Standards, EPA PAH polycyclic aromatic hydrocarbon PBPD physiologically based pharmacodynamic PBPK physiologically based pharmacokinetic PCE polychromatic erythrocytes PEL permissible exposure limit pg picogram PHS Public Health Service PID photo ionization detector pmol picomole PMR proportionate mortality ratio ppb parts per billion ppm parts per million ppt parts per trillion PSNS pretreatment standards for new sources RBC red blood cell REL recommended exposure level/limit RfC reference concentration RfD reference dose RNA ribonucleic acid RQ reportable quantity RTECS Registry of Toxic Effects of Chemical Substances SARA Superfund Amendments and Reauthorization Act SCE sister chromatid exchange SGOT serum glutamic oxaloacetic transaminase SGPT serum glutamic pyruvic transaminase SIC standard industrial classification SIM selected ion monitoring SMCL secondary maximum contaminant level SMR standardized mortality ratio SNARL suggested no adverse response level SPEGL Short-Term Public Emergency Guidance Level STEL short term exposure limit STORET Storage and Retrieval TD50 toxic dose, 50% specific toxic effect TLV threshold limit value TOC total organic carbon TPQ threshold planning quantity TRI Toxics Release Inventory TSCA Toxic Substances Control Act TWA time-weighted average UF uncertainty factor U.S. United States USDA United States Department of Agriculture USGS United States Geological Survey VOC volatile organic compound WBC white blood cell WHO World Health Organization
C-5 ETHYLBENZENE
APPENDIX C
> greater than ≥ greater than or equal to = equal to < less than ≤ less than or equal to % percent α alpha β beta γ gamma δ delta μm micrometer μg microgram q1
* cancer slope factor – negative + positive (+) weakly positive result (–) weakly negative result

C-6 ETHYLBENZENE
APPENDIX C
This page is intentionally blank.
D-1 ETHYLBENZENE
APPENDIX D. INDEX
absorbed dose........................................................................................ 96, 98, 101, 103, 118, 121, 124, 129 acetylcholine ............................................................................................................................................. 123 acetylcholinesterase .................................................................................................................................. 124 adenocarcinoma ........................................................................................................................................ 123 adipose tissue .............................................................................................................. 95, 141, 169, 196, 202 adsorbed .................................................................................................................................... 168, 191, 208 adsorption...................................................................................................................................... 9, 161, 202 aerobic........................................................................................................................... 9, 159, 173, 174, 175 alanine aminotransferase (see ALT) ............................................................... 11, 27, 28, 29, 30, 31, 81, 137 ALT (see alanine aminotransferase) ........................................................................................................... 28 ambient air .............................................................................................................. 9, 10, 130, 177, 178, 185 anaerobic ................................................................................................................... 159, 161, 173, 174, 175 bioaccumulation........................................................................................................................ 169, 188, 195 bioavailability ........................................................................................................... 168, 169, 191, 195, 198 bioconcentration factor ............................................................................................................................. 169 biodegradation................................................................................................... 144, 159, 170, 173, 174, 175 biomarker .................................................................................. 128, 129, 130, 140, 141, 143, 199, 210, 212 body weight effects ..................................................................................................................................... 65 breast milk..................................................................................... 5, 127, 143, 169, 188, 190, 191, 196, 197 cancer ........................................................................................................................ 4, 14, 72, 110, 117, 127 carcinogen........................................................................................................................................... 14, 219 carcinogenic .......................................................................................... 14, 16, 32, 33, 73, 84, 123, 137, 219 carcinogenicity................................................................................................ 14, 73, 84, 122, 123, 137, 219 carcinoma.............................................................................................................................................. 23, 73 carcinomas ............................................................................................................................................ 63, 74 cardiovascular ........................................................................................................................... 35, 60, 74, 84 cardiovascular effects............................................................................................................................ 60, 81 chromosomal aberrations ...................................................................................................................... 87, 91 clearance ..................................................................................................................... 92, 102, 107, 115, 122 death................................................................................................................................ 4, 33, 34, 35, 74, 84 deoxyribonucleic acid (see DNA)............................................................................................................... 88 dermal effects........................................................................................................................................ 35, 85 developmental effects ................................................................................. 13, 70, 72, 84, 87, 127, 139, 143 DNA (see deoxyribonucleic acid)....................................................................... 63, 87, 88, 90, 91, 129, 138 dopamine................................................................................................................................................... 123 elimination half-time......................................................................................................................... 102, 122 elimination rate ................................................................................................................................. 100, 102 endocrine................................................................................................................... 35, 65, 74, 84, 125, 126 endocrine effects ......................................................................................................................................... 65 estrogenic .................................................................................................................................................. 126 fetus........................................................................................................................................................... 126 gastrointestinal effects ................................................................................................................................ 60 general population............................................................................... 10, 161, 187, 193, 196, 197, 210, 212 genotoxic................................................................................................................................. 33, 87, 91, 138 genotoxicity................................................................................................................................... 87, 91, 138 germinal epithelium .................................................................................................................................... 69 groundwater .................2, 3, 10, 142, 144, 159, 161, 166, 167, 168, 173, 175, 182, 183, 184, 187, 193, 196 growth retardation....................................................................................................................................... 72 half-life............................................................................................................ 9, 92, 102, 128, 159, 167, 170
D-2 ETHYLBENZENE
APPENDIX D
hematological effects .................................................................................... 11, 60, 61, 66, 72, 81, 136, 137 hepatic effects ............................................................................................................. 29, 61, 62, 81, 82, 130 hydrolysis.................................................................................................................................................. 170 hydroxyl radical .................................................................................................................... 9, 159, 167, 169 immune system ......................................................................................................................................... 139 immunological ........................................................................................................................ 33, 66, 82, 139 Kow .................................................................................................................................... 120, 149, 168, 169 LD50....................................................................................................................................................... 74, 84 lymphoreticular ........................................................................................................................................... 66 metabolic effects ............................................................................................................................. 35, 74, 84 micronuclei ................................................................................................................................... 87, 91, 138 milk ......................................................... 5, 94, 127, 130, 143, 144, 169, 188, 190, 191, 196, 197, 200, 202 musculoskeletal effects ............................................................................................................................... 61 neonatal ............................................................................................................................................. 124, 191 neoplasm ..................................................................................................................................................... 14 neoplastic .................................................................................................................................................... 73 neurobehavioral......................................................................................................................................... 125 neurodevelopmental .................................................................................................................................. 139 neurological effects ........................................................................................... 66, 68, 83, 87, 122, 130, 140 neurophysiological ...................................................................................................................................... 21 nuclear......................................................................................................................................................... 64 ocular effects................................................................................................................................... 14, 65, 85 partition coefficients ........................................................................... 92, 107, 108, 113, 114, 116, 121, 122 pharmacodynamic ..................................................................................................................................... 104 pharmacokinetic.................................................................. 18, 104, 105, 106, 124, 126, 127, 141, 143, 191 photolysis .............................................................................................................................. 9, 159, 170, 173 placenta ............................................................................................................................................. 127, 143 rate constant ...................................................................................................... 102, 109, 111, 118, 120, 169 renal effects..................................................................................................................................... 27, 63, 82 reproductive effects..................................................................................... 13, 69, 70, 83, 87, 134, 136, 138 respiratory effects............................................................................................................................ 13, 59, 74 retention .......................................................................................................................................... 92, 93, 95 salivation......................................................................................................................................... 11, 27, 68 solubility ................................................................................................................................................... 168 systemic effects............................................................................................................. 14, 35, 59, 74, 84, 85 thyroid..................................................................................................................................... 23, 35, 65, 137 toxicokinetic................................................................................................................................................ 33 tumors ................................................................................................................... 4, 14, 63, 73, 84, 138, 143 vapor phase ....................................................................................................................... 151, 159, 167, 170 vapor pressure ....................................................................................................................... 9, 167, 191, 195 volatilization ................................................................................................................. 9, 161, 167, 173, 175 weanlings .................................................................................................................................................... 94