Embed Size (px)
Citation preview

1
Toy-Related Deaths and Injuries
Calendar Year 2012
Yongling Tu
Division of Hazard Analysis
Directorate for Epidemiology
U.S. Consumer Product Safety Commission
4330 East West Highway
Bethesda, MD 20814
November 2013
This analysis was prepared by CPSC staff. It has not been reviewed or approved by, and may not
necessarily reflect the views of, the Commission.
CPSC Hotline: 1-800-638-CPSC (2772) CPSC’s website: http://www.cpsc.gov

2
Table of Contents
Executive Summary 3
Introduction 4
Toy-Related Deaths 4
Table 1: Reported Toy-Related Deaths Among Children Younger than 15 Years of Age,
2010–2012 5
Table 2: Reported Toy-Related Deaths Among Children Younger than 15 Years of Age,
2012 6
Estimated Toy-Related Injuries 8
Table 3: Annual Toy-Related Emergency Department-Treated Injury Estimates,
2008–2012 8
Figure 1: Distribution of Toy-Related Injury Estimates by Body Regions Injured
for All Ages, 2012 9
Figure 2: Distribution of Toy-Related Injury Estimates by Type of Injuries
for All Ages, 2012 9
Table 4: Toy Categories Associated with the Largest Number of Estimated Emergency
Department-Treated Injuries for Different Age Groups, 2012 10
Table 5: Nonmotorized Scooter-Related Emergency Department-Treated Injury
Estimates for Children of Different Age Groups, 2008–2012 11
Table 6: Annual Emergency Department-Treated Injury Estimates Associated with
Product Code, “Toys, Not Elsewhere Classified,” for Different Age Groups,
2010–2012 12
Table 7: Annual Emergency Department-Treated Injury Estimates Associated with
Product Code, “Toys, Not Specified,” for Different Age Groups,
2010–2012 12
Table 8: Toy-Related Injury Estimates Adjusted for the Correction Factor for
Different Age Groups and Toy Categories Associated with the Most Adjusted
Estimated Injuries, 2012 13
Appendix A: Estimated Number of Toy-Related Injuries from 1998 through 2012 14
Table 9: Toy-Related Emergency Department-Treated Injury Estimates for Different
Age Groups, 1998–2012 15
Figure 3: Toy-Related Emergency Department-Treated Injury Estimates for Different
Age Groups, 1998–2012 16
Appendix B: NEISS Product Codes for Toys as of January 1, 2012 17

3
Executive Summary
In this report, U.S. Consumer Product Safety Commission (CPSC) staff presents the latest available
statistics on deaths and emergency department-treated injuries associated with toys. For toy-related deaths
and injuries, it is important to note that although a toy was associated with many of the incidents, the toy
was not necessarily the cause of the death or injury.
Reported Fatalities in Calendar Year 2012
CPSC staff received 11 reports of toy-related deaths that occurred in the 2012 calendar year
among children younger than 15 years old. Moreover, all 11 victims were younger than 12 years
of age.
Balloons were associated with two (18 percent) of the 11 reported deaths in 2012.
In 2012, most toy-related deaths were due to drowning (5 deaths) and asphyxiation/aspiration (3
deaths).
Emergency Department-Treated Injuries in Calendar Year 2012
In 2012, there were an estimated 265,000 toy-related injuries treated in U.S. hospital emergency
departments.
There is not a statistically significant trend in the estimated toy-related injuries from 2008 to
2012, for all individuals, children younger than 15 years, children 12 years of age or younger, or
children younger than five years.
A plurality (43 percent) of the estimated emergency department-treated injuries is classified as
lacerations, contusions, or abrasions. Forty-five percent of the estimated injuries were to the head
and face area, the most commonly affected area of the body.
Males accounted for 154,500 (58 percent) of the estimated toy-related injuries in 2012.
Ninety-six percent of the emergency department-treated, toy-related injury victims were treated
and released.
Of the 265,000 estimated toy-related, emergency department-treated injuries, an estimated
192,000 (72 percent) happened to children younger than 15 years of age; an estimated 181,600
(69 percent) occurred to children 12 years of age or younger; while an estimated 89,500 (34
percent) happened to children younger than five years of age.
For children 12 years or younger or children younger than 15 years old, nonmotorized scooters
continued to be the category of toys associated with the most injuries (26 percent and 27 percent,
respectively) in 2012. There is no statistically significant trend in the estimated injuries associated
with nonmotorized scooters in the last five years for children in these two age groups.

4
Introduction
This report provides updated summary information on toy-related fatalities for the years 2010 and 2011,
and it gives detailed information on toy-related fatalities for 2012. These fatality counts are based on
reports obtained by CPSC staff from the CPSC Injury and Potential Injury Incident file (IPII), Death
Certificate File (DTHS), In-Depth Investigations (INDP), and the National Electronic Injury Surveillance
System (NEISS). In addition, this report presents the estimated emergency department-treated injuries
associated with toys for the 2012 calendar year and the injury estimates from 2008 to 2012, based on the
NEISS. In Appendix A, historical estimated toy-related emergency department-treated injuries from 1998
to 2012 are given, along with their 95 percent confidence intervals. Appendix B lists the NEISS product
codes used to generate this report.
Toy-Related Deaths1
Fatalities for children younger than 15 years of age, as reported to CPSC staff from 2010 to 2012, are
summarized in Table 1. The reported death totals for each year are listed at the top of the table, with each
year’s reported deaths detailed by the type of toy with a parenthetical description of the hazard in the rows
below. The data from 2011 have been updated with four new incident reports received by CPSC staff;
thus, they differ from the reported fatality tabulations detailed in the previous memo for the calendar year
2011.2 No new toy-related fatality reports were received for 2010. All of the four fatalities that occurred
in 2011 but reported in 2012 involved children 12 years of age or younger. Two of these fatalities
involved balloons. The other two were associated with a crayon, an unspecified toy and playdough. Toys
that are associated with more than one fatality between 2010 and 2012 are listed in the table to highlight
the toys (and associated hazards). For other types of toys associated with only one fatality across the
given years, the information is summarized in the final row of the table. Fatalities are included where a
toy was present and, based on statements by investigators, police, family members, or medical examiners,
may have played a contributing role in the death.
1 These fatalities do not represent a sample of known probability of selection. They may not include all of the toy-related deaths that occurred
during the time period, in part, because at the time of data extraction, death certificate reporting was 92 percent, 76 percent, and 38 percent
complete for 2010, 2011, and 2012, respectively. 2 Y.Tu, “Toy-Related Deaths and Injuries, Calendar Year 2011,” CPSC, November 2012.

5
Table 1: Reported Toy-Related Deaths Among Children Younger Than 15 Years of Age
2010–20123
Type of Toy (Hazard)
2010 20114 2012
Children 12 Years of Age or Younger
Children 13 and 14 Years
of Age
Children 12 Years of Age or Younger
Children 13 and 14 Years
of Age
Children 12 Years of Age or Younger
Children 13 and 14 Years
of Age
TOTAL 19 17 11
Sub Total 19 0 16 1 11 0
Balloons (airway obstruction, aspiration, asphyxiation) 5 5 2
Tricycles (drowning, fall) 2 5
Nonmotorized scooters (motor vehicle involvement) 1 1 1 2
Stuffed toys/doll/doll accessory (choking, strangulation, suffocation)
2 1
Balls, other (drowning) 2 1
Toy boxes (entrapment, drowning, hanging) 2 1
Rubber balls/other small ball (airway obstruction, choking) 3
Inflatable toys other than balloons (drowning, fall) 1 1
Other toys with a single reported fatality in the year (asphyxiation, drowning, choking)
3 5 1
Source: In-Depth Investigations (INDP), Injury and Potential Injury Incidents (IPII), Death Certificates (DTHS), and the National Electronic Injury Surveillance System (NEISS) from 1/1/2010 to 12/31/2012;
CPSC. Data was extracted in July 2013.
3 Toy-related deaths among children 12 years of age or younger are presented to be consistent with the age definition for a children’s product in the Consumer Product Safety Improvement Act of 2008 (CPSIA), 15 U.S.C.
§ 2052 (a) (2). 4 Four new toy-related deaths were reported to CPSC staff occurring in the 2011 calendar year, increasing the number of reported deaths to 17 in 2011. No additional toy-related fatalities from 2010 were reported to CPSC
staff in 2012.

6
Table 2 details the fatalities associated with toys for children younger than 15 years of age in 2012 that
were reported to CPSC staff. The toy types and associated hazards involved in these reported fatalities are
presented in descending order of the frequency of reports. There is one toy (toy bowling pins) in Table 2,
which was associated with one death that is included in the last row of Table 1 with “other toys.” There is
another toy (stuffed animal) that was associated with a single death in 2012; however, because it was
associated with other deaths in 2010, it is presented in the row for stuffed toys on Table 1 to highlight the
hazard.
As shown in Table 2, seven fatalities (64 percent) of children younger than 15 years of age in 2012 were
associated with riding toys (i.e., tricycles and nonmotorized scooters), which involved drowning, injuries
from a fall, or motor vehicles. Three of the 11 (27 percent) reported toy-related deaths in 2012 involved
asphyxiation, suffocation, or aspiration, and they were associated with balloons and a stuffed animal.
Table 2: Reported Toy-Related Deaths Among Children Younger Than 15 Years of Age
2012
Type of Toys Children 12 Years of Age or Younger
¥
Children 13 and 14 Years
of Age
TOTAL 11
Sub Total 11 0
Tricycles (drowning, fall) 5
Nonmotorized scooters (motor vehicle involvement)
2
Balloons (asphyxiation, aspiration) 2
Stuffed animal (suffocation) 1
Toy bowling pins (drowning) 1
Source: INDP, IPII, DTHS, and NEISS from 1/1/2012 to 12/31/2012; CPSC. Data was extracted in July 2013. ¥
Toy-related deaths among children 12 years of age or younger are presented to be consistent with the age definition for a children’s
product in the Consumer Product Safety Improvement Act of 2008 (CPSIA), 15 U.S.C. § 2052 (a) (2).
In 2012, there were 11 reported deaths related to toys. Of the 11 fatalities, five victims were females, and
six were males. The age range for the 11 reported deaths is six months to seven years. The scenario-
specific details of some of these incidents are described below.
Tricycles
Five victims—one female and four males, ages of 12 months to three years—died when falls from
tricycles resulted in drowning or fatal injuries in 2012.
A three-year-old girl was found floating face down in a residential in-ground pool, and her tricycle was
also in the pool. The medical examiner’s report stated that the victim likely tipped over into the pool
when the tricycle’s wheels went off the rim. A two-year-old boy was found floating face down in a
backyard pool and his tricycle was inside the pool upside down lying on the step of the pool per the police
report. The victim was transported to a local hospital where he was pronounced dead. The police believed
that the victim fell into the pool while riding his tricycle. Another two-year-old boy was pulled from a
residential in-ground pool by his mother. The mother was looking for the victim and noticed his tricycle

7
was in the pool upside down, and she looked into the pool and found the victim in the pool. The victim
was pronounced dead four days later in a hospital. The fourth victim was also a two-year-old boy.
According to the medical examiner’s report, he fell into an in-ground pool while riding a toy tricycle and
died from the complications of drowning two months later at home under hospice care.
A 12-month-old boy was riding a tricycle in “circles” on the concrete pavement of his driveway under the
supervision of his mother. For unknown reasons the tricycle and the victim “toppled over” causing the
victim and the tricycle to fall forward. The victim’s head struck the pavement and was observed by his
mother to have an open wound. The victim was unconscious and transported by an ambulance to a
hospital where he was pronounced dead.
Nonmotorized Scooters
There were two deaths associated with nonmotorized scooters. A six-year-old boy was struck by a truck
while crossing a highway between school and his home on a scooter, and he died at the scene according to
the state police. A seven-year-old boy rode down a hill on his scooter and passed into an intersection of
roads where he struck the front right side of a passing passenger car according to the medical examiner’s
report. The victim died of a traumatic brain injury.
Balloons
There were two fatalities involving balloons in 2012. A six-month-old girl ingested a small rubber
balloon and died of asphyxia due to airway obstruction. A seven-month-old girl died in a hospital 17 days
after inhaling an un-inflated latex balloon at her home.
Stuffed Animal
A seven-month-old girl was found unresponsive in her crib with the right side of her face against a stuffed
animal. She died of asphyxia by suffocation per the medical examiner.
Toy Bowling Pins
A 15-month-old girl drowned in a plastic 5-gallon bucket containing “mop water” that was 3.5 inches
deep. It was surmised that the victim found the bucket with two toy bowling pins in it and was reaching
down into the bucket when she lost her balance and fell head first into the water, according to the police
report.

8
Estimated Toy-Related Injuries56
In 2012, there were an estimated 265,000 toy-related injuries for all ages treated in U.S. hospital
emergency departments. These injuries were related to, but not necessarily caused by, toys. There is not a
statistically significant trend in the estimated annual toy-related emergency departed-treated injuries from
2008 to 2012, for all ages.6 Moreover, for children younger than 15 years of age, children 12 years of age
or younger, and children younger than five years of age, there is not a statistically significant trend during
the same time period. Table 3 displays the annual injury estimates across these four age groups from 2008
to 2012. For additional historical estimates, refer to the attached Appendix A.
Table 3: Annual Toy-Related Emergency Department-Treated Injury Estimates
2008–2012
Calendar Year All Ages
Younger Than 15 Years of Age
12 Years of Age or Younger
¥ Younger Than 5
Years of Age
2008 235,300 172,700 164,400 82,300
2009 250,100 185,900 177,800 90,600
2010 251,700 181,500 172,000 89,200
2011 262,300 193,200 184,100 92,200
2012 265,000 192,000 181,600 89,500
Source: NEISS, U.S. Consumer Product Safety Commission/EPHA. Estimates are rounded to the nearest 100. ¥
Toy-related injury estimates among children 12 years of age or younger are presented to be consistent with the age definition for a
children’s product in the Consumer Product Safety Improvement Act of 2008 (CPSIA), 15 U.S.C. § 2052 (a) (2).
Of the 265,000 estimated emergency department-treated injuries associated with toys in 2012, 72 percent
(192,000) were sustained by children younger than 15 years of age, 69 percent (181,600) were sustained
by children 12 years or younger, and 34 percent (89,500) were sustained by children younger than five
years of age. Males accounted for 58 percent (154,500) of the estimated treated injuries. Most of the
victims (96 percent) were treated and released from the hospital. Two percent of the victims were
admitted to the hospital or transferred to another hospital. The remaining two percent were held for
observation or left without being seen by a doctor.
Figure 1 presents the distribution of annual estimated toy-related emergency department-treated injuries
by the specific parts of the body injured. Forty-five percent of the estimated 265,000 injuries in 2012
(119,200), occurred to the head and face area (head, face, eye, mouth, and ear). The arm, from the
shoulder to finger, accounted for 23 percent of the injuries (61,100). The leg (upper leg, lower leg, knee,
ankle, foot, and toes) accounted for 18 percent (47,100). The remaining 14 percent of injuries were to
other parts of the body not reported above. The individual body parts with the most estimated injuries
overall were the face (50,300) and the head (38,200).
5 The source of these data is the U.S. Consumer Product Commission’s National Electronic Injury Surveillance System (NEISS), which is based
on a statistical sample of hospital emergency department-treated injuries. For a description of which cases are included in NEISS, how they're coded and an alphabetical listing of products with current product codes, please see the NEISS Coding Manual at:
http://www.cpsc.gov/neiss/completemanual.pdf. 6 Throughout this report, a change (increase/trend) in estimated injuries over the given years is determined to be statistically significant where the p-value for the statistic that tests for trend is less than 0.05.

9
Figure 2 shows the distribution of annual estimated toy-related emergency department-treated injuries by
type of injury. In 2012, 24 percent of estimated emergency department-treated injuries were diagnosed as
lacerations, while an estimated 19 percent were diagnosed as contusions/abrasions. Strains/sprains
represented an estimated 12 percent of injuries, and fractures represented 12 percent as well. The
remaining 33 percent of estimated injuries were spread across several other diagnoses, such as: internal
injury, ingestion, dislocation, concussion, and puncture injuries, among others.

10
In 2012, riding toys continued to be associated with more emergency department-treated injuries for all
ages than any other category of toy.7 They were associated with 82,800 (31 percent) estimated injuries.
Nonmotorized scooters accounted for 73 percent of the estimated injuries related to riding toys for all
ages. As shown in Table 4, the top three specifically identified toys that were associated with the most
estimated injuries for all ages in 2012 were: nonmotorized scooters (60,100, or 23 percent); toy balls
(23,800, or 9 percent); and toy vehicles (13,600, or 5 percent).
Table 4: Toy Categories Associated with the Largest Number of Estimated Emergency
Department-Treated Injuries for Different Age Groups
2012
Toy
Category
Estimated Injuries (%)
All Ages Younger Than 15
Years of Age 12 Years of Age
or Younger¥
Younger Than 5 Years of Age
Nonmotorized Scooters
60,100 (23) 52,400 (27) 47,500 (26) 8,300 (9)
Toys, Not Specified 57,400 (22) 33,900 (18) 33,500 (18) 24,800 (28)
Toy Balls 23,800 (9) 16,800 (9) 15,600 (9) 5,800 (6)
Toy Vehicles 13,600 (5) 9,200 (5) 9,000 (5) 6,900 (8)
Source: NEISS, U.S. Consumer Product Safety Commission/EPHA. Estimates are rounded to the nearest 100. ¥
Toy-related injury estimates among children 12 years of age or younger are presented to be consistent with the age definition for a children’s
product in the Consumer Product Safety Improvement Act of 2008 (CPSIA), 15 U.S.C. § 2052 (a) (2).
Patterns for children younger than 15 years of age and for children 12 years of age or younger in 2012
were similar to those for all individuals.
For children younger than 15 years of age, riding toys, with 73,500 (38 percent) injuries, were also
associated with more estimated injuries than any other category of toy. Nonmotorized scooters accounted
for 71 percent of the estimated injuries related to riding toys. Table 4 shows that the top three specifically
identified toys associated with the most injuries for children younger than 15 years of age were the same
as for all ages: nonmotorized scooters (52,400, or 27 percent); toy balls (16,800, or 9 percent); and toy
vehicles (9,200, or 5 percent).
For children 12 years of age or younger, riding toys, with 68,400 (38 percent) estimated injuries, were
associated with a larger number of estimated injuries than any other category of toy as well.
Nonmotorized scooters accounted for 69 percent of the estimated injuries related to riding toys. Table 4
displays that the top three specifically identified toys associated with the most injuries for children 12
years of age or younger were the same as for all ages: nonmotorized scooters (47,500, or 26 percent); toy
balls (15,600, or 9 percent); and toy vehicles (9,000, or 5 percent).
For children younger than five years of age, riding toys, with 23,200 (26 percent) estimated injuries, were
too associated with more injuries than any other specified category of toy in 2012. However,
nonmotorized scooters accounted for only 36 percent of the riding toy-related injuries. As displayed in
Table 4, the top three specifically identified toys associated with the most injuries for children younger
7 Riding toys include these toy products: nonmotorized scooters; tricycles; unpowered nonwheeled riding toys; children’s wagons; powered riding toys; unpowered wheeled riding toys; and unspecified riding toys (excluding bicycles and tricycles).

11
than five years of age in 2012 were: nonmotorized scooters (8,300, or 9 percent); toy vehicles (6,900, or 8
percent); and toy balls (5,800, or 6 percent). This varies slightly from what were observed for all ages,
children younger than 15 years of age, or children 12 years of age or younger.
Table 5 displays the annual estimated emergency department-treated injuries associated with
nonmotorized scooters from 2008 to 2012, for children younger than 15 years of age, children 12 years of
age or younger, and for children younger than five years of age. This table also presents the injury
estimates associated with all toys and the percentages of injury estimates related to nonmotorized
scooters. In 2012, nonmotorized scooters were associated with the most estimated injuries among
specifically identified toys for these three age groups of children. There is not a statistically significant
trend in the estimated injuries related to nonmotorized scooters between 2008 and 2012 for any of the
three age groups of children.
Table 5: Nonmotorized Scooter-Related Annual Emergency Department-Treated Injury Estimates
for Children of Different Age Groups
2008–2012
Calendar
Year
Estimated Injuries
Younger Than 15 Years of Age
12 Years of Age or Younger Younger Than 5 Years of Age
Injuries Associated
with All Toys
Injuries (%) Associated
with Nonmotorized
Scooters
Injuries Associated
with All Toys
Injuries (%) Associated
with Nonmotorized
Scooters
Injuries Associated
with All Toys
Injuries (%) Associated
with Nonmotorized
Scooters
2008 172,700 42,900 (25) 164,400 40,000 (24) 82,300 7,000 (9)
2009 185,900 49,500 (27) 177,800 45,900 (26) 90,600 8,100 (9)
2010 181,500 42,800 (24) 172,000 39,400 (23) 89,200 5,800 (7)
2011 193,200 49,300 (26) 184,100 45,600 (25) 92,200 7,600 (8)
2012 192,000 52,400 (27) 181,600 47,500 (26) 89,500 8,300 (9)
Source: NEISS, U.S. Consumer Product Safety Commission/EPHA. Estimates are rounded to the nearest 100.
Toys that are identified but that cannot be placed under already-established toy product codes are likely to
be coded under the product code, “Toys, Not Elsewhere Classified.” Table 6 displays the estimated
emergency department-treated injuries associated with this product code for all ages, children younger
than 15 years of age, children 12 years of age or younger, and children younger than five years of age
from 2010 to 2012. It shows that the proportions of the estimated injuries related to this product code
were very similar across different age groups between 2010 and 2012. In addition, there is not a
statistically significant trend in the estimated injuries associated with this product code from 2010 to 2012
in any of the four age groups presented in Table 6. Please note that the injury estimates related to the
product code, “Toys, Not Elsewhere Classified,” between 2010 and 2012 were not comparable to the
estimates associated with this category of toys in 2009 or earlier.8
8 Y. Tu, “Toy-Related Deaths and Injuries, Calendar Year 2010,” CPSC, October 2011.

12
Table 6: Annual Emergency Department-Treated Injury Estimates Associated with Product Code,
“Toys, Not Elsewhere Classified,” for Different Age Groups
2010–2012
Calendar
Year
Estimated Injuries (%)
Associated with “Toys, Not Elsewhere Classified”
All Ages Younger Than 15
Years of Age 12 Years of Age
or Younger Younger Than 5
Years of Age
2010 8,500 (3) 7,000 (4) 6,800 (4) 3,400 (4)
2011 9,700 (4) 7,800 (4) 7,600 (4) 3,900 (4)
2012 6,500 (2) 5,200 (3) 4,900 (3) 2,700 (3)
Source: NEISS, U.S. Consumer Product Safety Commission/EPHA. Estimates are rounded to the nearest 100.
The product code, “Toys, Not Specified,” was reinstated in 2010, to classify injuries that were associated
with toys, but where the toys involved were not identified specifically in the NEISS injury narratives.
Table 7 presents the annual estimated emergency department-treated injuries associated with this product
code for all individuals, children younger than 15 years, children 12 years of age or younger, and children
younger than five years from 2010 to 2012. Table 7 shows that the proportions of the estimated injuries
related to this product code were very close between 2010 and 2012 for all four age groups. There is not a
statistically significant trend in the estimated number of injuries associated with the product code, “Toys,
Not Specified,” from 2010 to 2012 for any of the four age groups specified in Table 7.
Table 7: Annual Emergency Department-Treated Injury Estimates Associated with Product Code,
“Toys, Not Specified,” for Different Age Groups
2010–2012
Calendar
Year
Estimated Injuries (%)
Associated with “Toys, Not Specified”
All Ages Younger Than 15
Years of Age 12 Years of Age
or Younger Younger Than 5
Years of Age
2010 58,200 (23) 36,200 (20) 35,500 (21) 24,800 (28)
2011 60,000 (23) 38,900 (20) 38,700 (21) 27,700 (30)
2012 57,400 (22) 33,900 (18) 33,500 (18) 24,800 (28)
Source: NEISS, U.S. Consumer Product Safety Commission/EPHA. Estimates are rounded to the nearest 100.
In 2010, CPSC staff conducted a special study of all injuries that were treated at the emergency
departments of NEISS hospitals between July 1, 2010 and December 31, 2010, where the product
involved was coded: “Toys, Not Specified.” The aim of this study was to identify the actual toys involved
and to facilitate the characterization of toys with unknown classifications and the associated hazard
patterns. All NEISS cases that were treated during that specific six-month period and were associated
with the product code, “Toys, Not Specified,” were assigned for telephone in-depth investigations. During
the telephone investigations, telephone interviewers asked the injury victim (or the victim’s caregiver, if
the victim was a minor) about the incident scenario, how the injury occurred, what type of toy was

13
involved, the age of the toy, how the toy was obtained, and other questions regarding the characteristics of
the toy. CPSC staff wrote a report to summarize the study design, telephone survey results, the estimating
methods, and analysis results for this special study.9
The special study revealed that 19 percent of the estimated injuries, which were associated with the
product code, “Toys, Not Specified,” during the special study period, did not involve a toy. Therefore, a
0.81 correction factor was introduced to adjust the injury estimates related to this product code.9 Applying
this correction factor to the toy-related injury estimates in 2012, and further extrapolating the distribution
of toys identified from the special study to the injury estimate associated with the product code, “Toys,
Not Specified,” in 2012, the adjusted toy-related injury estimates and the toy categories that were
associated with the largest number of adjusted estimated injuries in 2012 are presented in Table 8 for all
ages, children younger than 15 years, children 12 years of age or younger, and children younger than five
years.
Table 8: Toy-Related Injury Estimates Adjusted for the Correction Factor for Different Age
Groups and Toy Categories Associated with the Most Adjusted Estimated Injuries
2012
Toys
Adjusted Estimated Injuries (%)
All Ages Younger Than
15 Years of Age 12 Years of Age
or Younger Younger Than 5 Years of Age
All Toys 254,300 (100) 185,700 (100) 175,400 (100) 84,900 (100)
Nonmotorized Scooters 60,700 (24) 52,800 (28) 47,900 (27) 8,600 (10)
Toy Balls 24,500 (10) 17,200 (9) 16,000 (9) 6,100 (7)
Toy Vehicles 24,000 (9) 15,300 (8) 15,100 (9) 11,400 (13)
Dolls, Plush Toys, and Action Figures 13,200 (5) 9,500 (5) 9,400 (5) 6,700 (8)
Source: NEISS, U.S. Consumer Product Safety Commission/EPHA. Estimates are adjusted for correction factor and rounded to the nearest
100.
Table 8 displays that the nonmotorized scooters, toy balls, toy vehicles, and “dolls, plush toys, and action
figures” were associated with the most adjusted estimated injuries in 2012 for all individuals, children
younger than 15 years of age, or children 12 years of age or younger. These four categories of toys
accounted for nearly half of the adjusted estimated toy-related injuries for these three age groups. For
children younger than five years of age, toy vehicles, nonmotorized scooters, “dolls, plush toys, and
action figures,” and toy balls were associated with the most adjusted estimated injuries, and they
represented 38 percent of the adjusted toy-related injuries in 2012.
It is worth noting that, after applying the correction factor and extrapolating the 2010 special study results
to the toy-related injury estimates in 2012, only three to four percent of the 2012 adjusted toy-related
injuries were associated with the product code, “Toys, Not Elsewhere Classified,” for the four age groups
specified in Table 8. As for the product code, “Toys, Not Specified,” just two to three percent of the
adjusted estimated toy-related injuries in 2012 were related to this product code for the four age groups
listed in Table 8. Therefore, more than 90 percent of the adjusted toy-related injuries in 2012 could be
attributed to established specified toy product codes.
9 Y. Tu and S. Garland, “A NEISS Special Study, “Toys, Not Specified”: Analysis and Results,” CPSC, February 2012.
14
Appendix A
Estimated Number of Toy-Related Injuries from 1998 through 2012
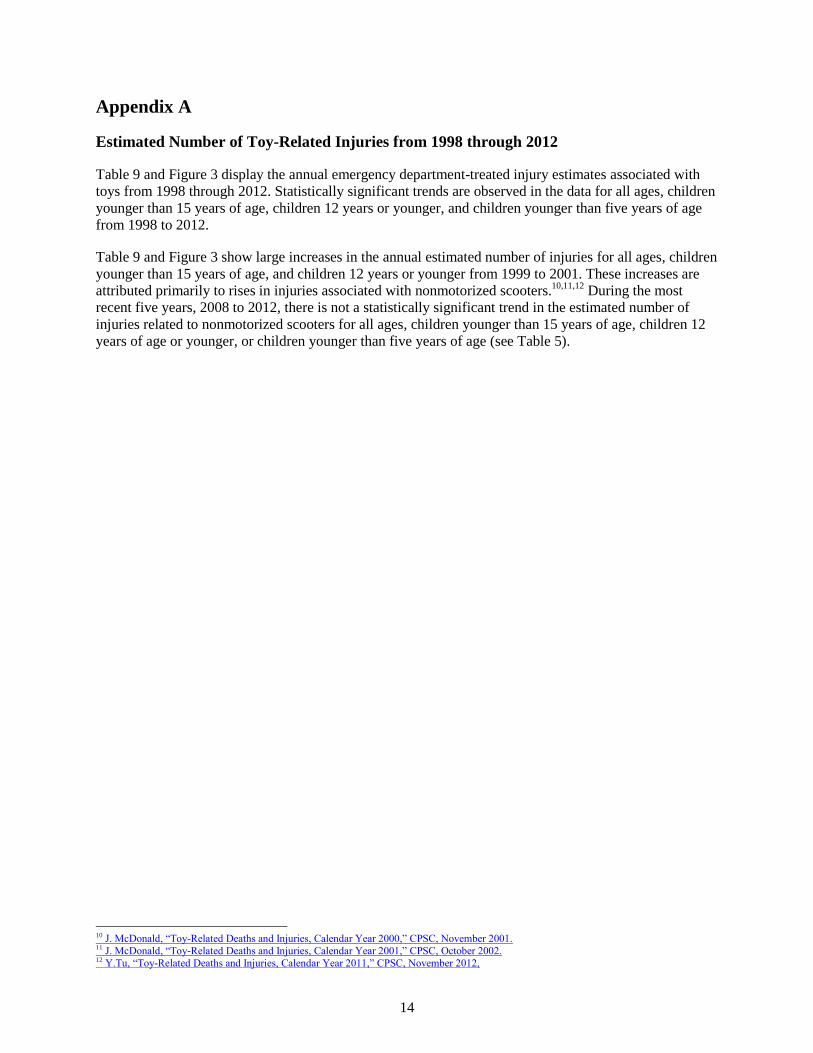
Table 9 and Figure 3 display the annual emergency department-treated injury estimates associated with
toys from 1998 through 2012. Statistically significant trends are observed in the data for all ages, children
younger than 15 years of age, children 12 years or younger, and children younger than five years of age
from 1998 to 2012.
Table 9 and Figure 3 show large increases in the annual estimated number of injuries for all ages, children
younger than 15 years of age, and children 12 years or younger from 1999 to 2001. These increases are
attributed primarily to rises in injuries associated with nonmotorized scooters.10,11,12
During the most
recent five years, 2008 to 2012, there is not a statistically significant trend in the estimated number of
injuries related to nonmotorized scooters for all ages, children younger than 15 years of age, children 12
years of age or younger, or children younger than five years of age (see Table 5).
10 J. McDonald, “Toy-Related Deaths and Injuries, Calendar Year 2000,” CPSC, November 2001. 11 J. McDonald, “Toy-Related Deaths and Injuries, Calendar Year 2001,” CPSC, October 2002. 12 Y.Tu, “Toy-Related Deaths and Injuries, Calendar Year 2011,” CPSC, November 2012,
15
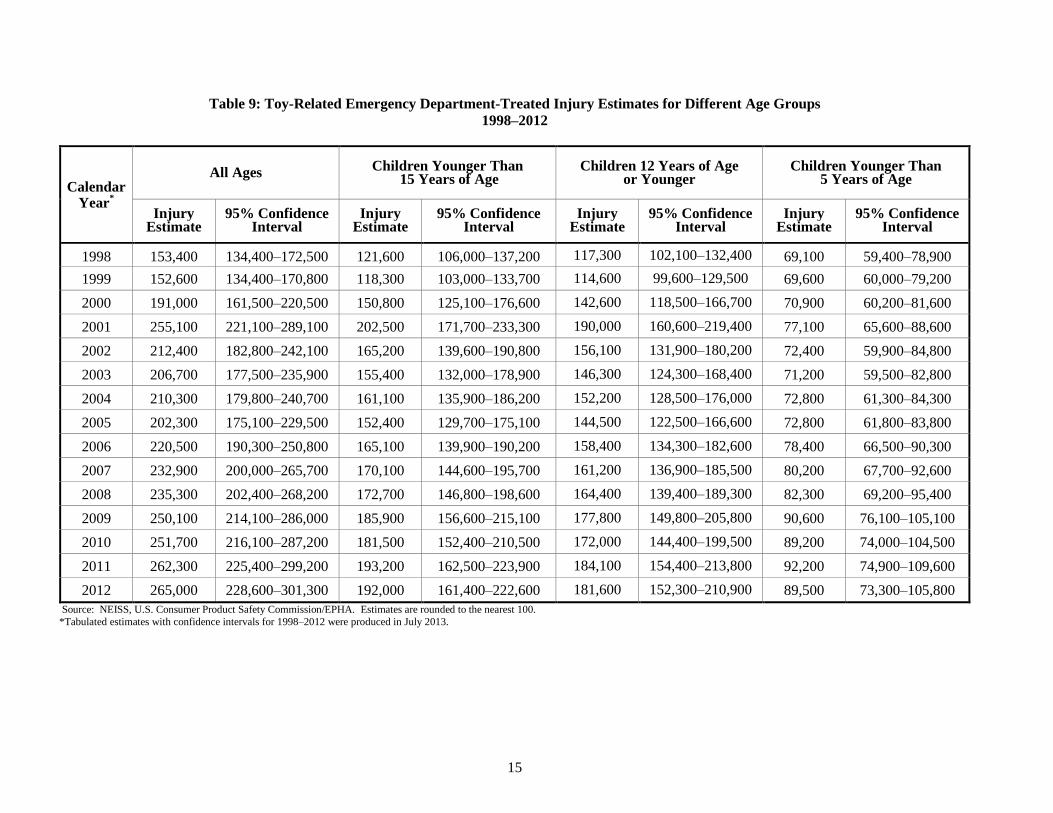
Table 9: Toy-Related Emergency Department-Treated Injury Estimates for Different Age Groups
1998–2012
Calendar Year
*
All Ages Children Younger Than
15 Years of Age Children 12 Years of Age
or Younger Children Younger Than
5 Years of Age
Injury Estimate
95% Confidence Interval
Injury Estimate
95% Confidence Interval
Injury Estimate
95% Confidence Interval
Injury Estimate
95% Confidence Interval
1998 153,400 134,400–172,500 121,600 106,000–137,200 117,300 102,100–132,400 69,100 59,400–78,900
1999 152,600 134,400–170,800 118,300 103,000–133,700 114,600 99,600–129,500 69,600 60,000–79,200
2000 191,000 161,500–220,500 150,800 125,100–176,600 142,600 118,500–166,700 70,900 60,200–81,600
2001 255,100 221,100–289,100 202,500 171,700–233,300 190,000 160,600–219,400 77,100 65,600–88,600
2002 212,400 182,800–242,100 165,200 139,600–190,800 156,100 131,900–180,200 72,400 59,900–84,800
2003 206,700 177,500–235,900 155,400 132,000–178,900 146,300 124,300–168,400 71,200 59,500–82,800
2004 210,300 179,800–240,700 161,100 135,900–186,200 152,200 128,500–176,000 72,800 61,300–84,300
2005 202,300 175,100–229,500 152,400 129,700–175,100 144,500 122,500–166,600 72,800 61,800–83,800
2006 220,500 190,300–250,800 165,100 139,900–190,200 158,400 134,300–182,600 78,400 66,500–90,300
2007 232,900 200,000–265,700 170,100 144,600–195,700 161,200 136,900–185,500 80,200 67,700–92,600
2008 235,300 202,400–268,200 172,700 146,800–198,600 164,400 139,400–189,300 82,300 69,200–95,400
2009 250,100 214,100–286,000 185,900 156,600–215,100 177,800 149,800–205,800 90,600 76,100–105,100
2010 251,700 216,100–287,200 181,500 152,400–210,500 172,000 144,400–199,500 89,200 74,000–104,500
2011 262,300 225,400–299,200 193,200 162,500–223,900 184,100 154,400–213,800 92,200 74,900–109,600
2012 265,000 228,600–301,300 192,000 161,400–222,600
222,600222,600
181,600 152,300–210,900 89,500 73,300–105,800
Source: NEISS, U.S. Consumer Product Safety Commission/EPHA. Estimates are rounded to the nearest 100. *Tabulated estimates with confidence intervals for 1998–2012 were produced in July 2013.

16
Figure 3: Toy-Related Emergency Department-Treated Injury Estimates for Different Age Groups
1998–2012

17
Appendix B NEISS Product Codes for Toys as of January 1, 2012
Product Code
Toy Type
1301 Tricycles (Children’s)
1309 Kites or Kite String
1310 Pogo Sticks
1314 Rocketry Sets
1319 Metal or Plastic Molding Sets
1322 Children's Play Tents, Play Tunnels, or Other Enclosures
1325 Inflatable Toys (Excluding Balls and Balloons)
1326 Blocks, Stacking Toys, or Pull Toys
1327 Nonwheeled Riding Toys, Unpowered
1328 Wagons (Children's)
1329 Scooters, Unpowered
1330 Powered Riding Toys
1338 Toy Bows or Arrows
1342 Costumes or Masks
1344 Toy Musical Instruments
1345 Building Sets
1346 Clacker Balls
1347 Balloons (Toy)
1349 Stilts
1350 Squeeze or Squeaker Toys
1352 Slingshots or Sling-Propelled Toys
1353 Toy Boxes or Chests
1354 Marbles
1362 Woodburning Kits
1365 Water Toys (Excluding Squeeze/Squeaker Toys and Inner Tubes or Similar Floating Equipment)
1376 Molding Compounds
1381 Toys, Not Elsewhere Classified
1389 Other Toy Weapons (Nonprojectile)
1390 Toy Guns, Not Specified

18
Product Code
Toy Type
1392 Toy Sports Equipment
1393 Chemistry Sets or Science Kits
1394 Dolls, Plush Toys, and Action Figures
1395 Toys, Not Specified
1398 Wheeled Riding Toys, Unpowered (Excluding Bicycles and Tricycles)
1399 Toy Guns With Projectiles
1550 Infant and Toddler Play Centers (Excluding Jumpers, Bouncers, and Exercisers)
5001 Other Toy Weapons (Projectile)
5005 Riding Toys (Excluding Bicycles and Tricycles), Not Specified
5006 Other Toy Guns
5007 Toy Weapons, Not Specified
5010 Crayons Or Chalk (Excluding Billiard or Pool Chalk)
5011 Book Bags or Back Carriers (Excluding Baby Carriers, Luggage and Camping Equipment)
5013 Toy Make-Up Kits or Cosmetics (Excluding Mirrors)
5015 Toy Caps, Cap Toys, or Cap Guns
5016 Balls, Other or Not Specified
5017 Flying Discs and Boomerangs
5018 Doll Houses and Other Play Scenes
5019 Games or Game Parts (Excluding Marbles and Computer Games)
5020 Pretend Electronics, Tools, Housewares, and Appliances
5021 Toy Vehicles (Excluding Riding Toys)