Embed Size (px)
Citation preview
WarsawOctober
28th, 2009
TP Group Results for the 9 months ended
September 30th, 2009
2
forward looking statement
This presentation contains 'forward-looking statements' including, but not limited to, statements regarding anticipated future events and financial performance with respect to our operations. Forward-looking statements can be identified by the fact that they do not relate strictly to historical or current facts.
They often include words
like 'believe', 'expect', 'anticipate', 'estimated', 'project', 'plan', 'pro forma', and 'intend' or future or conditional verbs such as 'will', 'would',
or 'may‘. Factors that
could cause actual results to differ materially from expected results include, but are not limited to, those set forth in our Registration Statement, as filed with the Polish securities and exchange commission, the competitive environment in which we operate, changes in general economic conditions and changes in the Polish, American and/or global financial and/or capital markets.
Forward-looking statements
represent management’s views as of the date they are made, and we assume no obligation to update any forward-looking statements for actual events occurring after that date. You are cautioned not to place undue reliance on our forward-looking statements.

3
table of contents
2 9m09 financial review
3 conclusions
introduction1 4
5
Q&A session
appendices

1 introduction
Maciej
Witucki president of the board and CEO
5
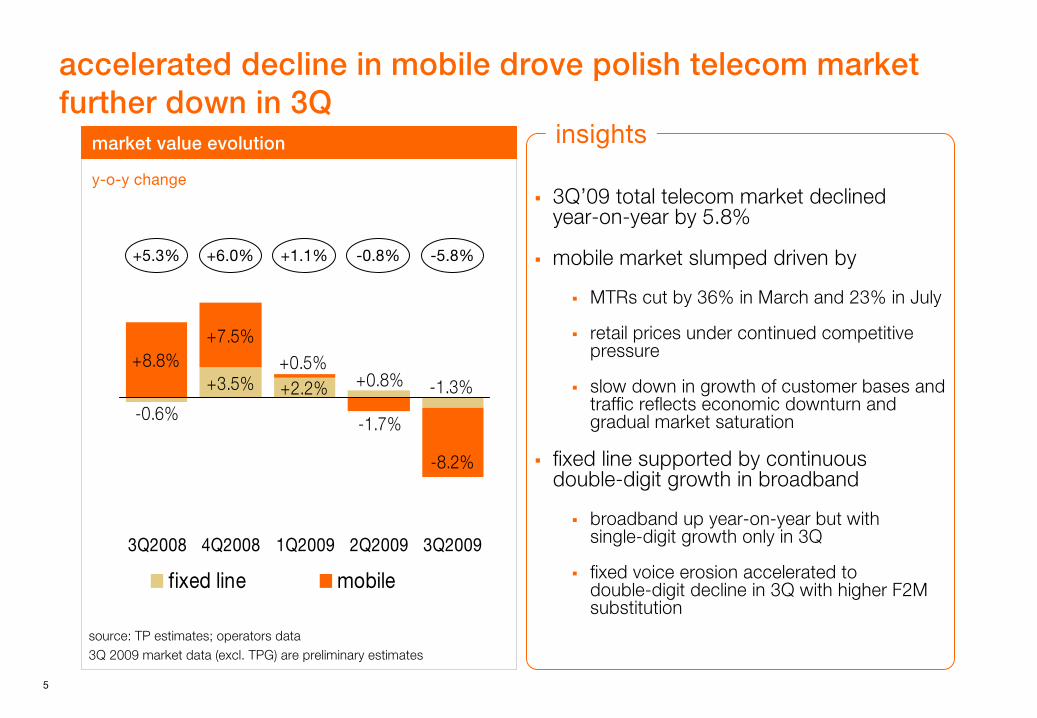
accelerated decline in mobile drove polish telecom market further down
in
3Q
3Q’09 total telecom market declinedyear-on-year by 5.8%
mobile market slumped driven by
MTRs cut by 36% in March and 23% in July
retail prices under continued competitive pressure
slow down in growth of customer bases and traffic reflects economic downturn and gradual market saturation
fixed line supported by continuousdouble-digit growth in broadband
broadband up year-on-year but withsingle-digit growth only in 3Q
fixed voice erosion accelerated todouble-digit decline in 3Q with higher F2M substitution
insights
y-o-y
change
market value evolution
+8.8%+7.5%
-1.3%+0.8%+2.2%+3.5%
-0.6%
+0.5%
-1.7%
-8.2%
3Q2008 4Q2008 1Q2009 2Q2009 3Q2009
fixed line mobile
-0.8%+1.1%
source: TP estimates; operators data3Q 2009 market data (excl. TPG) are preliminary estimates
-5.8%+5.3% +6.0%
6
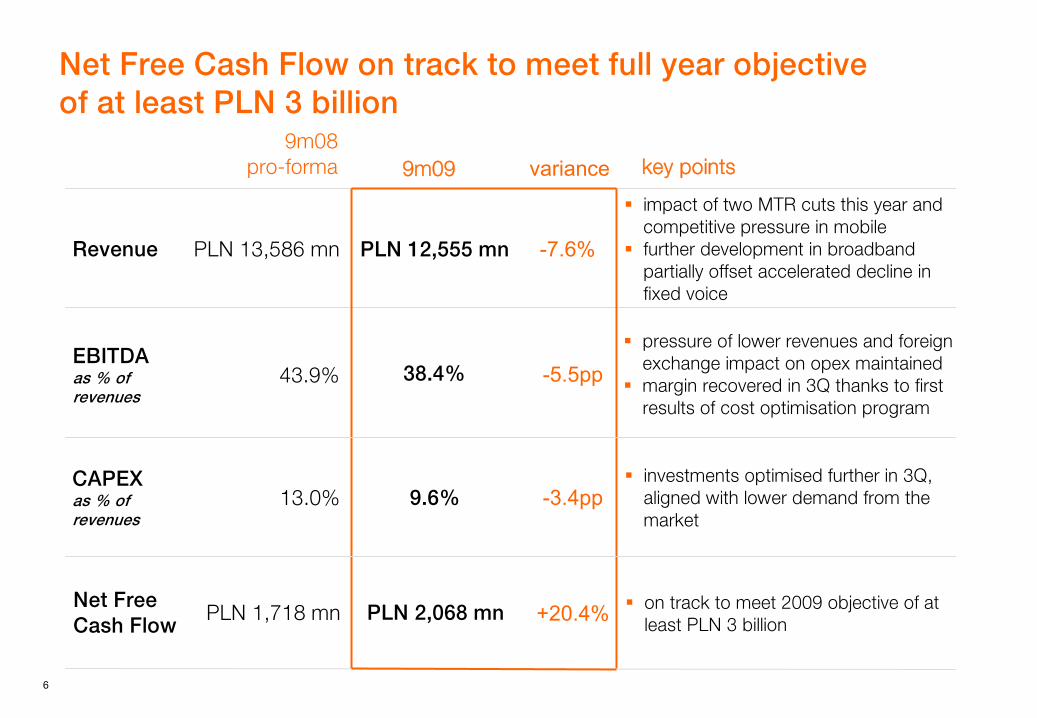
38.4%
pressure of lower revenues and foreign exchange impact on opex maintained margin recovered in 3Q thanks to first results of cost optimisation program
43.9%
Net Free Cash Flow on track to meet full year objective of at least PLN 3 billion
investments optimised further in 3Q, aligned with lower demand from the market
9.6%13.0%CAPEX
as % of revenues
on track to meet 2009 objective of at least PLN 3 billion
PLN 2,068 mnPLN 1,718 mnNet Free
Cash Flow
key points9m099m08
pro-forma
impact of two MTR cuts this year and competitive pressure in mobilefurther development in broadband partially offset accelerated decline in fixed voice
PLN
12,555
mnRevenue
EBITDA
as % of revenues
PLN 13,586 mn
variance
-7.6%
-5.5pp
-3.4pp
+20.4%
7
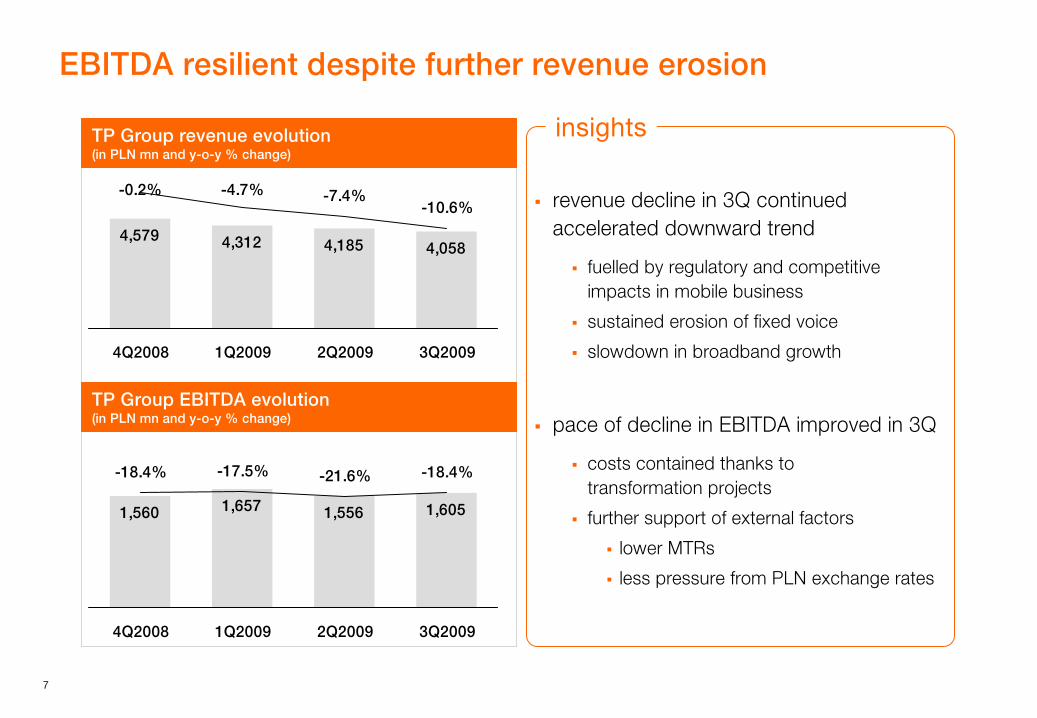
EBITDA resilient despite further revenue erosion
revenue decline in 3Q continued accelerated downward trend
fuelled by regulatory and competitive impacts in mobile business
sustained erosion of fixed voice
slowdown in broadband growth
pace of decline in EBITDA improved in 3Q
costs contained thanks totransformation projects
further support of external factors
lower MTRs
less pressure from PLN exchange rates
insightsTP Group revenue evolution(in PLN mn
and
y-o-y
% change)
4,579 4,312 4,185 4,058
-0.2% -4.7% -7.4%-10.6%
4Q2008 1Q2009 2Q2009 3Q2009
1,560 1,657 1,556 1,605
-18.4% -17.5% -21.6% -18.4%
4Q2008 1Q2009 2Q2009 3Q2009
TP Group EBITDA evolution(in PLN mn
and y-o-y
% change)

2 9m09 financial review
Roland Dubois chief financial officer
9
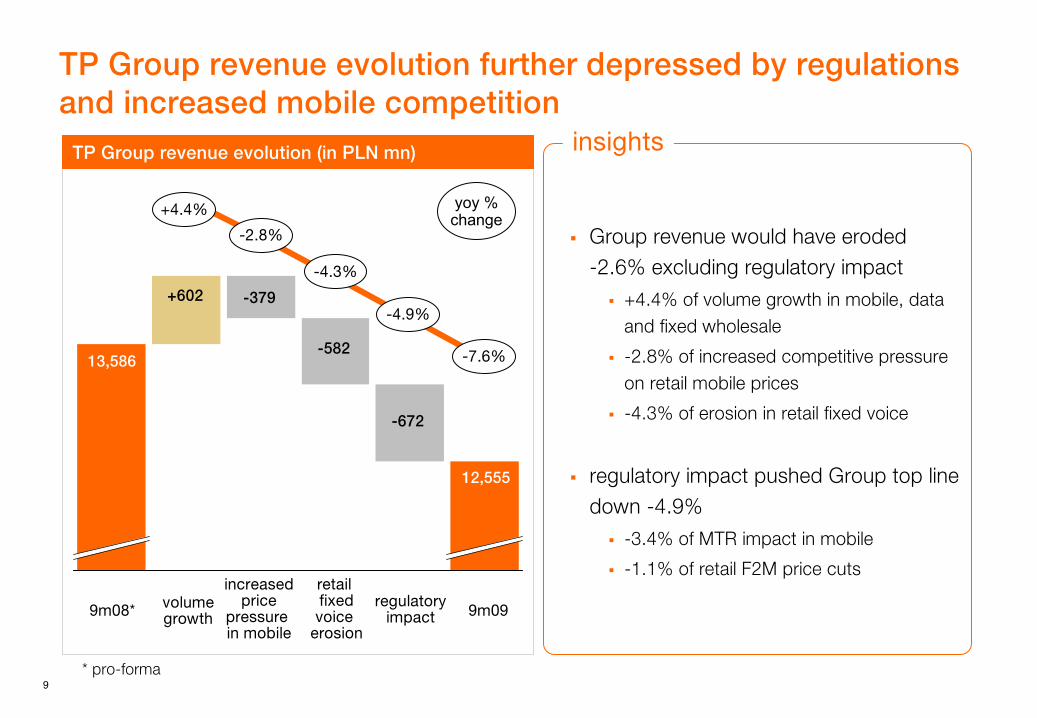
TP Group revenue evolution further depressed by regulations and increased mobile competition
Group revenue would have eroded-2.6% excluding regulatory impact
+4.4% of volume growth in mobile, data and fixed wholesale
-2.8% of increased competitive pressure on retail mobile prices
-4.3% of erosion in retail fixed voice
regulatory impact pushed Group top line down -4.9%
-3.4% of MTR impact in mobile
-1.1% of retail F2M price cuts
insightsTP Group revenue evolution (in PLN mn)
13,586
12,555
-672
-379+602
9m08* 9m09
* pro-forma
increasedprice
pressure in mobile
regulatory
impact
volume
growth
-7.6%
+4.4%
-2.8%
-4.9%
-582
retail fixed
voice
erosion
-4.3%
yoy
%
change
10
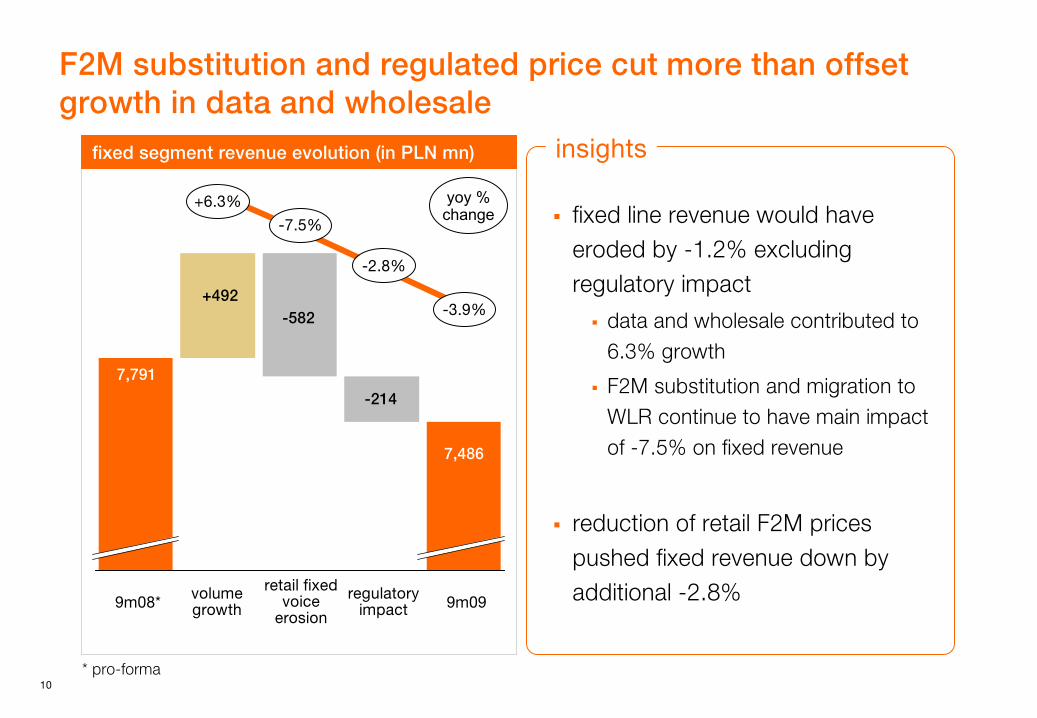
F2M substitution and regulated price cut more than offset growth in data and wholesale
fixed segment revenue evolution (in PLN mn)
7,791
7,486
-214
-582+492
* pro-forma
retail fixed
voice
erosion
regulatory
impact
volume
growth
-3.9%
+6.3%
-2.8%
-7.5% fixed line revenue would have eroded by -1.2% excluding regulatory impact
data and wholesale contributed to 6.3% growth
F2M substitution and migration to WLR continue to have main impact of -7.5% on fixed revenue
reduction of retail F2M prices pushed fixed revenue down by additional -2.8%
insights
9m08* 9m09
yoy
%
change
11
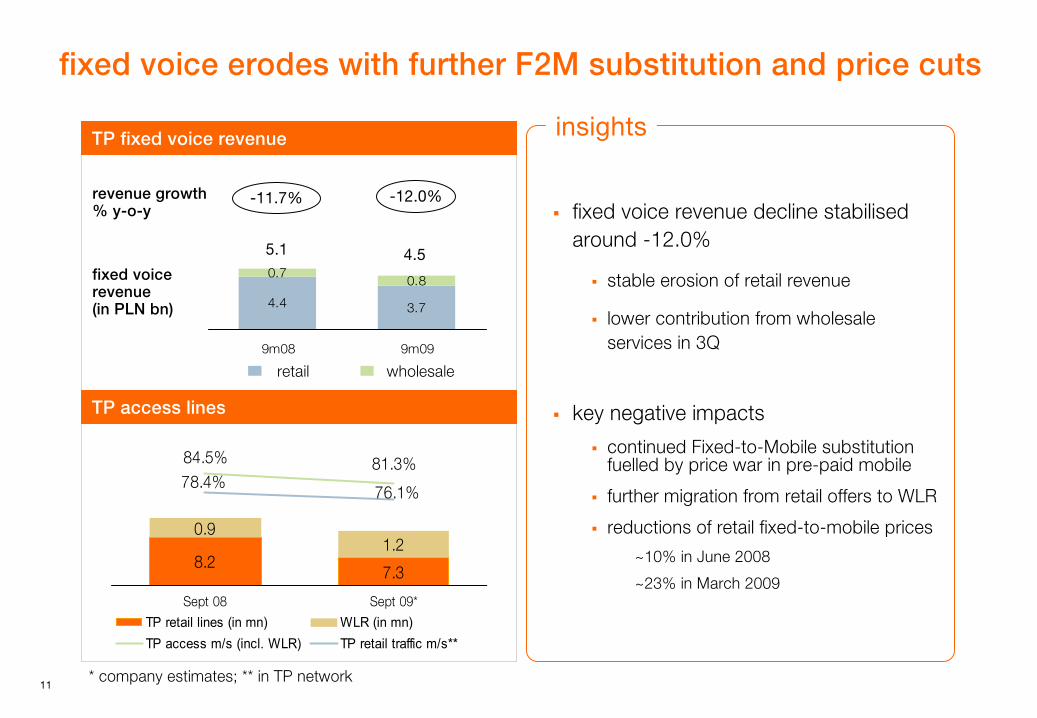
fixed voice erodes with further F2M substitution and price cuts
fixed voice revenue decline stabilised around -12.0%
stable erosion of retail revenue
lower contribution from wholesaleservices in 3Q
key negative impacts
continued Fixed-to-Mobile substitution fuelled by price war in pre-paid mobile
further migration from retail offers to WLR
reductions of retail fixed-to-mobile prices
~10% in June 2008
~23% in March 2009
insights
4.4 3.7
0.70.8
9m08 9m09
-12.0%-11.7%
5.1 4.5
revenue growth
% y-o-y
fixed voice
revenue (in PLN bn)
retail wholesale
TP fixed voice revenue
* company estimates; ** in TP network
8.27.3
0.91.2
84.5% 81.3%
76.1%78.4%
Sept 08 Sept 09*
TP retail lines (in mn) WLR (in mn)TP access m/s (incl. WLR) TP retail traffic m/s**
TP access lines
12
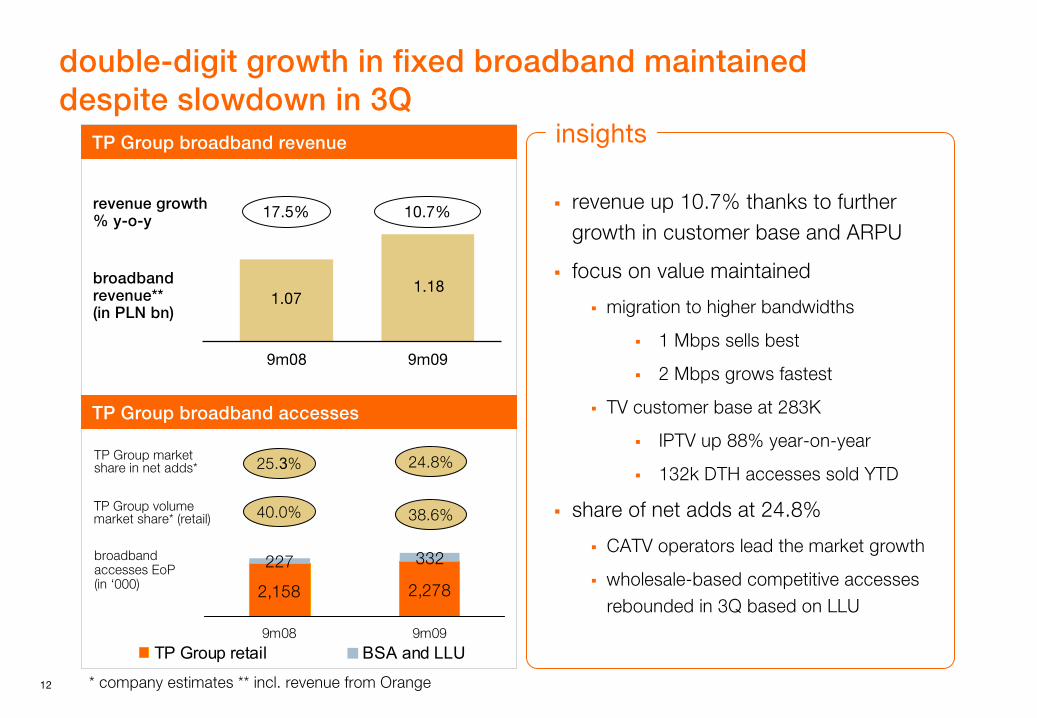
double-digit growth in fixed broadband maintained despite slowdown in 3Q
revenue up 10.7% thanks to further growth in customer base and ARPU
focus on value maintained
migration to higher bandwidths
1 Mbps sells best
2 Mbps grows fastest
TV customer base at 283K
IPTV up 88% year-on-year
132k DTH accesses sold YTD
share of net adds at 24.8%
CATV operators lead the market growth
wholesale-based competitive accesses rebounded in 3Q based on LLU
insights
* company estimates ** incl. revenue from Orange
1.071.18
9m08 9m09
17.5% 10.7%revenue growth
% y-o-y
broadband
revenue**
(in PLN bn)
TP Group broadband revenue
TP Group broadband accesses
2,158 2,278
227 332
9m08 9m09
TP Group retail BSA and LLU
TP Group volume market share* (retail)
TP Group market
share in net adds* 24.8%25.3%
38.6%40.0%
broadband
accesses EoP
(in ‘000)
13
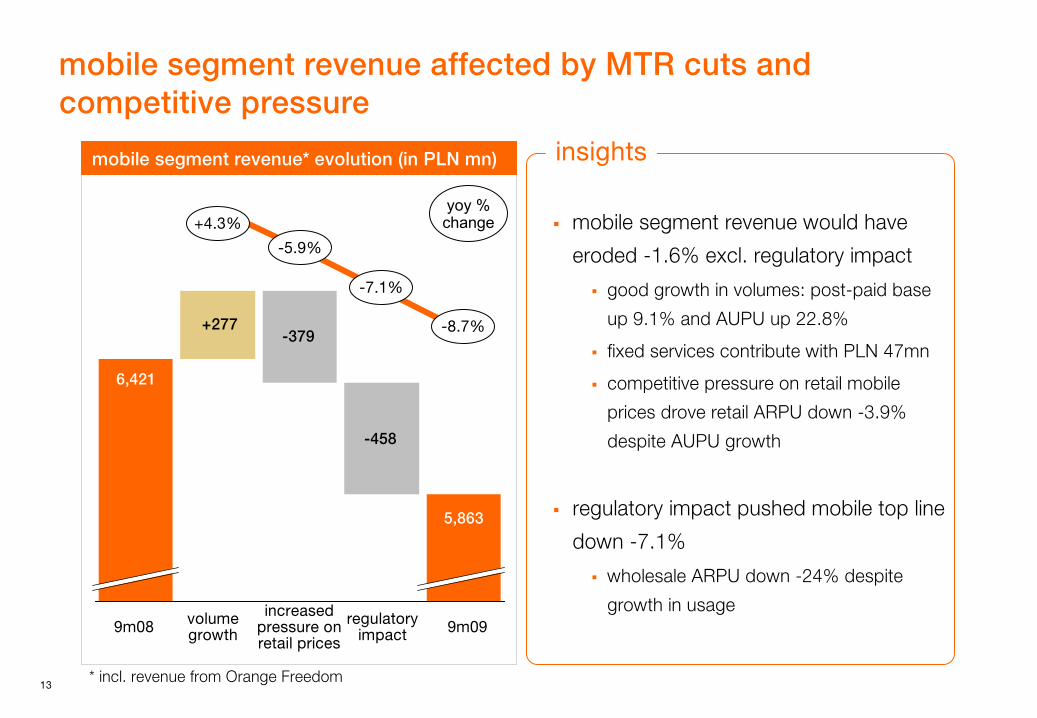
mobile segment revenue affected by MTR cuts and competitive pressure
mobile segment revenue would have
eroded -1.6% excl. regulatory impact
good growth in volumes: post-paid base
up 9.1% and AUPU up 22.8%
fixed services contribute with PLN 47mn
competitive pressure on retail mobile
prices drove retail ARPU down -3.9%
despite AUPU growth
regulatory impact pushed mobile top line
down -7.1%
wholesale ARPU down -24% despite
growth in usage
insights
6,421
5,863
-458
-379+277
9m08 9m09increased
pressure onretail prices
regulatory
impact
volume
growth
-8.7%
+4.3%
-7.1%
-5.9%
mobile segment revenue* evolution (in PLN mn)
* incl. revenue from Orange Freedom
yoy
%
change
14
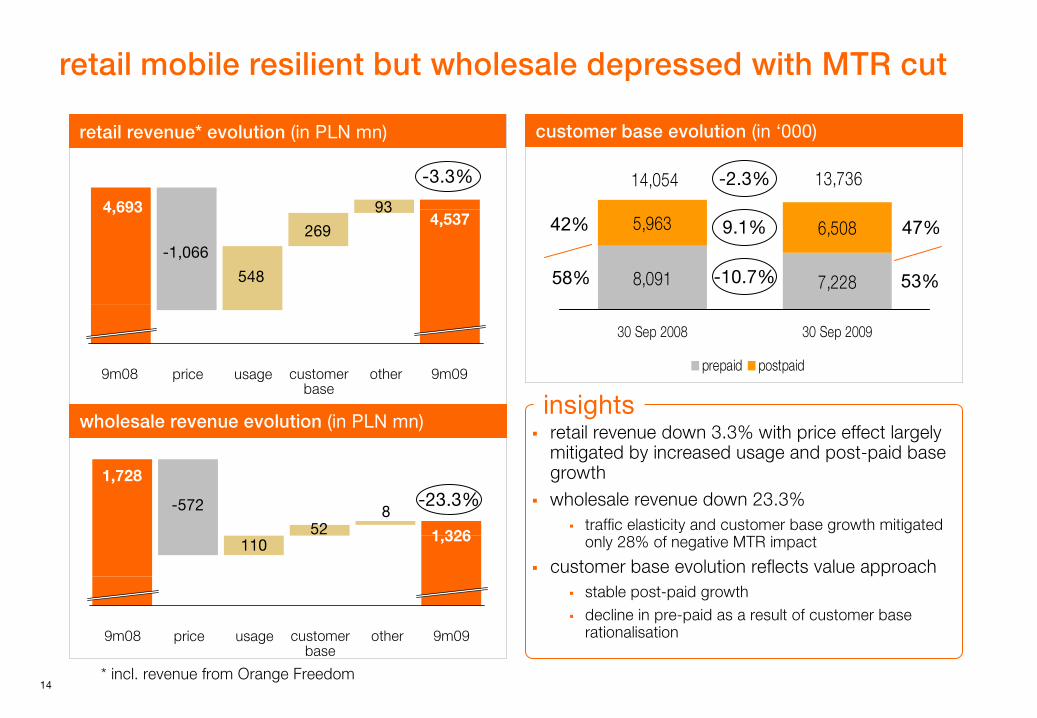
retail revenue down 3.3% with price effect largely mitigated by increased usage and post-paid base growthwholesale revenue down 23.3%
traffic elasticity and customer base growth mitigated only 28% of negative MTR impact
customer base evolution reflects value approachstable post-paid growthdecline in pre-paid as a result of customer base rationalisation
retail mobile resilient but wholesale depressed with MTR cut
insights
* incl. revenue from Orange Freedom
retail revenue* evolution (in PLN mn)
wholesale revenue evolution (in PLN mn)
4,693
-1,066
548
4,537
price usage customer
base
269
93
other9m08 9m09
-3.3%
1,728
-572
1101,326
price usage customer
base
528
other9m08 9m09
-23.3%
8,091 7,228
5,963 6,508
13,73614,054
30 Sep 2008 30 Sep 2009
prepaid postpaid
customer base evolution (in ‘000)
-2.3%
9.1%
-10.7%
42%
58%
47%
53%
15
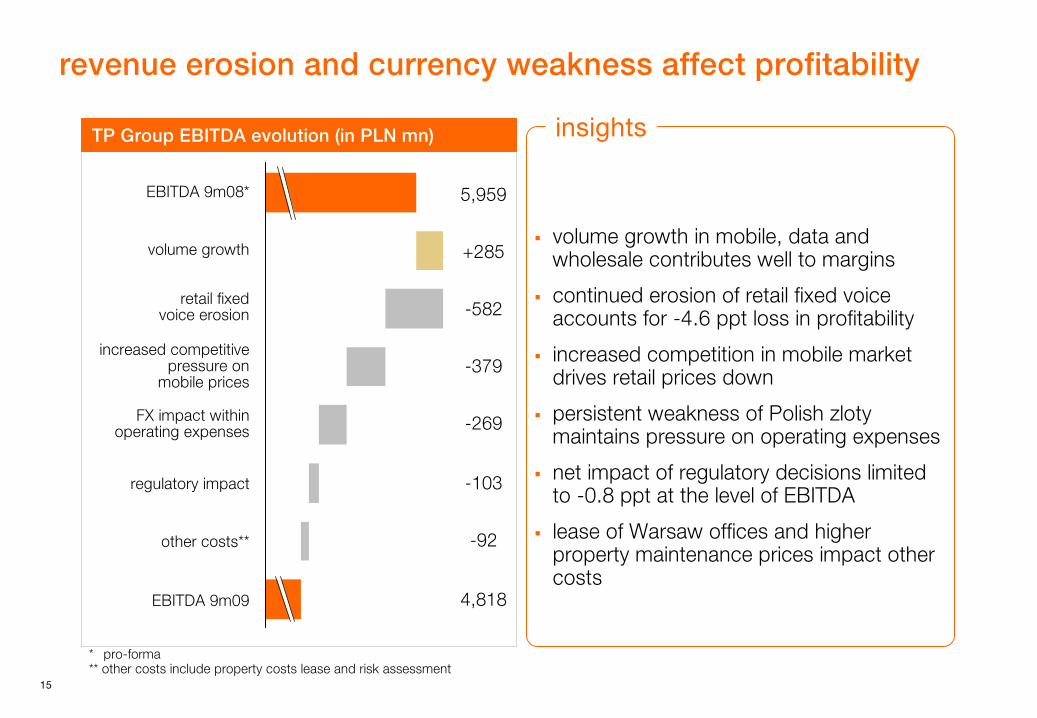
revenue erosion and currency weakness affect profitability
volume growth in mobile, data and wholesale contributes well to margins
continued erosion of retail fixed voice accounts for -4.6 ppt loss in profitability
increased competition in mobile market drives retail prices down
persistent weakness of Polish zloty maintains pressure on operating expenses
net impact of regulatory decisions limited to -0.8 ppt at the level of EBITDA
lease of Warsaw offices and higher property maintenance prices impact other costs
insightsTP Group EBITDA evolution (in PLN mn)
* pro-forma** other costs include property costs lease and risk assessment
other costs**
volume growth
FX impact within
operating expenses
EBITDA 9m09
EBITDA 9m08*
regulatory impact
5,959
+285
-379
-269
-92
4,818
increased competitive pressure on
mobile prices
-103
retail fixed
voice erosion -582
16
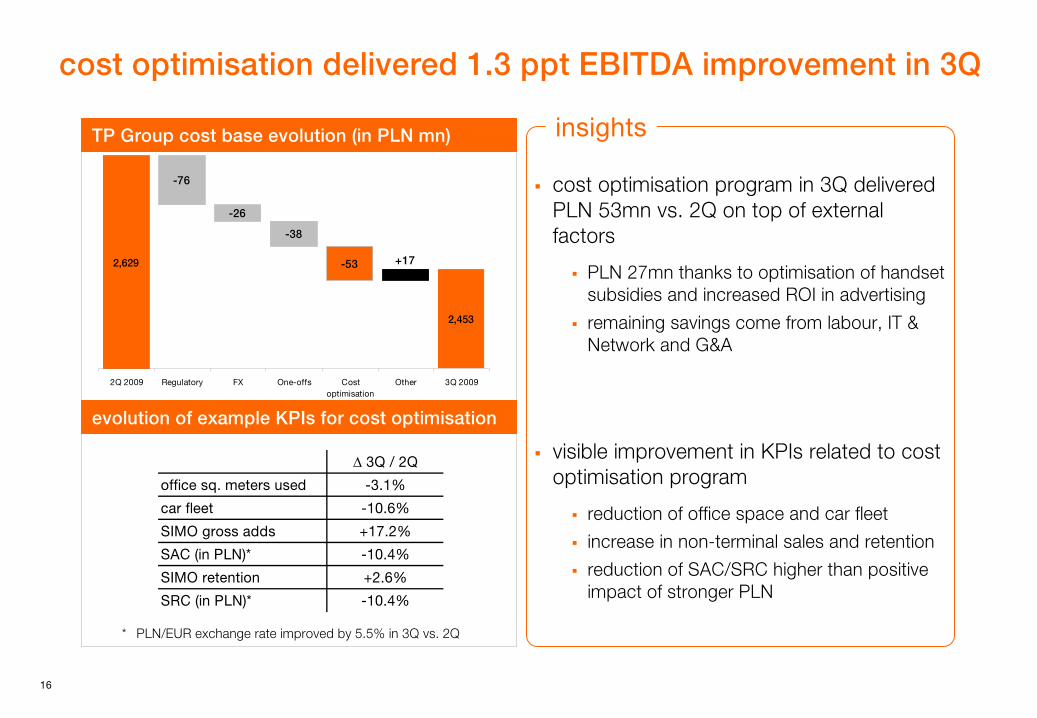
2,629
2,453
+17-53
-76
-26
-38
2Q 2009 Regulatory FX One-offs Costoptimisation
Other 3Q 2009
cost optimisation delivered 1.3 ppt
EBITDA improvement in 3Q
cost optimisation program in 3Q deliveredPLN 53mn vs. 2Q on top of external factors
PLN 27mn thanks to optimisation of handset subsidies and increased ROI in advertising
remaining savings come from labour, IT & Network and G&A
visible improvement in KPIs related to cost optimisation program
reduction of office space and car fleet
increase in non-terminal sales and retention
reduction of SAC/SRC higher than positive impact of stronger PLN
insightsTP Group cost base evolution (in PLN mn)
evolution of example KPIs
for cost optimisation
* PLN/EUR exchange rate improved by 5.5% in 3Q vs. 2Q
∆ 3Q / 2Q
office sq. meters used -3.1%
car fleet -10.6%
SIMO gross adds +17.2%
SAC (in PLN)* -10.4%
SIMO retention +2.6%
SRC (in PLN)* -10.4%
17
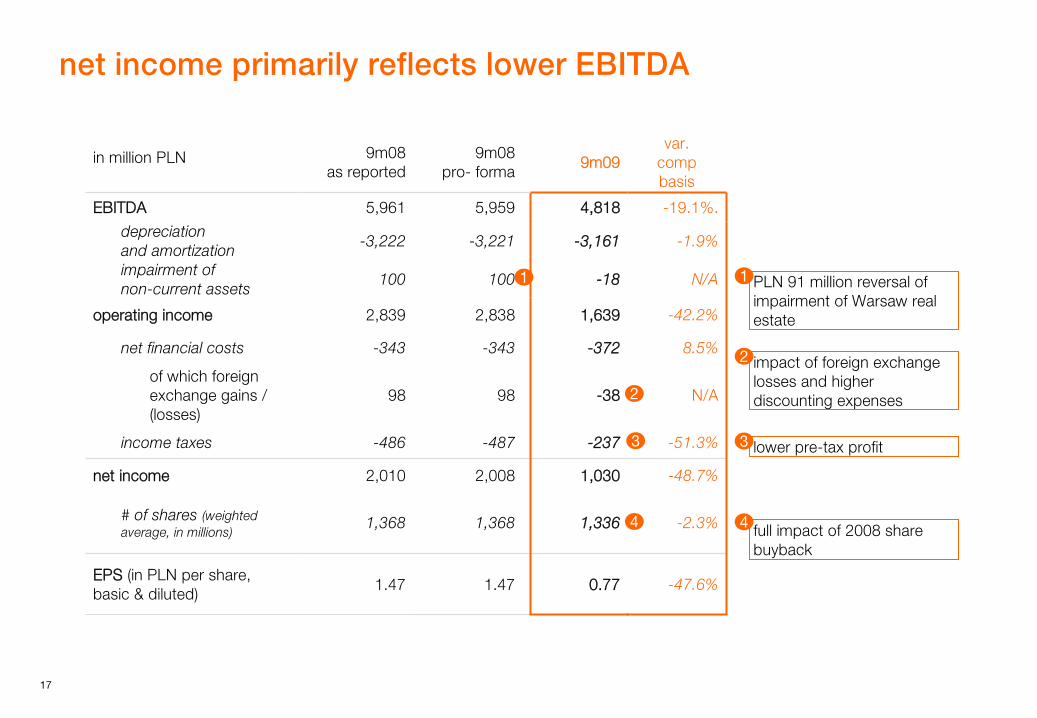
net income primarily reflects lower EBITDA
in million PLN 9m08
as reported
9m08
pro-
forma 9m09var.
compbasis
EBITDA 5,961 5,959 4,818 -19.1%.
depreciation
and amortization
-3,222 -3,221 -3,161 -1.9%
impairment of
non-current assets
100 100 -18 N/A
operating income 2,839 2,838 1,639 -42.2%
net financial costs -343 -343 -372 8.5%
of which foreign exchange gains / (losses)
98 98 -38 N/A
income taxes -486 -487 -237 -51.3%
net income 2,010 2,008 1,030 -48.7%
# of shares (weighted average, in millions)
1,368 1,368 1,336 -2.3%
EPS
(in PLN per share, basic & diluted)
1.47 1.47 0.77 -47.6%
impact of foreign exchange losses and higher discounting expenses
2
full impact of 2008 share buyback
4
2
4
PLN 91 million reversal of impairment of Warsaw real estate
1
lower pre-tax profit3
1
3
18
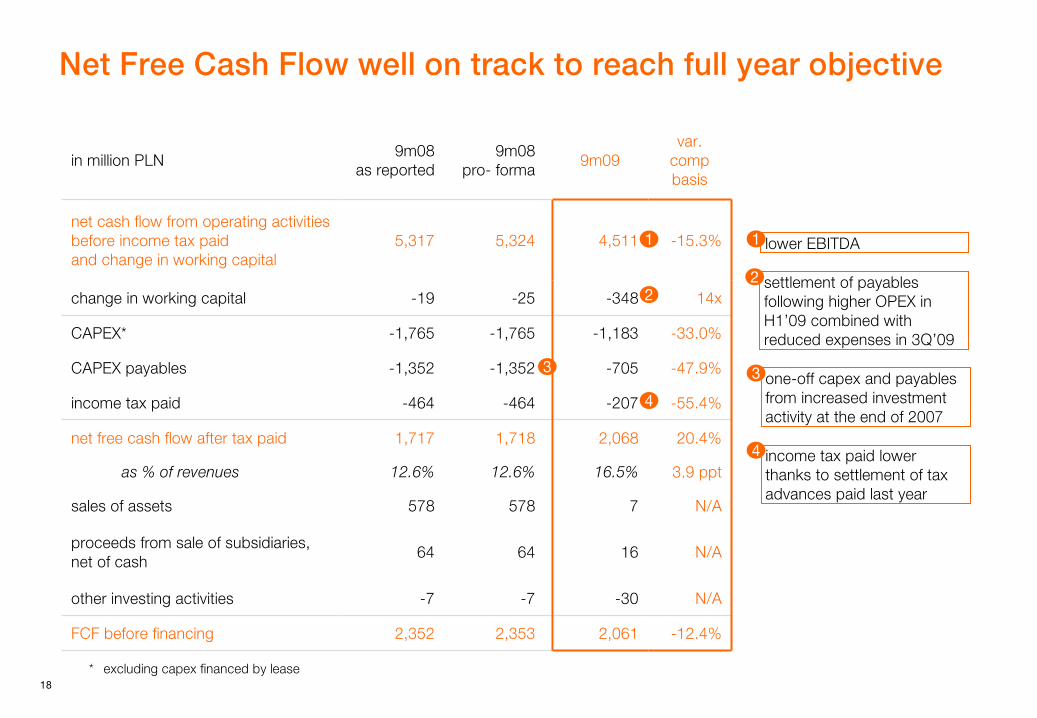
Net Free Cash Flow well on track to reach full year objective
one-off capex and payables from increased investment activity at the end of 2007
3
lower EBITDA1
in million PLN9m08
as reported
9m08
pro-
forma9m09
var.
compbasis
net cash flow from operating activities before income tax paid and change in working capital
5,317 5,324 4,511 -15.3%
change in working capital -19 -25 -348 14x
CAPEX* -1,765 -1,765 -1,183 -33.0%
CAPEX payables -1,352 -1,352 -705 -47.9%
income tax paid -464 -464 -207 -55.4%
net free cash flow after tax paid 1,717 1,718 2,068 20.4%
as % of revenues 12.6% 12.6% 16.5% 3.9 ppt
sales of assets 578 578 7 N/A
proceeds from sale of subsidiaries,
net of cash
64 64 16 N/A
other investing activities -7 -7 -30 N/A
FCF before financing 2,352 2,353 2,061 -12.4%
1
3
income tax paid lower thanks to settlement of tax advances paid last year
4
4
2settlement of payables following higher OPEX in H1’09 combined with reduced expenses in 3Q’09
2
* excluding capex financed by lease
19
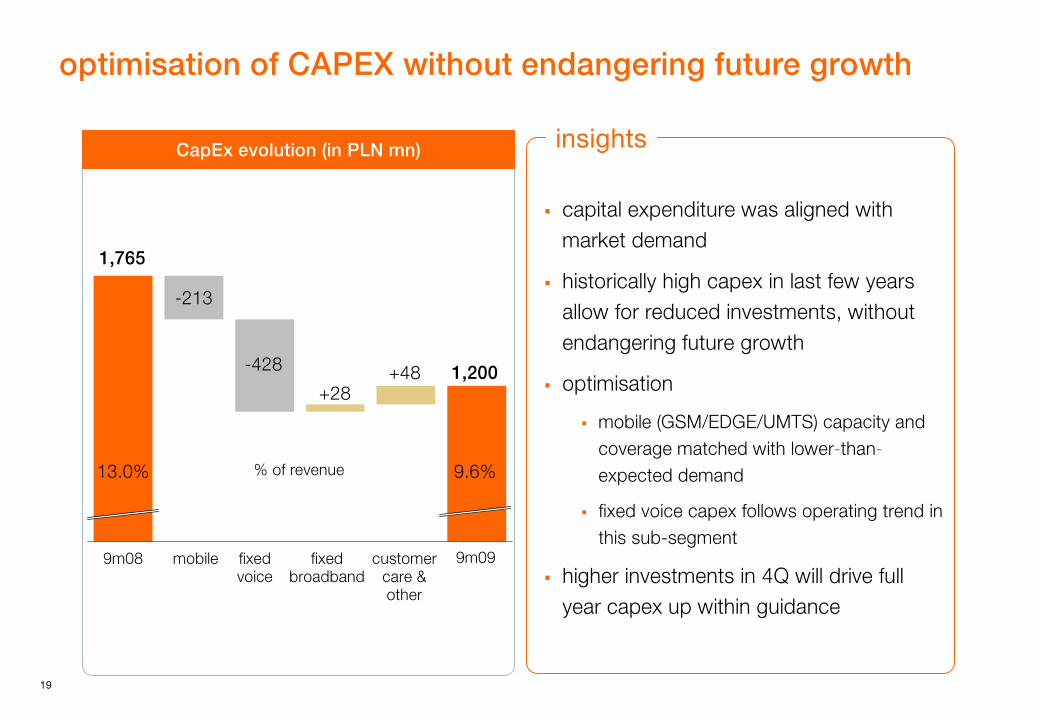
optimisation of CAPEX without endangering future growth
CapEx
evolution (in PLN mn)
1,765
-213
1,200
13.0% 9.6%
+48
capital expenditure was aligned with market demand
historically high capex in last few years allow for reduced investments, without endangering future growth
optimisation
mobile (GSM/EDGE/UMTS) capacity and coverage matched with lower-than-expected demand
fixed voice capex follows operating trend in this sub-segment
higher investments in 4Q will drive full year capex up within guidance
insights
+28
-428
9m08 mobile fixed voice
fixed broadband
customer care & other
9m09
% of revenue
20
31-Dec-08 net free cashflow
dividend other 30-Sep-09
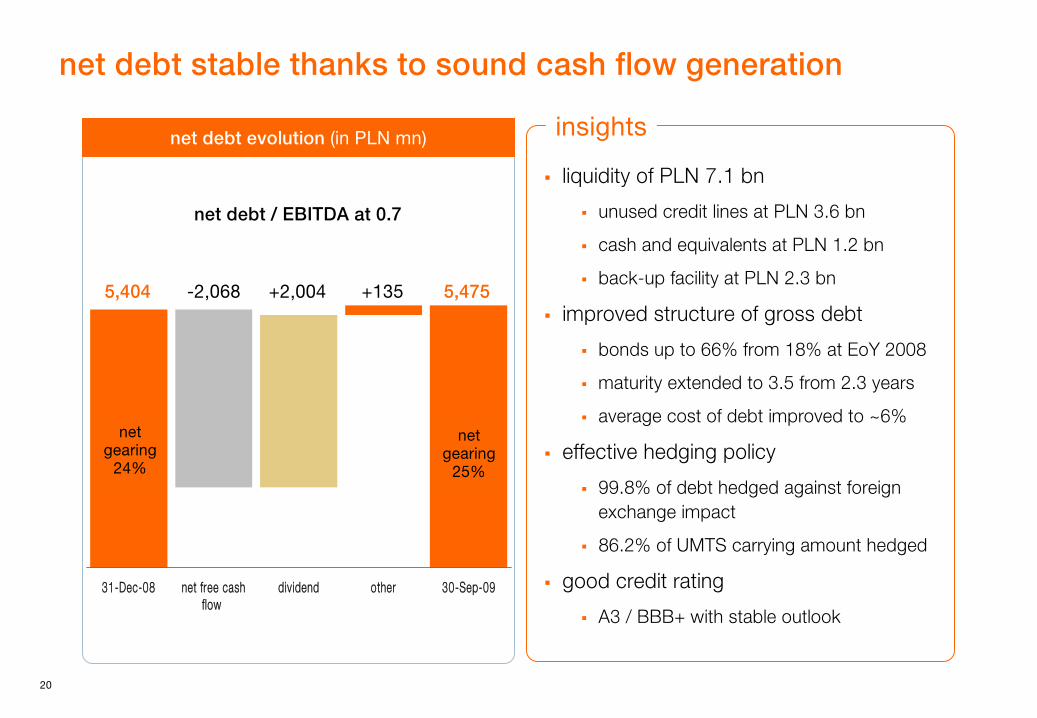
net debt stable thanks to sound cash flow generation
net debt evolution (in PLN mn)
5,404 -2,068 5,475
net gearing
24%
net gearing
25%
+135
net debt / EBITDA at 0.7
liquidity of PLN 7.1 bn
unused credit lines at PLN 3.6 bn
cash and equivalents at PLN 1.2 bn
back-up facility at PLN 2.3 bn
improved structure of gross debt
bonds up to 66% from 18% at EoY 2008
maturity extended to 3.5 from 2.3 years
average cost of debt improved to ~6%
effective hedging policy
99.8% of debt hedged against foreign exchange impact
86.2% of UMTS carrying amount hedged
good credit rating
A3 / BBB+ with stable outlook
insights
+2,004

3 conclusions
Maciej
Witucki president of the board and CEO
22
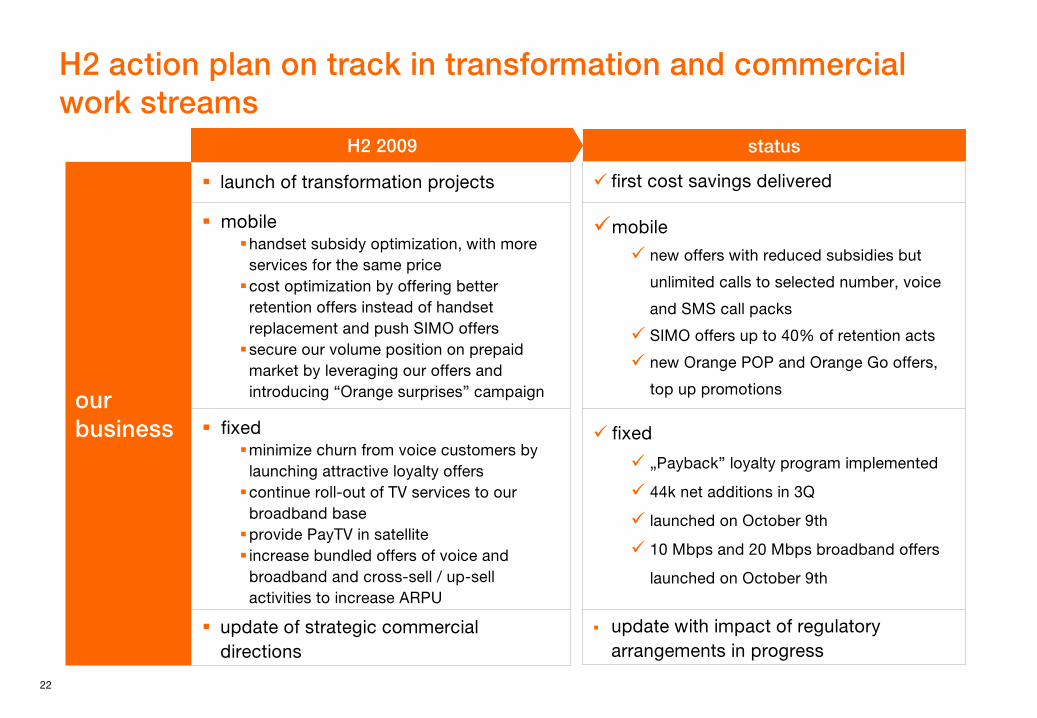
H2 action plan on track in transformation and commercial work streams
our business
launch of transformation projects
update of strategic commercial directions
H2 2009
fixedminimize churn from voice customers by launching attractive loyalty offers continue roll-out of TV services to our broadband baseprovide PayTV in satelliteincrease bundled offers of voice and broadband and cross-sell / up-sell activities to increase ARPU
mobilehandset subsidy optimization, with more services for the same price cost optimization by offering better retention offers instead of handset replacement and push SIMO offerssecure our volume position on prepaid market by leveraging our offers and introducing “Orange surprises” campaign
status
first cost savings delivered
update with impact of regulatory arrangements in progress
mobile
new offers with reduced subsidies but
unlimited calls to selected number, voice
and SMS call packs
SIMO offers up to 40% of retention acts
new Orange POP and Orange Go offers,
top up promotions
fixed
„Payback” loyalty program implemented
44k net additions in 3Q
launched on October 9th
10 Mbps and 20 Mbps broadband offers
launched on October 9th
23
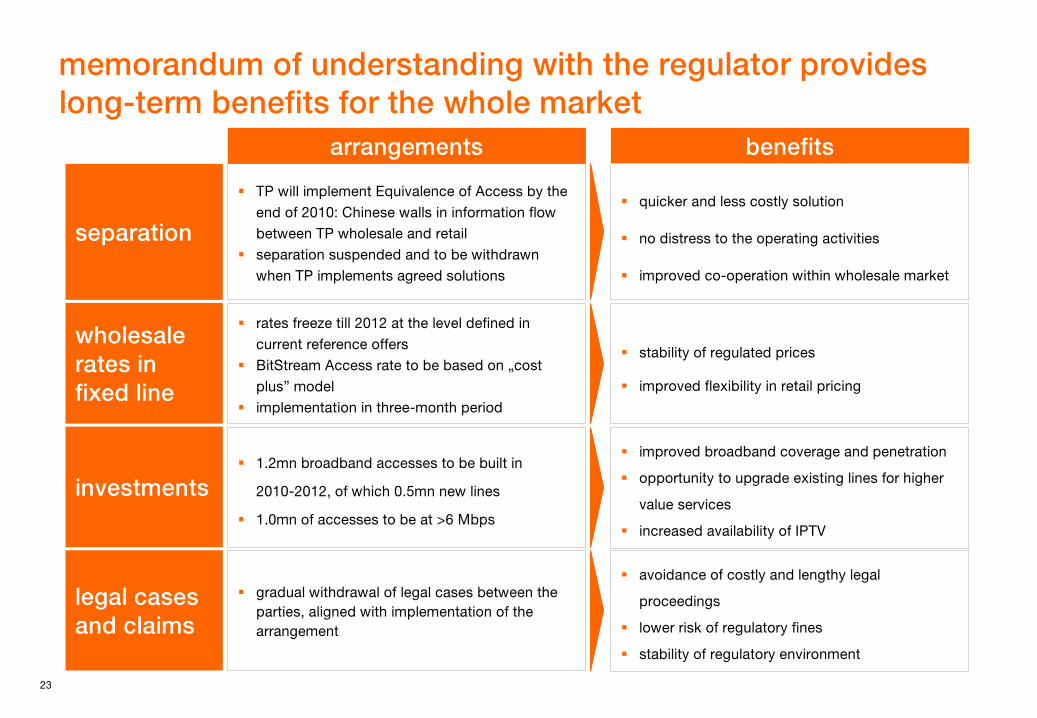
memorandum of understanding with the regulator provides long-term benefits for the whole market
TP will implement Equivalence of Access by the end of 2010: Chinese walls in information flow between TP wholesale and retailseparation suspended and to be withdrawn when TP implements agreed solutions
separation
wholesale rates in fixed line
legal cases and claims
arrangements benefits
quicker and less costly solution
no distress to the operating activities
improved co-operation within wholesale market
rates freeze till 2012 at the level defined in current reference offersBitStream Access rate to be based on „cost plus” modelimplementation in three-month period
stability of regulated prices
improved flexibility in retail pricing
investments1.2mn broadband accesses to be built in
2010-2012, of which 0.5mn new lines
1.0mn of accesses to be at >6 Mbps
improved broadband coverage and penetration
opportunity to upgrade existing lines for higher
value services
increased availability of IPTV
gradual withdrawal of legal cases between the parties, aligned with implementation of the arrangement
avoidance of costly and lengthy legal
proceedings
lower risk of regulatory fines
stability of regulatory environment
24
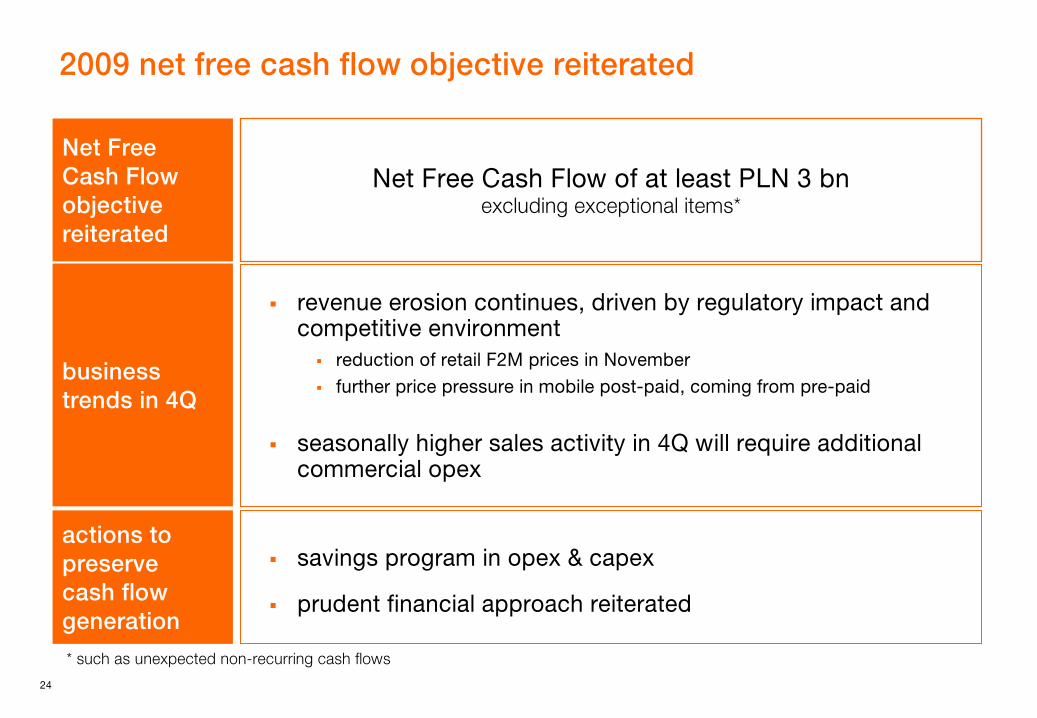
2009 net free cash flow objective reiterated
savings program in opex & capex
prudent financial approach reiterated
Net Free Cash Flow of at least PLN 3 bnexcluding exceptional items*
revenue erosion continues, driven by regulatory impact andcompetitive environment
reduction of retail F2M prices in Novemberfurther price pressure in mobile post-paid, coming from pre-paid
seasonally higher sales activity in 4Q will require additional commercial opex
Net FreeCash Flowobjectivereiterated
business trends in 4Q
actions to preserve
cash flow generation* such as unexpected non-recurring cash flows

4 Q&A session

5 appendices

27
appendices
I. glossary
II. regulatory update
III.
financials
28
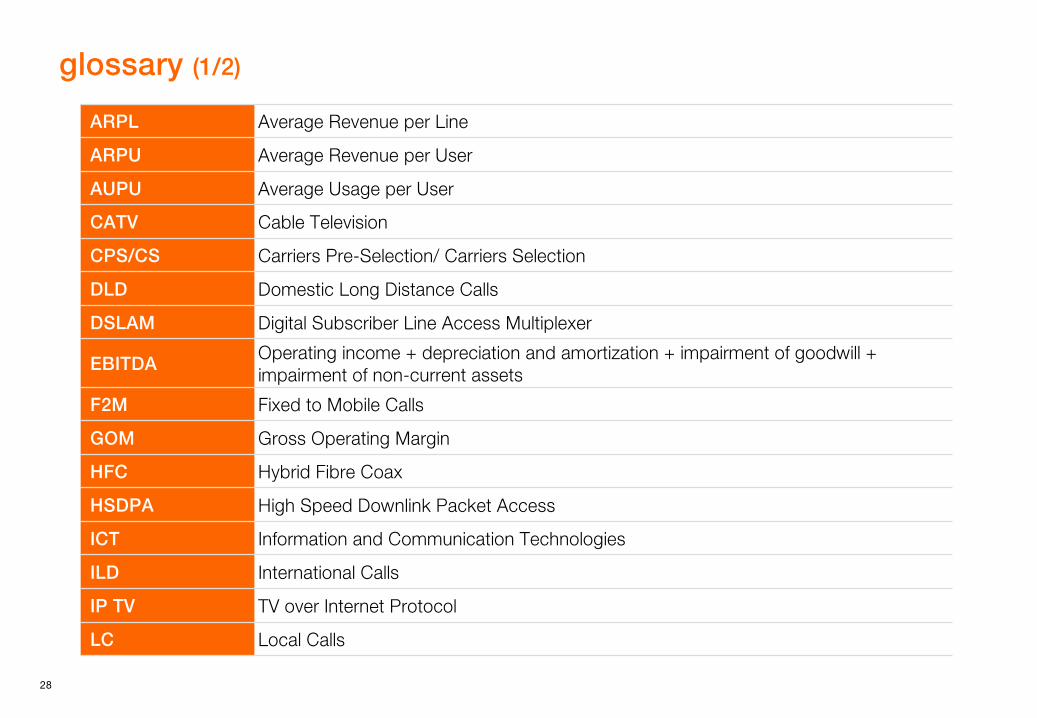
glossary (1/2)
ARPL Average Revenue per Line
ARPU Average Revenue per User
AUPU Average Usage per User
CATV Cable Television
CPS/CS Carriers Pre-Selection/ Carriers Selection
DLD Domestic Long Distance Calls
DSLAM Digital Subscriber Line Access Multiplexer
EBITDAOperating income + depreciation
and amortization +
impairment
of goodwill
+
impairment
of non-current assets
F2M Fixed to Mobile Calls
GOM Gross Operating Margin
HFC Hybrid Fibre Coax
HSDPA High Speed Downlink Packet Access
ICT Information and Communication Technologies
ILD International Calls
IP TV TV over Internet Protocol
LC Local Calls
29
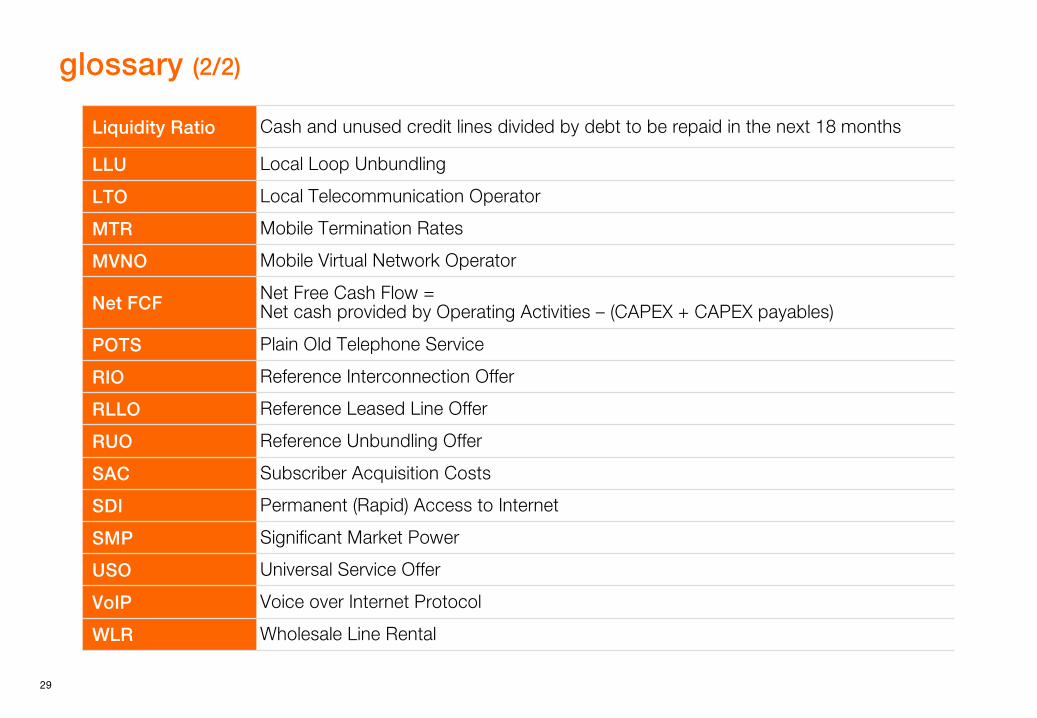
glossary (2/2)
Liquidity Ratio Cash and unused credit lines divided by debt to be repaid in the next 18 months
LLU Local Loop Unbundling
LTO Local Telecommunication Operator
MTR Mobile Termination Rates
MVNO Mobile Virtual Network Operator
Net FCF Net Free Cash Flow = Net cash provided by Operating Activities –
(CAPEX + CAPEX payables)
POTS Plain Old Telephone Service
RIO Reference Interconnection Offer
RLLO Reference Leased Line Offer
RUO Reference Unbundling Offer
SAC Subscriber Acquisition Costs
SDI Permanent (Rapid) Access to Internet
SMP Significant Market Power
USO Universal Service Offer
VoIP Voice over Internet Protocol
WLR Wholesale Line Rental

30
appendices
I. glossary
II.
regulatory update
III.
financials

31
appendices
I. glossary
II.
regulatory update
III.
financials
32
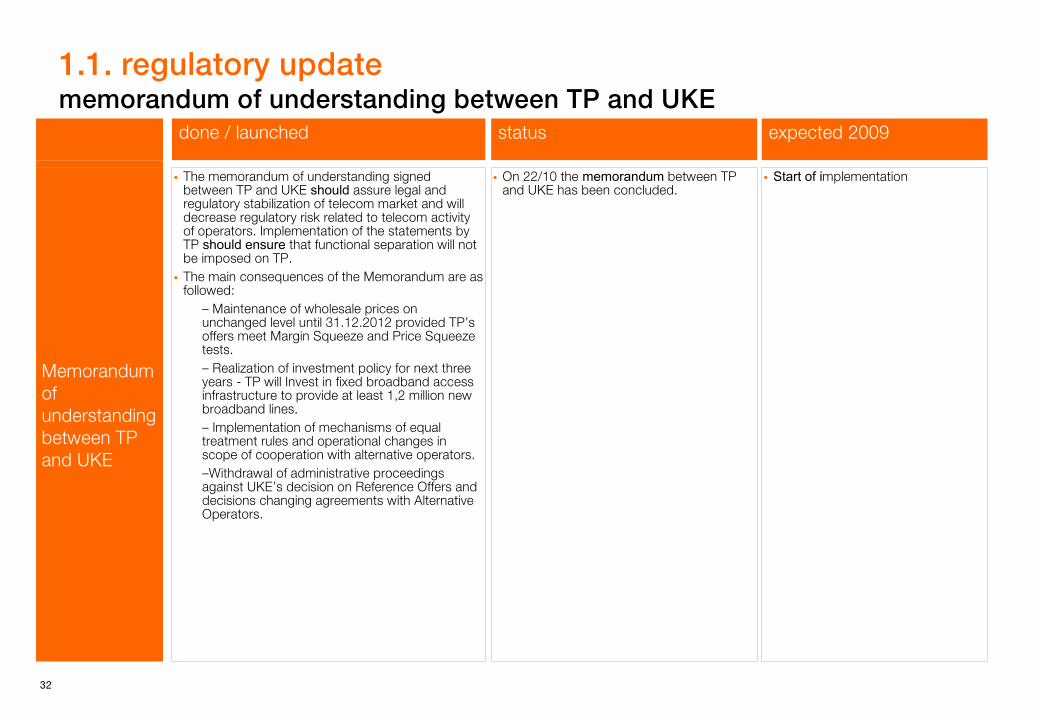
1.1. regulatory update memorandum of understanding between TP and UKE
done / launched status expected 2009
Memorandum of understanding between TP and UKE
The memorandum of understanding signed between TP and UKE should assure legal and regulatory stabilization of telecom market and will decrease regulatory risk related to telecom activity of operators. Implementation of the statements by TP should ensure that functional separation will not be imposed on TP. The main consequences of the Memorandum are as followed:
–
Maintenance of wholesale prices on unchanged level until 31.12.2012 provided TP’s
offers meet Margin Squeeze and Price Squeeze tests. –
Realization of investment policy for next three years -
TP will Invest in fixed broadband access infrastructure to provide at least 1,2 million new broadband lines.–
Implementation of mechanisms of equal treatment rules and operational changes in scope of cooperation with alternative operators.–Withdrawal of administrative proceedings against UKE’s
decision on Reference Offers and decisions changing agreements with Alternative Operators.
On 22/10 the memorandum between TP and UKE has been concluded.
Start of implementation
33
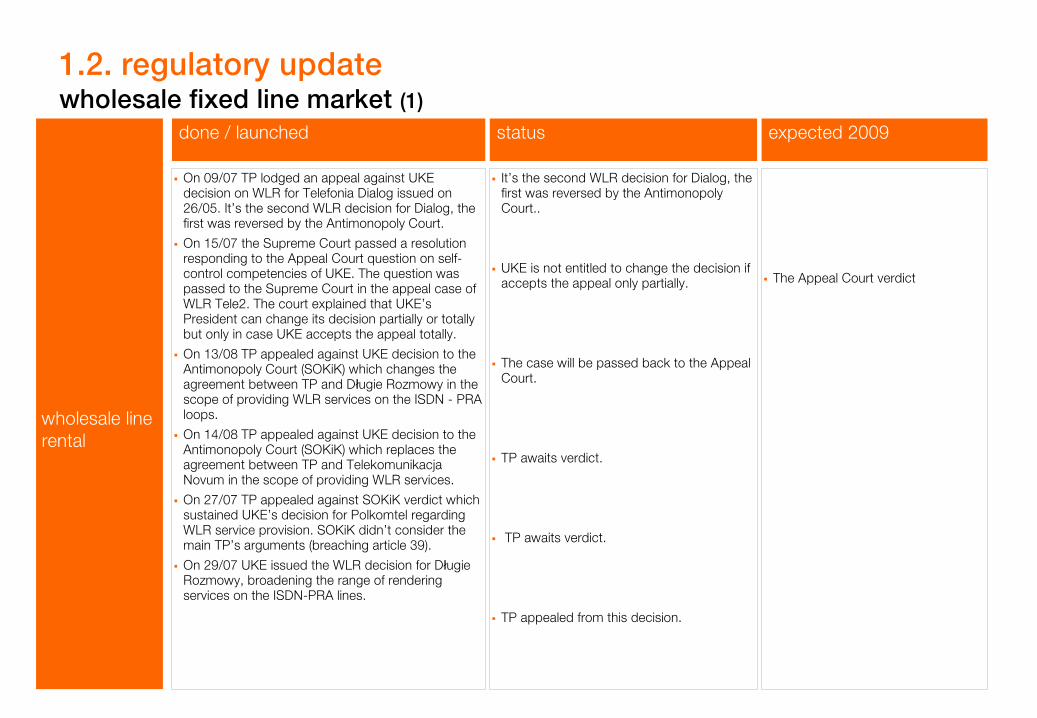
1.2. regulatory update wholesale fixed line market (1)
done / launched status expected 2009
wholesale line rental
On 09/07 TP lodged an appeal against UKE decision on WLR for Telefonia Dialog issued on 26/05. It’s the second WLR decision for Dialog, the first was reversed by the Antimonopoly Court.
On 15/07 the Supreme Court passed a resolution responding to the Appeal Court question on self-control competencies of UKE. The question was passed to the Supreme Court in the appeal case of WLR Tele2. The court explained that UKE’s President can change its decision partially or totally but only in case UKE accepts the appeal totally.
On 13/08 TP appealed against UKE decision to the Antimonopoly Court (SOKiK) which changes the agreement between TP and Długie Rozmowy in the scope of providing WLR services on the ISDN - PRA loops.
On 14/08 TP appealed against UKE decision to the Antimonopoly Court (SOKiK) which replaces the agreement between TP and Telekomunikacja Novum in the scope of providing WLR services.
On 27/07 TP appealed against SOKiK verdict which sustained UKE’s decision for Polkomtel regarding WLR service provision. SOKiK didn’t consider the main TP’s arguments (breaching article 39).
On 29/07 UKE issued the WLR decision for Długie Rozmowy, broadening the range of rendering services on the ISDN-PRA lines.
It’s the second WLR decision for Dialog, the first was reversed by the Antimonopoly Court..
UKE is not entitled to change the decision if accepts the appeal only partially.
The case will be passed back to the Appeal Court.
TP awaits verdict.
TP awaits verdict.
TP appealed from this decision.
The Appeal Court verdict
34
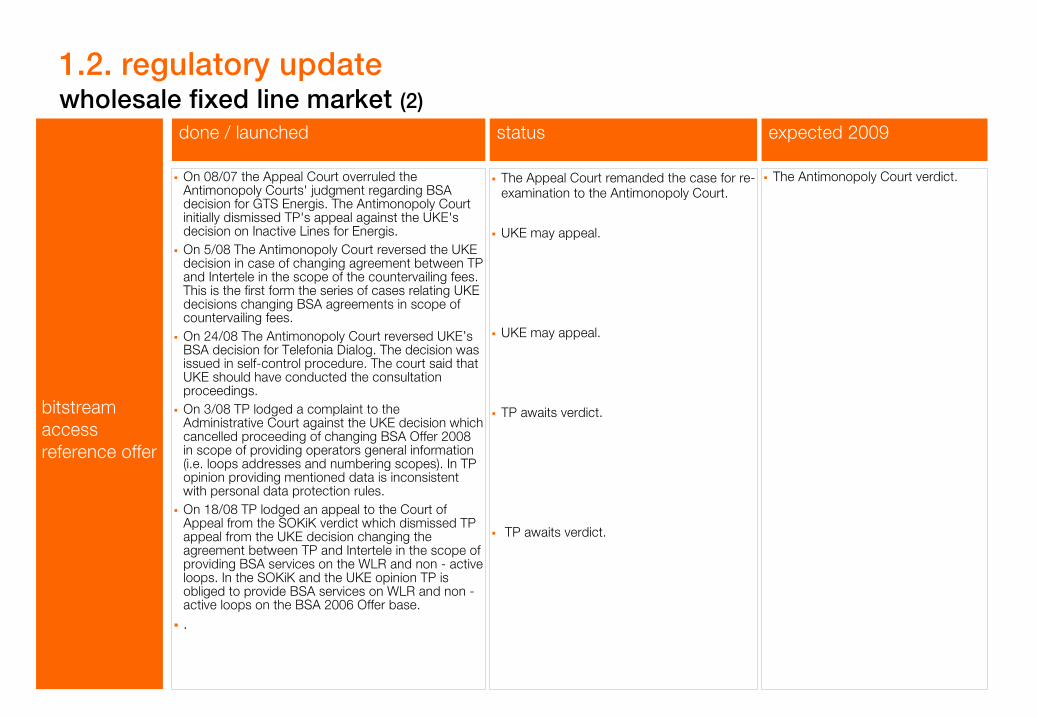
1.2. regulatory update wholesale fixed line market (2)
done / launched status expected 2009
bitstream access reference offer
On 08/07 the Appeal Court overruled the Antimonopoly Courts' judgment regarding BSA decision for GTS Energis. The Antimonopoly Court initially dismissed TP's appeal against the UKE's decision on Inactive Lines for Energis.On 5/08 The Antimonopoly Court reversed the UKE decision in case of changing agreement between TP and Intertele in the scope of the countervailing fees. This is the first form the series of cases relating UKE decisions changing BSA agreements in scope of countervailing fees. On 24/08 The Antimonopoly Court reversed UKE’s BSA decision for Telefonia Dialog. The decision was issued in self-control procedure. The court said that UKE should have conducted the consultation proceedings.On 3/08 TP lodged a complaint to the Administrative Court against the UKE decision which cancelled proceeding of changing BSA Offer 2008 in scope of providing operators general information (i.e. loops addresses and numbering scopes). In TP opinion providing mentioned data is inconsistent with personal data protection rules.On 18/08 TP lodged an appeal to the Court of Appeal from the SOKiK verdict which dismissed TP appeal from the UKE decision changing the agreement between TP and Intertele in the scope of providing BSA services on the WLR and non - active loops. In the SOKiK and the UKE opinion TP is obliged to provide BSA services on WLR and non -active loops on the BSA 2006 Offer base..
The Appeal Court remanded the case for re-examination to the Antimonopoly Court.
UKE may appeal.
UKE may appeal.
TP awaits verdict.
TP awaits verdict.
The Antimonopoly Court verdict.
35
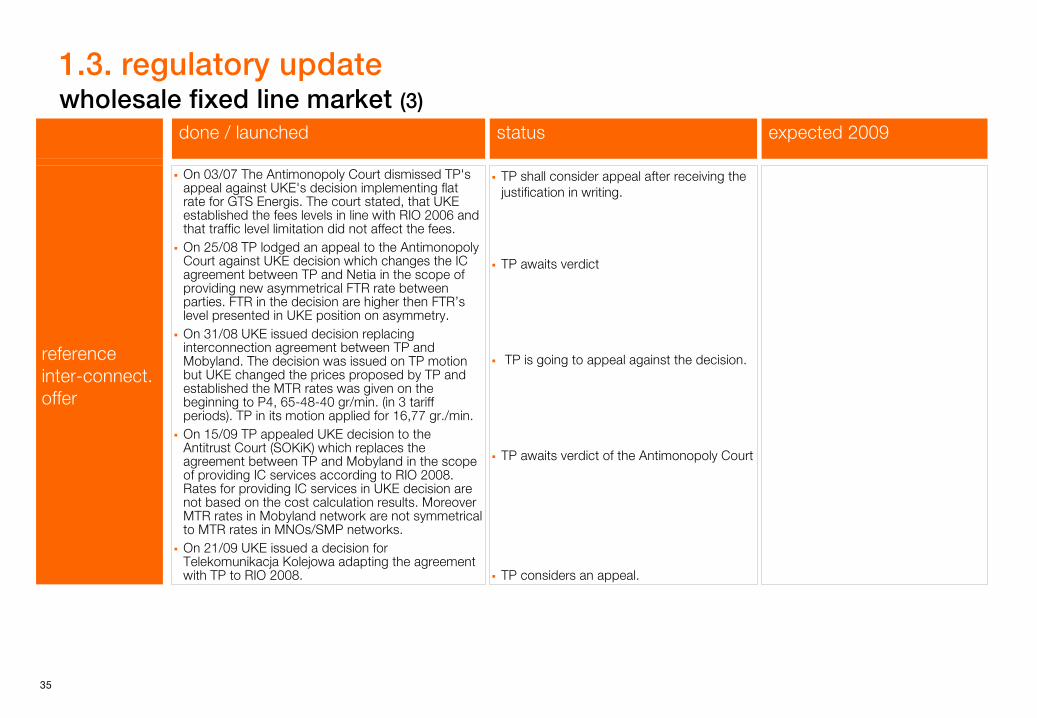
1.3. regulatory update wholesale fixed line market (3)
done / launched status expected 2009
reference inter-connect. offer
On 03/07 The Antimonopoly Court dismissed TP's appeal against UKE's decision implementing flat rate for GTS Energis. The court stated, that UKE established the fees levels in line with RIO 2006 and that traffic level limitation did not affect the fees. On 25/08 TP lodged an appeal to the Antimonopoly Court against UKE decision which changes the IC agreement between TP and Netia in the scope of providing new asymmetrical FTR rate between parties. FTR in the decision are higher then FTR’s level presented in UKE position on asymmetry.On 31/08 UKE issued decision replacing interconnection agreement between TP and Mobyland. The decision was issued on TP motion but UKE changed the prices proposed by TP and established the MTR rates was given on the beginning to P4, 65-48-40 gr/min. (in 3 tariff periods). TP in its motion applied for 16,77 gr./min. On 15/09 TP appealed UKE decision to the Antitrust Court (SOKiK) which replaces the agreement between TP and Mobyland in the scope of providing IC services according to RIO 2008. Rates for providing IC services in UKE decision are not based on the cost calculation results. MoreoverMTR rates in Mobyland network are not symmetrical to MTR rates in MNOs/SMP networks.On 21/09 UKE issued a decision for Telekomunikacja Kolejowa adapting the agreement with TP to RIO 2008.
TP shall consider appeal after receiving the justification in writing.
TP awaits verdict
TP is going to appeal against the decision.
TP awaits verdict of the Antimonopoly Court
TP considers an appeal.
36
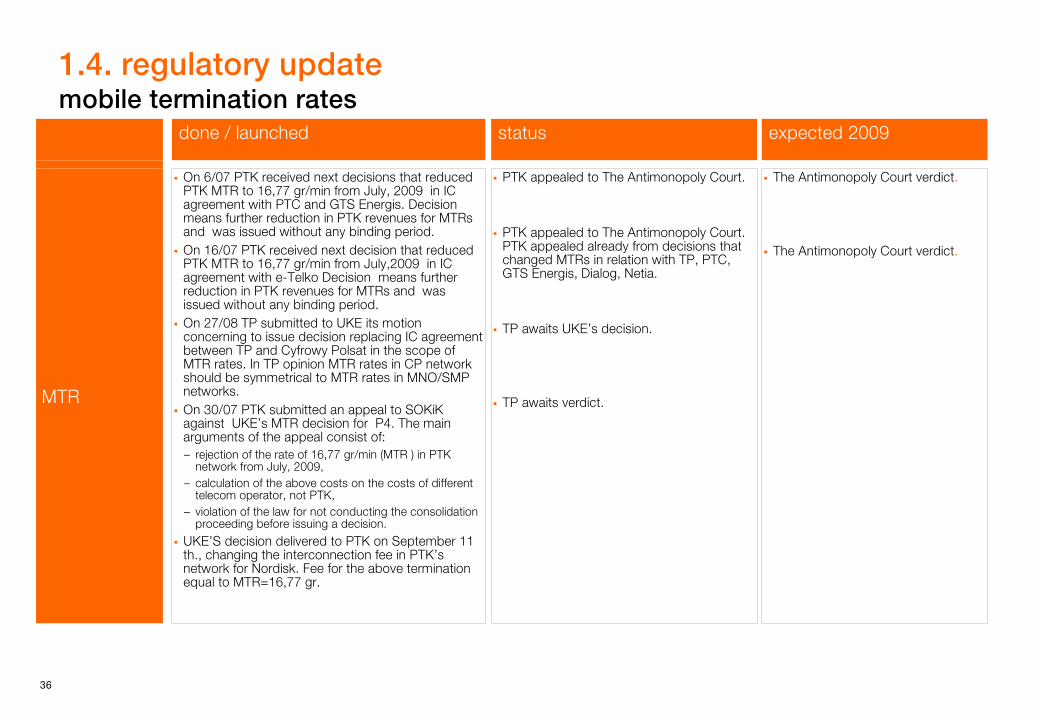
1.4. regulatory update mobile termination rates
done / launched status expected 2009
MTR
On 6/07 PTK received next decisions that reduced PTK MTR to 16,77 gr/min from July, 2009 in IC agreement with PTC and GTS Energis. Decision means further reduction in PTK revenues for MTRs and was issued without any binding period. On 16/07 PTK received next decision that reduced PTK MTR to 16,77 gr/min from July,2009 in IC agreement with e-Telko Decision means further reduction in PTK revenues for MTRs and was issued without any binding period. On 27/08 TP submitted to UKE its motion concerning to issue decision replacing IC agreement between TP and Cyfrowy Polsat in the scope of MTR rates. In TP opinion MTR rates in CP network should be symmetrical to MTR rates in MNO/SMP networks.On 30/07 PTK submitted an appeal to SOKiK against UKE’s MTR decision for P4. The main arguments of the appeal consist of: –
rejection of the rate of 16,77 gr/min (MTR ) in PTK network from July, 2009,
–
calculation of the above costs on the costs of different telecom operator, not PTK,
–
violation of the law for not conducting the consolidation proceeding before issuing a decision.
UKE’S decision delivered to PTK on September 11 th., changing the interconnection fee in PTK’s network for Nordisk. Fee for the above termination equal to MTR=16,77 gr.
PTK appealed to The Antimonopoly Court.
PTK appealed to The Antimonopoly Court. PTK appealed already from decisions that changed MTRs in relation with TP, PTC, GTS Energis, Dialog, Netia.
TP awaits UKE’s decision.
TP awaits verdict.
The Antimonopoly Court verdict.
The Antimonopoly Court verdict.
37
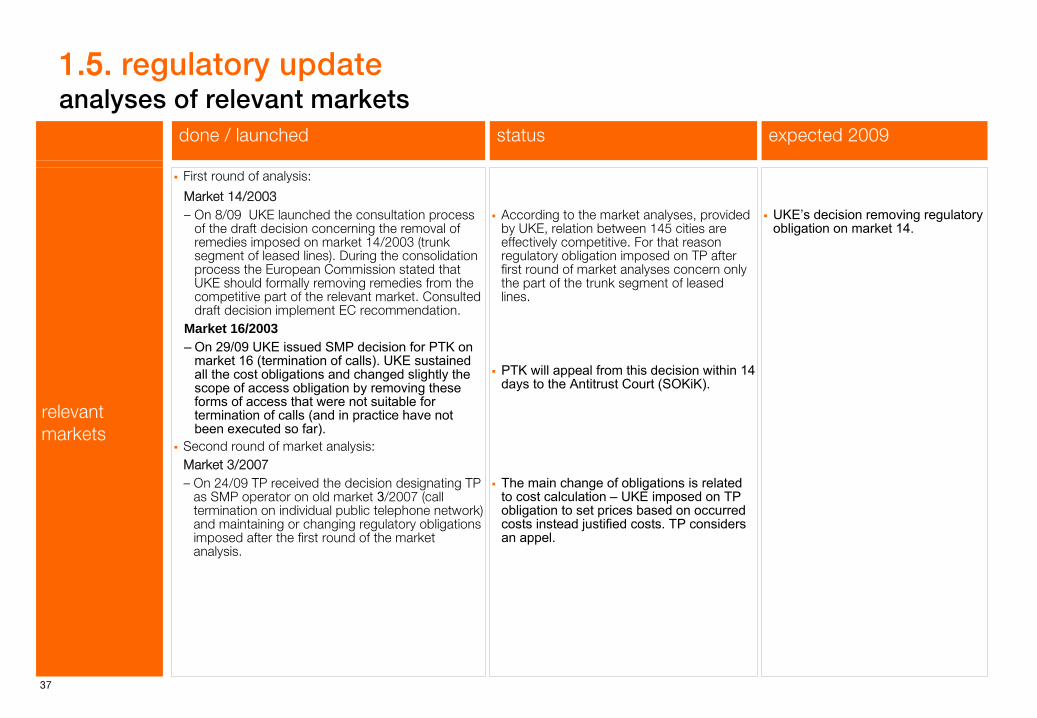
1.5. regulatory update analyses of relevant markets
done / launched status expected 2009
relevant markets
First round of analysis:
Market 14/2003–
On 8/09 UKE launched the consultation process of the draft decision concerning the removal of remedies imposed on market 14/2003 (trunk segment of leased lines). During the consolidation process the European Commission stated that UKE should formally removing remedies from the competitive part of the relevant market. Consulted draft decision implement EC recommendation.
Market 16/2003–
On 29/09 UKE issued SMP decision for PTK on market 16 (termination of calls). UKE sustained all the cost obligations and changed slightly the scope of access obligation by removing these forms of access that were not suitable for termination of calls (and in practice have not been executed so far).
According to the market analyses, provided by UKE, relation between 145 cities are effectively competitive. For that reason regulatory obligation imposed on TP after first round of market analyses concern only the part of the trunk segment of leased lines.
PTK will appeal from this decision within 14 days to the Antitrust Court (SOKiK).
UKE’s decision removing regulatory obligation on market 14.
Second round of market analysis:Market 3/2007–
On 24/09 TP received the decision designating TP as SMP operator on old market 3/2007 (call termination on individual public telephone network) and maintaining or changing regulatory obligations imposed after the first round of the market analysis.
The main change of obligations is related to cost calculation – UKE imposed on TP obligation to set prices based on occurred costs instead justified costs. TP considers an appel.
38
1.6. regulatory update other issues
(1)
done / launched status expected 2009
net cost deficit
On 2th of July TP sent the claim regarding UKE’s non-activity in the case of net cost of universal service obligation for the year 2007 (218 M PLN). TP asked the court to oblige UKE to issue the decision in 2 months from receiving the verdict. On 5/08 the Supreme Administrative Court (NSA) gave a verdict concerning UKE’s decision refusing TP to grant net cost of USO for 2006 (140 M PLN). UKE stated that TP had not provide all information required to analyze the case. At the same time UKE refused TP to indicate such information.So far TP applied for net cost deficit for years 2006 (139,9 M PLN), 2007 (219,2 M PLN - case is pending), and 2008 (208,4 M PLN - case is pending).
The term meets the date for the expert called by UKE to provide its opinion in the case.
NSA maintained the verdict of the first instance (WSA) annulling UKE’s decision. According to the court, UKE is obliged to analyze the case, to gather all needed information and to indicate information required from TP.
The trial at WSA is expected on the end of October.
UKE decisions regarding net cost deficit for the year 2006, 2007 and 2008 are expected most likely after finishing the net cost deficit audit announced by UKE. Audit should be finished till December 2009.
reference unbundling offer
On 05/08 TP lodged an appeal against UKE's decision amending previous LLU decision for Netia in the area of: inspections, contractual penalties, discounts.On 28/07 UKE issued a decision for Netia on LLU adjusting fees to RUO 2009.
TP awaits verdict.
TP considers the appeal.
39
1.7. regulatory update other issues
(2)
done / launched status expected 2009
reference offer of infrastructure (access to ducts)
On 04/08 TP submitted a motion to re-examine UKE's decision obliging TP to prepare amendment to ROI reference offer (mainly in the area of cable wells). The decision imposes obligation to exceed the area originally regulated in ROI, e.g. by including cable wells into the cable ducts, which allows the AOs to install their own devices into the cable wells, imposing on TP obligation to hand over the ordered ducts in permeable condition under the contractual penalty.On 20/08 TP submitted draft ROI offer amendment within the execution of obligation imposed on TP in UKE's decision
TP awaits decision of UKE.
TP awaits decision of UKE.
peering
On 10/07 President of UKE announced consultation of solution regarding exchange of IP traffic (peering service) between TP and Netia. Consortium (Audytel and Instytut Łączności) prepared consultation document proposing following solutions in order to regulate cooperation between operators. UKE in its announcement indicated, that till now exchange of IP traffic does not fall in scope of any finished market analysis and for this reason there is no operator having significant market power on relevant market and there is no regulatory obligation imposed on any player. Possible deciding of dispute between TP and Netia should be succeed after relevant market analysis related to peering services.
On 10/08 TP sent to UKE its position regarding the peering document, prepared by Instytut Łączności and Audytel and published by UKE for the consultation. The document provides the possibilities for settling the dispute between TP and Netia concerning peering agreement. IŁ and Audytel have not recommend to implement regulation. TP’s support this position and also provided the arguments showing that the other possibilities are harmful for the market and they are not consistent with the European law and the Commission decision concerning peering and IP transit.
40
1.8. regulatory update other issues
done / launched status expected 2009
Nation-wide directory service
On 4/08 SOKiK issued verdict in case of cooperation with Radiokomunikacja in scope of nation-wide directory (OBN/OSA). The court reversed UKE’s decision and stated that decision is not in line with TP’s motion in scope of the obligation to publish free of charge directory. TP implemented the decision because of the immediate execution clause. On 4/08 the Appeal Court dismissed SOKiK’s verdict regarding UKE decision regulating cooperation between TP and Multimedia Polska in scope of nation-wide directory (OBN/OSA). SOKiK reversed UKE’s decision. The Court decided that the case should be revised by SOKiK.
UKE may appeal.
The case will be revised by SOKiK.
41
1.9. regulatory update other issues
done / launched status expected 2009
EC Inspection
In September 2008, the European Commission conducted an inspection at the premises of TP and PTK-Centertel. The aim of the inspection was to gather evidence of a possible breach by TP of competition rules on the broadband Internet market. The Company has challenged, before the European Court of First Instance, the decision of the European Commission that was the basis for its inspection. On 17 April 2009, the European Commission notified TP of its intention to initiate proceedings on supposed refusal to provide services and non-price discrimination on the Polish wholesale market of broadband access to the Internet. The European Commission will issue a formal decision on initiating the proceeding which will describe the alleged infringements. On 27 April 2009, the European Commission published a memo confirming that the opening of the proceedings did not in itself imply that the European Commission had proof of infringements by Telekomunikacja Polska.
The European Commission has no deadline to complete an antitrust investigation.
At this stage of the proceedings, it is not feasible to foresee the consequences of such proceedings.
42
1.10.
regulatory update fines imposed on TP and its subsidiaries (1)
done / launched status expected 2009
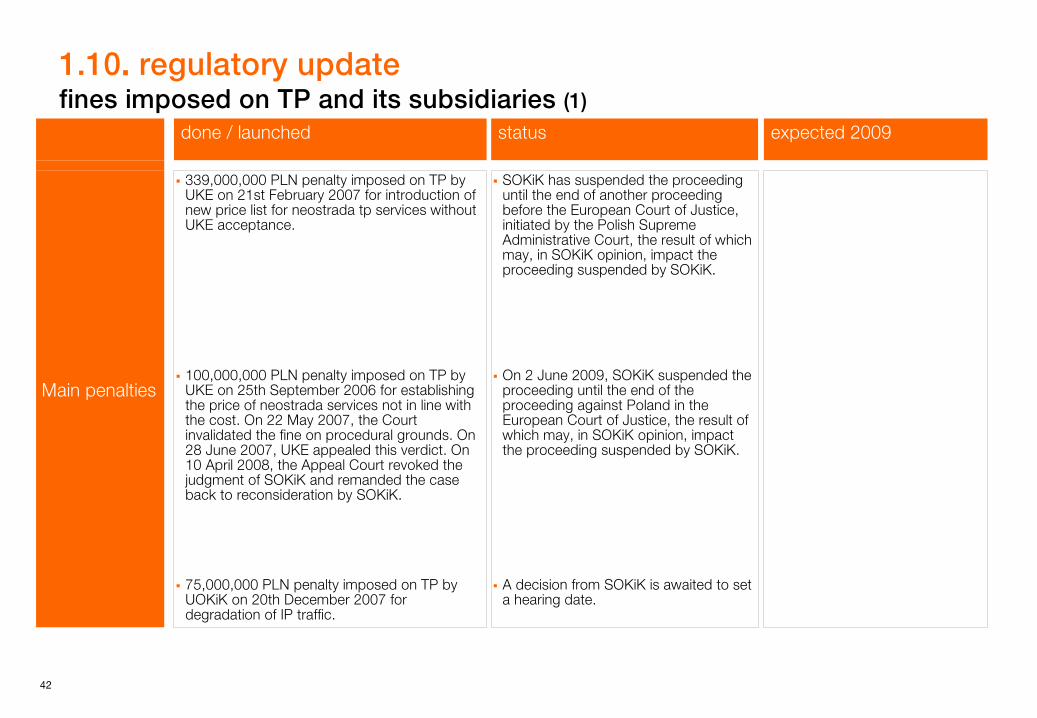
Main penalties
339,000,000 PLN penalty imposed on TP by UKE on 21st February 2007 for introduction of new price list for neostrada tp services without UKE acceptance.
SOKiK has suspended the proceeding until the end of another proceeding before the European Court of Justice, initiated by the Polish Supreme Administrative Court, the result of which may, in SOKiK opinion, impact the proceeding suspended by SOKiK.
100,000,000 PLN penalty imposed on TP by UKE on 25th September 2006 for establishing the price of neostrada services not in line with the cost. On 22 May 2007, the Court invalidated the fine on procedural grounds. On 28 June 2007, UKE appealed this verdict. On 10 April 2008, the Appeal Court revoked the judgment of SOKiK and remanded the case back to reconsideration by SOKiK.
On 2 June 2009, SOKiK suspended the proceeding until the end of the proceeding against Poland in the European Court of Justice, the result of which may, in SOKiK opinion, impact the proceeding suspended by SOKiK.
75,000,000 PLN penalty imposed on TP by UOKiK on 20th December 2007 for degradation of IP traffic.
A decision from SOKiK is awaited to set a hearing date.
43
1.11.
regulatory update fines imposed on TP and its subsidiaries (2)
done / launched status expected 2009
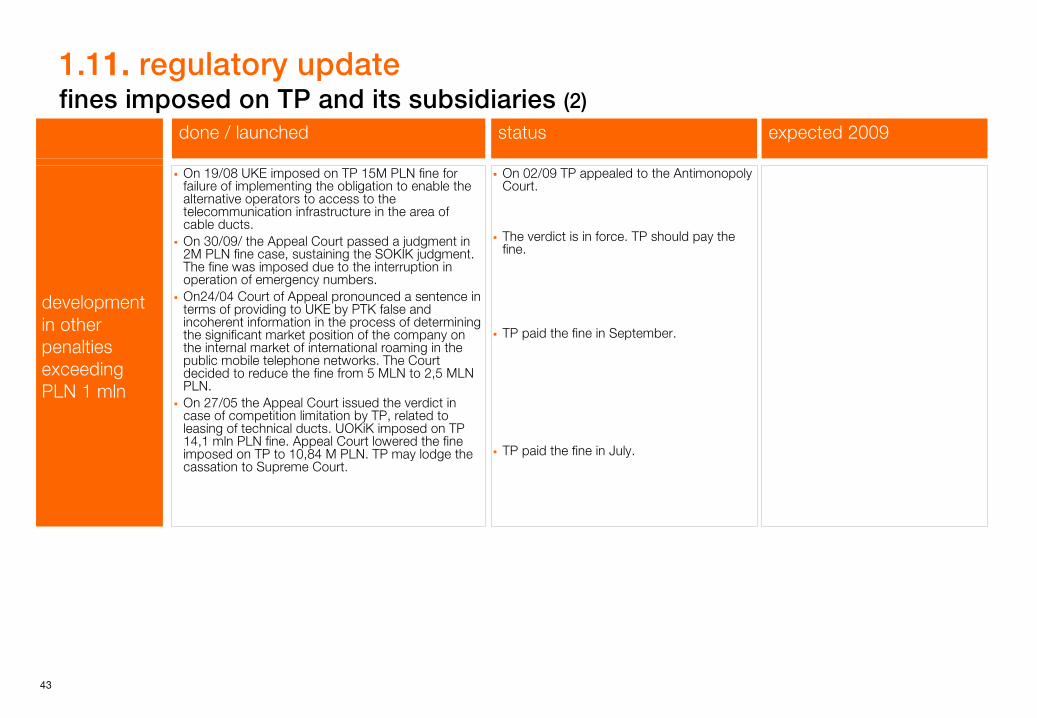
development in other penalties exceeding PLN 1 mln
On 19/08 UKE imposed on TP 15M PLN fine for failure of implementing the obligation to enable the alternative operators to access to the telecommunication infrastructure in the area of cable ducts. On 30/09/ the Appeal Court passed a judgment in 2M PLN fine case, sustaining the SOKIK judgment. The fine was imposed due to the interruption in operation of emergency numbers. On24/04 Court of Appeal pronounced a sentence in terms of providing to UKE by PTK false and incoherent information in the process of determining the significant market position of the company on the internal market of international roaming in the public mobile telephone networks. The Court decided to reduce the fine from 5 MLN to 2,5 MLN PLN.On 27/05 the Appeal Court issued the verdict in case of competition limitation by TP, related to leasing of technical ducts. UOKiK imposed on TP 14,1 mln PLN fine. Appeal Court lowered the fine imposed on TP to 10,84 M PLN. TP may lodge the cassation to Supreme Court.
On 02/09 TP appealed to the Antimonopoly Court.
The verdict is in force. TP should pay the fine.
TP paid the fine in September.
TP paid the fine in July.

44
appendices
I. glossary
II. regulatory update
III.
financials
45
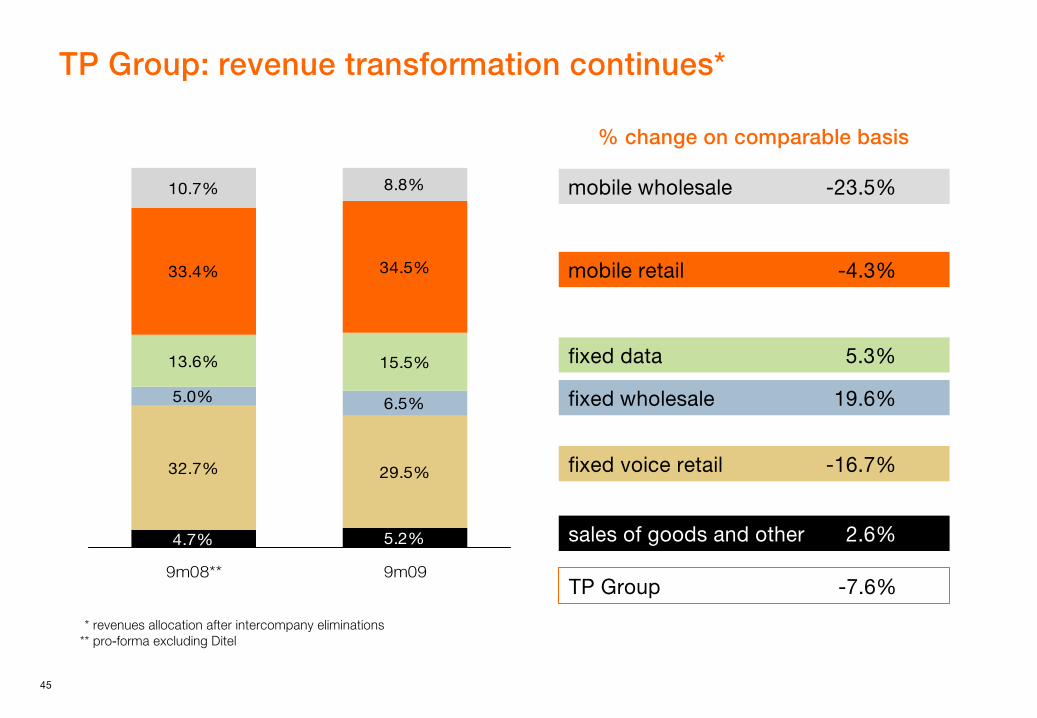
TP Group: revenue transformation continues*
*
revenues allocation after intercompany eliminations**
pro-forma excluding Ditel
5.2%
32.7% 29.5%
5.0% 6.5%
13.6% 15.5%
33.4% 34.5%
10.7% 8.8%
4.7%
9m08** 9m09
mobile retail
-4.3%
fixed data
5.3%
fixed voice retail
-16.7%
fixed wholesale
19.6%
TP Group
-7.6%
mobile wholesale
-23.5%
% change on comparable basis
sales of goods and other
2.6%
46
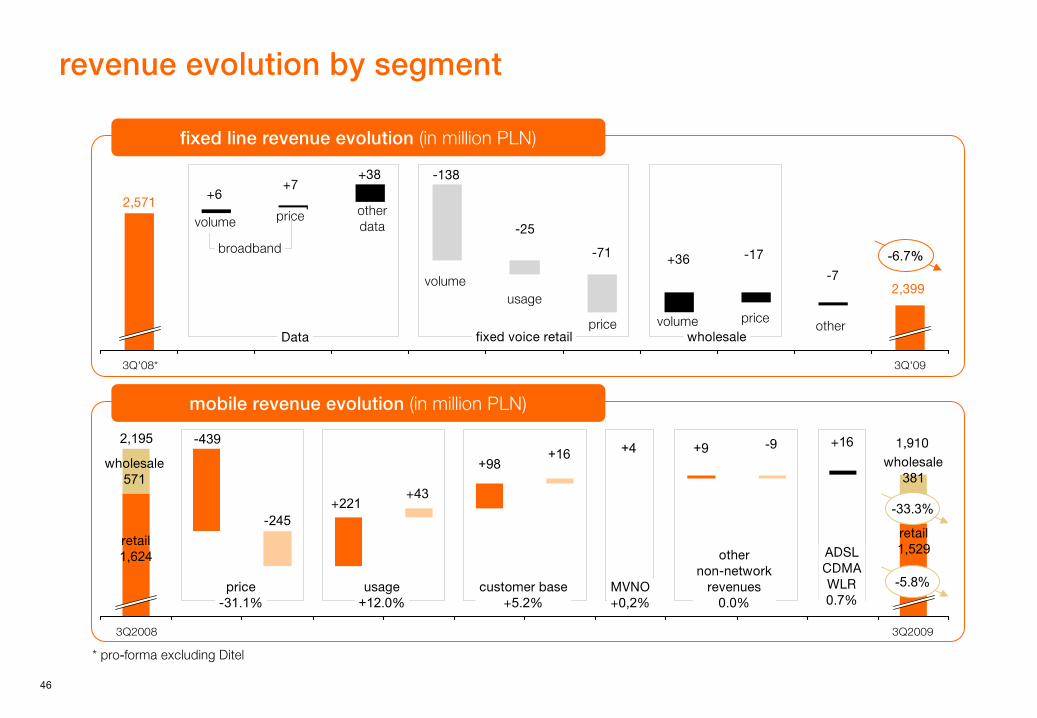
revenue evolution by segment
3Q'08* 3Q'09
fixed line revenue evolution (in million PLN)
mobile revenue evolution (in million PLN)
3Q2008 3Q2009
2,571
2,195
2,399
+6+7
+38 -138
-25
-71 +36 -17
-7
-245+221
+981,910+4
-439
+43
+16wholesale
381
wholesale
571
retail
1,624
retail
1,529
+9 +16-9
volume price other
data
Data fixed voice retail wholesaleother
volumeusage
price volume price
-6.7%
price
-31.1%
usage
+12.0%
customer base
+5.2%
MVNO
+0,2%
other
non-network
revenues
0.0%
ADSL
CDMA
WLR
0.7%
broadband
-33.3%
* pro-forma excluding Ditel
-5.8%
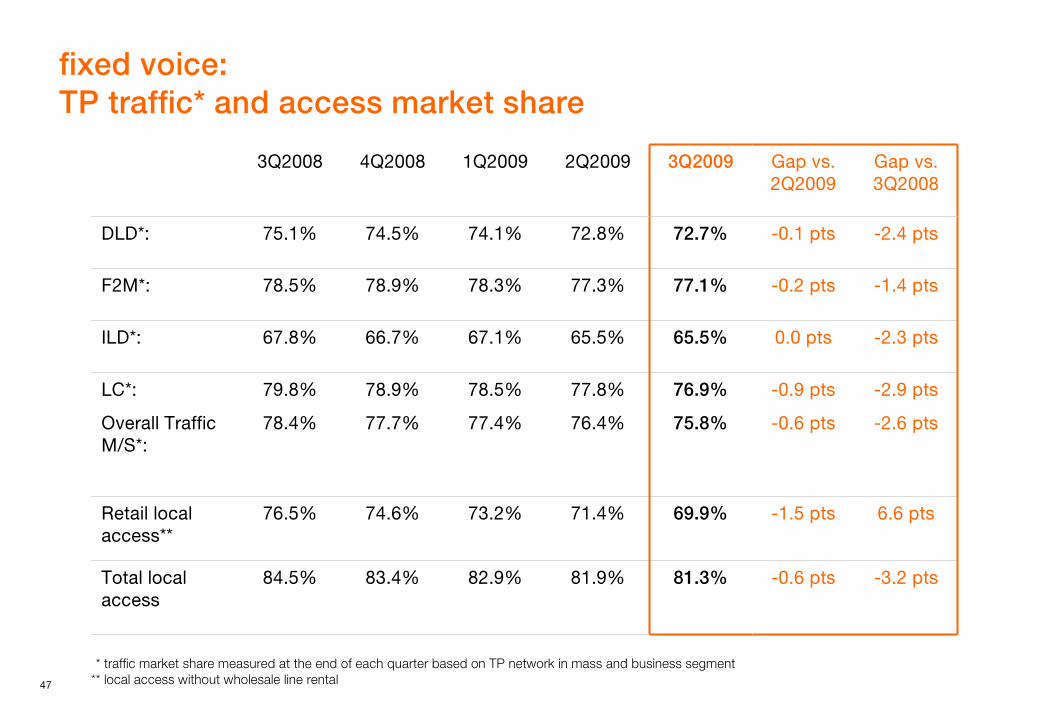
47
fixed voice: TP traffic* and access market share
*
traffic market share measured at the end of each quarter based on TP network in mass and business segment**
local access without wholesale line rental
3Q2008 4Q2008 1Q2009 2Q2009 3Q2009 Gap vs. 2Q2009
Gap vs. 3Q2008
DLD*: 75.1% 74.5% 74.1% 72.8% 72.7% -0.1 pts -2.4 pts
F2M*: 78.5% 78.9% 78.3% 77.3% 77.1% -0.2 pts -1.4 pts
ILD*: 67.8% 66.7% 67.1% 65.5% 65.5% 0.0 pts -2.3 pts
LC*:
Overall Traffic M/S*:
79.8%
78.4%
78.9%
77.7%
78.5%
77.4%
77.8%
76.4%
76.9%
75.8%
-0.9 pts
-0.6 pts
-2.9 pts
-2.6 pts
Retail local access**
76.5% 74.6% 73.2% 71.4% 69.9% -1.5 pts 6.6 pts
Total local
access
84.5% 83.4% 82.9% 81.9% 81.3% -0.6 pts -3.2 pts
48
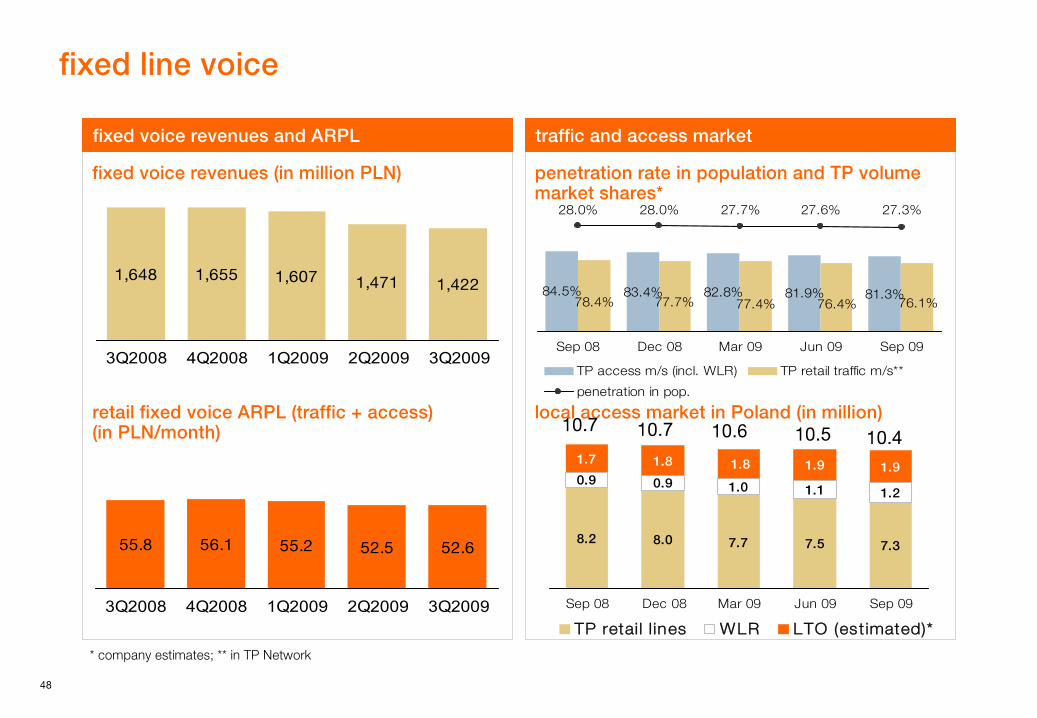
fixed line voice
fixed voice revenues and ARPL traffic and access market
* company estimates; ** in TP Network
fixed voice revenues (in million PLN)
55.8 56.1 55.2 52.5 52.6
3Q2008 4Q2008 1Q2009 2Q2009 3Q2009
retail fixed voice ARPL (traffic + access) (in PLN/month)
penetration rate
in
population
and TP volume
market shares*
local access market in Poland (in million)
1,648 1,655 1,607 1,471 1,422
3Q2008 4Q2008 1Q2009 2Q2009 3Q2009
84.5% 83.4% 82.8% 81.9% 81.3%76.1%76.4%77.4%77.7%78.4%
28.0% 28.0% 27.7% 27.6% 27.3%
Sep 08 Dec 08 Mar 09 Jun 09 Sep 09
TP access m/s (incl. WLR) TP retail traffic m/s**
penetration in pop.
8.2 8.0 7.7 7.5 7.3
0.9 0.9 1.0 1.1 1.2
1.7 1.8 1.9 1.91.8
Sep 08 Dec 08 Mar 09 Jun 09 Sep 09
TP retail l ines WLR LTO (estimated)*
10.5 10.410.7 10.7 10.6
49
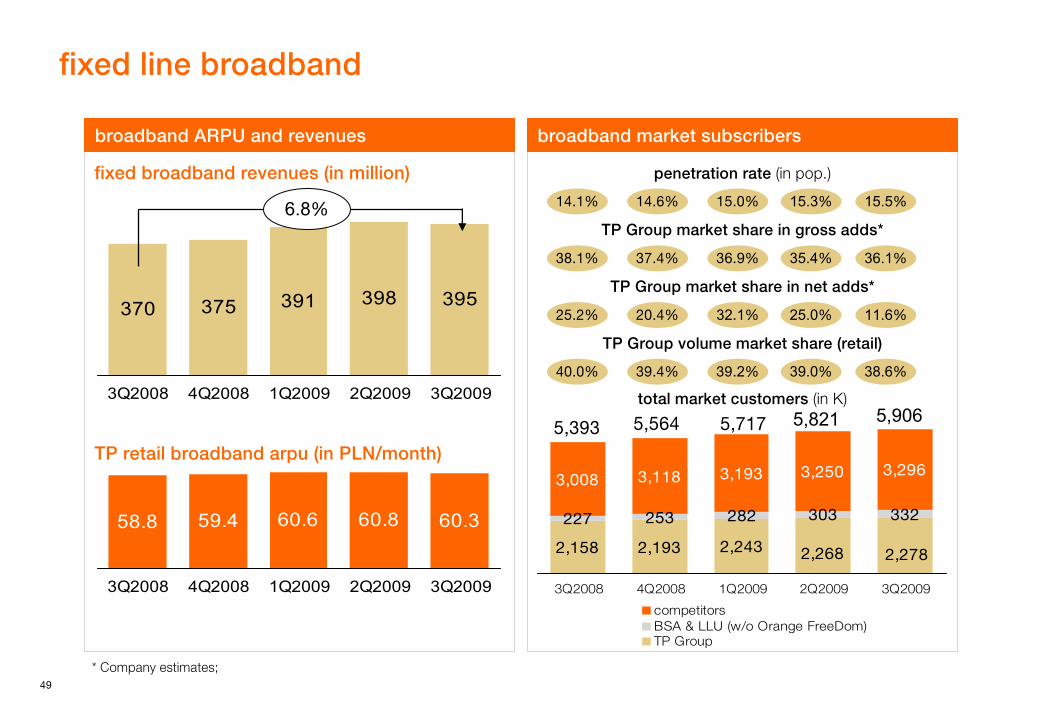
fixed line broadband
broadband ARPU and revenues broadband market subscribers
* Company estimates;
fixed
broadband
revenues
(in million)
58.8 59.4 60.6 60.8 60.3
3Q2008 4Q2008 1Q2009 2Q2009 3Q2009
370 375 391 398 395
3Q2008 4Q2008 1Q2009 2Q2009 3Q2009
TP retail
broadband
arpu
(in PLN/month)
6.8%
2,158 2,193 2,243
227 253 282 303 332
3,008 3,118 3,193 3,250 3,296
2,268 2,278
3Q2008 4Q2008 1Q2009 2Q2009 3Q2009
competitorsBSA & LLU (w/o Orange FreeDom)TP Group
total market customers (in K)
penetration rate (in
pop.)
TP Group volume market share (retail)
TP Group market share in gross adds*
TP Group market share in net adds*
15.3% 15.5%14.1% 14.6% 15.0%
35.4% 36.1%38.1% 37.4% 36.9%
25.0% 11.6%25.2% 20.4% 32.1%
39.0% 38.6%40.0% 39.4% 39.2%
5,821 5,9065,393 5,564 5,717
50
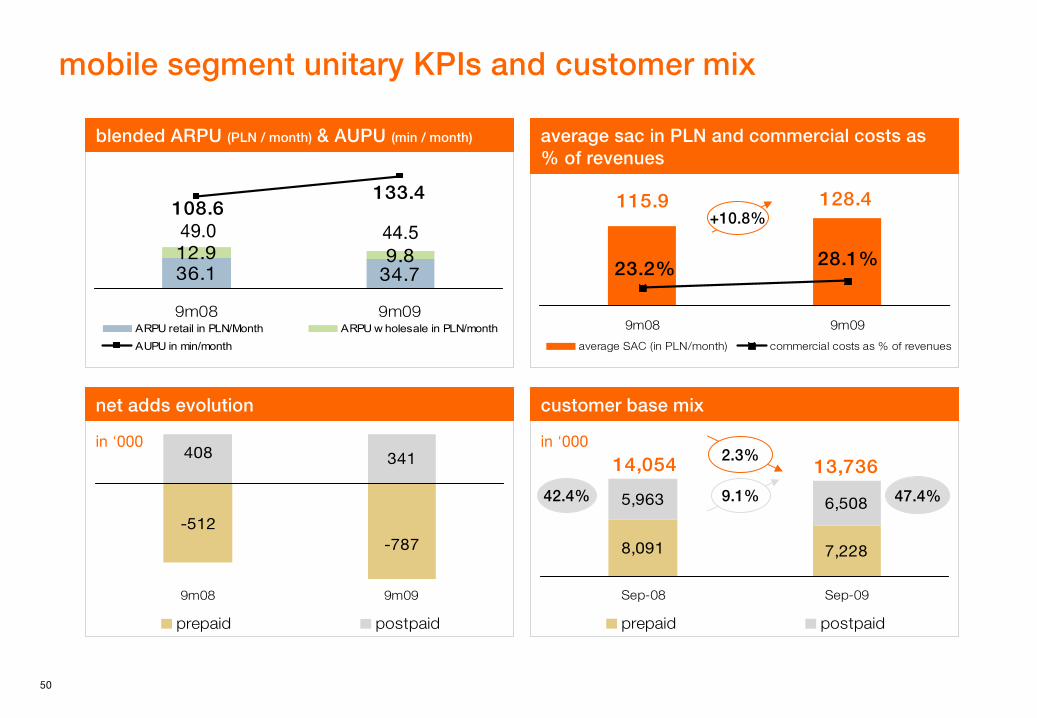
8,091 7,228
5,963 6,508
13,73614,054
Sep-08 Sep-09
prepaid postpaid
-512-787
408 341
9m08 9m09
prepaid postpaid
36.1 34.712.9 9.8
108.6133.4
9m08 9m09ARPU retail in PLN/Month ARPU w holesale in PLN/monthAUPU in min/month
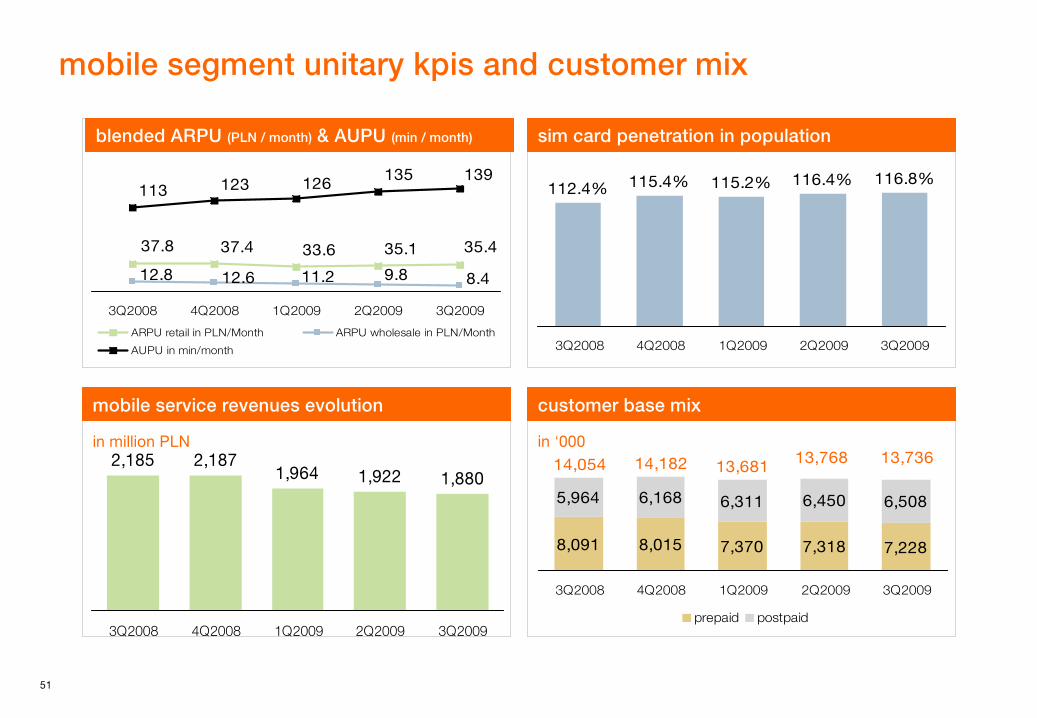
mobile segment unitary
KPIs
and customer mix
in ‘000
customer base mix
average sac in PLN and commercial costs as % of revenues
blended ARPU (PLN
/ month)
& AUPU (min
/ month)
in ‘000
net adds evolution
128.4115.9
28.1%23.2%
9m08 9m09
average SAC (in PLN/month) commercial costs as % of revenues
+10.8%
9.1% 47.4%42.4%
2.3%
49.0 44.5
51
mobile segment unitary
kpis
and customer mix
customer base mix
sim
card penetration in population
in million PLN
mobile service revenues evolution
in ‘000
35.435.133.637.437.8
9.811.212.612.8 8.4
113 123139135126
3Q2008 4Q2008 1Q2009 2Q2009 3Q2009
ARPU retail in PLN/Month ARPU wholesale in PLN/Month
AUPU in min/month
112.4% 115.4% 115.2% 116.4% 116.8%
3Q2008 4Q2008 1Q2009 2Q2009 3Q2009
2,185 2,1871,964 1,922 1,880
3Q2008 4Q2008 1Q2009 2Q2009 3Q2009
8,091 8,015 7,370 7,318 7,228
5,964 6,168 6,311 6,450 6,508
13,73613,76813,68114,18214,054
3Q2008 4Q2008 1Q2009 2Q2009 3Q2009
prepaid postpaid
blended ARPU (PLN
/ month)
& AUPU (min
/ month)
52
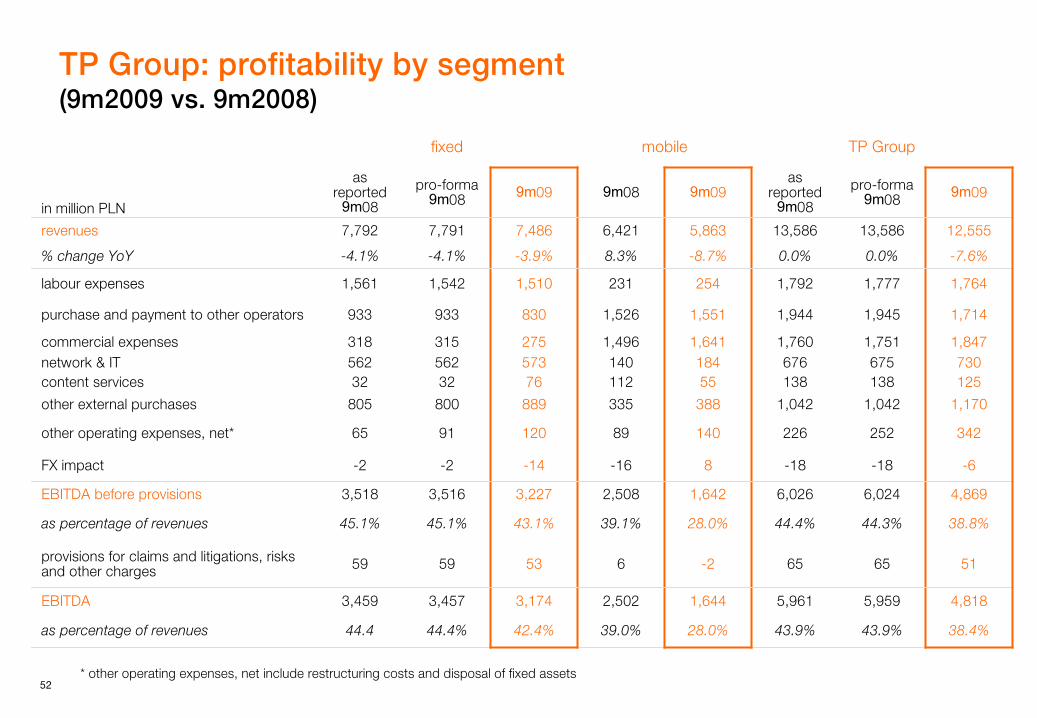
TP Group: profitability by segment (9m2009 vs. 9m2008)
fixed mobile TP Group
in million PLN
as reported
9m08
pro-forma 9m08 9m09 9m08 9m09
as reported
9m08
pro-forma 9m08 9m09
revenues 7,792 7,791 7,486 6,421 5,863 13,586 13,586 12,555
% change YoY -4.1% -4.1% -3.9% 8.3% -8.7% 0.0% 0.0% -7.6%
labour expenses 1,561 1,542 1,510 231 254 1,792 1,777 1,764
purchase and payment to other operators 933 933 830 1,526 1,551 1,944 1,945 1,714
commercial expenses 318 315 275 1,496 1,641 1,760 1,751 1,847network & IT 562 562 573 140 184 676 675 730content services 32 32 76 112 55 138 138 125
other external purchases 805 800 889 335 388 1,042 1,042 1,170
other operating expenses, net* 65 91 120 89 140 226 252 342
FX impact -2 -2 -14 -16 8 -18 -18 -6
EBITDA before provisions 3,518 3,516 3,227 2,508 1,642 6,026 6,024 4,869
as percentage of revenues 45.1% 45.1% 43.1% 39.1% 28.0% 44.4% 44.3% 38.8%
provisions for claims and litigations, risks and other charges 59 59 53 6 -2 65 65 51
EBITDA 3,459 3,457 3,174 2,502 1,644 5,961 5,959 4,818
as percentage of revenues 44.4 44.4% 42.4% 39.0% 28.0% 43.9% 43.9% 38.4%
* other operating expenses, net include restructuring costs and disposal of fixed assets
53
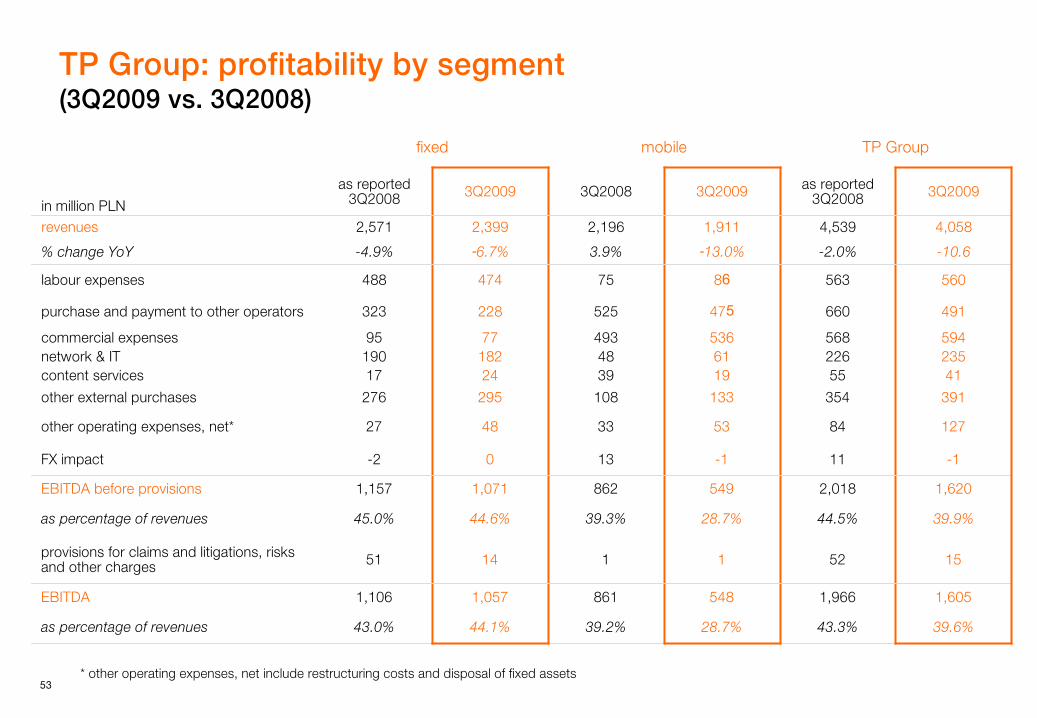
TP Group: profitability by segment (3Q2009 vs. 3Q2008)
fixed mobile TP Group
in million
PLN
as reported
3Q2008 3Q2009 3Q2008 3Q2009 as reported
3Q2008 3Q2009
revenues 2,571 2,399 2,196 1,911 4,539 4,058
% change YoY -4.9% -6.7% 3.9% -13.0% -2.0% -10.6
labour expenses 488 474 75 86 563 560
purchase and payment to other operators 323 228 525 475 660 491
commercial expenses 95 77 493 536 568 594network & IT 190 182 48 61 226 235content services 17 24 39 19 55 41
other external purchases 276 295 108 133 354 391
other operating
expenses, net* 27 48 33 53 84 127
FX impact -2 0 13 -1 11 -1
EBITDA before
provisions 1,157 1,071 862 549 2,018 1,620
as percentage
of revenues 45.0% 44.6% 39.3% 28.7% 44.5% 39.9%
provisions for claims and litigations, risks and other charges 51 14 1 1 52 15
EBITDA 1,106 1,057 861 548 1,966 1,605
as percentage
of revenues 43.0% 44.1% 39.2% 28.7% 43.3% 39.6%
* other operating expenses, net include restructuring costs and disposal of fixed assets
54
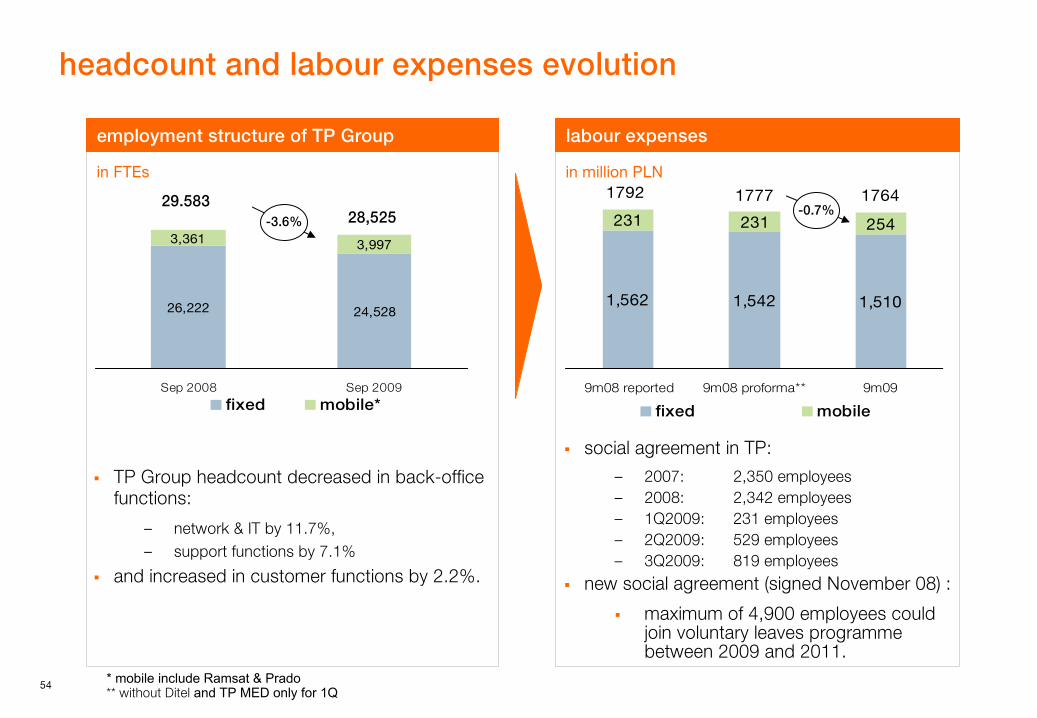
headcount and labour
expenses evolution
26,222 24,528
3,361 3,997
Sep 2008 Sep 2009
fixed mobile*
TP Group headcount decreased in back-office functions:
–
network & IT by 11.7%,–
support functions by 7.1%
and increased in customer functions by 2.2%.
social agreement in TP:
–
2007:
2,350 employees –
2008:
2,342 employees–
1Q2009:
231 employees–
2Q2009:
529 employees–
3Q2009:
819 employeesnew social agreement (signed November 08) :
maximum of 4,900 employees could join voluntary leaves programmebetween 2009 and 2011.
1,562 1,542 1,510
231 231 254
176417771792
9m08 reported 9m08 proforma** 9m09
fixed mobile
29.58328,525
labour
expenses employment structure of TP Group
in million PLNin FTEs
-3.6%-0.7%
* mobile include
Ramsat
& Prado** without Ditel
and
TP MED only
for 1Q
55
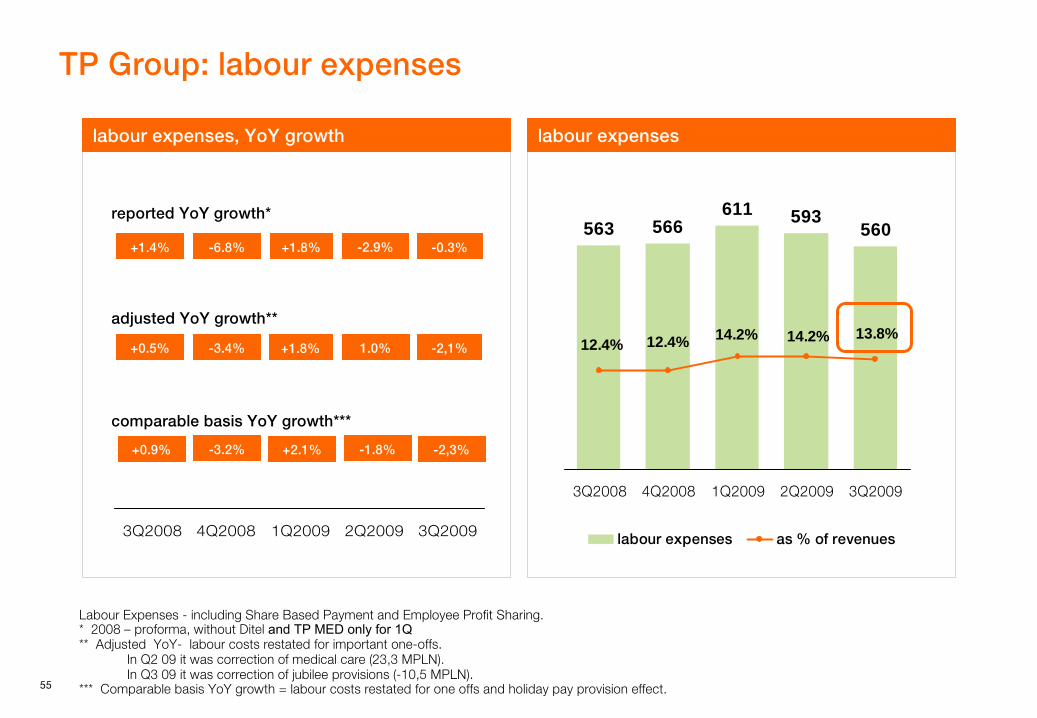
TP Group: labour
expenses
563 566611 593
560
13.8%14.2%14.2%12.4%12.4%
3Q2008 4Q2008 1Q2009 2Q2009 3Q2009
labour expenses as % of revenues3Q2008 4Q2008 1Q2009 2Q2009 3Q2009
Labour Expenses -
including Share Based Payment and Employee Profit Sharing.*
2008 –
proforma, without Ditel
and
TP MED only
for 1Q**
Adjusted YoY-
labour costs restated for important one-offs. In Q2 09 it was correction of medical care (23,3 MPLN). In Q3 09 it was correction of jubilee provisions (-10,5 MPLN).
***
Comparable basis YoY
growth = labour costs restated for one offs and holiday pay provision effect.
reported YoY
growth*
-6.8% +1.8%
adjusted YoY
growth**
comparable basis YoY
growth***
-3.4% +1.8%
-3.2% +2.1%
-2,1%
-2,3%
-0.3%
+0.5%
+0.9%
+1.4%
1.0%
-1.8%
-2.9%
labour expenseslabour expenses, YoY
growth
56
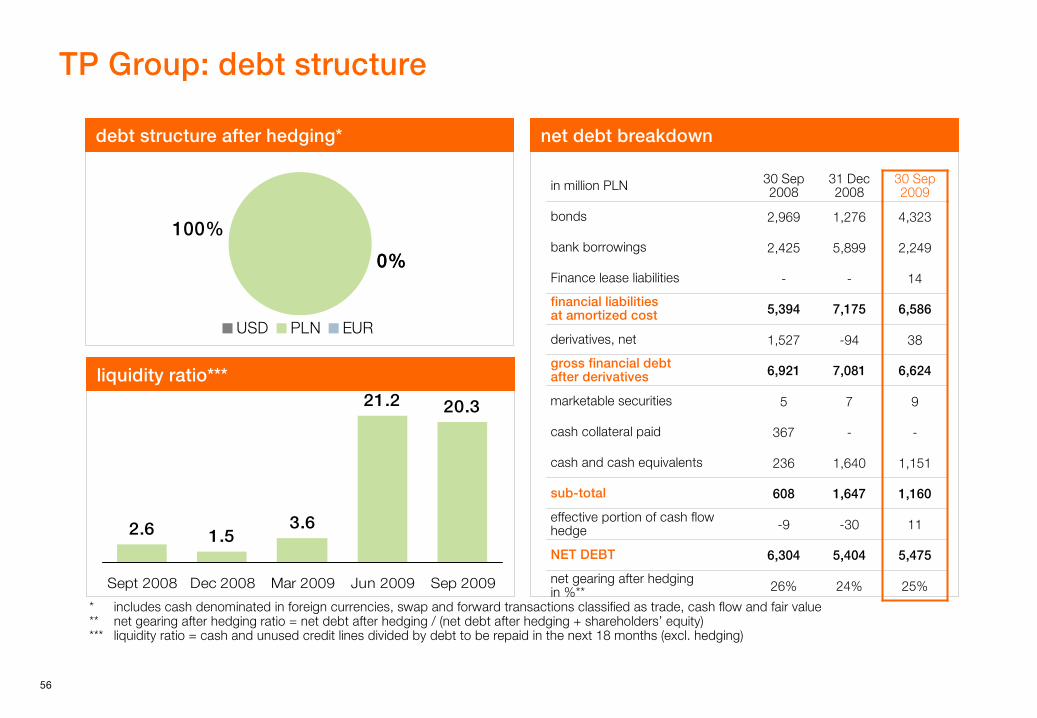
TP Group: debt structure
0%
100%
0%
USD PLN EUR
2.6 1.53.6
21.2 20.3
Sept 2008 Dec 2008 Mar 2009 Jun 2009 Sep 2009
*
includes cash denominated in foreign currencies, swap and forward transactions classified as trade, cash flow and fair value **
net gearing after hedging ratio = net debt after hedging / (net debt after hedging + shareholders’
equity)***
liquidity ratio = cash and unused credit lines divided by debt to be repaid in the next 18 months (excl. hedging)
net debt breakdowndebt structure after hedging*
liquidity ratio***
in million PLN 30
Sep 2008
31 Dec
200830
Sep 2009
bonds 2,969 1,276 4,323
bank borrowings 2,425 5,899 2,249
Finance
lease
liabilities - - 14
financial liabilities at amortized cost 5,394 7,175 6,586
derivatives, net 1,527 -94 38
gross financial debt after derivatives 6,921 7,081 6,624
marketable securities 5 7 9
cash collateral paid 367 - -
cash and cash equivalents 236 1,640 1,151
sub-total 608 1,647 1,160
effective portion of cash flow hedge -9 -30 11
NET DEBT 6,304 5,404 5,475
net gearing after hedging in %** 26% 24% 25%