Embed Size (px)
Citation preview
HSBC Bank Oman SAOG
Page 1 of 7
HSBC Bank Oman SAOG TP : OMR 0.140 / share
Upside/ (Downside): 19.7%
Source: Bloomberg
Hettish Karmani Head of Research [email protected] Tel: +968 24 94 90 34
Ayisha Zia Research Analyst [email protected] Tel: +968 24 94 90 36
Lowest Loan-to-Deposit Ratio at 74% within the sector (sector: about 111%), providing
ample room to grow
Well capitalized with CAR at 18.7%
Spreads at ~3.0% compared to sector simple average of 2.5%
Declining cost to Income amidst tight cost control; expected to fall to 57.7% in FY18e
Dividend payout expected to be maintained at 60% of earnings
We revise our 12-month target price (TP) for HSBC Oman (HBMO) to OMR 0.140 per share from our earlier TP of OMR 0.150 per share on revision in cost of equity, but maintain its rating at ACCUMULATE. Our fair value implies a P/e’19e of 10.15x and a P/b’19e of 0.81x, which we believe is justified given the bank’s capital strength and improving credit quality metrics. Operationally, we expect the bank to display better than historical performance in the current macroeconomic environment, on the back of its fundamental soundness and international parentage. Valuation & Outlook We have been conservative in our loan-book growth estimates for the entire Omani banking sector, despite an improving macroeconomic landscape in lieu of higher oil revenues (oil constitutes c60% of annual state revenues). We believe that the bank will be able to grow its net loan book at a CAGR of about 5% over the forecast period. We have been conservative in our estimates for top line as well bottom line growth prospects of the bank, and yet we see a significant upside to the latest closing price. The bank’s net interest margin has been trending upwards and we expect this to continue for the remainder of 2018 and onwards. We are expecting the bank’s operating income to increase at a CAGR of 5.6%, which coupled with slower growth in operating expenses as the bank continues to improve its efficiency metrics, will lead to a CAGR of 11.2% in the operating profit of the bank. Due to adoption of IFRS 9 that came into full effect on the 1st of January this year, the bank has been booking Expected Credit Losses (ECL) allowance releases instead of charges (OMR 3.03 released until 9M’18 of which OMR 1.67mn is from financial instruments & off balance sheet items). We believe that ECL allowance release will continue for the full year 2018, however, in the subsequent years, we believe ECL allowance will be expensed based on our expectation of a rise in cost of risk, albeit small, which will dampen net profit growth to a CAGR of 10.9% over 2018-2021. We believe that the bank will maintain dividend payout at the same level as seen in FY17, i.e. 60%.
Recommendation AccumulateBloomberg Ticker HBMO OM
Current Market Price (OMR) 0.117
52wk High / Low (OMR) 0.130/0.100
12m Average Vol. (000) 386.2
Mkt. Cap. (USD/OMR Mn) 608/234
Shares Outstanding (mn) 2,000.3
Free Float (%) 49%
3m Avg Daily Turnover (OMR'000) 18.9
6m Avg Daily Turnover (OMR'000) 47.9
PE 2019e (x) 8.49
PBv 2019e (x) 0.67
Dividend Yield '18e (%) 8.5%
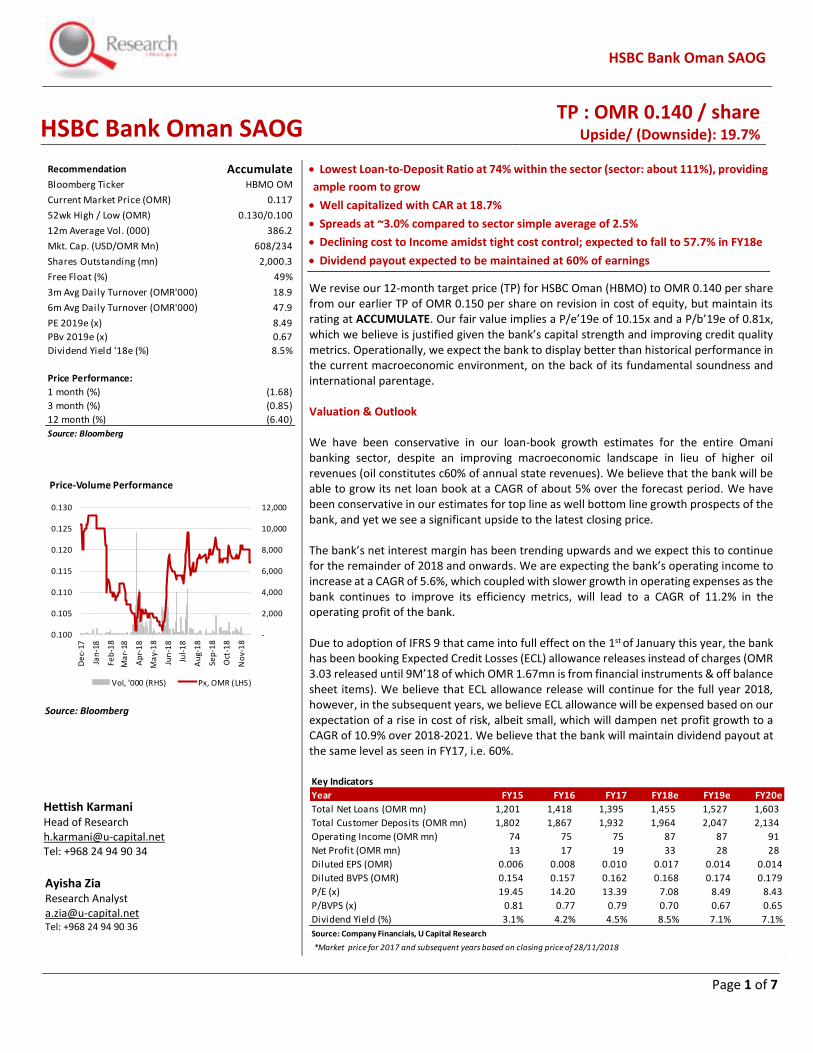
Price Performance:
1 month (%) (1.68)
3 month (%) (0.85)
12 month (%) (6.40)
Source: Bloomberg
-
2,000
4,000
6,000
8,000
10,000
12,000
0.100
0.105
0.110
0.115
0.120
0.125
0.130
De
c-17
Jan
-18
Feb
-18
Ma
r-18
Ap
r-1
8
Ma
y-1
8
Jun
-18
Jul-
18
Au
g-1
8
Sep
-18
Oct
-18
No
v-1
8
Price-Volume Performance
Vol, '000 (RHS) Px, OMR (LHS)
Key Indicators
Year FY15 FY16 FY17 FY18e FY19e FY20e
Total Net Loans (OMR mn) 1,201 1,418 1,395 1,455 1,527 1,603
Total Customer Deposits (OMR mn) 1,802 1,867 1,932 1,964 2,047 2,134
Operating Income (OMR mn) 74 75 75 87 87 91
Net Profit (OMR mn) 13 17 19 33 28 28
Diluted EPS (OMR) 0.006 0.008 0.010 0.017 0.014 0.014
Diluted BVPS (OMR) 0.154 0.157 0.162 0.168 0.174 0.179
P/E (x) 19.45 14.20 13.39 7.08 8.49 8.43
P/BVPS (x) 0.81 0.77 0.79 0.70 0.67 0.65
Dividend Yield (%) 3.1% 4.2% 4.5% 8.5% 7.1% 7.1%
Source: Company Financials, U Capital Research
*Market price for 2017 and subsequent years based on closing price of 28/11/2018
HSBC Bank Oman SAOG
Page 2 of 7
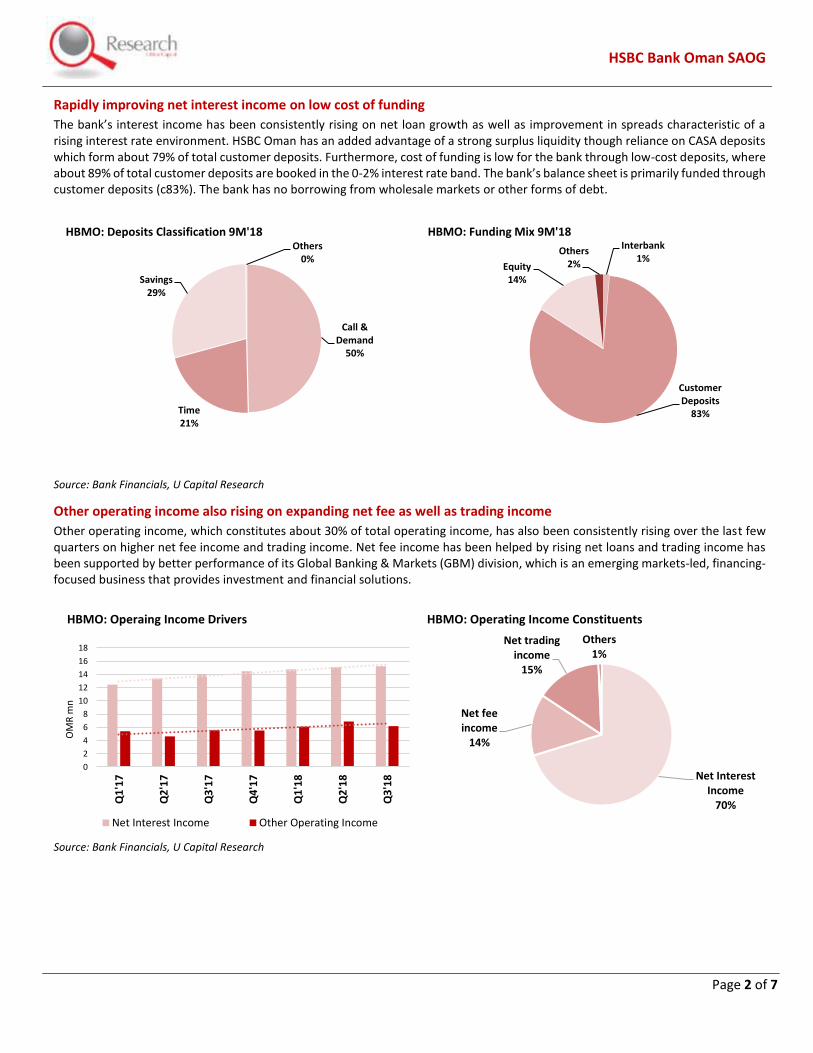
Rapidly improving net interest income on low cost of funding
The bank’s interest income has been consistently rising on net loan growth as well as improvement in spreads characteristic of a rising interest rate environment. HSBC Oman has an added advantage of a strong surplus liquidity though reliance on CASA deposits which form about 79% of total customer deposits. Furthermore, cost of funding is low for the bank through low-cost deposits, where about 89% of total customer deposits are booked in the 0-2% interest rate band. The bank’s balance sheet is primarily funded through customer deposits (c83%). The bank has no borrowing from wholesale markets or other forms of debt.
Source: Bank Financials, U Capital Research
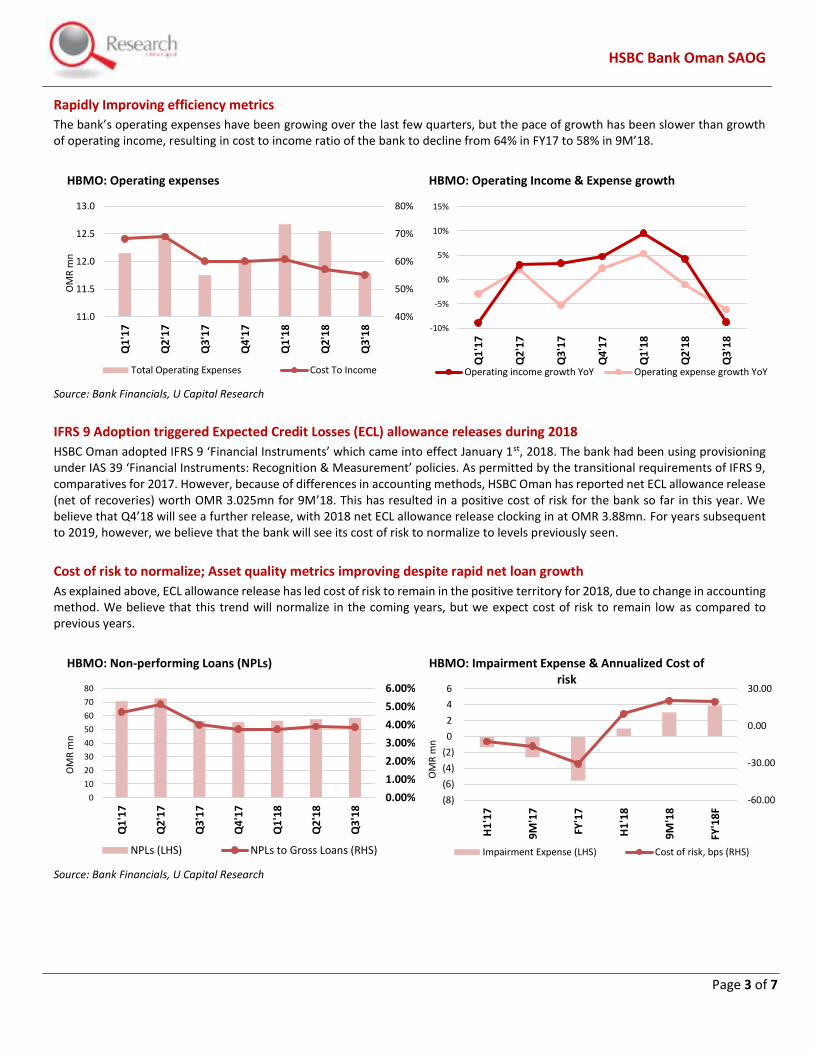
Other operating income also rising on expanding net fee as well as trading income
Other operating income, which constitutes about 30% of total operating income, has also been consistently rising over the last few quarters on higher net fee income and trading income. Net fee income has been helped by rising net loans and trading income has been supported by better performance of its Global Banking & Markets (GBM) division, which is an emerging markets-led, financing-focused business that provides investment and financial solutions.
Source: Bank Financials, U Capital Research
Call & Demand
50%
Time21%
Savings29%
Others0%
HBMO: Deposits Classification 9M'18Interbank
1%
Customer Deposits
83%
Equity14%
Others2%
HBMO: Funding Mix 9M'18
0
2
4
6
8
10
12
14
16
18
Q1
'17
Q2
'17
Q3
'17
Q4
'17
Q1
'18
Q2
'18
Q3
'18
OM
R m
n
HBMO: Operaing Income Drivers
Net Interest Income Other Operating Income
Net Interest Income
70%
Net fee income
14%
Net trading income
15%
Others1%
HBMO: Operating Income Constituents
HSBC Bank Oman SAOG
Page 3 of 7
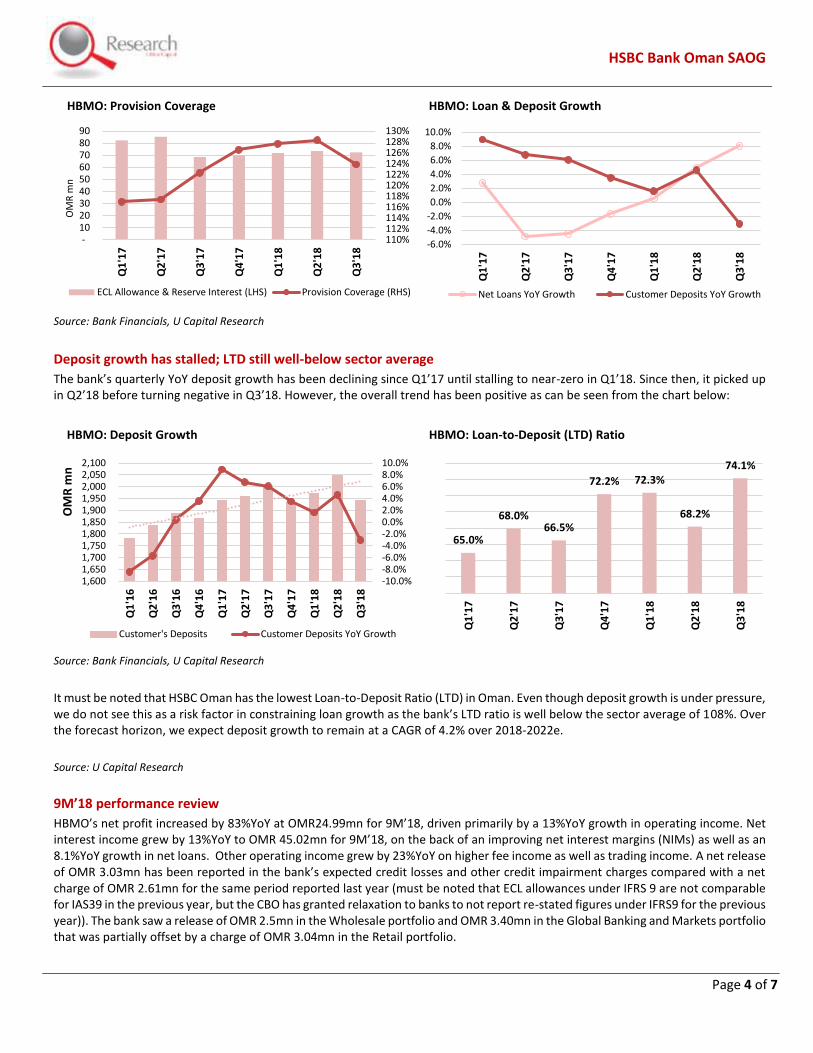
Rapidly Improving efficiency metrics
The bank’s operating expenses have been growing over the last few quarters, but the pace of growth has been slower than growth of operating income, resulting in cost to income ratio of the bank to decline from 64% in FY17 to 58% in 9M’18.
Source: Bank Financials, U Capital Research
IFRS 9 Adoption triggered Expected Credit Losses (ECL) allowance releases during 2018
HSBC Oman adopted IFRS 9 ‘Financial Instruments’ which came into effect January 1st, 2018. The bank had been using provisioning under IAS 39 ‘Financial Instruments: Recognition & Measurement’ policies. As permitted by the transitional requirements of IFRS 9, comparatives for 2017. However, because of differences in accounting methods, HSBC Oman has reported net ECL allowance release (net of recoveries) worth OMR 3.025mn for 9M’18. This has resulted in a positive cost of risk for the bank so far in this year. We believe that Q4’18 will see a further release, with 2018 net ECL allowance release clocking in at OMR 3.88mn. For years subsequent to 2019, however, we believe that the bank will see its cost of risk to normalize to levels previously seen.
Cost of risk to normalize; Asset quality metrics improving despite rapid net loan growth
As explained above, ECL allowance release has led cost of risk to remain in the positive territory for 2018, due to change in accounting method. We believe that this trend will normalize in the coming years, but we expect cost of risk to remain low as compared to previous years.
Source: Bank Financials, U Capital Research
40%
50%
60%
70%
80%
11.0
11.5
12.0
12.5
13.0
Q1
'17
Q2
'17
Q3
'17
Q4
'17
Q1
'18
Q2
'18
Q3
'18
OM
R m
n
HBMO: Operating expenses
Total Operating Expenses Cost To Income
-10%
-5%
0%
5%
10%
15%
Q1
'17
Q2
'17
Q3
'17
Q4
'17
Q1
'18
Q2
'18
Q3
'18
HBMO: Operating Income & Expense growth
Operating income growth YoY Operating expense growth YoY
0.00%
1.00%
2.00%
3.00%
4.00%
5.00%
6.00%
0
10
20
30
40
50
60
70
80
Q1
'17
Q2
'17
Q3
'17
Q4
'17
Q1
'18
Q2
'18
Q3
'18
OM
R m
n
HBMO: Non-performing Loans (NPLs)
NPLs (LHS) NPLs to Gross Loans (RHS)
-60.00
-30.00
0.00
30.00
(8)
(6)
(4)
(2)
0
2
4
6
H1
'17
9M
'17
FY'1
7
H1
'18
9M
'18
FY'1
8F
OM
R m
n
HBMO: Impairment Expense & Annualized Cost of risk
Impairment Expense (LHS) Cost of risk, bps (RHS)
HSBC Bank Oman SAOG
Page 4 of 7
Source: Bank Financials, U Capital Research
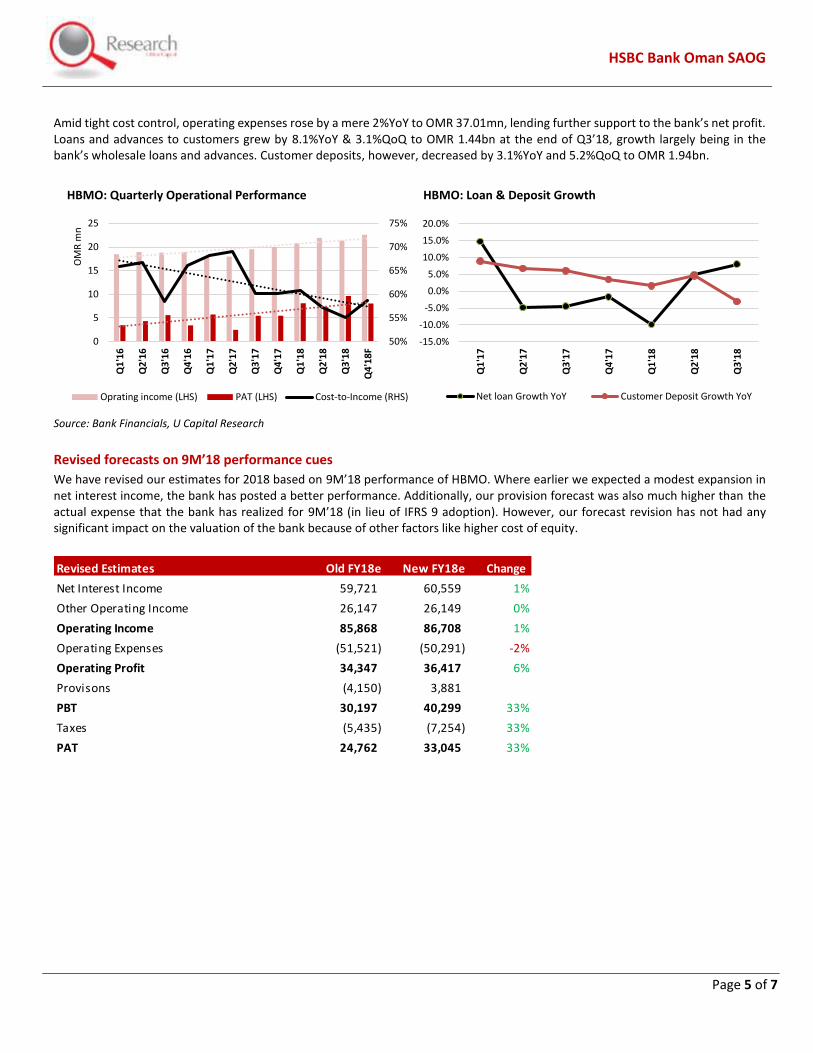
Deposit growth has stalled; LTD still well-below sector average
The bank’s quarterly YoY deposit growth has been declining since Q1’17 until stalling to near-zero in Q1’18. Since then, it picked up in Q2’18 before turning negative in Q3’18. However, the overall trend has been positive as can be seen from the chart below:
Source: Bank Financials, U Capital Research
It must be noted that HSBC Oman has the lowest Loan-to-Deposit Ratio (LTD) in Oman. Even though deposit growth is under pressure, we do not see this as a risk factor in constraining loan growth as the bank’s LTD ratio is well below the sector average of 108%. Over the forecast horizon, we expect deposit growth to remain at a CAGR of 4.2% over 2018-2022e.
Source: U Capital Research
9M’18 performance review
HBMO’s net profit increased by 83%YoY at OMR24.99mn for 9M’18, driven primarily by a 13%YoY growth in operating income. Net interest income grew by 13%YoY to OMR 45.02mn for 9M’18, on the back of an improving net interest margins (NIMs) as well as an 8.1%YoY growth in net loans. Other operating income grew by 23%YoY on higher fee income as well as trading income. A net release of OMR 3.03mn has been reported in the bank’s expected credit losses and other credit impairment charges compared with a net charge of OMR 2.61mn for the same period reported last year (must be noted that ECL allowances under IFRS 9 are not comparable for IAS39 in the previous year, but the CBO has granted relaxation to banks to not report re-stated figures under IFRS9 for the previous year)). The bank saw a release of OMR 2.5mn in the Wholesale portfolio and OMR 3.40mn in the Global Banking and Markets portfolio that was partially offset by a charge of OMR 3.04mn in the Retail portfolio.
110%112%114%116%118%120%122%124%126%128%130%
- 10 20 30 40 50 60 70 80 90
Q1
'17
Q2
'17
Q3
'17
Q4
'17
Q1
'18
Q2
'18
Q3
'18
OM
R m
n
HBMO: Provision Coverage
ECL Allowance & Reserve Interest (LHS) Provision Coverage (RHS)
-6.0%
-4.0%
-2.0%
0.0%
2.0%
4.0%
6.0%
8.0%
10.0%
Q1
'17
Q2
'17
Q3
'17
Q4
'17
Q1
'18
Q2
'18
Q3
'18
HBMO: Loan & Deposit Growth
Net Loans YoY Growth Customer Deposits YoY Growth
-10.0%-8.0%-6.0%-4.0%-2.0%0.0%2.0%4.0%6.0%8.0%10.0%
1,600 1,650 1,700 1,750 1,800 1,850 1,900 1,950 2,000 2,050 2,100
Q1
'16
Q2
'16
Q3
'16
Q4
'16
Q1
'17
Q2
'17
Q3
'17
Q4
'17
Q1
'18
Q2
'18
Q3
'18
OM
R m
n
HBMO: Deposit Growth
Customer's Deposits Customer Deposits YoY Growth
65.0%
68.0%66.5%
72.2% 72.3%
68.2%
74.1%Q
1'1
7
Q2
'17
Q3
'17
Q4
'17
Q1
'18
Q2
'18
Q3
'18
HBMO: Loan-to-Deposit (LTD) Ratio
HSBC Bank Oman SAOG
Page 5 of 7
Amid tight cost control, operating expenses rose by a mere 2%YoY to OMR 37.01mn, lending further support to the bank’s net profit. Loans and advances to customers grew by 8.1%YoY & 3.1%QoQ to OMR 1.44bn at the end of Q3’18, growth largely being in the bank’s wholesale loans and advances. Customer deposits, however, decreased by 3.1%YoY and 5.2%QoQ to OMR 1.94bn.
Source: Bank Financials, U Capital Research
Revised forecasts on 9M’18 performance cues
We have revised our estimates for 2018 based on 9M’18 performance of HBMO. Where earlier we expected a modest expansion in net interest income, the bank has posted a better performance. Additionally, our provision forecast was also much higher than the actual expense that the bank has realized for 9M’18 (in lieu of IFRS 9 adoption). However, our forecast revision has not had any significant impact on the valuation of the bank because of other factors like higher cost of equity.
50%
55%
60%
65%
70%
75%
0
5
10
15
20
25
Q1
'16
Q2
'16
Q3
'16
Q4
'16
Q1
'17
Q2
'17
Q3
'17
Q4
'17
Q1
'18
Q2
'18
Q3
'18
Q4
'18
F
OM
R m
n
HBMO: Quarterly Operational Performance
Oprating income (LHS) PAT (LHS) Cost-to-Income (RHS)
-15.0%
-10.0%
-5.0%
0.0%
5.0%
10.0%
15.0%
20.0%
Q1
'17
Q2
'17
Q3
'17
Q4
'17
Q1
'18
Q2
'18
Q3
'18
HBMO: Loan & Deposit Growth
Net loan Growth YoY Customer Deposit Growth YoY
Revised Estimates Old FY18e New FY18e Change
Net Interest Income 59,721 60,559 1%
Other Operating Income 26,147 26,149 0%
Operating Income 85,868 86,708 1%
Operating Expenses (51,521) (50,291) -2%
Operating Profit 34,347 36,417 6%
Provisons (4,150) 3,881
PBT 30,197 40,299 33%
Taxes (5,435) (7,254) 33%
PAT 24,762 33,045 33%
HSBC Bank Oman SAOG
Page 6 of 7
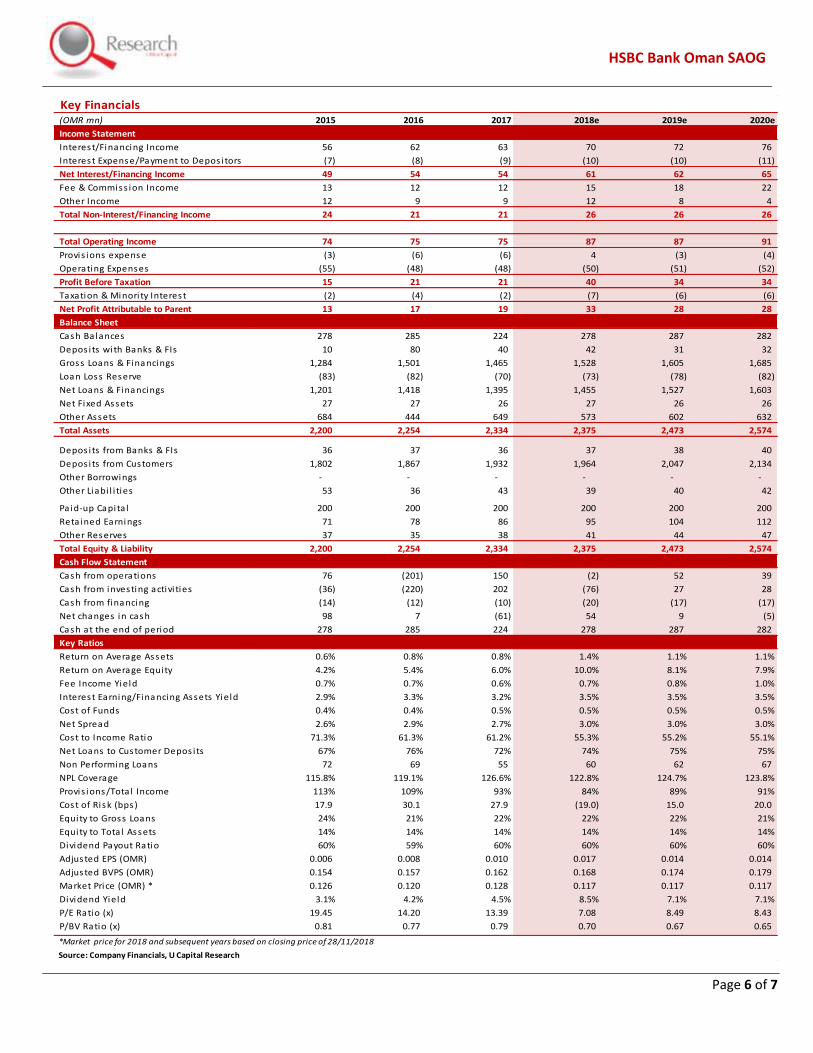
Key Financials (OMR mn) 2015 2016 2017 2018e 2019e 2020e
Income Statement
Interest/Financing Income 56 62 63 70 72 76
Interest Expense/Payment to Depos i tors (7) (8) (9) (10) (10) (11)
Net Interest/Financing Income 49 54 54 61 62 65
Fee & Commiss ion Income 13 12 12 15 18 22
Other Income 12 9 9 12 8 4
Total Non-Interest/Financing Income 24 21 21 26 26 26
Total Operating Income 74 75 75 87 87 91
Provis ions expense (3) (6) (6) 4 (3) (4)
Operating Expenses (55) (48) (48) (50) (51) (52)
Profit Before Taxation 15 21 21 40 34 34
Taxation & Minori ty Interest (2) (4) (2) (7) (6) (6)
Net Profit Attributable to Parent 13 17 19 33 28 28
Balance Sheet
Cash Balances 278 285 224 278 287 282
Depos i ts with Banks & FIs 10 80 40 42 31 32
Gross Loans & Financings 1,284 1,501 1,465 1,528 1,605 1,685
Loan Loss Reserve (83) (82) (70) (73) (78) (82)
Net Loans & Financings 1,201 1,418 1,395 1,455 1,527 1,603
Net Fixed Assets 27 27 26 27 26 26
Other Assets 684 444 649 573 602 632
Total Assets 2,200 2,254 2,334 2,375 2,473 2,574
Depos its from Banks & FIs 36 37 36 37 38 40
Depos i ts from Customers 1,802 1,867 1,932 1,964 2,047 2,134
Other Borrowings - - - - - -
Other Liabi l i ties 53 36 43 39 40 42
Pa id-up Capita l 200 200 200 200 200 200
Reta ined Earnings 71 78 86 95 104 112
Other Reserves 37 35 38 41 44 47
Total Equity & Liability 2,200 2,254 2,334 2,375 2,473 2,574
Cash Flow Statement
Cash from operations 76 (201) 150 (2) 52 39
Cash from investing activi ties (36) (220) 202 (76) 27 28
Cash from financing (14) (12) (10) (20) (17) (17)
Net changes in cash 98 7 (61) 54 9 (5)
Cash at the end of period 278 285 224 278 287 282
Key Ratios
Return on Average Assets 0.6% 0.8% 0.8% 1.4% 1.1% 1.1%
Return on Average Equity 4.2% 5.4% 6.0% 10.0% 8.1% 7.9%
Fee Income Yield 0.7% 0.7% 0.6% 0.7% 0.8% 1.0%
Interest Earning/Financing Assets Yield 2.9% 3.3% 3.2% 3.5% 3.5% 3.5%
Cost of Funds 0.4% 0.4% 0.5% 0.5% 0.5% 0.5%
Net Spread 2.6% 2.9% 2.7% 3.0% 3.0% 3.0%
Cost to Income Ratio 71.3% 61.3% 61.2% 55.3% 55.2% 55.1%
Net Loans to Customer Depos i ts 67% 76% 72% 74% 75% 75%
Non Performing Loans 72 69 55 60 62 67
NPL Coverage 115.8% 119.1% 126.6% 122.8% 124.7% 123.8%
Provis ions/Tota l Income 113% 109% 93% 84% 89% 91%
Cost of Risk (bps) 17.9 30.1 27.9 (19.0) 15.0 20.0
Equity to Gross Loans 24% 21% 22% 22% 22% 21%
Equity to Tota l Assets 14% 14% 14% 14% 14% 14%
Dividend Payout Ratio 60% 59% 60% 60% 60% 60%
Adjusted EPS (OMR) 0.006 0.008 0.010 0.017 0.014 0.014
Adjusted BVPS (OMR) 0.154 0.157 0.162 0.168 0.174 0.179
Market Price (OMR) * 0.126 0.120 0.128 0.117 0.117 0.117
Dividend Yield 3.1% 4.2% 4.5% 8.5% 7.1% 7.1%
P/E Ratio (x) 19.45 14.20 13.39 7.08 8.49 8.43
P/BV Ratio (x) 0.81 0.77 0.79 0.70 0.67 0.65
*Market price for 2018 and subsequent years based on closing price of 28/11/2018
Source: Company Financials, U Capital Research
Page 7 of 7 P.O.BOX 1137, PC 111 – CPO, Sultanate of Oman l CR No. 1279406 l Tel: +968 2494 9000 l Fax: +968 2494 9099 l Email: [email protected] l Web: www.u-capital.net
Ubhar Capital SAOC (U Capital)
Website: www.u-capital.net PO Box 1137
PC 111, Sultanate of Oman Tel: +968 2494 9000 Fax: +968 2494 9099
Email: [email protected]
Disclaimer: This report has been prepared by Ubhar Capital (U Capital) Research, and is provided for information purposes only. Under no circumstances is it to be used or considered as an offer to sell or solicitation of any offer to buy. While all reasonable care has been taken to ensure that the information contained therein is not untrue or misleading at the time of publication, we make no representation as to its accuracy or completeness and it should not be relied upon as such. The company accepts no responsibility whatsoever for any direct or indirect consequential loss arising from any use of this report or its contents. All opinions and estimates included in this document constitute U Capital Research team’s judgment as at the date of production of this report, and are subject to change without notice. This report may not be reproduced, distributed or published by any recipient for any other purpose.
Recommendation
BUY Greater than 20%
ACCUMULATE Between +10% and +20%
HOLD Between +10% and -10%
REDUCE Between -10% and -20%
SELL Lower than -20%