Embed Size (px)
Citation preview
Strictly Private & Confidential
TPBI Public Company Limited
Opportunity Day Presentation
September 3, 2018
Strictly Private & Confidential
Disclaimer
Page 1
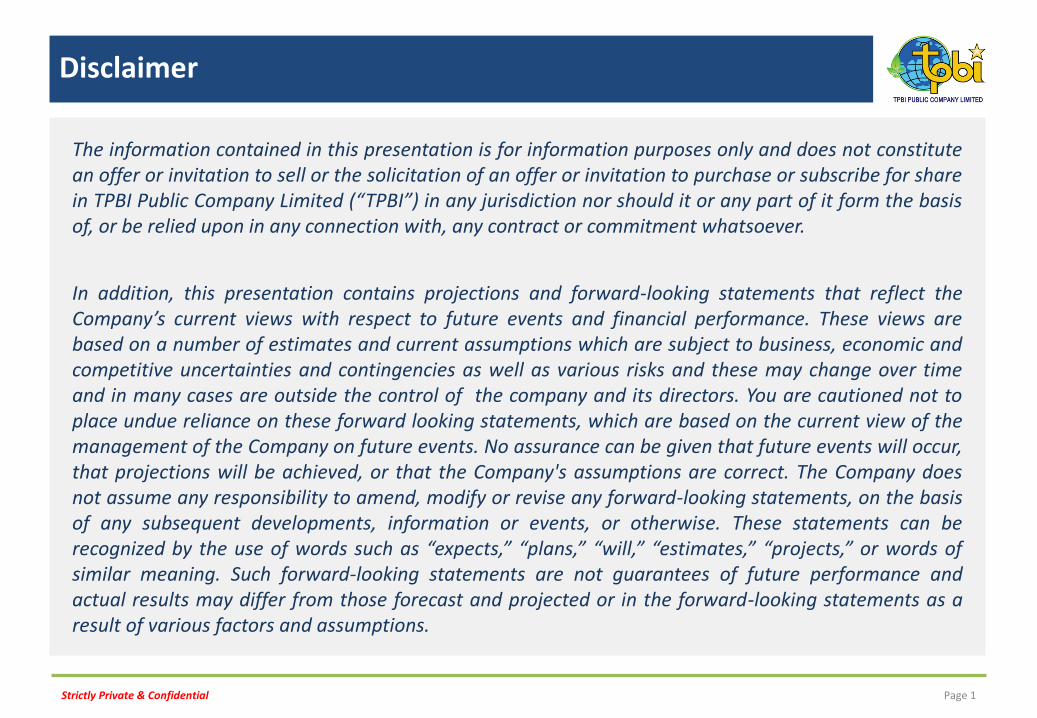
The information contained in this presentation is for information purposes only and does not constitute an offer or invitation to sell or the solicitation of an offer or invitation to purchase or subscribe for share in TPBI Public Company Limited (“TPBI”) in any jurisdiction nor should it or any part of it form the basis of, or be relied upon in any connection with, any contract or commitment whatsoever.
In addition, this presentation contains projections and forward-looking statements that reflect the Company’s current views with respect to future events and financial performance. These views are based on a number of estimates and current assumptions which are subject to business, economic and competitive uncertainties and contingencies as well as various risks and these may change over time and in many cases are outside the control of the company and its directors. You are cautioned not to place undue reliance on these forward looking statements, which are based on the current view of the management of the Company on future events. No assurance can be given that future events will occur, that projections will be achieved, or that the Company's assumptions are correct. The Company does not assume any responsibility to amend, modify or revise any forward-looking statements, on the basis of any subsequent developments, information or events, or otherwise. These statements can be recognized by the use of words such as “expects,” “plans,” “will,” “estimates,” “projects,” or words of similar meaning. Such forward-looking statements are not guarantees of future performance and actual results may differ from those forecast and projected or in the forward-looking statements as a result of various factors and assumptions.
Strictly Private & Confidential
Agenda
Page 2
Section 1 About TPBI Group
Section 2 Business Overview
Section 3 Financial Highlights
Section 4 Future Plan

Strictly Private & Confidential
‹#›
Strictly Private & Confidential
TPBI Group Products
Page 4
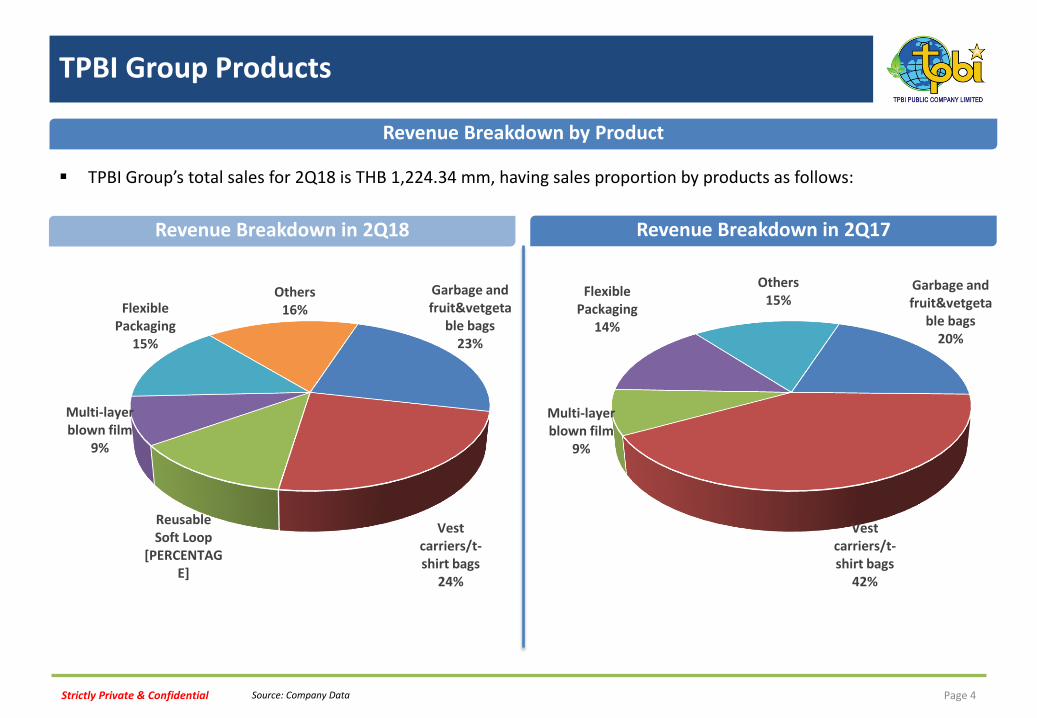
Revenue Breakdown by Product
TPBI Group’s total sales for 2Q18 is THB 1,224.34 mm, having sales proportion by products as follows:
Source: Company Data
Garbage and fruit&vetgeta
ble bags 23%
Vest carriers/t-shirt bags
24%
Reusable Soft Loop
[PERCENTAGE]
Multi-layer blown film
9%
Flexible Packaging
15%
Others 16%
Revenue Breakdown in 2Q18 Revenue Breakdown in 2Q17
Garbage and fruit&vetgeta
ble bags 20%
Vest carriers/t-shirt bags
42%
Multi-layer blown film
9%
Flexible Packaging
14%
Others 15%

Strictly Private & Confidential
Australia 30%
Japan 10%
UK 6%
USA 6%
0% New Zealand
2%
Other countries 4%
Thailand 42%
Australia 25%
Japan 8%
UK 5%
USA 8%
0%
New Zealand 5%
Other countries 6%
Thailand 43%
Market Diversification
Page 5
Market Diversification
During 2Q18, approximately 57.1% of total sales are from exports to international markets while 42.9% are from domestic sales.
“TPBI Group distributes their different types of products to various regions to diversify the risk of relying on a few market”
Note: :*Other countries include South Korea, Singapore, Nigeria, Laos, Cambodia, etc. Source: Company Data
In 2Q18 In 2Q17

Strictly Private & Confidential
Agenda
Page 6
Section 1 About TPBI Group
Section 2 Business Overview
Section 3 Financial Highlights
Section 4 Future Plan
Strictly Private & Confidential
Strong Presence in Plastic Packaging Value Chain through Backward Integration
Page 7
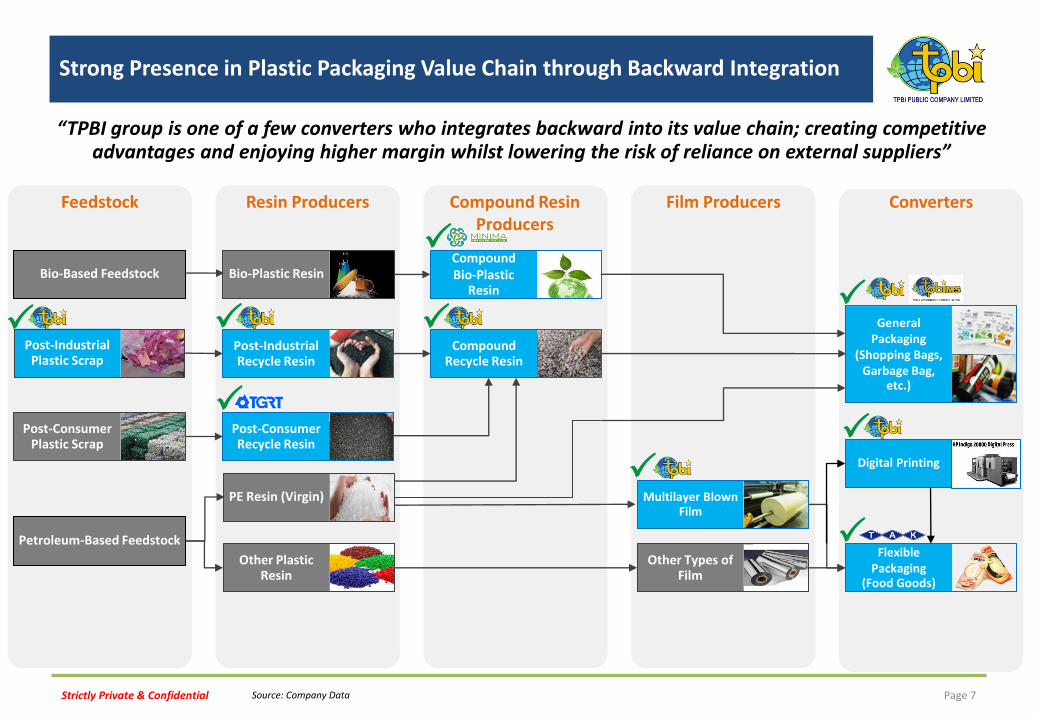
“TPBI group is one of a few converters who integrates backward into its value chain; creating competitive advantages and enjoying higher margin whilst lowering the risk of reliance on external suppliers”
Feedstock Resin Producers Compound Resin Producers
Film Producers Converters
Post-Consumer Plastic Scrap
Post-Industrial Plastic Scrap
Post-Industrial Recycle Resin
Compound Recycle Resin
Bio-Plastic Resin
PE Resin (Virgin)
Other Plastic Resin
Compound Bio-Plastic
Resin
General Packaging
(Shopping Bags, Garbage Bag,
etc.)
Flexible Packaging
(Food Goods)
Other Types of Film
Bio-Based Feedstock
Petroleum-Based Feedstock
Post-Consumer Recycle Resin
Multilayer Blown Film
Source: Company Data
Digital Printing
Strictly Private & Confidential
Company Operations
Page 8
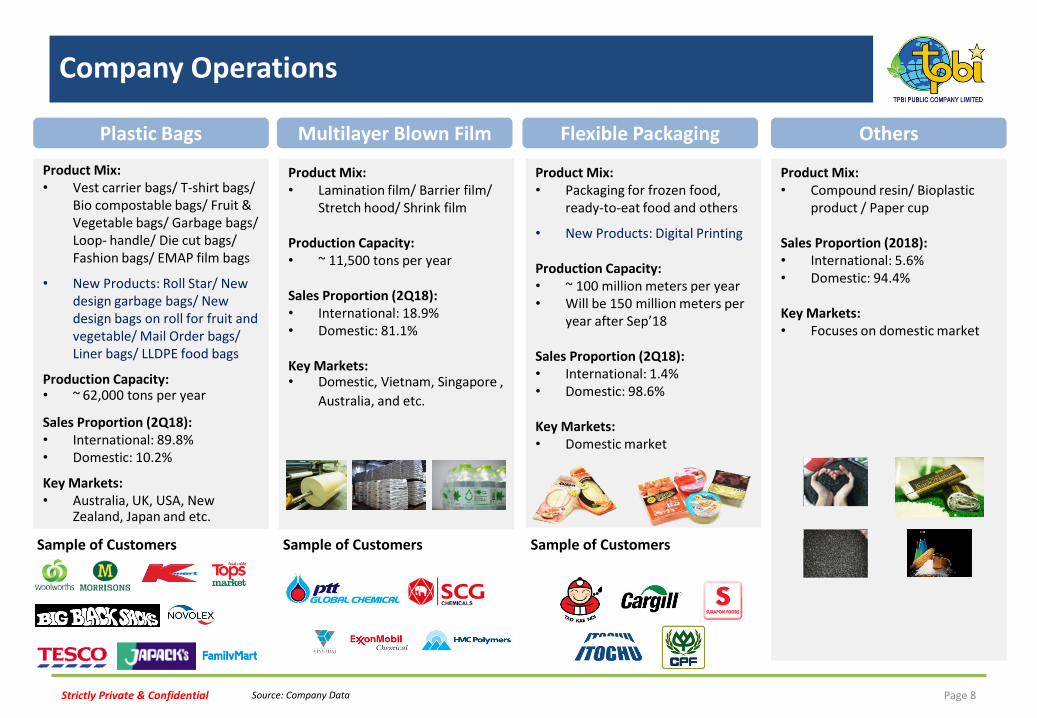
Plastic Bags Multilayer Blown Film Flexible Packaging
Product Mix: • Vest carrier bags/ T-shirt bags/
Bio compostable bags/ Fruit & Vegetable bags/ Garbage bags/ Loop- handle/ Die cut bags/ Fashion bags/ EMAP film bags
• New Products: Roll Star/ New design garbage bags/ New design bags on roll for fruit and vegetable/ Mail Order bags/ Liner bags/ LLDPE food bags
Production Capacity: • ~ 62,000 tons per year
Sales Proportion (2Q18): • International: 89.8% • Domestic: 10.2%
Key Markets: • Australia, UK, USA, New
Zealand, Japan and etc.
Product Mix: • Lamination film/ Barrier film/
Stretch hood/ Shrink film
Production Capacity: • ~ 11,500 tons per year Sales Proportion (2Q18): • International: 18.9% • Domestic: 81.1%
Key Markets: • Domestic, Vietnam, Singapore ,
Australia, and etc.
Product Mix: • Packaging for frozen food,
ready-to-eat food and others
• New Products: Digital Printing
Production Capacity: • ~ 100 million meters per year • Will be 150 million meters per
year after Sep’18
Sales Proportion (2Q18): • International: 1.4% • Domestic: 98.6% Key Markets: • Domestic market
Sample of Customers Sample of Customers Sample of Customers
Source: Company Data
Others
Product Mix: • Compound resin/ Bioplastic
product / Paper cup Sales Proportion (2018): • International: 5.6% • Domestic: 94.4% Key Markets: • Focuses on domestic market
Strictly Private & Confidential
67%
80%
62% 58% 72% 70%
0%
20%
40%
60%
80%
100%
0
50
100
150
2013 2014 2015 2016 2017 2Q18
Mill
ion
Me
ters
pe
r ye
ar
Capacity Output Utilization rate
95%
76%
82% 81% 84%
74%
0%
20%
40%
60%
80%
100%
0
2,000
4,000
6,000
8,000
10,000
12,000
2013 2014 2015 2016 2017 2Q18
Ton
s p
er
year
Historical Production Capacity and Utilization Rate
Page 9
74% 84%
86% 85% 78%
66%
0%
20%
40%
60%
80%
100%
0
20,000
40,000
60,000
80,000
100,000
2013 2014 2015 2016 2017 2Q18
Ton
s p
er
year
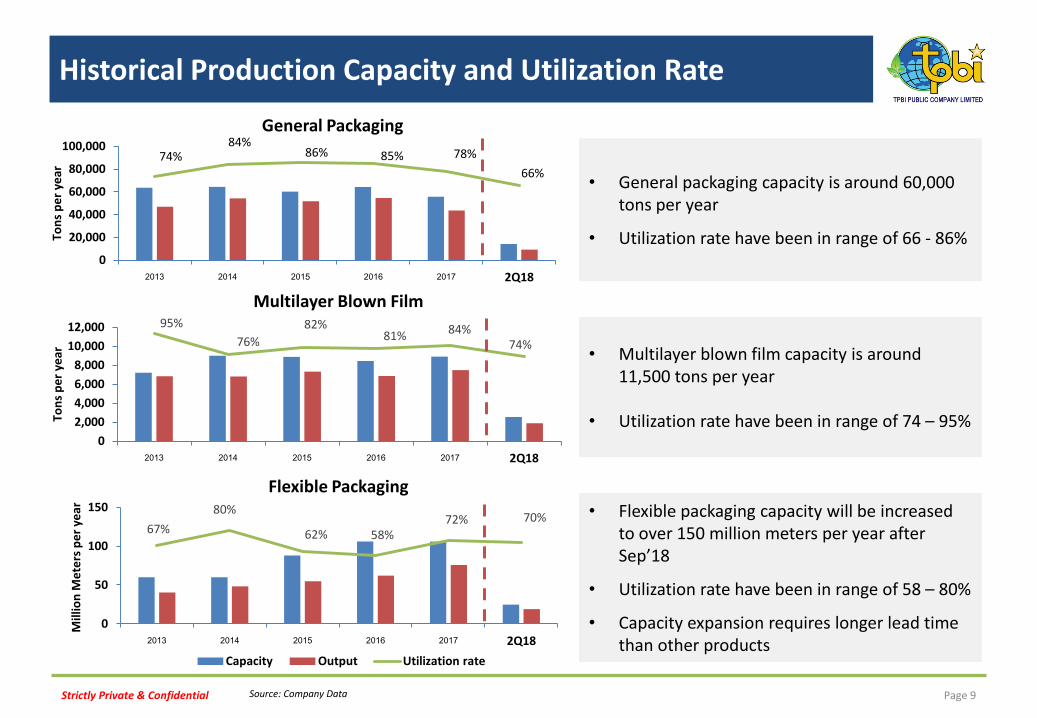
General Packaging
Multilayer Blown Film
Flexible Packaging
• Flexible packaging capacity will be increased to over 150 million meters per year after Sep’18
• Utilization rate have been in range of 58 – 80%
• Capacity expansion requires longer lead time than other products
• General packaging capacity is around 60,000 tons per year
• Utilization rate have been in range of 66 - 86%
• Multilayer blown film capacity is around 11,500 tons per year
• Utilization rate have been in range of 74 – 95%
Source: Company Data

Strictly Private & Confidential
Agenda
Page 10
Section 1 About TPBI Group
Section 2 Business Overview
Section 3 Financial Highlights
Section 4 Future Plan
Strictly Private & Confidential
31
32
33
34
Aug-17 Sep-17 Oct-17 Nov-17 Dec-17 Jan-18 Feb-18 Mar-18 Apr-18 May-18 Jun-18
THB
0
100
200
300
400
500
600
0
20
40
60
80
100
Jul 2017 Aug 2017 Sep 2017 Oct 2017 Nov 2017 Dec 2017 Jan 2018 Feb 2018 Mar 2018 Apr 2018 May 2018 Jun 2018
Vo
lum
e ('
00
0)
US
D/B
arre
l
Volume (RHS) Closing Px
Market Overview
Page 11
Foreign Exchange
Brent Crude Oil
Resin Price
Source: Bloomberg
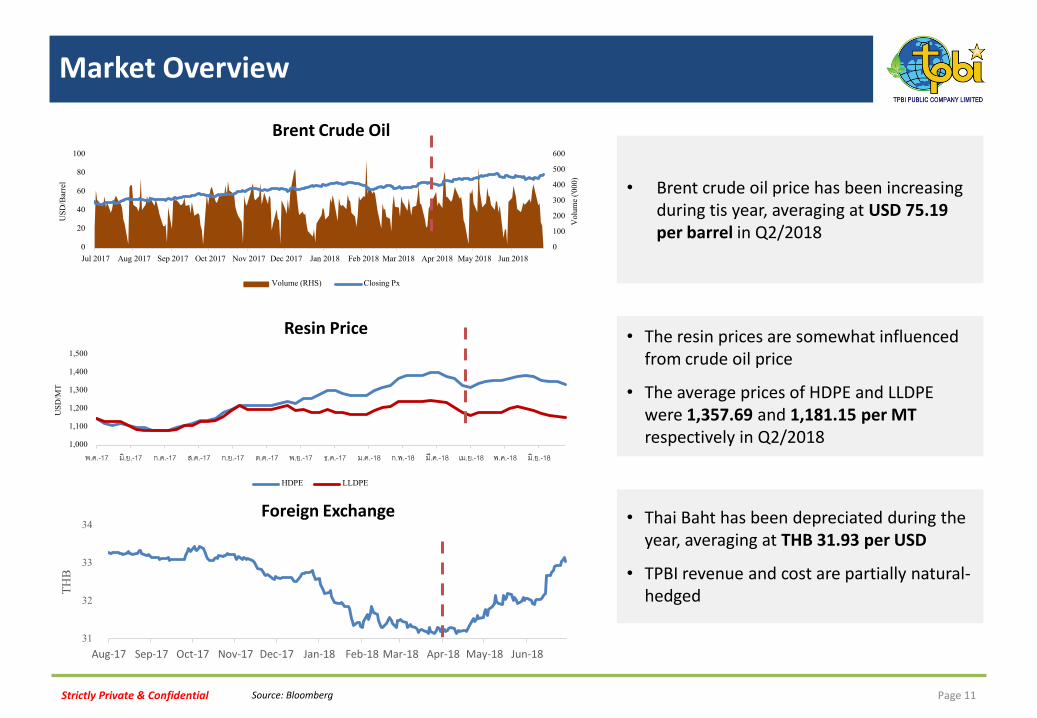
• Thai Baht has been depreciated during the year, averaging at THB 31.93 per USD
• TPBI revenue and cost are partially natural-hedged
• Brent crude oil price has been increasing during tis year, averaging at USD 75.19 per barrel in Q2/2018
• The resin prices are somewhat influenced from crude oil price
• The average prices of HDPE and LLDPE were 1,357.69 and 1,181.15 per MT respectively in Q2/2018
1,000
1,100
1,200
1,300
1,400
1,500
พ.ค.-17 มิ.ย.-17 ก.ค.-17 ส.ค.-17 ก.ย.-17 ต.ค.-17 พ.ย.-17 ธ.ค.-17 ม.ค.-18 ก.พ.-18 มี.ค.-18 เม.ย.-18 พ.ค.-18 มิ.ย.-18
US
D/M
T
HDPE LLDPE
Strictly Private & Confidential
14.8%
9.5%
6.7% 8.0%
2.9% 1.4%
0.0%
5.0%
10.0%
15.0%
20.0%
2Q16 2Q17 2Q18
Profit Margin
Gross Profit Margin Net Profit Margin
1,179 1,182 1,246
-
500
1,000
1,500
2Q16 2Q17 2Q18
THB
mm
231 238 289
499 486 447
77 101 112 158 165 181 196 179 195
-
200
400
600
800
1,000
1,200
1,400
2Q16 2Q17 2Q18
THB
mm
Garbage and others bags Vest carriers/t-shirt bags Multi-layer blown film
Flexible packaging Others
Operating Results
Page 12
Total Revenue Gross Profit and Net Profit
Source: Company Data
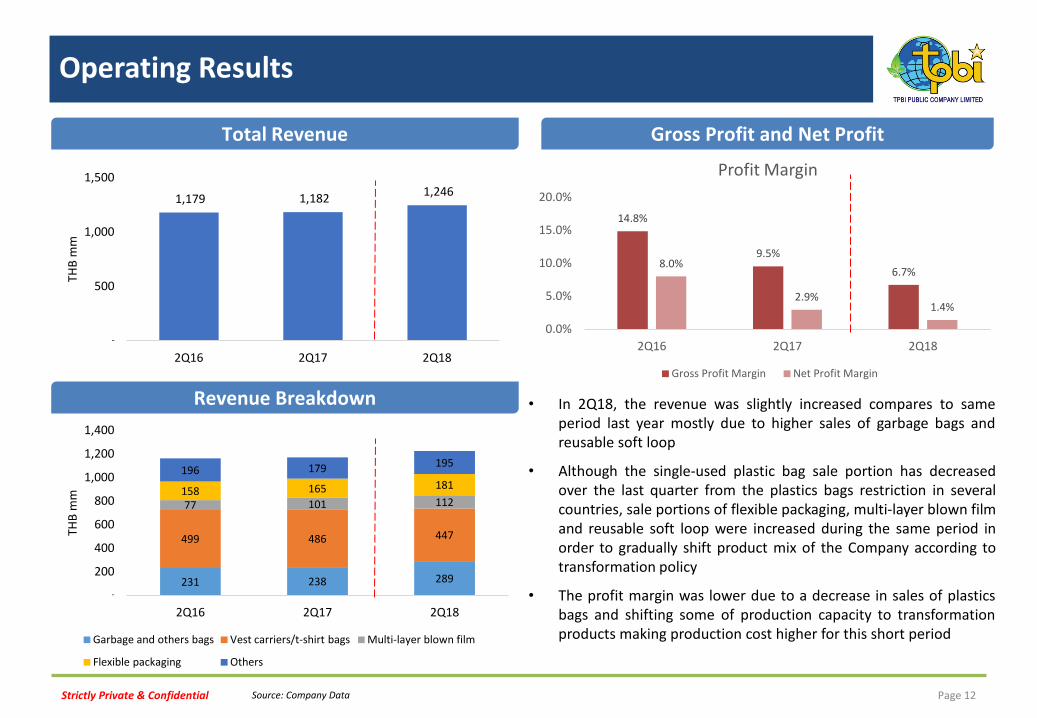
• In 2Q18, the revenue was slightly increased compares to same period last year mostly due to higher sales of garbage bags and reusable soft loop
• Although the single-used plastic bag sale portion has decreased over the last quarter from the plastics bags restriction in several countries, sale portions of flexible packaging, multi-layer blown film and reusable soft loop were increased during the same period in order to gradually shift product mix of the Company according to transformation policy
• The profit margin was lower due to a decrease in sales of plastics bags and shifting some of production capacity to transformation products making production cost higher for this short period
Revenue Breakdown
Strictly Private & Confidential
Operating Results (Cont.)
Page 13
Operating Result in 2018
In THB mm 2Q18 2Q17 YoY
THB mm %
Sales 1,248.85 1,182.26 66.59 5.63%
Cost of Sales 1,142.29 1,057.56 84.73 8.01%
Gross Profit 82.05 111.35 -29.3 -26.32%
Other Income 21.44 13.35 8.09 60.63%
SG&A 80.03 78.00 2.03 2.61%
EBITDA 83.26 93.10 (9.85) (10.57%)
Net Income 17.22 34.68 (17.45) (50.33%)
EPS (THB) 0.04 0.08 (0.04) (52.85%)
GP Margin (%) 6.70% 9.53% -2.83% -29.70%
EBITDA Margin (%) 6.67% 7.88% -1.21% -15.34%
NP Margin (%) 1.38% 2.93% -1.55% -52.98%
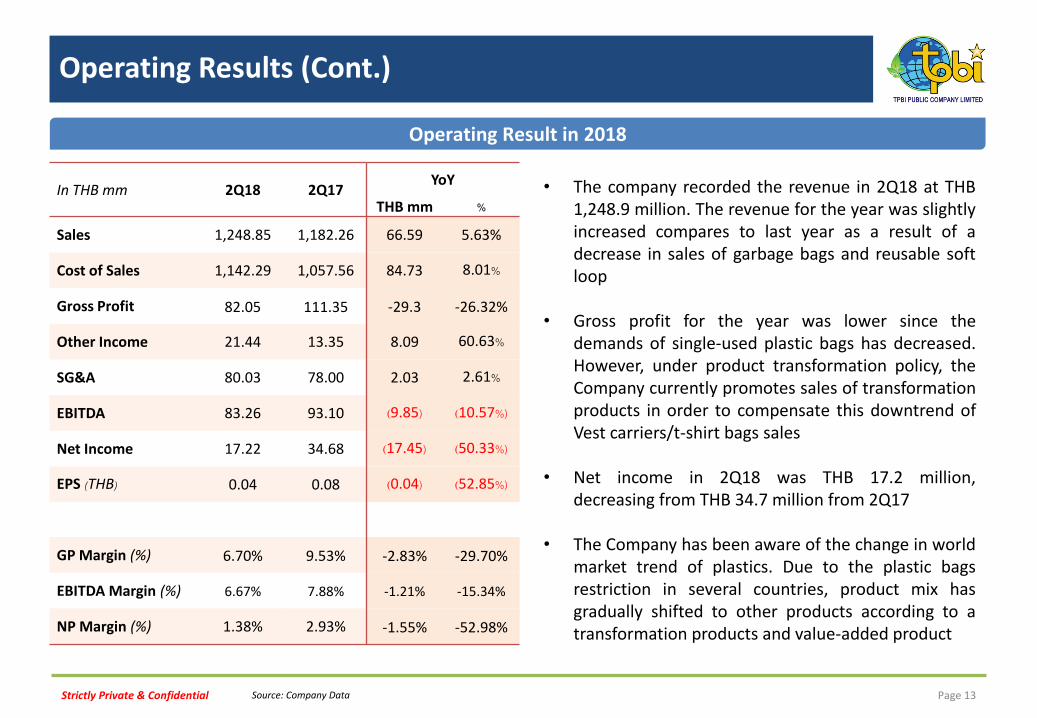
• The company recorded the revenue in 2Q18 at THB 1,248.9 million. The revenue for the year was slightly increased compares to last year as a result of a decrease in sales of garbage bags and reusable soft loop
• Gross profit for the year was lower since the demands of single-used plastic bags has decreased. However, under product transformation policy, the Company currently promotes sales of transformation products in order to compensate this downtrend of Vest carriers/t-shirt bags sales
• Net income in 2Q18 was THB 17.2 million, decreasing from THB 34.7 million from 2Q17
• The Company has been aware of the change in world market trend of plastics. Due to the plastic bags restriction in several countries, product mix has gradually shifted to other products according to a transformation products and value-added product
Source: Company Data
Strictly Private & Confidential
Operating Results (Cont.)
Page 14
Gross Profit Margin and Net profit Margin
7.9%
9.8% 10.4%
14.7% 14.3%
10.5%
6.7% 6.2%
9.0% 9.2%
13.0% 13.1%
8.9%
6.7%
3.7%
4.7% 5.2%
7.9% 7.9%
4.0%
1.4%
0%
2%
4%
6%
8%
10%
12%
14%
16%
2012 2013 2014 2015 2016 2017 2Q18 Gross Profit Margin EBITDA Margin Net Profit Margin
Source: Company Data
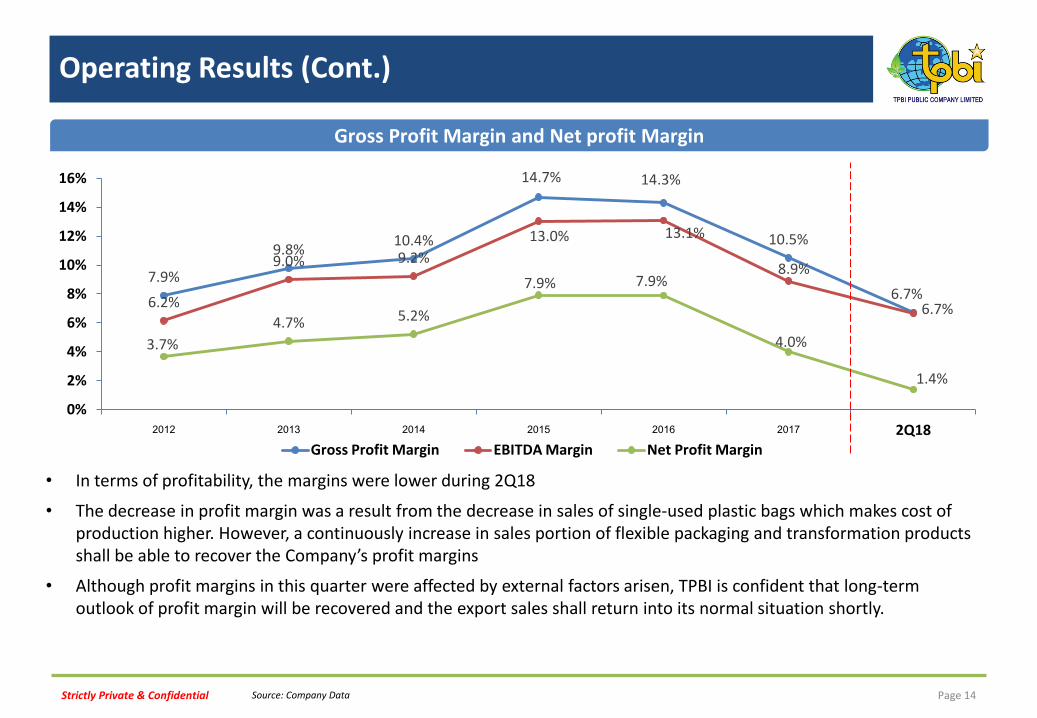
• In terms of profitability, the margins were lower during 2Q18
• The decrease in profit margin was a result from the decrease in sales of single-used plastic bags which makes cost of production higher. However, a continuously increase in sales portion of flexible packaging and transformation products shall be able to recover the Company’s profit margins
• Although profit margins in this quarter were affected by external factors arisen, TPBI is confident that long-term outlook of profit margin will be recovered and the export sales shall return into its normal situation shortly.
Strictly Private & Confidential
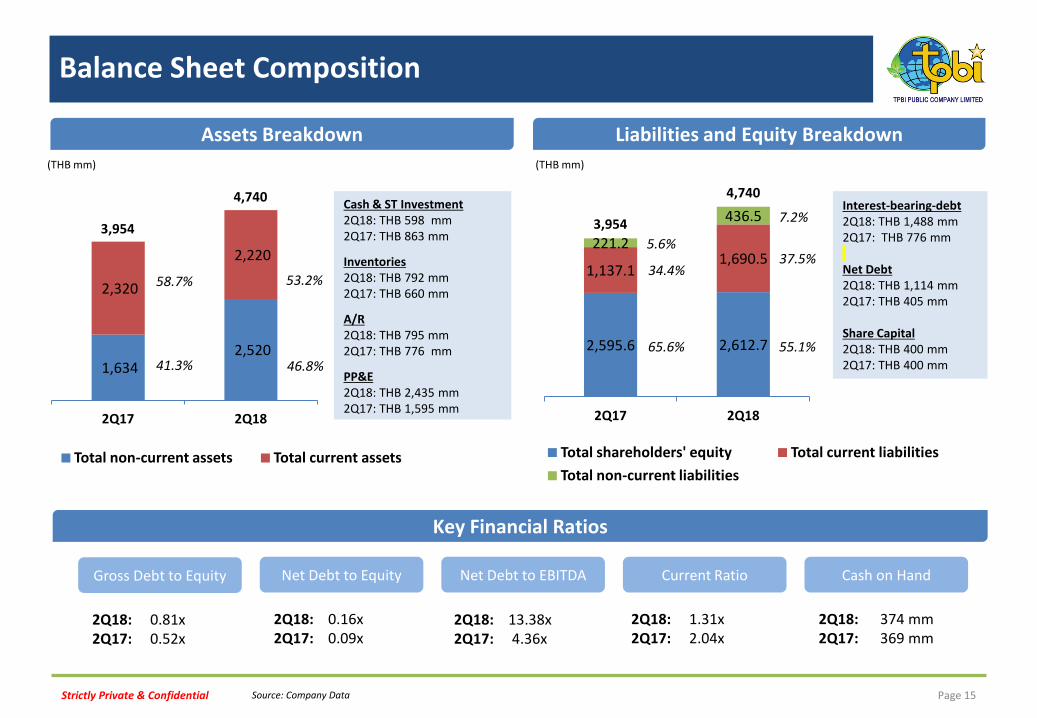
1,634 2,520
2,320
2,220
2Q17 2Q18
Total non-current assets Total current assets
2,595.6 2,612.7
1,137.1 1,690.5
221.2
436.5
2Q17 2Q18
Total shareholders' equity Total current liabilities
Total non-current liabilities
Assets Breakdown
Balance Sheet Composition
Page 15
(THB mm)
Liabilities and Equity Breakdown
(THB mm)
Key Financial Ratios
58.7%
41.3%
53.2%
46.8%
Cash & ST Investment 2Q18: THB 598 mm 2Q17: THB 863 mm
Inventories 2Q18: THB 792 mm 2Q17: THB 660 mm
A/R 2Q18: THB 795 mm 2Q17: THB 776 mm
PP&E 2Q18: THB 2,435 mm 2Q17: THB 1,595 mm
Interest-bearing-debt 2Q18: THB 1,488 mm 2Q17: THB 776 mm Net Debt 2Q18: THB 1,114 mm 2Q17: THB 405 mm Share Capital 2Q18: THB 400 mm 2Q17: THB 400 mm
34.4%
65.6%
5.6%
7.2%
55.1%
37.5%
Source: Company Data
Gross Debt to Equity Net Debt to Equity Net Debt to EBITDA Current Ratio Cash on Hand
2Q18: 0.81x 2Q17: 0.52x
2Q18: 0.16x 2Q17: 0.09x
2Q18: 13.38x 2Q17: 4.36x
2Q18: 1.31x 2Q17: 2.04x
2Q18: 374 mm 2Q17: 369 mm
4,740
3,954
4,740
3,954
Strictly Private & Confidential
Agenda
Page 16
Section 1 About TPBI Group
Section 2 Business Overview
Section 3 Financial Highlights
Section 4 Future Plan
Strictly Private & Confidential
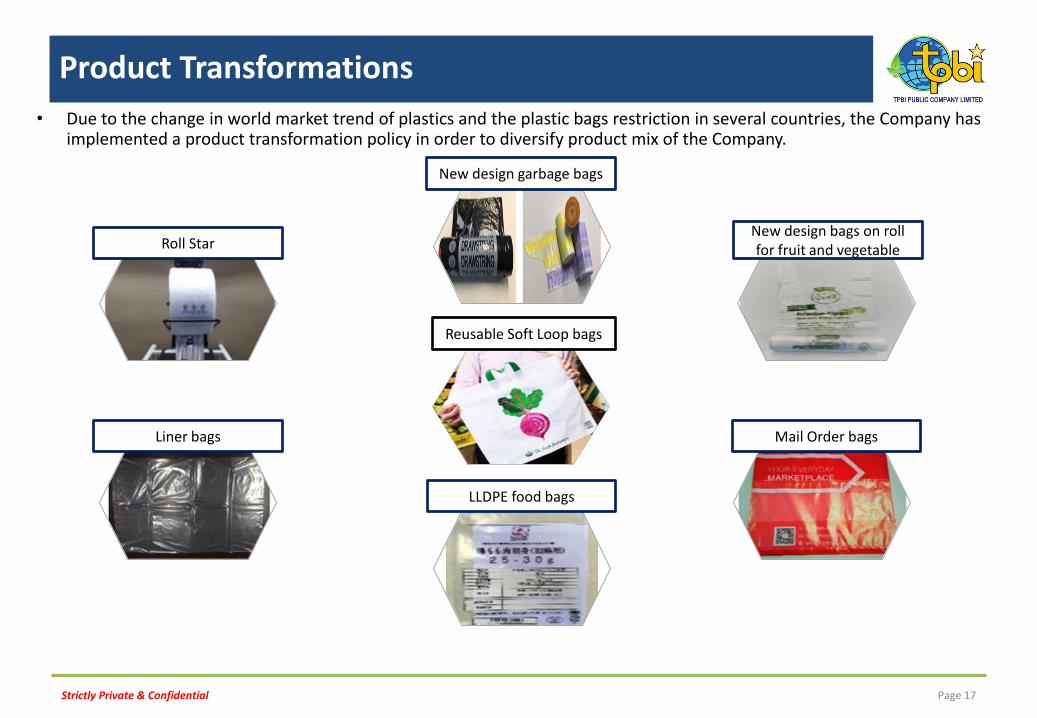
Product Transformations
Page 17
• Due to the change in world market trend of plastics and the plastic bags restriction in several countries, the Company has implemented a product transformation policy in order to diversify product mix of the Company.
Roll Star
New design garbage bags
New design bags on roll for fruit and vegetable
Mail Order bags Liner bags
LLDPE food bags
Reusable Soft Loop bags
Strictly Private & Confidential
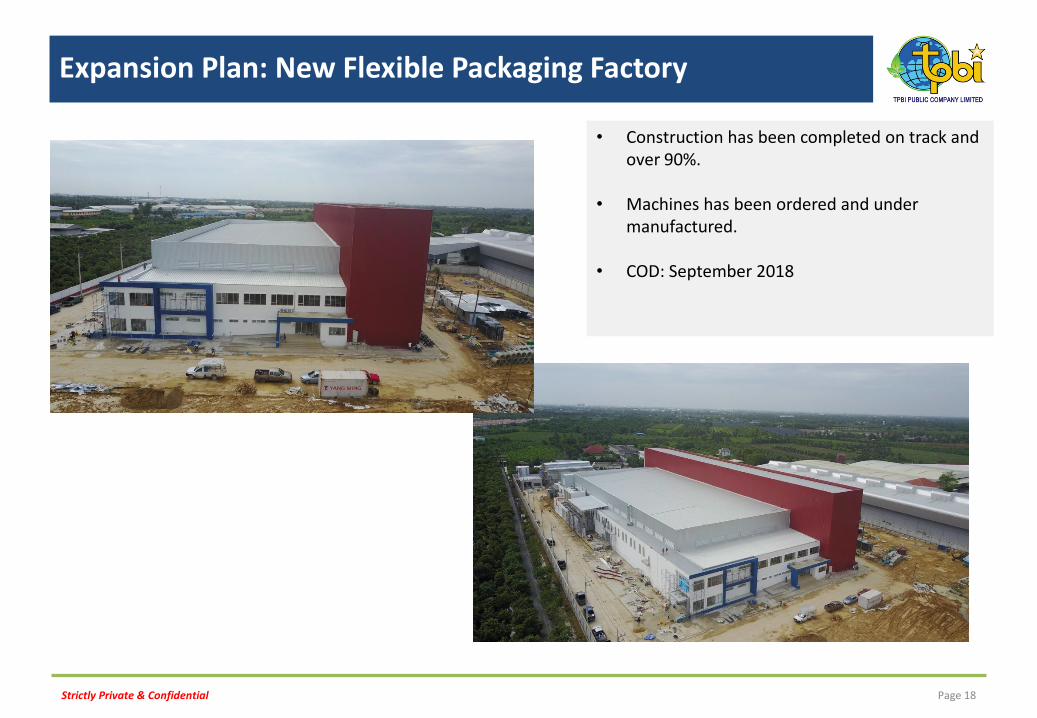
Expansion Plan: New Flexible Packaging Factory
Page 18
• Construction has been completed on track and over 90%.
• Machines has been ordered and under manufactured.
• COD: September 2018
Strictly Private & Confidential
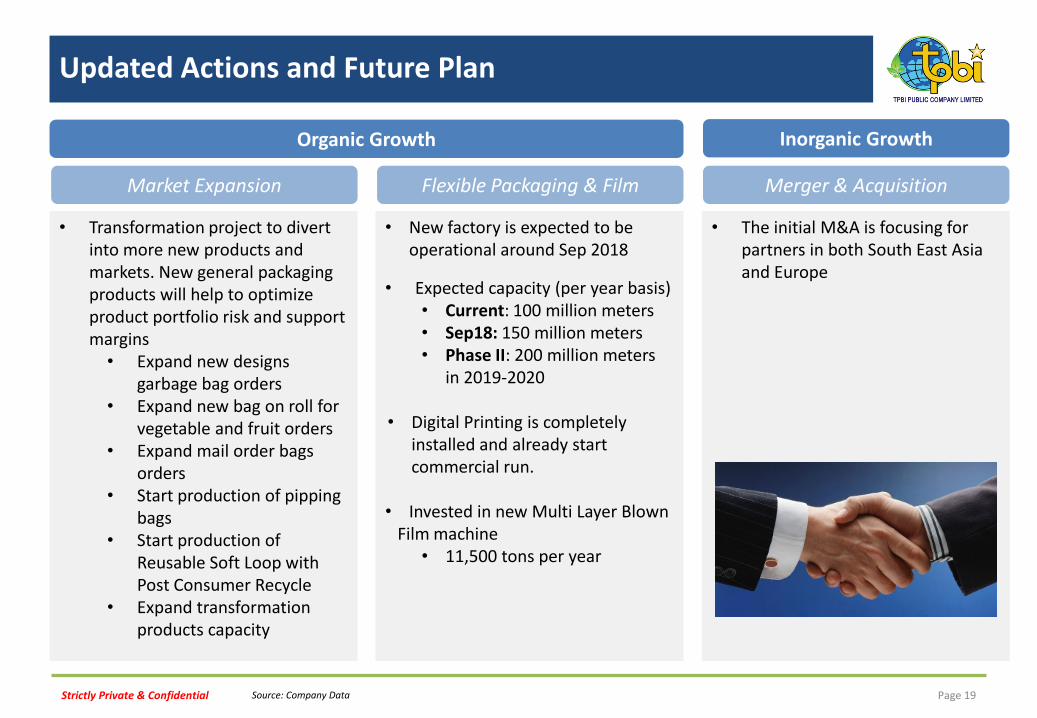
Updated Actions and Future Plan
Page 19
Market Expansion
• Transformation project to divert into more new products and markets. New general packaging products will help to optimize product portfolio risk and support margins
• Expand new designs garbage bag orders
• Expand new bag on roll for vegetable and fruit orders
• Expand mail order bags orders
• Start production of pipping bags
• Start production of Reusable Soft Loop with Post Consumer Recycle
• Expand transformation products capacity
Flexible Packaging & Film
• New factory is expected to be operational around Sep 2018
• Expected capacity (per year basis) • Current: 100 million meters • Sep18: 150 million meters • Phase II: 200 million meters
in 2019-2020
• Digital Printing is completely installed and already start commercial run.
• Invested in new Multi Layer Blown
Film machine • 11,500 tons per year
Merger & Acquisition
• The initial M&A is focusing for partners in both South East Asia and Europe
Organic Growth Inorganic Growth
Source: Company Data
Strictly Private & Confidential Page 20
Strictly Private & Confidential Page 21
Strictly Private & Confidential Page 22
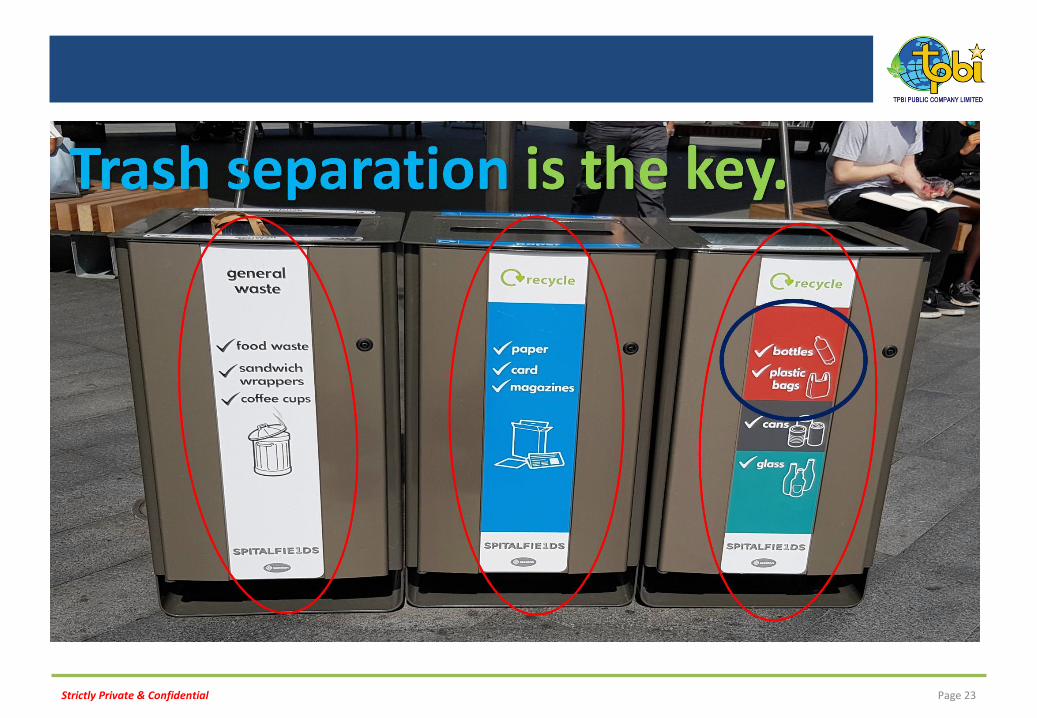
Strictly Private & Confidential Page 23
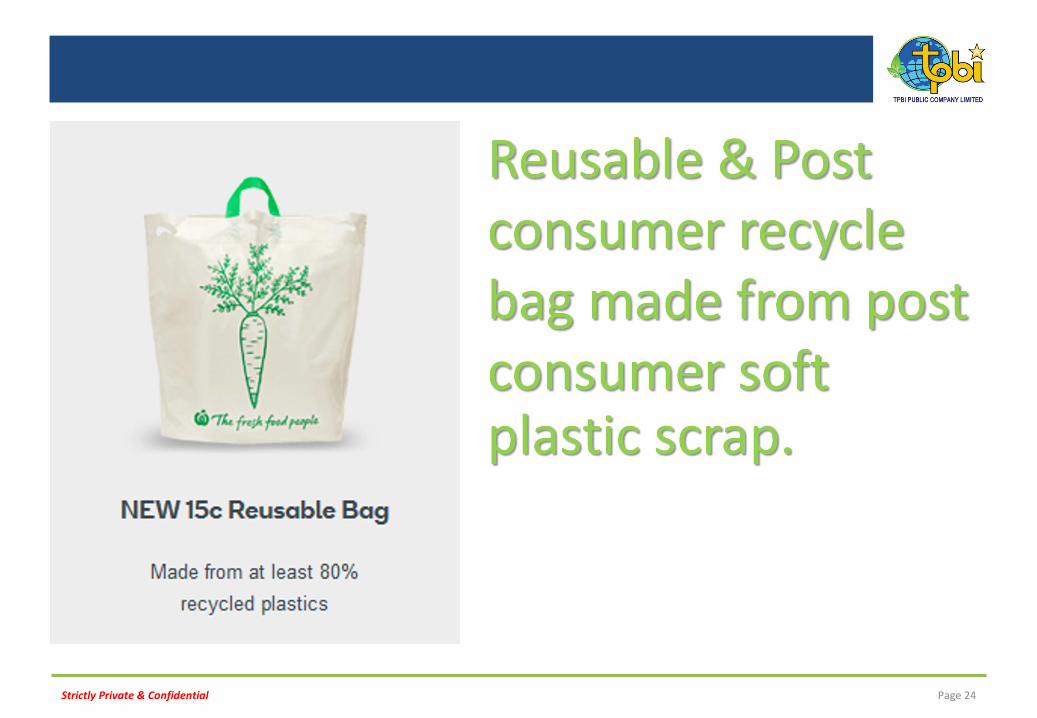
Strictly Private & Confidential Page 24
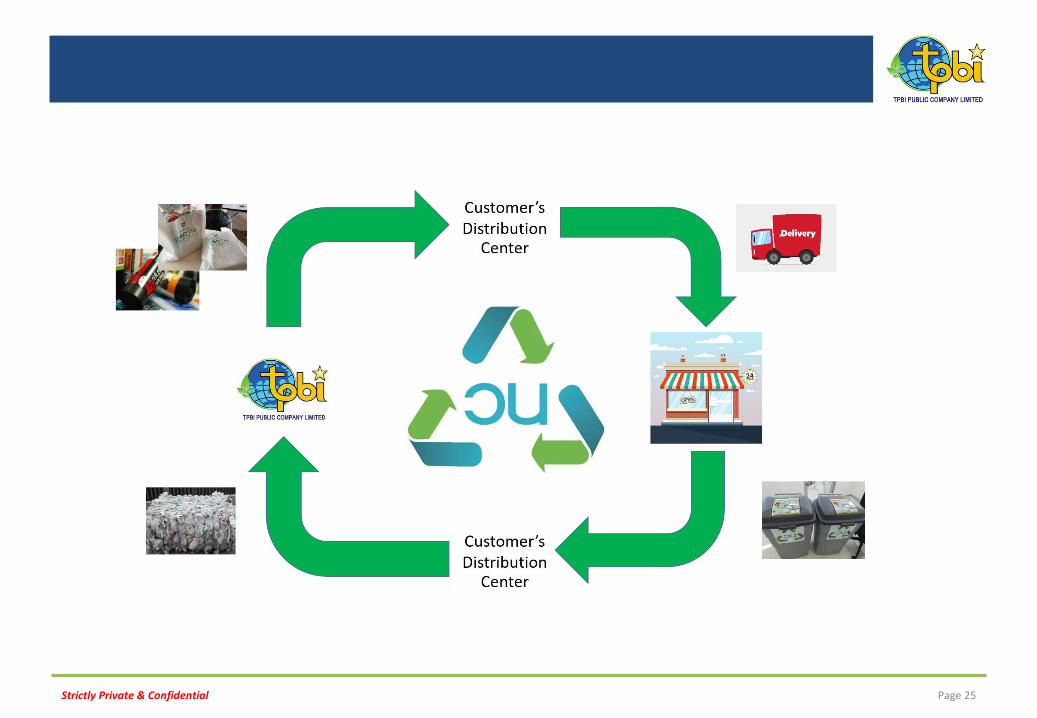
Strictly Private & Confidential Page 25
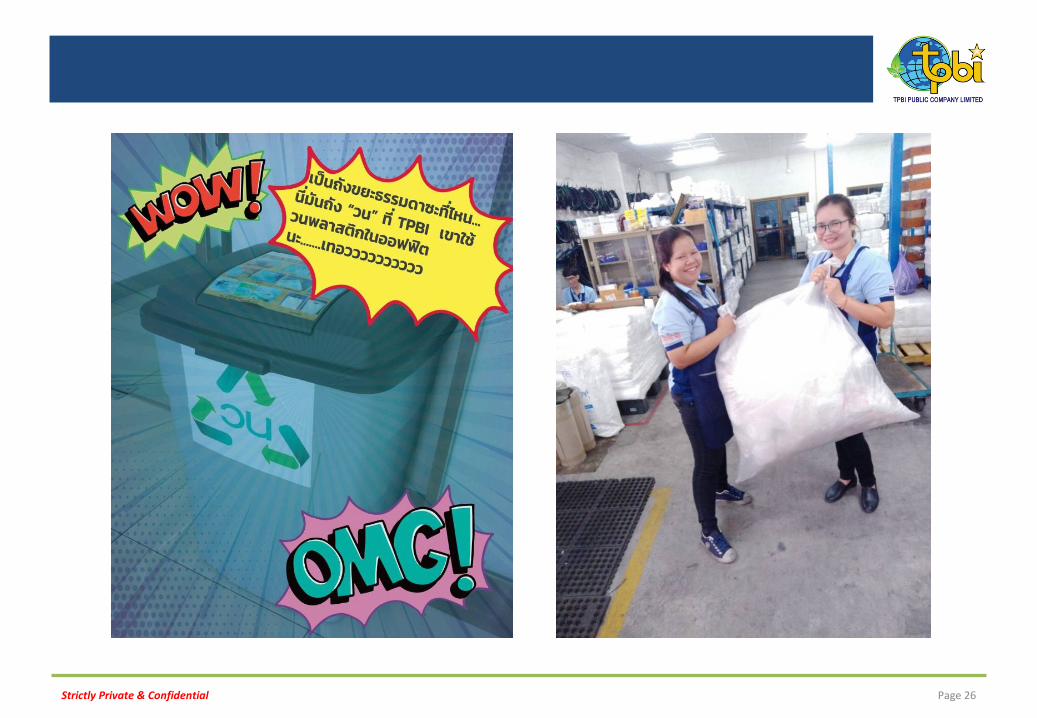
Strictly Private & Confidential Page 26
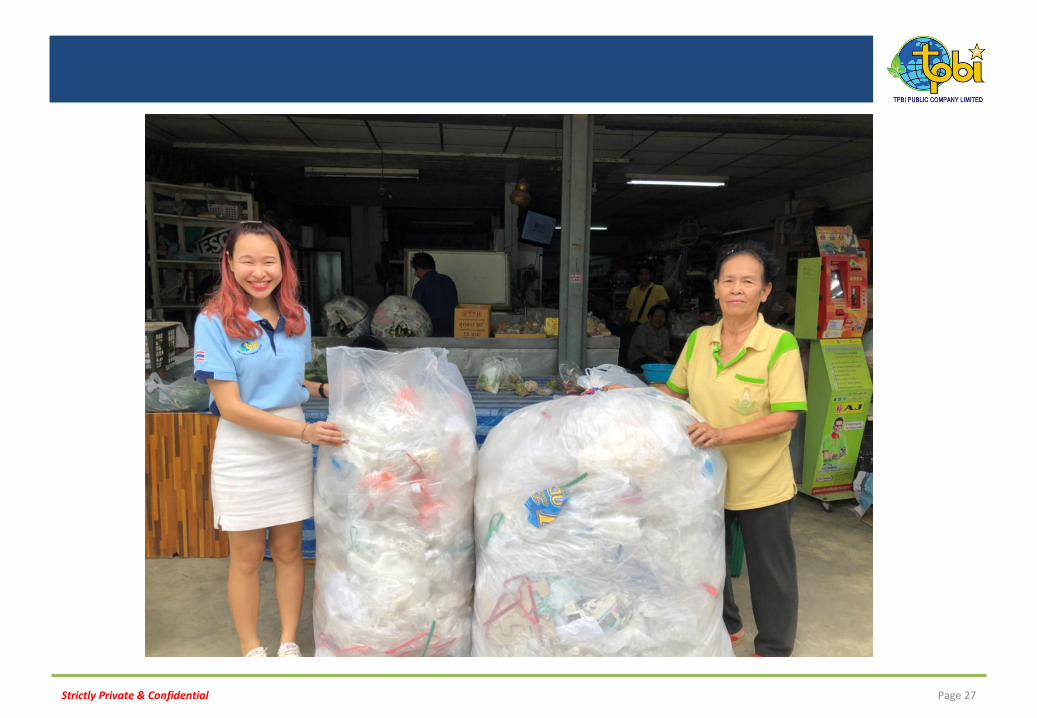
Strictly Private & Confidential Page 27
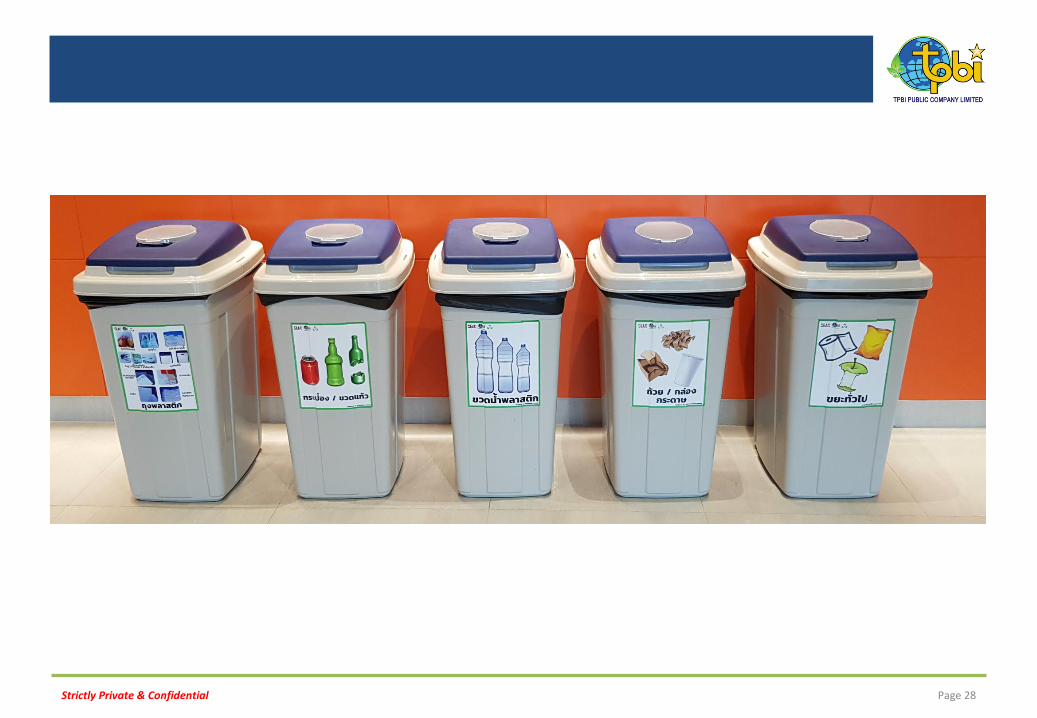
Strictly Private & Confidential Page 28
Strictly Private & Confidential Page 29
Strictly Private & Confidential
Investor Relations
TPBI Public Company Limited
42/174 Moo 5, Raiking Sampran Nakorn pathom 73210 Thailand
Tel: +66 (0)2 4290354-7
Fax: +66 (0)2 4290358
E-mail: [email protected]
Page 30