Embed Size (px)
Citation preview
TPC-H Full Disclosure Report
© 2012 Dell Inc. All rights reserved.
1
Dell Inc.
TPC Benchmark™ H Full Disclosure Report
PowerEdge R820
using
Actian VectorWise 2.0.1
and
Red Hat Enterprise Linux 6.1
First Edition
June 2012
TPC-H Full Disclosure Report
© 2012 Dell Inc. All rights reserved.
2
First Edition – June, 2012
Dell Inc., the sponsor of this benchmark test, believes that the information in this document is
accurate as of the publication date. The information in this document is subject to change without
notice. The sponsor assumes no responsibility for any errors that may appear in this document. The
pricing in this document is believed to accurately reflect the current prices as of the date of
publication. However, the sponsor provides no warranty of the pricing information in this document.
Vectorwise is a trademark of Actian. Intel and Intel Xeon are trademarks or registered trademarks of
Intel Corporation. TPC Benchmark, TPC-H, QphH, and $/QphH are trademarks of Transaction
Processing Performance Council. All other trademarks and copyrights are property of their
respective owners.
Benchmark results are highly dependent upon workload, specific application requirements, and
system design and implementation. Relative system performance will vary as a result of these and
other factors. Therefore, TPC Benchmark H should not be used as a substitute for a specific customer
application benchmark when critical capacity planning and/or product evaluation decisions are
contemplated.
All performance data contained in this report was obtained in a rigorously controlled environment.
Results obtained in other operating environments may vary significantly. No warranty of system
performance or price/performance is expressed or implied in this report.
© 2012 Dell Inc. All rights Reserved.
TPC-H Executive Summary
© 2012 Dell Inc. All rights reserved
Table of Contents
TABLE OF CONTENTS ..................................................................................................................................... 3
ABSTRACT ......................................................................................................................................................... 6
PREFACE .......................................................................................................................................................... 11
TPC BENCHMARK© H OVERVIEW ................................................................................................................. 11
GENERAL ITEMS ............................................................................................................................................ 13
0.1 TEST SPONSOR .......................................................................................................................................... 13
0.2 PARAMETER SETTINGS ............................................................................................................................. 13
0.3 CONFIGURATION DIAGRAMS..................................................................................................................... 13
CLAUSE 1: LOGICAL DATABASE DESIGN ................................................................................................ 14
1.1 DATABASE DEFINITION STATEMENTS ...................................................................................................... 15
1.2 PHYSICAL ORGANIZATION ....................................................................................................................... 15
1.3 HORIZONTAL PARTITIONING .................................................................................................................... 15
1.4 REPLICATION ............................................................................................................................................ 15
CLAUSE 2: QUERIES AND REFRESH FUNCTIONS ................................................................................... 16
2.1 QUERY LANGUAGE ................................................................................................................................... 16
2.2 VERIFYING METHOD OF RANDOM NUMBER GENERATION ...................................................................... 16
2.3 GENERATING VALUES FOR SUBSTITUTION PARAMETERS ....................................................................... 16
2.4 QUERY TEXT AND OUTPUT DATA FROM QUALIFICATION DATABASE .................................................... 16
2.5 QUERY SUBSTITUTION PARAMETERS AND SEEDS USED .......................................................................... 16
2.6 ISOLATION LEVEL..................................................................................................................................... 17
2.7 SOURCE CODE OF REFRESH FUNCTIONS .................................................................................................. 17
CLAUSE 3: DATABASE SYSTEM PROPERTIES ......................................................................................... 18
3.1 ACID PROPERTIES .................................................................................................................................... 18
3.2 ATOMICITY REQUIREMENTS .................................................................................................................... 18
3.3 CONSISTENCY REQUIREMENTS ................................................................................................................ 18
3.4 ISOLATION REQUIREMENTS ...................................................................................................................... 19
3.5 DURABILITY REQUIREMENTS ................................................................................................................... 21
TPC-H Executive Summary
© 2012 Dell Inc. All rights reserved
CLAUSE 4: SCALING AND DATABASE POPULATION ............................................................................ 23
4.1 INITIAL CARDINALITY OF TABLES ........................................................................................................... 23
4.2 DISTRIBUTION OF TABLES AND LOGS ACROSS MEDIA ............................................................................ 23
4.3 MAPPING OF DATABASE PARTITIONS/REPLICATIONS .............................................................................. 23
4.4 IMPLEMENTATION OF RAID ..................................................................................................................... 23
4.5 DBGEN MODIFICATIONS ......................................................................................................................... 24
4.6 DATABASE LOAD TIME ............................................................................................................................. 24
4.7 DATA STORAGE RATIO ............................................................................................................................. 24
4.8 DATABASE LOAD MECHANISM DETAILS AND ILLUSTRATION ................................................................. 24
4.9 QUALIFICATION DATABASE CONFIGURATION ......................................................................................... 26
4.10 MEMORY TO DATABASE SIZE PERCENTAGE .......................................................................................... 26
CLAUSE 5: PERFORMANCE METRICS AND EXECUTION RULES ......................................................... 27
5.1 SYSTEM ACTIVITY BETWEEN LOAD AND PERFORMANCE TESTS ............................................................ 27
5.2 STEPS IN THE POWER TEST ....................................................................................................................... 27
5.3 TIMING INTERVALS FOR EACH QUERY AND REFRESH FUNCTION ........................................................... 27
5.4 NUMBER OF STREAMS FOR THE THROUGHPUT TEST ............................................................................... 27
5.5 START AND END DATE/TIMES FOR EACH QUERY STREAM ..................................................................... 27
5.6 TOTAL ELAPSED TIME FOR THE MEASUREMENT INTERVAL .................................................................... 27
5.7 REFRESH FUNCTION START DATE/TIME AND FINISH DATE/TIME ........................................................... 28
5.8 TIMING INTERVALS FOR EACH QUERY AND EACH REFRESH FUNCTION FOR EACH STREAM ................. 28
5.9 PERFORMANCE METRICS .......................................................................................................................... 28
5.10 THE PERFORMANCE METRIC AND NUMERICAL QUANTITIES FROM BOTH RUNS .................................. 28
5.11 SYSTEM ACTIVITY BETWEEN TESTS ....................................................................................................... 28
5.12 DATASET VERIFICATION ......................................................................................................................... 28
5.13 REFERENTIAL INTEGRITY ........................................................................................................................ 29
CLAUSE 6: SUT AND DRIVER IMPLEMENTATION .................................................................................. 30
6.1 DRIVER ..................................................................................................................................................... 30
6.2 IMPLEMENTATION SPECIFIC LAYER ......................................................................................................... 30
TPC-H Executive Summary
© 2012 Dell Inc. All rights reserved
6.3 PROFILE-DIRECTED OPTIMIZATION .......................................................................................................... 30
CLAUSE 7: PRICING ....................................................................................................................................... 31
7.1 HARDWARE AND SOFTWARE PRICING ..................................................................................................... 31
7.2 THREE YEAR PRICE .................................................................................................................................. 31
7.3 AVAILABILITY DATES .............................................................................................................................. 31
SUPPORTING FILE INDEX ............................................................................................................................. 32
AUDITORS’ INFORMATION AND ATTESTATION LETTER .................................................................... 34
APPENDIX A .................................................................................................................................................... 37
TPC-H Executive Summary
© 2012 Dell Inc. All rights reserved
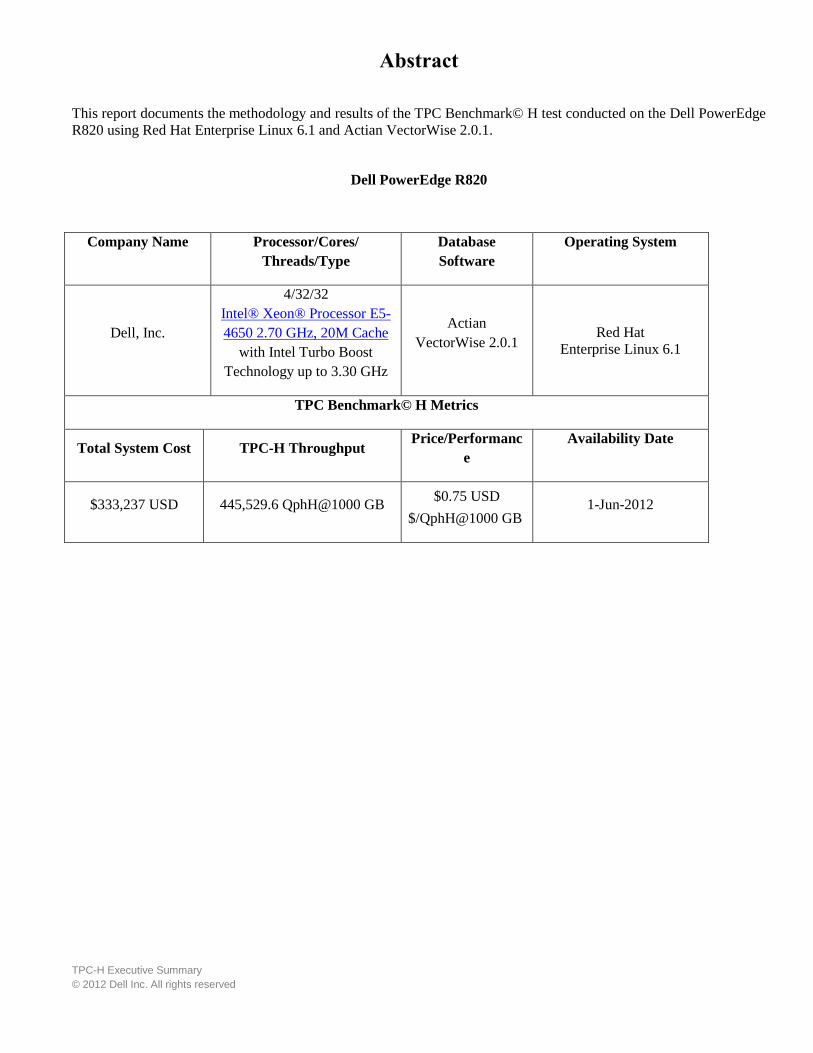
Abstract
This report documents the methodology and results of the TPC Benchmark© H test conducted on the Dell PowerEdge
R820 using Red Hat Enterprise Linux 6.1 and Actian VectorWise 2.0.1.
Dell PowerEdge R820
Company Name Processor/Cores/
Threads/Type
Database
Software
Operating System
Dell, Inc.
4/32/32
Intel® Xeon® Processor E5-
4650 2.70 GHz, 20M Cache
with Intel Turbo Boost
Technology up to 3.30 GHz
Actian
VectorWise 2.0.1 Red Hat
Enterprise Linux 6.1
TPC Benchmark© H Metrics
Total System Cost TPC-H Throughput Price/Performanc
e
Availability Date
$333,237 USD 445,529.6 QphH@1000 GB $0.75 USD
$/QphH@1000 GB 1-Jun-2012
TPC-H Executive Summary
© 2012 Dell Inc. All rights reserved
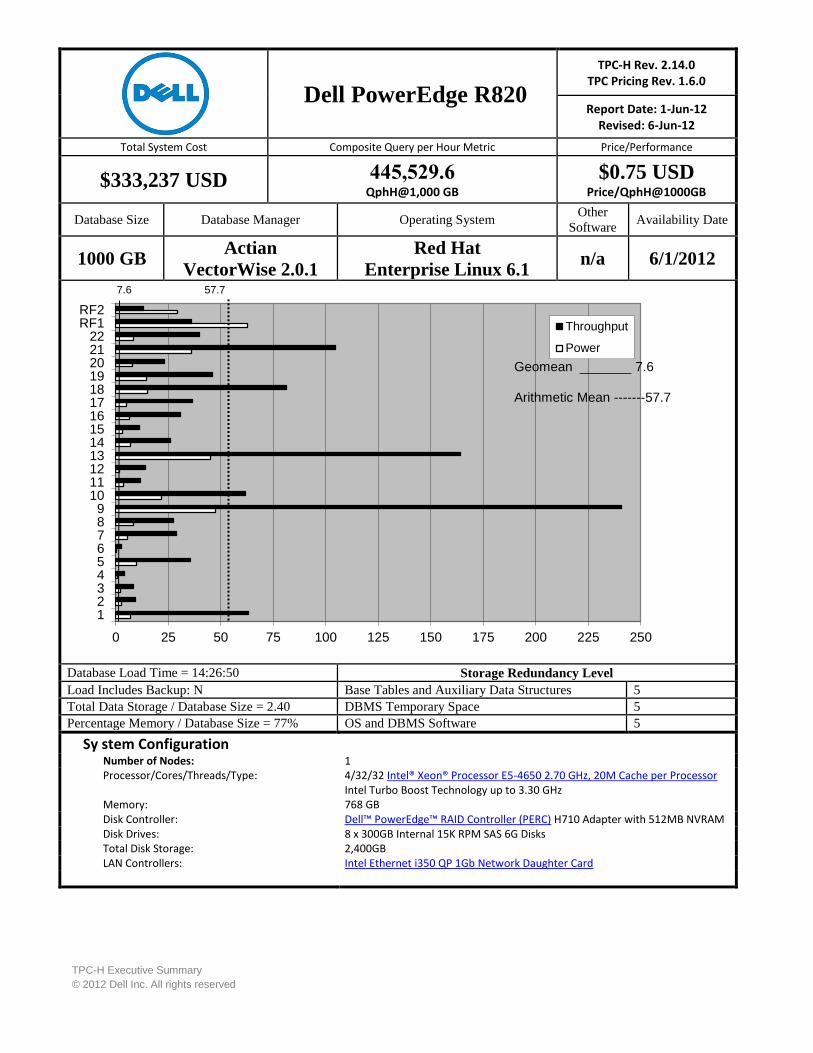
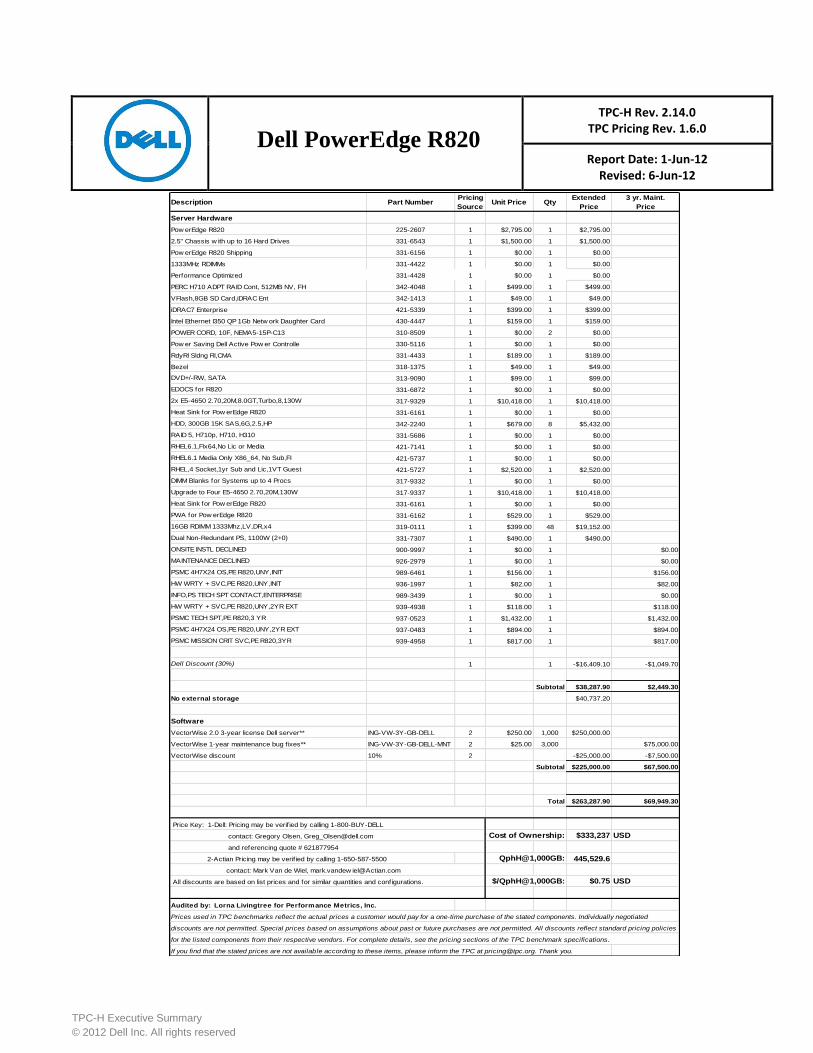
Dell PowerEdge R820
TPC-H Rev. 2.14.0 TPC Pricing Rev. 1.6.0
Report Date: 1-Jun-12 Revised: 6-Jun-12
Total System Cost Composite Query per Hour Metric Price/Performance
$333,237 USD 445,529.6 QphH@1,000 GB
$0.75 USD Price/QphH@1000GB
Database Size Database Manager Operating System Other
Software Availability Date
1000 GB Actian
VectorWise 2.0.1
Red Hat
Enterprise Linux 6.1 n/a 6/1/2012
Database Load Time = 14:26:50 Storage Redundancy Level
Load Includes Backup: N Base Tables and Auxiliary Data Structures 5
Total Data Storage / Database Size = 2.40 DBMS Temporary Space 5
Percentage Memory / Database Size = 77% OS and DBMS Software 5
Sy stem Configuration Number of Nodes: 1 Processor/Cores/Threads/Type: 4/32/32 Intel® Xeon® Processor E5-4650 2.70 GHz, 20M Cache per Processor
Intel Turbo Boost Technology up to 3.30 GHz Memory: 768 GB Disk Controller: Dell™ PowerEdge™ RAID Controller (PERC) H710 Adapter with 512MB NVRAM Disk Drives: 8 x 300GB Internal 15K RPM SAS 6G Disks Total Disk Storage: 2,400GB LAN Controllers: Intel Ethernet i350 QP 1Gb Network Daughter Card
0 25 50 75 100 125 150 175 200 225 250
123456789
10111213141516171819202122
RF1RF2
Throughput
Power
Geomean _______ 7.6 Arithmetic Mean -------57.7
7.6 57.7
TPC-H Executive Summary
© 2012 Dell Inc. All rights reserved
Dell PowerEdge R820
TPC-H Rev. 2.14.0 TPC Pricing Rev. 1.6.0
Report Date: 1-Jun-12 Revised: 6-Jun-12
Description Part NumberPricing
SourceUnit Price Qty
Extended
Price
3 yr. Maint.
Price
Server Hardware
Pow erEdge R820 225-2607 1 $2,795.00 1 $2,795.00
2.5" Chassis w ith up to 16 Hard Drives 331-6543 1 $1,500.00 1 $1,500.00
Pow erEdge R820 Shipping 331-6156 1 $0.00 1 $0.00
1333MHz RDIMMs 331-4422 1 $0.00 1 $0.00
Performance Optimized 331-4428 1 $0.00 1 $0.00
PERC H710 ADPT RAID Cont, 512MB NV, FH 342-4048 1 $499.00 1 $499.00
VFlash,8GB SD Card,iDRAC Ent 342-1413 1 $49.00 1 $49.00
iDRAC7 Enterprise 421-5339 1 $399.00 1 $399.00
Intel Ethernet I350 QP 1Gb Netw ork Daughter Card 430-4447 1 $159.00 1 $159.00
POWER CORD, 10F, NEMA5-15P-C13 310-8509 1 $0.00 2 $0.00
Pow er Saving Dell Active Pow er Controlle 330-5116 1 $0.00 1 $0.00
RdyRl Sldng Rl,CMA 331-4433 1 $189.00 1 $189.00
Bezel 318-1375 1 $49.00 1 $49.00
DVD+/-RW, SATA 313-9090 1 $99.00 1 $99.00
EDOCS for R820 331-6872 1 $0.00 1 $0.00
2x E5-4650 2.70,20M,8.0GT,Turbo,8,130W 317-9329 1 $10,418.00 1 $10,418.00
Heat Sink for Pow erEdge R820 331-6161 1 $0.00 1 $0.00
HDD, 300GB 15K SAS,6G,2.5,HP 342-2240 1 $679.00 8 $5,432.00
RAID 5, H710p, H710, H310 331-5686 1 $0.00 1 $0.00
RHEL6.1,FIx64,No Lic or Media 421-7141 1 $0.00 1 $0.00
RHEL6.1 Media Only X86_64, No Sub,FI 421-5737 1 $0.00 1 $0.00
RHEL,4 Socket,1yr Sub and Lic,1VT Guest 421-5727 1 $2,520.00 1 $2,520.00
DIMM Blanks for Systems up to 4 Procs 317-9332 1 $0.00 1 $0.00
Upgrade to Four E5-4650 2.70,20M,130W 317-9337 1 $10,418.00 1 $10,418.00
Heat Sink for Pow erEdge R820 331-6161 1 $0.00 1 $0.00
PWA for Pow erEdge R820 331-6162 1 $529.00 1 $529.00
16GB RDIMM 1333Mhz,LV,DR,x4 319-0111 1 $399.00 48 $19,152.00
Dual Non-Redundant PS, 1100W (2+0) 331-7307 1 $490.00 1 $490.00
ONSITE INSTL DECLINED 900-9997 1 $0.00 1 $0.00
MAINTENANCE DECLINED 926-2979 1 $0.00 1 $0.00
PSMC 4H7X24 OS,PE R820,UNY,INIT 989-6461 1 $156.00 1 $156.00
HW WRTY + SVC,PE R820,UNY,INIT 936-1997 1 $82.00 1 $82.00
INFO,PS TECH SPT CONTACT,ENTERPRISE 989-3439 1 $0.00 1 $0.00
HW WRTY + SVC,PE R820,UNY,2YR EXT 939-4938 1 $118.00 1 $118.00
PSMC TECH SPT,PE R820,3 YR 937-0523 1 $1,432.00 1 $1,432.00
PSMC 4H7X24 OS,PE R820,UNY,2YR EXT 937-0483 1 $894.00 1 $894.00
PSMC MISSION CRIT SVC,PE R820,3YR 939-4958 1 $817.00 1 $817.00
Dell Discount (30%) 1 1 -$16,409.10 -$1,049.70
Subtotal $38,287.90 $2,449.30
No external storage $40,737.20
Software
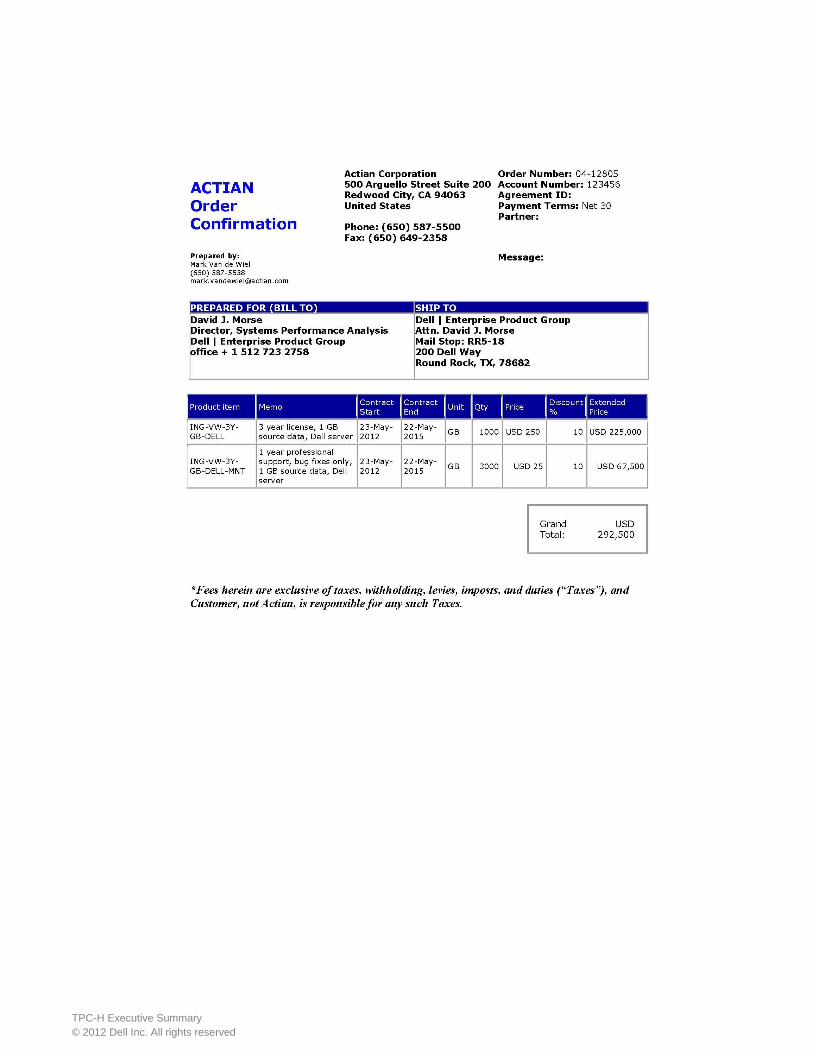
VectorWise 2.0 3-year license Dell server** ING-VW-3Y-GB-DELL 2 $250.00 1,000 $250,000.00
VectorWise 1-year maintenance bug f ixes** ING-VW-3Y-GB-DELL-MNT 2 $25.00 3,000 $75,000.00
VectorWise discount 10% 2 -$25,000.00 -$7,500.00
Subtotal $225,000.00 $67,500.00
Total $263,287.90 $69,949.30
$333,237 USD
2-Actian Pricing may be verif ied by calling 1-650-587-5500 445,529.6
$0.75 USD
Audited by: Lorna Livingtree for Performance Metrics, Inc.
Prices used in TPC benchmarks reflect the actual prices a customer would pay for a one-time purchase of the stated components. Individually negotiated
discounts are not permitted. Special prices based on assumptions about past or future purchases are not permitted. All discounts reflect standard pricing policies
for the listed components from their respective vendors. For complete details, see the pricing sections of the TPC benchmark specifications.
If you find that the stated prices are not available according to these items, please inform the TPC at [email protected]. Thank you.
QphH@1,000GB:
3-Year Cost of Ownership:
Price Key: 1-Dell: Pricing may be verif ied by calling 1-800-BUY-DELL
$/QphH@1,000GB: All discounts are based on list prices and for similar quantities and configurations.
and referencing quote # 621877954
contact: Gregory Olsen, [email protected]
contact: Mark Van de Wiel, mark.vandew [email protected]
TPC-H Executive Summary
© 2012 Dell Inc. All rights reserved
Dell PowerEdge R820
TPC-H Rev. 2.14.0 TPC Pricing Rev. 1.6.0
Report Date: 1-Jun-12 Revised: 6-Jun-12
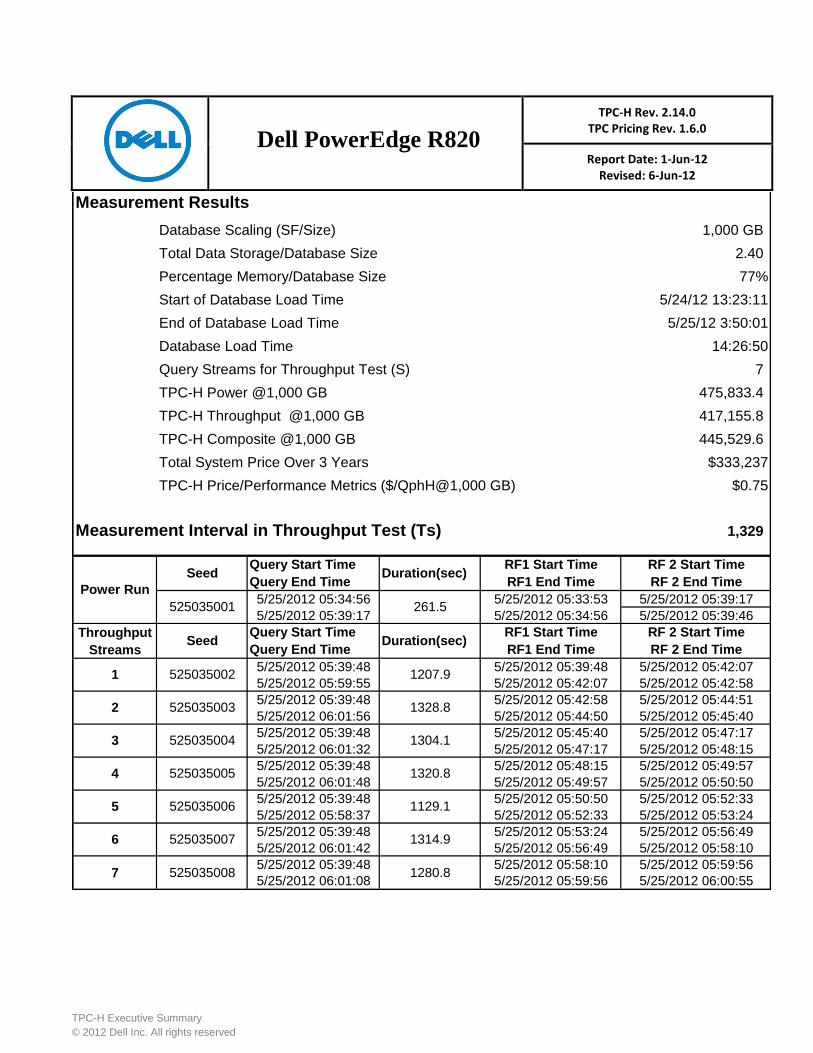
Measurement Results
Database Scaling (SF/Size) 1,000 GB
Total Data Storage/Database Size 2.40
Percentage Memory/Database Size 77%
Start of Database Load Time 5/24/12 13:23:11
End of Database Load Time 5/25/12 3:50:01
Database Load Time 14:26:50
Query Streams for Throughput Test (S) 7
TPC-H Power @1,000 GB 475,833.4
TPC-H Throughput @1,000 GB 417,155.8
TPC-H Composite @1,000 GB 445,529.6
Total System Price Over 3 Years $333,237
TPC-H Price/Performance Metrics ($/QphH@1,000 GB) $0.75
Measurement Interval in Throughput Test (Ts) 1,329
Query Start Time
Query End Time
5/25/2012 05:34:56
5/25/2012 05:39:17
Throughput Query Start Time
Streams Query End Time
5/25/2012 05:39:48
5/25/2012 05:59:55
5/25/2012 05:39:48
5/25/2012 06:01:56
5/25/2012 05:39:48
5/25/2012 06:01:32
5/25/2012 05:39:48
5/25/2012 06:01:48
5/25/2012 05:39:48
5/25/2012 05:58:37
5/25/2012 05:39:48
5/25/2012 06:01:42
5/25/2012 05:39:48
5/25/2012 06:01:08 5/25/2012 06:00:55
5/25/2012 05:53:24
5/25/2012 05:56:49
5/25/2012 05:58:10
5/25/2012 05:59:56
5/25/2012 05:42:58
5/25/2012 05:44:51
5/25/2012 05:45:40
5/25/2012 05:47:17
5/25/2012 05:48:15
5/25/2012 05:49:57
5/25/2012 05:50:50
5/25/2012 05:52:33
5/25/2012 05:56:49
5/25/2012 05:58:10
5/25/2012 05:59:56
RF 2 Start Time
RF 2 End Time
5/25/2012 05:39:17
5/25/2012 05:39:46
RF 2 Start Time
RF 2 End Time
5/25/2012 05:42:07
5/25/2012 05:53:24
5/25/2012 05:33:53
5/25/2012 05:34:56
RF1 Start Time
RF1 Start Time
RF1 End Time
RF1 End Time
5/25/2012 05:49:57
7
5/25/2012 05:39:48
5/25/2012 05:42:07
5/25/2012 05:42:58
4
5
6
3
525035008 1280.8
5/25/2012 05:50:50
5/25/2012 05:52:33
5/25/2012 05:44:50
5/25/2012 05:45:40
5/25/2012 05:47:17
5/25/2012 05:48:15
Seed Duration(sec)
2
1 525035002 1207.9
525035003 1328.8
Power Run
525035007 1314.9
525035004 1304.1
525035005 1320.8
Seed Duration(sec)
525035001 261.5
525035006 1129.1
TPC-H Executive Summary
© 2012 Dell Inc. All rights reserved
Dell PowerEdge R820
TPC-H Rev. 2.14.0 TPC Pricing Rev. 1.6.0
Report Date: 1-Jun-12 Revised: 6-Jun-12
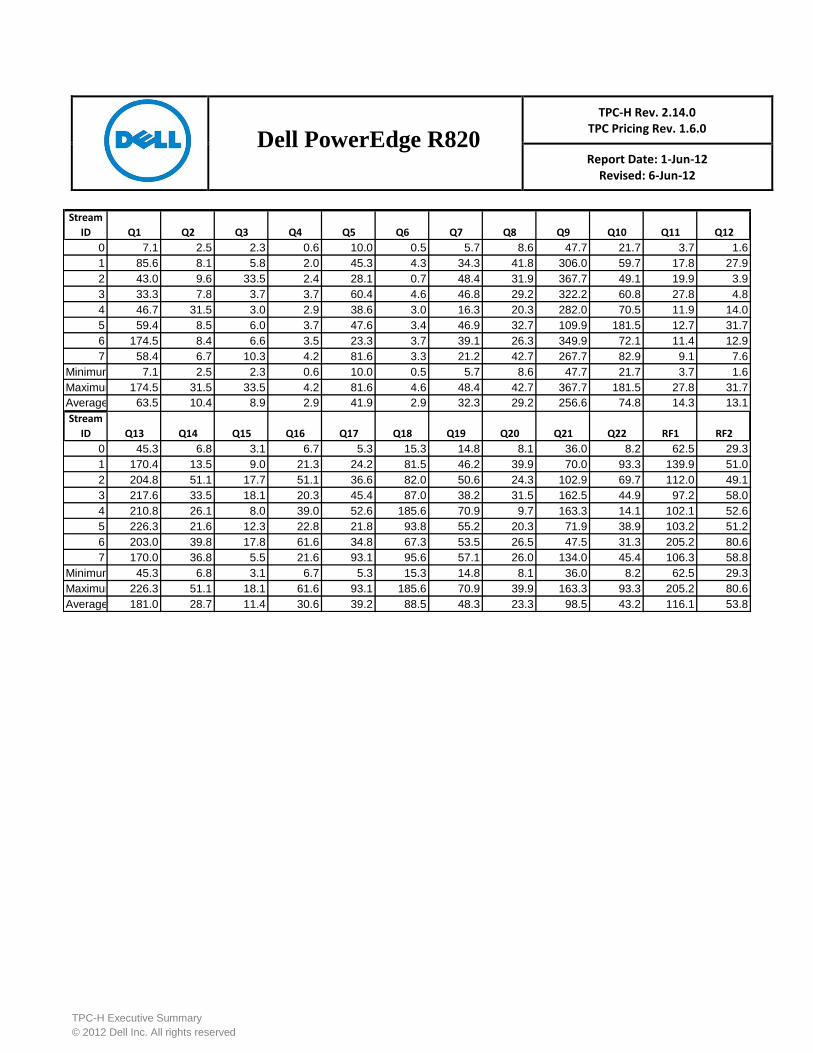
Stream
ID Q1 Q2 Q3 Q4 Q5 Q6 Q7 Q8 Q9 Q10 Q11 Q12
0 7.1 2.5 2.3 0.6 10.0 0.5 5.7 8.6 47.7 21.7 3.7 1.6
1 85.6 8.1 5.8 2.0 45.3 4.3 34.3 41.8 306.0 59.7 17.8 27.9
2 43.0 9.6 33.5 2.4 28.1 0.7 48.4 31.9 367.7 49.1 19.9 3.9
3 33.3 7.8 3.7 3.7 60.4 4.6 46.8 29.2 322.2 60.8 27.8 4.8
4 46.7 31.5 3.0 2.9 38.6 3.0 16.3 20.3 282.0 70.5 11.9 14.0
5 59.4 8.5 6.0 3.7 47.6 3.4 46.9 32.7 109.9 181.5 12.7 31.7
6 174.5 8.4 6.6 3.5 23.3 3.7 39.1 26.3 349.9 72.1 11.4 12.9
7 58.4 6.7 10.3 4.2 81.6 3.3 21.2 42.7 267.7 82.9 9.1 7.6
Minimum 7.1 2.5 2.3 0.6 10.0 0.5 5.7 8.6 47.7 21.7 3.7 1.6
Maximum 174.5 31.5 33.5 4.2 81.6 4.6 48.4 42.7 367.7 181.5 27.8 31.7
Average 63.5 10.4 8.9 2.9 41.9 2.9 32.3 29.2 256.6 74.8 14.3 13.1
Stream
ID Q13 Q14 Q15 Q16 Q17 Q18 Q19 Q20 Q21 Q22 RF1 RF2
0 45.3 6.8 3.1 6.7 5.3 15.3 14.8 8.1 36.0 8.2 62.5 29.3
1 170.4 13.5 9.0 21.3 24.2 81.5 46.2 39.9 70.0 93.3 139.9 51.0
2 204.8 51.1 17.7 51.1 36.6 82.0 50.6 24.3 102.9 69.7 112.0 49.1
3 217.6 33.5 18.1 20.3 45.4 87.0 38.2 31.5 162.5 44.9 97.2 58.0
4 210.8 26.1 8.0 39.0 52.6 185.6 70.9 9.7 163.3 14.1 102.1 52.6
5 226.3 21.6 12.3 22.8 21.8 93.8 55.2 20.3 71.9 38.9 103.2 51.2
6 203.0 39.8 17.8 61.6 34.8 67.3 53.5 26.5 47.5 31.3 205.2 80.6
7 170.0 36.8 5.5 21.6 93.1 95.6 57.1 26.0 134.0 45.4 106.3 58.8
Minimum 45.3 6.8 3.1 6.7 5.3 15.3 14.8 8.1 36.0 8.2 62.5 29.3
Maximum 226.3 51.1 18.1 61.6 93.1 185.6 70.9 39.9 163.3 93.3 205.2 80.6
Average 181.0 28.7 11.4 30.6 39.2 88.5 48.3 23.3 98.5 43.2 116.1 53.8
TPC-H Executive Summary
© 2012 Dell Inc. All rights reserved
Preface
The Transaction Processing Performance Council (TPC) is a non-profit corporation founded to define transaction
processing and database benchmarks and to disseminate objective, verifiable TPC performance data to the
industry. The TPC Benchmark© H (TPC-H) is a decision support benchmark.
TPC Benchmark© H Overview
The TPC Benchmark© H (TPC-H) consists of a suite of business oriented ad-hoc queries and concurrent data
modifications. The queries and the data populating the database have been chosen to have broad industry-wide
relevance while maintaining a sufficient degree of ease of implementation. This benchmark illustrates decision
support systems that
Examine large volumes of data;
Execute queries with a high degree of complexity;
Give answers to critical business questions.
TPC-H evaluates the performance of various decision support systems by the execution of sets of queries against
a standard database under controlled conditions. The TPC-H queries:
Give answers to real-world business questions;
Simulate generated ad-hoc queries (e.g., via a point and click GUI interface);
Are far more complex than most OLTP transactions;
Include a rich breadth of operators and selectivity constraints;
Generate intensive activity on the part of the database server component of the system under test;
Are executed against a database complying to specific population and scaling requirements;
Are implemented with constraints derived from staying closely synchronized with an on-line
production database.
The TPC-H operations are modeled as follows:
The database is continuously available 24 hours a day, 7 days a week, for ad-hoc queries from
multiple end users and data modifications against all tables, except possibly during infrequent
(e.g., once a month) maintenance sessions;
The TPC-H database tracks, possibly with some delay, the state of the OLTP database through
on-going refresh functions which batch together a number of modifications impacting some part
of the decision support database;
Due to the world-wide nature of the business data stored in the TPC-H database, the queries and
the refresh functions may be executed against the database at any time, especially in relation to
TPC-H Executive Summary
© 2012 Dell Inc. All rights reserved
each other. In addition, this mix of queries and refresh functions is subject to specific ACIDity
requirements, since queries and refresh functions may execute concurrently;
To achieve the optimal compromise between performance and operational requirements, the
database administrator can set, once and for all, the locking levels and the concurrent scheduling
rules for queries and refresh functions.
The performance metric reported by TPC-H is called the TPC-H Composite Query-per-Hour Performance Metric
(QphH@Size), and reflects multiple aspects of the capability of the system to process queries. These aspects
include the selected database size against which the queries are executed, the query processing power when
queries are submitted by a single stream and the query throughput when queries are submitted by multiple
concurrent users. The TPC-H Price/Performance metric is expressed as $/QphH@Size. To be compliant with the
TPC-H standard, all references to TPC-H results for a given configuration must include all required reporting
components. The TPC believes that comparisons of TPC-H results measured against different database sizes are
misleading and discourages such comparisons.
The TPC-H database must be implemented using a commercially available database management system (DBMS)
and the queries executed via an interface using dynamic SQL. The specification provides for variants of SQL, as
implementers are not required to have implemented a specific SQL standard in full.
TPC-H uses terminology and metrics that are similar to other benchmarks, originated by the TPC and others. Such
similarity in terminology does not in any way imply that TPC-H results are comparable to other benchmarks. The
only benchmark results comparable to TPC-H are other TPC-H results compliant with the same revision.
Despite the fact that this benchmark offers a rich environment representative of many decision support systems,
this benchmark does not reflect the entire range of decision support requirements. In addition, the extent to which
a customer can achieve the results reported by a vendor is highly dependent on how closely TPC-H approximates
the customer application. The relative performance of systems derived from this benchmark does not necessarily
hold for other workloads or environments. Extrapolations to any other environment are not recommended.
Benchmark results are highly dependent upon workload, specific application requirements, and systems design
and implementation. Relative system performance will vary as a result of these and other factors. Therefore, TPC-
H should not be used as a substitute for a specific customer application benchmarking when critical capacity
planning and/or product evaluation decisions are contemplated.
Further information is available at www.tpc.org

TPC-H Executive Summary
© 2012 Dell Inc. All rights reserved
General Items
0.1 Test Sponsor
A statement identifying the benchmark sponsor(s) and other participating companies must be provided.
This benchmark was sponsored by Dell Inc. and developed and engineered in partnership with Actian
Corporation.
0.2 Parameter Settings
Settings must be provided for all customer-tunable parameters and options which have been changed
from the defaults found in actual products, including but not limited to:
Database Tuning Options
Optimizer/Query execution options
Query processing tool/language configuration parameters
Recovery/commit options
Consistency/locking options
Operating system and configuration parameters
Configuration parameters and options for any other software component incorporated into the
pricing structure
Compiler optimization options
This requirement can be satisfied by providing a full list of all parameters and options, as long as all
those which have been modified from their default values have been clearly identified and these
parameters and options are only set once.
The Supporting File Archive contains the Operating System and DBMS parameters used in this
benchmark.
0.3 Configuration Diagrams
Diagrams of both measured and priced configurations must be provided, accompanied by a description of
the differences. This includes, but is not limited to:
• Total number of nodes used, total number and type of processors used/total number of cores
used/total number of threads used (including sizes of L2 and L3 caches);
• Size of allocated memory, and any specific mapping/partitioning of memory unique to the test;
• Number and type of disk units (and controllers, if applicable);
• Number of channels or bus connections to disk units, including their protocol type;
• Number of LAN (e.g., Ethernet) connections, including routers, workstations, terminals, etc., that
were physically used in the test or are incorporated into the pricing structure;
• Type and the run-time execution location of software components (e.g., DBMS, query processing
tools/languages, middleware components, software drivers, etc.).
TPC-H Executive Summary
© 2012 Dell Inc. All rights reserved
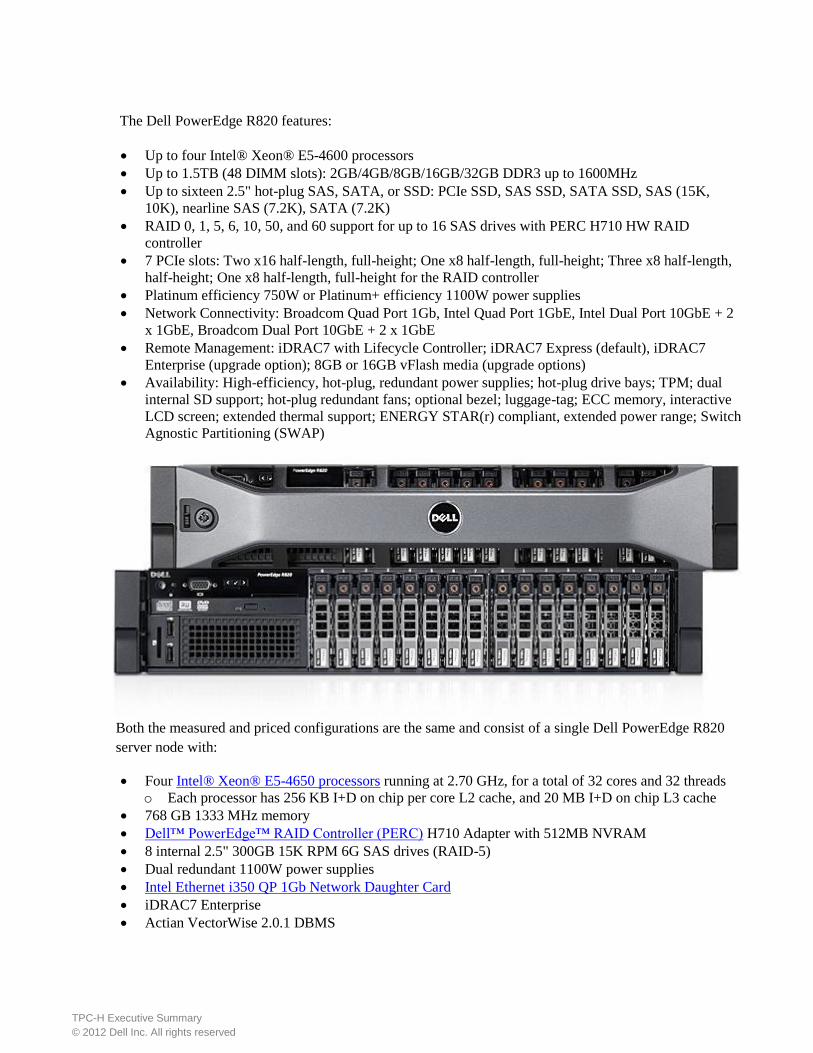
The Dell PowerEdge R820 features:
Up to four Intel® Xeon® E5-4600 processors
Up to 1.5TB (48 DIMM slots): 2GB/4GB/8GB/16GB/32GB DDR3 up to 1600MHz
Up to sixteen 2.5" hot-plug SAS, SATA, or SSD: PCIe SSD, SAS SSD, SATA SSD, SAS (15K,
10K), nearline SAS (7.2K), SATA (7.2K)
RAID 0, 1, 5, 6, 10, 50, and 60 support for up to 16 SAS drives with PERC H710 HW RAID
controller
7 PCIe slots: Two x16 half-length, full-height; One x8 half-length, full-height; Three x8 half-length,
half-height; One x8 half-length, full-height for the RAID controller
Platinum efficiency 750W or Platinum+ efficiency 1100W power supplies
Network Connectivity: Broadcom Quad Port 1Gb, Intel Quad Port 1GbE, Intel Dual Port 10GbE + 2
x 1GbE, Broadcom Dual Port 10GbE + 2 x 1GbE
Remote Management: iDRAC7 with Lifecycle Controller; iDRAC7 Express (default), iDRAC7
Enterprise (upgrade option); 8GB or 16GB vFlash media (upgrade options)
Availability: High-efficiency, hot-plug, redundant power supplies; hot-plug drive bays; TPM; dual
internal SD support; hot-plug redundant fans; optional bezel; luggage-tag; ECC memory, interactive
LCD screen; extended thermal support; ENERGY STAR(r) compliant, extended power range; Switch
Agnostic Partitioning (SWAP)
Both the measured and priced configurations are the same and consist of a single Dell PowerEdge R820
server node with:
Four Intel® Xeon® E5-4650 processors running at 2.70 GHz, for a total of 32 cores and 32 threads
o Each processor has 256 KB I+D on chip per core L2 cache, and 20 MB I+D on chip L3 cache
768 GB 1333 MHz memory
Dell™ PowerEdge™ RAID Controller (PERC) H710 Adapter with 512MB NVRAM
8 internal 2.5" 300GB 15K RPM 6G SAS drives (RAID-5)
Dual redundant 1100W power supplies
Intel Ethernet i350 QP 1Gb Network Daughter Card
iDRAC7 Enterprise
Actian VectorWise 2.0.1 DBMS
TPC-H Executive Summary
© 2012 Dell Inc. All rights reserved
Clause 1: Logical Database Design
1.1 Database Definition Statements
Listings must be provided for all table definition statements and all other statements used to set up the
test and qualification databases
The Supporting File Archive contains the table definitions and all other statements used to set up the test
and qualification databases.
1.2 Physical Organization
The physical organization of tables and indices, within the test and qualification databases, must be
disclosed. If the column ordering of any table is different from that specified in Clause 1.4, it must be
noted.
No record clustering or index clustering was used. No column reordering was used.
1.3 Horizontal Partitioning
Horizontal partitioning of tables and rows in the test and qualification databases (see Clause 1.5.4) must
be disclosed.
No horizontal partitioning was used.
1.4 Replication
Any replication of physical objects must be disclosed and must conform to the requirements of Clause
1.5.6.
No replication was used.
TPC-H Executive Summary
© 2012 Dell Inc. All rights reserved
Clause 2: Queries and Refresh Functions
2.1 Query Language
The query language used to implement the queries must be identified.
SQL was the query language used to implement the queries.
2.2 Verifying Method of Random Number Generation
The method of verification for the random number generation must be described unless the supplied
DBGEN and QGEN were used.
TPC-supplied DBGEN version 2.14.0 and QGEN version 2.14.0 were used.
2.3 Generating Values for Substitution Parameters
The method used to generate values for substitution parameters must be disclosed. If QGEN is not used
for this purpose, then the source code of any non-commercial tool used must be disclosed. If QGEN is
used, the version number, release number, modification number and patch level of QGEN must be
disclosed.
TPC supplied QGEN version 2.14.0 was used to generate the substitution parameters.
2.4 Query Text and Output Data from Qualification Database
The executable query text used for query validation must be disclosed along with the corresponding
output data generated during the execution of the query text against the qualification database. If minor
modifications (see Clause 2.2.3) have been applied to any functional query definitions or approved
variants in order to obtain executable query text, these modifications must be disclosed and justified. The
justification for a particular minor query modification can apply collectively to all queries for which it
has been used. The output data for the power and throughput tests must be made available electronically
upon request.
Supporting Files Archive contains the actual query text and query output. Following are the modifications
to the query.
In Q1, Q4, Q5, Q6, Q10, Q12, Q14, Q15 and Q20, the “dateadd” function is used to perform date
arithmetic.
In Q7, Q8 and Q9, the “datepart” function is used to extract part of a date (e.g., datepart(yy,…)).
In Q2, Q3, Q10, Q18 and Q21, the “top” function is used to restrict the number of output rows.
The word GO is used as a command delimiter.
2.5 Query Substitution Parameters and Seeds Used
All the query substitution parameters used during the performance test must be disclosed in tabular
format, along with the seeds used to generate these parameters.
Supporting Files Archive contains the query substitution parameters and seed used.
TPC-H Executive Summary
© 2012 Dell Inc. All rights reserved
2.6 Isolation Level
The isolation level used to run the queries must be disclosed. If the isolation level does not map closely to
one of the isolation levels defined in Clause 3.4, additional descriptive detail must be provided.
The queries and transactions were run with “Snapshot Isolation”.
2.7 Source Code of Refresh Functions
The details of how the refresh functions were implemented must be disclosed (including source code of
any non-commercial program used).
Supporting Files Archive contains the Source Code of refresh functions.
TPC-H Executive Summary
© 2012 Dell Inc. All rights reserved
Clause 3: Database System Properties
3.1 ACID Properties
The ACID (Atomicity, Consistency, Isolation, and Durability) properties of transaction processing
systems must be supported by the system under test during the timed portion of this benchmark. Since
TPC-H is not a transaction processing benchmark, the ACID properties must be evaluated outside the
timed portion of the test.
All ACID tests were conducted according to specification. The Supporting Files Archive contains the
source code of the ACID test scripts.
3.2 Atomicity Requirements
The results of the ACID tests must be disclosed along with a description of how the ACID requirements
were met. This includes disclosing the code written to implement the ACID Transaction and Query.
3.2.1 Atomicity of the Completed Transactions
Perform the ACID Transaction for a randomly selected set of input data and verify that the appropriate
rows have been changed in the ORDER, LINEITEM, and HISTORY tables.
The following steps were performed to verify the Atomicity of completed transactions:
1. The total price from the ORDER table and the extended price from the LINEITEM table were
retrieved for a randomly selected order key.
2. The ACID Transaction was performed using the order key from step 1.
3. The ACID Transaction was committed.
4. The total price from the ORDER table and the extended price from the LINEITEM table were
retrieved for the same order key. It was verified that the appropriate rows had been changed.
3.2.2 Atomicity of Aborted Transactions
Perform the ACID transaction for a randomly selected set of input data, submitting a ROLLBACK of the
transaction for the COMMIT of the transaction. Verify that the appropriate rows have not been changed
in the ORDER, LINEITEM, and HISTORY tables.
The following steps were performed to verify the Atomicity of the aborted ACID transaction:
1. The total price from the ORDER table and the extended price from the LINEITEM table
were retrieved for a randomly selected order key.
2. The ACID Transaction was performed using the order key from step 1. The transaction
was stopped prior to the commit.
3. The ACID Transaction was ROLLED BACK. .
4. The total price from the ORDER table and the extended price from the LINEITEM table
were retrieved for the same order key used in steps 1 and 2. It was verified that the
appropriate rows had not been changed.
3.3 Consistency Requirements
Consistency is the property of the application that requires any execution of transactions to take the
database from one consistent state to another.
TPC-H Executive Summary
© 2012 Dell Inc. All rights reserved
A consistent state for the TPC-H database is defined to exist when:
O_TOTALPRICE = SUM(L_EXTENDEDPRICE – L_DISCOUNT) * (1 + L_TAX)
For each ORDER and LINEITEM defined by (O_ORDERKEY = L_ORDERKEY)
3.3.1 Consistency Test
Verify that ORDER and LINEITEM tables are initially consistent as defined in Clause 3.3.2.1, based
upon a random sample of at least 10 distinct values of O_ORDERKEY.
The following steps were performed to verify consistency:
1. The consistency of the ORDER and LINEITEM tables was verified based on a sample of
O_ORDERKEYs.
2. One hundred ACID Transactions were submitted from each of eight execution streams.
3. The consistency of the ORDER and LINEITEM tables was re-verified.
3.4 Isolation Requirements
Operations of concurrent transactions must yield results which are indistinguishable from the results
which would be obtained by forcing each transaction to be serially executed to completion in some order.
3.4.1 Isolation Test 1 - Read-Write Conflict with Commit
Demonstrate isolation for the read-write conflict of a read-write transaction and a read-only transaction
when the read-write transaction is committed.
The following steps were performed to satisfy the test of isolation for a read-only and a read-write
committed transaction:
1. An ACID query was run with randomly selected values for O_KEY, L_KEY and DELTA to get
the initial value for O_TOTALPRICE.
2. An ACID Transaction was started using O_KEY, L_KEY and DELTA from step 1. The ACID
Transaction was suspended prior to Commit.
3. An ACID query was started for the same O_KEY used in step 1. The ACID query ran to
completion and did not see any uncommitted changes made by the ACID Transaction.
4. The ACID Transaction was resumed and committed.
5. The ACID query completed. It returned the data as committed by the ACID Transaction.
3.4.2 Isolation Test 2 - Read-Write Conflict with Rollback
Demonstrate isolation for the read-write conflict of a read-write transaction and a read-only transaction
when the read-write transaction is rolled back.
The following steps were performed to satisfy the test of isolation for read-only and a rolled back read-
write transaction:
1. An ACID query was run with randomly selected values for O_KEY, L_KEY and DELTA to get
the initial value for O_TOTALPRICE.
2. An ACID transaction was started using O_KEY, L_KEY and DELTA from step 1. The ACID
Transaction was suspended prior to Rollback.
3. An ACID query was started for the same O_KEY used in step 1. The ACID query did not see any
uncommitted changes made by the ACID Transaction.
4. The ACID Transaction was ROLLED BACK.
TPC-H Executive Summary
© 2012 Dell Inc. All rights reserved
5. The ACID query completed.
3.4.3 Isolation Test 3 - Write-Write Conflict with Commit
Demonstrate isolation for the write-write conflict of two update transactions when the first transaction is
committed. Two tests were run, the first with a transaction that COMMITS and the second with a transaction that ROLLS
BACK. Results from the first test were as follows: 1. An ACID query was run with randomly selected values for O_KEY, L_KEY and DELTA to get
the initial value for O_TOTALPRICE.
2. An ACID Transaction T1 was started using the same O_KEY, L_KEY and DELTA as step 1.
The ACID transaction T1 was suspended prior to Commit.
3. Another ACID Transaction T2 was started using the same O_KEY and L_KEY and a randomly
selected DELTA.
4. T2 committed and completed normally.
5. The ACID transaction T1 was allowed to Commit and received an error. This was expected due
to the “Snapshot Isolation” in use by the DBMS. This is also known as “First Committer Wins”.
6. The ACID Query was run again to verify that the O_TOTALPRICE was the value from T2.
Results from the second test were as follows:
1. An ACID Query was run for a randomly selected O_KEY, L_KEY and DELTA to get the initial
value for O_TOTALPRICE.
2. An ACID Transaction, T1, was started with the values used in step 1. The ACID transaction T1
was suspended prior to COMMIT.
3. A Second ACID transaction, T2, was started with the same O_KEY and L_KEY as step 1 and a
different value for DELTA.
4. T2 ROLLED BACK and completed.
5. T1 resumed and completed normally.
6. The ACID Query was run to verify the database was updated with the values from T1 and not T2.
3.4.4 Isolation Test 4 - Write-Write Conflict with Rollback
Demonstrate isolation for the write-write conflict of two update transactions when the first transaction is
rolled back.
Two tests were run, the first with a transaction that COMMITS and the second with a transaction that
ROLLS BACK
The results from the first test were as follows:
1. An ACID Query was run for a randomly selected O_KEY, L_KEY and DELTA to get the initial
value for O_TOTALPRICE
2. An ACID Transaction, T1, was started using the values from step 1. The ACID transaction T1
was suspended prior to ROLLBACK.
3. Another ACID Transaction, T2, was started using the same O_KEY and L_KEY and a randomly
selected DELTA.
4. T2 completed normally.
5. T1 was allowed to ROLLBACK.
6. It was verified that O_TOTALPRICE was from T2.
TPC-H Executive Summary
© 2012 Dell Inc. All rights reserved
The results from the second test were as follows
1. An ACID Query was run for a randomly selected O_KEY, L_KEY and DELTA to get the initial value for
O_TOTALPRICE.
2. An ACID Transaction, T1, was started with the same values as from step 1. T1 suspended prior to
COMMIT.
3. Another ACID Transaction, T2, was started and it ROLLED BACK its updates and completed
normally.
4. T1 resumed and COMMITED its updates.
5. An ACID Query was run to verify that O_TOTALPRICE was the value from T1 and not T2.
3.4.5 Isolation Test 5 – Concurrent Read and Write Transactions on Different Tables
Demonstrate the ability of read and write transactions affecting different database tables to make
progress concurrently.
The following steps were performed to verify isolation of concurrent read and write transactions on
different tables:
1. An ACID Query was run for a randomly selected O_KEY, L_KEY and DELTA to get the initial
value for O_TOTALPRICE.
2. An ACID Transaction, T1, was started with the values from step 1. T1 was suspended prior to
COMMIT.
3. A query was started using random values for PS_PARTKEY and PS_SUPPKEY, all columns of
the PARTSUPP table for which PS_PARTKEY and PS_SUPPKEY are equal are returned. The
query completed normally.
4. T1 was allowed to COMMIT.
5. It was verified that O_TOTALPRICE had been changed by T1
3.4.6 Isolation Test 6 – Update Transactions during Continuous Read-Only Query Stream
Demonstrate the continuous submission of arbitrary (read-only) queries against one or more tables of the
database does not indefinitely delay update transactions affecting those tables from making progress.
The following steps were performed to verify isolation of update transaction during continuous read-
only query:
1. A Stream was submitted that executed Q1 ten times in a row with a delta of 0 to ensure that each
query ran as long as possible.
2. An ACID Transaction, T1, was started for a randomly selected O_KEY, L_KEY and DELTA.
3. T1 completed and it was verified that O_TOTALPRICE was updated correctly.
4. The stream submitting Q1 finished.
3.5 Durability Requirements
The tested system must guarantee durability: the ability to preserve the effects of committed transactions
and insure database consistency after recovery from any one of the failures listed in Clause 3.5.2.
3.5.1 Permanent Unrecoverable Failure of Any Durable Medium
Guarantee the database and committed updates are preserved across a permanent irrecoverable failure
of any single durable medium containing TPC-H database tables or recovery log tables.

TPC-H Executive Summary
© 2012 Dell Inc. All rights reserved
The database files including the logs were distributed across 8 disk drives in a RAID 5 configuration. The
tests were conducted on the qualification database. These steps were performed to demonstrate that
committed updates are preserved across a permanent irrecoverable failure of a disk drive:
1. The consistency of the ORDERS and LINEITEM tables was verified using 80 randomly chosen
values for O_ORDERKEY.
2. Exactly 8 streams of ACID transactions were started.
3. When the driver script indicated that at least 100 transactions had completed in each stream, a
randomly selected disk drive was removed from the SUT and the SUT continued to process work
until all streams had completed 200 transactions.
4. An analysis of the transaction start and end times from each stream showed that there was at least
1 transaction in-flight at all times.
5. An analysis of the HISTORY table showed that all of the values used for O_ORDERKEY in step
1 were used by some transaction in step 2.
6. An analysis of the success file and the HISTORY table showed that all entries in the HISTORY
table had a corresponding entry in the success file and that every entry in the success file had a
corresponding entry in the HISTORY table.
7. The consistency of the database was re-verified.
3.5.2 System Crash
Guarantee the database and committed updates are preserved across an instantaneous interruption
(system crash/system hang) in processing which requires the system to reboot to recover.
1. The system crash and memory failure tests were combined. First the consistency of the ORDER
and LINEITEM tables was verified.
2. Then transactions were submitted from 8 streams.
3. Once the driver script indicated that 100 transactions had been submitted from each stream,
power to the SUT was removed by pulling the power cord.
4. When power was restored to the SUT, the system rebooted and the database was restarted.
5. The HISTORY table and success files were compared to verify that every record in the
HISTORY table had a corresponding record in the success file and that each record in the success
file had a corresponding entry in the HISTORY table. The consistency of the ORDERS and
LINEITEM tables was then verified again.
3.5.3 Memory Failure
Guarantee the database and committed updates are preserved across failure of all or part of memory
(loss of contents).
See section 3.5.2
TPC-H Executive Summary
© 2012 Dell Inc. All rights reserved
Clause 4: Scaling and Database Population
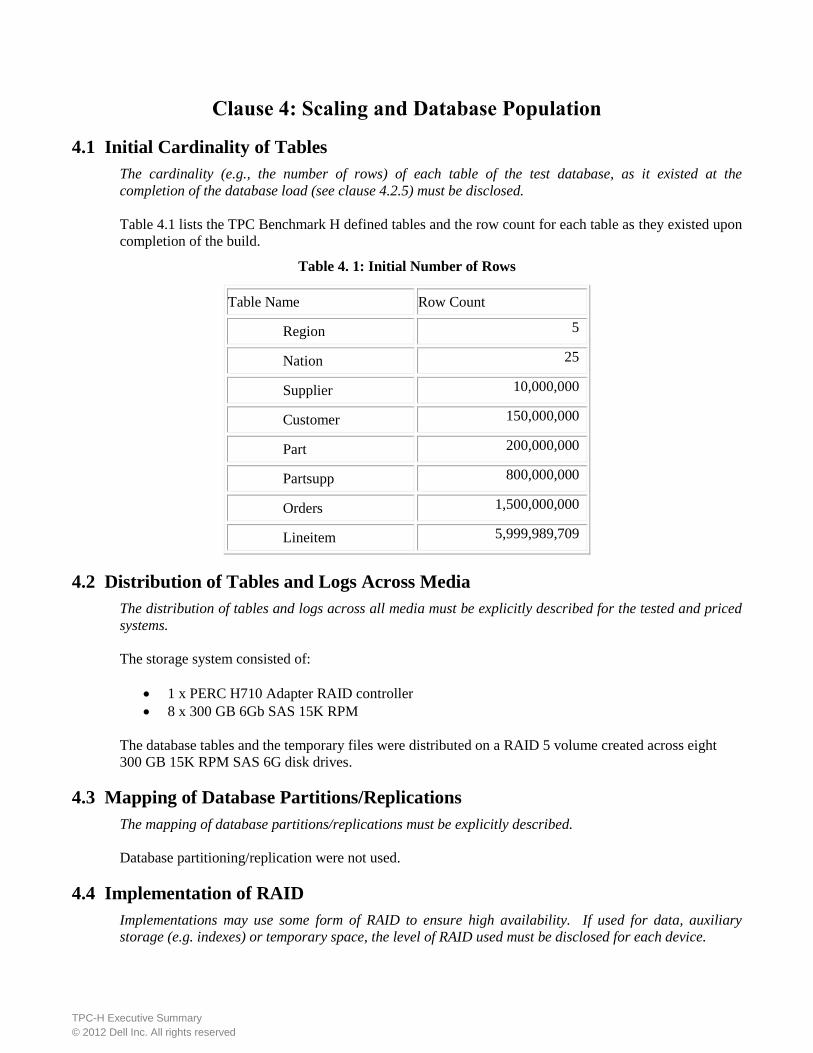
4.1 Initial Cardinality of Tables
The cardinality (e.g., the number of rows) of each table of the test database, as it existed at the
completion of the database load (see clause 4.2.5) must be disclosed.
Table 4.1 lists the TPC Benchmark H defined tables and the row count for each table as they existed upon
completion of the build.
Table 4. 1: Initial Number of Rows
Table Name Row Count
Region 5
Nation 25
Supplier 10,000,000
Customer 150,000,000
Part 200,000,000
Partsupp 800,000,000
Orders 1,500,000,000
Lineitem 5,999,989,709
4.2 Distribution of Tables and Logs Across Media
The distribution of tables and logs across all media must be explicitly described for the tested and priced
systems.
The storage system consisted of:
1 x PERC H710 Adapter RAID controller
8 x 300 GB 6Gb SAS 15K RPM
The database tables and the temporary files were distributed on a RAID 5 volume created across eight
300 GB 15K RPM SAS 6G disk drives.
4.3 Mapping of Database Partitions/Replications
The mapping of database partitions/replications must be explicitly described.
Database partitioning/replication were not used.
4.4 Implementation of RAID
Implementations may use some form of RAID to ensure high availability. If used for data, auxiliary
storage (e.g. indexes) or temporary space, the level of RAID used must be disclosed for each device.
TPC-H Executive Summary
© 2012 Dell Inc. All rights reserved
The database tables and the temporary files were distributed on a RAID 5 volume created across eight
300 GB 15K RPM SAS 6G disk drives.
4.5 DBGEN Modifications
The version number, release number, modification number, and patch level of DBGEN must be disclosed.
Any modifications to the DBGEN (see Clause 4.2.1) source code must be disclosed. In the event that a
program other than DBGEN was used to populate the database, it must be disclosed in its entirety.
DBGEN version 2.14.0 was used, no modifications were made.
4.6 Database Load time
The database load time for the test database (see clause 4.3) must be disclosed.
The database load time was 14 hours 26 minutes and 50 seconds
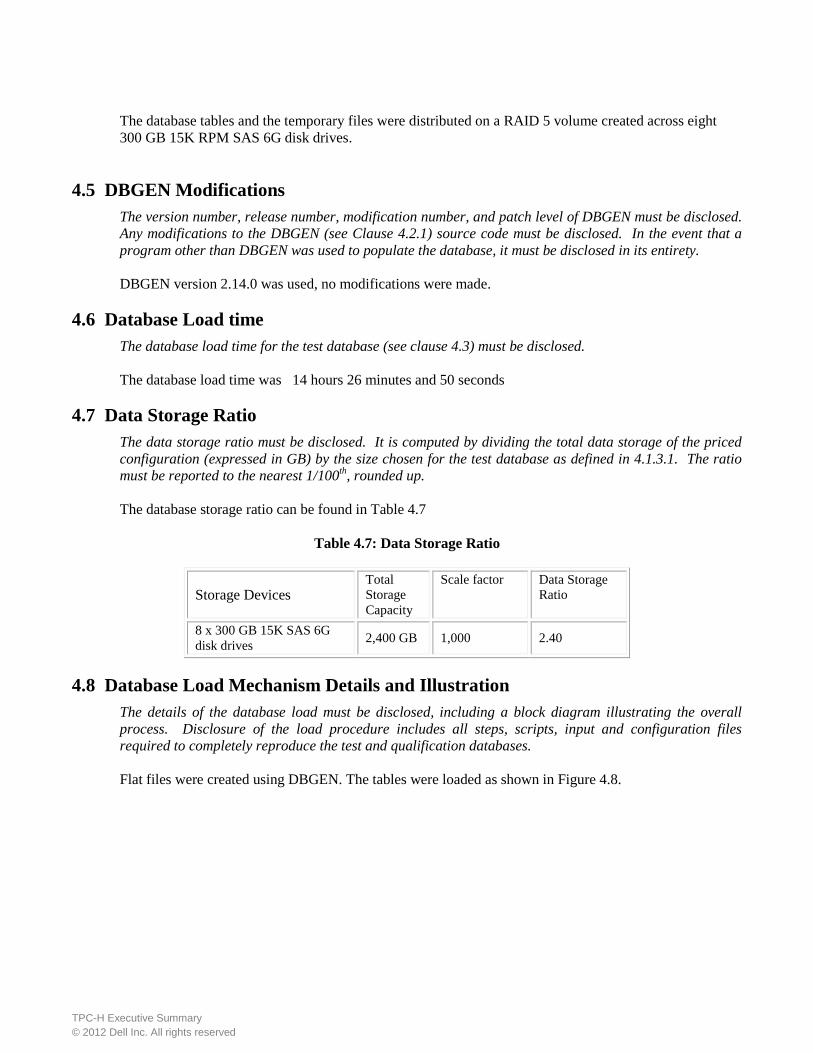
4.7 Data Storage Ratio
The data storage ratio must be disclosed. It is computed by dividing the total data storage of the priced
configuration (expressed in GB) by the size chosen for the test database as defined in 4.1.3.1. The ratio
must be reported to the nearest 1/100th, rounded up.
The database storage ratio can be found in Table 4.7
Table 4.7: Data Storage Ratio
Storage Devices Total
Storage
Capacity
Scale factor Data Storage
Ratio
8 x 300 GB 15K SAS 6G
disk drives 2,400 GB 1,000 2.40
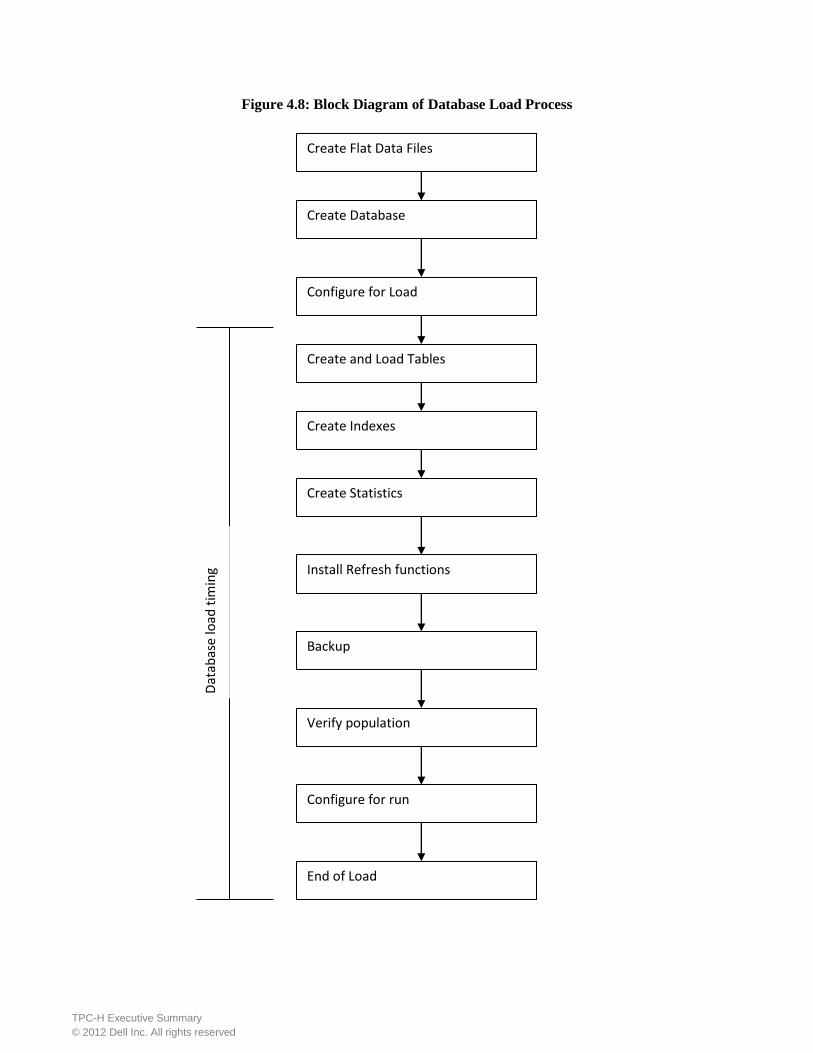
4.8 Database Load Mechanism Details and Illustration
The details of the database load must be disclosed, including a block diagram illustrating the overall
process. Disclosure of the load procedure includes all steps, scripts, input and configuration files
required to completely reproduce the test and qualification databases.
Flat files were created using DBGEN. The tables were loaded as shown in Figure 4.8.
TPC-H Executive Summary
© 2012 Dell Inc. All rights reserved
Figure 4.8: Block Diagram of Database Load Process
Create Flat Data Files
Create Database
Configure for Load
Create and Load Tables
Create Indexes
Create Statistics
Install Refresh functions
Backup
Verify population
Configure for run
Dat
abas
e lo
ad t
imin
g
per
iod
End of Load
TPC-H Executive Summary
© 2012 Dell Inc. All rights reserved
4.9 Qualification Database Configuration
Any differences between the configuration of the qualification database and the test database must be disclosed.
The qualification database used identical scripts to create and load the data with changes to adjust for the database
scale factor.
4.10 Memory to Database Size Percentage
The memory to database size percentage must be disclosed.
The memory to database size percentage is 77%
TPC-H Executive Summary
© 2012 Dell Inc. All rights reserved
Clause 5: Performance Metrics and Execution Rules
5.1 System Activity Between Load and Performance Tests
Any system activity on the SUT that takes place between the conclusion of the load test and the beginning of the
performance test must be fully disclosed.
Auditor requested script was run to display the indices that had been created on the database and the row
counts at the end of the load. All scripts and queries used are included in the Supporting Files Archive.
5.2 Steps in the Power Test
The details of the steps followed to implement the power test (e.g., system boot, database restart, etc.)
must be disclosed.
The following steps were used to implement the power test:
1. RF1 Refresh Transaction
2. Stream 00 Execution
3. RF2 Refresh Transaction.
5.3 Timing Intervals for Each Query and Refresh Function
The timing intervals (see Clause 5.3.6) for each query of the measured set and for both refresh functions
must be reported for the power test.
The timing intervals for each query and both refresh functions are given in the Numerical Quantities
Summary earlier in the executive summary.
5.4 Number of Streams for The Throughput Test
The number of execution streams used for the throughput test must be disclosed.
Eleven streams were used for the Throughput Test.
5.5 Start and End Date/Times for Each Query Stream
The start time and finish time for each query execution stream must be reported for the throughput test.
The Numerical Quantities Summary contains the start and stop times for the query execution streams run
on the system reported.
5.6 Total Elapsed Time for the Measurement Interval
The total elapsed time of the measurement interval (see Clause 5.3.5) must be reported for the throughput
test.
The Numerical Quantities Summary contains the timing intervals for the throughput test run on the
system reported.
TPC-H Executive Summary
© 2012 Dell Inc. All rights reserved
5.7 Refresh Function Start Date/Time and Finish Date/Time
Start and finish time for each update function in the update stream must be reported for the throughput
test.
Start and finish time for each update function in the update stream are included in the Numerical
Quantities Summary earlier in the Executive Summary.
5.8 Timing Intervals for Each Query and Each Refresh Function for Each Stream
The timing intervals (see Clause 5.3.6) for each query of each stream and for each update function must
be reported for the throughput test.
The timing intervals for each query and each update function are included in the Numerical Quantities
Summary earlier in the Executive Summary.
5.9 Performance Metrics
The computed performance metrics, related numerical quantities and the price performance metric must
be reported.
The Numerical Quantities Summary contains the performance metrics, related numerical quantities, and
the price/performance metric for the system reported.
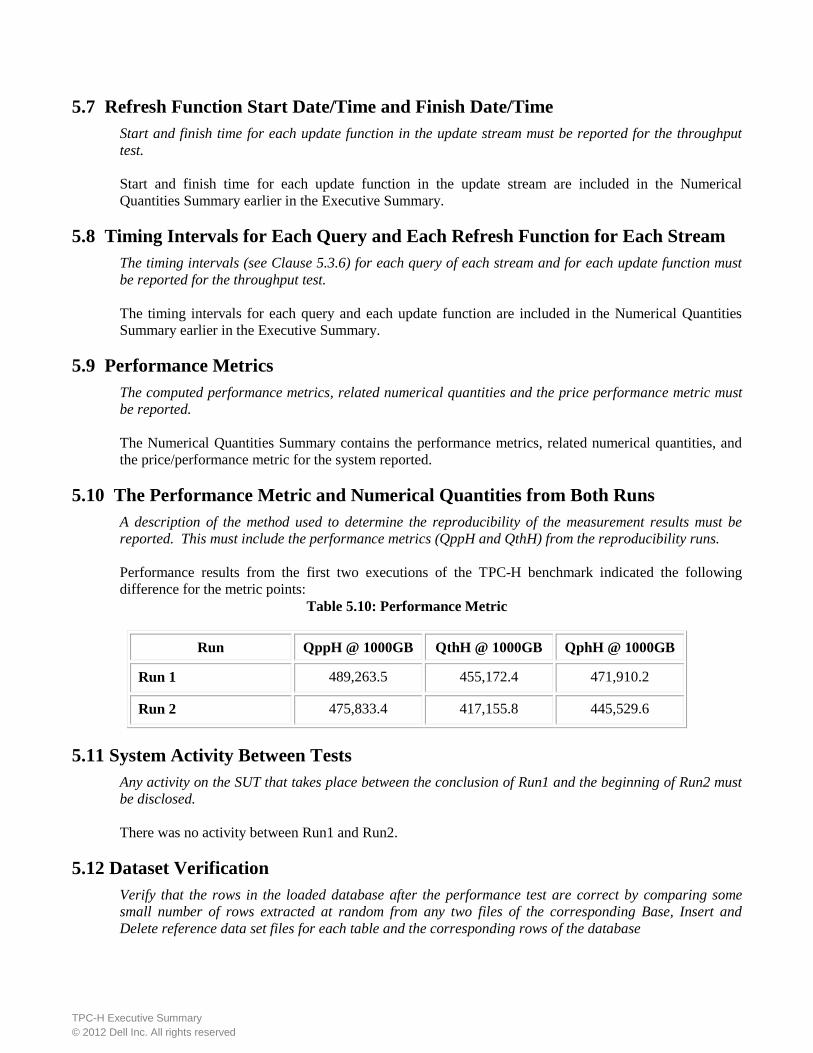
5.10 The Performance Metric and Numerical Quantities from Both Runs
A description of the method used to determine the reproducibility of the measurement results must be
reported. This must include the performance metrics (QppH and QthH) from the reproducibility runs.
Performance results from the first two executions of the TPC-H benchmark indicated the following
difference for the metric points:
Table 5.10: Performance Metric
Run QppH @ 1000GB QthH @ 1000GB QphH @ 1000GB
Run 1 489,263.5 455,172.4 471,910.2
Run 2 475,833.4 417,155.8 445,529.6
5.11 System Activity Between Tests
Any activity on the SUT that takes place between the conclusion of Run1 and the beginning of Run2 must
be disclosed.
There was no activity between Run1 and Run2.
5.12 Dataset Verification
Verify that the rows in the loaded database after the performance test are correct by comparing some
small number of rows extracted at random from any two files of the corresponding Base, Insert and
Delete reference data set files for each table and the corresponding rows of the database

TPC-H Executive Summary
© 2012 Dell Inc. All rights reserved
Verified according to specification.
5.13 Referential Integrity
Verify referential integrity in the database after the initial load. An auditor supplied script was used to verify referential integrity.

TPC-H Executive Summary
© 2012 Dell Inc. All rights reserved
Clause 6: SUT and Driver Implementation
6.1 Driver
A detailed description of how the driver performs its functions must be supplied, including any related
source code or scripts. This description should allow an independent reconstruction of the driver.
The supporting files archive contains the scripts that were used to implement the driver.
The power test is invoked through the script power_test.sh. It starts the stream 0 SQL script along with
the refresh functions such that:
• The SQL for RF1 is submitted and executed by the database
• Then the queries as generated by QGEN are submitted in the order defined by Clause 5.3.5.4
• The SQL for RF2 is then submitted from the same connection used for RF1 and executed by
database
The Throughput test is invoked through the script throughput_test.sh. This script then initiates all of the
SQL streams and the refresh stream.
6.2 Implementation Specific Layer
If an implementation-specific layer is used, then a detailed description of how it performs its functions
must be supplied, including any related source code or scripts. This description should allow an
independent reconstruction of the implementation-specific layer.
There was no Implementation Specific Layer, only native scripts and SQL.
6.3 Profile-Directed Optimization
If profile-directed optimization as described in Clause 5.2.9 is used, such used must be disclosed.
Profile-directed optimization was not used.

TPC-H Executive Summary
© 2012 Dell Inc. All rights reserved
Clause 7: Pricing
7.1 Hardware and Software Pricing
A detailed list of hardware and software used in the priced system must be reported. Each item must
have vendor part number, description, and release/revision level, and either general availability status or
committed delivery date. If package-pricing is used, contents of the package must be disclosed. Pricing
source(s) and effective date(s) of price(s) must also be reported.
A detailed list of all hardware and software, including the 3-year support, is provided in the Executive
Summary in the Abstract section of this report. The price quotations are included in Appendix A.
7.2 Three Year Price
The total 3-year price of the entire configuration must be reported including: hardware, software, and
maintenance charges. Separate component pricing is recommended. The basis of all discounts used must
be disclosed.
The pricing details for this disclosure are contained in the executive summary pages.
7.3 Availability Dates
The committed delivery date for general availability of products used in the price calculations must be
reported. When the priced system includes products with different availability dates, the availability date
reported on the executive summary must be the date by which all components are committed to being
available. The full disclosure report must report availability dates individually for at least each of the
categories for which a pricing subtotal must be provided.
All components of the SUT will be available on the date of publication.
TPC-H Executive Summary
© 2012 Dell Inc. All rights reserved
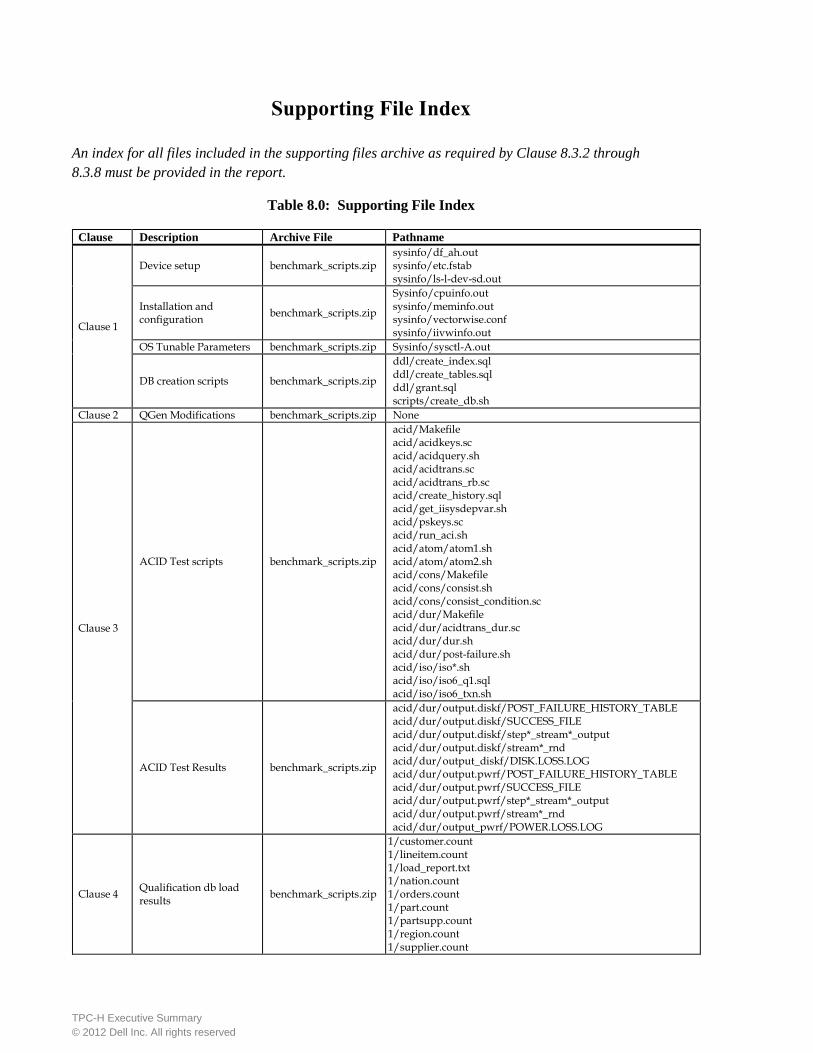
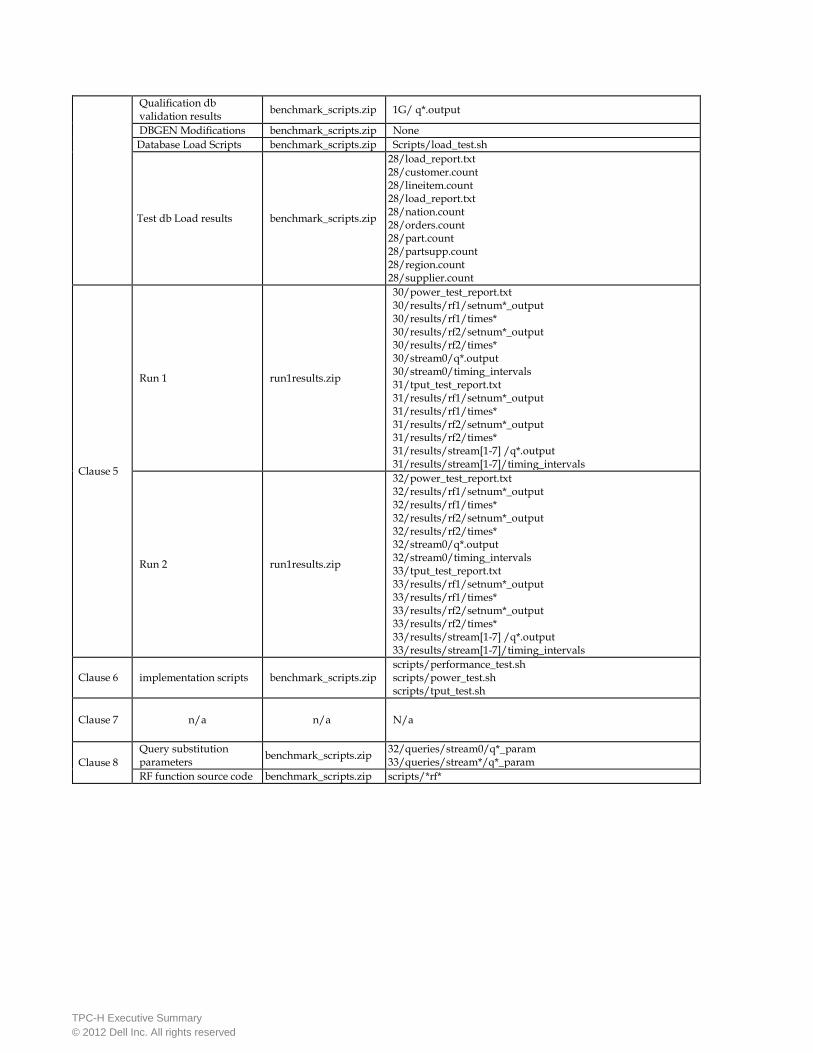
Supporting File Index
An index for all files included in the supporting files archive as required by Clause 8.3.2 through
8.3.8 must be provided in the report.
Table 8.0: Supporting File Index
Clause Description Archive File Pathname
Clause 1
Device setup benchmark_scripts.zip sysinfo/df_ah.out sysinfo/etc.fstab sysinfo/ls-l-dev-sd.out
Installation and configuration
benchmark_scripts.zip
Sysinfo/cpuinfo.out sysinfo/meminfo.out sysinfo/vectorwise.conf sysinfo/iivwinfo.out
OS Tunable Parameters benchmark_scripts.zip Sysinfo/sysctl-A.out
DB creation scripts benchmark_scripts.zip
ddl/create_index.sql ddl/create_tables.sql ddl/grant.sql scripts/create_db.sh
Clause 2 QGen Modifications benchmark_scripts.zip None
Clause 3
ACID Test scripts benchmark_scripts.zip
acid/Makefile acid/acidkeys.sc acid/acidquery.sh acid/acidtrans.sc acid/acidtrans_rb.sc acid/create_history.sql acid/get_iisysdepvar.sh acid/pskeys.sc acid/run_aci.sh acid/atom/atom1.sh acid/atom/atom2.sh acid/cons/Makefile acid/cons/consist.sh acid/cons/consist_condition.sc acid/dur/Makefile acid/dur/acidtrans_dur.sc acid/dur/dur.sh acid/dur/post-failure.sh acid/iso/iso*.sh acid/iso/iso6_q1.sql acid/iso/iso6_txn.sh
ACID Test Results benchmark_scripts.zip
acid/dur/output.diskf/POST_FAILURE_HISTORY_TABLE acid/dur/output.diskf/SUCCESS_FILE acid/dur/output.diskf/step*_stream*_output acid/dur/output.diskf/stream*_rnd acid/dur/output_diskf/DISK.LOSS.LOG acid/dur/output.pwrf/POST_FAILURE_HISTORY_TABLE acid/dur/output.pwrf/SUCCESS_FILE acid/dur/output.pwrf/step*_stream*_output acid/dur/output.pwrf/stream*_rnd acid/dur/output_pwrf/POWER.LOSS.LOG
Clause 4 Qualification db load results
benchmark_scripts.zip
1/customer.count 1/lineitem.count 1/load_report.txt 1/nation.count 1/orders.count 1/part.count 1/partsupp.count 1/region.count 1/supplier.count
TPC-H Executive Summary
© 2012 Dell Inc. All rights reserved
Qualification db validation results
benchmark_scripts.zip 1G/ q*.output
DBGEN Modifications benchmark_scripts.zip None
Database Load Scripts benchmark_scripts.zip Scripts/load_test.sh
Test db Load results benchmark_scripts.zip
28/load_report.txt 28/customer.count 28/lineitem.count 28/load_report.txt 28/nation.count 28/orders.count 28/part.count 28/partsupp.count 28/region.count 28/supplier.count
Clause 5
Run 1 run1results.zip
30/power_test_report.txt 30/results/rf1/setnum*_output 30/results/rf1/times* 30/results/rf2/setnum*_output 30/results/rf2/times* 30/stream0/q*.output 30/stream0/timing_intervals 31/tput_test_report.txt 31/results/rf1/setnum*_output 31/results/rf1/times* 31/results/rf2/setnum*_output 31/results/rf2/times* 31/results/stream[1-7] /q*.output 31/results/stream[1-7]/timing_intervals
Run 2 run1results.zip
32/power_test_report.txt 32/results/rf1/setnum*_output 32/results/rf1/times* 32/results/rf2/setnum*_output 32/results/rf2/times* 32/stream0/q*.output 32/stream0/timing_intervals 33/tput_test_report.txt 33/results/rf1/setnum*_output 33/results/rf1/times* 33/results/rf2/setnum*_output 33/results/rf2/times* 33/results/stream[1-7] /q*.output 33/results/stream[1-7]/timing_intervals
Clause 6 implementation scripts benchmark_scripts.zip scripts/performance_test.sh scripts/power_test.sh scripts/tput_test.sh
Clause 7 n/a n/a N/a
Clause 8
Query substitution parameters
benchmark_scripts.zip 32/queries/stream0/q*_param 33/queries/stream*/q*_param
RF function source code benchmark_scripts.zip scripts/*rf*
TPC-H Executive Summary
© 2012 Dell Inc. All rights reserved
Auditors’ Information and Attestation Letter
The auditor’s agency name, address, phone number, and Attestation letter with a brief audit
summary report indicating compliance must be included in the full disclosure report. A
statement should be included specifying who to contact in order to obtain further information
regarding the audit process.
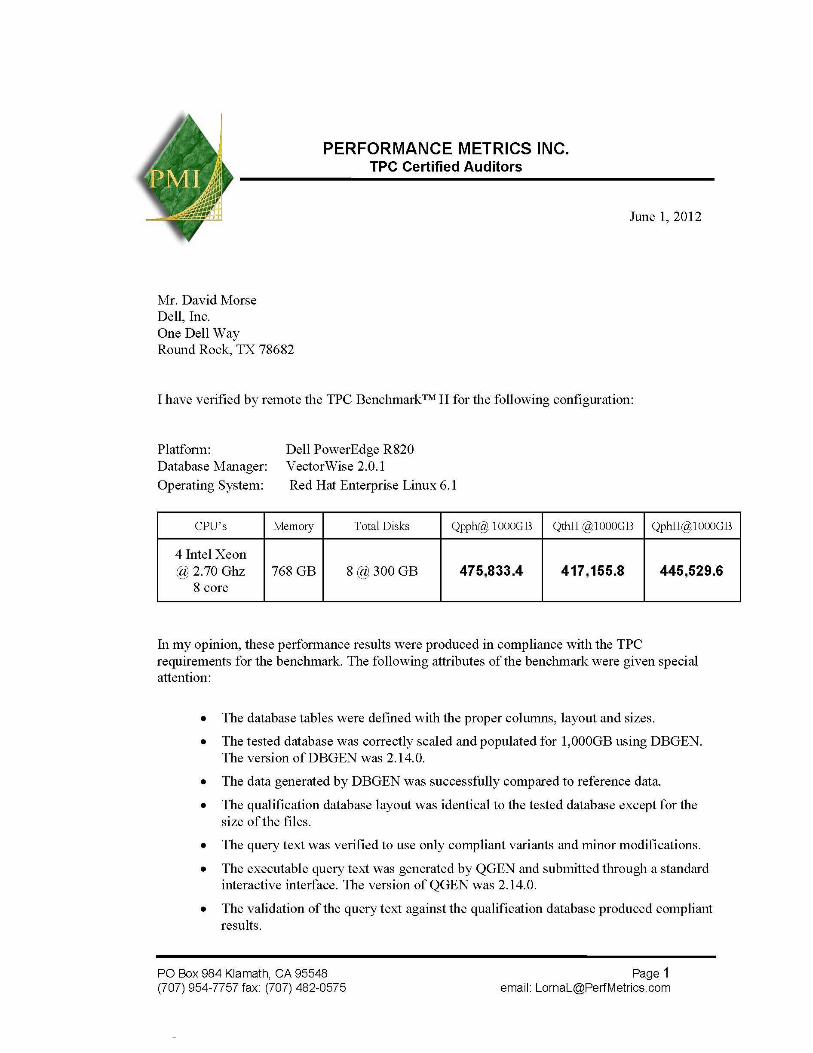
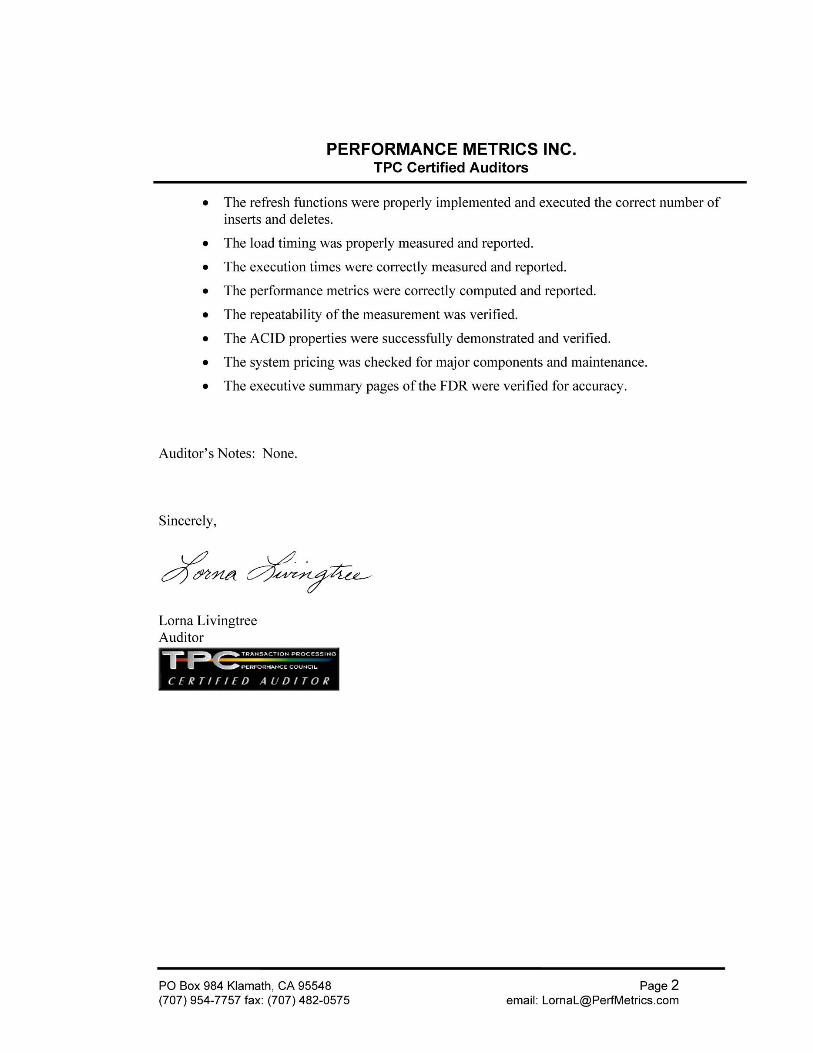
The auditor’s letter is included in the following section.
This benchmark was audited by:
Lorna Livingtree
Performance Metrics, Inc.
PO Box 984
Klamath, CA 95548
Phone: 707-954-7757
TPC-H Executive Summary
© 2012 Dell Inc. All rights reserved
TPC-H Executive Summary
© 2012 Dell Inc. All rights reserved

TPC-H Executive Summary
© 2012 Dell Inc. All rights reserved
Appendix A
TPC-H Executive Summary
© 2012 Dell Inc. All rights reserved
TPC-H Executive Summary
© 2012 Dell Inc. All rights reserved