Embed Size (px)
Citation preview

OFFICIAL NTP FILE COPY
National Cancer Institute
CARCINOGENESIS DO NOT REMOVE FROM THIS OFFICE Technical Report Series No. 101 1978
BIOASSAY OF
FORMULATED FENAMINOSULF FOR POSSIBLE CARCINOGENICITY
CAS No. 140-56-7
NCI-CG-TR-101
U.S. DEPARTMENT OF HEALTH, EDUCATION, AND WELFARE Public Health Service National Institutes of Health


BIOASSAY OF
FORMULATED FENAMINOSULF
FOR POSSIBLE CARCINOGENICITY
Carcinogenesis Testing Program Division of Cancer Cause and Prevention
National Cancer Institute National Institutes of Health
Bethesda, Maryland 20014
U.S. DEPARTMENT OF HEALTH, EDUCATION, AND WELFARE Public Health Service
National Institutes of Health
DHEW Publication No. (NIH) 78-1351


REPORT ON THE BIOASSAY OF FORMULATED FENAMINOSULF FOR POSSIBLE CARCINOGENICITY
CARCINOGENESIS TESTING PROGRAM DIVISION OF CANCER CAUSE AND PREVENTION
NATIONAL CANCER INSTITUTE, NATIONAL INSTITUTES OF HEALTH
FOREWORD: This report presents the results of the bioassay of formulated fenaminosulf conducted for the Carcinogenesis Testing Program, Division of Cancer Cause and Prevention, National Cancer Institute (NCI), National Institutes of Health, Bethesda, Maryland. This is one of a series of experiments designed to determine whether selected chemicals have the capacity to produce cancer in animals. Negative results, in which the test animals do not have a significantly greater incidence of cancer than control animals, do not necessarily mean the test chemical is not a carcinogen because the experiments are conducted under a limited set of circumstances. Positive results demonstrate that the test chemical is carcinogenic for animals under the conditions of the test and indicate a potential risk to man. The actual determination of the risk to man from animal carcinogens requires a wider analysis.
CONTRIBUTORS: This bioassay of formulated fenaminosulf was conducted by Mason Research Institute, Worcester, Massachusetts, initially under direct contract to the NCI and currently under a subcontract to Tracor Jitco, Inc., prime contractor for the NCI Carcinogenesis Testing Program.
The experimental design was determined by the NCI Project Officers, Dr. J. H. Weisburger (1,2) and Dr. E. K. Weisburger (1). The principal investigators for the contract were Dr. E. Smith (3) and Dr. A. Handler (3). Animal treatment and observation were supervised by Mr. G. Wade (3) and Ms. E. Zepp (3). Chemical analysis was performed by Midwest Research Institute (4) and the analytical results were reviewed by Dr. N. Zimmerman (5).
Histopathologic examinations were performed by Dr. A. S. Krishna Murthy (3) and Dr. D. S. Wyand (3) at the Mason Research Institute, and the diagnoses included in this report represent the interpretation of these pathologists. Histopathology findings and reports were reviewed by Dr. R. L. Schueler (6).
Compilation of individual animal survival, pathology, and summary tables was performed by EG&G Mason Research Institute (7); the statistical analysis was performed by Mr. W. W. Belew (5) and Dr. J. R. Joiner (6) using methods selected for the Carcinogenesis Testing Program by Dr. J. J. Gart (8).
iii

This report was prepared at METREK, a Division of The MITRE Corporation (5) under the direction of the NCI. Those responsible for this report at METREK are the project coordinator, Dr. L. W. Thomas (5), task leader Dr. M. R. Kornreich (5), senior biologist Ms. P. Walker (5), biochemist Mr. S. C. Drill (5), and technical editor Ms. P. A. Miller (5). The final report was reviewed by members of the participating organizations.
The following other scientists at the National Cancer Institute were responsible for evaluating the bioassay experiment, interpreting the results, and reporting the findings: Dr. K. C. Chu (1), Dr. C. Cueto, Jr. (1), Dr. J. F. Douglas (1), Dr. D. G. Goodman (1), Dr. R. A. Griesemer (1), Dr. H. A. Milman (1), Dr. T. W. Orme (1), Dr. R. A. Squire (1,9), Dr. J. M. Ward (1), and Dr. C. E. Whitmire (1).
1. Carcinogenesis Testing Program, Division of Cancer Cause and Prevention, National Cancer Institute, National Institutes of Health, Bethesda, Maryland.
2. Now with the Naylor Dana Institute for Disease Prevention, American Health Foundation, Hammon House Road, Valhalla, New York.
3. Mason Research Institute, 57 Union Street, Worcester, Massachusetts.
4. Midwest Research Institute, 425 Volker Boulevard, Kansas City, Missouri.
5. The MITRE Corporation, METREK Division, 1820 Dolley Madison Boulevard, McLean, Virginia.
6. Tracer Jitco, Inc., 1776 East Jefferson Street, Rockville, Maryland.
7. EG&G Mason Research Institute, 1530 East Jefferson Street, Rockville, Maryland.
8. Mathematical Statistics and Applied Mathematics Section, Biometry Branch, Field Studies and Statistics Program, Division of Cancer Cause and Prevention, National Cancer Institute, National Institutes of Health, Bethesda, Maryland.
9. Now with the Division of Comparative Medicine, Johns Hopkins University, School of Medicine, Traylor Building, Baltimore, Maryland.
IV

SUMMARY
A bioassay of formulated fenaminosulf for possible carcinogenicity was conducted using Fischer 344 rats and B6C3F1 mice. Fenaminosulf was administered in the feed, at either of two concentrations, to groups of 50 male and 50 female animals of each species. The time-weighted average high and low dietary concentrations of fenaminosulf were, respectively, 0.10 and 0.05 percent for rats, 0.19 and 0.10 percent for male mice, and 0.10 and 0.05 percent for female mice. After a 78-week period of compound administration, observation of the rats continued for up to an additional 31 weeks and observation of the mice continued for up to an additional 19 weeks.
Fifty male mice and 50 rats of each sex were placed on test as controls and fed only the basal diet. For female mice, 50 animals served as controls for the high dose group and 50 as controls for the low dose group.
For female rats there was no significant association between fenaminosulf dosage and mortality and, if the 21 male rats that died in the first two weeks of the bioassay were excluded from consideration, the same was true for male rats.. For both male and female mice there was a significant positive association between dosage and mortality. In all groups of both species, however, adequate numbers of animals survived sufficiently long to be at risk from late-developing tumors.
No convincing, statistically significant positive associations were demonstrated between chemical administration and the incidence of neoplasms in either sex of either species. An increased incidence of necrosis and mineralization of the tubular cells of the renal papilla occurred in treated rats and mice. These nonneoplastic lesions were not present in control animals of either species.
Under the conditions of this bioassay, dietary administration of formulated fenaminosulf was not carcinogenic in either Fischer 344 rats or B6C3F1 mice.

TABLE OF CONTENTS
Page
I. INTRODUCTION 1
II. MATERIALS AND METHODS 3
A. Chemicals 3B. Dietary Preparation 3C. Animals 4D. Animal Maintenance 4E. Selection of Initial Concentrations 8F. Experimental Design 9G. Clinical and Histopathologic Examinations 13 H. Data Recording and Statistical Analyses 15
III. CHRONIC TESTING RESULTS: RATS 20
A. Body Weights and Clinical Observations 20 B. Survival 20 C. Pathology 23 D. Statistical Analyses of Results 25
IV. CHRONIC TESTING RESULTS: MICE 33
A. Body Weights and Clinical Observations 33 B. Survival 33 C. Pathology 36 D. Statistical Analyses of Results 37
V. DISCUSSION 44
VI. BIBLIOGRAPHY 47
APPENDIX A SUMMARY OF THE INCIDENCE OF NEOPLASMS IN RATS TREATED WITH FENAMINOSULF A-l
APPENDIX B SUMMARY OF THE INCIDENCE OF NEOPLASMS IN MICE TREATED WITH FENAMINOSULF B-l
APPENDIX C SUMMARY OF THE INCIDENCE OF NONNEOPLASTIC LESIONS IN RATS TREATED WITH FENAMINOSULF C-l
APPENDIX D SUMMARY OF THE INCIDENCE OF NONNEOPLASTIC LESIONS IN MICE TREATED WITH FENAMINOSULF D-l
VII

LIST OF ILLUSTRATIONS
Figure Number
1
Table Number
Al
Page
GROWTH CURVES FOR FENAMINOSULF CHRONIC STUDY RATS 21
SURVIVAL COMPARISONS OF FENAMINOSULF CHRONIC STUDY RATS 22
GROWTH CURVES FOR FENAMINOSULF CHRONIC STUDY MICE 34
SURVIVAL COMPARISONS OF FENAMINOSULF CHRONIC STUDY MICE 35
LIST OF TABLES
Page
DESIGN SUMMARY FOR FISCHER 344 RATS—FENAMINOSULF FEEDING EXPERIMENT 10
DESIGN SUMMARY FOR B6C3F1 MICE—FENAMINOSULF FEEDING EXPERIMENT 11
ANALYSES OF THE INCIDENCE OF PRIMARY TUMORS AT SPECIFIC SITES IN MALE RATS TREATED WITH FENAMINOSULF SURVIVING AT LEAST 52 WEEKS 26
ANALYSES OF THE INCIDENCE OF PRIMARY TUMORS AT SPECIFIC SITES IN FEMALE RATS TREATED WITH FENAMINOSULF 29
ANALYSES OF THE INCIDENCE OF PRIMARY TUMORS AT SPECIFIC SITES IN MALE MICE TREATED WITH FENAMINOSULF SURVIVING AT LEAST 52 WEEKS 38
ANALYSES OF THE INCIDENCE OF PRIMARY TUMORS AT SPECIFIC SITES IN FEMALE MICE TREATED WITH FENAMINOSULF SURVIVING AT LEAST 52 WEEKS 40
SUMMARY OF THE INCIDENCE OF NEOPLASMS IN MALE RATS TREATED WITH FENAMINOSULF A-3
Vlll

LIST OF TABLES (Concluded)
Table Number
A2 SUMMARY OF THE INCIDENCE OF NEOPLASMS IN FEMALE RATS TREATED WITH FENAMINOSULF A-7
Bl SUMMARY OF THE INCIDENCE OF NEOPLASMS IN MALE MICE TREATED WITH FENAMINOSULF B-3
B2 SUMMARY OF THE INCIDENCE OF NEOPLASMS IN FEMALE MICE TREATED WITH FENAMINOSULF B-6
Cl SUMMARY OF THE INCIDENCE OF NONNEOPLASTIC LESIONS IN MALE RATS TREATED WITH FENAMINOSULF C-3
C2 SUMMARY OF THE INCIDENCE OF NONNEOPLASTIC LESIONS IN FEMALE RATS TREATED WITH FENAMINOSULF C-7
Dl SUMMARY OF THE INCIDENCE OF NONNEOPLASTIC LESIONS IN MALE MICE TREATED WITH FENAMINOSULF D-3
D2 SUMMARY OF THE INCIDENCE OF NONNEOPLASTIC LESIONS IN FEMALE MICE TREATED WITH FENAMINOSULF D-7
ix


I. INTRODUCTION
Fenaminosulf (NCI No. C03010), an aromatic diazo compound used
exclusively as a fungicide, was selected for bioassay by the National
Cancer Institute because of conflicting reports concerning its ability
to induce hepatomas in rats (Herrmann and DuBois, 1949; Miller et al.,
1957). The structural similarity of fenaminosulf to the carcinogenic
aminoazo dyes, such as dlmethylaminoazobenzene (Terayama, 1967) was an
additional factor in its selection for testing.
The Chemical Abstracts Service (CAS) Ninth Collective Index
(1977) name for this compound is sodium 4-(dimethylamino)phenol diaze
*nesulfonate. It is also known as p-dimethylaminobenzenediazo sodium
(8) sulfonate; sodium 4-dimethylaminobenzenediazosulfonate; DAS; Dexon ;
diazoben; and Bayer 22555.
Fenaminosulf is registered by the U.S. Environmental Protection
Agency as a seed-treatment fungicide for beans, beets, corn, cotton,
cucumbers, peas, sorghum, spinach, and sugar beets; and as the active
ingredient in commercial fungicides for use on avocados, ornamentals,
sugarcane, lawns, and turf (Carter et al., 1973; as cited in Interna
tional Agency for Research on Cancer, 1975).
Specific production figures for fenaminosulf are not available;
however, the inclusion of this compound in the 1977 Directory of Chem
ical Producers, U.S.A. (Stanford Research Institute, 1977) implies an
*The CAS registry number is 140-56-7,

annual commercial production in excess of 1000 pounds or $1000 in
value.
The potential for exposure to fenaminosulf is greatest for agri
cultural workers, although workers in fenaminosulf production facil
ities may also be exposed. The general population may be exposed via
dermal contact to fenaminosulf on packaged seeds, in lawn and garden
fungicides, and to residues in soils and turf. Ingestion is unlikely
since fenaminosulf is apparently not sprayed directly on food crops.
Persistence may not be a major problem because fenaminosulf is labile
in the environment (Farm Chemicals Handbook, 1976).

II. MATERIALS AND METHODS
A. Chemicals
A fenaminosulf formulation manufactured by Chemagro Corporation
(Kansas City, Missouri) under the trade name Dexon was purchased by
the NCI for Mason Research Institute. Chemical analysis was performed
by Midwest Research Institute, Kansas City, Missouri. The composition
of this formulation was estimated by the manufacturer to contain 35
percent fenaminosulf, 41 percent Kaolin clay, 12 percent synthetic
silica, 5 percent sodium naphthalene sulfonate, and 6 percent sodium
ligno-sulfate.
The results of elemental analysis .were consistent with those
which would be expected from this formulation. Direct current polar
ography indicated that the formulation was 30 to 35 percent pure fen
aminosulf.
Throughout this report the term fenaminosulf is used to represent
this mixture.
B. Dietary Preparation
The basal laboratory diet for both treated and control animals
(5) consisted of Wayne Lab-Blox (Allied Mills, Inc., Chicago, Illinois).
Fenaminosulf was administered to the treated animals as a component
of the diet. The chemical was hand-mixed with an aliquot of the
ground feed until visual uniformity was attained. This premix was
then placed into a 6 kg capacity Patterson-Kelley twin-shell stain
less steel V-blender along with the remainder of the feed and blended

for 20 minutes. Prepared diets were placed in double plastic bags
and stored in the dark at 4°C. Mixtures were prepared weekly and
stored for not longer than 2 weeks.
C. Animals
Two animal species, rats and mice, were used in the carcino
genicity bioassay. Fischer 344 rats and B6C3F1 mice were obtained
through contracts of the Division of Cancer Treatment, National Can
cer Institute. The animals were received in several separate ship
ments from Charles River Breeding Laboratories, Inc., Wilmington,
Massachusetts. All male mice to be assigned to treated groups and
the female mice to be assigned to the high dose group were received
approximately 5 weeks before the mice to be used as controls for
these groups. Low dose female mice were received 3 months after the
first shipment and the controls for this group were received 1 week
later. Rats to be utilized for the high dose and control groups were
received 12 weeks before the low dose rats.
Upon arrival, a sample of animals was examined for parasites and
other signs of disease. The remaining animals were quarantined by
species for 2 weeks prior to initiation of the test. Animals were
assigned to groups and distributed among cages so that the average
body weight per cage was approximately equal for a given sex and spe
cies .
D. Animal Maintenance
All animals were housed by species in rooms having a temperature
range of 23° to 34°C. Incoming air was filtered through Tri-Dek®
4

(R) 15/40 denier Dacron filters (Tri-Dim Filter Corp., Hawthorne, New
Jersey) providing six changes of room air per hour. Fluorescent
lighting was provided on a 12-hour-daily cycle.
Rats were housed five per cage by sex. During quarantine and for
the first 16 months of study, high dose and control rats were housed
in galvanized-steel wire-mesh cages suspended above newspapers. Low
dose rats were housed in galvanized wire-mesh cages during quarantine
and for the first 14 months of study. Newspapers under cages were re
placed daily and cages and racks washed weekly. For the remainder of
the study, rats were housed in suspended polycarbonate cages equipped
with disposable nonwoven fiber filter sheets. Clean bedding and cages
®were provided twice weekly. Corncob bedding (SAN-I-CEL , Paxton Pro
cessing Company, Paxton, Illinois) was used for the first 7 months
that high dose and control rats were housed in polycarbonate cages and
for the first 6 months that low dose rats were housed in polycarbonate
cages. For the remainder of the study Aspen hardwood chip bedding
(American Excelsior Company, Baltimore, Maryland) was provided in rat
cages. Stainless steel cage racks were cleaned once every two weeks,
and disposable filters were replaced at that time.
Mice were housed by sex in polycarbonate shoe box type cages
fitted with perforated stainless steel lids (Lab Products, Inc.,
Garfield, New Jersey) and nonwoven fiber filter bonnets. All mice
were housed ten per cage for the first part of the study. Low dose

treated and control females, treated males and high dose females, and
control males and high dose control females were reduced to five per
cage after 11, 14, and 13 months, respectively. Cages, lids, filters,
and bedding were provided three times per week when the number of mice
per cage was ten and twice per week when cage populations were five.
.®Ab-sorb-dn hardwood chip bedding (Wilner Wood Products Company,
Norway, Maine) was used for 2 months (control males and high dose
control females) and 3 months (treated males and high dose females).
(R) Subsequently, SAN-I-CEL was used for the next 12 months for these
groups and for the first 12 months for low dose treated and control
(R) females. A second corncob bedding (Bed-o-Cobs , The Andersons Cob
Division, Maumee, Ohio) was used for the next 8 months. Aspen
bedding was then provided for the remainder of the study. Reusable
filter bonnets and pipe racks were sanitized every 2 weeks throughout
the study.
Water was available ad libitum for both species from 250 ml wa
ter bottles equipped with rubber stoppers and stainless steel sipper
tubes. Bottles were replaced twice weekly and, for rats only, re
filled as needed between changes.
®Wayne Lab-Blox was supplied ad libitum throughout the entire
test. Pelleted Wayne Lab-Blox was supplied to treated and control
male mice and high dose treated and control female mice during the
final observation period. During the quarantine and dosing periods,
(R) all animals received Wayne Lab-Blox® meal. Alpine aluminum feed

cups (Curtin Matheson Scientific, Inc., Woburn, Massachusetts)
containing stainless steel baffles were used to distribute powdered
feed until the last 5 months of the study for rats, all control male
mice, and high dose control female mice. This same apparatus was
used until the last 4 months of the study for treated male mice and
high dose female mice, and until the last 7 months of the study for
low dose treated and control female mice. After these periods stain
less steel gangstyle food hoppers (Scientific Cages, Inc., Bryan,
Texas) were utilized.
During the final observation period, treated and control male
mice and high dose female mice were fed pellets from a wire bar hop
per incorporated into the cage lid, low dose treated and control fe
males were fed meal from gangstyle hoppers, and rats were fed pellets
on the cage floor. Food hoppers were changed on the same schedule as
®were cages. Food was replenished daily in Alpine feed cups.
Treated and control rats were housed with rats being intubated
with m-cresidine (102-50-1); and with other rats receiving diets
containing 2,5-dithiobiurea (142-46-1) and cupferron (135-20-6).
All treated male mice, high dose treated female mice, and low
dose control female mice were housed with other mice receiving diets
containing 2-methyl-l-nitroanthraquinone (129-15-7); acetylamino
fluorene (53-96-3); p-cresidine (120-71-8); and 4-chloro-m-phenylene
diamine (5131-60-2). Low dose treated female mice, high dose control
*CAS registry numbers are given in parentheses.

male mice, low dose control male mice, and high dose control female
mice were housed with other mice receiving diets containing cupferron
(135-20-6); 2,5-dithiobiurea (142-46-1); 4-chloro-o-phenylenediamine
(95-83-0); o-anisidine hydrochloride (134-29-0); and p-anisidine
hydrochloride (20265-97-8).
E. Selection of Initial Concentrations
In order to establish the maximum tolerated concentrations of
fenaminosulf for administration to treated animals in the chronic
studies, Subchronic toxicity tests were conducted with both rats and
mice. Animals of each species were distributed among five groups,
each consisting of five males and five females. Fenaminosulf was
incorporated into the basal laboratory diet and supplied ad libitum
to four of the five rat groups and four of the five mouse groups in
concentrations of 0.008, 0.015, 0.030, and 0.060 percent. The fifth
group of each species served as a control group, receiving only the
basal laboratory diet. The dosed dietary preparations were admin
istered for a period of 7 weeks, followed by a 1-week observation
period during which all animals were fed the untreated basal diet.
The highest concentration causing no deaths, no compound-related
gross abnormalities, and no mean body weight depression in excess of
30 percent relative to controls was selected as the high concentration
utilized for the rat and mouse chronic bioassays.
No deaths or gross abnormalities were observed in male or female
rats treated with fenaminosulf. Mean body weight depression was

approximately 28 and 8 percent, respectively, in male and female rats
receiving a dietary concentration of 0.060 percent. The initial high
dose selected for use in the rat chronic bioassay was 0.10 percent
for both sexes.
One of the five male and one of the five female mice receiving
dietary concentrations of 0.060 percent fenaminosulf died. No mean
body weight depression was observed among male mice. There was,
however, slight spleen enlargement in all males treated with 0.060
percent. Mean body weight depression was approximately 14 percent
in female mice treated with 0.060 percent. The initial high doses
selected for use in the mouse chronic bioassay were 0.20 and 0.10
percent for males and females, respectively.
F. Experimental Design
The experimental design parameters for the chronic study (spe
cies, sex, group size, actual concentrations administered, duration
of treated and untreated observation periods, and the time-weighted
average concentrations) are summarized in Tables 1 and 2.
The rat groups receiving an initial concentration of 0.20 per
cent had a lower time-weighted average dose at the end of the study,
than the rat groups receiving an initial concentration of 0.10 per
cent, and thus will be referred to as the low dose groups throughout
this report, while the latter groups will be referred to as the high
dose groups. At the time of inclusion in the study, high dose and
control male and female rats were approximately 6 weeks old. Low

TABLE 1
DESIGN SUMMARY FOR FISCHER 344 RATS FENAMINOSULF FEEDING EXPERIMENT
INITIAL OBSERVATION PERIOD GROUP FENAMINOSULF TREATED UNTREATED SIZE CONCENTRATION a (WEEKS) (WEEKS)
MALE
CONTROL 50 0 0 110
LOW DOSEC 50 0.20 10.05 77 0 27
HIGH DOSE° 50 0.10 10.05 60.10 71 0 31
FEMALE
CONTROL 50 0 0 110
LOW DOSEC 50 0.20 10.05 77 0 27
HIGH DOSE° 50 0.10 10.05 60.10 71 0 31
a~Concentrations given in percentages in feed.
b 2 (concentration X
TIME-WEIGHTED AVERAGE
CONCENTRATION
0
0.05
0.10
0
0.05
0.10
weeks received)
Group designations were determined by time-weighted average concentrations,
10

TABLE 2
DESIGN SUMMARY FOR B6C3F1 MICE FENAMINOSULF FEEDING EXPERIMENT
INITIAL OBSERVATION PERIOD TIME -WEIGHTED GROUP FENAMINOSULF TREATED UNTREATED AVERAGE SIZE CONCENTRATION3 (WEEKS) (WEEKS) CONCENTRATION
MALE
CONTROL 50 0 0 97 0
LOW DOSE 50 0.10 1 0.10 0.05 60.10 71 0 17
HIGH DOSE 50 0.20 1 0.19 0.10 60.20 71 0 17
FEMALE
LOW DOSE CONTROL 50 0 0 97 0
HIGH DOSE CONTROL 50 0 0 98 0
LOW DOSEC 50 0.20 1 0.05 0.05 77 0 19
HIGH DOSE° 49 0.10 1 0.10 0.05 60.10 71 0 17
a-, . . .Concentrations given in percentages in feed,
^(concentration X weeks received) 2) (weeks receiving chemical)
Group designations were determined by time-weighted average concentrations,
11
c

dose male and female rats were also approximately 6 weeks old; how
ever, they were started on test 12 weeks later than the other groups.
The high and low concentrations utilized for both sexes for the first
week were 0.20 and 0.10 percent. The dietary concentrations of fena
minosulf for all treated rats were reduced to 0.05 percent in week 2
and in week 8 the concentration administered to the high dose male
and female rats was increased to 0.10 percent. These concentrations
were maintained for the remainder of the fenaminosulf administration
period. Subsequent to chemical exposure was an untreated observation
period of up to 31 weeks.
As the female mouse group receiving an initial concentration of
0.20 percent had the lower time-weighted average dose at the end of
the bioassay, this female mouse group will be referred as the low
dose group throughout this report; the female mouse group receiving
an initial concentration of 0.10 percent, on the other hand, will be
referred to as the high dose group. For males the initial concentra
tions utilized were 0.20 and 0.10 percent and the males receiving the
former concentration will be referred to as the high dose group while
those receiving the latter will be referred to as the low dose group.
At the time of inclusion in the study all mice were approximately 6
to 7 weeks old. High and low dose males and high dose females were
approximately 5 weeks older than their controls. The low dose fe
males were 12 weeks younger than the other treated mice and the low
dose control females were 1 week younger than the low dose treated
12

females. The high and low dose male mice received initial dietary
concentrations of 0.20 and 0.10 percent, respectively. After 1 week
the concentrations were decreased to 0.10 and 0.05 percent for high
and low dose male mice, respectively. Six weeks later concentrations
were increased to original levels and these were maintained for the
remainder of the fenaminosulf administration period. Subsequently,
the male mice were observed for an untreated period of up to 17 weeks.
The high and low dose females received initial dietary concentrations
of 0.10 and 0.20 percent, respectively. After 1 week the concentra
tion administered to both groups was decreased to 0.05 percent. Six
weeks later the concentration administered to the high dose groups
was increased to 0.10 percent. These concentrations were maintained
for the remainder of the fenaminosulf administration period. An
untreated observation period of up to 19 weeks followed.
G. Clinical and Histopathologic Examinations
Animals were weighed immediately prior to initiation of the
experiment. Body weights were recorded twice weekly for the first
12 weeks of the study and at monthly intervals thereafter. From
the first day, all animals were inspected twice daily for mortality.
Food consumption, for two cages from each group, was monitored for
seven consecutive days once a month for the first nine months of the
bioassay and for three consecutive days each month thereafter. The
presence of tissue masses and lesions was determined by monthly
observation and palpation of each animal.
13

A necropsy was performed on each animal regardless of whether it
died, was killed when moribund, or was sacrificed at the end of the
bioassay. The animals were euthanized by carbon dioxide inhalation,
and were immediately necropsied. The histopathologic examination con
sisted of gross and microscopic examination of major tissues, organs,
and gross lesions taken from sacrificed animals and, whenever possible,
from animals found dead.
Tissues were preserved in 10 percent buffered formalin, embedded
in paraffin, sectioned, and stained with hematoxylin and eosin prior
to microscopic examination. An occasional section was subjected to
special staining techniques for more definitive diagnosis.
Slides were prepared from the following tissues: skin, subcuta
neous tissue, lungs and bronchi, trachea, bone marrow, spleen, lymph
nodes, thymus, heart, salivary gland, liver, gallbladder (mice), pan
creas, esophagus, stomach, small intestine, large intestine, kidney,
urinary bladder, pituitary, adrenal, thyroid, parathyroid, testis,
prostate, brain, uterus, mammary gland, and ovary.
A few tissues were not examined for some animals, particularly
for those that died early. Also, some animals were missing, canni
balized, or judged to be in such an advanced state of autolysis as
to preclude histopathologic interpretation. Thus, the number of ani
mals for which particular organs, tissues, or lesions were examined
microscopically varies and does not necessarily represent the number
of animals that were placed on experiment in each group.
14
H. Data Recording and Statistical Analyses
Pertinent data on this experiment have been recorded in an auto
matic data processing system, the Carcinogenesis Bioassay Data System
(Linhart et al., 1974). The data elements include descriptive infor
mation on the chemicals, animals, experimental design, clinical ob
servations, survival, body weight, and individual pathologic results,
as recommended by the International Union Against Cancer (Berenblum,
1969). Data tables were generated for verification of data transcrip
tion and for statistical review.
These data were analyzed using the statistical techniques de
scribed in this section. Those analyses of the experimental results
that bear on the possibility of carcinogenicity are discussed in the
statistical narrative sections.
Probabilities of survival were estimated by the product-limit
procedure of Kaplan and Meier (1958) and are presented in this report
in the form of graphs. Animals were statistically censored as of the
time that they died of other than natural causes or were found to be
missing; animals dying from natural causes were not statistically
censored. Statistical analyses for a possible dose-related effect
on survival used the method of Cox (1972) when testing two groups for
equality and used Tarone's (1975) extensions of Cox's methods when
testing a dose-related trend. One-tailed P-values have been reported
for all tests except the departure from linearity test, which is only
reported when its two-tailed P-value is less than 0.05.
15
The incidence of neoplastic or nonneoplastic lesions has been
given as the ratio of the number of animals bearing such lesions at a
specific anatomic site (numerator) to the number of animals in which
that site was examined (denominator). In most instances, the denomi
nators included only those animals for which that site was examined
histologically. However, when macroscopic examination was required
to detect lesions prior to histologic sampling (e.g., skin or mammary
tumors), or when lesions could have appeared at multiple sites (e.g.,
lymphomas), the denominators consist of the numbers of animals necrop
sied.
The purpose of the statistical analyses of tumor incidence is to
determine whether animals receiving the test chemical developed a sig
nificantly higher proportion of tumors than did the control animals.
As a part of these analyses, the one-tailed Fisher exact test (Cox,
1970, pp. 48-52) was used to compare the tumor incidence of a control
group to that of a group of treated animals at each dose level. When
results for a number of treated groups, k, are compared simultaneously
with those for a control group, a correction to ensure an overall
significance level of 0.05 may be made. The Bonferroni inequality
(Miller, 1966, pp. 6-10) requires that the P-value for any comparison
be less than or equal to 0.05/k. In cases where this correction was
used, it is discussed in the narrative section. It is not, however,
presented in the tables, where the Fisher exact P-values are shown.
16

The Cochran-Armitage test for linear trend in proportions, with
continuity correction (Armitage, 1971, pp. 362-365), was also used
when appropriate. Under the assumption of a linear trend, this test
determined if the slope of the dose-response curve is different from
zero at the one-tailed 0.05 level of significance. Unless otherwise
noted, the direction of the significant trend was a positive dose re
lationship. This method also provides a two-tailed test of departure
from linear trend.
A time-adjusted analysis was applied when numerous early deaths
resulted from causes that were not associated with the formation of
tumors. In this analysis, deaths that occurred before the first
tumor was observed were excluded by basing the statistical tests on
animals that survived at least 52 weeks, unless a tumor was found at
the anatomic site of interest before week 52. When such an early
tumor was found, comparisons were based exclusively on animals that
survived at least as long as the animal in which the first tumor was
found. Once this reduced set of data was obtained, the standard pro
cedures for analyses of the incidence of tumors (Fisher exact tests,
Cochran-Armitage tests, etc.) were followed.
When appropriate, life-table methods were used to analyze the
incidence of tumors. Curves of the proportions surviving without an
observed tumor were computed as in Saffiotti et al. (1972). The week
during which animals died naturally or were sacrificed was entered as
the time point of tumor observation. Cox's methods of comparing
17
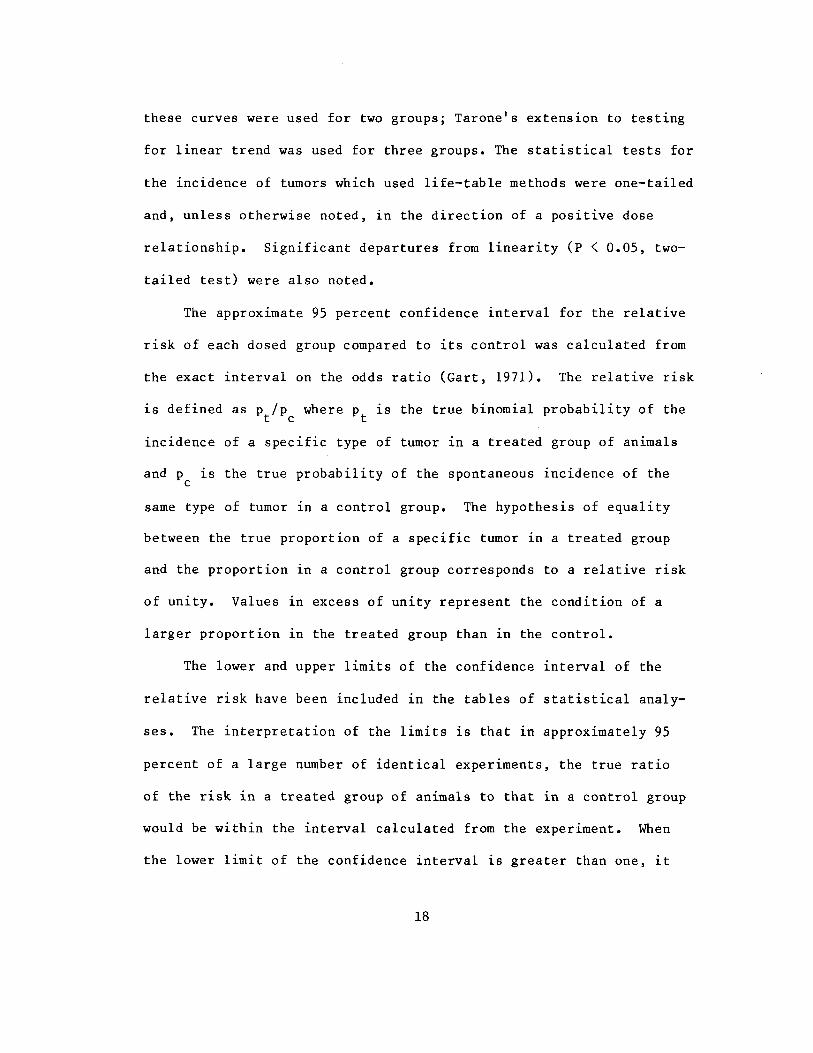
these curves were used for two groups; Tarone's extension to testing
for linear trend was used for three groups. The statistical tests for
the incidence of tumors which used life-table methods were one-tailed
and, unless otherwise noted, in the direction of a positive dose
relationship. Significant departures from linearity (P < 0.05, two-
tailed test) were also noted.
The approximate 95 percent confidence interval for the relative
risk of each dosed group compared to its control was calculated from
the exact interval on the odds ratio (Gart, 1971). The relative risk
is defined as p /p where p is the true binomial probability of the
incidence of a specific type of tumor in a treated group of animals
and p is the true probability of the spontaneous incidence of the c
same type of tumor in a control group. The hypothesis of equality
between the true proportion of a specific tumor in a treated group
and the proportion in a control group corresponds to a relative risk
of unity. Values in excess of unity represent the condition of a
larger proportion in the treated group than in the control.
The lower and upper limits of the confidence interval of the
relative risk have been included in the tables of statistical analy
ses. The interpretation of the limits is that in approximately 95
percent of a large number of identical experiments, the true ratio
of the risk in a treated group of animals to that in a control group
would be within the interval calculated from the experiment. When
the lower limit of the confidence interval is greater than one, it
18

can be inferred that a statistically significant result (a P < 0.025
one-tailed test when the control incidence is not zero, P < 0.050
when the control incidence is zero) has occurred. When the lower
limit is less than unity but the upper limit is greater than unity,
the lower limit indicates the absence of a significant result while
the upper limit indicates that there is a theoretical possibility
of the induction of tumors by the test chemical which could not be
detected under the conditions of this test.
19

III. CHRONIC TESTING RESULTS: RATS
A. Body Weights and Clinical Observations
No distinct mean body weight depression was associated with com
pound administration in either males or females (Figure 1). Although
the low dose male groups experienced high early mortality, the mean
body weight for this group was consistently higher than that for the
other male groups.
Two high dose females developed subcutaneous masses, one high
dose female had a cutaneous growth, and one control male developed a
crusted cutaneous lesion. One high dose female and one low dose male
exhibited discoloration of the eye and there was brown exudate from
the eyes of one low dose female.
B. Survival
The estimated probabilities of survival for male and female rats
in the control and fenaminosulf-dosed groups are shown in Figure 2.
Twenty-one of the original high dose male rats died in weeks 1
or 2 from toxic effects—at which point the dosage was lowered and
the original high dose group was renamed as the low dose group.
These 21 animals were excluded for test purposes; the Tarone test did
not indicate a positive association between dosage and mortality.
Five animals were sacrificed from the high dose treated group
and five from the control group in week 78. Adequate numbers of
males were at risk from late-developing tumors as 78 percent (39/50)
20

750 -750
CONTROL
MALE RATS LOW DOSE
600 — -600 HIGH DOSE
I- 450X o LU
g
§300CO
150
-450
-300
- 150
I \ 15 30 45 60 75 90 105 120
TIME ON TEST (WEEKS)
750 750
— 600
^450
-300
-150
15 120
TIME ON TEST (WEEKS)
FIGURE 1 GROWTH CURVES FOR FENAMINOSULF CHRONIC STUDY RATS
21

PR
OB
AB
ILIT
Y O
F S
UR
VIV
AL
P
RO
BA
BIL
ITY
OF
SU
RV
IVA
L o
p
op
b
bo
•fe
b>
bo
I
i I
i I
i I
•3}
O
o
o
g
i
V) O
m
m5=
O
z > c
?
3D
5 m
Z
N>
8
-8
S
m
m
m
m
A
o
CO
30
O
O
I
D
>
r~
m
a-30
>
II
II
T
I O
o
Po
o
P
o
O)
b
b>
high dose, 58 percent (29/50) low dose, and 64 percent (32/50) control
rats survived on test until the termination of the study.
For female rats, the Tarone test for association between dosage
and mortality was not significant. Five animals were sacrificed
from the high dose and five from the control group in week 78. With
78 percent (39/50) high dose, 82 percent (41/50) low dose and 72 per
cent (36/50) control rats alive on test until the end of the study,
adequate numbers of females were at risk from late-developing tumors.
C. Pathology
Histopathologic findings on neoplasms in rats are summarized in
Appendix A (Tables Al and A2); findings on nonneoplastic lesions are
summarized in Appendix C (Tables Cl and C2).
A variety of neoplasms was observed with approximately equal fre
quency in the treated and control rats. The most frequently observed
neoplasms in the male rats were interstitial-cell adenomas of the tes
tis. In the female rats, the most commonly observed neoplasms were
adenomas of the pituitary gland, fibroadenomas of the mammary gland,
and endometrial stromal polyps of the uterus. A high spontaneous
incidence of these tumors is characteristic of aged Fischer 344 rats.
A neoplasm which was observed in the treated female rats was endome
trial stromal sarcoma. This neoplasm was seen in 3/48 (6 percent)
low dose females and 1/47 (2 percent) high dose females but in none
of the control females.
23

There were instances in this study, as noted in the summary
tables, where neoplasms occurred only in treated animals, or with
increased frequency when compared to the control animals. The nature
and incidence of these lesions were similar to those known to occur
spontaneously in aged Fischer 344 rats.
A high incidence of necrosis and mineralization of the tubules of
the renal papilla was present in the treated rats. These lesions were
not observed in control rats. Mineralization of tubules was present
in 21/41 (51 percent) low dose and 32/48 (67 percent) high dose male
rats and 34/48 (71 percent) low dose and 12/49 (24 percent) high dose
female rats. The severity of the papillary necrosis and mineraliza
tion was quite variable and was superimposed on chronic renal disease
(nephrosis, nephropathy) commonly seen in aged Fischer 344 rats.
Several other nonneoplastic lesions commonly seen in aged Fischer 344
rats were observed with approximately equal frequency in the treated
and control animals.
Under the conditions of this study, the administration of fena
minosulf did not appear to induce neoplastic lesions in Fischer 344
rats. Although endometrial stromal sarcomas were present only in
treated female rats, the low incidence observed in this study does
not provide conclusive evidence that these neoplasms were induced by
the compound. The concentrations of the compound administered did
have a toxic effect on the kidney, producing tubular necrosis and
mineralization of the renal papilla.
24
D. Statistical Analyses of Results
The results of the statistical analyses of tumor incidence in
rats are summarized in Tables 3 and 4. The analysis is included for
every type of malignant tumor in either sex where at least two such
tumors were observed in at least one of the control or fenaminosulf
dosed groups and where such tumors were observed in at least 5 percent
of the group. Because of high early mortality noted in rats of both
sexes, the analyses for males were based on those rats surviving at
least 52 weeks.
In male rats the Fisher exact test indicated a significantly
(P = 0.021) higher incidence of interstitial-cell tumors of the
testis in the low dose treated group than in the control. The high
dose comparison and the Cochran-Armitage test, however, were not
significant.
For both male and female rats the possibility of a negative
association between chemical administration and the incidence of
leukemia or of malignant lymphomas was observed. For females,
however, none of the Fisher exact tests were significant under the
Bonferroni criterion.
No other statistical tests for any site indicated a significant
association between compound administration and incidence. Based
upon these results there was no convincing statistical evidence of
the carcinogenicity of fenaminosulf in rats.
25

TABLE 3
ANALYSES OF THE INCIDENCE OF PRIMARY TUMORS AT SPECIFIC SITES IN MALE RATS TREATED WITH FENAMINOSULF
SURVIVING AT LEAST 52 WEEKSa
TOPOGRAPHY: MORPHOLOGY
Skin and Subcutaneous Tissue: Fibroma
P Values0
Relative Risk (Control) Lower Limit Upper Limit
Weeks to First Observed Tumor
Hematopoietic System: Leukemia or Malignant Lymphoma
P Values0
Relative Risk (Control) Lower Limit Upper Limit
Weeks to First Observed Tumor
Pituitary: Adenoma NOS, Chromophobe Adenoma, or Acidophil Adenoma"
P Values0
Relative Risk (Control) Lower Limit Upper Limit
CONTROL
2/50(0.04)
N.S.
86
10/50(0.20)
P = 0.002(N)
78
7/45(0.16)
N.S.
LOW DOSE
2/29(0.07)
N.S.
1.724 0.130 22.468
105
1/29(0.03)
P = 0.037(N)
0.172 0.004 1.109
105
7/26(0.27)
N.S.
1.731 0.577 5.029
HIGH DOSE
3/49(0.06)
N.S.
1.531 0.183 17.671
108
1/49(0.02)
P - 0.004(N)
0.102 0.002 0.675
108
9/42(0.21)
N.S.
1.378 0.502 3.955
78 Weeks to First Observed Tumor 78 105

TOPOGRAPHY: MORPHOLOGY
Adrenal: Pheochromocytoma
P Values0
Relative Risk (Control) Lower Limit Upper Limit
Weeks to First Observed Tumor
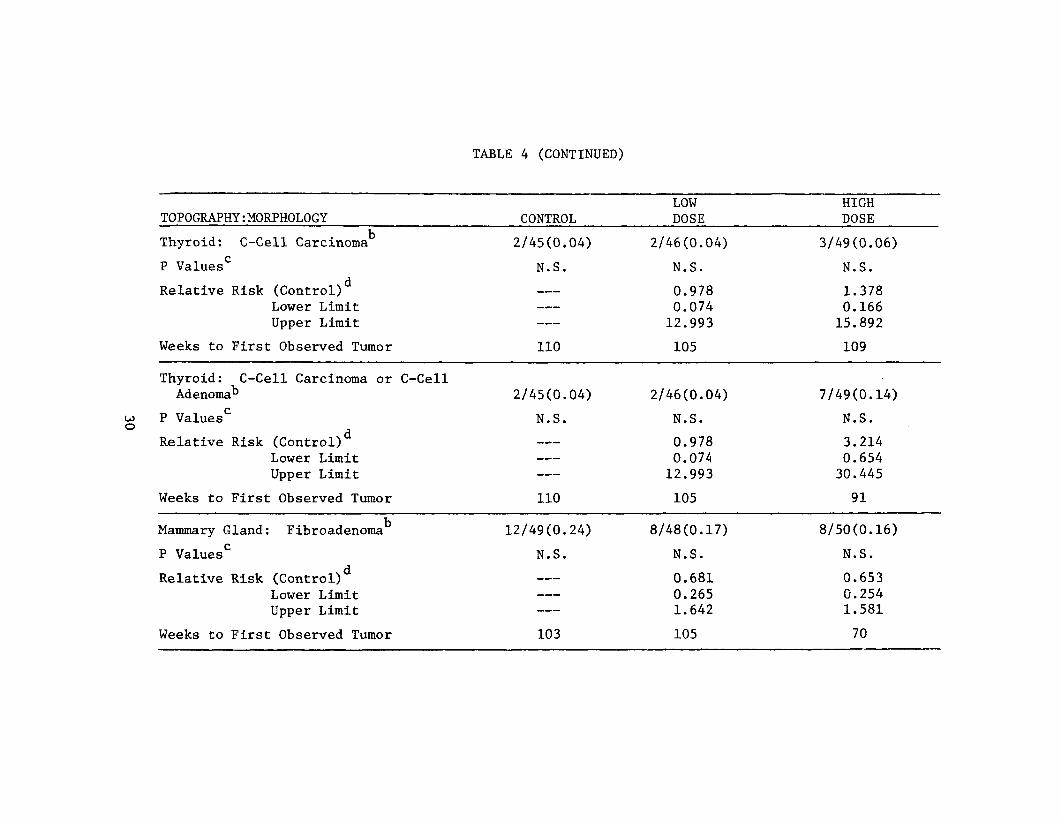
Thyroid: C-Cell Carcinoma
P Values0
Relative Risk (Control) Lower Limit Upper Limit
Weeks to First Observed Tumor
Thyroid: C-Cell Carcinoma or C-Cell Adenoma^
P Values0
Relative Risk (Control) Lower Limit Upper Limit
Weeks to First Observed Tumor
TABLE 3 (CONTINUED)
CONTROL
3/50(0.06)
N.S.
78
2/37(0.05)
N.S.
109
3/37(0.08)
N.S.
109
LOW DOSE
6/29(0.21)
N.S.
3.448 0.796 19.588
105
1/26(0.04)
N.S.
0.712 0.012 12.845
105
5/26(0.19)
N.S.
2.372 0.505 13.893
105
HIGH DOSE
3/47(0.06)
N.S.
1.064 0.149 7.571
103
2/44(0.05)
N.S.
0.841 0.064 11.135
108
3/44(0.07)
N.S.
0.841 0.120 5.944
108

TABLE 3 (CONCLUDED)
LOW HIGH TOPOGRAPHY: MORPHOLOGY CONTROL DOSE DOSE
Pancreatic Islets: Islet-Cell Carcinoma or Islet-Cell Adenoma"3 1/47(0.22) 3/29(0.10) 2/47(0.04)
P Values0 N.S. N.S. N.S. ___
Relative Risk (Control) 4.862 2.000 Lower Limit 0.411 0.108 Upper Limit 245.698 115.483
Weeks to First Observed Tumor 110 105 108
Testis: Interstitial-Cell Tumor 42/50(0.84) 29/29(1.00) 40/47(0.85)
00 P Values0 N.S. P = 0.021 N.S.
Departure from Linear Trend P = 0.025
Relative Risk (Control) Lower Limit Upper Limit
• 1.190 1.007 1.190
1.013 0.842 1.208
Weeks to First Observed Tumor 78 105 100
Treated groups received time-weighted average doses of 3.05 or 0.10 percent in feed.
Number of tumor-bearing animals/number of animals examined at site (proportion). c.The probability level for the Cochran-Armitage test is given beneath the incidence of tumors in the control group when P < 0.05; otherwise, not significant (N.S.) is indicated. The probability level for the Fisher exact test for the comparison of a treated group with the control group is given beneath the incidence of tumors in the treated group when P < 0.05; otherwise, not significant (N.S.) is indicated. For both Cochran-Armitage and Fisher exact tests a negative designation (N) indicates a lower incidence in the treated group(s) than in the control group.
The 95% confidence interval on the relative risk of the treated group to the control group. eThe probability level of the test for departure from linear trend is given beneath the control group when P < 0.05.

___
TABLE 4
ANALYSES OF THE INCIDENCE OF PRIMARY TUMORS AT SPECIFIC SITES IN FEMALE RATS TREATED WITH FENAMINOSULF*
TOPOGRAPHY: MORPHOLOGY
Hematopoietic System: Leukemia or Malignant Lymphoma
P Values0
Relative Risk (Control) Lower Limit Upper Limit
Weeks to First Observed Tumor to VO
Pituitary: Adenoma NOS, Chromophobe Adenoma, or Acidophil Adenoma"
P Values0
Relative Risk (Control) Lower Limit Upper Limit
Weeks to First Observed Tumor
Adrenal: Pheochromocytoma
P Values0
Relative Risk (Control) Lower Limit Upper Limit
Weeks to First Observed Tumor
CONTROL
7/49(0.14)
P - O.OIO(N)
96
17/39(0.44)
N.S.
78
3/49(0.06)
N.S.
110
LOW DOSE
1/48(0.02)
P = 0.032(N)
0.146 0.003 1.072
91
18/40(0.45)
N.S.
1.032 0.598 1.791
84
2/46(0.04)
N.S.
0.710 0.062 5.914
63
HIGH DOSE
1/50(0.02)
P = 0.028(N)
0.140 0.003 1.030
109
17/41(0.41)
N.S.
0.951 0.542 1.678
101
2/46(0.04)
N.S.
0.710 0.062 5.914
70
___
TOPOGRAPHY: MORPHOLOGY
Thyroid: C-Cell Carcinoma
P Values0
Relative Risk (Control) Lower Limit Upper Limit
Weeks to First Observed Tumor
Thyroid: C-Cell Carcinoma or C-Cell Adenoma"
P Values0
Relative Risk (Control) Lower Limit Upper Limit
Weeks to First Observed Tumor
Mammary Gland: Fibroadenoma
P Values0
Relative Risk (Control) Lower Limit Upper Limit
Weeks to First Observed Tumor
TABLE 4 (CONTINUED)
CONTROL
2/45(0.04)
N.S.
110
2/45(0.04)
N.S.
110
12/49(0.24)
N.S.
103
LOW DOSE
2/46(0.04)
N.S.
0.978 0.074 12.993
105
2/46(0.04)
N.S.
0.978 0.074 12.993
105
8/48(0.17)
N.S.
0.681 0.265 1.642
105
HIGH DOSE
3/49(0.06)
N.S.
1.378 0.166 15.892
109
7/49(0.14)
N.S.
3.214 0.654 30.445
91
8/50(0.16)
N.S.
0.653 0.254 1.581
70

TABLE 4 (CONCLUDED)
LOW HIGH TOPOGRAPHY: MORPHOLOGY CONTROL DOSE DOSE
Uterus: Endometrial Stromal Polyp 5/46(0.11) 7/48(0.15) 4/47(0.09)
P Values0 N.S. N.S. N.S.
Relative Risk (Control) Lower Limit Upper Limit
1.342 0.396 4.998
0.783 0.165 3.409
Weeks to First Observed Tumor 110 105 109
Uterus: Endometrial Stromal Sarcoma 0/46(0.00) 3/48(0.06) 1/47(0.02)
P Values0 N.S. N.S. N.S.
Relative Risk (Control) _— Infinite Infinite Lower Limit 0.578 0.053 Upper Limit Infinite Infinite
Weeks to First Observed Tumor 91 91
aTreated groups received time-weighted average doses of 0.05 or 0.10 percent in feed.
Number of tumor-bearing animals/number of animals examined at site (proportion). CThe probability level for the Cochran-Armitage test is given beneath the incidence of tumors in the control group when P < 0.05; otherwise, not significant (N.S.) is indicated. The probability level for the Fisher exact test for the comparison of a treated group with the control group is given beneath the incidence of tumors in the treated group when P < 0.05; otherwise, not significant (N.S.) is indicated. For both Cochran-Armitage and Fisher exact tests a negative designation (N) indicates a lower incidence in the treated group(s) than in the control group.
The 95% confidence interval on the relative risk of the treated group to the control group.

To provide additional insight into the possible carcinogenicity
of this compound, 95 percent confidence intervals on the relative
risk have been estimated and entered in the tables based upon the
observed tumor incidence rates. In many of the intervals shown in
Tables 3 and 4, the value one is included; this indicates the absence
of statistically significant results. It should also be noted that
many of the confidence intervals have an upper limit greater than one,
indicating the theoretical possibility of tumor induction in rats by
fenaminosulf that could not be established under the conditions of
this test.
32

IV. CHRONIC TESTING RESULTS: MICE
A. Body Weights and Clinical Observations
There was no significant mean body weight depression in treated
male mice when compared to controls until approximately week 32, at
which time the mean body weight of the treated male mice was consis
tently lower than that of control mice (Figure 3). Slight mean body
weight depression was noted when low dose female mice were compared
to their controls. Fluctuations in the growth curve may be due to
mortality; as the size of the group diminishes, the mean body weight
may be subject to wide variations.
No clinical abnormalities were observed in treated or control
mice of either sex.
B. Survival
The estimated probabilities of survival for male and female mice
in the control and fenaminosulf-dosed groups are shown in Figure 4.
Nineteen of the 50 high dose male mice died in weeks 1 or 2
from toxic reactions. After excluding these mice, the Tarone test
still indicated a significant positive association between dose and
mortality. Twelve high dose male mice died in weeks 42 and 43, nine
of which were autolyzed. With only 13 of the high dose male mice
surviving on test beyond week 52, five of which were sacrificed in
week 78, inadequate numbers of high dose male mice were at risk from
late-developing tumors. Five control male mice were sacrificed in
week 79. Survival was adequate in the low dose and control groups
33

50- -50
40 — -40
C/3
-30
O LU
s -20 >20
o CO
CONTROL
10— -10 LOW DOSE
HIGH DOSE MALE MICE
II I 15 30 45 60 75 90 105 120
TIME ON TEST (WEEKS)
50
HIGH DOSE CONTROL
-'—'—'- LOW DOSE CONTROL
LOW DOSE
_ HIGH DOSE
T 60 75 105 120
TIME ON TEST (WEEKS)
FIGURES GROWTH CURVES FOR FENAMINOSULF CHRONIC STUDY MICE
34

O
c 3
c3
g
s
30
<
<
^
S
o-
S
TJ
30 8
g
d £
S
* ^
0 .
Tl
z
-y
m
-n
Z o
—1
^> J
^ m
;p
»
*—
WO
) S
3
D
HO
0 *
?
c«
mC
m
~
-n
c/)
0
-j_
I 01
30
O
Z
O
V) |
•
0
m
8 -
O
o
c 3
c 3
PR
OB
AB
ILIT
Y O
F S
UR
VIV
AL
P
O
O
io
-t*
b)
03
< 3
i 1
i 1
i ! •
i i
ri
i !
i 1
i r r i
|i
i i
1
,— j
0
0
0
°
—
£
rn
m
t"
>0
0
I
«o
g •-
«*
5 5
i
J?
-
r~ i ^
r jIr^F
j JT
I ^ *-»r j1
^1
i 'j I rs
! r r
,1
p
m
2
O
m i
| i
| i
| i
i
O
O
o
k>
4*
O
> G
O
O
O M
1C3
c3
1
CJ1
-
to
o
-
—1
-fc
—
m
5
m
0
2
H
m ?q
8s
m
im
I £
en
i^j
n01
-
S-
i m S
- 0
o —
01
o
i io
c 3
c 3
Kj
PR
OB
AB
ILIT
Y O
F S
UR
VIV
AL
P
O
O
-.
'•*
0>
00
b
1
1
1 1
1 1
1
j~'~
H
r
r_i—
——
•*
P«
1
I
„
0
r-/
/
'
O
0
s
5
°
5
I 8
°
i
i i
i |
i
O
O
0
J*
b)
CO
b

with 78 percent (39/50) of the low dose and 84 percent (42/50) of the
controls surviving on test until the end of the study.
For female mice the Cox tests also showed significant positive
differences between each of the dosed groups and its respective con
trol; for the low dose those females that died in weeks 1 and 2 were
excluded for this Cox test. The departure from linear trend was also
significant, primarily because survival was poorer in the low dose
group than in the high dose group. Five females from the high dose
treated group, five from the low dose control, and five from the high
dose control group were sacrificed in week 79. Adequate numbers of
female mice were at risk from late-developing tumors with 64 percent
(32/50) of the high dose, 72 percent (36/50) of the low dose control,
and 80 percent (40/50) of the high dose control mice alive on test
until the end of the study. In the low dose group, 18/21 of those
mice surviving at least 52 weeks were alive on test until the end
of the study. Since no tumors were observed in females that died
before week 78, there was no evidence that early mortality was tumor-
related.
C. Pathology
Histopathologic findings on neoplasms in mice are summarized in
Appendix B (Tables Bl and B2); findings on nonneoplastic lesions are
summarized in Appendix D (Tables Dl and D2).
A variety of neoplasms occurred with approximately equal fre
quency in the treated and control mice. Occasionally, as shown in
36

the summary tables, neoplasms occurred only in the treated mice or
with an increased frequency when compared with the control animals.
The nature and incidence of these neoplasms were similar to sponta
neously occurring neoplasms in B6C3F1 mice. An unusual tumor was a
teratoma of the ovary in 1/37 (3 percent) of the high dose mice.
The treated mice had a variety of nonneoplastic lesions. The
incidence and severity of the lesions were approximately equal in
the treated and control groups, with the exception of 13/16 low dose
female mice that died in weeks 32 and 33 having either kidney nephro
pathy, kidney tubule mineralization, or both.
The results of this microscopic examination indicate that the
administration of fenaminosulf was not carcinogenic to B6C3F1 mice.
D. Statistical Analyses of Results
The results of the statistical analyses of tumor incidence in
mice are summarized in Tables 5 and 6. The analysis is included for
every type of malignant tumor in either sex where at least two such
tumors were observed in at least one of the control or fenaminosulf
dosed groups and where such tumors were observed in at least 5 per
cent of the group. Because of high early mortality noted in mice
of both sexes, these analyses were based on those mice surviving at
least 52 weeks. No Cochran-Armitage tests were used in the analyses
of the female mice because the high dose group and its control were
started at a different time from the low dose group and its control.
37

___
___
TABLE 5
ANALYSES OF THE INCIDENCE OF PRIMARY TUMORS AT SPECIFIC SITES IN MALE MICE TREATED WITH FENAMINOSULF
SURVIVING AT LEAST 52 WEEKS3
HIGH DOSE
0/13(0.00)
N.S.
0.000 0.000 5.581
1/13(0.08)
N.S.
0.516 0.012 3.391
0/13(0.00)
N.S.
0.000 0.000 66.474
TOPOGRAPHY: MORPHOLOGY
Lung: Alveolar/Bronchiolar Carcinoma
P Values0
Relative Risk (Control) Lower Limit Upper Limit
Weeks to First Observed Tumor
oo Lung: Alveolar/Bronchiolar Carcinoma or Alveolar/Bronchiolar Adenoma^
P Values0
Relative Risk (Control) Lower Limit Upper Limit
Weeks to First Observed Tumor
Hematopoietic System: Leukemia or Malignant Lymphoma"
P Values0e
Departure from Linear Trend
Relative Risk (Control) Lower Limit Upper Limit
Weeks to First Observed Tumor
CONTROL
3/47(0.06)
N.S.
97
7/47(0.15)
N.S.
97
1/49(0.02)
N.S.
P = 0.009
97
LOW DOSE
3/42(0.07)
N.S.
1.119 0.158 7.921
90
7/42(0.17)
N.S.
1.119 0.365 3.421
90
7/43(0.16)
P = 0.019
7.977 1.088
349.807
87
95
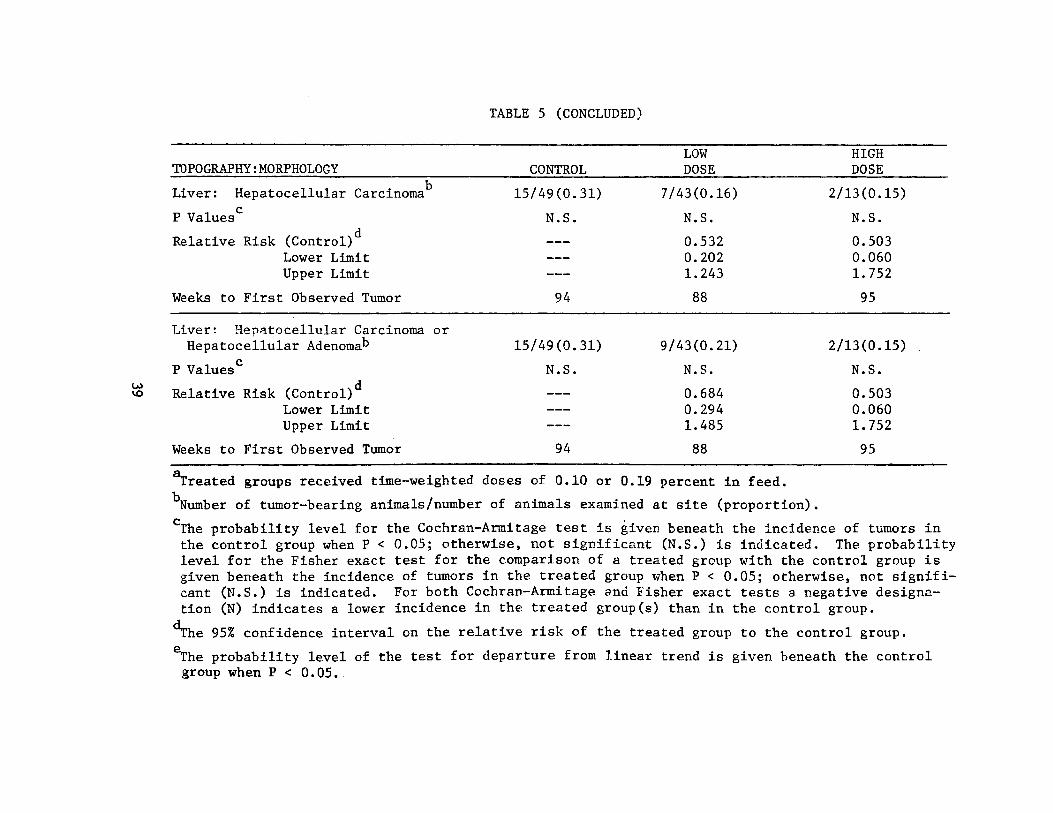
TABLE 5 (CONCLUDED)
LOW HIGH TOPOGRAPHY: MORPHOLOGY CONTROL DOSE DOSE
Liver: Hepatocellular Carcinoma 15/49(0.31) 7/43(0.16) 2/13(0.15)
P Values0 N.S. N.S. N.S.
Relative Risk (Control) Lower Limit Upper Limit
0.532 0.202 1.243
0.503 0.060 1.752
Weeks to First Observed Tumor 94 88 95
Liver: Hepatocellular Carcinoma or Hepatocellular Adenoma^ 15/49(0.31) 9/43(0.21) 2/13(0.15)
P Values0 N.S. N.S. N.S. CO vo Relative Risk (Control)
Lower Limit Upper Limit
0.684 0.294 1.485
0.503 0.060 1.752
Weeks to First Observed Tumor 94 88 95
ireated groups received time-weighted doses of 0.10 or 0.19 percent in feed.
Number of tumor-bearing animals/number of animals examined at site (proportion).
°The probability level for the Cochran-Armitage test is given beneath the incidence of tumors in the control group when P < 0.05; otherwise, not significant (N.S.) is indicated. The probability level for the Fisher exact test for the comparison of a treated group with the control group is given beneath the incidence of tumors in the treated group when P < 0.05; otherwise, not significant (N.S.) is indicated. For both Cochran-Armitage and Fisher exact tests a negative designation (N) indicates a lower incidence in the treated group(s) than in the control group.
The 95% confidence interval on the relative risk of the treated group to the control group. eThe probability level of the test for departure from linear trend is given beneath the control group when P < 0.05.

TABLE 6
ANALYSES OF THE INCIDENCE OF PRIMARY TUMORS AT SPECIFIC SITES IN FEMALE MICE TREATED WITH FENAMINOSULF
SURVIVING AT LEAST 52 WEEKS3
LOW DOSE HIGH DOSE LOW HIGH TOPOGRAPHY: MORPHOLOGY CONTROL CONTROL DOSE DOSE
Lung: Alveolar/Bronchiolar Carcinoma 3/45(0.07) 3/50(0.06) 0/20(0.00) 1/39(0.03)
P Values0 N.S. N.S.
Relative Risk (Control) Lower Limit Upper Limit
___ 0.000 0.000 3.598
0.427 0.008 5.060
Weeks to First Observed Tumor 97 79 93
Lung: Alveolar/Bronchiolar Carcinoma or Alveolar/Bronchiolar Adenoma^
P Values0 4/45(0.09)
___ 4/50(0.08) 3/20(0.15)
N.S.
4/39(0.10)
N.S.
Relative Risk (Control) Lower Limit
1.687 0.265
1.282 0.253
Upper Limit 8.837 6.438
Weeks to First Observed Tumor 97 79 93 93
Hematopoietic System:Malignant Lymphoma'3
P Values0
Leukemia or 6/46(0.13)
^ ^
6/50(0.12) ___
3/20(0.15)
N.S.
5/39(0.13)
N.S.
Relative Risk (Control) Lower Limit Upper Limit
_.__ 1.150 0.200 4.701
1.068 0.277 3.872
Weeks to First Observed Tumor 68 98 93 91

___
TABLE 6 (CONTINUED)
TOPOGRAPHY: MORPHOLOGY t
Liver: Hepatocellular Carcinoma
P Values0
Relative Risk (Control) Lower Limit Upper Limit
Weeks to First Observed Tumor
Liver: Hepatocellular Carcinoma or Hepatocellular Adenoma^5
P Values0j
Relative Risk (Control) Lower Limit Upper Limit
Weeks to First Observed Tumor
Pituitary: Adenoma NOS
P Values0
Relative Risk (Control) Lower Limit Upper Limit
Weeks to First Observed Tumor
LOW DOSE CONTROL
0/45(0.00)
__—__._
0/45(0.00)
1/32(0.03)
80
HIGH DOSE CONTROL
2/49(0.04)
98
2/49(0.04)
98
0/42(0.00)___ •
__—
LOW DOSE
2/19(0.11)
N.S.
Infinite 0.706
Infinite
97
4/19(0.21)
P = 0.006
Infinite 2.228
Infinite
93
3/16(0.19)
N.S.
6.000 0.523
291.426
97
HIGH DOSE
3/37(0.08)
N.S.
1.986 0.239 22.690
78
3/37(0.08)
N.S.
1.986 0.239 22.690
78
3/32(0.09)
N.S.
Infinite 0.796
Infinite
95

TABLE 6 (CONCLUDED)
Treated groups received time-weighted average doses of 0.05 or 0.10 percent in feed.
Number of tumor-bearing animals/number of animals examined at site (proportion). cThe probability level for the Fisher exact test for the comparison of a treated group with its control group is given beneath the incidence of tumors in the treated group when P < 0.05; otherwise, not significant (N.S.) is indicated. A negative designation (N) indicates a lower incidence in the treated group than in the control group.
The 95% confidence interval on the relative risk of the treated group to the control group.
.pN3

In male mice the incidence of leukemia or malignant lymphoma was
increased in the low dose treated group. The Fisher exact test showed
a significantly (P = 0.019) greater incidence in the low dose than in
the control group. However, in historical data compiled by this labo
ratory for the NCI Carcinogenesis Testing Program 29/275 (11 percent)
of the untreated male B6C3F1 mice had a malignant lymphoma or leukemia,
compared to the 7/43 (16 percent) observed in the low dose group.
In female mice the combined incidence of hepatocellular adenomas
or hepatocellular carcinomas was increased in the treated groups com
pared to their respective controls. The results of the Fisher exact
test comparing the low dose treated group to its control was signifi
cant (P = 0.006). This was not supported, however, by significant
high dose Fisher exact test results.
To provide additional insight into the possible carcinogenicity
of this compound, 95 percent confidence intervals on the relative
risk have been estimated and entered in the tables based upon the
observed tumor incidence rates. In many of the intervals shown in
Tables 5 and 6, the value one is included; this indicates the absence
of statistically significant results. It should also be noted that
many of the confidence intervals have an upper limit greater than one,
indicating the theoretical possibility of tumor induction in mice by
fenaminosulf that could not be established under the conditions of
this test.
43

V. DISCUSSION
It is recognized that the results reported in this study are not
for pure or technical-grade fenaminosulf, but for the commercially
available formulated product containing fenaminosulf.
There was no significant association for female rats between
fenaminosulf dosage and mortality; this was also true for male rats
if the 21 males that died in the first two weeks of the bioassay are
excluded from consideration. For both male and female mice there was
a significant positive association between dosage and mortality. In
all groups of both species, except for high dose male and low dose
female mice, adequate numbers of animals survived sufficiently long
to be at risk from late-developing tumors.
No convincing statistical evidence was provided for a significant
positive association between compound administration and the incidence
of any tumor in male or female rats. Endometrial stromal sarcomas
were observed only in treated female rats (i.e., 3/48 [6 percent] low
dose and 1/47 [2 percent] high dose). These incidences did not, how
ever, prove to be statistically significant when compared to controls.
There were increased incidences of necrosis and mineralization
of the renal papillary tubules in treated rats and mice when compared
to controls. The severity of these lesions was variable and they
were observed in addition to the chronic renal disease often seen in
aging rodents.
44
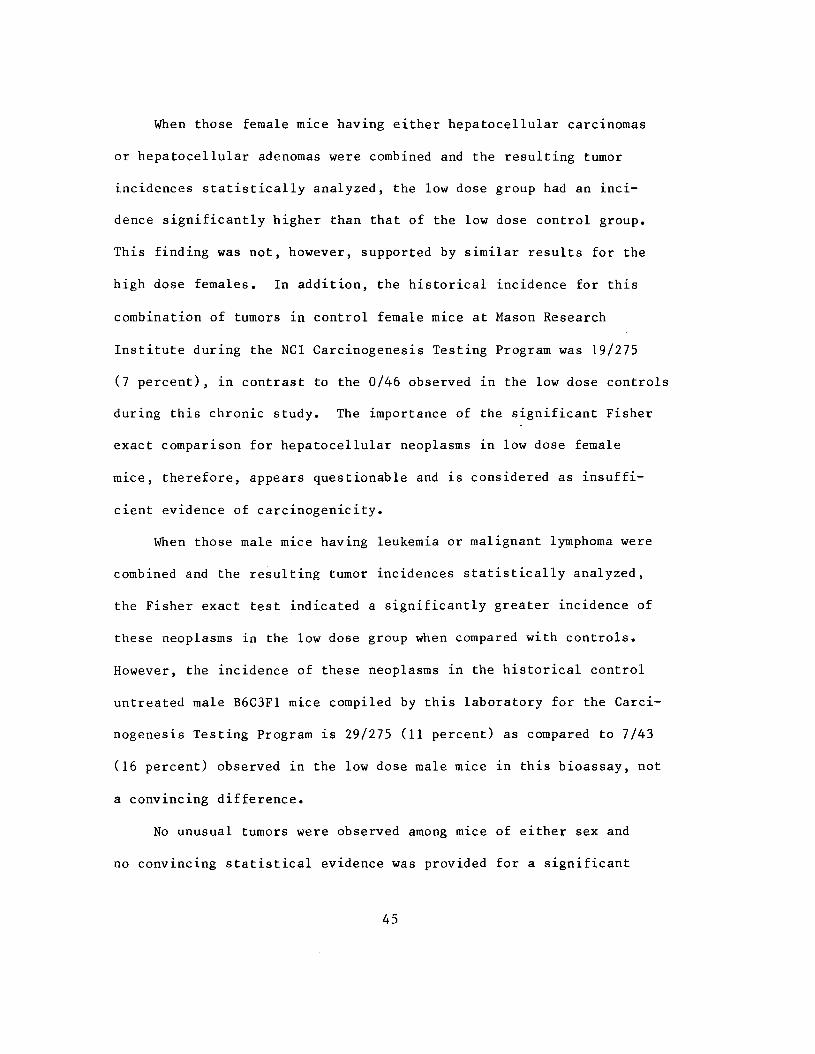
When those female mice having either hepatocellular carcinomas
or hepatocellular adenomas were combined and the resulting tumor
incidences statistically analyzed, the low dose group had an inci
dence significantly higher than that of the low dose control group.
This finding was not, however, supported by similar results for the
high dose females. In addition, the historical incidence for this
combination of tumors in control female mice at Mason Research
Institute during the NCI Carcinogenesis Testing Program was 19/275
(7 percent), in contrast to the 0/46 observed in the low dose controls
during this chronic study. The importance of the significant Fisher
exact comparison for hepatocellular neoplasms in low dose female
mice, therefore, appears questionable and is considered as insuffi
cient evidence of carcinogenicity.
When those male mice having leukemia or malignant lymphoma were
combined and the resulting tumor incidences statistically analyzed,
the Fisher exact test indicated a significantly greater incidence of
these neoplasms in the low dose group when compared with controls.
However, the incidence of these neoplasms in the historical control
untreated male B6C3F1 mice compiled by this laboratory for the Carci
nogenesis Testing Program is 29/275 (11 percent) as compared to 7/43
(16 percent) observed in the low dose male mice in this bioassay, not
a convincing difference.
No unusual tumors were observed among mice of either sex and
no convincing statistical evidence was provided for a significant
45

positive association between compound administration and the incidence
of any tumor in either sex.
Contradictory carcinogenicity data have been obtained in two
other studies with fenaminosulf. An unspecified number of Sprague-
Dawley rats fed fenaminosulf at a concentration of 1000 mg/kg of diet
developed "hepatomas resembling those produced by dimethylaminoazoben
zene" after 12 months (Herrmann and DuBois, 1949); however, no liver
tumors were found in 2 groups of 20 Holtzmann rats 15 months after
administration of a diet containing 1.35 or 4.0 millimoles of fenami
nosulf per kg of feed (339.12 or 1004.8 mg/kg) (Miller et al., 1957).
Under the conditions of this bioassay, dietary administration of
formulated fenaminosulf was not carcinogenic in either Fischer 344
rats or B6C3F1 mice.
46

VI. BIBLIOGRAPHY
Armitage, P., Statistical Methods in Medical Research, Chapter 14. J. Wiley & Sons, New York, 1971.
Berenblum, I., editor, Carcinogenicity Testing. International Union Against Cancer, Technical Report Series, Vol. 2. International Union Against Cancer, Geneva, 1969.
Carter, L.J., J.G. Mitchell, and D.J. Wilson, EPA Compendium of Registered Pesticides, Volume II: Fungicides and Nematacides. Technical Service Division, Office of Pesticides Programs, U.S. Environmental Protection Agency, Washington, D.C., 1973.
Chemical Abstracts Service. The Chemical Abstracts Service (CAS) Ninth Collective Index, Volumes 76-85, 1972-1976. American Chemical Society, Washington, D.C., 1977.
Cox, D.R., Analysis of Binary Data, Chapters 4 and 5. Methuen and Co., Ltd., London, 1970.
Cox, D.R., "Regression Models and Life-Tables." Journal of the Royal Statistical Society, Series "B" 34:187-220, 1972.
Farm Chemicals Handbook. Mesiter Publishing Company, Willoughby, Ohio, 1976.
Gart, J.J., "The Comparison of Proportions: A Review of Significance Tests, Confidence Limits, and Adjustments for Stratification." International Statistical Institute Review 39:148-169, 1971.
Herrmann, R.G. and K.P. DuBois, "Studies on the Toxicity and Pharmacological Action of p-Dimethylaminobenzenediaso Sodium Sulfonate (DAS)." Journal of Pharmacology and Experimental Therapeutics _95j262-271, 1949.
International Agency for Research on Cancer. IARC Monographs on the Evaluation of Carcinogenic Risk of Chemicals to Man, Volume 8. IARC, Lyon, France, 1975.
Kaplan, E.L., and P. Meier, "Nonparametric Estimation from Incomplete Observations." Journal of the American Statistical Association _53_:457-481, 1958.
Linhart, M.S., J.A. Cooper, R.L. Martin, N.P. Page, and J.A. Peters, "Carcinogenesis Bioassay Data System." Computers and Biomedical Research 7:230-248, 1974.
47

Miller, J.A., E.G. Miller, and G.C. Finger, "Further Studies on the Carcinogenicity of Dyes Related to 4-Dimethylaminoazobenzene. The Requirement for an Unsubstituted 2-Position." Cancer Research 17:387-398, 1957.
Miller, R.G., Simultaneous Statistical Inference. McGraw-Hill Book Co., New York, 1966.
Saffiotti, U., R. Montesano, A.R. Sellakumar, F. Cefis, and D.G. Kaufman, "Respiratory Tract Carcinogenesis in Hamsters Induced by Different Numbers of Administration of Benzo (a) Pyrene and Ferric Oxide." Cancer Research 32:1073-1079, 1972.
Stanford Research Institute, 1977 Directory of Chemical Producers, U.S.A. Menlo Park, California, 1977.
Tarone, R.E., "Tests for Trend in Life-Table Analysis." Biometrika jj :679-682, 1975.
Terayama, H., "Aminoazo Carcinogenesis—Methods and Biochemical Problems." Methods in Cancer Research 1:399-449, 1967.
48

Review of the Bioassay of Formulated Fenaminosulf* for Carcinogenicity
by the Data Evaluation/Risk Assessment Subgroup of the Clearinghouse on Environmental Carcinogens
April 26, 1978
The Clearinghouse on Environmental Carcinogens was established in May, 1976, in compliance with DHEW Committee Regulations and the Provisions of the Federal Advisory Committee Act. The purpose of the Clearinghouse is to advise the Director of the National Cancer Institute (NCI) on its bioassay program to identify and to evaluate chemical carcinogens in the environment to which humans may be exposed. The members of the Clearinghouse have been drawn from academla, industry, organized labor, public interest groups, State health officials, and quasi-public health and research organizations. Members have been selected on the basis of their experience in carcinogenesis or related fields and, collectively, provide expertise in chemistry, biochemistry, biostatistics, toxicology, pathology, and epidemiology. Representatives of various Governmental agencies participate as ad hoc members. The Data Evaluation/ Risk Assessment Subgroup of the Clearinghouse is charged with the responsibility of providing a peer review of reports prepared on NCI-sponsored bioassays of chemicals studied for carcinogenicity. It is in this context that the below critique is given on the bioassay of Formulated Fenaminosulf for carcinogenicity.
The primary reviewer said that the compound was not carcinogenic in rats or mice under the conditions of test. He noted that only 35% of the tested compound was estimated to be Fenaminosulf, the remainder being clay, silica, sodium naphthalene sulfonate, and sodium ligno-sulfate. Despite certain experimental shortcomings, he said that the study was adequate to conclude that Formulated Fenaminosulf was not carcinogenic under the conditions of test.
Although the secondary reviewer agreed that the study was "essentially negative," he pointed out the elevated incidence of hepatocellular carcinomas in low dose treated female mice and hematopoietic system tumors in low dose treated male mice. The meaningfulness of these increases was obscured by excessive early mortality due to toxicity. If Formulated Fenaminosulf is still a major environmental hazard, he suggested that it be retested, at least in mice.
49

A motion was made that the report on the bioassay of Formulated Fenaminosulf be accepted as written. The motion was seconded and approved unanimously.
Members present were:
Michael Shimkin (Acting Chairman), University of California at San Diego
Joseph Highland, Environmental Defense Fund George Roush, Jr., Monsanto Company Louise Strong, University of Texas Health Sciences Center John Weisburger, American Health Foundation (David Clayson, Eppley Institute for Cancer Research, submitted a written review)
* Subsequent to this review, changes may have been made in the bioassay report either as a result of the review or other reasons. Thus, certain comments and criticisms reflected in the review may no longer be appropriate.
i^U.S. G O V E R N M E N T P R I N T I N G O F F I C E ; 1978-260-899/3205
50

APPENDIX A
SUMMARY OF THE INCIDENCE OF NEOPLASMS IN RATS TREATED WITH FENAMINOSULF


TABLE A1 SUMMARY OF THE INCIDENCE OF NEOPLASMS IN MALE RATS TREATED WITH FEN AMINOSULF
c:OSTROL (UNTR) LOU DOSE HIGH DOSE 01-0160 01-R151 01-0140
ANIMALS INITIALLY IN STUDY 50 50 50 ANIMALS NECROPSIED 50 43 1)9 ANIMALS EXAMINED HISTOPATHOLOGICALLY ** 50 41 48
INTEGUMENTARY SYSTEM
*SKIN (50) (43) (49) FIBEOMA 1 (2%)*IBROSARCCMA 1 (2%)
*SOBCOT TISSUE (50) (43) (49) SARCOHA, NOS 1 <2X) 1 (2X) FIBROMA 1 (2X) 2 (5%) 3 (6%)FIBHOSARCOMA 1 (2<S) LEIOHYOSARCOHA 1 (2«) FIBROADENCMA 1 (2%)
RESPIRATORY SYSTEM
»LUNG ALVEOLAR/BPONCHIOLJR CARCINOMA C-CELL CARCINOMA, METASTATIC
(49) 1 (2%) (41)
1 (2*)
(48) 1 (2%)
HEMATOPOIETIC SYSTEM
*MULTIPLE ORGANS (50) (43) (49) LEUKEMIA, NOS 1 (2X) MYELOMONOCYTIC LEUKEMIA 9 (18%)
•SPLEEN (50) (41) (48) MYELOMONOCYTIC LEUKEMIA 1 (2!5) 1 (2«)
#THYMUS (24) (23) (34) C-CELL CARCINOMA, METASTATIC 1 <4X)
CIRCULATORY SYSTEM
tHEAHT (48) (40) (48 ) ____SARCQMAi_NOSi_gETASTATIC
* N U M B E R O F A N I M A L S W I T H TISSUE E X A M I N E D M I C R O S C O P I C A L L Y * N U M B E R OF A N I M A L S N E C R O P S I E D **EXCLUDES PARTIALLY AUTOLYZED ANIMALS
A-3

TABLE A1 (CONTINUED)
CONTROL (UNTH) LOW DOSE HIGH DOSE 01-0160 01-R150 01-0 140
DIGESTIVE SYSTEM
•LIVER (49) (41) (48) NEOPLASTIC NODULE 1 (2X)
•JEJUNUM (49) (36) (47) SARCOMA, NOS 1 (3X)
URINARY SYSTEM
NONE
ENDOCKINE SYSTEM
•PITUITARY (45) (30) (42) ADENOMA, NOS 5 (11X) t (13X) 5 (12X) CHROHOPHOBE ADENOMA 2 (4%) 3 (10X) 2 (5X) ACIDOPHIL ADENOMA 2 (5X)
•ADRENAL (50) (41) (47) CORTICAL ADENOMA 1 (2X) 1 <2X) PHEOCHROMOCYTOHA 3 <6X) 6 (15X) 3 (6X)
•THYROID (37) (31) (44) FOLLICULAR-CELL CARCINOMA 1 (3X) 1 (2X) C-CELL ADENOMA 1 (3X) U (13X) 1 (2X) C-CELL CARCINOMA 2 <5X) 1 (3X) 2 (5X)
•PARATHYROID (20) (17) (24) ADENOMA, NOS 1 (6X)
•PANCREATIC ISLETS (47) (40) (47) ISLET-CELL ADENOMA 1 (2X) 2 (5X) 2 (IX) ISLET-CELL CARCINOMA 1 (3X)
REPRODUCTIVE SYSTEM
*PREP'!TIAL GLAND (50) (43) (49) CARCINOMA, NOS 2 (»X)
•TESTIS (50) (41) (47) INTERSTITIAL-CELL TUMOH <J2 _[8«Xl_ 29 _[71X)_ 10 J85X).
» NUMBER OF ANIMALS WITH TISSUE EXAMINED MICROSCOPICALLY * NUMBER OF ANIMALS NECROPSIED
A-4

NERVOUS SYSTEM
ICEREBRAL CORTEX GLIOMA, NOS
SPECIAL SENSE ORGANS
*ZYNBAL'S GLAND SEBACEOUS ADENOCARCINOMA
MDSCULOSKELETAL SYSTEM
NONE
BODY CAVITIES
*BOD!( CAVITIES MESOTHELIOMA, NOS
ALL OTHER SYSTEMS
NONE
ANIHAL DISPOSITION SUMMARY
ANIMALS INITIALLY IN STUDY NATURAL DEATHS MORIBUND SACRIFICE SCHEDULED SACRIFICE ACCIDENTALLY KILLED TERMINAL SACRIFICE ANIMAL MISSING
I_rMCLODES_AUTQLIZED_AfiIH»LS
TABLE A1 (CONTINUED)
CONTROL(UNTR) 01-0160
(50) 1 (2X)
(50)
(50)
50 5
8 5
32
LOW DOSE HIGH DOSE 01-R150 01-011(0
(39) (47)
(U3) («9) 1 (2%)
(1*3) (U9) 1 (2%)
50 50 21 3
3 5
29 39
I NUMBER OP ANIMALS WITH TISSUE EXAMINED MICROSCOPICALLY * NUMBER OF ANIMALS NECROPSIED
A-5

TABLE Al (CONCLUDED)
TUMOR SUMMARY
TOTAL ANIMALS WITH PRIMARY TUMORS*TOTAL PRIMARY TUMORS
TOTAL ANIMALS WITH BENIGN TUMORSTOTAL BENIGN TUMORS
TOTAL ANIMALS WITH MALIGNANT TUMORSTOTAL MALIGNANT TUMORS
TOTAL ANIMALS WITH SECONDARY TUMORSfTOTAL SECONDARY TUMORS
TOTAL ANIMALS WITH TUMORS UNCERTAINBENIGN OP MALIGNANT
TOTAL UNCERTAIN TUMORS
TOTAL ANIMALS WITH TUMORS UNCERTAINPEIMARY OR METASTATIC
TOTAL UNCERTAIN TUMORS
CONTROL(UNTR) 01-0160
49 76
16 56
17 20
1 1
LOW DOSE HIGH DOSE 01-B150 01-01UO
29 «2 60 66
29 11 52 60
6 66 6
12
12
* PRIMARY TU.10BS: ALL TUMORS EXCEPT SECONDARY TUHORS I SECONDARY TUMORS: METASTATIC TUMORS OR TUMORS INVASIVE INTO AN ADJACENT ORGAN
A-6

TABLE A2
SUMMARY OF THE INCIDENCE OF NEOPLASMS IN FEMALE RATS TREATED WITH FENAMINOSULF
A N I M A L S I N I T I A L L Y IN STUDY A N I M A L S H I S S I N G A N I M A L S NECBOPSIED A N I M A L S E X A M I N E D H I S T O P A T H O L O G I C A L L Y * *
I N T E G U M E N T A R Y SYSTEM
*SUBCUT TISSUE F I B R O H A
R E S P I R A T O R Y SYSTEM
• LUNG SQUAMOUS CELL CARCINOMA ALVEOLAR/BRONCHIOLAS ADENOMA
HEMATOPOIETIC SYSTEM
*(1ULTIPLE ORGANS MALIGNANT 1YMPHOMA, NOS LEUKEMIA,NOS MYELOMONOCYTIC LEUKEMIA
tSPLEFN MYELOHONOCYTIC LEUKEMIA
CIRCULATORY SYSTEM
NONE
DIGESTIVE SYSTEM
*LIVER HEPATOCELLULAR CARCINOMA
*COLON ADENOMATOUS POLYP, NOS
URINARY SYSTEM
NONE.
C O N T R O L ( U N T R ) L O W DOSE H I G H DOSE 02-0160 02-R150 02-011(0
50 50 50 1
19 US 50 49 U8 50
(«9) (US) (50) 2 (14%) 1 (2%)
(19) (US) (1(9) 1 (2%)
1 (2%)
(K9) (US) (50) 1 (2X)
1 (2%) 6 (12*)
(K7) (US) (H9) 1 (2%)
(KB) (US) (50) 1 (2%) 1 (2«)
(U9) (U5) (U2) 1 (2Jt)
* N U M B E R O F A N I M A L S W I T H T I S S U E E X A M I N E D M I C R O S C O P I C A L L Y * N U M B E R OF A N I M A L S N E C R O P S I E D "EXCLUDES PARTIALLY AUTOLYZED ANIMALS
A-7
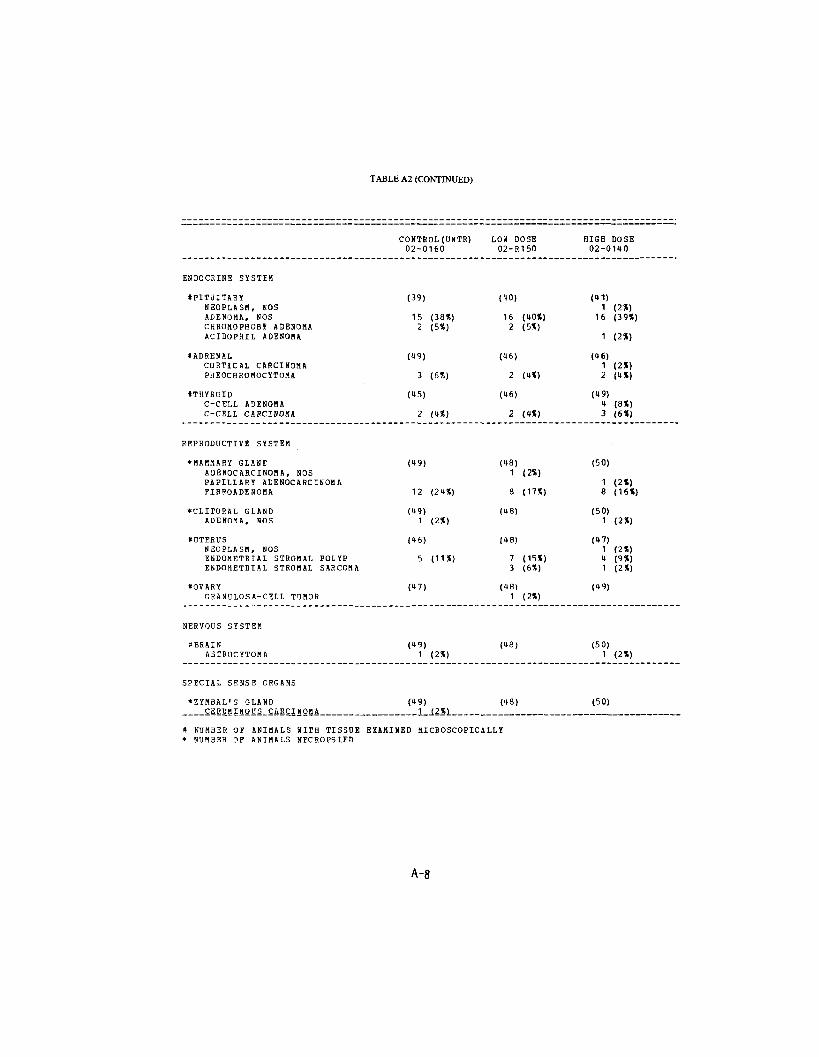
E N D O C R I N E S Y S T E M
* P I T U I T A R Y N E O P L A S M , NOS A D E N O M A , N O S C H R O M O P H O B I A D E N O M A A C I D O P H I L A D E N O H A
• A D R E N A L C O R T I C A L C A R C I N O M A P H E O C H R O H O C Y T O M A
# T H Y R O I D C-CELL A D E N O H A C-CELL C A R C I N O M A
R E P R O D U C T I V E S Y S T E M
* M A M M A R Y G L A N D A D E N O C A 8 C I N O M A , NOS P A P I L L A R Y A D E N O C A 8 C I N O M A F I B B O A D E N C M A
* C L I T O R A L G L A N D A D E N O M A , N O S
tUTERUS N E O P L A S M , NOS E N D O M E T R I A L S T R O M A L P O L Y P E N D O M E T R I A L S T R O M A L S A R C O M A
O O V A R Y G R A N U L O S A - C E L L T U M O R
N E R V O U S S Y S T E M
* B 8 A I N A S T R O C Y T O M A
SPECIAL S E N S E O R G A N S
•ZYMBAL'S GLAND ____ CERUnlNOUS_C&RCINOMA
TABLE A2 (CONTINUED)
CONTROL ( D N T R ) 02-0160
(39)
15 (38X) 2 (5%)
(19)
3 ( 6X)
(15)
2 (1%)
(19)
12 (21X)
(19) 1 ( 2 X )
(16)
5 ( 1 1 X )
(17)
(19) 1 < 2 X )
( 49 )
LOW DOSE H I G H DOSE 02-R150 02-0140
(10) (11) 1 < 2 X )
16 (UOX) 16 (39X) 2 (5%)
1 (2X)
(16) (46) 1 (2X)
2 (IX) 2 (IX)
(16) (49) 4 (8X)
2 (IX) 3 (6X)
(18) (50) 1 (2X)
1 (2X) 8 (17X) 8 (16X)
(18) (50) 1 (2X)
(18) («7) 1 ( 2 X )
7 (15X) 4 (9X) 3 (6X) 1 (2X)
(18) (19) 1 (2X)
(18) (50) 1 < 2 X )
(18) (50)
* NUMBER OF ANIMALS WITH TISSUE EXAMINED MICROSCOPICALLY * NUMBER OF ANIMALS SECBOPSIED
A-8

TABLE A2 (CONCLUDED)
CONTROL(DNTR) L0¥ DOSE H I G H DOSE 02-0160 02-E150 02-0140
HDSCDLOSKELETAL SYSTEM
NONE
BODY CAVITIES
NONE
ALL OTHER SYSTEMS
NONE
ANIMAL DISPOSITION SUMHARY
ANIMALS INITIALLY IN STUDY 50 50 50 NATURAL DEATHS 2 6 3MORIBUND SACRIFICE 6 3 3SCHEDULED SACRIFICE 5 5ACCIDENTALLY KILLED TERMINAL SACRIFICE 36 41 39 ANIMAL MISSING 1
9 INCLUDES AUTOLYZED ANIMALS
TUBOR SUMMARY
TOTAL ANIMALS WITH PRIMARY TUMORS* 31 33 30 TOTAL PRIMARY TUMORS 52 47 47
TOTAL ANIMALS WITH BENIGN TUMORS 27 30 25 TOTAL BENIGN TUMORS 10 38 36
TOTAL ANIMALS WITH MALIGNANT TUMORS 10 8 8TOTAL MALIGNANT TDNOBS 12 8 9
TOTAL ANIMALS WITH SECONDARY TUMORS* TOTAL SECONDARY TUMORS
TOTAL ANIMALS WITH TUMORS UNCERTAINBENIGN OR MALIGNANT 1 2
TOTAL UNCERTAIN TUMORS 1 2
TOTAL ANIMALS WITH TOMORS UNCERTAINPRIMARY OR BBTASTATIC
TOTAL UNCERTAIN TUMORS
* PRIMARY TUMORS: ALL TUMORS EXCEPT SECONDARY TUMORS * SECONDARY TUHORS: METASTATIC TUMORS OR TUMORS INVASIVE INTO AN ADJACENT ORGAN
A-9


APPENDIX B
SUMMARY OF THE INCIDENCE OF NEOPLASMS IN MICE TREATED WITH FENAMINOSULF


TABLE Bl SUMMARY OF THE INCIDENCE OF NEOPLASMS IN MALE MICE TREATED WITH FENAMINOSULF
CONTROL (UNTR) LOW DOSE HIGH DOSE 05-0160 05-0140 05-0150
ANIMALS INITIA1LY IN STUDY 50 50 50 ANIHALS MISSING 1ANIMALS NECROPSIED 50 44 22 ANIMALS EXAMINED HISTOPATHOLOGICALLY** 49 44 22
INTEGUMENTARY SYSTEM
NONE
RESPIRATORY SYSTEM
*LUNG (47) (43) (22) HEPATOCELLULAR CARCINOMA, METAST 2 (4X) ALVEOLAR/BRONCHIOLAR ADENOMA 4 (9X) 4 (9X) 1 (5X) ALVEOLAR/BRONCHIOLAR CARCINOMA 3 (6X) 3 (7X)
HEMATOPOIETIC SYSTEM
*MULIIPLE ORGANS (50) (44) (22) MALIGNANT IYMPHOMA, NOS 1 (2X) 1 (2X) MALIG.LYMPHOMA, HISTIOCYTIC TYPE 1 (2X)
ISPLEEN (49) (43) (20) HEMANGIOMA HEMANGIOSARCOMA 1 (2X) 1 (2X) MALIGNANT LYMPHOMA, NOS 1 (2X)
tLYBPH NODE (40) (10) (14) MALIGNANT LYMPHOMA, NOS 1 <3X)
#MESENTERIC L. NODE (40) (40) (11) MALIGNANT LYMPHOMA, NOS MALIG.LYMPHOMA, HISTIOCYTIC TYPE 1 (3X)
"LIVER (49) (44) (22) MALIG.LYMPHOMA, HISTIOCYTIC TYPE
*PEYERS PATCH (49) (-42) (19) _ HALIG..LYMPHOMAi_HISTIOCYTIC TYPE__ _
f N U M B E R O F A N I M A L S W I T H TISSUE E X A M I N E D MICROSCOPICALLY * N U M B E R OF A N I M A L S N E C H O P S I E D "EXCLUDES PARTIALLY AUTOLYZED ANIMALS
B-3

TABLE Bl (CONTINUED)
CONTROL (UNTR) LOU DOSE HIGH DOSE 05-0160 05-01UO 05-0150
JTHYHUS (30) (21) (7) MALIGNANT LYMPHOMA, NOS 1 (IX)
CIRCULATORY SYSTEM
NONE
DIGESTIVE SYSTEM
*LIVE8 («9) (It) (22) HEPATOCELLULAR ADENOMA 2 (5*) HEPATOCELLULAR CARCINOMA 15 (31X) 7 (16%) 2 (9%)
tSTOMACH («9) («1) (19) ADENOMATOUS POLYP, NOS 1 (2X)
URINARY SYSTEM
NONE
ENDOCRINE SYSTEM
ITHYHOID (<*2) (39) (14) FOLLICULAR-CELL ADENOMA FOLLICDLAR-CELL CARCINOMA
REPRODUCTIVE SYSTEM
«TESTIS (U9) («i|) (22) INTERSTITIAL-CELL TUMOR 1 (2X) EMBRYONAL CARCINOMA
NERVOUS SYSTEM
NONE
SPECIAL SENSE ORGANS
*HARDERIAN GLAND (50) (UK) (22) £ISTJDENCMAX_NOS
# NUMBER OF ANIMALS WITH TISSUE EXAMINED MICROSCOPICALLY » NUMBER OF ANIMALS NECROPSIED
B-4
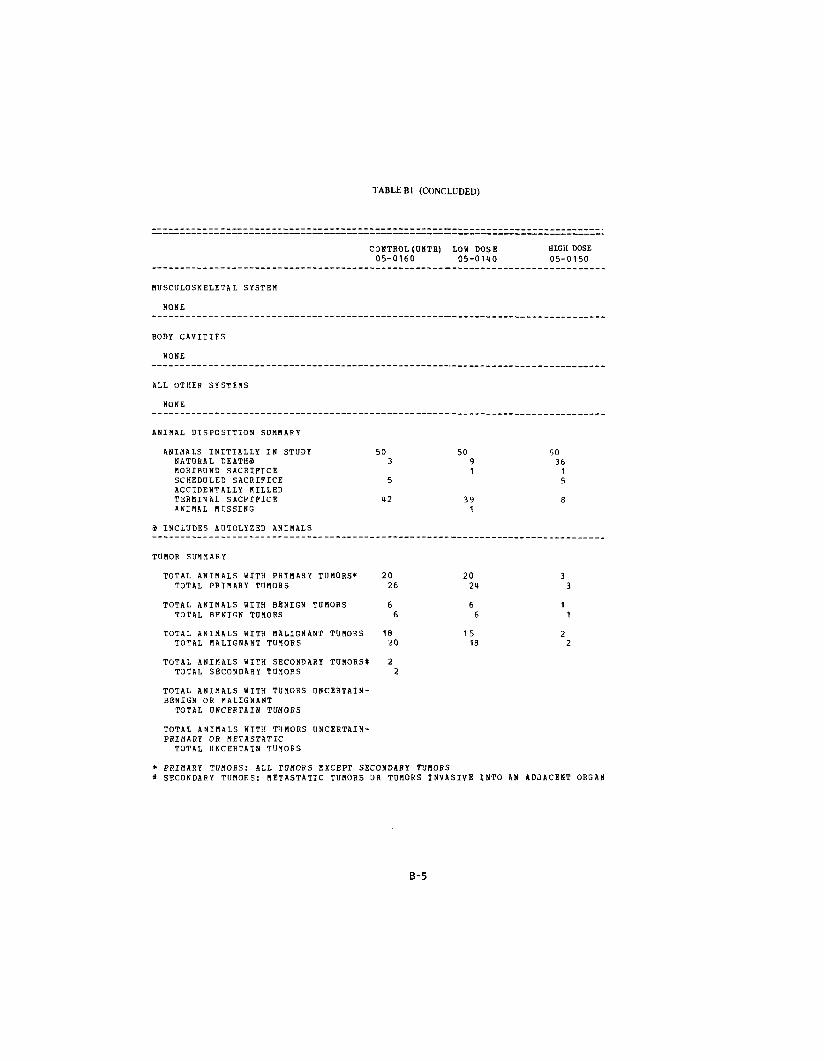
TABLE Bl (CONCLUDED)
CONTROL (UNTR) 05-0160
HUSCULOSKELETAL SYSTEM
NONE
BODY CAVITIES
NONE
ALL OTHER SYSTEMS
NONE
ANIMAL DISPOSITION SUMMARY
ANIMALS INITIALLY IN STUDY 50 NATURAL DEATHS 3 MORIBUND SACRIFICE SCHEDULED SACRIFICE 5 ACCIDENTALLY KILLED TERMINAL SACRIFICE 42 ANIMAL MISSING
9 INCLUDES AUTOLYZED ANIMALS
TUMOR SUMMARY
TOTAL ANIMALS WITH PRIMARY TUMORS* 20 TOTAL PRIMARY TUMORS 26
TOTAL ANIMALS WITH BESIGN TUMORS 6 TOTAL BENIGN TUMORS 6
TOTAL ANIMALS WITH MALIGNANT TUMORS 18 TOTAL MALIGNANT TUMORS 20
TOTAL ANIMALS WITH SECONDARY TUMOHSt 2TOTAL SECONDARY THMOPS 2
TOTAL ANIMALS WITH TUMORS UNCERTAINBENIGN OR MALIGNANT TOTAL UNCERTAIN TUMORS
TOTAL ANIMALS WITH TUMORS UNCERTAINPRIMARY OR METASTATIC
TOTAL UNCERTAIN TUMORS
LOU DOSE HIGH DOSE 05-0110 05-0150
50 50 9 36 1 1
5
39 81
20 324 3
6 16 1
15 218 2
* PRIMARY TUMORS: ALL TUMORS EXCEPT SECONDARY TUMORS * SECONDARY TUMORS: METASTATIC TUMORS OR TUMORS INVASIVE INTO AN ADJACENT ORGAN
B-5

TABLE B2
SUMMARY OF THE INCIDENCE OF NEOPLASMS IN FEMALE MICE TREATED WITH FENAMINOSULF
HIGH DOSE LOW DOSE CONTROL(UNTR) CONTROL (DNTR) LOW DOSE HIGH DOSE 06-0160 06-0220 06-R151 06-01KO
ANIMALS INITIALLY 111 STUDY 50 50 50 350 ANIMALS MISSING 2 2 1ANIMALS NECROPSIED 50 47 13 12 ANIMALS EXAMINED HISTOPATHOLOGICALLY ** 50 141 38 39
INTEGUMENTARY SYSTEM
*SKIN (50) (1»7) (13) (12) KERATOACANTHOMA 1 (2X)
*SUBCUT TISSUE (50) (17) (13) (12) FIBROSARCCMA 1 (2«) HEMANGIOSARCOMA 1 (2*)
RESPIRATORY SYSTEM
*LONG (50) (16) (39) (39) HEPATOCELLDLAR CARCINOMA, METAST 1 (2%) ALVEOLAR/BRONCHIOLSR ADENOMA 1 (2%) 1 (2X) 3 (8*) 3 (8%) ALVEOLAR/BRONCHIOLA8 CARCINOMA 3 (6*) 3 (1%) 1 (3X)
HEMATOPOIETIC SYSTEM
*MULTIPLE ORGANS (50) (17) (13) (12) MALIGNANT LYMPHOMA, NOS 3 (6X) 1 (2X) 2 (5X) 2 (5X) MALIG.LYNPHOMA, HISTIOCYTIC TYPE 3 (6X)
IBONE HARROW (19) (39) (35) (32) HEBANGIOSARCOMA 1 (3X)
*SPL£EN (19) (15) (38) (38) H E M A N G I O S A R C O M A 1 (2*) 1 (3%) BALIG. LYMPHOMA. HISTIOCYTIC TYPE 1 (2%) 2 (IX) 1 (3X)
*MANDIBULAE L. NODE (10) (38) (29) (35) M A L I G N A N T L Y M P H O M A , NOS 1 (3%)
t M E S E N T E R I C L. NODE (10) (38) (29) (35) M A L I G N A N T _ L Y M P H O M A t _ N O S 1_IIS)
* N U M B E R OF A N I M A L S H I T H TISSDE E X A M I N E D MICROSCOPICALLY * NUMBER OF A N I M A L S NECROPSIED **EXCLUDES PARTIALLY AUTOLYZED ANIMALS
a 50 A N I M A L S WERE INITIALLY IN THE STUDY BUT ONE A N I M A L WAS FOUND TO BE A MALE IN A FEMALE GROUP.
B-6

TABLE B2 (CONTINUED)
HIGH DOSE CONTROL (UNTR) 06-0160
LOW DOSE CONTROL(UNTH)
06-0220 LOW DOSE
06-R151 HIGH DOSE 06-0140
fPEYERS PATCH MALIGNANT LYMPHOMA, NOS MALIG.LYMPHOMA, HISTIOCYTIC TYPE
(49) 1 (2%)
(44) . (34) 1 (3S)
(37)
1 (3X)
CIRCULATORY SYSTEM
NONE
DIGESTIVE SYSTEM
»LIVER HEPATOCELLULAR ADENOMA HEPATOCELLULAR CARCINOMA
(49)
2 (4X)
(>46) (36) 2 (6X)
2 (6%)
(37)
3 (8X)
URINARY SYSTEM
NONE
ENDOCRINE SYSTEM
• PITUITARY ADENOMA, NOS
• ADRENAL/CAPSULE ADENOMA, NOS
• THYROID FOLLICULAR-CELL ADENOMA
(U2)
(47)
(41)
(33) 1 (3X)
(40) 1 (3%)
(29) 1 (3!5)
(25) 3 (12X)
(37)
(27)
(32) 3 (9%)
(39)
(31)
REPRODUCTIVE SYSTEM
* M A P 1 M A R Y G L A N D A D E N O C A R C I N O M A , N O S
• OVA4Y PAPILLARY ADENOMA PAPILLARY CYSTADENOMA, NOS TERATOMA, BENIGN
(50)
(48)
( 4 7 )
(40) 1 (3X)
(43) 1 ( 2 % )
(32)
1 (3%)
(42)
(37)
1 (3X)
NERVOUS SYSTEM
NONE
* NUMBER OF ANIMALS WITH TISSUE EXAMINED MICROSCOPICALLY * NUMBER OF ANIMALS NECROPSIED
B-7
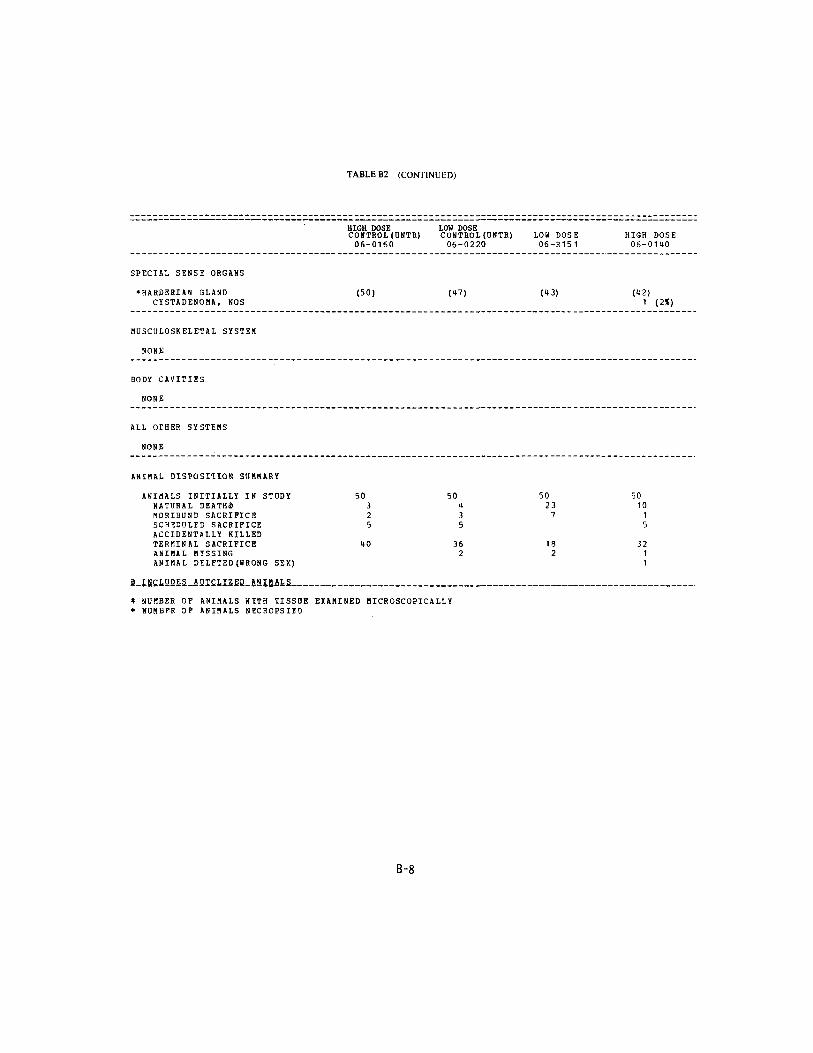
TABLE B2 (CONTINUED)
HIGH DOSE LOW DOSE C O N T R O L ( D N T R ) C O N T R O L ( U N T R ) L O W DOSE H I G H DOSE
06-0160 06-0220 06-R151 06-0140
SPECIAL S E N S E O R G A N S
* H A R D E R I A N G L A N D (50) (47) (43) (42 ) C Y S T A D E N O M A , NOS 1 (2%)
M U S C t J L O S K E L E T A L S Y S T E M
N O N E
BODY C A V I T I E S
NONE
A L L OIHEH S Y S T E M S
N O N E
ANIMAL DISPOSITION S U M M A R Y
ASIf lALS I N I T I A L L Y I N STUDY 50 50 50 50 N A T U R A L DEATHS 3 4 23 10 M O R I B U N D SACRIFICE 2 3 7 1S C H E D U L E D S A C R I F I C E 5 5 5A C C I D E N T A L L Y KILLED T E R M I N A L SACRIFICE 40 36 18 32 A N I M A L M I S S I N G 2 2 1A N I M A L D E L F T E D ( W R O N G SEX) 1
* N U M B E R O F A N I M A L S W I T H TISSUE E X A M I N E D M I C R O S C O P I C A L L Y » N U M B F R OF A N I M A L S N E C R O P S I E D
B-8
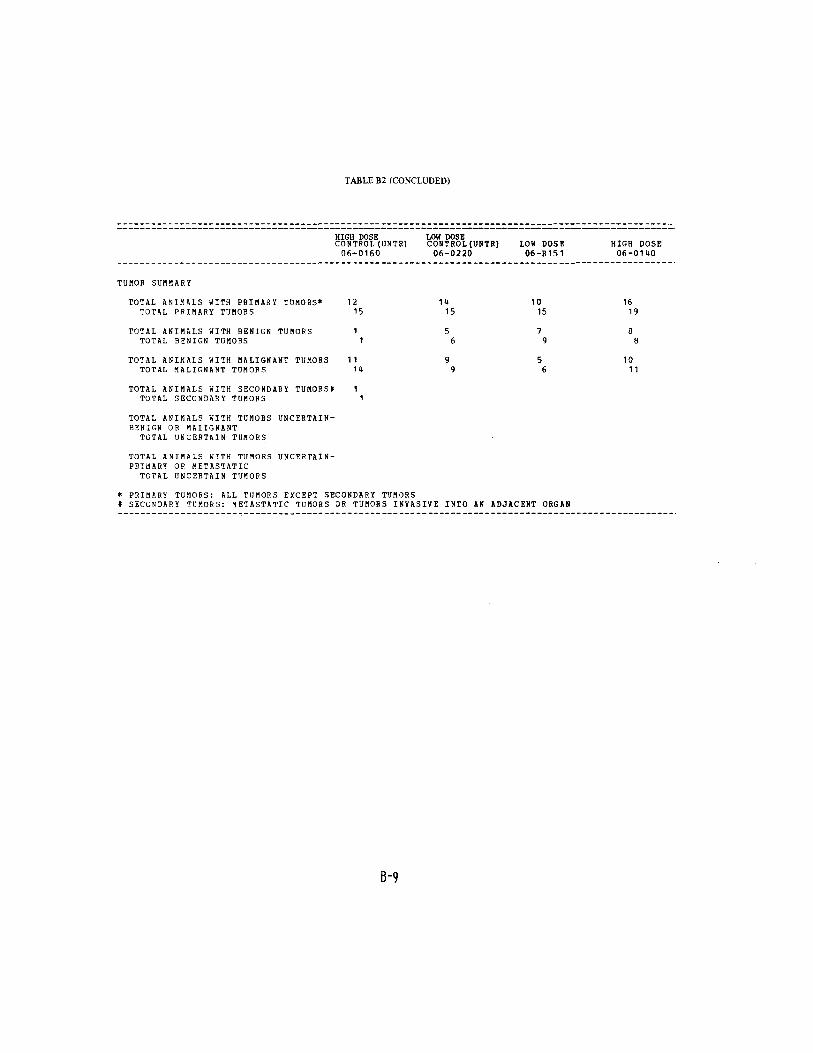
TABLE B2 (CONCLUDED)
HIGH DOSE LOU DOSE C O N T R O L ( U N T R ) C O N T R O L ( U N T 8 ) LOW DOSE HIGH DOSE
06-0160 06-0220 06-R151 06-01HO
T U M O R S U M M A R Y
TOTAL A N I M A L S W I T H P R I M A B Y TUMORS* 12 1U 10 16 T O T A L P R I M A R Y T U M O R S 15 15 15 19
TOTAL ANIMALS WITH BENIGN TUMORS TOTAL BENIGN TUMOHS
TOTAL ANIMAIS WITH MALIGNANT TUMORS 1 1 10 TOTAL MALIGNANT TUMORS 11* 11
TOTAL ANIMALS WITH SECONDARY TUMORS* 1TOTAL SECONDARY TUMORS 1
TOTAL ANIMALS KITH TUMORS UNCERTAINBENIGN OR MAIIGNANT
TOTAL UNCERTAIN TUMORS
TOTAL ANIMAIS WITH TUMORS UNCERTAINPRIMARY OR METASTATIC
TOTAL UNCERTAIN TUMORS
* PRIMARY TUMORS: ALL TUMORS EXCEPT SECONDARY TUMORS * SECONDARY TUMORS: METASTATIC TUMORS OR TUMORS INVASIVE INTO AN ADJACENT ORGAN
B-9


APPENDIX C
SUMMARY OF THE INCIDENCE OF NONNEOPLASTIC LESIONS IN RATS TREATED WITH FENAMINOSULF


ANIMALS INITIALLY IN STODY ANIMALS NECROPSIED ANIMALS EXAMINED HISTOPATHO LOGICALLY**
INTEGUMENTARY SYSTEM
*SKIN EPIDERMAL INCLUSION CYST INFLAMMATION, SUPPUHATIVE
RESPIRATORY SYSTEM
ILONG CONGESTION, CHRONIC PASSIVE INFLAMMATION, INTERSTITIAL FIBROSIS, DIFFUSE HYPERPLASIA, NOS HYPERPLASIA, EPITHELIAL HYPERPLASIA, ALVEOLAR EPITHELIUM
iLUNG/ALVEOLI HEMOBRHAGE
HEMATOPOIETIC SYSTEM
tSPLEEN FIBROSIS HEMOSIDEROSIS HEMATOPOIESIS
tLYMPH NODE INFLAMMATION, NOS
*MANDIBULAR L. NODE HYPERPLASIA, PLASMA CELL
tMESENTERIC L. NODE HYPERPLASIA.,. PLASMA CELL
TABLE Cl
I:ONTROL (UNTR) 01-0160
50 50 50
(50)
1 (2%)
(49) 1 (2«) U (8%) 1 (2X) 1 (2%)
1 <2*>
(19) 1 (2X)
(50) 1 (2%) 2 (4X)
(49)
(49) 1 (2%)
(49) 1 12%) .
LOW DOSE HIGH DOSE 01-R150 01-0140
50 50 M3 49 41 48
(43) (49) 1 (2X) 1 (2%)
(41) (48)
2 (5%) 1 (2«)
2 (5%) 1 (2X)
(41) (48)
(41) (48)
2 (4X) 1 (2*)
(34) (47) 1 (2X)
(34) (47)
(34) (47) __
* N U M B E R O F A N I M A L S W I T H TISSUE E X A M I N E D M I C R O S C O P I C A L L Y * N U M B E R OF A N I M A L S NECROPSIED **EXCLUDES PARTIALLY AUTOLYZED ANIMALS
C-3

CIRCULATORY SYSTEM
*MYOCARDIUM INFLAMMATION, INTERSTITIAL FIBROSIS DEGENERATION, NOS
DIGESTIVE SYSTEM
tSALIVARY GLAND HYPERTROPHY, FOCAL HYPERPLASIA, INTRADUCTAL
OLIVER INFLAMMATION, CHRONIC FOCAL NECROSIS, FOCAL METAMORPHOSIS FATTY HYPERPLASIA, FOCAL
#LIVER/CENTRILOBULAH CONGESTION, PASSIVE
*BILE DUCT HYPERPLASIA, NOS
*PANCREAS INFLAMMATION, NOS INFLAMMATION, CHROHIC FOCAL
tPANCREATIC ACINUS STROPHY, NOS
ISTOMACH HYPERKERATCSIS ACANTHOSIS
*PEYERS PATCH HYPEBPLASIA, NOS
•JEJUNUM METAPLASIA, OSSEOUS
*COLON PARASITISM
TABLE Cl (CONTINUED)
CONTROL (UNTR) LOW DOSE HIGH DOSE 01-0160 01-8150 01-0140
(48) (40) (48) 1 (2«) 2 (4%) 1 (2*)
(50) (38) (46) 1 <3X)
1 (2%)
(49) (41) (48) 1 (296) 3 (6%) 1 (2%)
1 (2%) 2 (4X) 1 (2%) 4 (10X) 5 (10X)
(49) (41) (48) 1(2%)
(50) (43) (49) 2 (4%) 2 (4X)
(47) (40) (47) 2 (4%) 2 (4X) 1 (2%)
(47) (40) (47) 1 <2X)
(49) (40) (46) 1 (2%) 1 (2%) 1 (3X)
(49) 1(2%)
(36) (47) 2 <4»)
(49) (36) (47) 1 (3X)
(48) (30) (43) . 2.J5X1
# NUMBER OF ANIMALS WITH TISSUE EXAHINED MICROSCOPICALLY * NUMBER OF ANIMALS NECRCPSIED
04
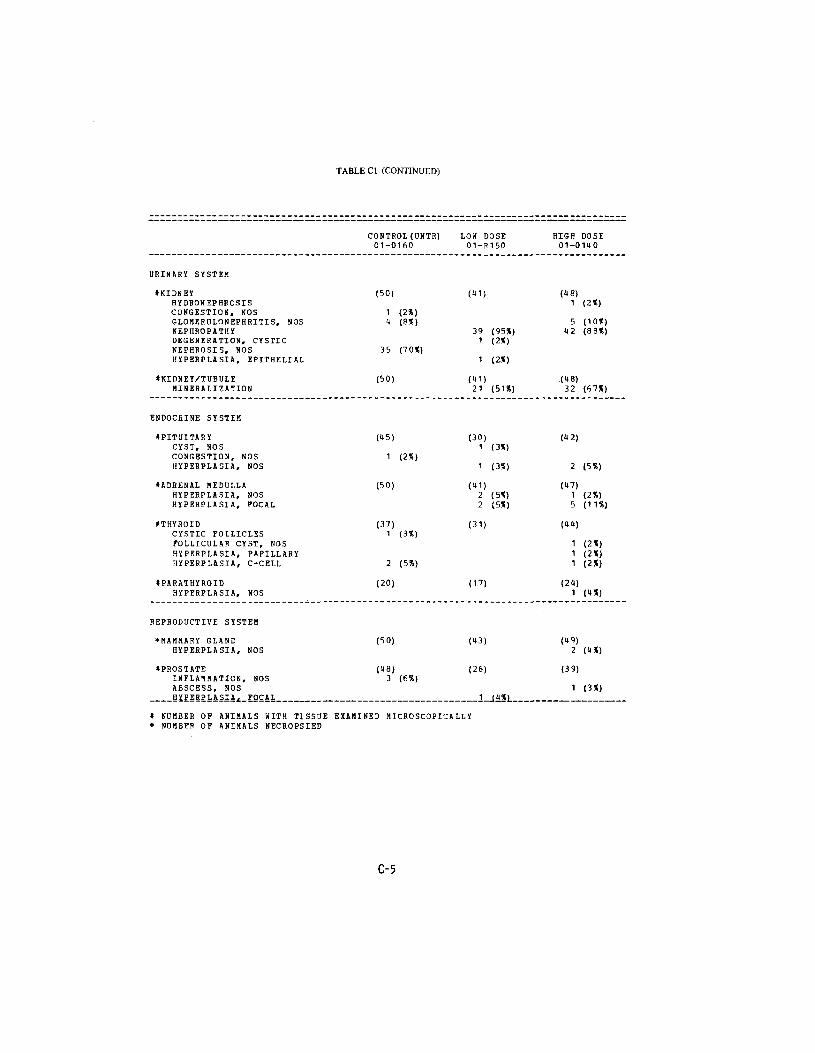
TABLECl (CONTINUED)
CONTROL (UNTR) LOW DOSE 01-0160 01-R150
URINARY SYSTEM
tKIDNEY (50) (1*1) HYDRONEPHROSIS CONGESTION, NOS 1 (2X) 6LOMEHOLONEPHRITIS, NOS U (8X) NEPHROPATHY 39 (95X) DEGENERATION. CYSTIC 1 (2*) NEPHROSIS, NOS 35 (70X) HYPERPLASIA, EPITHELIAL 1 (2X)
*KIDNEY/TUBULE (50) (11) MINERALIZATION 21 (51)8)
ENDOCRINE SYSTEM
*PITUITARY (H5) (30) CYST, NOS 1 (3X) CONGESTION, NOS 1 (2X) HYPERPIASIA, NOS 1 (3%)
*ADHENAL MEDULLA (50) (11) HYPERPLASIA, NOS 2 (5X) HYPERPLASIA, FOCAL 2 (55!)
*THYHOID (37) (31) CYSTIC FOLLICLES 1 (3*) FOLLICULAR CYST, NOS HYPERPLASIA, PAPILLARY HYPERPLASIA, C-CELL 2 (5*)
•PARATHYROID (20) (17) HYPERPLASIA, NOS
REPRODUCTIVE SYSTEM
*MAMMARY GLAND (50) (13) HYPERPLASIA, NOS
tPROSTATE (48) (26) INFLAMMATION, NOS 3 (6X) ABSCESS, NOS HYPERPLASIA. FOCAL. __ __ . _ 1 J4S1
t NUMBER OF ANIMALS WITH TISSUE EXAMINED MICROSCOPICALLY * NUMBER OF ANIMALS NECHOPSIED
C-5
HIGH DOSE 01-011(0
(48) 1 (2%)
5 (10*) 42 (88X)
(48) 32 (67X)
(42)
2 (5X)
(47) 1 (2%) 5 (11S)
(44)
1 (2*) 1 (2X) 1 (2X)
(24) 1 (4X)
(49) 2 (IX)
(39)
1 <3X)

TABLE Cl (CONCLUDED)
CONTROL (UNTE) LOW DOSE HIGH DOSE 01-0160 01-R150 01-0140
ItTESTIS (SO) (U1) (17) PERIVASCIUITIS 1 (2%) CALCIFICATION, NOS 3 (6«) CALCIFICATION, FOCAL 1 (2%) ATROPHY, NOS 11 (22%) 4 (10%) 9 (19X) HYPERPLASIA, INTERSTITIAL CELL 4 (8%) 5 (11*)
tTESTIS/TUBULE (SO) • (41) (U7) HINERALIZATION 3 (7X)
NERVOUS SYSTEM
NONE
SPECIAL SENS" ORGANS
*EYE/RETINA (SO) (43) (49) DEGENERATION, NOS 1(2%)
MUSCDLOSKELETAL SYSTEM
NONE
BODY C A V I T I E S
* P L E U R A ( S O ) (43) (49) F I B R O S I S , D I F F U S E 1 ( 2 % )
A L L O T H E R S Y S T E M S
O M E N T t l M NECROSIS, FAT 1 1
SPECIAL MORPHOLOGY S U M M A R Y
NO LESION REPORTED 1 AUTO/NECROPSY/NO HISTO 2 1 AUTOLYSIS/NO NECROPSY 7 1
» NUMBER OF ANIMALS WITH TISSUE EXAMINED MICROSCOPICALLY * NUMBER OP ANIMALS NSCHOPSIED
C-6
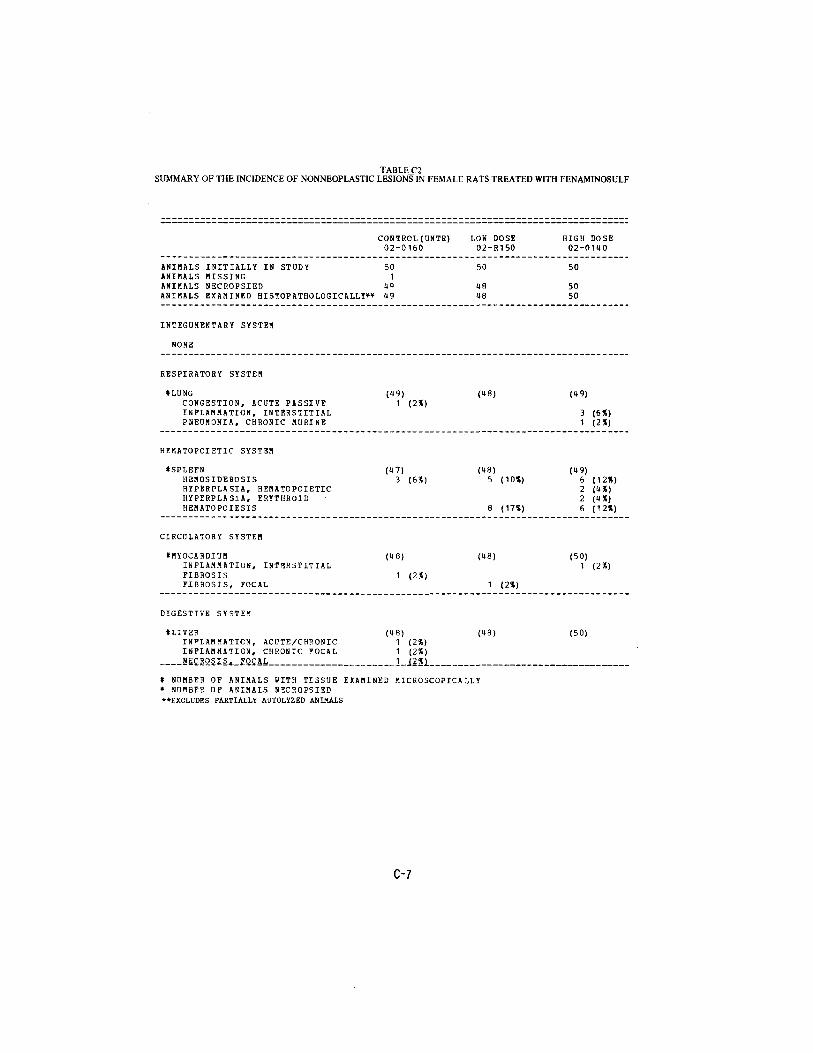
TABLE_C2 SUMMARY OF THE INCIDENCE OF NONNEOPLASTIC LESIONS IN FEMALE RATS TREATED WITH FENAMINOSULF
CONTROL(UNTB) LOW DOSE HIGH DOSE 02-0160 02-R150 02-01<10
ANIMALS INITIALLY IN STUDY 50 50 50 ANIMALS MISSING 1ANIMALS NECEOPSIED U1 K8 50 ANIMALS EXAMINED HISTOPATHOLOGICALLY** 19 48 50
INTEGUMENTARY SYSTEM
NONE
RESPIRATORY SYSTEM
ILUNG (U9) (18) («9) CONGESTION, ACUTE PASSIVE 1 (2*) INFLAMMATION, INTERSTITIAL 3 (6X) PNEUMONIA, CHEONIC MURINE 1 (2S)
HEMATOPOIETIC SYSTEM
*SPLEEN (U7) C*8) (1*9) HEHOSIDEROSIS 3 (6%) 5 (10*) 6 (12*) HYPEHPLASIA, HEMATOPOIETIC 2 (US) HYPEEPLASIA, EEYTHHOID 2 (KX) HEMATOPOIESIS 8 (17X) 6 (12X)
CIRCULATORY SYSTEM
IMYOCARDIUM (M8) (1*8) (SO) INFLAMMATION, INTERSTITIAL 1 (2%)FIBROSIS 1 (2%) FIBROSIS, FOCAL 1 (2*)
DIGESTIVE SYSTEM
fLIVEE («8) (1(8) (50) INFLAMMATION, ACUTE/CHRONIC 1 (2%)INFLAMMATION, CHEONIC FOCAL 1 (2X)
» N U M B E R O F A N I M A L S W I T H TISSUE E X A M I N E D MICEOSCOPICA L L Y * N U M B E R OF A N I M A L S N E C R O P S I E D "EXCLUDES PARTIALLY AUTOLYZED ANIMALS
C-7

TABLE C2 (CONTINUED)
CONTROL (ONTR) LOH DOSE HIGH DOSE 02-0160 02-R150 02-0140
NECROSIS, COAGULATIVE 1 (2X) METAMORPHOSIS FATTY BASOPHILIC CYTO CHANGE
12 (2X) (»%)
39 (6X) (19X)
217
(1%) (34%)
HYPERPLASIA, FOCAL ANGIECTASIS
1 (2%) 1 (8X) 10 (20%)2 (4X)
HEKATOPOIESIS 1 <2X)
*BILE DUCT HYPERPLASIA, NOS
(119) 2 (4%)
(18) (50) 2 (4X)
HYPERPLASIA, FOCAL 1 (2X)
tPANCREAS INFLAMMATION, NOS
(l»8) (16) (47) 1 (2«)
•STOMACH (19) (15) (47) INFLAMMATION, NOS 1 (2*) ACANTHOSIS 1 (2X) 1 (2X)
*GASTRIC SUBMUCOSA (19) (15) (17) EDEMA, NOS 1 (2%)
tPEYEES PATCH HYPERPLASIA, NOS
(19) 2 (4«)
(16) (48) 3 (6X)
#COLON (19) (15) (42) PARASITISM 1 (2X) 1 <2X)
URINABY SYSTEM
tKIDNEY (18) (18) (49) HYDPONEPHROSIS 1 (2X) CYST, NOS GLOMEPULONIPHRITIS, NOS * (8%)
1 (2X) 3 (6X)
NEPHROPATHY UU (92X) 35 (71X) NEPHROSIS, NOS 29 (60%)
tKIDNEY/CORTEX METAMORPHOSIS FATTY
(18) 1 (2%)
(1«) (49)
tKIDNEY/TUBULE MINERALIZATION
(18) (18) 31 (71X)
(49) 12 (24X)
ENDOCRINE SYSTEM
*ADSENAL MEDULLA (19) (16) (46) HYPERPLASIA, FOCAL 1 19S) _ . 1 12X1 _ _.
# NUMBER OF ANIMALS WITH TISSUE EXAMINED MICROSCOPICALLY * NUMBER OF ANIMALS NECROPSIED
C-8

*THYBOID HYPEEPLASIA, C-CFLL
*PARATHYROID HYPERPLASIA, NOS
tPANCREATIC ISLETS HYPERPLASIA, NOS
REPRODUCTIVE SYSTEM
*MABMARY GLAND DILATATION/DUCTS GALACTOCELE HYPERPLASIA, NOS
*MAMMARY DUCT HYPEHPLASIA, CYSTIC
*UTERUS HYDROtlETRA HEMATOMA, NOS ABSCESS, NOS POLYP, INFLAMMATORY
•OVARY INFLAMMATION, CHRONIC
NERVOUS SYSTEM
NONE
SPECIAL SENSF ORGANS
*LENS CAPSULE CALCIFICATION, NOS
MUSCULOSKELETAL SYSTEM
NONE
BODY CAVITIES
NONE
TABLE C2 (CONTINUED)
CONTROL (UNTR) 02-0160
(45) 2 (4%)
(27)
(48)
(49) 1 (2%)
(49) 1 (2%)
(46) 1 (2%) 1 (2*)
1 (2%)
(47) 1 (2%)
(49) 1 (2«)
LOW DOSE HIGH DOSE 02-R150 02-0140
(U6) (49) 2 (4*) 3 (6%)
(21) (35) 1 (5S)
(46) (47) 1 (2%) 1 (2%)
(48) (50)
3 (6X) 5 (10%) 1 (2%)
(48) (50)
(48) (47)
1 (2«)
(48) (49)
(48) (50)
# NUHBER OF ANIMALS WITH TISSUE EXAMINED MICROSCOPICALLY * NUMBER OF ANIMALS NECROPSIED
C-9

TABLE C2 (CONCLUDED)
C O N T R O L ( U N T R ) L O W DOSE H I G H D O S E 02-0160 02-8150 02-0110
A L L O T H E R S Y S T E M S
O M E N T U M NECROSIS, NOS
CRANIOBUCCAL POOCH CYST, NOS
SPECIAL MORPHOLOGY SUMMARY
NO LESION REPORTED 2 1ANIMAL HISSING/NO NECROPSY 1AUTOLYSIS/NO NECROPSY 2
* NUMBER OF ANIMALS WITH TISSUE EXAMINED MICROSCOPICALLY * NUMBER OF ANIMALS NECROPSIED
C-IO

APPENDIX D
SUMMARY OF THE INCIDENCE OF NONNEOPLASTIC LESIONS IN MICE TREATED WITH FENAMINOSULF


JABLE Dl
CONTROL (DKTR) LOU DOSE HIGH DOSE 05-0160 05-01110 05-0150
ANIMALS INITIALLY IS STUDY 50 50 50 ANIMALS MISSING 1ANIMALS NECEOPSIED 50 44 22 ANIMALS EXAMINED HISTOPATHOLOGICALLY ** 49 44 22
INTEGUMENTARY SYSTEM
*SCIBCUT TISSUE (50) (44) (22) HEMATOMA, NOS 1 (2X) INFLAMMATION, ACUTE FOCAL 1 (2%) ABSCESS, NOS 1 (2X)
RESPIRATORY SYSTEM
ILDNG/BRONCHUS (17) (1)3) (22) INFLAMHATION, NOS 1 (2%)
*LUNG (47) (43) (22) INFLAMMATION, INTERSTITIAL
HEMATOPOIETIC SYSTEM
tSPLEEN (49) (43) (20) HYPEHPLASIA, HEMATOPOISTIC 1 (2%) HEMATOPOIESIS EHYTHSOPOIESIS 2 (4%)
iMESENTESIC L. NODE (40) (40) (14) INFLAMMATION, NOS 2 (5%) HEMATOPOIESIS
#RENAL LYMPH NODE (40) (40) (14) HYPERPLASIA, NOS 2 (5%)
CIRCULATORY SYSTEM
NONE
i N U M B E R O F A N I M A L S W I T H TISSUE E X A M I N E D M I C R O S C O P I C A L L Y * N U M B F . R OP A N I M A L S N E C H O P S I E D **EXCLUDES PARTIALLY AUTOLYZED ANIMALS
D-3

TABLE Dl (CONTINUED)
C O N T R O L ( U N T R ) L O W D O S E HIGH DOSE 05-0160 0 5 - 0 1 U O 05-0150
D I G E S T I V E S Y S T E M
(1*9) (i*H) (22) ABSCESS, NOS NECROSIS, FOCAL NECROSIS, COAGULATIVE METAMORPHOSIS FATTY 1 (2X) HYPERPLASTIC NODULE 1 (2*) HYP2BPLASIA, FOCAL 1 (551) ANGIECTASIS 1 (2%) HEMATOPOIESIS
tLIVER/KUPFFER CELL (1*9) (22) HYPEHPLASIA, NOS 1 (2%)
*GALLBLADDER (50) (UK) (22) INFLAMMATION, NOS 2 (5%)
IPANCBEAS (K6) (1*2) (18) CYSTIC DUCTS 1 (2%) INFLAMMATION, NOS 1 (6X) PliBIVASCTHITIS 1 (2%) DEGENERATION, CYSTIC 1 (6X) NECROSIS, FAT 1 (2%)
(•PANCREATIC ACINUS (U6) (K2) (18) DEGENERATION, NOS 1 (2%)ATEOPHY, NOS HYPERTROPHY, NOS HYPERTROPHY, FOCAL
#STOMACH (K9) (19) INFLAMMATION, NOS ACANTHOSIS
*PEY£RS PATCH (H9) (19) INFLAMMATION, ACUTE 1 (2%) HYPERPLASIA, LYMPHOID 1 (2%)
*COLON (1*8) (1*0) (18) PARASITISM 1 (3%)
URINARY SYSTEM
tKIDNEY (1*9) (UU) (21) ____ HYDRONEPHEOSIS
i NUMBER OF ANIMALS WITH TISSUE EXAMINED MICROSCOPICALLY * NUMBER 3F ANIMALS NECBOPSIED
D-4

TABLE Dl (CONTINUED)
HIGH DOSE 05-0160 0 5 - 0 1 U O 05-0150
C O N T R O L ( D N T R ) L O W D O S E
I N F L A M M A T I O N , N O S 2 (10%) I N F L A M M A T I O N , S U P P U R A T I V E 1 (2%) I N F L A M M A T I O N , C H R O N I C 1 (2%)N E P H B O P A T H Y 3 (14*)
# K I D N E Y / T U B U L E (49) (44) (21) M I N E R A L I Z A T I O N 1 (5X)
ENDOCRINE SYSTEM
*ADRENAL (47) (38) (21) NECROSIS, NOS CALCIFICATION, NOS
ITHYROID (42) (39) (14) INFLAMMATION, NOS 1 (3X) INFLAMMATION, FOCAL 1 (3%) HYPEBPLASIA, FOCAL 1 (2%)
*PANCREATIC ISLETS (46) (42) (18) INFLAMMATION, NOS HYPEBPLASIA, ADENOHATOUS
BEPRODUCTIVE SYSTEM
*PREPUTIAL GLAND (50) (44) (22) DILATATION, NOS 1 (2%) INFLAMMATION, NOS 1 (2%)
*TESIIS (49) (44) (22) MINERALIZATION 1 (5S) DEGENERATION, NOS 1 (2%) ATROPHY, NOS
tTESTIS/TUBULE (49) (44) (22)MINERALIZATION NECROSIS, FOCAL 1 (2%)
NERVOUS SYSTEM
NONE
SPECIAL SENSE ORGANS
NONE
* NUMBER OF ANIMALS WITH TISSUE EXAMINED MICROSCOPICALLY * NUMBER OF ANIMALS NECROPSIED
D-5

TABLE Dl (CONCLUDED)
C O N T R O L ( U N T R ) L O W DOSE HIGH DOSE 05-0160 05-01KO 05-0150
MUSCULOSKELETAL SYSTEM
NONE
BODY CSVITIES
*ABDOMINAL CAVITY (50) («U) (22) ADHESION, NOS 1 (2*)
*MESENTERY (50) (It) (22) STEATITIS 1 (2%) ABSCESS, NOS 1 (2%)
ALL OTHER SYSTEMS
ADIPOSE TISSUE STEATITIS 1NECROSIS, FAT 2
SPECIAL MORPHOLOGY SUMMARY
NO LESION REPORTED 17 18 9A NIMAL MISSING/NO NECROPSY 1NO NECROPSY PERFORMED 19 AUTO/NECROPSY/HISTO PEBF 1 2AOTO/NECROESY/NO HISTO 1AU70LYSIVNO NECROPSY 5 9
* NUMBER OF ANIMALS WITH TISSUE EXAMINED MICROSCOPICALLY * NUMBER OP ANIMALS NECSOPSIFD
D-6

TABLE D2
SUMMARY OF THE INCIDENCE OF NONNEOPLASTIC LESIONS IN FEMALE MICE TREATED WITH FENAMINOSULF
HIGH DOSE CONTROL(UNTR) 06-0160
LOW DOSE C O N T R O L ( U N T R )
06-0220 L O W
06 D O S E
R151 H I G H
0 6 - 0 DOSE
1 U O
ANIMALS INITIAllY IN STUDY 50 ANIMALS MISSING ANIMALS NECROPSIED 50 ANIMALS EXAMINED HISTOPATHOLOGICALLY** 50
50 2
U7 U7
50 2
143 3B
350 1
12 39
INTEGUMENTARY SYSTEM
*SUBCUT TISSUE (50) ( U 7 ) (U3) ( U 2 ) MINERALIZATION 1 (2%) INFLAMMATION, NOS 1 (2%) NECROSIS, NOS 1 (2%)
RESPIRATORY SYSTEM
ILUNG (50) (U6) (39) (39) INFLAMMATION, INTERSTITIAL 1 (3X)
HEMATOPOIETIC SYSTEM
ISPLEEN ( U 9 ) ( U 5 ) (38) ( 3 8 ) HYPERPLASIA, LYMPHOID 1 (2%) HEMATOPOIESIS 1 (2%) 7 (18%) 5 ( 1 3 % ) ERYTHROPOIHSIS 1 (2%)
*MANDIBULAR L. NODE (UO) (38) (29) (35) HYPERPLASIA, PLASMA CELL 1 (3%)
tMEDIASTINAL L.NODE (38) (29) (35) HYPERPLASIA, NOS 1 (3%)
*LUMBAR LYMPH NODE (UO) (38) (29) (35) HYPERPLASIA, NOS 1 (3%)
fMESENTERIC L. NODE (UO) (38) (29) (35) INFLAMMATION, NOS 1 (3%) HEMATOPOIESIS 1 (3%)
»RENAL LYMPH NODE (UO) (38) (29) (35) HYPERPLASIA^. NOS
* N U M B E R O F A N I M A L S W I T H T I S S U E E X A M I N E D M I C R O S C O P I C A L L Y * N U M B E R OF A N I M A L S N E C R O P S I E D "EXCLUDES PARTIALLY AUTOLYZED ANIMALS
5) 50 A N I M A L S W E R E I N I T I A L L Y IN THS S T U D Y BUT ONE A N I M A L WAS F O U N D TO BE A M A L E IN A F E M A L E G R O U P .
D-7

HYPERPLASIA, PLASMA CELL
CIRCULATORY SYSTEM
(•CARDIOVASCULAR SYSTE PERIVASCHLITIS
tMYOCARDIUM INFLAMMATION, ACUTE DIFFUSE
DIGESTIVE SYSTEM
#LIVER NECROSIS, NOS NECROSIS, FOCAL INFARCT, NOS METAMORPHOSIS FATTY HYPERPLASIA, FOCAL HEMATOPOIESIS
*BILE DUCT INFLAMMATION, CHRONIC FOCAL
(•PANCREAS DILATATION/DUCTS
•PANCREATIC ACINUS HYPERTROPHY, FOCAL
'STOMACH INFLAMMATION, ACUTE FOCAL INFLAMMATION, CHRONIC
tPEYERS PATCH HYPERPLASIA, LYMPHOID
*COLON NEM.ATODIASIS
URINAEY SYSTEM
ttKIDNFY GLOMERULONEPHRITISt NOS
* NUMBER OF ANIMALS WITH TISSUE * NUMBER OF ANIMALS NECEOPSIED
TABLE D2 (CONTINUED)
HIGH DOSE LOW DOSE CONTROL (UNTB) CONTROL (UNTH) 06-0160 06-0220
1 <3X)
(50) (17)
(50) (15) 1 (2X)
(19) (16) 1 (2X) 1 (2X) 1 (2«)
1 (2%}
(50) (17) 2 (IX)
(17) (45)
(17) (15)
(19) (16) 1 (2X) 1 (2%)
(19) (44) 1 (2X)
(50) (42) 1 (2)8)
(19) (46) 1 12X1.
EXAMINED MICROSCOPICALLY
D-8
LOW DOSE 06-R151
(M3) 1 (2%)
(39)
(36)
1 (3X)
2 ((,%)1 (3%)
(43)
(31)
(31) 1 (3%)
(31)
(34)
(27)
(39) 2 15%).
HIGH DOSE 06-0110
(42)
(39)
(37)
1 (3X) 1 (3X)
(12)
(38) 1 (3*)
(38)
(36)
(37)
(35)
(39) 1 13X1
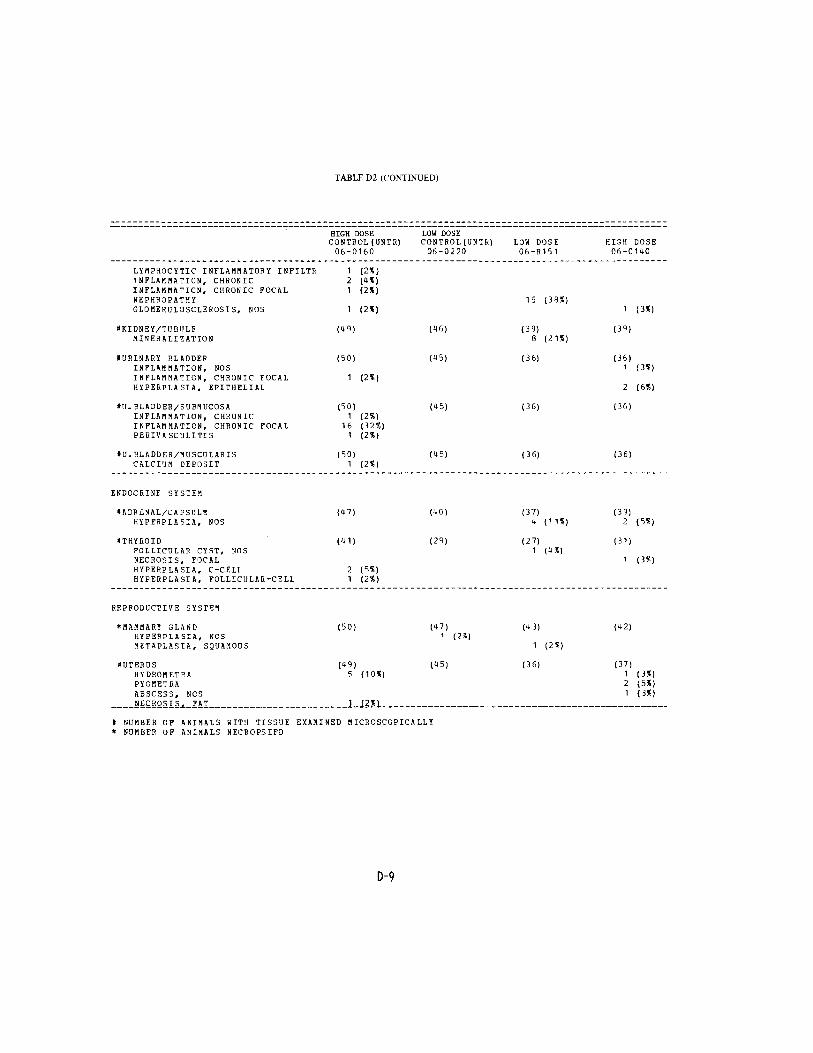
TABLE D2 (CONTINUED)
HIGH DOSE CONTROL (UNTR) 06-0160
LOW DOSE CONTROL(UNTR) 06-0220
LOW DOSE 06-8151
HIGH DOSE 06-0140
LYMPHOCYTIC INFLAMMATORY INFILTR INFLAMMATION, CHRONIC INFLAMMATION, CHRONIC FOCAL NEPHROPATHY GLOMERULOSCLEROSIS, NOS
1 (2%) 2 {«*) 1 (2%)
1 (2%) 15 (38?)
1 (3*)
*KIDNEY/TUBt!LE MINERALIZATION
(49) (46) (39) 8 (21%) (39)
tUEINARY BLADDEE INFLAMMATION, NOS INFLAMMATION, CHRONIC FOCAL HYPEHPLASIA, EPITHELIAL
(50)
1 (2%)
(45) (36) (36) 1 (3%)
2 (6%)
tU.BLADDER/SUEMUCOSA INFLAMMATION, CHRONIC INFLAMMATION, CHRONIC FOCAL PEHIVASCOLITIS
(50) 1 (2%)
16 (32%) 1 (2*)
(45) (36) (36)
fD. BLADDER/MUSCULAR IS CALCIUM DEPOSIT
(50) 1 (2*)
(45) (36) (36)
ENDOCRINE SYSTEM
*ADR£NAL/CAPSULE HYPERPLASIA, NOS
(K7) (40) (37) 4 (11%) (39)
2 (5«)
tTHYEOID FOLLICDLAR CYST, NOS NECROSIS, FOCAL HYPERPLASIA, C-CELt HYPERPLASIA, FOLLICULAR-CELL
(41)
2 1 (5%) (2%)
(29) (27) 1 (4%) (31)
1 (3X)
REPRODUCTIVE SYSTEM
'MAMMARY GLAND HYPERPLASIA, NOS METAPLASIA, SQUAMOUS
(50) (47) 1 (2*)
(43)
1 (21)
(42)
•UTERUS HYDROMETRA PYOMETRA ABSCESS, NCS NECROSIS, FAT _ _ _
(49) 5 (105!)
._ 1 illl .
(45) (36) (37) 1 (3%) 2 <5X) 1 (3%)
* NUMBER OF ANIMALS WITH TISSUE EXAMINED MICROSCOPICALLY * NUMBER OF ANIMALS NECROPSIED
D-9

TABLE D2 (CONTINUED)
HIGH DOSE LOW DOSE C O N T R O L ( U N T B )
06-0160 C O N T R O L ( U N T R )
06-0220
CALCIFICATION, NOS 1 (2%) MiTAPLASIA, SQUAMOUS
* D T E B U S / E N D C M E T R I U ? I (09) (45) INFLAMMATION, SUPPURATIVE 2 (K%) HYPERPLASIA, NOS HYPERPLASIA, CYSTIC 32 (65%)
tOVAEY/OVIDUCT (U9) INFLAMMATION, NOS DEGENERATION, NOS 1 (2%)
• OVASY (48) (40)CYST, NOS 6 (13%) INFLABMATICN, NOS INFLAMMATION, SUPPURATIVE 1 (2%)ABSCESS, NOS INFLACHATION, CHRONIC 1 (2%)DEGENERATION, NOS
NERVOUS SYSTEM
NONE
SPECIAL SENSE ORGANS
NONE
MUSCIILOSKELFTAI SYSTEM
NONE
BODY CAVITIES
'PERITONEUM (50) (47)INFLAMMATION, NOS
ALL OTHER SYSTEMS
•MULTIPLE ORGANS (50) (47) A&YLOIDOSIS 1_J281
» NUMBER OF ANIMALS WITH TISSUE EXAMINED MICROSCOPICALLY * NU1BEH OF ANIMALS NECROPSIED
D-IO
LOH DOSE 06-R151
2 (6%)
(36)
9 (25%) 4 (11%)
(36)
(32)
3 (9%)
5 (16%)
2 (6%)
(43)
(43)
HIGH DOSE 06-0140
(37)
1 (3%) 3 (8%)
(37) 1 (3%)
(37)
1 (3%) 1 (3X) 1 (3%)
(42) 1 (2%)
(42)

TABLE D2 (CONCLUDED)
HIGH DOSE LOW DOSE C O N T R O L ( U N T H ) C O N T R O L ( U N T R ) L O W DOSE HIGH DOSE
06-0160 06-0220 06-R151 06-0140
O M E N T U M P E H I V A S C U L I T I S 1
SPECIAL MORPHOLOGY SUMMARY
NO LESION REPORTED 2 30 2 11 ANIMAL MISSING/NO NECROPSY 2 2 1NiCROPSY PERF/NO HISTO PERFORMED 2AUTO/NECROPSY/HISTO PERF 2 1AUTO/NECRCFSY/NO HISTO 3 3AUTOLY5IS/NO NECROPSY 1 5 6
* NUMBER OF ANIMALS WITH TISSUE EXAMINED MICROSCOPICALLY * NUMBER OF ANIMALS NECROPSIED
D-ll


DHEW Publication No. (NIH) 78-1351