Embed Size (px)
Citation preview

T.R. Lakshmanan
Road-Rail Intermodalism: Opportunities and Barriers
Center for Transportation Studies Boston University
September 22-23, 2005Washington, DC
Road Rail Intermodalism Workshopheld at AASHTO Building

Presentation Outline
1. Road Rail Intermodalism: Definition & Scope
2. The Emergence of Short haul Rail as a Public/Private Policy Issue
3. The Evolving Decision Contexts in Short haul Rail
4. Experience with Short Rail Corridors
5. Towards New Modals of Intermodal of Transport Service

Intermodalism represents the use of at least two modes of transport in an integrated manner, in a door-todoor transport chain.
Integrated implies: coordinated, seamless, flexible, and continuous flow
Road Rail intermodalism is used in the sense of short haul rail freight movement along a corridor or a geographically bandedarea. Freight movement is a directional flow linking major freight nodes (terminals) and has a mainline rail elementwith connecting roadways.
e.g. Alameda Corridor FAST Corridor in Washington State Mid Atlantic Rail Corridor.

- Increasing Congestion in Major Metros & Cargo Hubs
- Potential for Degradation of Transport Service Quality
- Threats to U.S. Trade Performance and Industry competitiveness
Such Corridor Projects offered as Solutions to Major Problems in the U.S. Transport System:
- New Decision Contexts for New Corridor Projects * Sustainable Transport Criteria * Financing Mosaics * Stakeholder Partnerships

Factors Underlying Transport Problems
Demand Side Factors volume expansion locations of demand quality of transport services that add production value
Supply Side Constraints slow expansion of road & related infrastructure rising congestion and degrading service
Support for Future Economic Development centers of innovation in global economy heavily weighted towards major metros and cargo hubs

US Freight Shipments
-
5,000
10,000
15,000
20,000
25,000
30,000
35,000
1998 2010 2020
International
Domestic
Total
-
5,000
10,000
15,000
20,000
25,000
30,000
1998 2010 2020
International
Domestic
Totalby tons (millions)
by value (billions $)

Industry Direct Total
Foundry products .017 .368
Forgings and stampings .026 .346
Pulp, paper and paperboard .131 .301
Non Metallic minerals .048 .362
Other fabricated metal products .075 .378
Basic chemicals 0.182 0.565
Direct and Total Export Proportions for Selected Industries

Top 10 US International Freight Gateways Ranked by Value of Shipments 2003 ($ Billion)
2003 Rank
2002 Rank Port Name Total Exports Imports
1 2 Port of Los Angeles, CA (water) 122 17 105
2 1 JFK International Airport, NY (air) 112 47 65
3 3 Port of Detroit, MI (land) 102 55 47
4 4 Port of New York and New Jersey (water)
101 24 77
5 5 Port of Long Beach, CA (water) 96 17 79
6 6 Port of Laredo, TX (land) 79 32 46
7 7 Los Angeles International Airport, CA (air)
64 33 31
8 8 Port Huron, MI (land) 62 23 40
9 9 Port of Buffalo-Niagara Falls, NY (land) 59 27 32
10 11 Chicago, IL (air) 54 21 34
Top 10 gateways 851 296 556

Quality of Transport Services (beyond reliability & speed)
- Transport Process Innovations
* Improved vehicle utilization
* JIT, quick response systems
- Transport Service Innovations
* New Supply Chains (Global sourcing, Changing markets)* Refashioning Supply Chains (Spatial concentration of inventories)
These processes and service innovations add production value and confer strategic advantage to U.S. firms

Supply Side Constraints
Over Two Decades
1. U.S: VMT has doubled, while highway mileage is up by 1%
2. Railroads Value of freight up by 50%, while available track
mileage down by 35%
3. 42 of 75 major urban areas with “undesirable congestion”
4. Congestion is concentrated at our largest ports and rail hubs, which are co-located in major urban areas

Evolving Transport Services and Regional Economic Development
Freight Operations &Regional, Global Supply
Chain Management
Warehousing &Distribution
Airfreight&
ParcelExpress
Commercial Trucking
RailroadIntermodal
Transportation
Manufacturing
Containerized OceanShipping

Knowledge &
Competence
Endowments
Communication
Infrastructure
TransportInfrastructure
Regulatory &
Policy Environment
Industry Competitiveness
& Economic Clustering
Transport Infrastructure, Competitiveness & Economic Growth

Two Major Games in the Global Economy
•Urban areas in economic competitionin the global economy competing globally.
•Centers of innovation in a knowledge-intensive global economy concentrated in a few large creative urban areas.
Implications

Short haul rail corridors are being considered as responses - e.g. a 200 FEU train per hour in each direction for a 10 hour daily window is equivalent of about 1.5 million truck moves per year by rail.
• Major investments• Tough issues of assembly of land and physical capital at desired locations• Principle beneficiaries scattered beyond urban areas• Difficulties in arriving at a consensus on solutions and• Financing among diverse affected communities.
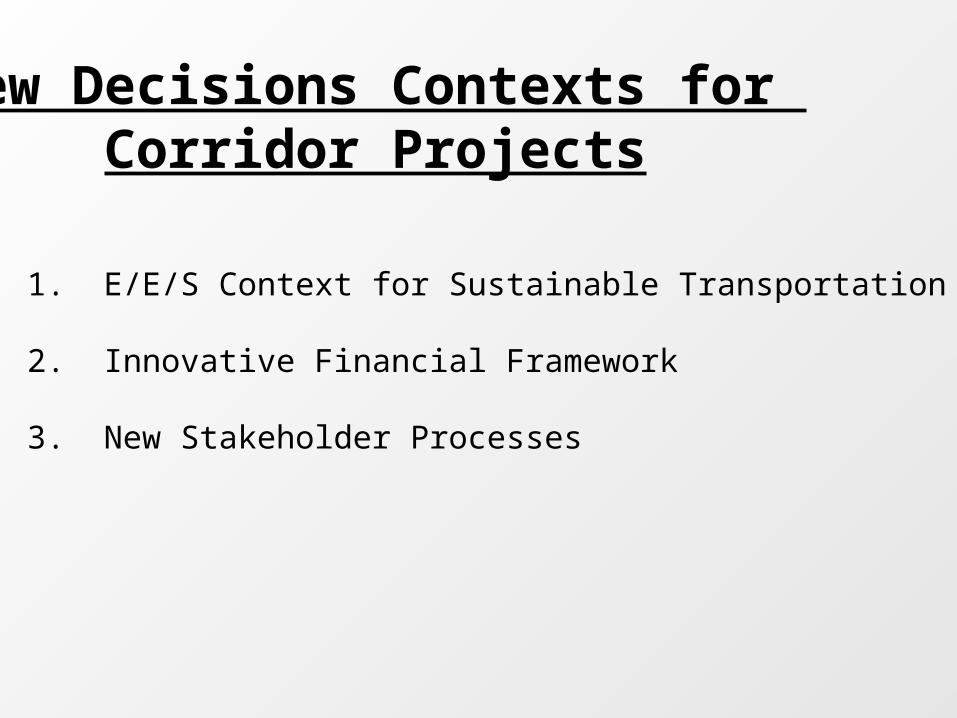
New Decisions Contexts for Corridor Projects
1. E/E/S Context for Sustainable Transportation
2. Innovative Financial Framework
3. New Stakeholder Processes

Economic Assessment

Railroads a Volume Business
A very cheap line haul cost/mile to offset very expensive terminal & dryage costs incurred in container movement)
- 55,000 main track miles abandoned (replacement at $2-5 million/track mile. major intermodal terminals - $50-75 million)
- Bring rail costs to a level to promote traffic shift from highway to short haul corridors
- Public benefits and costs

A. Highway Marginal Trucking Cost
Highway user revenues Net highway corridor costs/mile and over time
B. Other External Costs - accidents - pollutions costs - energy costs - congestion costs

Fatalities per billion ton miles.
BTU’s per ton miles.

Pounds of pollutant per ton mile

Cost Component Road/Highway Rail
Air Pollution 7.9 3.8
Congestion 5.5 0.2
Accidents 5.4 1.5
Infrastructure 2.5 2.9
Other 2.9 4.0
Total 24.2 12.4
Source: European Commission, 2002
Marginal External Cost for Road & RailEuros per 1000 tkm)

Cargo Hub Project Types
Types of Benefit Beneficiaries Selected Potential Funding Sources
Possible Funding Partners
Highways and rail access improvements to cargo hubs of national significance and international services
• Increased transportation industry productivity
• Increased reliability
• Reduced inventory cots and logistics
•National, state, and local economy
•Shippers
•Carriers
•Consumers
• Tolls and user feeds
• State/local grants or loans
• Boarders and corridor programs
•Special-purpose authority
•State and local government
•FHWA Section 1118
Rail access improvements to domestic rail cargo hubs
• Increased rail freight traffic
• Increased rail capacity and efficiency
•Rail carrier
•Port operators/owners
• Tolls
• Wharfage fees
• Railroads
•Special-purpose authority
•railroads
Cargo hub access improvements that add cargo hub expansion options and capacity and also benefit local commuters and reduce congestion in metro-politan areas
• Increased transportation capacity with diversified modal options
• Improved shipping reliability
• Reduced congestion
• Reduced delays
• Reduced vehicle emissions
•Shippers
•Commercial vehicle operators
•Auto users
•Regional economy
•Surrounding community, other highway users, and railroads
• Tolls
• Railroads
• Intermodal demonstration project
• TIFIA
• Surface transportation programs
• CMAQ
• State transportation funds
• Special-purpose authority
• FHWA
• FHWA (state and MPO)
• State government
Benefit, Beneficiaries and Potential Funding Sources For Short Haul Rail Projects
Derived from TRB, 1 NCHRP Report 497. 2003

Type of Assistance Examples Repayment Requirements/Match
Requirements
Implication of Level/ Type of Public Private Sector Commitment
Other Considerations
Private sector rant or donation Cash contribution, ROW contribution, and or in kind support (planning , design or operations commitment).
No repayment required Cash contribution implies most significant private sector commitment to project initiation and ongoing success
Level of private sector contribution is major factor in indicating importance of project to private sector firms directly involved & is an essential element in public/private partnership. Reponses to private sector needs for projects that are not part of long term area plans.
Bond financing through public credit market- specifically floated for project or TIFIA or other gov’t/public authority loans to be repaid by users
Special bond issues (e.g. Alameda Corridor)
Repayment guaranteed by private sector generally through user fees charged to user of facilities being implemented (Project finances).
Implies commitment from primary direct user groups that will pay user fees through the life of the project an significant private sector interest in ongoing operation.
Government may act as guarantor of bonds or offer tax incentives/tax free status to reduce interest rates below market level.
Local, state, and/or federal loans or bond issues
Federal loans (TIFIA), FSTED program; State Infrastructure Bank Loans, or state DOT, airport, or port authority bond issues
Repayment guaranteed by taxes: fees and/or general revenue not specifically tied to the project (I some cases may be repaid partially through user charges or tolls)
Implies significant public interest in project initiation, ongoing public sector interest restricted to financial viability; significant private sector interest in ongoing operation
Generally provides financing at lower interest rate than project specific bonds financing: repayment may be tied to certain future tax revenues or user fees (similar to revenue bonds).
Local, state and federal grants CMAQ, STP, state and local grant funding – part of most projects, different levels of national, state or local significance
No repayment required Implies significant public interest in project initiation, significant pubic interest in ongoing operation, CMAQ directly related to environment/congestion benefit
Implies significant, on-going public benefit; grant assistance especially federal , may trigger environmental review, other requirements.
Categories of Funding Assitance Related to public/Private Sector Benefits