Embed Size (px)
Citation preview

Journal of Water Resource and Protection, 2015, 7, 219-227 Published Online February 2015 in SciRes. http://www.scirp.org/journal/jwarp http://dx.doi.org/10.4236/jwarp.2015.73018
How to cite this paper: Mabika, N., Masiya, T., Utete, B., Barson, M. and Tsamba, J. (2015) Trace Metal Concentration in Two Matrices in an Urban Subtropical River. Journal of Water Resource and Protection, 7, 219-227. http://dx.doi.org/10.4236/jwarp.2015.73018
Trace Metal Concentration in Two Matrices in an Urban Subtropical River Nyasha Mabika1, Trust Masiya2, Beaven Utete3*, Maxwell Barson4, Joshua Tsamba4 1Department of Anatomy, University of Zimbabwe, Harare, Zimbabwe 2Institute of Mining Research, University of Zimbabwe, Harare, Zimbabwe 3Department of Wildlife Ecology and Conservation, Chinhoyi University of Technology, Chinhoyi, Zimbabwe 4Department of Biological Sciences, University of Zimbabwe, Harare, Zimbabwe Email: *[email protected], [email protected] Received 27 January 2015; accepted 22 February 2015; published 25 February 2015
Copyright © 2015 by authors and Scientific Research Publishing Inc. This work is licensed under the Creative Commons Attribution International License (CC BY). http://creativecommons.org/licenses/by/4.0/
Abstract This study investigates the concentration of metals namely aluminium, manganese and cobalt in two matrices: sediment and fish organs (whole muscle stomach tissue, gills, liver and kidney) in an urban river, Mukuvisi River, Zimbabwe. River bed sediments and fish samples were collected si-multaneously at five sites over seven months (September 2008-April 2009). Concentrations of aluminium, manganese and cobalt in the selected fish organs and sediment were estimated using the Flame Atomic Absorption Spectrometry (FAAS). Water limnochemical aspects, dissolved oxy-gen, pH, temperature and conductivity were measured concomitantly at each site. Aluminium had significantly higher mean concentrations and bioconcentration factors in both sediments and fish tissues relative to cobalt and manganese. Cobalt and aluminium were detected in all fish tissues, whilst manganese was not detected in muscle and liver. Significant differences in bioconcentration factors for the metals in organs of the same fish species analysed in this study show differences in metal assimilation. Metal specific river rehabilitation methods need to be applied for the future restoration of the ecological integrity of Mukuvisi River.
Keywords Metal Assimilation, Bioconcentration Factors, Pollution, Ecosystem Integrity
1. Introduction The chemistry of metals in sediments and water in rivers with respect to bio-availability to aquatic organisms
*Corresponding author.

N. Mabika et al.
220
and chemical reactivity is regulated by pH, texture, and organic matter contents, specific binding form and coupled reactivity of the metals [1]. Metals accumulate through the aquatic chain and their bioavailability is an indirect measure of potential toxicity [2]. Faced with rapid industrialization and an accelerating demotechnic growth, urban authorities deliberately discharge sewage and industrial effluent into urban streams [3]. This ef-fluent contains metals which have potential deleterious impacts on the aquatic fauna [4]. In natural freshwater ecosystems most metals are typically present in low concentrations such that any increase in the levels of bio- available metals in the sediment and water phases may lead to an increase in the bioaccumulation of the metals in tissues of aquatic organisms [5] [6].
Among the aquatic fauna, fish are most susceptible to heavy metal toxicants and are thus more vulnerable to heavy metal contamination than any other aquatic fauna [3]. When fish are exposed to elevated concentrations of metals in a polluted aquatic ecosystem, they tend to absorb these metals directly from their environments [7] [8]. After uptake, the metals are transported by the blood, where they are usually bound to proteins and brought into contact with the tissues and consequently accumulate in different tissues [9] [10]. The accumulated heavy metals may ultimately reach concentrations hundreds or thousands of times above those measured in the water, sediment and food [11].
The Mukuvisi River, drain the greater part of the city of Harare, the most industrialized and urbanized city in Zimbabwe [12]. As a result, the river displays a gradient in pollution as most of the urban, agricultural and in-dustrial run off uploads into it before it uploads into Lake Chivero Because of the threat of water pollution, sev-eral studies to monitor the water quality of Mukuvisi River have been done. However, most of these studies have focused on monitoring of the river integrity using resident aquatic organisms particularly macroinverte-brates [13] [14], selected water quality parameters [15]-[18], metazoan fish parasites [19] and selected heavy metals [20], largely neglecting the essential and trace metal elements like manganese, aluminium and cobalt analysed in this study. The main objectives of this study were to investigate the concentration of aluminium, manganese and cobalt in the sediment phase and assess their potential bioavailability to the African catfish (Cla-rias gariepinus, Burchell 1822) in an urban river, Mukuvisi River, Zimbabwe.
2. Material and Methods 2.1. Sampling Sites Five sampling sites were selected along the Mukuvisi River. The Seke Road Bridge was the first site. At this site, industrial effluent (from Graniteside and City Centre) and leachate from landfills are presumed to be discharged into the river. Site 2 was the Magaba bend industry. Effluent is expected to be discharged from the informal in-dustry in the Magaba area into the river. Site 3 was Glen Norah where most of the effluent from the Southert on industry is discharged into the river. Site 4 was the Amalinda farm. Effluent from urban cultivation such as ferti-lizers and pesticides are leached into the river. Site 5 was pension farm where effluent from the Firle Sewage Treatment Plant is presumed to be discharged into the river. The sampled sites in the Mukuvisi River are shown in Figure 1.
2.2. Sample Collection Sediment and fish were sampled at five selected sites in the Mukuvisi River once after every two months (from September 2008 to April 2009). Sampling occurred between 1000 and 1400 hours on all occasions to minimize variation due to climate factors. Sediment samples were collected using an acid-washed polyethene corer to a depth of 3 cm. At each sampling site three replicate samples were collected at an interval distance of 15 m. The sediments were stored in sterilized polyethene bags and returned to the laboratory in sealed containers contain-ing ice packs for metal analysis. Live fish samples were collected at each site using 89 mm meshfyke nets and a DC electro fisher (Smith-Root Type IV-A). Electro fishing was done for 10 minutes at each sampling station.
2.3. Water Quality Temperature, pH, conductivity and dissolved oxygen (DO) were measured in situ. Water temperature and DO were measured using a HACH oxygen 330i meter; pH and conductivity were measured using a HACH pH meter and WTW 330i conductivity meter, respectively. Water samples were analysed in the laboratory for total and reactive phosphorus (orthophosphate), total nitrogen, nitrate and ammonia. The nutrients were measured with a

N. Mabika et al.
221
Figure 1. Location of sampling sites in the Mukuvisi River.
HACH water analysis kit (HACH DR/2010 portable data logging spectrophotometer) using filtered water sam-ples filtered through 0.45 μm Whatman GF 47 mm filters, except for total nitrogen and phosphorus analysis. The methods are described in detail in [21].
2.4. Heavy Metals in Sediments The two step acid digestion process used for the sediments is a strong digestion method and was chosen so that the total metal content could be estimated. Metals in the sediments were analysed using flame atomic absorption spectrophotometry (FAAS) [22] after acid digestion to extract the metals from the sediments. This procedure consisted of two parts:
1) Digestion: The sediments were oven-dried at 180˚C in a muffle furnace and large aggregates were broken up and then 20 ml nitric acid and 5 ml perchloric acid were added to 5 g of the oven-dried sample. The mixture was heated on a hot plate until fumes were produced and allowed to cool to room temperature.
2) Acidification: 20 ml of 50% hydrochloric acid was added to the mixture from the first digestion. The acidi-fied mixture was heated until boiling and then was cooled to room temperature. The acidified mixture was fil-tered and distilled water was added to the filtrate in a volumetric flask up to the 100 ml mark. The digested se-diments were then analysed for metal amounts in an atomic absorption spectrometer [22].
2.5. Heavy Metals in Fish Tissues In the laboratory, fish were dissected with clean autoclaved stain less teel instruments. One gram (wet weight) of gill, liver, kidney and muscle tissue of C. gariepinus was measured using an electronic balance. The tissues were placed into Petri dishes to dry at 120˚C until they reached a constant weight. Drygill, liver, kidney and muscle tissue were placed in digestion flasks to which 5 ml perchloric acid and 10 ml nitric acid were added. All acids used were of analytical grade quality. The digestion flasks were placed in an oven at 130˚C until all materials dissolved. The prepared tissue samples were analysed using flame atomic absorption spectrophotometry (FAAS).
2.6. Data Analysis Spatial differences in limnochemical aspects of the water among sites sampled in the Mukuvisi River were in-vestigated using Kruskall Wallis ANOVA at 5% level of significance respectively using Paleontological Statis-tics (PAST) software Version 190 [23]. The bioconcentration factor (BCF) was calculated after metal concentra-tions were determined for sediment and fish tissues. The BCF is defined in this study as the concentration of a metal in a fish tissue in relation to the concentration of that metal in the sediment surrounding that tissue, and was calculated using the formula [24]:
N. Mabika et al.
222
( )( )
Concentration of metal in fish organ ppmBCF
Concentration of metal in river sediments ppm=
BCF values greater than 1000 are considered high and those under 250 low. Those between these extremes are classified as moderate. Differences in bioconcentration factors were assessed using the Kruskall Anova at 5% significance level.
Canonical correspondence of the metal concentration in the sediment and fish tissue to water limnochemistry was analysed using CANOCCO 5 [25].
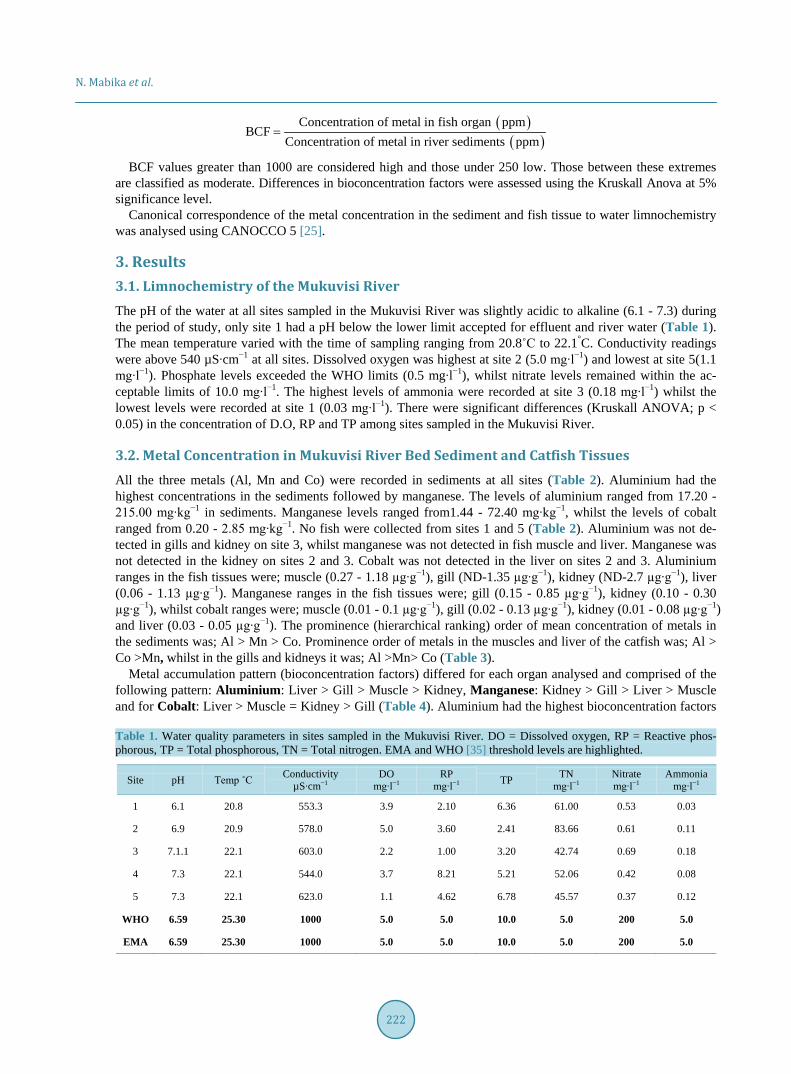
3. Results 3.1. Limnochemistry of the Mukuvisi River The pH of the water at all sites sampled in the Mukuvisi River was slightly acidic to alkaline (6.1 - 7.3) during the period of study, only site 1 had a pH below the lower limit accepted for effluent and river water (Table 1). The mean temperature varied with the time of sampling ranging from 20.8˚C to 22.1°C. Conductivity readings were above 540 µS∙cm−1 at all sites. Dissolved oxygen was highest at site 2 (5.0 mg∙l−1) and lowest at site 5(1.1 mg∙l−1). Phosphate levels exceeded the WHO limits (0.5 mg∙l−1), whilst nitrate levels remained within the ac-ceptable limits of 10.0 mg∙l−1. The highest levels of ammonia were recorded at site 3 (0.18 mg∙l−1) whilst the lowest levels were recorded at site 1 (0.03 mg∙l−1). There were significant differences (Kruskall ANOVA; p < 0.05) in the concentration of D.O, RP and TP among sites sampled in the Mukuvisi River.
3.2. Metal Concentration in Mukuvisi River Bed Sediment and Catfish Tissues All the three metals (Al, Mn and Co) were recorded in sediments at all sites (Table 2). Aluminium had the highest concentrations in the sediments followed by manganese. The levels of aluminium ranged from 17.20 - 215.00 mg∙kg−1 in sediments. Manganese levels ranged from1.44 - 72.40 mg∙kg−1, whilst the levels of cobalt ranged from 0.20 - 2.85 mg∙kg−1. No fish were collected from sites 1 and 5 (Table 2). Aluminium was not de-tected in gills and kidney on site 3, whilst manganese was not detected in fish muscle and liver. Manganese was not detected in the kidney on sites 2 and 3. Cobalt was not detected in the liver on sites 2 and 3. Aluminium ranges in the fish tissues were; muscle (0.27 - 1.18 µg∙g−1), gill (ND-1.35 µg∙g−1), kidney (ND-2.7 µg∙g−1), liver (0.06 - 1.13 µg∙g−1). Manganese ranges in the fish tissues were; gill (0.15 - 0.85 µg∙g−1), kidney (0.10 - 0.30 µg∙g−1), whilst cobalt ranges were; muscle (0.01 - 0.1 µg∙g−1), gill (0.02 - 0.13 µg∙g−1), kidney (0.01 - 0.08 µg∙g−1) and liver (0.03 - 0.05 µg∙g−1). The prominence (hierarchical ranking) order of mean concentration of metals in the sediments was; Al > Mn > Co. Prominence order of metals in the muscles and liver of the catfish was; Al > Co >Mn, whilst in the gills and kidneys it was; Al >Mn> Co (Table 3).
Metal accumulation pattern (bioconcentration factors) differed for each organ analysed and comprised of the following pattern: Aluminium: Liver > Gill > Muscle > Kidney, Manganese: Kidney > Gill > Liver > Muscle and for Cobalt: Liver > Muscle = Kidney > Gill (Table 4). Aluminium had the highest bioconcentration factors
Table 1. Water quality parameters in sites sampled in the Mukuvisi River. DO = Dissolved oxygen, RP = Reactive phos-phorous, TP = Total phosphorous, TN = Total nitrogen. EMA and WHO [35] threshold levels are highlighted.
Site pH Temp ˚C Conductivity µS∙cm−1
DO mg∙l−1
RP mg∙l−1 TP TN
mg∙l−1 Nitrate mg∙l−1
Ammonia mg∙l−1
1 6.1 20.8 553.3 3.9 2.10 6.36 61.00 0.53 0.03
2 6.9 20.9 578.0 5.0 3.60 2.41 83.66 0.61 0.11
3 7.1.1 22.1 603.0 2.2 1.00 3.20 42.74 0.69 0.18
4 7.3 22.1 544.0 3.7 8.21 5.21 52.06 0.42 0.08
5 7.3 22.1 623.0 1.1 4.62 6.78 45.57 0.37 0.12
WHO 6.59 25.30 1000 5.0 5.0 10.0 5.0 200 5.0
EMA 6.59 25.30 1000 5.0 5.0 10.0 5.0 200 5.0

N. Mabika et al.
223
Table 2. Ranges, mean ± SD of the concentrations of Al, Mn and Co in sediments (mg∙kg−1/ppm) and tissues (µg∙g−1/ppm) of C. gariepinus.
Metal Site Sediments Muscle Gill Kidney Liver
1 Rs (74.00 - 142.00) M (110.9 ± 27.64) No fish No fish No fish No fish
2 Rs(78.00 - 118.70) M (95.97 ± 20.91)
Rs (0.40 - 0.50) M (0.45 ± 0.05)
Rs (0.92 - 1.30) M (1.10 ± 0.19)
Rs (0.80 - 1.51) M (1.20 ± 0.39)
Rs (0.40 - 1.00) M (0.70 ± 0.30)
Al 3 Rs (62.60 - 102.00) M (84.10 ± 16.79
Rs (0.80 - 1.18) M (0.99 ± 0.19) ND ND Rs (0.06 - 0.15)
M (0.10 ± 0.04)
4 Rs (17.20 - 215.00) M(117.9-98.00)
Rs (0.27 - 0.74) M (0.50 ± 0.23)
Rs (0.39 - 1.35)) M (0.83 ± 0.48)
Rs (1.45 - 2.7) M (2.02 ± 0.63)
Rs (0.84 - 1.13) M (1.00 ± 0.15)
5 Rs (43.50 - 70.00) M (58.7 ± 13.67 No fish No fish No fish No fish
1 Rs (18.42 - 72.40) M (31.02 ± 28.96) No fish No fish No fish No fish
2 Rs (13.69 - 13.90) M (13.80 ± 0.15) ND Rs (0.43 - 0.85)
M (0.64 ± 0.21) ND ND
Mn 3 Rs (2.63 - 11.69) M (7.36 ± 3.74) ND Rs (0.25 - 0.41)
M (0.33 ± 0.08) ND ND
4 Rs (1.44 - 10.57) M (3.74 ± 4.76) ND Rs (0.15 - 0.50)
M (0.32 ± 0.17) Rs (0.10 - 0.30) M (0.14 ± 0.05) ND
5 Rs (3.47 - 6.30) M (5.25 ± 1.55) No fish No fish No fish No fish
1 Rs (0.82 - 1.78) M (1.16 ± 0.54) No fish No fish No fish No fish
2 Rs (0.50 - 2.85) M (1.29 ± 1.10)
Rs (0.01 - 0.1) M (0.05 ± 0.04)
Rs (0.06 - 0.13) M (0.09 ± 0.04)
Rs (0.03 - 0.05) M (0.04 ± 0.01) ND
Co 3 Rs (0.28 - 0.72) M (0.51 ± 0.18)
Rs (0.02 - 0.03) M (0.03 ± 0.01)
Rs (0.02 - 0.08) M (0.05 ± 0.03)
Rs (0.01 - 0.03) M (0.01 ± 0.02) ND
4 Rs (0.21 - 1.28) M (0.66 ± 0.53)
Rs (0.02 - 0.04) M (0.03 ± 0.01)
Rs (0.04 - 0.09) M (0.07 ± 0.03)
Rs (0.06 - 0.08) M (0.07 ± 0.01)
Rs (0.03 - 0.05) M (0.04 ± 0.010
5 Rs (0.20 - 0.43) M (0.33 ± 0.12) No fish No fish No fish No fish
Note: ND: not detected, Rs: ranges, M: mean.
Table 3. Summary of mean ± SD concentrations of metals in sediments (ppm or mg∙kg-1) and fish tissues (ppm or µg∙g-1).
Metal Sediment Muscle Liver Gill Kidney
Mn 12.23 ± 11.18 ND ND 0.43 ± 0.18 0.14 ± 0.00
Al 93.25 ± 23.30 0.65 ± 0.30 0.60 ± 0.46 0.64 ± 0.57 1.27 ± 0.71
Co 0.78 ± 0.42 0.04 ± 0.01 0.01 ± 0.02 0.07 ± 0.02 0.05 ± 0.03
Note: ND: Not detected.
Table 4. Bioconcentration factors of Al, Mn and Co from sediments to selected catfish tissues in Mukuvisi River.
Metal Fish organ
Muscle Liver Gill Kidney
Mn 12.23 12.23 28.44 87.36
Al 143.50 155 145.7 73.43
Co 19.5 78 11.14 19.5

N. Mabika et al.
224
in all organs of the catfish analysed except in the kidney where Mn had a significantly higher bioconcentration (Table 4). There was a significant difference (ANOVA, p < 0.05) in the bioconcentration the three metals from the sediments into the catfish stomach muscles and liver.
Canonical correspondence analyses show that there was a strong association in aluminum concentration in the kidney, liver and gill of the catfish with the levels of DO and TN in water in Mukuvisi River particularly at site 2, whilst there is a strong association of Al concentration in the catfish muscles with nitrate levels in the water at Mukuvisi site 1. The first two axes explain 87.61% of the variation in Al concentration in the catfish tissues sampled (Figure 2). A narrow angle of attachment shows that temperature; conductivity and ammonia values were closely linked in the water phase in Mukuvisi River. The correspondence analysis for manganese was not valid as the number of ND non-detectable values in the catfish tissues which were treated as missing figures or zeros exceeded the possible explanatory variables (water limnochemical parameters). Figure 3 shows that the cobalt concentration in the muscle and gill of the catfish had a strong association with the nitrate, ammonia and DO values in the Mukuvisi River. Cobalt concentration in the kidney and liver of the catfish sampled in the Mukuvisi River had a strong association with the RP values in the water. The first two axes explain only 64.13% of the variation in the concentration of Co concentration in the catfish tissues analysed in this study. A narrow angle of attachment shows that temperature, conductivity and TN values are closely related in the water phase in Mukuvisi River (Figure 3).
4. Discussion The objectives of this study were to investigate the concentration of Al, Co and Mn in two matrices: sediments and selected fish tissues of the African catfish Clarias gariepinus, Burchell 1822, in a subtropical urban river, Mukuvisi River, and assess potential bioavailability of metals to the fish. Results show Al, Co and Mn contami-nation in sediments and fish tissues. This contamination is attributed to localized pollution sources along the Mukuvisi River mainly automobile and detergent manufacturing industries which directly discharge metal laden effluent into the river [13] [20]. Al, Co and Mn concentrations in sediments were significantly higher relative to fish tissues. This is expected as sediments act both as a source and a sink for metals [26]. However, an elevated concentration of metals in sediments translates to increased potential bioavailability to resident aquatic fauna [27]. For instance, aluminium which has highest concentration in sediments among the three metals we analysed
Figure 2. Correspondence analyses of the Al concentration in catfish tissues and selected water limnochemical parameters in sites sampled in the Mukuvisi River.
-1.0 1.0
-1.0
1.0
Aluminiu
Muscle
Gill
KidneyLiver
PH
Temp
Conductv
DO
RP
TP
TN
Nitrate_
Ammonia
1
2
3
4
5

N. Mabika et al.
225
Figure 3. Correspondence analyses of the Co concentration in catfish tissues and selected water limnochemical parameters in sites sampled in the Mukuvisi River.
has a higher bioconcentration factor in all the fish tissues except in the kidneys where Mn had the highest bio-concentration factors. An increased bioavailability of a metal is not problematic as long as the lethal dose limit is not exceeded [28].
Significant differences in bioconcentration factors for the metals in organs of the same fish species analysed in this study show differences in metal assimilation. Metal assimilation in an aquatic organism corroborates closely with its specific binding form (species/fraction), chemical reactivity, and depuration [29]. Aluminium has a range of species but the most assimilated fractions by freshwater aquatic organisms are the Al2+ and Al3+ ions [30]. Speciation modelling of the assimilation and toxicity of Al to freshwater fish has been correlated to the water limnochemistry particularly the concentration of dissolved organic carbon, dissolved oxygen levels and pH [30] [31]. In this study correspondence analysis shows that Al levels in the sediment and fish tissue ma-trices is strongly associated with the concentrations of dissolved oxygen (DO), total nitrogen (TN) and nitratesin the water phase in the Mukuvisi River.
Manganese is a toxic element frequently overlooked when assessing the toxicity of sewage and industrial ef-fluents, sediments and pore waters [32] [33]. Manganese exists in different fractions but the most assimilated form is the Mn2+ ion in freshwater [32]. Several authors have correlated the rapid assimilation and acute toxicity of Mn2+ ion in freshwater organisms to stochastic shifts in pH, as well as DO concentration. In well aerated wa-ters with slightly alkaline pH (pH > 7), Mn2+ concentration is low in lotic systems due to redox equilibrium reactions that favour its conversion to the less toxic Mn (IV) fraction which is easily sequestered into insoluble Mn oxides [32] [33]. Manganese analyses show non-detectable (ND) incidences at most sites in both the sedi-ment and fish matrices in the Mukuvisi River. This could be due to the rapid conversion of the highly reactive and radical Mn2+ ion into the insoluble Mn (IV) fraction which is assimilated by aquatic organisms as it is an essential element. Hence we could not investigate the possible relation between Mn concentration in the sedi-ments and fish tissues to the levels of water limnochemistry parameters.
Elevated concentrations of Co were observed in the sediments mainly at Mukuvisi site 1 and in the liver of the catfish. The elevated concentrations of cobalt at site 1 can be attributed to the industrial effluent discharge from Graniteside Industrial Area and City Centre and leachate from adjacent landfills [20]. Cobalt is an essential met-al vital for flora and fauna as it forms the backbone of the cofactors in most vitamins. However, elevated con-centrations in aquatic systems can be detrimental to the fauna as elevated cobalt (particularly Co2+ ion) toxicity
-3 3
-33
Cobalt
Muscle GillKidney
Liver
PH
Temp
Conductv
DO
RP
TP
TN
Nitrate_
Ammonia
1
2
3
4
5

N. Mabika et al.
226
has been demonstrated to lungs, heart and skin of amphibians and fish [34]. Toxicity and assimilation of cobalt have been correlated to water pH and water hardness [34]. For our study the cobalt concentration in the sediment and the fish tissues (kidney and liver) of the catfish sampled in the Mukuvisi River had a strong association with the RP values in the water.
Results from this study demonstrate metal (Al, Co and Mn) contamination in the sediment and fish tissue ma-trices in the Mukuvisi River. Furthermore there is accumulation/bioconcentration of Al, Co and Mn in catfish tissues thus indicating their potential toxicity. In addition our analyses show that there is possible association and relation of Al and Co concentration in sediments and catfish tissues to the stochastic levels of water limno-chemical parameters in the Mukuvisi River. Although the lack of metal fraction analyses and the specific sedi-ment toxicity tests underestimate the risks associated with each metal, use of total components in the analysis of metal contamination in sediment and fish tissues provides a useful river integrity assessment option for man-agement. In future studies there is need for both single and multispecies sediment toxicity tests for any specified metal, and metal specific river rehabilitation methods need to be applied for the rehabilitation and restoration of the Mukuvisi River.
Acknowledgements The laboratory and field assistance of Elizabeth Munyoro is greatly appreciated.
References [1] Harichandan, R., Routroy, S., Mohanty, J.K. and Randa, C.R. (2013) An Assessment of Heavy Metal Contamination in
Soils of Freshwater Aquifer System and Evaluation of Ecotoxicityby Lithogenic Implications. Environmental Moni-toring Assessment, 185, 3503-3516. http://dx.doi.org/10.1007/s10661-012-2806-7
[2] Storelli, M.M., Storelli, A., Diddaabbo, R., Morano, C., Bruno, R. and Marcotrigiano, G.O. (2005) Trace Elements in Loggerhead Turtles (Caretta caretta) from the Eastern Mediterranean Sea: Overview and Evaluation. Environmental Pollution, 135, 163-170. http://dx.doi.org/10.1016/j.envpol.2004.09.005
[3] Agbozu, I.E., Ekweozor, I.K.E. and Opuene, K. (2000) Survey of Heavy Metals in the Catfish (Synodontisclarias). In-ternational Journal of Environmental Science Technology, 4, 93-97.
[4] Obire, O., Tamauro, P.C. and Wemedo, S.A. (2003) Physico-Chemical Quality of ElechiCreek in Port Harcourt, Nige-ria. Journal of Applied Science and Environmental Management, 7, 43-50.
[5] Du Preez, H.H., Van Der Merwe, M. and Van Vuren, J.H.J. (1997) Bioaccumulation of Selected Metals in African Sharptooth Catfish, Clarias gariepinus from the Lower Olifants River, Mpumalanga, South Africa. Koedoe, 40, 77-90. http://dx.doi.org/10.4102/koedoe.v40i1.265
[6] Edward, J.B., Idowu, E.O., Oso, O.R. and Ibidapo, O.R. (2013) Determination of Heavy Metals in Fish Samples, Se-diment and Water from Odo-Ayo River in Ado-Ekiti, Ekiti State, Nigeria. International Journal of Environmental Monitoring and Analysis, 1, 27-33. http://dx.doi.org/10.11648/j.ijema.20130101.14
[7] Wepener, V. (1997) Metal Ecotoxicology of the Olifants River in the Kruger National Park and the Effect Thereof of Fish Haematology. Ph.D. Dissertation, Rand Afrikaans University, South Africa.
[8] Battacharya, A. and Battacharya, S. (2007) Induction of Oxidative Stress by Arsenic in Clarias batrachus: Involve-ment of Peroxisomes. Ecotoxicology and Environmental Safety, 66, 178-187.
[9] Hogstrand, C. and Haux, C. (1991) Mini-Review: Binding and Detoxification of Heavy Metals in Lower Vertebrates with Reference to Metallothionein. Comprehensive Biochemical Physiology, 100C, 383-390.
[10] Ventura-Lima, J., Bogo, M.R. and Monserrat, J.M. (2011) Arsenic Toxicity in Mammals and Aquatic Animals: A Comparative Biochemical Approach. Ecotoxicology and Environmental Safety, 74, 211-218. http://dx.doi.org/10.1016/j.ecoenv.2010.11.002
[11] Osman, A., Wuertz, S., Mekkawyi, I., Exner, H. and Kirschbaum, F. (2007) Lead Induced Malformations in Embryos of the African Catfish Clarias gariepinus (Burchell, 1822). Environmental Toxicology, 22, 375-389. http://dx.doi.org/10.1002/tox.20272
[12] Magadza, C.H.D. (2003) Lake Chivero: A Management Case Study. Lakes & Reservoirs: Research & Management, 8, 69-81. http://dx.doi.org/10.1046/j.1320-5331.2003.00214.x
[13] Regina, N.M.M. (2012) Biological Monitoring and Pollution Assessment of the Mukuvisi River, Harare, Zimbabwe. Lakes & Reservoirs: Research & Management, 17, 73-80. http://dx.doi.org/10.1111/j.1440-1770.2012.00497.x
[14] Phiri, C. (2000) An Assessment of the Health of Two Rivers within Harare, Zimbabwe, on the Basis of Macroinverte-brate Community Structure and Selected Physicochemical Variables. African Journal of Aquatic Science, 25, 134-145.

N. Mabika et al.
227
http://dx.doi.org/10.2989/160859100780177677 [15] Mathuthu, A.S., Zaranyika, F.M. and Jonnalagadda, S.B. (1993) Monitoring of Water Quality in Upper Mukuvisi River
in Harare, Zimbabwe. Environment International, 19, 51-61. http://dx.doi.org/10.1016/0160-4120(93)90006-4 [16] Zaranyika, M.F. (1996) Sources of Levels of Pollution along Mukuvisi River: A Review. In: Moyo, N.A.G., Ed., Lake
Chivero: A Polluted Lake, University of Zimbabwe Publications, Harare, 35-42. [17] Machena, C. (1997) The Pollution and Self-Purification Capacity of the Mukuvisi River. In: Moyo, N.A.G., Ed., Lake
Chivero: A Polluted Lake, University of Zimbabwe Publishers, Harare, 75-91. [18] Moyo, N.A.G. and Worster, K. (1997) The Effects of Organic Pollution on the Mukuvisi River, Harare, Zimbabwe. In:
Moyo, N.A.G., Ed., Lake Chivero: A Polluted Lake, University of Zimbabwe Publishers, Harare, 53-63. [19] Madanire-Moyo, G. and Barson, M. (2010) Diversity of Metazoan Parasites of the African Catfish Clarias gariepinus
(Burchell, 1822) as Indicators of Pollution in a Subtropical African River System. Journal of Helminthology, 84, 216- 227. http://dx.doi.org/10.1017/S0022149X09990563
[20] Nhiwatiwa, T., Barson, M., Harrison, A.P., Utete, B. and Cooper, R.G. (2011) Metal Concentrations in Water, Sedi-ment and Sharptooth Catfish Clarias gariepinus from Three Peri-Urban Rivers in the Upper Manyame Catchment, Zimbabwe. African Journal of Aquatic Science, 36, 243-252. http://dx.doi.org/10.2989/16085914.2011.636906
[21] Faber, L., Gilcreas, F.W., Edwards, G.P. and Taras, M.J. (1960) Standard Methods for the Examination of Water and Wastewater: Including Bottom Sediments and Sludges. 11th Edition, American Public Health Association, Inc., New York.
[22] Greenberg, A.E., Connors, J.J. and Jenkin, D. (1980) Standard Methods for the Examination of Water and Wastewater. 15th Edition, American Public Health Association, Washington DC.
[23] Hammer, O., Harper, D.A.T. and Ryan, P.D. (2012) PAST—Palaeontological Statistics. Version 1.90. http://folk.uio.no/ohammer/past
[24] Weiner, J.G. and Giesy Jr., J.P. (1979) Concentrations of Cd, Cu, MN, Pb & Zn in Fishes in a Highly Organic Softwa-ter Pond. Journal of the Fisheries Research Board of Canada, 36, 270-279. http://dx.doi.org/10.1139/f79-042
[25] TerBraak, C.J.F. and Šmilauer, P. (2002) CANOCO Reference Manual and CanoDraw for Windows User’s Guide: Software for Community Ordination. Version 4.5, Microcomputer Power, Ithaca, NY.
[26] Milenkovic, N.M., Damjanovic, M. and Ristic, M. (2005) Study of Heavy Metal Pollution in Sediments from the Iron Gate (Danube, River), Serbia and Montenegro. Polish Journal of Environmental Studies, 14, 781-787.
[27] Ali, A., Ahmadou, D., Adji Mohamadou, B., Saidou, C. and Tenin, D. (2010) Determination of Minerals and Heavy Metals in Water, Sediments and Three Fish Species (Tilapia nilotica, Silurus glanis and Arius parkii) from Lagdo Lake Cameroun. Journal of Fisheries International, 5, 54-57.
[28] Alexopoulous, E., McCrohan, C.R., Powell, J.J., Juqidaohsingh, R. and White, K.N. (2003) Bioavailability and Toxic-ity of Freshly Neutralized Aluminium to the Freshwater Crayfish (Pacifastacus leniusculus). Archives of Environmen-tal Contamination and Toxicology, 45, 509-514. http://dx.doi.org/10.1007/s00244-003-0228-9
[29] Canli, M. and Kalay, M. (1998) Levels of Heavy Metals (Cd, Pb, Cu, Cr and Ni) in Tissue of Cyprinus carpio, Barbus capito and Chondrostoma regium from the Seyhan River, Turkey. Turkish Journal of Zoology, 22, 149-157.
[30] Trenfield, M.A., Morkich, S.J., Nq, J.C., Noller, B. and van Dam, R.A. (2012) Dissolved Organic Carbon Reduces Toxicity of Aluminium to Three Tropical Freshwater Organisms. Environmental Toxicology and Chemistry, 31, 427- 436. http://dx.doi.org/10.1002/etc.1704
[31] Poleo, A.B., Ostbye, K., Oxnerard, S.A., Andersen, R.A., Heibo, E. and Vollestad, L.A. (1997) Toxicity of Acid Alu-minium Rich Water to Seven Freshwater Species: A Comparative Laboratory Study. Environmental Pollution, 96, 129- 139. http://dx.doi.org/10.1016/S0269-7491(97)00033-X
[32] Mohamed, Z.A. (2001) Removal of Cadmium and Manganese by a Non-Toxic Strain of the Freshwater Cyanobacteria Gloethece magna. Water Research, 35, 4405-4409. http://dx.doi.org/10.1016/S0043-1354(01)00160-9
[33] Lasier, P.J., Winger, P.V. and Bogencider, K. (2000) Toxicity of Manganese to Ceriodaphnia dubia and Hyalella az-teca. Archives of Environmental Contamination and Toxicology, 38, 298-304. http://dx.doi.org/10.1007/s002449910039
[34] Karel, A.C., Deschamphelare, J., Koene, D.G. and Jansen, C.R. (2008) Reduction of Growth and Haemolymph Ca Le-vels in the Freshwater Snail Lymnaea stagnalis Chronically Exposed to Cobalt. Ecotoxicology and Environmental Safety, 71, 65-70. http://dx.doi.org/10.1016/j.ecoenv.2007.07.004
[35] WHO (2006) Guidelines for Drinking Water Quality. Drinking Water Quality Control in Small Community Supplies, Geneva, 3, 121.