Embed Size (px)
Citation preview

Trace metals in sediments from Torres Strait and the Gulf ofPapua: concentrations, distribution and water circulation patterns
David Haynes a,*, Donna Kwan b
a Great Barrier Reef Marine Park Authority, P.O. Box 1379, Townsville 4810, Australiab Tropical Environmental Science and Geography, James Cook University, Townsville 4811, Australia
Keywords: Heavy metals; Torres Strait; Marine pollution; Sediments; Great Barrier Reef; Fly River; Ok Tedi
Torres Strait is a relatively shallow (typically <20m),tropical epicontinental seaway that separates the Aus-
tralian mainland from Papua New Guinea (Fig. 1). The
region is characterised by numerous continental islands
and coral reefs and has been the subject of a number of
biological and physico-chemical investigations over the
last 15 years, principally to investigate the estuarine andmarine impacts of large-scale mining activities that have
been carried out in the Papuan highlands over the last 20
years. In particular, gold and copper mining on the Ok
Tedi River (a tributary of the Fly River) is estimated to
contribute 750,000 tonnes per day of copper-rich mine
tailings and 90,000 tonnes of sediment per day to the
river (Apte and Day, 1998). Past studies have concluded
that the impact of the Fly River discharge on local tracemetal concentrations is restricted to the northern Torres
Strait (Alongi et al., 1991; Baker and Harris, 1991;
Baker et al., 1990; Gladstone, 1996). However, elevated
concentrations of certain metals reported in seafoods
commonly eaten by Torres Strait Islanders has promp-
ted ongoing monitoring of Torres Strait metal concen-
trations (Dight and Gladstone, 1993; Gladstone, 1996;
Evans-Illidge, 1997). The results of the most recentsurvey of metal concentrations in sediments from the
Gulf of Papua and Torres Strait are presented here.
Sediment samples were collected from 28 sites across
Torres Strait (northern, central and southern Torres
Strait) and from the Gulf of Papua in February 2000
(Fig. 1). All sediment samples were collected opportu-
nistically along the route of a proposed natural gas
pipeline between Papua New Guinea and Australiaduring an environmental assessment phase of the pipe-
line project (NSR, 1997). Sediment samples were col-
lected using a vibrocore. Sediments for metals analyses
were selectively retrieved from the top portion of the core
(representing approximately 2–3 cm of surficial bottom
sediments) and placed in acid washed plastic containers.
Sediment samples were frozen following collection.
Heavy metals analyses were performed at the NATA
certified laboratory of the Queensland Department of
Natural Resources, Brisbane. Frozen sediments were
transported to the analytical laboratory where the sam-ples were thawed and ground to <50 lm using a shatter-box grinding mill. Ground sediment samples were
pelleted using the pressed powder technique (Gladstone,
1996) and analysed by X-ray fluorescence for Al, As, Co,
Cr, Cu, Fe, Mn, Ni, Pb, Si, Sr and Zn concentrations. Cd
and Hg determination samples were digested with nitric
and hydrochloric acids (6:2) following 2 h exposure to a
steam bath. Cadmium was analysed by graphite furnaceatomic adsorption spectrometry (AAS), and mercury by
hydride generation AAS. Sediment calcium carbonate
content was determined by a weight loss gravimetric
method (Blakemore et al., 1987).
Blanks and certified reference materials (Marine
Sediment Mess-2, National Research Council, Canada)
were analysed concurrently with sediment samples to
ensure consistency and accuracy of recoveries over metalanalyses (Table 1). Metal data were graphed and in-
spected for gross deviations from normality and where
necessary, transformed (log10) prior to analysis. Non-
detectable values were set at half the detection limit for
that metal for statistical analyses purposes. Pearson
correlation co-efficients and their associated Bonferroni-
adjusted probabilities were calculated for sediment
physico-chemical parameters. Sediment metal data werestandardised to Z scores and an agglomerative hierar-
chical algorithm using complete clustering used to clas-
sify the sediment metal data and principal component
analysis (PCA) used to ordinate the data. Euclidean
distances were utilized to calculate dissimilarities. The
presence of natural groupings in the data was defined by
concurrence in both the classification and the ordination
analyses (Clarke and Warwick, 1994). Differences inmetal concentrations between sampling regions defined
*Corresponding author. Tel.: +61-747-500700; fax: +61-747-
726093.
E-mail address: [email protected] (D. Haynes).
Baseline / Marine Pollution Bulletin 44 (2002) 1296–1313 1309

by multivariate analysis were compared using one-way
analysis of variance (ANOVA). Significant differences in
metal concentrations were located using a Tukey HSD
multiple comparison test with an experiment-wise type 1
error probability of 0.05. All statistical computations
were carried out with the aid of the SYSTAT V7.0
package (Wilkinson, 1996).
Detectable concentrations of all metals analysed forwere present in Torres Strait sediments (Table 2). All
metals except strontium and cadmium were negatively
correlated with calcium carbonate concentrations and
positively correlated with aluminium, iron and silica
concentrations, and is indicative of their terrestrial origin
(Table 3). In contrast, both strontium and cadmium were
primarily associated with carbonates of marine origin.
The first two components of a PCA of standardisedsediment metal concentrations accounted for 82% of the
variance in the data (Table 4). The cluster dendrogram
and the PCA ordination separated sediment samples
into four distinct clusters (Fig. 2). These consisted of
samples collected in the Gulf of Papua, in Northern
Torres Strait (adjacent to the Fly River delta), a single
sample collected at the northern end of Dungeness
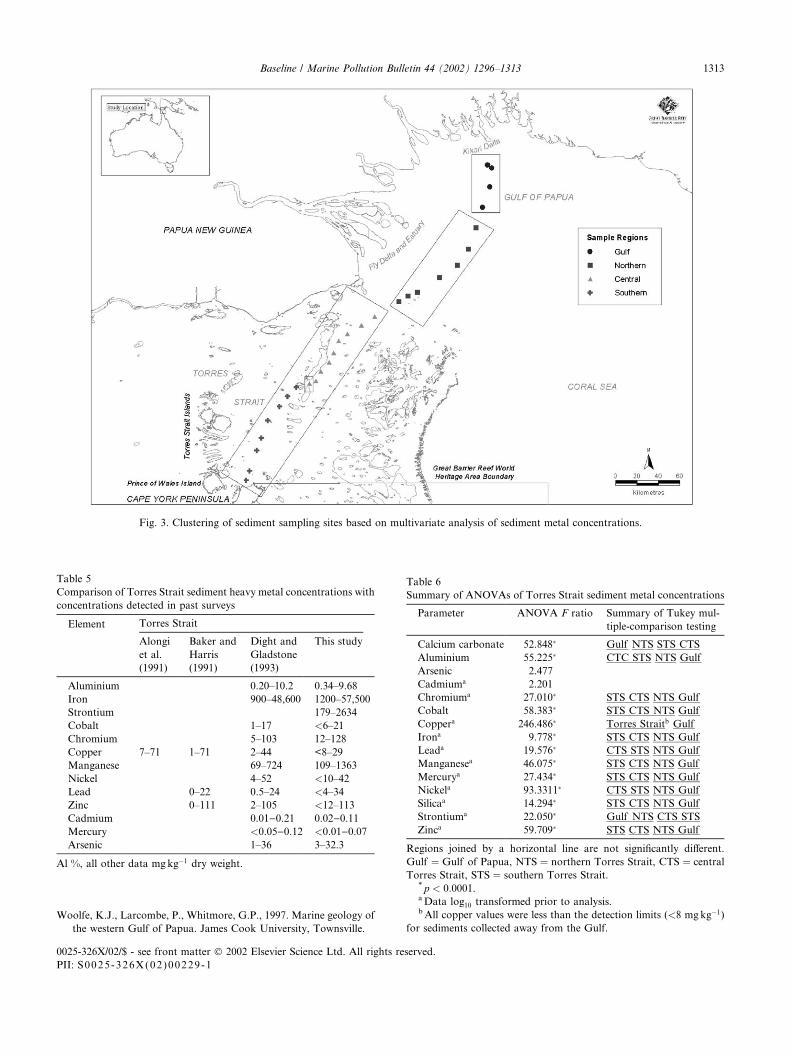
Reef (central Torres Strait) and samples collected incentral and southern Torres Strait (Fig. 3). Principal
component I (47% of the data variance) was associated
with all metals except cadmiumand arsenic, and principal
component II (35% of the data variance) was associated
with sediment arsenic and cadmium concentrations.
Average concentrations of sediment metals were
similar to those detected in past surveys of Torres Strait
(Table 5), although concentrations of arsenic, chromium
Fig. 1. Torres Strait and Gulf of Papua sediment sampling sites.
Table 1
Standard reference material (MESS-2) recoveries
Element Units (dry
weight)
SRM
recovery
SRM certi-
fied value
SRM stan-
dard deviation
CaCO3 % 98.6 100
Al % 8.36 8.57 0.26
Co mgkg�1 10.8 13.8 1.4
Cr mgkg�1 114 106 8
Cu mgkg�1 31.9 39.3 2
Fe % 4.39 4.35 0.22
Mn mgkg�1 368 365 21
Ni mgkg�1 55.4 49.3 1.8
Pb mgkg�1 21.7 21.9 1.2
Si % 25.6 27.80 1.10
Sr mgkg�1 150 125 10
Zn mgkg�1 173 172 16
Cd mgkg�1 0.234 0.24 0.01
Hg mgkg�1 0.099 0.092 0.009
As mgkg�1 19.3 20.7 0.8
1310 Baseline / Marine Pollution Bulletin 44 (2002) 1296–1313

and nickel were high enough to exceed sediment qualityguidelines (ANZECC, 2000) at a number of sites. Nickel
sediment concentrations were elevated (i.e. >21 mgkg�1
dry weight) at all Gulf of Papua sampling sites and all
but one of the northern Torres Strait sampling sites.
Similarly, sediment concentrations of chromium were
elevated (i.e. >80 mgkg�1 dry weight) at all Gulf sitesand at a majority of northern Torres Strait sampling
sites. Concentrations of arsenic were elevated (i.e. >20mgkg�1 dry weight) at approximately half of the
Gulf of Papua and northern Torres Strait sampling
sites. Average sediment metal and calcium carbonate
concentrations were significantly different between the
sampling regions defined in the multivariate analyses
Table 2
Torres Strait and Gulf of Papua sediment heavy metal concentrations
Sample no. CaCO3 Al Co Cr Cu Fe Mn Ni Pb Si Sr Zn Cd Hg As
1 11.9 7.38 18 94 16 5.28 1363 33 15 23.6 405 81 0.03 0.03 15.8
2 11.4 7.23 21 128 15 5.75 1362 34 20 23.4 363 85 0.03 0.05 22.4
3 3.5 9.68 19 95 29 5.45 955 41 24 24.5 179 113 0.02 0.07 20.6
4 7.3 9.14 15 88 18 4.93 638 42 34 22.8 262 108 0.03 0.06 11.9
5 44.6 4.76 <6 68 <8 3.71 990 28 12 16.1 832 57 0.03 0.03 32.2
6 44.1 5.7 <6 58 <8 2.72 404 23 15 15.6 1176 57 0.03 0.03 9.8
7 42 4.91 <6 80 <8 3.2 386 23 14 16.3 1116 56 0.03 0.03 11.8
8 19.7 6.99 12 98 <8 4.9 661 41 22 23 442 84 0.03 0.03 26.4
9 23.8 5.74 9 96 <8 4.44 510 35 21 23.5 607 81 0.02 0.03 14.3
10 38.4 4.54 <6 91 <8 4.1 572 26 23 18.3 810 62 0.03 0.02 23.5
11 36.7 3.17 <6 118 <8 3.6 382 19 17 20.2 749 46 0.02 0.02 21.5
12 55 2.69 <6 68 <8 3.16 282 11 8 13.5 1071 37 0.02 0.02 17.9
13 66.7 2.02 <6 51 <8 2.94 229 <10 6 9.34 1334 24 0.02 0.02 18.3
14 68.2 1.99 <6 42 <8 1.43 174 <10 8 9.07 1786 22 0.02 0.01 5.5
15 76.4 1.49 <6 32 <8 0.91 164 <10 6 6.37 2261 16 0.03 0.01 3
16 79.3 1.14 <6 32 <8 1.51 240 <10 9 5.33 2007 <12 0.03 0.01 6.3
17 82.8 1.19 <6 32 <8 1.81 229 <10 4 3.95 1628 13 0.05 0.01 15.9
18 84.2 1.04 <6 22 <8 1.89 370 <10 6 3.86 1733 13 0.04 0.01 16.1
19 IS 0.42 <6 21 <8 1.43 332 <10 <4 1.51 2117 16 0.06 <0.01 23
20 89.5 0.46 <6 14 <8 0.12 210 <10 6 1.85 1309 <12 0.11 <0.01 4.7
21 92.7 0.34 <6 12 <8 0.22 109 <10 7 1.09 2634 <12 0.05 <0.01 5.5
22 86 0.56 <6 17 <8 0.84 159 <10 12 2.34 2234 <12 0.03 <0.01 8
23 86.3 0.86 <6 26 <8 0.84 151 <10 9 3.02 2495 <12 0.04 <0.01 7.3
24 85.7 0.73 <6 25 <8 0.99 251 <10 9 2.89 2406 <12 0.04 <0.01 10.7
25 70.2 4.1 <6 42 <8 1.72 148 12 7 5.86 1089 14 0.05 0.02 17.4
26 87.7 0.71 <6 19 <8 0.71 163 <10 10 2.8 2247 <12 0.03 <0.01 7.9
27 74.4 0.39 <6 17 <8 0.71 150 <10 7 7.36 1867 <12 0.04 <0.01 15.7
28 51.6 1.37 <6 22 <8 2.34 166 <10 17 15.7 1233 <12 0.07 0.01 21
All metal concentrations mgkg�1 dry weight, CaCO3, Al, Fe, Si %.
Table 3
Pearson correlation coefficient matrix including Bonferroni adjusted
probabilities for sediment metal concentrations
Element CaCO3 Al Fe Si
Aluminium )0.945���
Iron )0.962��� 0.911���
Silica )0.986��� 0.890��� 0.951���
Strontium 0.900��� )0.863��� )0.890��� )0.892���
Cobalt )0.792��� 0.812��� 0.775��� 0.712��
Chromium )0.909��� 0.839��� 0.928��� 0.915���
Copper )0.665� 0.732��� 0.622 0.562
Manganese )0.800��� 0.791�� 0.841��� 0.758���
Nickel )0.941��� 0.962��� 0.911��� 0.907���
Lead )0.849��� 0.814��� 0.777��� 0.825���
Zinc )0.957��� 0.971��� 0.934��� 0.921���
Cadmium 0.413 )0.392 )0.470 )0.426Mercury )0.889��� 0.948��� 0.864��� 0.822���
Arsenic )0.574 0.477 0.674� 0.611
* 0:05 < p < 0:01.** 0:01 < p < 0:001.*** p < 0:001:
Table 4
Summary of PCA analysis of sediment metal concentrations
Element Component I Component II
Copper 0.931 0.026
Cobalt 0.909 0.226
Mercury 0.836 0.459
Aluminium 0.801 0.552
Zinc 0.774 0.600
Nickel 0.733 0.624
Lead 0.689 0.481
Manganese 0.686 0.503
Iron 0.640 0.750
Silica 0.616 0.737
Strontium )0.570 )0.705Chromium 0.541 0.774
Arsenic 0.014 0.805
Cadmium )0.174 )0.497
% Variance explained 46.8 35.0
Eigen value 10.308 1.145
Baseline / Marine Pollution Bulletin 44 (2002) 1296–1313 1311

(Table 6). Calcium carbonate concentrations increased
with increasing distance from the Gulf of Papua. Lowest
concentrations of strontium and cadmium were also
present in the Gulf of Papua and northern Torres Strait.
In contrast, concentrations of all other metals weresignificantly higher in sediments collected from the Gulf
of Papua and/or northern Torres Strait than in sedi-
ments collected from more southern sites in central and
southern Torres Strait.
Oceanographic studies have indicated that cur-
rent flow in the Torres Strait region is predominantly
east–west in the passages between reefs and island, but
otherwise tends to run north–south, along the GreatNorth-East Channel, parallel to Warrior Reefs (NSR,
1997; Wolanski et al., 1999). Oceanic circulation within
the Gulf of Papua is dominated by a clockwise gyre
generated as the northwards flowing Coral Sea Coastal
Current enters the Gulf along the eastern edge of Torres
Strait and exits to the north-east (Woolfe et al., 1997). As
a result, most the freshwater delivered to the Gulf bylarge Papuan rivers travels eastwards, while only a small
proportion flows towards Torres Strait (Woolfe et al.,
1997). This pattern of water circulation and sediment
movement within the region is substantiated by the dis-
tribution of metals in sediments across the Gulf of Papua
and Torres Strait determined in this study.
Acknowledgements
Foong Chun Kok (Petronas) is thanked for supplyingsediment samples for analysis, Glenn Barry (Queensland
Department of Natural Resources and Mines) coordi-
nated metal analysis of the Torres Strait sediment
samples, Stan Wright (Torres Strait Regional Authority)
coordinated sediment sample procurement and Mike
Ridd (James Cook University) is thanked for reviewing
a draft of the manuscript. This study was funded
through Environment Australia.
References
Alongi, D.M., Tirendi, F., Robertson, A.I., 1991. Vertical profiles of
copper in sediments from the Fly River delta and Gulf of Papua
(Papua New Guinea). Marine Pollution Bulletin 22, 253–255.
ANZECC, 2000. Australian and New Zealand guidelines for fresh and
marine water quality. Australian and New Zealand Environment
and Conservation Council.
Apte, S.C., Day, G.M., 1998. Dissolved metal concentrations in the
Torres Strait and Gulf of Papua. Marine Pollution Bulletin 36,
298–304.
Baker, E.K., Harris, P.T., 1991. Copper, lead and zinc distribution in
the sediments of the Fly River delta and Torres Strait. Marine
Pollution Bulletin 22, 614–618.
Baker, E.K., Harris, P.T., Beck, R.W., 1990. Cu and Cd associated
with suspended particulate matter in Torres Strait. Marine Pollu-
tion Bulletin 21, 484–486.
Blakemore, L., Searle, P.L., Daly, B.K., 1987. Methods for the
Analysis of Soils. New Zealand Soil Bureau.
Clarke, K.R., Warwick, R.M., 1994. Change in Marine Communities:
An Approach to Statistical Analysis and Interpretation. Natural
Environmental Research Council, England.
Dight, I.J., Gladstone, W., 1993. Torres Strait baseline study: pilot
study final report June 1993. Great Barrier Reef Marine Park
Authority Research Publication No. 29. Great Barrier Reef Marine
Park Authority, Townsville.
Evans-Illidge, E., 1997. Heavy metals in commercial prawn and
crayfish species of the Torres Strait. Report 5b, Great Barrier Reef
Marine Park Authority Report Series. Great Barrier Reef Marine
Park Authority, Townsville.
Gladstone, W., 1996. Trace metals in sediments, indicator organisms
and traditional seafoods of the Torres Strait. Final report of the
Torres Strait Baseline Study. Great Barrier Reef Marine Park
Authority, Townsville.
NSR, 1997. PNG gas project: draft environmental impact statement
and impact assessment study, main report. Report No. CR 790/9/
v3. NSR Environmental Consultants, Hawthorn East, Australia.
Wilkinson, L., 1996. Systat 7.0 for Windows: Statistics. Microsoft,
Chicago.
Wolanski, E., Spagnol, S., King, B., Ayukai, T., 1999. Patchiness in
the Fly River plume in Torres Strait. Journal of Marine Systems 18,
369–381.
Fig. 2. Cluster dendogram and PCA ordination of sediment heavy
metal concentrations.
1312 Baseline / Marine Pollution Bulletin 44 (2002) 1296–1313
Woolfe, K.J., Larcombe, P., Whitmore, G.P., 1997. Marine geology of
the western Gulf of Papua. James Cook University, Townsville.
Table 5
Comparison of Torres Strait sediment heavy metal concentrations with
concentrations detected in past surveys
Element Torres Strait
Alongi
et al.
(1991)
Baker and
Harris
(1991)
Dight and
Gladstone
(1993)
This study
Aluminium 0.20–10.2 0.34–9.68
Iron 900–48,600 1200–57,500
Strontium 179–2634
Cobalt 1–17 <6–21
Chromium 5–103 12–128
Copper 7–71 1–71 2–44 <8–29
Manganese 69–724 109–1363
Nickel 4–52 <10–42
Lead 0–22 0.5–24 <4–34
Zinc 0–111 2–105 <12–113
Cadmium 0.01)0.21 0.02)0.11Mercury <0.05)0.12 <0.01)0.07Arsenic 1–36 3–32.3
Al %, all other data mgkg�1 dry weight.
Table 6
Summary of ANOVAs of Torres Strait sediment metal concentrations
Parameter ANOVA F ratio Summary of Tukey mul-
tiple-comparison testing
Calcium carbonate 52.848� Gulf NTS STS CTS
Aluminium 55.225� CTC STS NTS Gulf
Arsenic 2.477
Cadmiuma 2.201
Chromiuma 27.010� STS CTS NTS Gulf
Cobalt 58.383� STS CTS NTS Gulf
Coppera 246.486� Torres Straitb Gulf
Irona 9.778� STS CTS NTS Gulf
Leada 19.576� CTS STS NTS Gulf
Manganesea 46.075� STS CTS NTS Gulf
Mercurya 27.434� STS CTS NTS Gulf
Nickela 93.3311� CTS STS NTS Gulf
Silicaa 14.294� STS CTS NTS Gulf
Strontiuma 22.050� Gulf NTS CTS STS
Zinca 59.709� STS CTS NTS Gulf
Regions joined by a horizontal line are not significantly different.
Gulf ¼ Gulf of Papua, NTS ¼ northern Torres Strait, CTS ¼ centralTorres Strait, STS ¼ southern Torres Strait.* p < 0:0001.aData log10 transformed prior to analysis.bAll copper values were less than the detection limits (<8 mgkg�1)
for sediments collected away from the Gulf.
Fig. 3. Clustering of sediment sampling sites based on multivariate analysis of sediment metal concentrations.
0025-326X/02/$ - see front matter � 2002 Elsevier Science Ltd. All rights reserved.
PII: S0025-326X(02 )00229-1
Baseline / Marine Pollution Bulletin 44 (2002) 1296–1313 1313


![Biogeochemical cycling in anoxic sediments · 2007-04-20 · for sulfate reduction and methanogenesis. Hydrogen concentrations respond to T, [X], pH. Laboratory changes correspond](https://img.pdfslide.net/doc/110x75/5f478b2e8fcaea602546f86a/biogeochemical-cycling-in-anoxic-sediments-2007-04-20-for-sulfate-reduction-and.jpg)

![Ecological Risk Assessment of Heavy Metals in Coastal ...the highest concentrations of toxic heavy metals in marine environment are found in sediments [1,6,7]. Coastal sediments are](https://img.pdfslide.net/doc/110x75/60777613a46f6a043806f637/ecological-risk-assessment-of-heavy-metals-in-coastal-the-highest-concentrations.jpg)