Embed Size (px)
Citation preview
TRACEABILITY SYSTEM APPROACHES AND COST
ANALYSIS FOR THE BEEF INDUSTRY
by
MEHMET MUS
A thesis in partial fulfillment of the Requirements for the
degree of
MASTER OF ARTS IN ECONOMICS
WASHINGTON STATE UNIVERSITY School of Economics Sciences
August 2006
i
To the Faculty of Washington State University:
The members of the committee appointed to examine the thesis of
MEHMET MUS find it satisfactory and recommend that it be accepted.
Chair

ii
ACKNOWLEDGMENTS
I would first like to express my special thanks to Dr. Thomas I. Wahl for his
guidance, encouragement, suggestions, and assistance to successfully complete my thesis.
I also want to thank my committee members Dr. Jill J. McCluskey and Dr. Thomas
Marsh for their assistance and time to be my committee members.
I would like to express my special thanks and respect to Dr. Barbara Rasco for her
contribution to my thesis and valuable time she allocated to answer my questions.
I also want to sincerely thank Dr. Jan Busboom for the time he allocated to
answer my questions.
Finally, I would like to express my special thanks to my friends, Vugar Ahmedov,
Hasan Buker and Arif Akgul for their support, friendship and assistance during the time I
spent at Washington State University for my study. I also want to thank director of our
school Dr. Ron C. Mittelhammer, associate director Dr. Robby Rosenman and faculty
members Dr. Scott Matulich and Dr. Shumway, and all other faculty members of School
of Economics Sciences.
iii
TRACEABILITY SYSTEM APPROACHES AND COST
ANALYSIS FOR THE BEEF INDUSTRY
Abstract
by MEHMET MUS, M.A. Washington State University
August 2006
Chair: Thomas Wahl
The paper provides a comprehensive review of the literature on the beef
traceability by identifying its benefits and costs. It proposes the comparative view over
several qualitative and quantitative papers to the reader. The review also includes the
reason of applying traceability into food supply chain, especially into livestock.
Moreover, in the literature, different types of traceability models were extensively
discussed. Also the literature review provides detailed information on functions of
traceability.
Furthermore, this research will analyze the various traceability applications in
different countries around the globe. The analysis of various traceability applications in
other countries is done by the use of existing experiences comparatively. The different
traceability systems in other countries are compared with each other to identify common
and unique characteristics that each system has. The comparative analysis of different
traceability applications in other countries will help us to measure the ability of U.S.
ivSmall and Medium Sized Enterprises to obtain compliance with the requirements of
system
The paper depicts a very important theory that involves a monopolistic
competitive market model of a firm aiming at maximizing profit by applying a
traceability system. The model also lays out the extra revenue that will be brought in by
the application of traceability and cost that will be incurred by the firms.
v
TABLE OF CONTENTS
PageACKNOWLEDGMENTS………………………………………………………
ii
ABSTRACT…………………………………………………………………….
iii
LIST OF TABLES………………………………………………………………
viii
LIST OF FIGURES……………………………………………………………..
iv
Chapter
1. INTRODUCTION………………………………………………………
1
Research Objectives………………………………………………… 5 Summary of Findings………………………………………………. 6 Background of the Study……………………………………………
6
2. PREVIOUS STUDIES………………………………………………….
10
Definitions………………………………………………………….. 10 Traceability Functions……………………………………………… 11 Different Types of Traceability Models……………………………. 13
Comparisons of Different Traceability Applications in Different Countries………………………………………………………
18
United States………………………………………………….. 20 Japan………………………………………………………….. 24 European Union………………………………………………. 28 Canada………………………………………………………... 31 Australia………………………………………………………. 34 U.S. National Animal Identification System (NAIS)……………….
36
Premises Identification……………………………………….. 38Animal Identification…………………………………………. 40Animal Tracking……………………………………………… 45
AIN Management System…………………..………………. 46
vi
AIN Tag Manufacturers………………………………… 47AIN Tag Managers……………………………………... 48AIN Tag Resellers………………………………………
49
E-Authentication……………………………………………… 50Tracking Databases……………………………………………
51
Comparisons of National Animal Identification System (NAIS) and Country of Origin Labeling (COOL)…………………………. 52
DNA Based Traceability…………………………………………….
43
3. METHODOLOGY AND RESULTS…………………………………… 54
Beef Supply Chain…………………………………………………..
54
Cow-Calf Producer (Ranch)………………………………….. 55Auction Market (Saleyard)…………………………………… 57Stocker………………………………………………………... 57Feedlot Operator……………………………………………… 57Packer/Slaughterhouse………………………………………...
58
Radio Frequency Identification…………………………………….. 58Components of Radio Frequency Identification System (RFID)…...
59
Transponder…………………………………………………... 59Electronic Reader……………………………………………... 60Data Accumulator…………………………………………….. 61Software/web-Based Analysis and Storage…………………... 61Other…………………………………………………………..
61
Cost Computation of Traceability from Farm to Fork………………
63
Cow/Calf Producer…………………………………………… 65Auction Market (Saleyard)…………………………………… 67Stocker………………………………………………………... 68Feedlot Operator…………………...…………………………. 69Packing Plants………………………………………………… 70Traceability Cost from Slaughterhouse to Retailers………….. 71Estimation of Traceability Cost from Farm to Fork………….. 74Economic Interpretation of the results Found in Section 3.4…
75
4. WELFARE IMPLICATIONS ………………………………………….
77
The Welfare of Traceability for Consumers………………...……… 77The Benefits of Traceability for firms……………………………… 81

vii
5. SUMMARY AND CONCLUSIONS…………………………………...
91
BIBLIOGRAPHY………………………………………………………………
93
APPANDIX A………………………………………………………………….. 98
viii
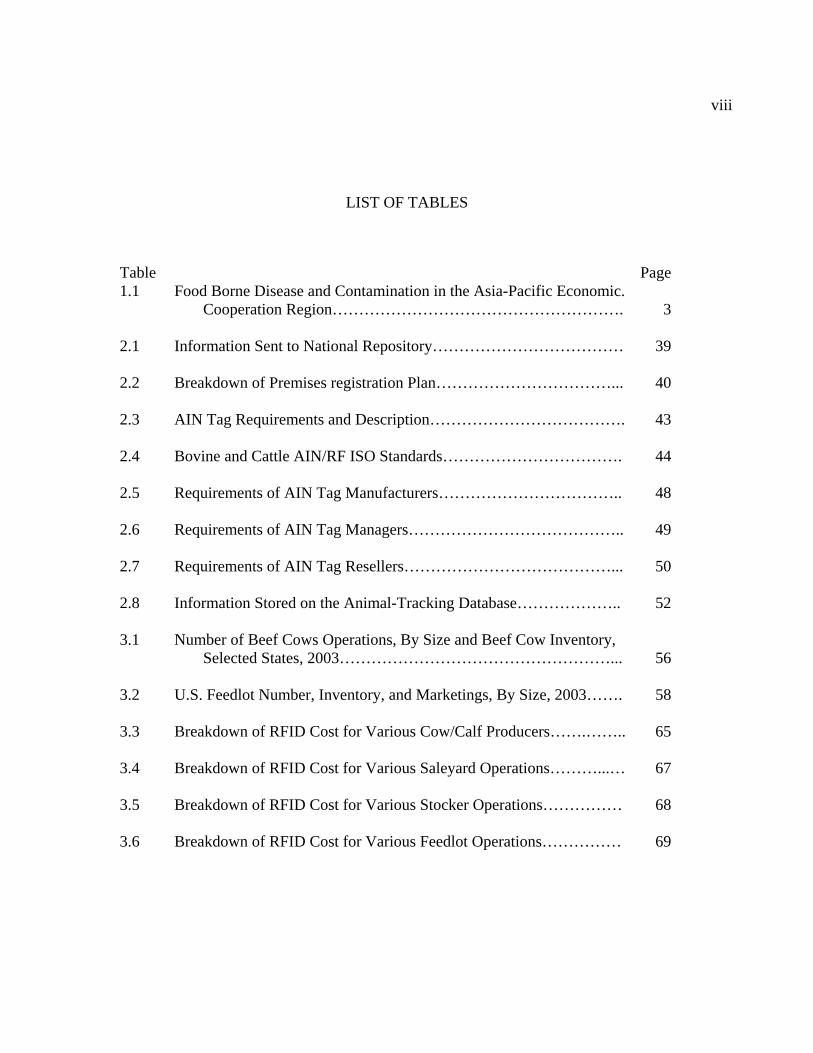
LIST OF TABLES
Table Page1.1 Food Borne Disease and Contamination in the Asia-Pacific Economic.
Cooperation Region……………………………………………….
3
2.1 Information Sent to National Repository………………………………
39
2.2 Breakdown of Premises registration Plan……………………………...
40
2.3 AIN Tag Requirements and Description……………………………….
43
2.4 Bovine and Cattle AIN/RF ISO Standards…………………………….
44
2.5 Requirements of AIN Tag Manufacturers……………………………..
48
2.6 Requirements of AIN Tag Managers…………………………………..
49
2.7 Requirements of AIN Tag Resellers…………………………………...
50
2.8 Information Stored on the Animal-Tracking Database………………..
52
3.1 Number of Beef Cows Operations, By Size and Beef Cow Inventory, Selected States, 2003……………………………………………...
56
3.2 U.S. Feedlot Number, Inventory, and Marketings, By Size, 2003…….
58
3.3 Breakdown of RFID Cost for Various Cow/Calf Producers…….……..
65
3.4 Breakdown of RFID Cost for Various Saleyard Operations………...…
67
3.5 Breakdown of RFID Cost for Various Stocker Operations……………
68
3.6 Breakdown of RFID Cost for Various Feedlot Operations……………
69
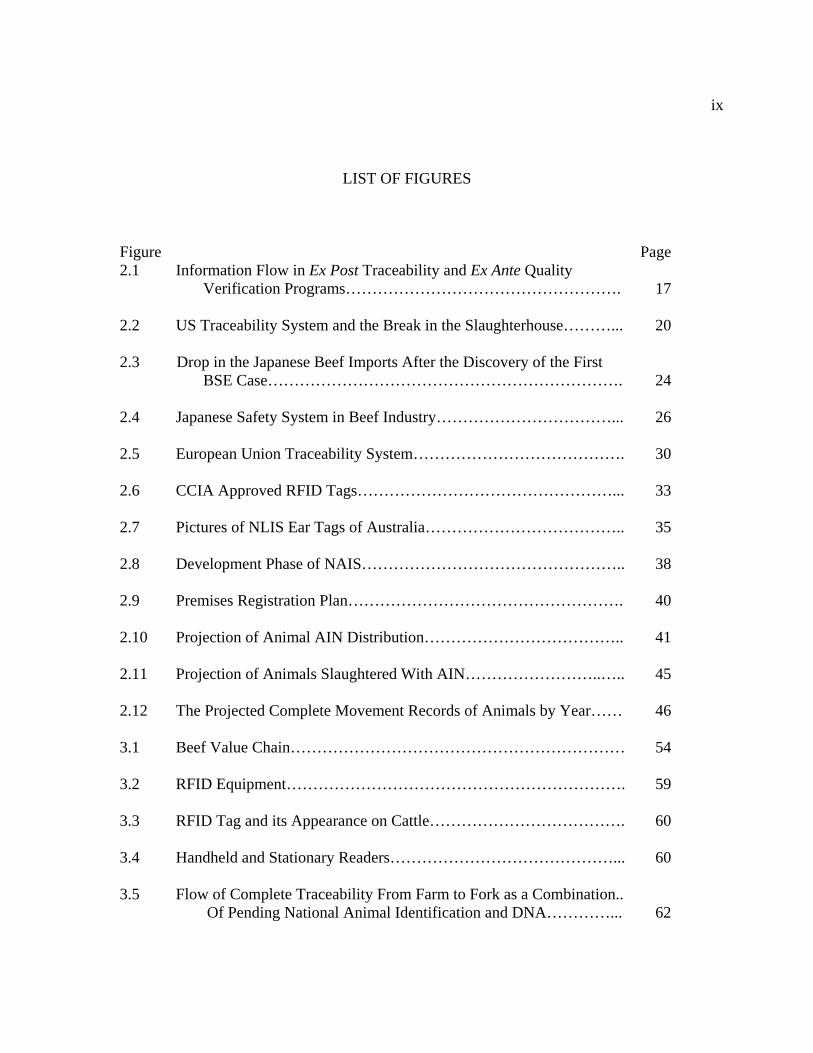
ix
LIST OF FIGURES Figure Page2.1 Information Flow in Ex Post Traceability and Ex Ante Quality
Verification Programs…………………………………………….
17
2.2 US Traceability System and the Break in the Slaughterhouse………...
20
2.3 Drop in the Japanese Beef Imports After the Discovery of the First BSE Case………………………………………………………….
24
2.4 Japanese Safety System in Beef Industry……………………………...
26
2.5 European Union Traceability System………………………………….
30
2.6 CCIA Approved RFID Tags…………………………………………...
33
2.7 Pictures of NLIS Ear Tags of Australia………………………………..
35
2.8 Development Phase of NAIS…………………………………………..
38
2.9 Premises Registration Plan…………………………………………….
40
2.10 Projection of Animal AIN Distribution………………………………..
41
2.11 Projection of Animals Slaughtered With AIN……………………..…..
45
2.12 The Projected Complete Movement Records of Animals by Year……
46
3.1 Beef Value Chain………………………………………………………
54
3.2 RFID Equipment……………………………………………………….
59
3.3 RFID Tag and its Appearance on Cattle……………………………….
60
3.4 Handheld and Stationary Readers……………………………………...
60
3.5 Flow of Complete Traceability From Farm to Fork as a Combination.. Of Pending National Animal Identification and DNA…………...
62
x3.6 RFID Cost for Cow/Calf Producers……………………………………
66
3.7 RFID Cost for Various Saleyard Operations…………………………..
68
3.8 RFID Cost for Various Stocker Operations……………………………
69
3.9 RFID Cost for Various Feedlot Operations……………………………
70
3.10 Connection of National Animal Identification System and DNA……..
72
4.1 Short Run Case of Traceability effect and Abnormal Profit…………..
86
4.2 Effects of New Entrants on the First Firm……………………………..
88
4.3 The Long Run Case of an Individual firm in the Premium Market……
89
A.1
Allflex Electronic Ear Tag…………………………………………….. 99
A.2
Allflex Handheld Readers……………………………………………... 99
A.3
Destron Walk-Thru Reader……………………………………………. 100
xi
Dedication
To my parents:
Ismail and Mekiye MUS
1
CHAPTER 1
INTRODUCTION
An increasing demand by consumers for safe food products drives all players
globally in integrated food value chains to improve their quality control programs and
implement voluntary food safety standards. There are several reasons characterizing this
increasing demand to improve food safety standards: of recent historical importance are a
series of highly publicized outbreaks involving beef causing a prion based disease called
BOVINE SPONGIFORM ENCEPHALOPATHY (BSE) also known as Mad Cow
Disease that can lead to an illness in humans called variant Cruetzfeld-Jacob Disease
(vCJD). Because of the suspected long onset period for this illness in people, there may
be many thousands of individuals who have consumed contaminated meat, but who will
not appear to be ill for a number of years, possibly decades. Because of the factors
associated with this disease, a number of animal feeding practices were changed in 1997
in the United States, the EU and other countries. Also, there has been an effective
prohibition on the sale of animals over a certain age in specific markets as younger
animals are less likely to have been exposed to, contracted and retained the prion
compared to older animals. Despite the relatively simple preventive measures involving
feeding and tracking animal age, adoption of an effective tracking program for beef at the
farm level entering the human food chain has been long in coming.
2Other food borne illness outbreaks involving bacterial contamination could
also be better controlled by improved traceability measures at the slaughterhouse and
processing facility. Probably, the most illustrious and highly publicized outbreaks
involving beef over the past decade are illnesses associated with a pathogenic form of the
Escherichia coli. Non-pathogenic forms of Escherichia coli colonize the intestinal tract
of all warm-blooded animals, but cattle and other ruminants can harbor the pathogenic
0157:H7 variant and not exhibit illness symptoms. One of the most famous outbreaks
implicating beef occurred in Washington State and other Western states in 1992
involving undercooked ground beef. Later incidents occurred in Scotland in 1999. A
1995 incident in Australia resulted in the death of a child from E.coli O157:H7
contamination in sausage (Hobbs, 2003). Some other foodborne outbreaks and countries
are outlined in Table 1.1.
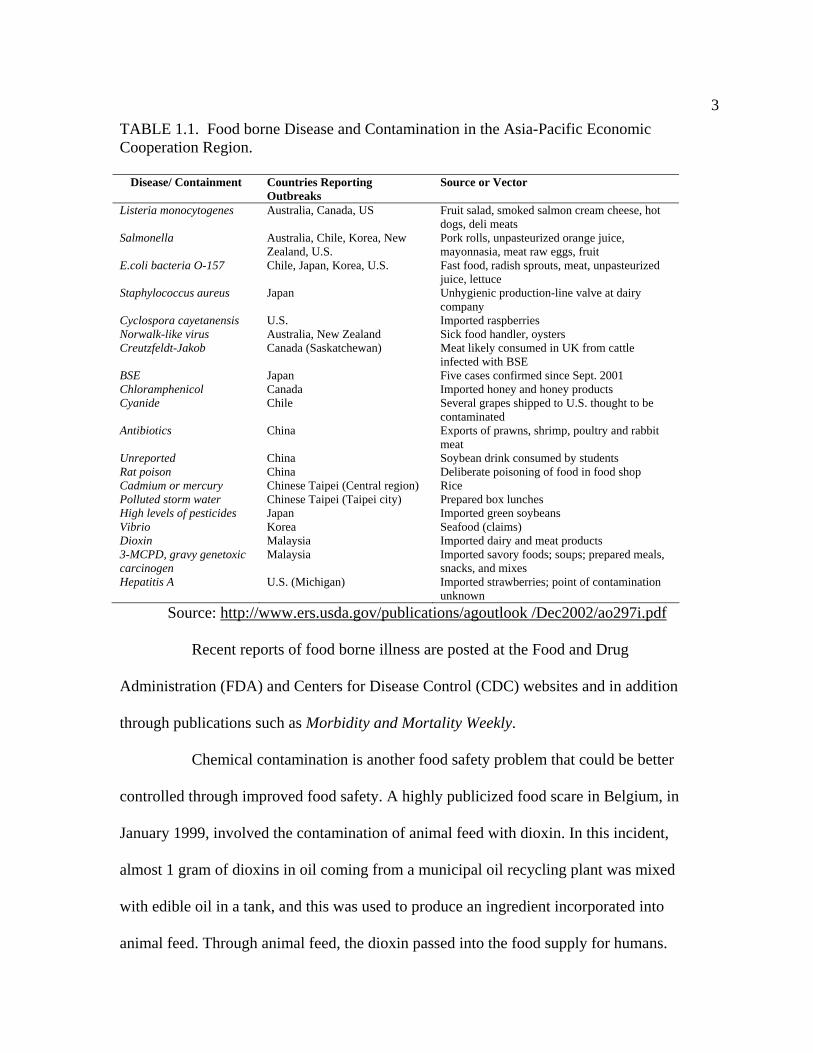
3TABLE 1.1. Food borne Disease and Contamination in the Asia-Pacific Economic Cooperation Region.
Disease/ Containment Countries Reporting Outbreaks
Source or Vector
Listeria monocytogenes Australia, Canada, US Fruit salad, smoked salmon cream cheese, hot dogs, deli meats
Salmonella Australia, Chile, Korea, New Zealand, U.S.
Pork rolls, unpasteurized orange juice, mayonnasia, meat raw eggs, fruit
E.coli bacteria O-157 Chile, Japan, Korea, U.S. Fast food, radish sprouts, meat, unpasteurized juice, lettuce
Staphylococcus aureus Japan Unhygienic production-line valve at dairy company
Cyclospora cayetanensis U.S. Imported raspberries Norwalk-like virus Australia, New Zealand Sick food handler, oysters Creutzfeldt-Jakob Canada (Saskatchewan) Meat likely consumed in UK from cattle
infected with BSE BSE Japan Five cases confirmed since Sept. 2001 Chloramphenicol Canada Imported honey and honey products Cyanide Chile Several grapes shipped to U.S. thought to be
contaminated Antibiotics China Exports of prawns, shrimp, poultry and rabbit
meat Unreported China Soybean drink consumed by students Rat poison China Deliberate poisoning of food in food shop Cadmium or mercury Chinese Taipei (Central region) Rice Polluted storm water Chinese Taipei (Taipei city) Prepared box lunches High levels of pesticides Japan Imported green soybeans Vibrio Korea Seafood (claims) Dioxin Malaysia Imported dairy and meat products 3-MCPD, gravy genetoxic carcinogen
Malaysia Imported savory foods; soups; prepared meals, snacks, and mixes
Hepatitis A U.S. (Michigan) Imported strawberries; point of contamination unknown
Source: http://www.ers.usda.gov/publications/agoutlook /Dec2002/ao297i.pdf
Recent reports of food borne illness are posted at the Food and Drug
Administration (FDA) and Centers for Disease Control (CDC) websites and in addition
through publications such as Morbidity and Mortality Weekly.
Chemical contamination is another food safety problem that could be better
controlled through improved food safety. A highly publicized food scare in Belgium, in
January 1999, involved the contamination of animal feed with dioxin. In this incident,
almost 1 gram of dioxins in oil coming from a municipal oil recycling plant was mixed
with edible oil in a tank, and this was used to produce an ingredient incorporated into
animal feed. Through animal feed, the dioxin passed into the food supply for humans.
4Because of lack of a suitable traceability program, the contaminated food could not be
readily found and removed from the marketplace. The resultant recall cost millions of
Euros and stifled international trade in feed ingredients for over a year. This unfortunate
case caused loss of consumer confidence in the safety of the food supply and resulted in
millions of Euros losses to a number of companies affected by this recall (The Food
Business Forum, 2005).
Such instances have caused more caution and concern about food safety
characteristics. Also, these instances indicate that the current food safety and quality
standards are not sufficient to satisfy the quality expectations of consumers to assure their
trust in the safety of the food supply.
Due to the variety of food safety incidents occurring in different countries
around the world, people have lost some confidence in the safety of the food products
that they consume. This has led to initiatives that proport to result in safer products, such
as a movement to organic foods, and the marketing of “ecologically clean” products in
the EU, Eastern Europe and Central Asia. The success of these programs, when they are
legitimate, is due in large part to an assurance that the producer can verify that certain
types of contaminants are not present in the food through the use of traceability
programs. It is inevitable that traceability will be incorporated into food production
practices as a means to gain people’s confidence. For example, Becker (2000) and Wall
(1994) identify traceability as a very significant system to ensure the quality production
practices and product quality at firm or industry level.
The results of those outbreaks or contamination incidents did not only
increase consumers’ concerns over the food products that they consume but also such
5instances damaged the reputation of companies operating in certain industries. Some
industries suffered from loss of their buyers domestically and internationally and had to
bear millions of US dollar investments to improve their reputation due to the outbreaks of
food borne diseases. Others, like Hudson Beef went out of business due to a
precautionary recall. Because of restructuring of the beef trade between the US and
Canada from the BSE incident in December 2003, companies including Iowa Beef have
sold operations as a means of remaining viable. To support firms or industries to control
those outbreaks in meat sector and reducing costs related with the rehabilitation of the
reputation of the industry, improved traceability methods have been introduced as a
system and developed in certain countries successfully.
A number of traceability strategies have been applied as a tool to provide the
capability to both provide information on the safety of food products and to more
efficiently recover any impacted product from the marketplace. A very limited study has
been undertaken to show what the potential economic benefits of an improved
traceability program could be for an industry segment or for individual firms.
Research Objectives
The overall objective of this research is to highlight economic benefits of the
traceability for small and medium sized enterprises (SMEs) by analyzing benefits and
application costs. In other words, this research aims at identifying whether small and
medium sized enterprises will be better off applying traceability in an integrated food
supply chain. The analysis will also propose answers to the questions: will SMEs capture
more market power and will they be able to differentiate their products by introducing the
6new system to their production practices and work force? In addition, the research will
address the following objectives:
1. The research will produce a set of technical assumptions that will show the importance of traceability in the development of trade and markets for SMEs.
2. It will identify and recommend strategies on how U.S. small and medium
enterprises can benefit from traceability to improve their trading and marketing opportunities.
Summary of Findings
The study strongly suggests that traceability is a significant tool to assure
consumers about food safety and enable firms to differentiate their products to gain
advantage over their rivals. In addition, the firm also can benefit from economies of scale
to improve efficiency of production practices as illustrated in the chapter 3, section 3.4.
The study also found that traceability has become a crucial issue for the US
beef industry to compete in the international as well as domestic market, because major
beef producing and exporting countries like Australia, EU, New Zealand and Canada
achieved significant steps in producing traceable products to meet expectations of
consumers.
Background of the Study
Many countries began mandating traceability in their food supply systems
beginning in the 1960s in the form of lot codes for low acid and acidified thermally
processed “canned” foods. Country of origin labeling began in the late 1970’s as a tool of
government agricultural programs. They were further developed in the 1980s’ through
the present day to address concerns over consumers’ right to know and to reduce
7fraudulent representation of products in the marketplace. The most recent country (and
specific regional) origin labeling came about in 2004 as part of the US Farm Bill and with
proposed market restrictions on the use of specific place names tied to popular food
products. Examples of the latter led to trade disputes over the use of the name Parmesan
cheese (Parma Italy) and champagne (Champagne region of France) among several
others. Country of origin labeling in the 1980s and 1990s was also tied with specific
zoonotic disease control measures. European Union and Japan are the first to implement
and then to mandate traceability through all stages of the production for mammalian
muscle food products. As Schwagele (2005) stated, there was a need for traceability in
Europe to provide quality verification information to consumers about the origin of the
animal, its place of processing, distribution and wholesale, retail outlets. The system
enabled certain food industries to instill consumer confidence in the food consumed and
also empowered the related public health authorities to be more responsive in the unlikely
event that food would have to be removed from the marketplace since it would be easier
to identify and recall infected products.
In the international arena, the U.S. beef industry remains behind international
competitors in terms of application and development of traceability in food and
particularly in livestock (Smith, Tatum, Belk, Scanga, Grandin & Sofos, 2005), and
consequently, this has caused U.S. meat exporters to lose market share and has weakened
the market power of many US players. Japan, for example, banned the import of US beef
because of one infected cow in 2003, and only removed the ban in late 2005. There were
recent closures in January 2006 due to failure of U.S. shipments to comply with customer
specifications in shipping beef, which contained nerve tissue. This incident resulted in
8loss of tens of millions of dollars of export revenues for U.S. beef producers. In response,
large U.S. firms that lost export market shares started to strengthen their focus and
increase reliance on the domestic market. Also, the restructuring of the U.S. and
Canadian beef industries in 2004 and 2005 resulting from restrictions on shipping cattle
across the border has had a greater impact on smaller producers and ranchers with regard
to both supply and price. Canadian ranchers, particularly those in the border states, were
not able to send cattle for processing in the U.S. Similarly, a number of processors in the
United States, already in financially tenuous situations, shut down as it became difficult
to obtain enough animals to remain financially viable. A strategic change during this
period among major players facilitated very strong competition in the market place and
pushed SMEs out of the market, because SMEs were not as financially strong as the large
firms and was not able to bear high costs of competition in the long run.
An additional factor affecting traceability in the U.S. food supply came after
September 11, 2001 when US citizens became more concerned about the safety of critical
infrastructure including food and water supplies following the attack on the Twin Towers
in New York City. Terrorists had previously targeted the food supply in the United
States, with the most notorious incident being a 1984 contamination of the salad bars in
10 restaurants in The Dalles Oregon, along a major east-west interstate highway, by a
religious cult intent on throwing a local election. The terrorists intentionally contaminated
products with Salmonella typhimurium.
As part of a larger program to address the threat of terrorism, Congress passed
a law named as the Public Health Security and Bioterrorism Preparedness and Response
Act (signed into law June 12, 2002) (Shapiro, 2002). The purpose of this law was to
9improve government response programs to a public health crisis, including production
smallpox vaccine and to change government regulatory control over food and public
water supplies. This bill greatly expanded the authority the FDA experts over products it
regulates and expanded the agency’s jurisdiction over farm production and retail sale
(Rasco & Bledsoe, 2005). Within this bill and the resulting regulations are mandatory
traceability requirements.
Even today, in the United stated traceability is not mandatory for all products,
with those regulated by the USDA (meat and poultry) under less oversight than products
under FDA control. Actual requirements for FDA regulated foods is open to
interpretation, which provides some flexibility to food producers to select a traceability
program that meet their needs and those of their customers. Due to the incoherent
regulatory framework surrounding traceability in the United States, the primary
incentives within the food industry are market driven, with a major incentive being
inventory and supply chain management, as well as increased food safety and quality
control (Golan, Krissoff, Kuchler, Calvin, Nelson & Price, 2004).
10
CHAPTER 2
PREVIOUS STUDIES
People are increasingly more concerned about food safety. They want to be
confident that they consume safe food, which complies with well-accepted food safety
standards and regulations. Nortje (2002) stated that consumers especially in developed
countries such as the U.S., those of the EU and Japan are becoming more concerned
about the safety of their food. Similarly higher income individuals in developing
countries are demanding safer food as they now have the economic power to influence
the marketplace to make provision of safer food a reality. Traceability is one of many
means used in marketing programs to help people become more confident that the food
they consume is safe since one of the key features of a traceability program is the ability
to verify that the food complies with specific food safety standards. Another feature is the
ability to isolate only affected products that might have become contaminated, allowing
other similar product to remain on the market in the case of a recall event regarding food
safety. In order to better understand what traceability is, we should first look at how it is
defined.
Definitions
In the General Food Regulation Law of European Union, traceability is
defined as “the ability to trace and follow a food, feed, food-producing animal or
11substance intended to be or expected to be incorporated into a food, feed through all
stages of production, processing and distribution.”(Article 18, General Food Law 2004,
p.8).
Traceability is defined by the International Organization for Standardization
(ISO) “as ability to trace the history, application or location of that which is under
consideration.” (The Business Forum, 2005, p.7).
Previously provided definitions state that the traceability may be defined in
several ways, all of which overlap to some degree. A general definition recognizes
traceability as a method that enables tracking of inputs and outputs in all stages of the
supply chain and tracing a product and its components back to their source of origin in
the case of a contamination problem.
Traceability Functions
According to Hobbs (2004a) Traceability has three main functions to be
performed, which are the follows:
First, is to make the trace back of the products easy and rapid in the event of a
contaminated product or one, which does meet product standards, if it has to be removed
from the market. By this, an effective traceability program limits the problem from
spreading more and reduces the cost for companies of the impact of a recall or market
withdrawal (e.g. less reduced loss of sales, less lost revenue, less affected product on the
market, less damage to the company image and less lost goodwill with customers and the
general public). Accurate and complete tracking records for products can reduce the
impact of a product recall by limiting the scope since potentially affected product can be
12better defined and contained. If there is an illness outbreak associated with food,
traceability programs can provide background information that could improve diagnoses
and reduce the overall cost for patient care since it may be possible to determine more
quickly and accurately which individuals may have been made ill by an implicated food.
Second, is the ability to mitigate damages in a contract, commercial law and
tort actions. The primary losses from a food recall to an affected firm come from
disruptions in the supply chain. Consumer litigation under state product liability and
consumer protection laws exposes a company responsible for the distribution of allegedly
contaminated food to strict liability. The company distributing a contaminated product is
likely liable for any damages resulting from the consumption of the food regardless of
whether or not the company was negligent.
Buzby and Frenzen (1999; Buzby et al., 2001a, b) point out that the legal
incentives for firms to produce safer foods and practice due dilignce in the US are
limited, because less than the 0.01% of the cases of food borne illness are taken to court,
most likely because the source of contamination could not be attributable to a particular
food product, and in addition, because negligent consumer food handling practices could
not be ruled out. In the cases that are litigated, the rate of compensation is low.
Regardless, the application of traceability provides an incentive to avoid litigation,
particularly as it becomes widely adopted throughout the industry. A common legal
standard for a defendant in suits brought under a negligence cause of action is that of a
“prudent processor” an individual or company that can be shown to have exercised
“reasonable care” in processing and handling a food. As industry practices improve, the
level of care required of processors increases causing both a market driven improvement
13in food safety and an improvement in overall quality standard practices. It is possible that
litigation in the US will find fault with the effectiveness of a company’s traceability
program and introduce this deficiency in a food traceability program as evidence that the
company failed to exercise reasonable care. For food products, including FDA regulated
products, where traceability is mandated by regulation, failing to have a traceability
program will constitute negligence per se, providing some evidence, but not conclusive
evidence, that a company was negligent (Rasco, 1997; Buzby et al., 2002). Regardless of
the legal theory that might be employed to impose liability upon a company, traceability
programs will provide another incentive for firms to produce safer food, because they
will know that in the case of an outbreak the supplier of the infected product could be
easily determined.
Third, is basis for a developing a traceability program is for pre-purchase
quality verification. With traceability information, a purchaser will be able to have
relevant information on the quality properties of a product. With traceability, a purchaser
may also be able to verify growing conditions, inspection protocols and nutrient content
in addition to the information that is already provided such as the packing date, place,
and producer etc. and what can be recovered through barcodes or product labeling to
identify product features.
Different Types of Traceability Models
According to Hobbs (2004a), there are two distinct models for traceability: ex
post traceability and an ex ante quality verification systems.
14An ex post traceability system would be appropriate in the case of a foodborne
disease outbreak or intentional contamination incident. It traces back the product to the
lot or source of contamination and then traces forward to locate the contaminated product
in the marketplace, providing the ability to isolate it from unaffected products.
Theoretically, similar products, which were not affected, would not be involved in the
market withdrawal, reducing the costs of a recall and, hopefully, saving a company’s
reputation. As Hobbs (2004a) points out, there are three additional costs for a company
in the case of an outbreak that results in a market withdrawal.
The first cost is the market penalty cost if the company is the provider of the
contaminated food. A market penalty cost for a specific firm, is the cost associated with
the loss of demand for the products, because fewer consumers are willing to purchase
their products, which in turn, leads to lower revenue.
The second cost is the legal liability cost imposed on a firm, which is the
supplier of the contaminated products since food producers, in the United States and the
EU are strictly liable for damages such food borne illness or physical injury if a consumer
is injured by consumption of their product. This cost greatly exceeds Hobb’s concept of
due diligence in producing food as companies are liable for damages without fault.
Employment of industry best practices will not insulate a company from strict liability
claims. Due diligence is some protection against cases arising under a negligence cause
of action and involves the steps taken to produce safer foods or products. An example to
due diligence is a Hazard Analysis Critical Control Point (HACCP) food safety program.
For seafood products under the FDA and meat and poultry products under the United
States Department of Agriculture (USDA), which must follow HACCP, programs are
15required and have been required for the past 8-10 years. Having a HACCP plan will not
reduce liability exposure, but it could be useful of mitigating damages resulting from a
recall. In addition to the formalized food safety programs, liability cost will be imposed
to those firms that do not take steps to produce safer foods if they are not engaging in
practices that would limit the liability of other companies down the supply chain. For
examples, corporate buyers are less willing to purchase products from vendors that do not
process under a validated HACCP plan and make it a requirement of vendors within a
preferred supplier program to participate in corporate audit programs to show that the
supplier firm is following industry best practices regarding manufacture and sanitation.
The market penalty and liability costs arise in the absence of an effective traceability
program for the buyer are greater if the supplier of the contaminated food cannot be
clearly identified.
The third cost discussed by Hobbs (2004a) arises is named externality cost.
Because contaminated product suppliers cannot be detected in the absence of traceability
system, all the firms operating in the industry incur the cost caused by a lower demand by
consumers for all the industry products regardless of the provider of the product because
of a lack of confidence in the product category. This is known as an externality cost.
Ex ante1 quality verification works differently than ex post2 programs. In an ex
ante system, a third party verifies the quality of the products or the compliance of the
producers with the standards. The effectiveness of such a program from a profit
1 The ex ante is Latin word means in the context of the traceability: “tracing the product up to
the consumer by providing quality verification information. 2 The ex post is also Latin word means in the context of the traceability: “tracing the product
from consumer to the origin or farm.
16maximizing company depends on the effectiveness of the monitoring party. As Hobbs
(2004a, p.408) claims “traceability has little value for physical quality characteristics
identifiable by the buyer through a search process prior to purchase” (Hobbs, 2004a). An
ex ante program can verify following attributes such as:
1. Health Quality: these are attributes that a consumer cannot detect prior to
purchase. Monitoring by a third party is required to verify that products are in
compliance with the specified standards (e.g. fat and trans fat content,
cholesterol, fiber, phytochemical type and content).
2. Ethical Quality: These attributes refer to agricultural, marketing and labor
practices. Some ethical quality attributes would include whether animal
welfare friendly methods were used in production. A company may use
products promoting the sustainable agricultural practices in its production,
which would be extremely difficult if not impossible to detect by an analysis
of the product, as it would be rare for the sensory attributes, physical structure
or chemical composition of the product to be different in foods that did not
have the target ethical quality attributes. The only way to verify if such a
program is being followed is for a third party to audit the program ensuring
that the specified guidelines are met.
3. Environmental Quality: Certain aspects of organic farming fall under this
criteria as far as soil and water management issues are concerned. Other issue
with organic farming, such as the presence of impermissible levels of
agricultural chemicals or drug residues can be detected, albeit at a high cost.
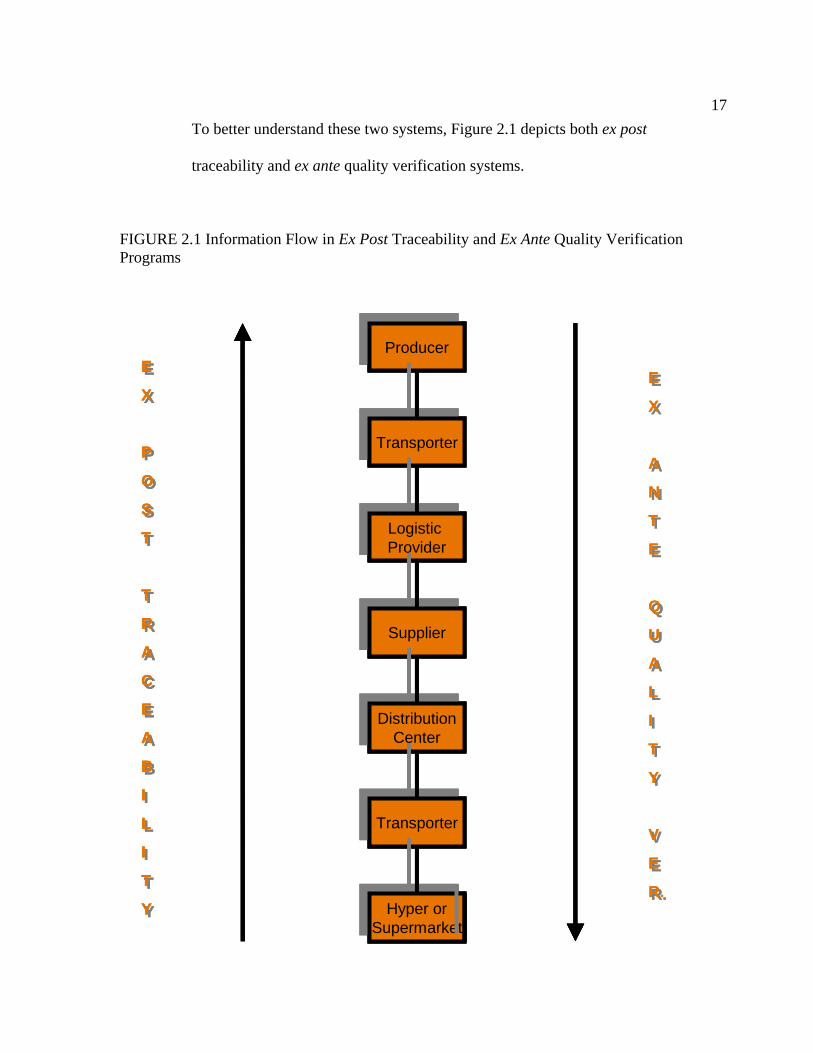
17To better understand these two systems, Figure 2.1 depicts both ex post
traceability and ex ante quality verification systems.
FIGURE 2.1 Information Flow in Ex Post Traceability and Ex Ante Quality Verification Programs
E
X
A
N
T
E
Q
U
A
L
I
T
Y
V
E
R.
E
X
A
N
T
E
Q
U
A
L
I
T
Y
V
E
R.
ProducerProducer
TransporterTransporter
Logistic ProviderLogistic Provider
SupplierSupplier
DistributionCenter
DistributionCenter
TransporterTransporter
Hyper orSupermarket
Hyper orSupermarket
E
X
P
O
S
T
T
R
A
C
E
A
B
I
L
I
T
Y
E
X
P
O
S
T
T
R
A
C
E
A
B
I
L
I
T
Y
E
X
A
N
T
E
Q
U
A
L
I
T
Y
V
E
R.
E
X
A
N
T
E
Q
U
A
L
I
T
Y
V
E
R.
ProducerProducer
TransporterTransporter
Logistic ProviderLogistic Provider
SupplierSupplier
DistributionCenter
DistributionCenter
TransporterTransporter
Hyper orSupermarket
Hyper orSupermarket
E
X
P
O
S
T
T
R
A
C
E
A
B
I
L
I
T
Y
E
X
P
O
S
T
T
R
A
C
E
A
B
I
L
I
T
Y
ProducerProducer
TransporterTransporter
Logistic ProviderLogistic Provider
SupplierSupplier
DistributionCenter
DistributionCenter
TransporterTransporter
Hyper orSupermarket
Hyper orSupermarket
E
X
P
O
S
T
T
R
A
C
E
A
B
I
L
I
T
Y
E
X
P
O
S
T
T
R
A
C
E
A
B
I
L
I
T
Y
18
Comparison of Different Traceability Applications
in Different Countries
As it is stated in the previous parts of the study, traceability is increasingly
becoming an important means to assure food safety and provide valuable market
information about a product that is not readily discernible.
The main objective of traceability is to maintain consumers’ confidence.
Firms, however, would like to gain the confidence to be more competitive compared to
their rivals and make more profits since businesses exist to make money. Public
authorities would like to have traceability in their supply chain to protect the public’s
health and to pinpoint the responsible player for the contamination within a very short
period of time.
There are some countries, which have made traceability mandatory, and some,
which recognize voluntary programs for beef products. Countries of the EU and Japan
have made traceability compulsory for the firms operating in the food sector; the level of
traceability applied in these countries is from farm origin to table (Souze-Monteiro &
Caswell, 2004). In Australia and Brazil, traceability is voluntary for the local market but
it is mandatory for companies that are exporting to Europe and Japan (Souze-Monteiro &
Caswell, 2004) Argentina imposed traceability only upon exporting firms and to
companies, which produce meat and livestock products in regions where animal diseases
are often encountered. In the Argentinean domestic market traceability is not compulsory
if the firm produces meat in a recognized safe region (Souze-Monteiro & Caswell, 2004).
19In this part of thesis work, the different traceability systems are analyzed and
compared in those countries, which are stated above.
There are certain differences among traceability systems applied by different
countries. In order to understand these differences, the definition and description of
breadth depth, and precision must be known.
Breadth: breadth “describes the amount of information the traceability
system records. There is a lot to know about the food we eat and a record keeping system
cataloging all of a food’s attributes would be enormous, expensive, and unnecessary.”
Depth: depth “describes how far back or forwards the system tracks. In most
cases, the depth of a system is largely determined by its breadth: once the firm or
regulator has decided which attributes are worth tracking, the depth of the system is
fundamentally determined.”
Precision: precision “reflects the degree of assurance with which the tracing
system can pinpoint a particular food product’s movement or characteristics. The unit of
analysis used in the system and the acceptable error rate determines precision.” (Golan et
al., 2004).
United States
In the states of Washington and Texas in December 2003 and June 2005
respectively, two BSE infected cows were identified, which led the United States to seek
a better tracking system for use in livestock sector (Bailey, Robb & Checketts, 2005).
Currently, the U.S. traceability system is based on two steps. The first step is
from farm to slaughterhouse and the second is from processing plant to retailer (Bailey,
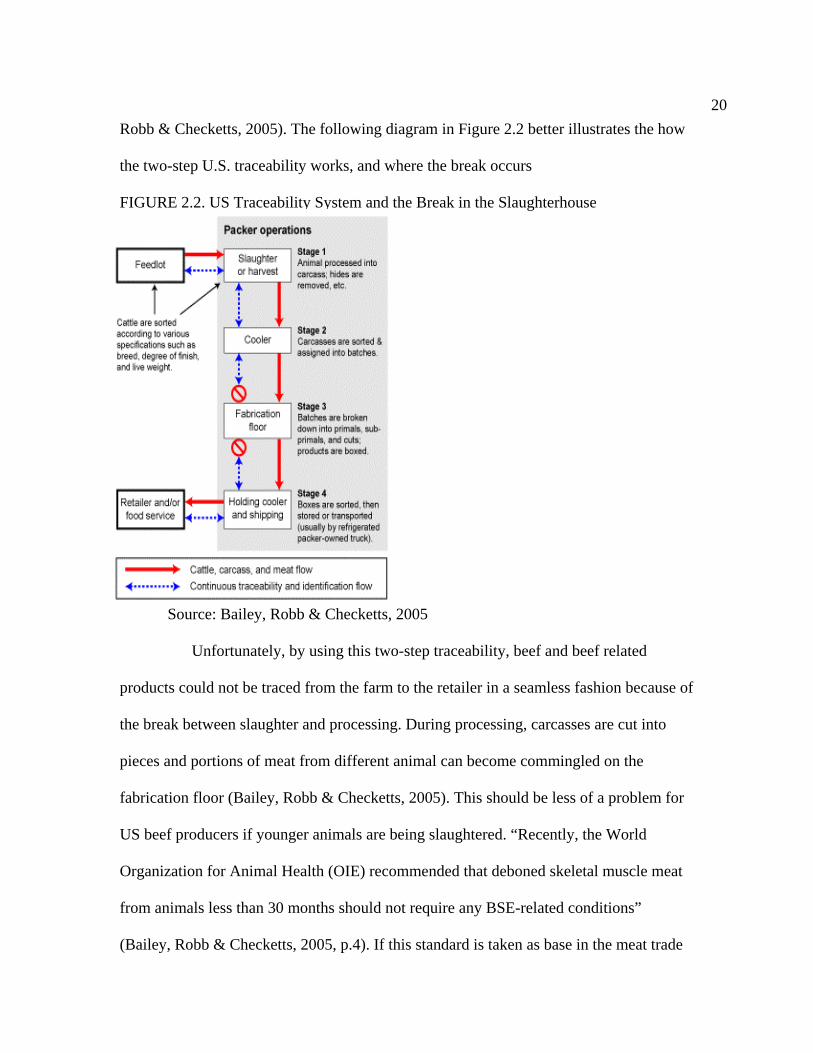
20Robb & Checketts, 2005). The following diagram in Figure 2.2 better illustrates the how
the two-step U.S. traceability works, and where the break occurs
FIGURE 2.2. US Traceability System and the Break in the Slaughterhouse
Source: Bailey, Robb & Checketts, 2005
Unfortunately, by using this two-step traceability, beef and beef related
products could not be traced from the farm to the retailer in a seamless fashion because of
the break between slaughter and processing. During processing, carcasses are cut into
pieces and portions of meat from different animal can become commingled on the
fabrication floor (Bailey, Robb & Checketts, 2005). This should be less of a problem for
US beef producers if younger animals are being slaughtered. “Recently, the World
Organization for Animal Health (OIE) recommended that deboned skeletal muscle meat
from animals less than 30 months should not require any BSE-related conditions”
(Bailey, Robb & Checketts, 2005, p.4). If this standard is taken as base in the meat trade
21then, this break in two-step U.S. traceability system will not prevent traceability from
retailer to farm, at least for the risk of BSE, however problems would still exist for other
types of possible contamination. For example, this ‘break’ in traceability would increase
response time for recalling product that would be affected in an incident involving
chemical contamination of feed, such as the dioxin incident in Western Europe in 1999.
In the United States, food producers have developed an enormous ability to
track the flow of food products through the supply chain. Since there is no strict
mandatory protocol, companies are able to develop individualized traceability systems
that are effective for their operations; therefore the systems used vary widely across the
county and between different industry segments.
The US Congress mandated Country of Origin Labeling (known as COOL)
for many crops and products including beef in the 2002 Farm Bill (Smith et al., 2005).
“Regardless of whether pressure for better tracking comes from consumers, suppliers, or
procurers, it is likely that the U.S. meat system will continue to move toward more
traceability” (Bailey, Robb and Checketts, 2005, p.8). Moreover, the COOL would
inform consumers about the country of origin and enable retailers to label whether the
beef product of the cattle were born and raised in US (Smith et al., 2005). Except wild
and farm-raised and shellfish implementation of provisions for all covered commodities
has been delayed until September 30, 2008 (http://www.ams.usda.gov/COOL).
The BSE cases in Canada and the U.S. have changed the approach of
government and industry toward how the USDA addresses traceability for products under
its jurisdiction in the United States (Souza-Monteiro & Caswell, 2004). The government
started taking more serious actions and has constituted an expert team to work on the
22Animal Identification Plan (USAIP), also know as National Animal Identification Plan
(NAIS) for U.S. livestock. In the United States, currently, traceability systems such as
animal identification are voluntary and it is more market driven. Golan et al (2004)
specified the incentives for US firms for applying traceability in their systems as follows:
1. Supply-side Management: The ability of a firm to reduce cost such as
movement, storage, and control of products in the supply chain is the
determinant for that company to be successful or to go bankrupt. Since
companies operating in the food industry where profit margins are very low,
then, supply-side management becomes more important if a firm is to remain
competitive in the market. Therefore, an effective and efficient traceability
system is a key factor to reducing the cost associated with the above given
supply-related activities.
2. Food Safety and Quality Control: Traceability for food safety and quality
control is an essential tool to facilitate the isolation of a source of
contamination and reduce the impact of a food safety problem. If the system
applied is very precise, then it can be very fast to identify the problem and
resolve it. The incentive for firms is to have the ability within a traceability
system to minimize the production and distribution of unsafe or poor quality
products, which will in turn, minimize the potential for bad publicity, liability
and recalls.
3. Differentiate and Market Foods With Subtle or Undetectable Quality
Attributes: Since the food industry and especially the meat sector is very
competitive, firms operating in this sector are trying to differentiate their
23products in order to stay competitive in the market. Companies use a number
of different ways to differentiate their products from those of their
competitors; including taste, texture, nutritional content, feeding techniques
and origin. Consumers can discern some of the characteristics and cannot
discern others, which are known as credence attributes. The only means to
allow consumers to discern these attributes is traceability. Credence attributes
can be gathered under two basic topics:
I. Content Attributes: These attributes can affect the physical characteristics of
products and they are difficult for consumers to realize.
II. Process Attributes: These attributes do not have any affect on the products
consumers purchase (known as a final product). However, these attributes
refer to characteristics of the production process, such as country of origin,
free-range, dolphin-safe, or earth friendly.
Both US public and private authorities are more careful in responding to the
concerns of international and domestic markets (Souza-Monteiro & Caswell, 2004, p.21),
because the markets have become very sensitive to food safety issues. For example, the
first Japanese domestic BSE case dramatically decreased beef imports, which can be seen
in Figure 2.3.
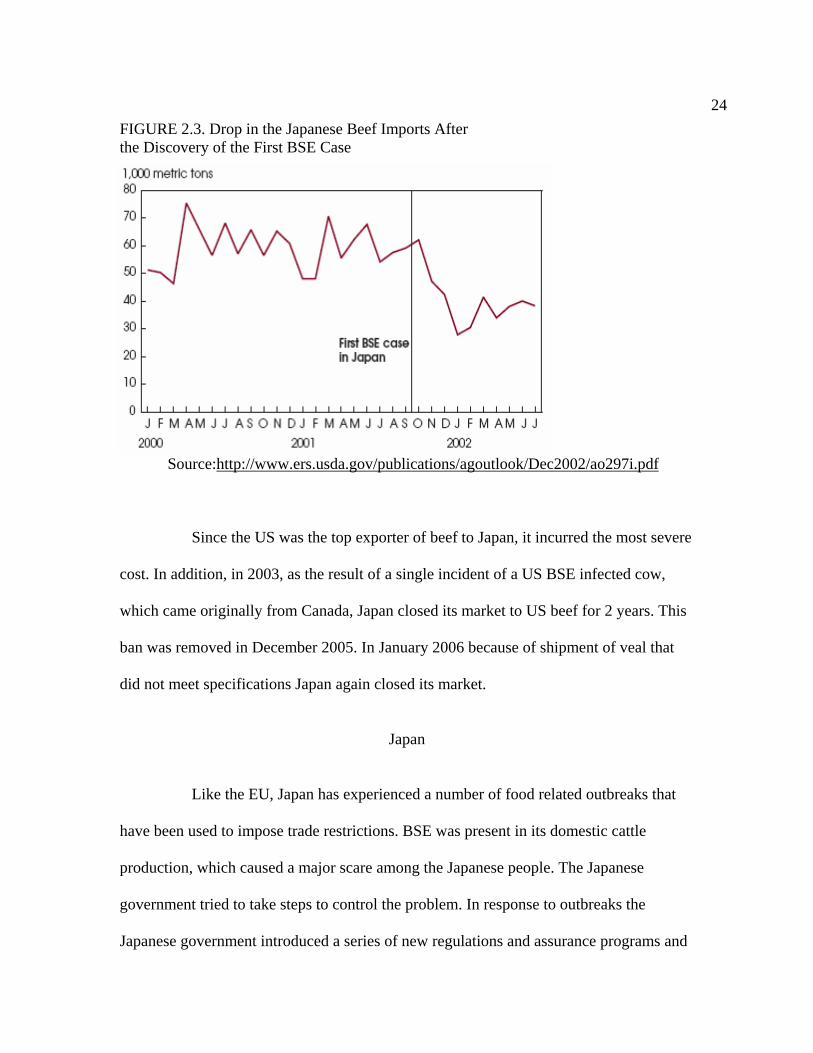
24FIGURE 2.3. Drop in the Japanese Beef Imports After the Discovery of the First BSE Case
Source:http://www.ers.usda.gov/publications/agoutlook/Dec2002/ao297i.pdf
Since the US was the top exporter of beef to Japan, it incurred the most severe
cost. In addition, in 2003, as the result of a single incident of a US BSE infected cow,
which came originally from Canada, Japan closed its market to US beef for 2 years. This
ban was removed in December 2005. In January 2006 because of shipment of veal that
did not meet specifications Japan again closed its market.
Japan
Like the EU, Japan has experienced a number of food related outbreaks that
have been used to impose trade restrictions. BSE was present in its domestic cattle
production, which caused a major scare among the Japanese people. The Japanese
government tried to take steps to control the problem. In response to outbreaks the
Japanese government introduced a series of new regulations and assurance programs and
25many of these were at least based upon traceability systems (Clemens 2003b). As
Clemens (2003a) stated these new assurance programs with traceability will bring extra
cost to agents in the meat supply chain and also, if importers’ demand regarding
traceability cannot be met by their suppliers may lead to loss of market share to
competitors.
The Japanese government applied traceability in livestock to identify the
cohorts in the event of animal diseases and passed a law to control BSE in July 2002,
which required traceability from feedlot to packing plant (Clemens 2003 b). In this new
system, each cow was given an identification number and producers must submit
information such as date of birth, sex, breed, name and address of the owner, place and
date of fattening begun and date of slaughter (Clemens 2003 b). The Japanese
government was responsible for enforcement of this system and the collected data on
individual animals was entered into a database called. “Family Register” (Clemens
2003b).
In June 2003, the Japanese government passed another law, which required
traceability from farm to retail sale and all the stakeholders in the supply chain requiring
processors, distributors, and retailers to implement a traceability system and prove
information by December1, 2004 (Clemens 2003 b).
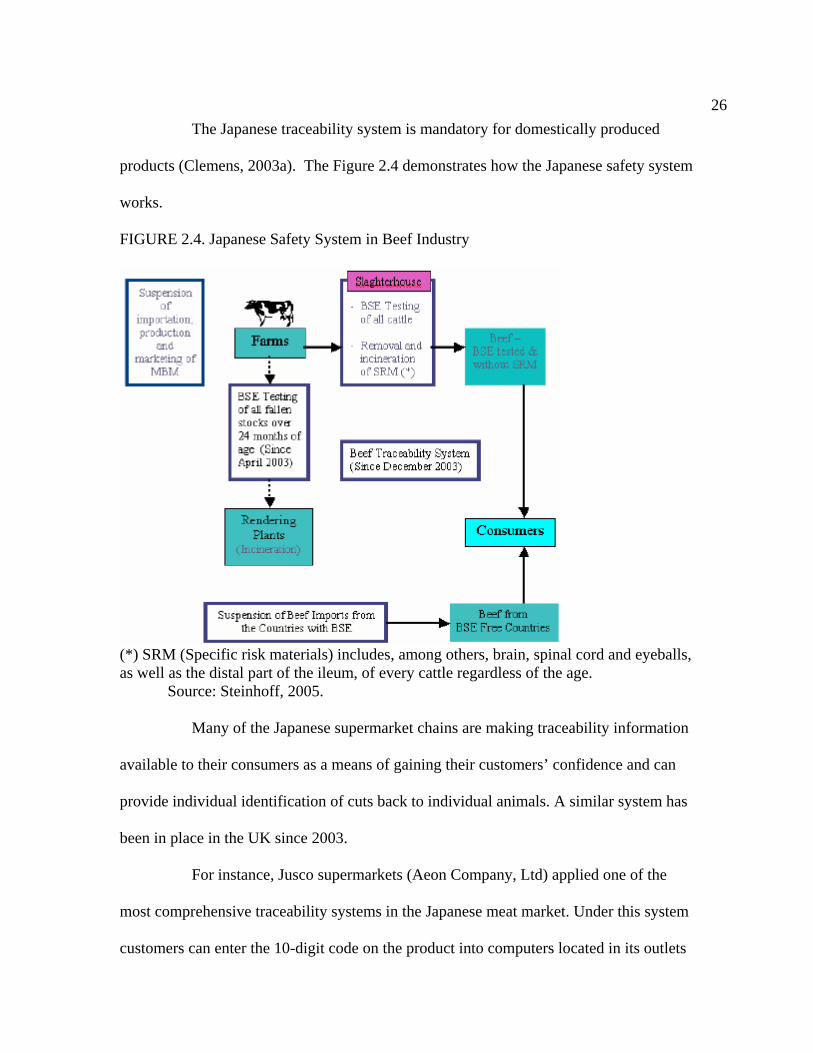
26The Japanese traceability system is mandatory for domestically produced
products (Clemens, 2003a). The Figure 2.4 demonstrates how the Japanese safety system
works.
FIGURE 2.4. Japanese Safety System in Beef Industry
(*) SRM (Specific risk materials) includes, among others, brain, spinal cord and eyeballs, as well as the distal part of the ileum, of every cattle regardless of the age.
Source: Steinhoff, 2005.
Many of the Japanese supermarket chains are making traceability information
available to their consumers as a means of gaining their customers’ confidence and can
provide individual identification of cuts back to individual animals. A similar system has
been in place in the UK since 2003.
For instance, Jusco supermarkets (Aeon Company, Ltd) applied one of the
most comprehensive traceability systems in the Japanese meat market. Under this system
customers can enter the 10-digit code on the product into computers located in its outlets
27to get information about the products they purchased (Clemens, 2003a, b). Customers can
read as well as print out the BSE certificate, which the Government issues, and include an
official stamp and a statement indicating that the meat was delivered to their company
(Clemens, 2003 a). This certificate also includes information such as date of slaughter,
breed, sex, slaughter number, name of the producer, the carcass number, the unique
identification number and date. In addition to this information, the name and address of
the packing plant and the inspector’s name is identified.
Second, customers can read and print out another certificate, which enables
customers to trace the animal back to its time and place of birth, and the information in
this certificate is similar to that of the first certificate and information such as the
shipping date, ear tag number, and slaughter date and processing plant (Clemens, 2003a).
Finally, by entering the 10-digit code consumers can see the producers’ picture, because
market research shows that Japanese consumers feel more comfortable about the meat
they purchase when they see they can identify with the individual or individual company
responsible for producing their food (Clemens, 2003a). Other Japanese markets are using
similar systems to assure consumers about the safety of their products of the producers.
As Souza-Monteiro and Caswell (2004) point out, the introduction of a
mandatory traceability system in the Japanese meat sector has had some effects on beef
trade. Since Japan is one of the major beef importers, many of its beef suppliers are
facing the challenge of introducing traceability in their production practice to market to
Japanese supermarkets. Souza-Monteiro and Caswell (2004) also point out, the breadth of
Japanese traceability system is broader than that of European Union and both countries
Japan and European Union have equal traceability in place regarding precision.
28Moreover, the precision of the system is from individual animals to their place of birth
and the integrity verification is DNA.
European Union
On the first of July 1987, the Single European Act took effect with the
objective of completing the Single European Market by 1992 (McGrann & Wiseman,
2005). The freedom of movement of live animals such as cattle, pigs, sheep and goats for
different purposes make it obvious that an effective identification and tracking system is
needed within the new single market (McGrann & Wiseman, 2005).
After the unification of the single market, insufficient transnational
traceability within the new market became a serious threat to health of people and
animals being traded (McGrann & Wiseman, 2005). According to a European Union
research, 11% of the food that is controlled in the EU does not comply with the EU
legislation (Trienekens & Beulens, 2001).
Between 1990 and 1999, beef consumption went down by 6% because of the
discovery of variant Creutzveldt-Jacobs disease, the human variant of BSE (Trienekens &
Beulens, 2001). In 2000, new BSE cases were found in France and Germany, which led
to 80% reduction in cattle meat sales in Germany, by mid-February 2001. The occurrence
of such BSE cases in the EU increased the necessity of an effective traceability system in
the European Union. Article 18 of General Food Law 2002 states the traceability is to be
applied at all stages of production for food, feed, food-producing animals, and any other
substance that is intended to be or expected to be incorporated into a food or feed. By this
29law food and feed businesses or operators should be able to identify their suppliers. For
this, such businesses and operators should have the needed systems in the place to make
any information query available to the competent authorities in the charge.
On January 1, 2005 the European Union mandated the traceability for all food
and feeds produced within the EU and imported into the EU (http://useu.usmission.gov).
There are two important provisions under the Regulation (EC) 1760/2000. Under Title I
as Souza-Monteiro and Caswell (2004) point out; two individual ear tags must be used as
part of the mandatory animal identification. One of them is an animal passport, which is a
document, issued for each animal within 14 days after birth and includes information
regarding animal health, movements and production procedures. “The second one is a
computerized database in each member state used to provide the link between farms and
abattoirs where animals are slaughtered” (Souza-Monteiro & Caswell 2004, p.8). Figure
2.5 better illustrates the way the system works in the European Union. As seen on the
below Figure 2.5 there is a central database for Europe which collects information from
individual state’s servers. As McGrann and Wiseman (2001, p. 410) state:
“The advantages of this approach are low maintenance and installation costs. The animal movement database application would be managed centrally. Maintenance of master files and look-up tables would also occur centrally. National servers would be updated electronically from the central server. Users would not need to dial up to transmit or receive messages. In addition, message would be available for users to query immediately after inversion”.
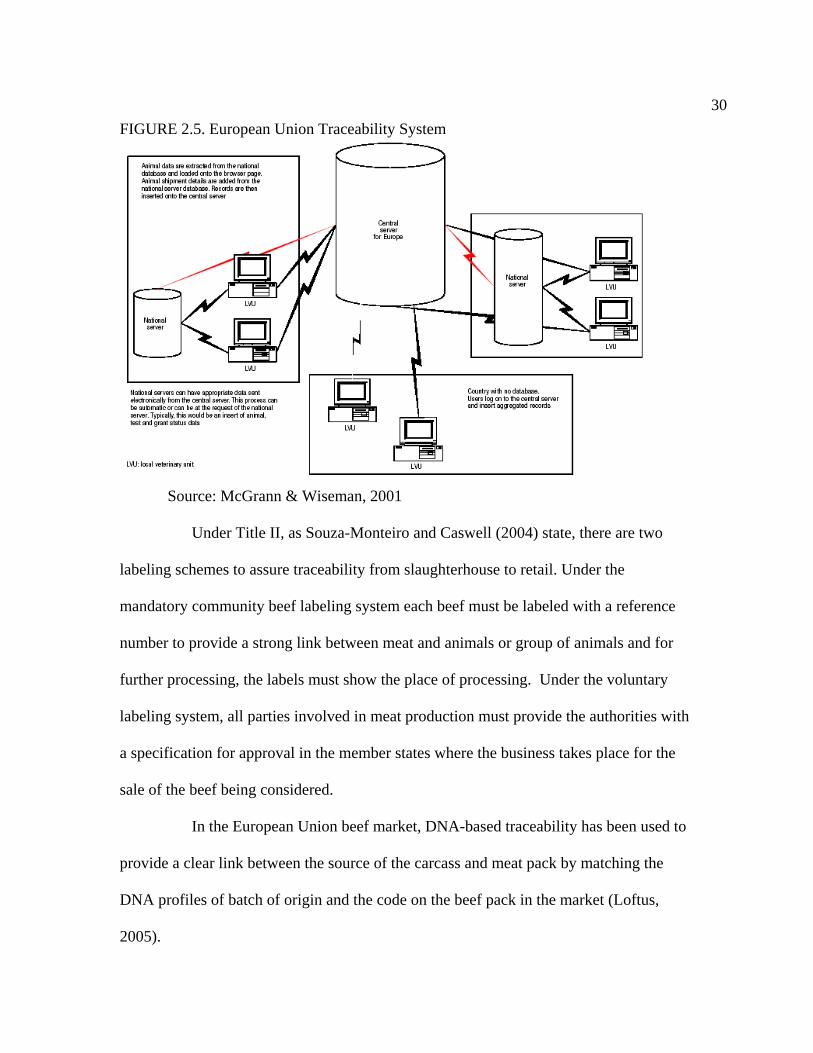
30FIGURE 2.5. European Union Traceability System
Source: McGrann & Wiseman, 2001
Under Title II, as Souza-Monteiro and Caswell (2004) state, there are two
labeling schemes to assure traceability from slaughterhouse to retail. Under the
mandatory community beef labeling system each beef must be labeled with a reference
number to provide a strong link between meat and animals or group of animals and for
further processing, the labels must show the place of processing. Under the voluntary
labeling system, all parties involved in meat production must provide the authorities with
a specification for approval in the member states where the business takes place for the
sale of the beef being considered.
In the European Union beef market, DNA-based traceability has been used to
provide a clear link between the source of the carcass and meat pack by matching the
DNA profiles of batch of origin and the code on the beef pack in the market (Loftus,
2005).
31The mandatory traceability system being applied in the European Union is
quite precise, deep and narrow in terms of breadth (Souza-Monteiro & Caswell, 2004).
The possible shortcoming of the European traceability occurs in the slaughterhouse
because of the links established with group of animals (Souza-Monteiro & Caswell,
2004).
Canada
The Canadian Cattle identification (CCID) is an industry initiated trace back
system established to contain and eradicate animal disease. The Canadian Cattle
Identification Agency (CCIA) established in 1998 to implement the identification system
in Canadian livestock. The CCIA launched the identification in the Canadian livestock as
a voluntary system in July 2001 and it became mandatory in July 2002 (Lawrence,
Strohbehn, Loy & Clause, 2003). The Canadian identification system is simpler
compared to that of Japan and European Union (Souza-Monteiro & Caswell, 2004). In
this system, cattle that are going to leave the herd are issued an ear tag, which has a
unique number (Hobbs, 2004b). The cattle carry the tag until the slaughterhouse whether
it is removed by the operator in the facility and reported to the authorities within 30 days
(Souza-Monteiro & Caswell, 2004). The tags are distributed by centers that are
authorized by CCIA and report to CCIA on the issued ID number to the producers
(Hobbs, 2004b). The CCIA provides the necessary software to those authorized centers
to report the sales of tags promptly and CCIA provides a premise identification number to
producers. The sales of tags are registered to this number and reported to CCIA through
the software. There are 1500 retailers or authorized centers across Canada provide tags to
32producers (Lawrence et al., 2003) There are penalties issued to non-compliant producers
by CCIA. If more than 5% of the cattle in a group is not tagged or missed tag, a C$$ 250
($226) penalty is issued to producer (Lawrence et al., 2003). If there is commercial non-
compliance, the penalty changes from C$ 500 ($452) to C$6000 ($5424). If the CCIA
official tag is deliberately dropped out, the penalty is 1,000 C$ (Lawrence et al., 2003).
The Canadian Cattle Identification system is the world leader in animal
identification with its 97% compliance (www.canadaid.com). The following example
better illustrate the effectiveness, (Lawrence et al., 2003):
“A Canadian Food Inspection Agency (CFIA) inspector detects problems during a post mortem inspection at a packing plant. He states that the tag number is 298278605. CCIA or CFIA enters the necessary passwords to get into the database and requests a tag history for that tag number. Within seconds the screen reports that the tag number had been allocated by CCIA to Ketchum Manufacturing for production purposes on November 16, 2000. On March 20, 2001, the tag was sold through a Ketchum distributor to John Newman. On August 1, 2002, the tag number was retired from Better Beef Packing plant in Guelph, Ontario. Double clicking on John Newman’s name provides his contact information”.
The Canadian Cattle Identification Agency (CCIA) is in the process of
moving into electronic bar codes scanners and Radio Frequency Identification® (RFID)
readers to make the system more efficient and credible. The overall goal of RFID Reader
Program is to ensure the cattle industry has the ability and necessary equipment for
comprehensive tracking and traceability. All the cattle leaving the farm must be tagged
with a CCIA approved RFID as of September 1, 2006. CCIA will recognize the bar
coded tags until December 31, 2007 to facilitate the transition. There are a number of
benefits of RFID listed on the CCIA website:
$ Canadian Dollar, 1 US $=1.1062 C$,
http://teachmefinance.com/Charts/US_Dollar_Foreign_Exchange_Rates.html , 06/10,2006, 13:04 ® Radio Frequency Identification (RFID) is a type of technology that uses reader to scan the
ear tags and transmit the data to receiver, which is usually a computer.
331. Provides the necessary basis for full animal movement tracking;
2. Provides accurate and efficient trace back information;
3. Ensures Canada has an accurate and comprehensive age verification system; 4. Allows for optimal retention;
5. Allows for the electronic reading of numbers without previously required line of sight;
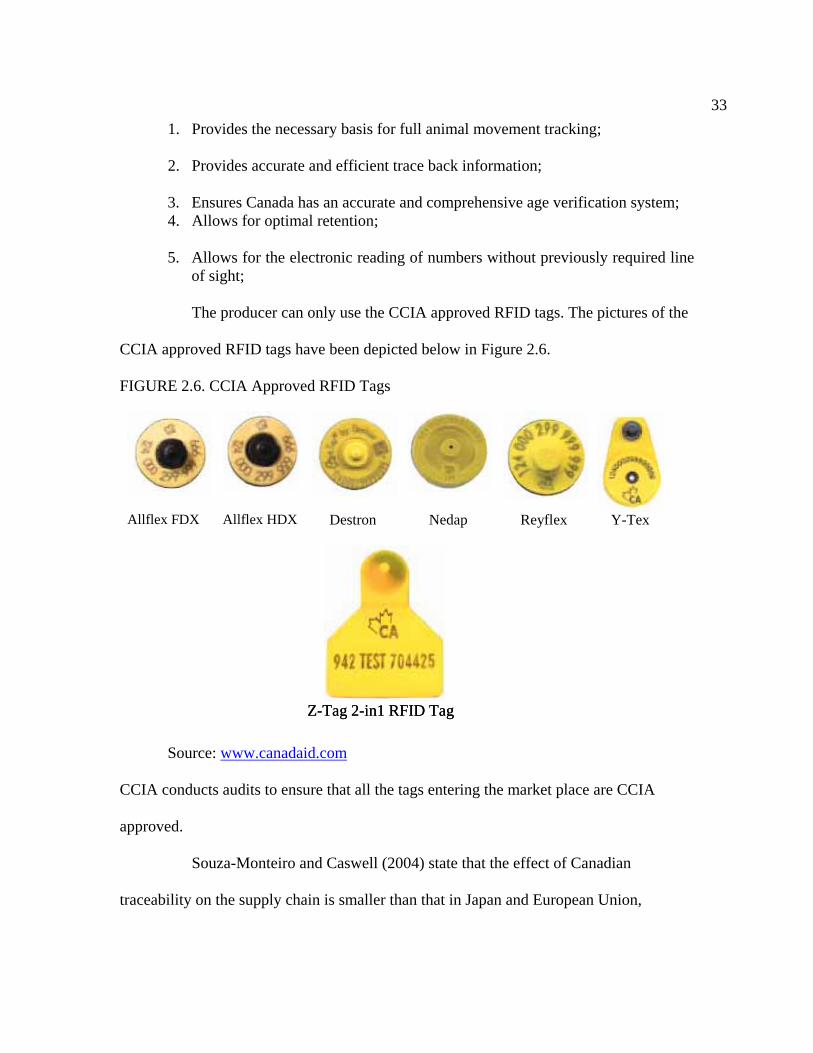
The producer can only use the CCIA approved RFID tags. The pictures of the
CCIA approved RFID tags have been depicted below in Figure 2.6.
FIGURE 2.6. CCIA Approved RFID Tags
Source: www.canadaid.com
CCIA conducts audits to ensure that all the tags entering the market place are CCIA
approved.
Souza-Monteiro and Caswell (2004) state that the effect of Canadian
traceability on the supply chain is smaller than that in Japan and European Union,
Allflex FDX Allflex HDX Destron Nedap Reyflex Y-Tex
Z-Tag 2-in1 RFID TagZ-Tag 2-in1 RFID Tag
34because Canadian traceability is not extended to retail outlets. However, it does trace
back the beef from export ports to farm (Souza-Monteiro and Caswell, 2004).
Australia
Australia maintains its position as being the world’s largest beef exporter by
supplying over 100 global markets. It has been internationally accepted as being free of
all major animal illnesses such as Foot and Mouth disease (FMD) and BSE
(www.mla.com.au).
To protect the reputation of Australian beef, government and industry jointly
established the SAFEMEAT to ensure that beef produced in Australia meets all sanitary
and safety standards (www.mla.com.au). Due to the application of strict and
comprehensive measures to protect Australia’s free of major animal’s illnesses, it is
recognized as Level 1 free of BSE by the European Commission Scientific Steering
Committee.
In order to identify livestock in the country, in 1996 Australia, jointly with the
industry, developed the National Livestock Identification System (NLIS). The NLIS was
implemented voluntarily in all Australian states and the State of Victoria mandated the
NLIS (Souza-Monteiro & Caswell, 2004). “The NLIS is a whole of life identification
system that enables the individual animals to be traced back from property of birth to
slaughter for food safety, product integrity and market access purpose” (Meat and
Livestock of Australia, 2006). The most important reason for the full implementation of
the NLIS is the fear whether the current tagging system can enable tracing of cattle in
case of a Food and Mouth Disease (FMD), because a government study showed that the
35overall economic loss as a result of a FMD outbreak could be between $2 to $13 billion
(www.mla.com.au).
Before the introduction of NLIS, Property Identification Code (PIC) known as
a mandatory tagging system has been in place since the 1960s. In this system, each
producer that breeds cattle is assigned a unique identification number and every cattle on
the land is tagged at the tail with that specific assigned number before the cattle leaves
the farm or the land (www.mla.com.au). In fact, this system constitutes the basis of the
current applied NLIS.
The reliability of NLIS is higher than other available identification systems,
because, the tags are read electronically and the data obtained is transmitted safely,
accurately, and quickly via the internet (www.dpi.vic.gov.au). The information collected
by the NLIS devices about the animal’s movement and history is stored on the national
NLIS database, which allows tracing of the cattle from farm to the point of slaughter.
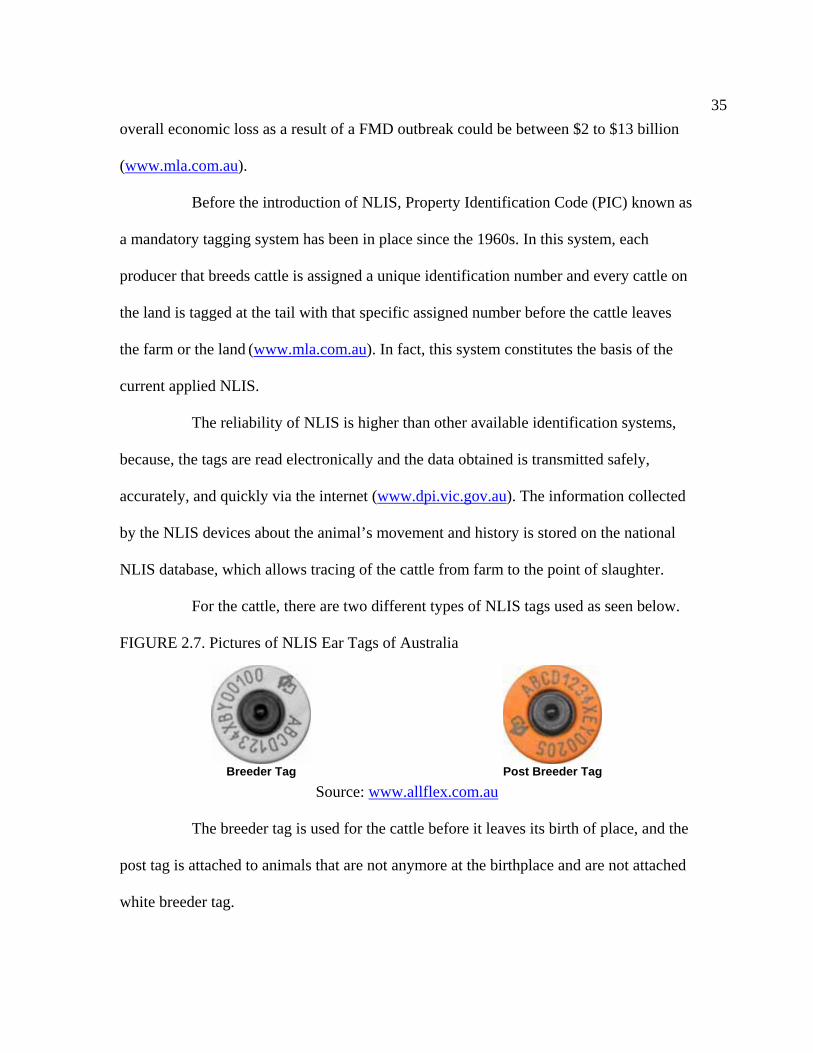
For the cattle, there are two different types of NLIS tags used as seen below.
FIGURE 2.7. Pictures of NLIS Ear Tags of Australia
Breeder Tag
Post Breeder Tag
Source: www.allflex.com.au
The breeder tag is used for the cattle before it leaves its birth of place, and the
post tag is attached to animals that are not anymore at the birthplace and are not attached
white breeder tag.
36In order to identify the cattle, machine-readable Radio Frequency
Identification devices are used, which are depicted above, in the NLIS. These devices are
endorsed by NLIS and have a microchip with a unique identification number linked to the
PIC (www.mla.com.au). In case of an outbreak, the cattle can easily be traced back and
linked to the farm it was raised by accessing the database, where all the information about
the cattle stored.
A study conducted by the Eclipse Group (2004, p.4) offers the following
findings about NLIS.
1. “All data sourced from the data sources was valid;
2. Any difference between the source data and data held in the NLIS database was due to subsequent movements of the animals; and
3. The NLIS database accurately records animal movements.”
Souza-Monteiro and Caswell (2004) concluded that the NLIS is precise and
more reliable than the identification systems in Europe and Japan because of the
electronic identification tags. The reason is that, in the RFID technology, reading the
microchip placed in the ear tag does identification and the radio waves are converted into
information and stored in the firm’s database (Kelepouris & Pramataris, 2005).
Therefore, the error rate is very low and the information collection is very rapid and
precise.
U.S. National Animal Identification System (NAIS)
The increased number of animal disease outbreaks and the two cases of BSE,
also known as mad cow disease, are the important developments that drew attention for
the need of a nationwide identification system in the United States. In order to safeguard
37US animal health and provide traceability in the supply chain, the USDA introduced the
National Animal Identification System (NAIS), which is a Federal-State joint program
carried out by the Animal and Plant Health Inspection Service (APHIS). In fact, the
United States is familiar with identification systems. In 1940s, in order to identify the
cattle that got vaccinated for brucellosis from those of not vaccinated, ear tattoo used
which government officials provided. The main objectives of the implementation of
National Animal Identification System are to:
1. Enable State and Federal animal agencies to swiftly determine animal health status to issue intrastate, interstate or international animal certificates.
2. Enable State and Federal agencies to identify the lost or scattered animals
caused by natural disasters.
3. Enable State and Federal agencies to take actions against animal disease
outbreak.
The ultimate long-term goal of NAIS is to identify all the premises and animals the
infected animal had contact with within 48 hours after the discovery of the disease.
The National Animal Identification System is a voluntary program. The
USDA would make the program mandatory only if it decides that it is necessary to do so.
Figure 2.8 depicts the development phase of NAIS.
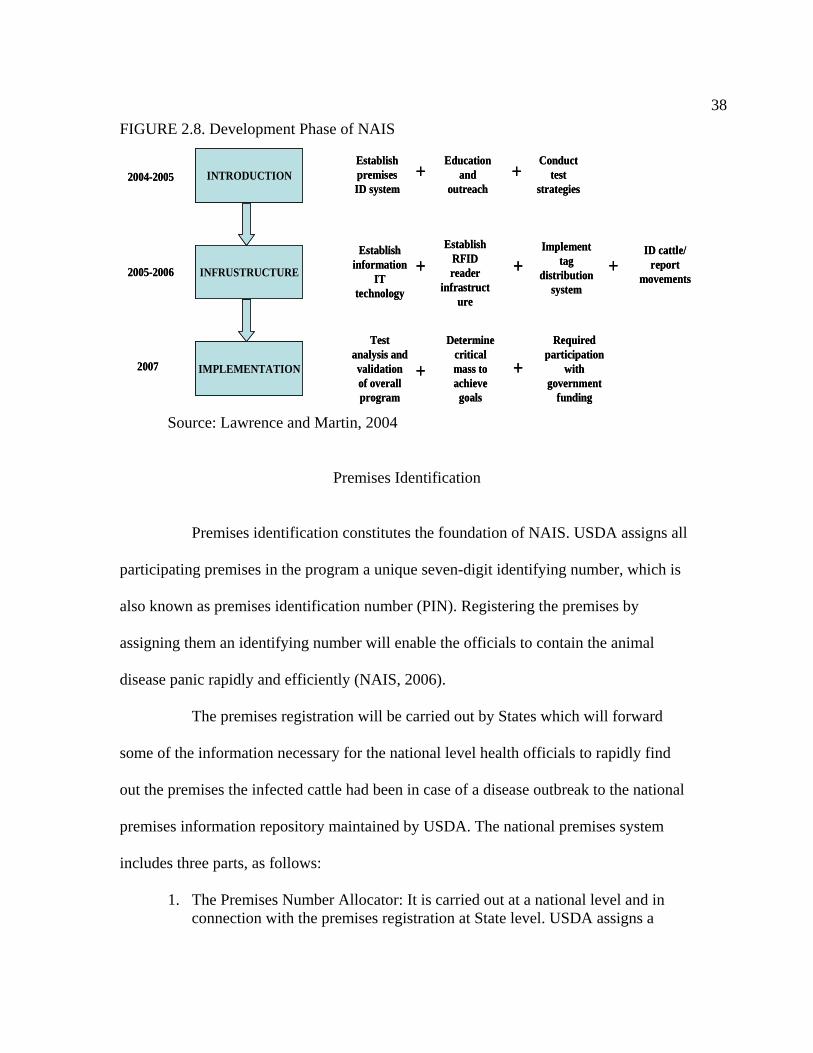
38FIGURE 2.8. Development Phase of NAIS
Source: Lawrence and Martin, 2004
Premises Identification
Premises identification constitutes the foundation of NAIS. USDA assigns all
participating premises in the program a unique seven-digit identifying number, which is
also known as premises identification number (PIN). Registering the premises by
assigning them an identifying number will enable the officials to contain the animal
disease panic rapidly and efficiently (NAIS, 2006).
The premises registration will be carried out by States which will forward
some of the information necessary for the national level health officials to rapidly find
out the premises the infected cattle had been in case of a disease outbreak to the national
premises information repository maintained by USDA. The national premises system
includes three parts, as follows:
1. The Premises Number Allocator: It is carried out at a national level and in connection with the premises registration at State level. USDA assigns a
INTRODUCTION
INFRUSTRUCTURE
IMPLEMENTATION
2004-2005
2005-2006
2007
Establish premises ID system
+Education
and outreach
+Conduct
test strategies
Establish information
IT technology
+Establish
RFID reader
infrastructure
+Implement
tag distribution
system
+ID cattle/
report movements
Test analysis and validation of overall program
+
Determine critical mass to achieve
goals
+Required
participation with
government funding
39unique seven digit-premises identification number through the premises number allocator.
2. Premises Registration System: This is a database program, which has the
necessary information about the premises and provides premises identification number. States carry out the premises registration and necessary information collection.
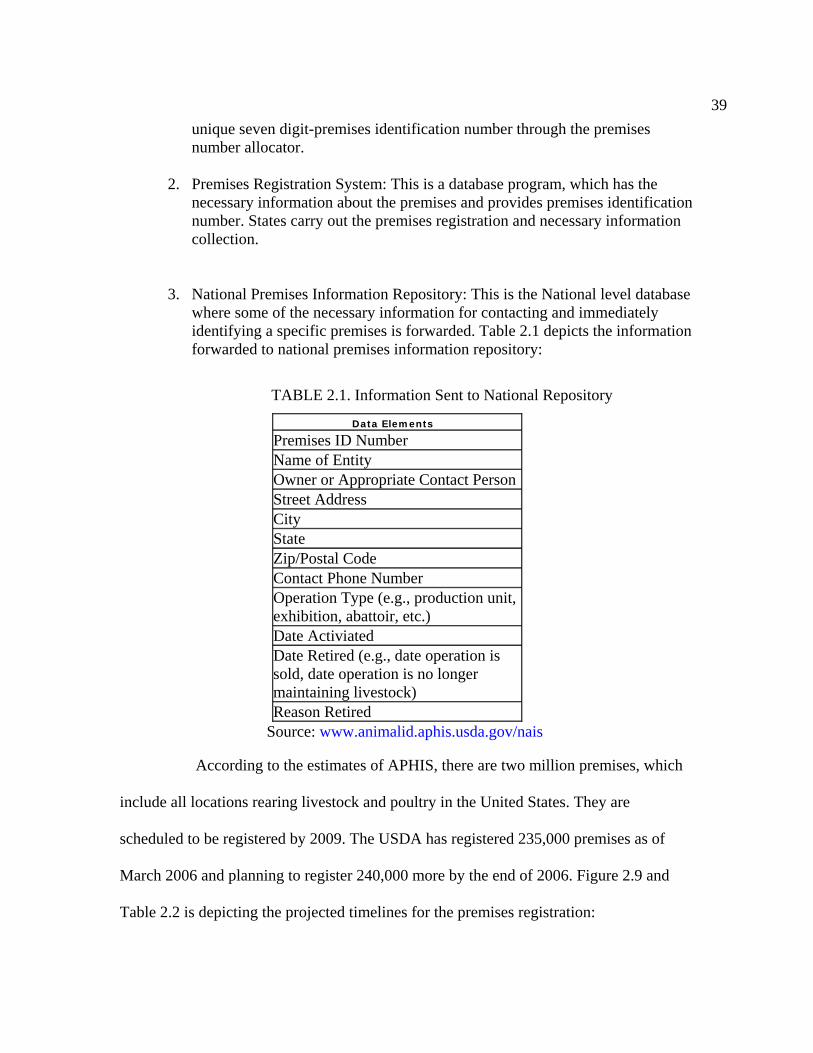
3. National Premises Information Repository: This is the National level database
where some of the necessary information for contacting and immediately identifying a specific premises is forwarded. Table 2.1 depicts the information forwarded to national premises information repository:
TABLE 2.1. Information Sent to National Repository
Data Elements
Premises ID Number Name of Entity Owner or Appropriate Contact PersonStreet Address City State Zip/Postal Code Contact Phone Number Operation Type (e.g., production unit, exhibition, abattoir, etc.) Date Activiated Date Retired (e.g., date operation is sold, date operation is no longer maintaining livestock) Reason Retired
Source: www.animalid.aphis.usda.gov/nais
According to the estimates of APHIS, there are two million premises, which
include all locations rearing livestock and poultry in the United States. They are
scheduled to be registered by 2009. The USDA has registered 235,000 premises as of
March 2006 and planning to register 240,000 more by the end of 2006. Figure 2.9 and
Table 2.2 is depicting the projected timelines for the premises registration:
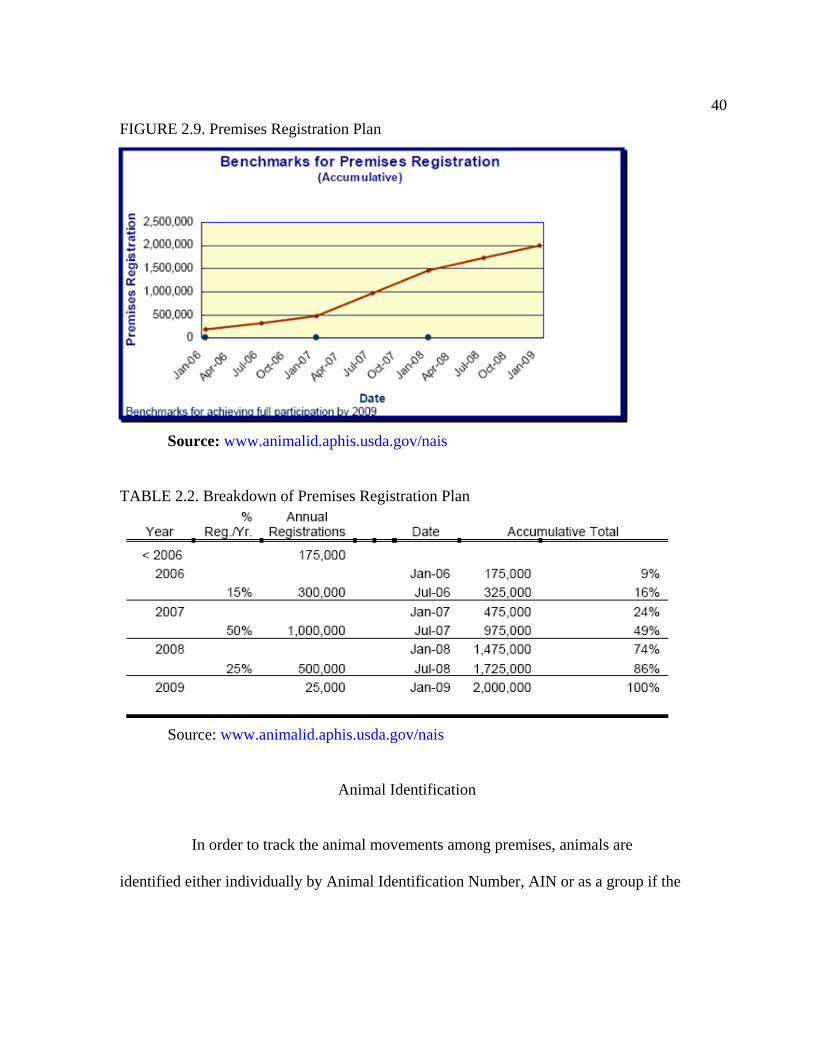
40FIGURE 2.9. Premises Registration Plan
Source: www.animalid.aphis.usda.gov/nais TABLE 2.2. Breakdown of Premises Registration Plan
Source: www.animalid.aphis.usda.gov/nais
Animal Identification
In order to track the animal movements among premises, animals are
identified either individually by Animal Identification Number, AIN or as a group if the
41whole herd will move together from premise to premise by Group/Lot Identification
Number (GIN).
As the National Animal Identification System develops, animal producers
would be able to contact a reseller, animal identification number distributor to obtain
officially approved tags. The reseller will send the records of the identification numbers
sold to each premises to national information repository.
There are 33 million calf births every year and 7 million births of other
animals such as sheep, goats. It is projected to attach AIN tags to all newborn animals by
2009.
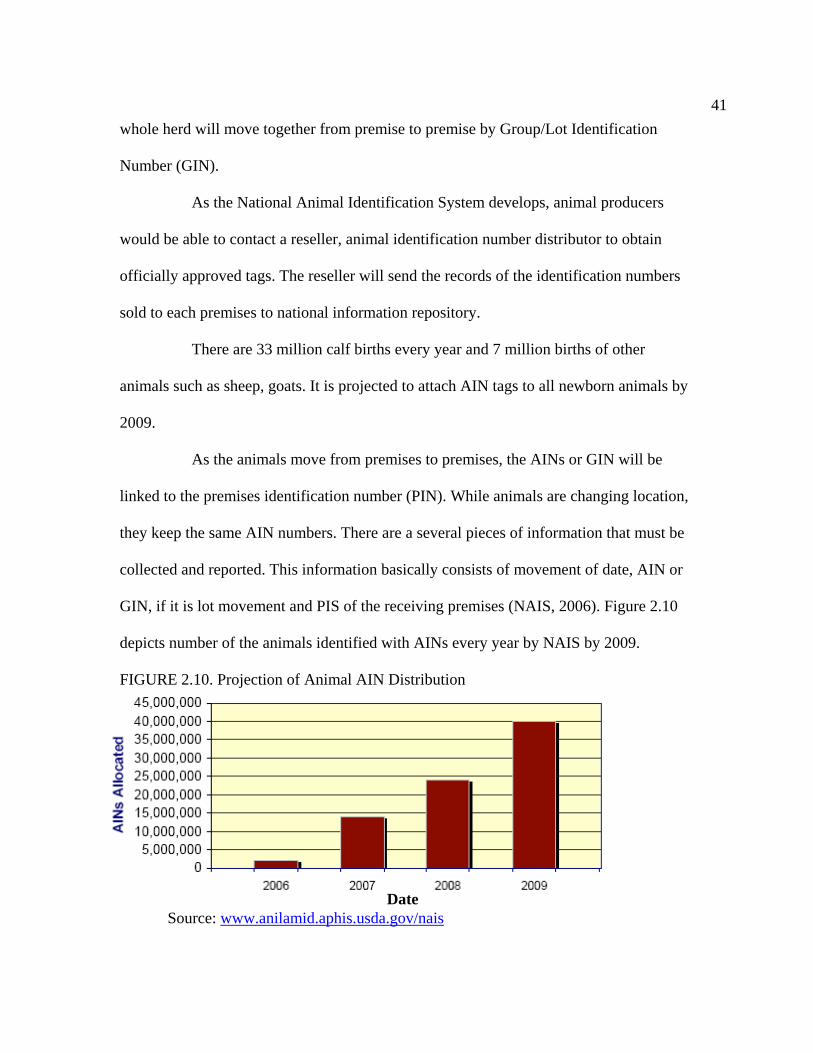
As the animals move from premises to premises, the AINs or GIN will be
linked to the premises identification number (PIN). While animals are changing location,
they keep the same AIN numbers. There are a several pieces of information that must be
collected and reported. This information basically consists of movement of date, AIN or
GIN, if it is lot movement and PIS of the receiving premises (NAIS, 2006). Figure 2.10
depicts number of the animals identified with AINs every year by NAIS by 2009.
FIGURE 2.10. Projection of Animal AIN Distribution
Source: www.anilamid.aphis.usda.gov/nais
Date
42To identify the animals, producers can opt to use visual tags which will have
the AIN imprinted on it. There are some standards that must be met by the identifiers.
These standards are required by Code of Federal Regulation (CFR) and listed in the Table
2.3 at the following page.
Animal and Plant Health Inspection Service (APHIS) is in cooperation with
NAIS to allow firms to use supplemental technologies such as Radio Frequency
Identification System (RFID) and compatible ear tag as a part of their identification
equipment (NAIS, 2006). For bison and cattle, APHIS encourages the use of Radio
Frequency Identification ear tags. In order to get the AIN/RF ISO tags recognized as
supplemental identification devices in the National Animal Identification system (NAIS),
ISO 11784 (Radio frequency identification of animals-Code Structure) and ISO 11785
(Radio frequency identification animals-Technical concept) must be used to ensure the
compatibility of the technology used across “vendors” (NAIS, 2006). For this reason, all
the RFID devices must be certified for the conformance with ISO 11784 and ISO 11785
by International Committee for Animal Recording (ICAR), which “is a world-wide
organization with over 40 member countries dedicated to the standardization of animal
recording and productivity evaluation” (NAIS, 2006). In other words, ICAR carries out
the testing of the RFIDs to ensure the compliance with the ISO 11784 and ISO 11785.
The standards for RFIDs that must be met by vendors are listed in Table 2.4.
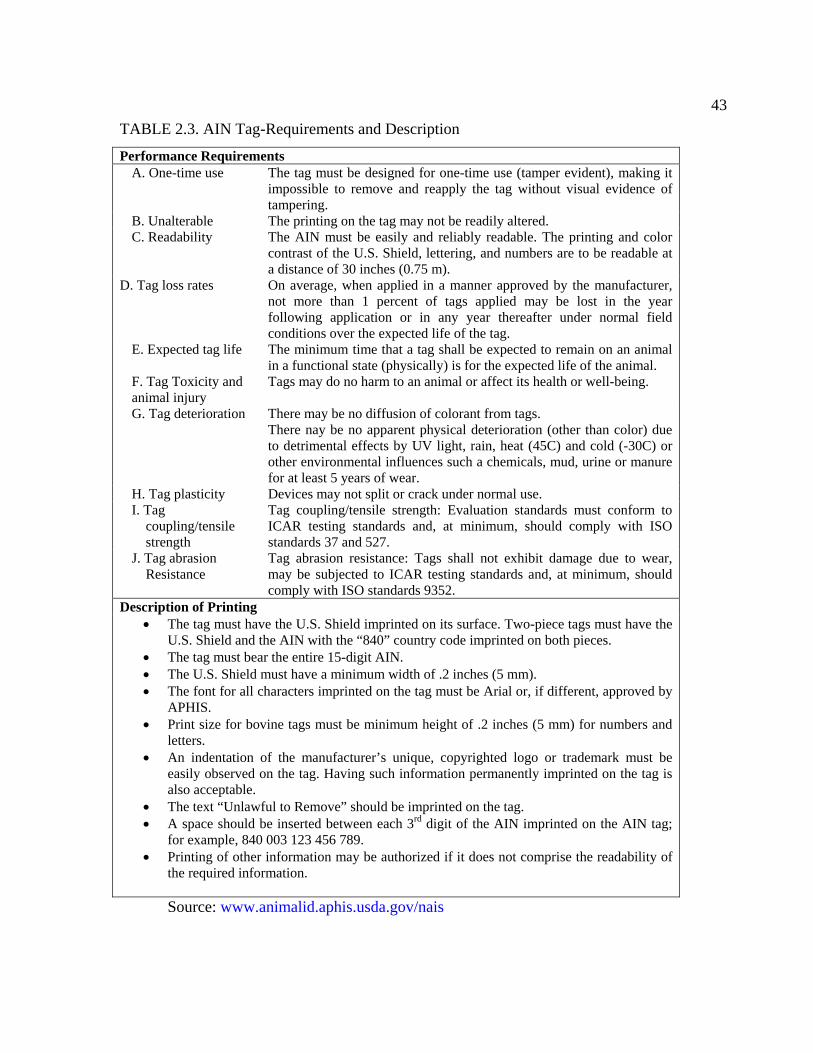
43TABLE 2.3. AIN Tag-Requirements and Description
Performance Requirements A. One-time use The tag must be designed for one-time use (tamper evident), making it
impossible to remove and reapply the tag without visual evidence of tampering.
B. Unalterable The printing on the tag may not be readily altered. C. Readability The AIN must be easily and reliably readable. The printing and color
contrast of the U.S. Shield, lettering, and numbers are to be readable at a distance of 30 inches (0.75 m).
D. Tag loss rates On average, when applied in a manner approved by the manufacturer, not more than 1 percent of tags applied may be lost in the year following application or in any year thereafter under normal field conditions over the expected life of the tag.
E. Expected tag life The minimum time that a tag shall be expected to remain on an animal in a functional state (physically) is for the expected life of the animal.
F. Tag Toxicity and animal injury
Tags may do no harm to an animal or affect its health or well-being.
G. Tag deterioration There may be no diffusion of colorant from tags. There nay be no apparent physical deterioration (other than color) due to detrimental effects by UV light, rain, heat (45C) and cold (-30C) or other environmental influences such a chemicals, mud, urine or manure for at least 5 years of wear.
H. Tag plasticity Devices may not split or crack under normal use. I. Tag coupling/tensile strength
Tag coupling/tensile strength: Evaluation standards must conform to ICAR testing standards and, at minimum, should comply with ISO standards 37 and 527.
J. Tag abrasion Resistance
Tag abrasion resistance: Tags shall not exhibit damage due to wear, may be subjected to ICAR testing standards and, at minimum, should comply with ISO standards 9352.
Description of Printing • The tag must have the U.S. Shield imprinted on its surface. Two-piece tags must have the
U.S. Shield and the AIN with the “840” country code imprinted on both pieces. • The tag must bear the entire 15-digit AIN. • The U.S. Shield must have a minimum width of .2 inches (5 mm). • The font for all characters imprinted on the tag must be Arial or, if different, approved by
APHIS. • Print size for bovine tags must be minimum height of .2 inches (5 mm) for numbers and
letters. • An indentation of the manufacturer’s unique, copyrighted logo or trademark must be
easily observed on the tag. Having such information permanently imprinted on the tag is also acceptable.
• The text “Unlawful to Remove” should be imprinted on the tag. • A space should be inserted between each 3rd digit of the AIN imprinted on the AIN tag;
for example, 840 003 123 456 789. • Printing of other information may be authorized if it does not comprise the readability of
the required information.
Source: www.animalid.aphis.usda.gov/nais
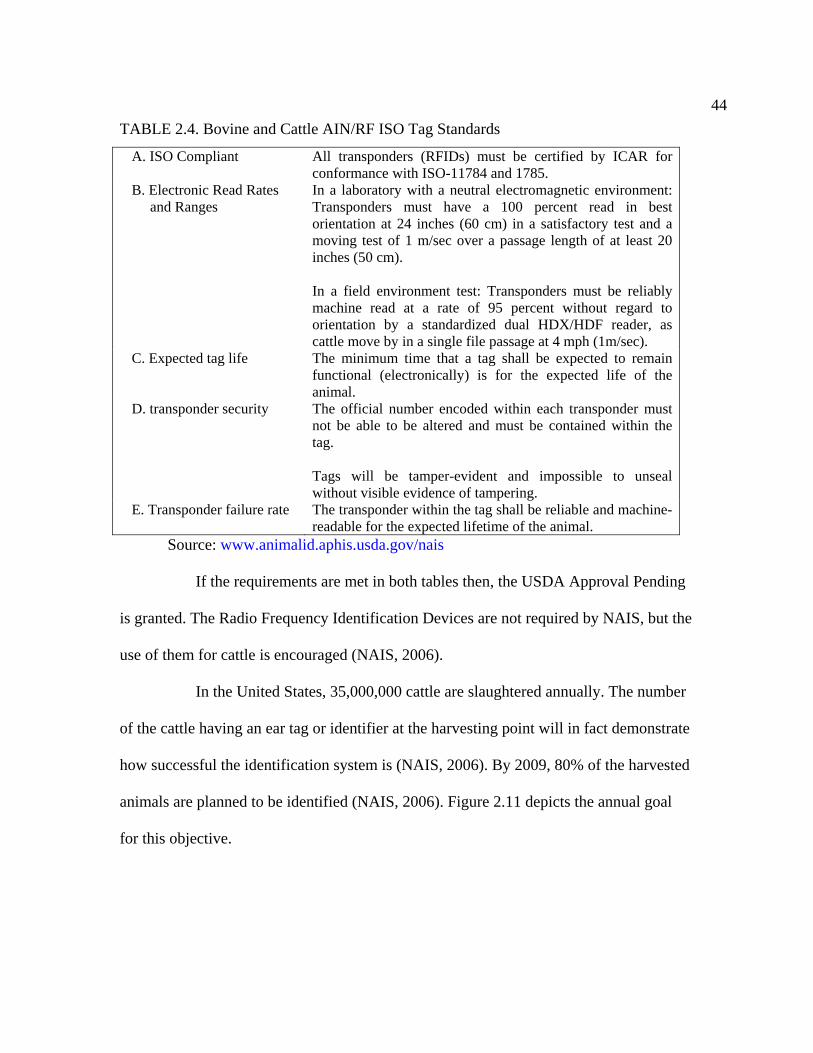
44TABLE 2.4. Bovine and Cattle AIN/RF ISO Tag Standards
A. ISO Compliant All transponders (RFIDs) must be certified by ICAR for conformance with ISO-11784 and 1785.
B. Electronic Read Rates and Ranges
In a laboratory with a neutral electromagnetic environment: Transponders must have a 100 percent read in best orientation at 24 inches (60 cm) in a satisfactory test and a moving test of 1 m/sec over a passage length of at least 20 inches (50 cm). In a field environment test: Transponders must be reliably machine read at a rate of 95 percent without regard to orientation by a standardized dual HDX/HDF reader, as cattle move by in a single file passage at 4 mph (1m/sec).
C. Expected tag life The minimum time that a tag shall be expected to remain functional (electronically) is for the expected life of the animal.
D. transponder security The official number encoded within each transponder must not be able to be altered and must be contained within the tag. Tags will be tamper-evident and impossible to unseal without visible evidence of tampering.
E. Transponder failure rate The transponder within the tag shall be reliable and machine-readable for the expected lifetime of the animal.
Source: www.animalid.aphis.usda.gov/nais
If the requirements are met in both tables then, the USDA Approval Pending
is granted. The Radio Frequency Identification Devices are not required by NAIS, but the
use of them for cattle is encouraged (NAIS, 2006).
In the United States, 35,000,000 cattle are slaughtered annually. The number
of the cattle having an ear tag or identifier at the harvesting point will in fact demonstrate
how successful the identification system is (NAIS, 2006). By 2009, 80% of the harvested
animals are planned to be identified (NAIS, 2006). Figure 2.11 depicts the annual goal
for this objective.
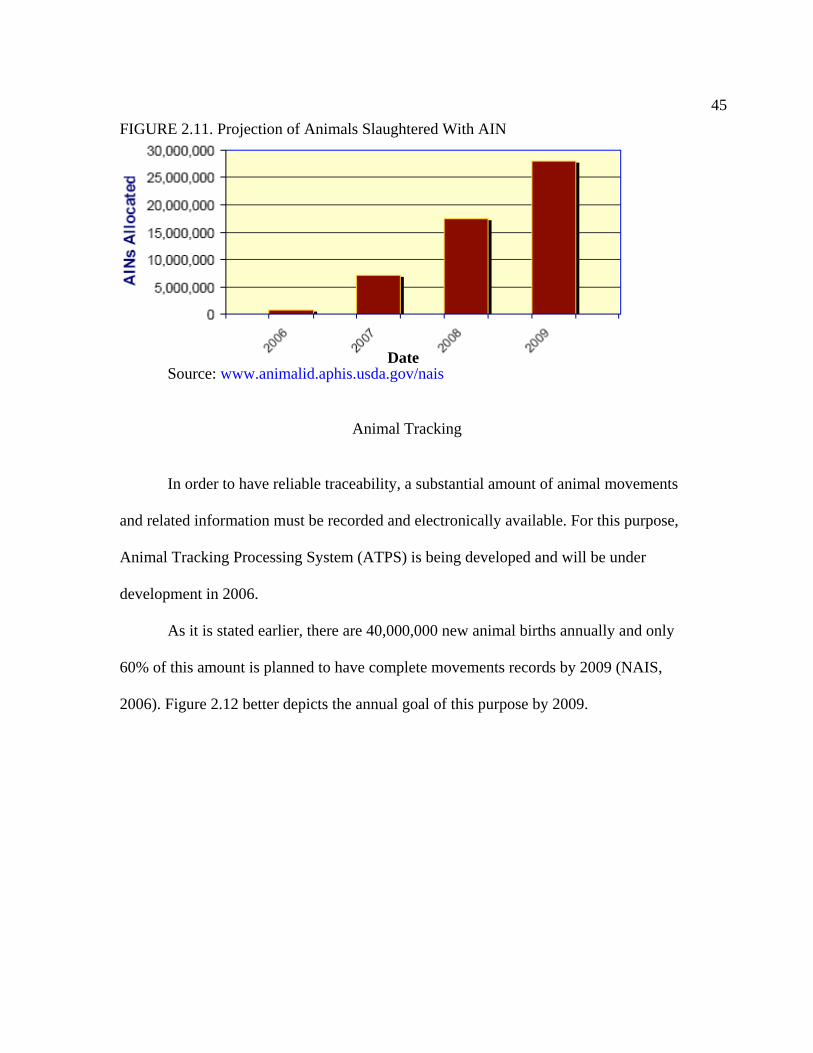
45FIGURE 2.11. Projection of Animals Slaughtered With AIN 2.5.3 Animal Tracking
Source: www.animalid.aphis.usda.gov/nais
Animal Tracking
In order to have reliable traceability, a substantial amount of animal movements
and related information must be recorded and electronically available. For this purpose,
Animal Tracking Processing System (ATPS) is being developed and will be under
development in 2006.
As it is stated earlier, there are 40,000,000 new animal births annually and only
60% of this amount is planned to have complete movements records by 2009 (NAIS,
2006). Figure 2.12 better depicts the annual goal of this purpose by 2009.
Date
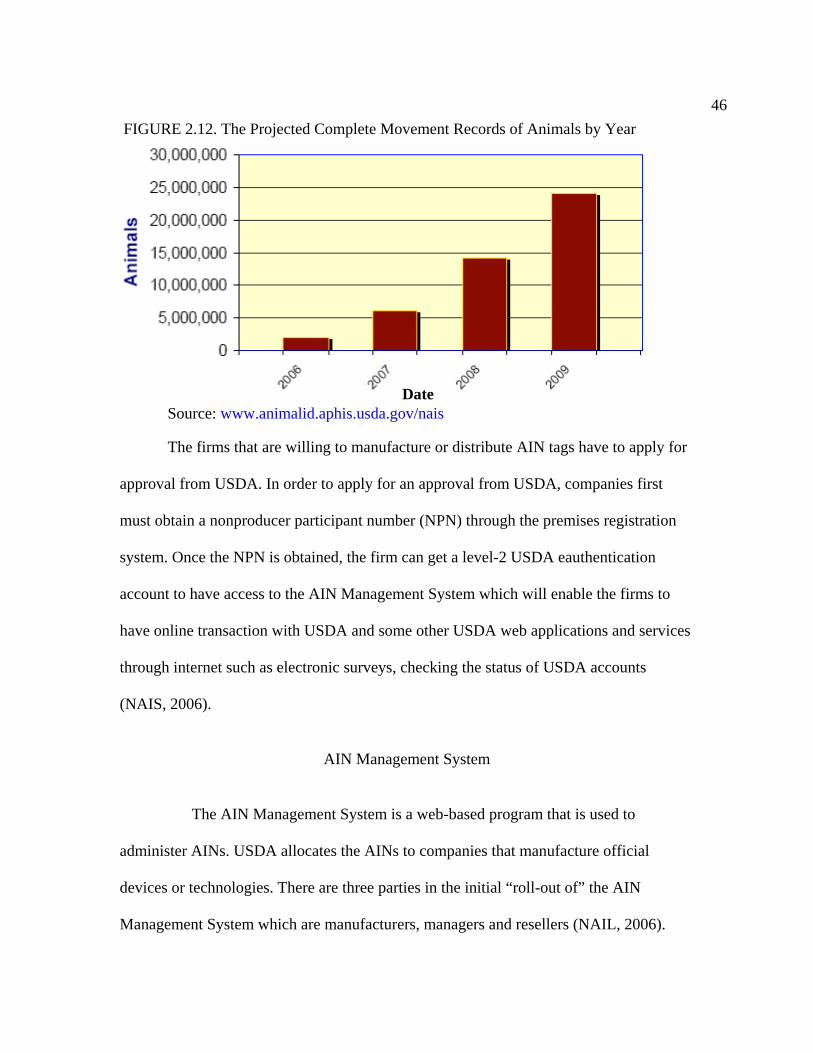
46FIGURE 2.12. The Projected Complete Movement Records of Animals by Year
Source: www.animalid.aphis.usda.gov/nais
The firms that are willing to manufacture or distribute AIN tags have to apply for
approval from USDA. In order to apply for an approval from USDA, companies first
must obtain a nonproducer participant number (NPN) through the premises registration
system. Once the NPN is obtained, the firm can get a level-2 USDA eauthentication
account to have access to the AIN Management System which will enable the firms to
have online transaction with USDA and some other USDA web applications and services
through internet such as electronic surveys, checking the status of USDA accounts
(NAIS, 2006).
AIN Management System
The AIN Management System is a web-based program that is used to
administer AINs. USDA allocates the AINs to companies that manufacture official
devices or technologies. There are three parties in the initial “roll-out of” the AIN
Management System which are manufacturers, managers and resellers (NAIL, 2006).
Date
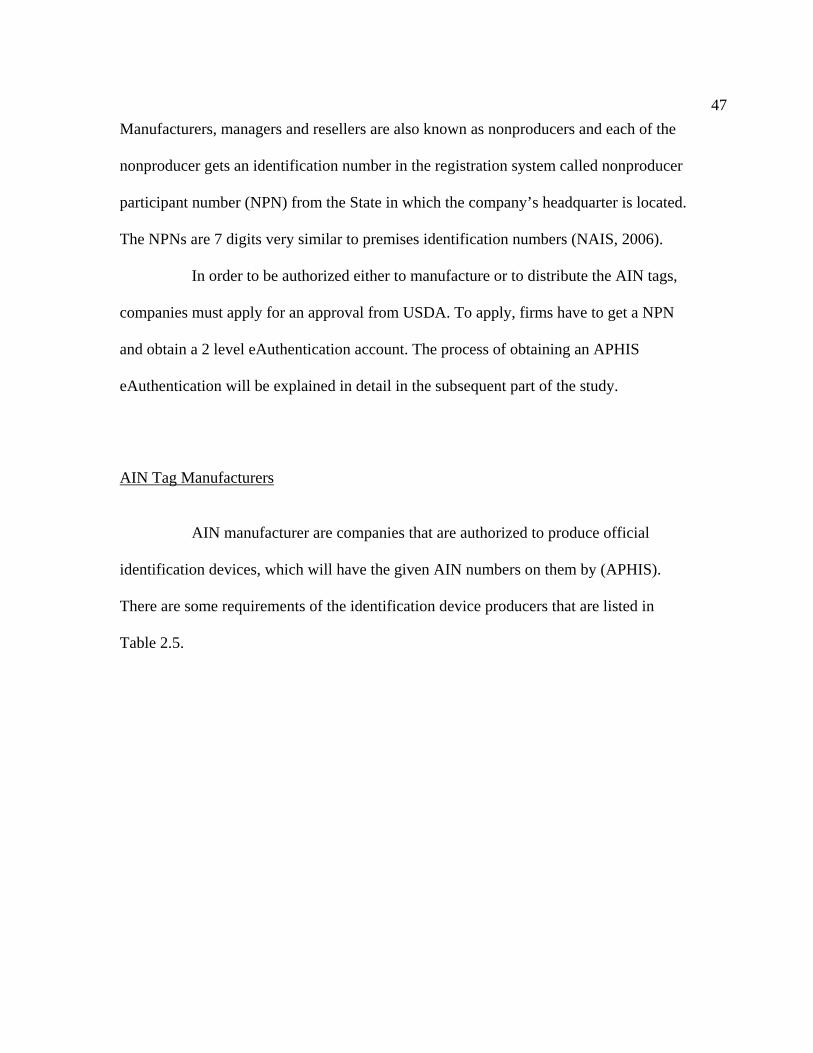
47Manufacturers, managers and resellers are also known as nonproducers and each of the
nonproducer gets an identification number in the registration system called nonproducer
participant number (NPN) from the State in which the company’s headquarter is located.
The NPNs are 7 digits very similar to premises identification numbers (NAIS, 2006).
In order to be authorized either to manufacture or to distribute the AIN tags,
companies must apply for an approval from USDA. To apply, firms have to get a NPN
and obtain a 2 level eAuthentication account. The process of obtaining an APHIS
eAuthentication will be explained in detail in the subsequent part of the study.
AIN Tag Manufacturers
AIN manufacturer are companies that are authorized to produce official
identification devices, which will have the given AIN numbers on them by (APHIS).
There are some requirements of the identification device producers that are listed in
Table 2.5.
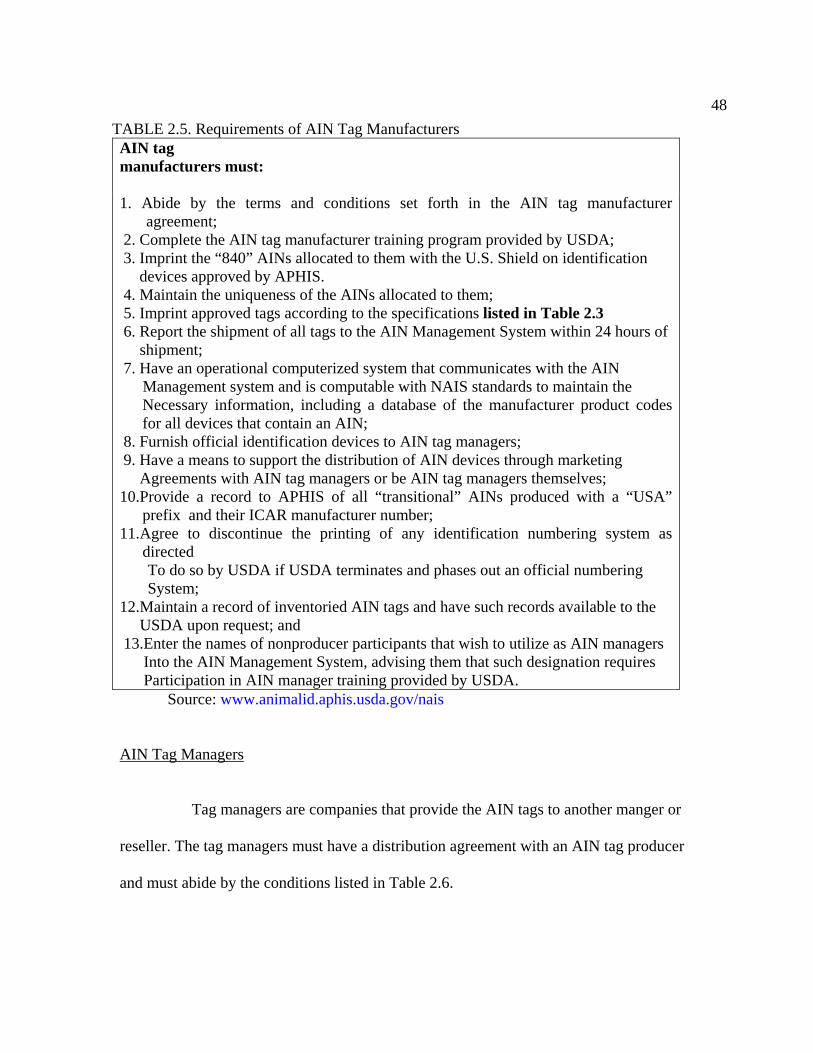
48TABLE 2.5. Requirements of AIN Tag Manufacturers AIN tag manufacturers must:
1. Abide by the terms and conditions set forth in the AIN tag manufacturer agreement;
2. Complete the AIN tag manufacturer training program provided by USDA; 3. Imprint the “840” AINs allocated to them with the U.S. Shield on identification devices approved by APHIS. 4. Maintain the uniqueness of the AINs allocated to them; 5. Imprint approved tags according to the specifications listed in Table 2.3 6. Report the shipment of all tags to the AIN Management System within 24 hours of
shipment; 7. Have an operational computerized system that communicates with the AIN
Management system and is computable with NAIS standards to maintain the Necessary information, including a database of the manufacturer product codes for all devices that contain an AIN;
8. Furnish official identification devices to AIN tag managers; 9. Have a means to support the distribution of AIN devices through marketing
Agreements with AIN tag managers or be AIN tag managers themselves; 10.Provide a record to APHIS of all “transitional” AINs produced with a “USA”
prefix and their ICAR manufacturer number; 11.Agree to discontinue the printing of any identification numbering system as
directed To do so by USDA if USDA terminates and phases out an official numbering System;
12.Maintain a record of inventoried AIN tags and have such records available to the USDA upon request; and
13.Enter the names of nonproducer participants that wish to utilize as AIN managers Into the AIN Management System, advising them that such designation requires Participation in AIN manager training provided by USDA.
Source: www.animalid.aphis.usda.gov/nais AIN Tag Managers
Tag managers are companies that provide the AIN tags to another manger or
reseller. The tag managers must have a distribution agreement with an AIN tag producer
and must abide by the conditions listed in Table 2.6.
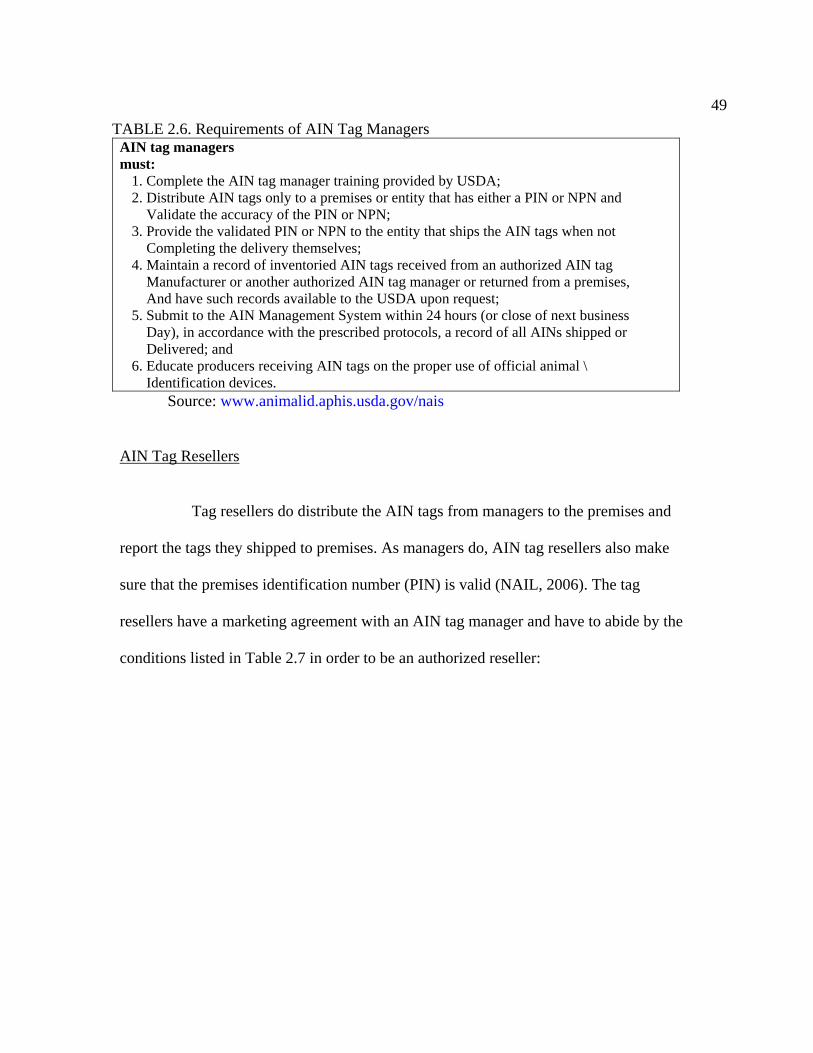
49TABLE 2.6. Requirements of AIN Tag Managers
AIN tag managers must:
1. Complete the AIN tag manager training provided by USDA; 2. Distribute AIN tags only to a premises or entity that has either a PIN or NPN and Validate the accuracy of the PIN or NPN; 3. Provide the validated PIN or NPN to the entity that ships the AIN tags when not Completing the delivery themselves; 4. Maintain a record of inventoried AIN tags received from an authorized AIN tag Manufacturer or another authorized AIN tag manager or returned from a premises, And have such records available to the USDA upon request; 5. Submit to the AIN Management System within 24 hours (or close of next business Day), in accordance with the prescribed protocols, a record of all AINs shipped or Delivered; and 6. Educate producers receiving AIN tags on the proper use of official animal \ Identification devices.
Source: www.animalid.aphis.usda.gov/nais AIN Tag Resellers
Tag resellers do distribute the AIN tags from managers to the premises and
report the tags they shipped to premises. As managers do, AIN tag resellers also make
sure that the premises identification number (PIN) is valid (NAIL, 2006). The tag
resellers have a marketing agreement with an AIN tag manager and have to abide by the
conditions listed in Table 2.7 in order to be an authorized reseller:
50TABLE 2.7. Requirements of AIN Tag Resellers AIN tag resellers must:
1. Complete the AIN tag reseller training provided by USDA; 2. Distribute AIN tags only to a premises or entity that has either a PIN or NPN and Validate the accuracy of the PIN or NPN; 3. Provide the validated PIN of NPN to the entity that ships the AIN tags when not Completing the delivery themselves; 4. Maintain a dated record of inventoried AIN tags received from an authorized AIN Tag manager or another authorized AIN tag reseller, or returned from a premises, And have such records available to the USDA upon request; 5. Submit to the AIN Management System within 24 hours (or closes of next
business Day), in accordance with prescribed protocols, a record of all AINs shipped or Delivered; and 6. Educate producers receiving AIN tags on the proper use of official animal Identification devices.
Source: www.animalid.aphis.usda.gov/nais
E-Authentication
USDA agencies use the eAuthentication to allow individuals to open online
accounts to have access to certain USDA web services. There are two types of
eAuthentication accounts, which are level 1 and level 2 (NAIS, 2006)
Level 1 account provides limited access to USDA web services. It does not
enable the holder of this type of account to have electronic transactions.
AIN tag manufacturers, AIN tag managers and AIN tag resellers use level 2-
account. This type of account does enable its holders to have electronic transactions with
USDA and uses the services provided electronically by USDA. The transactions that can
be conducted by USDA include application for permits, registering premises for the
National Animal Identification System (NAIS) and checking the status of the documents.
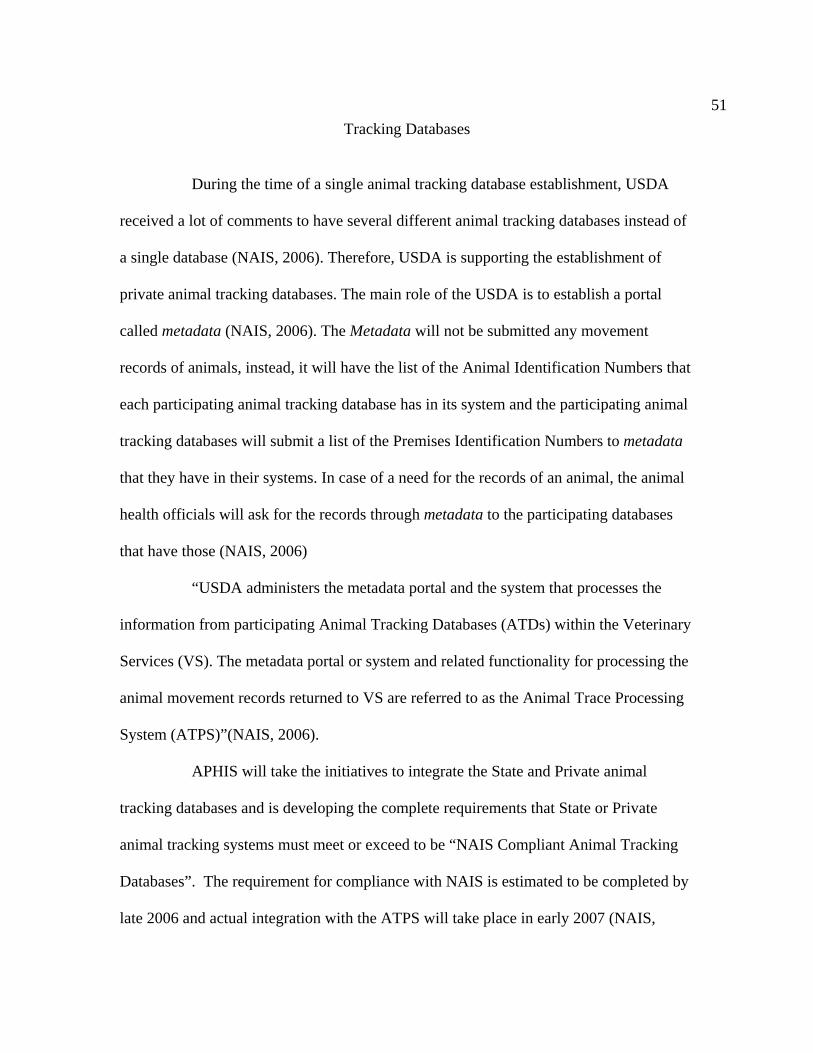
51Tracking Databases
During the time of a single animal tracking database establishment, USDA
received a lot of comments to have several different animal tracking databases instead of
a single database (NAIS, 2006). Therefore, USDA is supporting the establishment of
private animal tracking databases. The main role of the USDA is to establish a portal
called metadata (NAIS, 2006). The Metadata will not be submitted any movement
records of animals, instead, it will have the list of the Animal Identification Numbers that
each participating animal tracking database has in its system and the participating animal
tracking databases will submit a list of the Premises Identification Numbers to metadata
that they have in their systems. In case of a need for the records of an animal, the animal
health officials will ask for the records through metadata to the participating databases
that have those (NAIS, 2006)
“USDA administers the metadata portal and the system that processes the
information from participating Animal Tracking Databases (ATDs) within the Veterinary
Services (VS). The metadata portal or system and related functionality for processing the
animal movement records returned to VS are referred to as the Animal Trace Processing
System (ATPS)”(NAIS, 2006).
APHIS will take the initiatives to integrate the State and Private animal
tracking databases and is developing the complete requirements that State or Private
animal tracking systems must meet or exceed to be “NAIS Compliant Animal Tracking
Databases”. The requirement for compliance with NAIS is estimated to be completed by
late 2006 and actual integration with the ATPS will take place in early 2007 (NAIS,
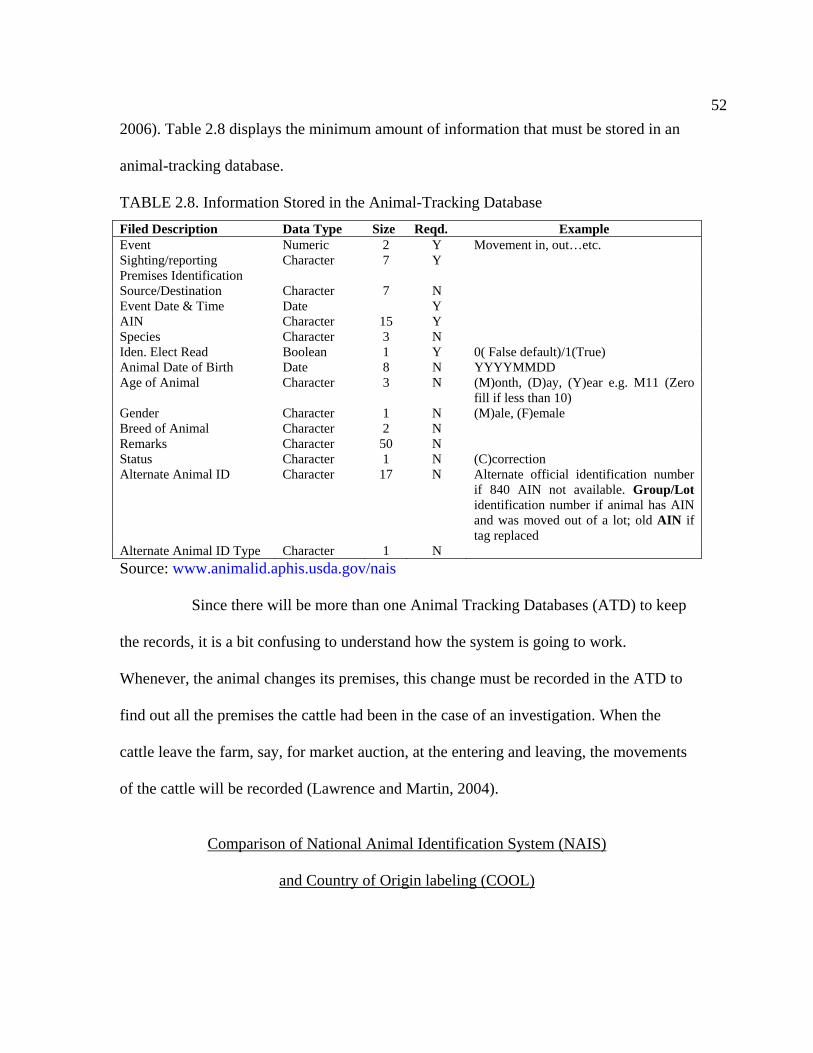
522006). Table 2.8 displays the minimum amount of information that must be stored in an
animal-tracking database.
TABLE 2.8. Information Stored in the Animal-Tracking Database Filed Description Data Type Size Reqd. Example Event Numeric 2 Y Movement in, out…etc. Sighting/reporting Premises Identification
Character 7 Y
Source/Destination Character 7 N Event Date & Time Date Y AIN Character 15 Y Species Character 3 N Iden. Elect Read Boolean 1 Y 0( False default)/1(True) Animal Date of Birth Date 8 N YYYYMMDD Age of Animal Character 3 N (M)onth, (D)ay, (Y)ear e.g. M11 (Zero
fill if less than 10) Gender Character 1 N (M)ale, (F)emale Breed of Animal Character 2 N Remarks Character 50 N Status Character 1 N (C)correction Alternate Animal ID Character 17 N Alternate official identification number
if 840 AIN not available. Group/Lot identification number if animal has AIN and was moved out of a lot; old AIN if tag replaced
Alternate Animal ID Type Character 1 N Source: www.animalid.aphis.usda.gov/nais
Since there will be more than one Animal Tracking Databases (ATD) to keep
the records, it is a bit confusing to understand how the system is going to work.
Whenever, the animal changes its premises, this change must be recorded in the ATD to
find out all the premises the cattle had been in the case of an investigation. When the
cattle leave the farm, say, for market auction, at the entering and leaving, the movements
of the cattle will be recorded (Lawrence and Martin, 2004).
Comparison of National Animal Identification System (NAIS)
and Country of Origin labeling (COOL)
53As the name of the two systems implies, NAIS is able to trace back the
individual cattle from slaughterhouse to the farm of origin and all the premises the cattle
had been. However, COOL does not enable officials to trace back individual cattle; it
only provides information about the origin of the cattle where the animal was born,
reared, slaughtered and packed. As Umberger (2004) states, the implementation of COOL
at producer level will be simplified by NAIS and it would be complementary to the
COOL program. In addition, since the NAIS does provide little or no information about
the origin of the cattle at the retail level, COOL will inform the customers about the
country of origin of the product they buy (Umberger, 2004).
DNA Based Traceability
Each animal has a distinct DNA code except twins. This characteristic of
DNA enables the animal and its products derived from that to be matched and identified
(Loftus, 2005). In order to apply DNA-based traceability, DNA samples would need to be
collected and stored in a database to enable the animal to be identified in case of need by
comparing the DNA samples from the products (Loftus, 2005). Currently, the biggest
obstacle preventing the traceability from farm to fork is the break in the slaughterhouse.
By the application of NAIS there will full traceability from farm to slaughterhouse
allowing the animal health officials to track every step of the cattle up to slaughterhouse.
To overcome the “break” in the slaughterhouse and allow full traceability DNA samples
will be taken from the carcasses at slaughterhouse and stored in a database. When a
product from a retailer is needed to be traced back, the DNA sample from the products
will be matched with the stored samples.
54
CHAPTER 3
METHODOLOGY AND RESULTS
This research focuses mainly on the cost-benefit analysis of traceability for
SMEs. Since SMEs are not as financially strong as large enterprises, the cost of
traceability application is a very sensitive issue for them. The cost, therefore, must be
computed in advance and compared with the benefits it will bring to enterprises. This
research will also focus on the benefits of traceability. Both qualitative and quantitative
approach will be carried out to provide the perfect fit.
In order to compute the traceability cost from farm to fork, I will first explain
the beef supply chain and then shed light on the technical components needed to establish
traceability system
Beef Supply Chain
In the U.S. beef supply chain there are four basic segments; they are the cow-
calf producer, the stockyard, the feedlot, and the packer. Figure 3.1 illustrates the animal
flow between segments
FIGURE 3.1. Beef Value Chain
Source: Donnelly, Deines & Katz, 2002
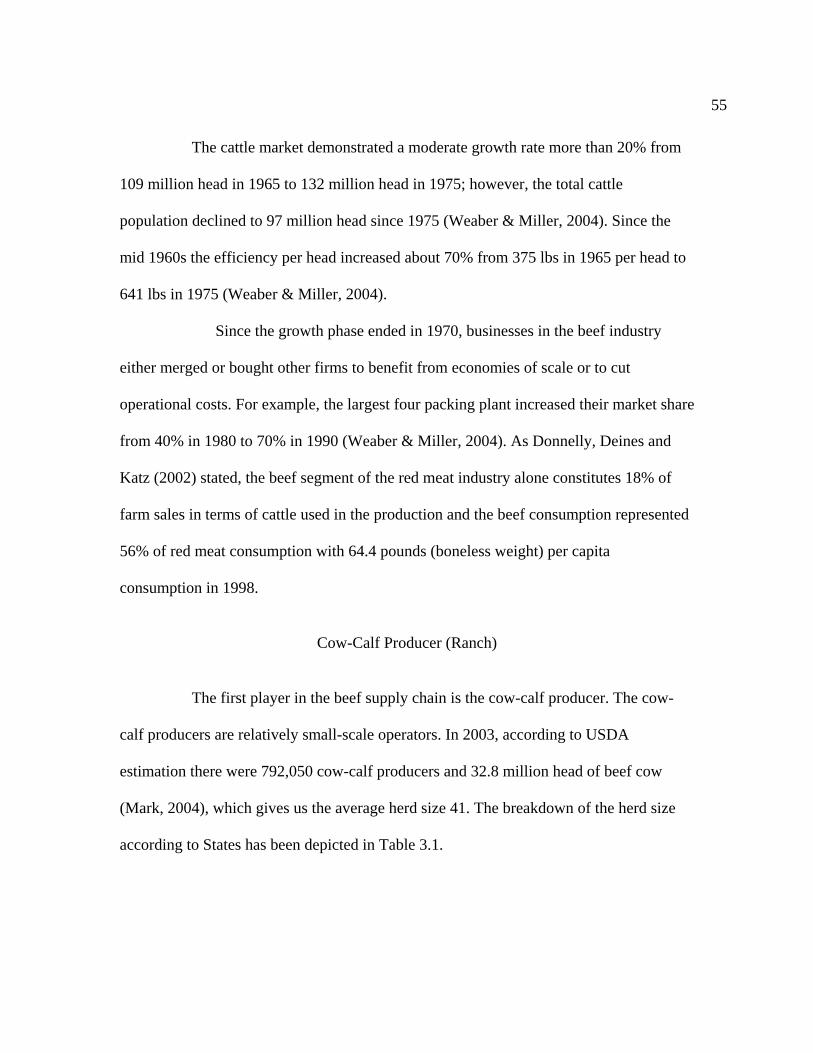
55
The cattle market demonstrated a moderate growth rate more than 20% from
109 million head in 1965 to 132 million head in 1975; however, the total cattle
population declined to 97 million head since 1975 (Weaber & Miller, 2004). Since the
mid 1960s the efficiency per head increased about 70% from 375 lbs in 1965 per head to
641 lbs in 1975 (Weaber & Miller, 2004).
Since the growth phase ended in 1970, businesses in the beef industry
either merged or bought other firms to benefit from economies of scale or to cut
operational costs. For example, the largest four packing plant increased their market share
from 40% in 1980 to 70% in 1990 (Weaber & Miller, 2004). As Donnelly, Deines and
Katz (2002) stated, the beef segment of the red meat industry alone constitutes 18% of
farm sales in terms of cattle used in the production and the beef consumption represented
56% of red meat consumption with 64.4 pounds (boneless weight) per capita
consumption in 1998.
Cow-Calf Producer (Ranch)
The first player in the beef supply chain is the cow-calf producer. The cow-
calf producers are relatively small-scale operators. In 2003, according to USDA
estimation there were 792,050 cow-calf producers and 32.8 million head of beef cow
(Mark, 2004), which gives us the average herd size 41. The breakdown of the herd size
according to States has been depicted in Table 3.1.
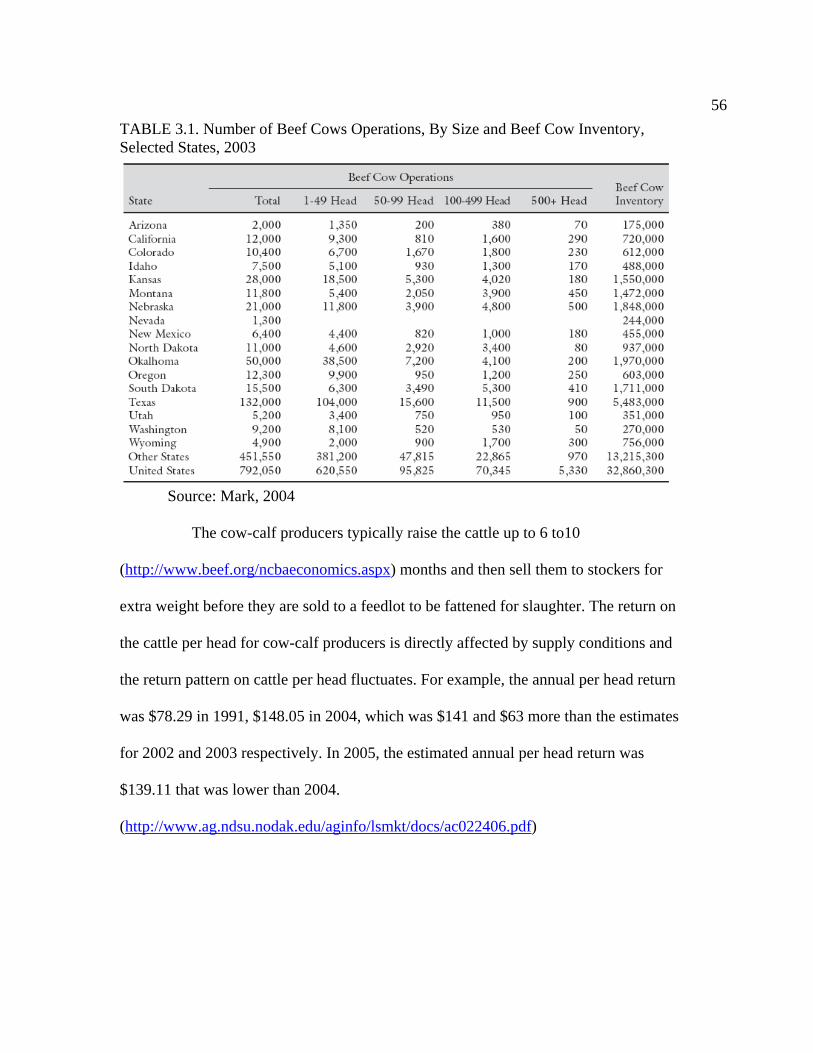
56TABLE 3.1. Number of Beef Cows Operations, By Size and Beef Cow Inventory, Selected States, 2003
Source: Mark, 2004
The cow-calf producers typically raise the cattle up to 6 to10
(http://www.beef.org/ncbaeconomics.aspx) months and then sell them to stockers for
extra weight before they are sold to a feedlot to be fattened for slaughter. The return on
the cattle per head for cow-calf producers is directly affected by supply conditions and
the return pattern on cattle per head fluctuates. For example, the annual per head return
was $78.29 in 1991, $148.05 in 2004, which was $141 and $63 more than the estimates
for 2002 and 2003 respectively. In 2005, the estimated annual per head return was
$139.11 that was lower than 2004.
(http://www.ag.ndsu.nodak.edu/aginfo/lsmkt/docs/ac022406.pdf)
57Auction Market (saleyard)
Auction markets are the places where numerous cattle sellers and relatively
few buyers meet. There are 815 fixed auction facilities in the United States, according to
the USDA Packers and Stockyards Administration. The annual number of the cattle sold
by an average U.S. saleyard is 10,000 (Wahl, 2006).
Stocker
Stockers are the second producing segment in the US beef supply chain. They
graze the cattle until they are about 12 months old. The cattle usually gain about 200-300
pounds of weight at the stocker (Mark, 2004).
Feedlot Operator
Feedlot operators buy cattle from stockers at around 900 pounds and feed
them up to 1,200 to 1,400 pounds keeping them on feed from 110 to 250 days to reach
target weights (http://www.beef.org/ncbaeconomics.aspx) The size of feedlot operator
ranges from a couple of hundred head to 100,000 head, and they are mostly located in the
Southwest and the Pacific Northwest (www.beefusa.org). The annual number of cattle
raised by an average feedlot operator is about 10,000 (Wahl, 2006). The annual return at
the feedlots is relatively stable and does not fluctuate too much
(http://www.ag.ndsu.nodak.edu/aginfo/lsmkt/docs/ac022406.pdf). There are
approximately 2,205 feedlot operators having 1000 or more cattle and Table 3.2 depicts
the feedlot operator sizes in details.
58TABLE 3.2. U.S. Feedlot Number, Inventory, and Marketings, By Size, 2003
Source: Mark, 2004
Packer/Slaughterhouse
The Packer/slaughterhouse is the last segment of the beef supply chain before
the final consumers. Packing plants typically buy cattle from feedlot operators at around
1,000 to 1,250 pounds (www.beefusa.org). There are 64 major packing plants and the
four largest of these packing plants are Tyson Foods that owns IBP Inc; Cargill owns
Excel Corp; ConAgra Foods Inc, and Farmland National Beef (www.beefusa.org), which
account for 80% of the total US beef market. The annual average number of cattle and
calves harvested is about 33 million in the US. In 2005, 32.5 million cattle and 770.4
thousand calve slaughtered (www.nass.usda.gov). The four largest packing plants
account for approximately 26.6 million of the animals slaughtered in 2005.
Radio Frequency Identification
United States Department of Agriculture (USDA) aims to fully implement
NAIS by 2009 and it is neutral about the technology that will be used for the NAIS.
However, Lawrence and Martin (2004) state, “Cattle will likely use individual animal IDs
with a radio frequency ear tag.” RFID tags are capable of carrying identification
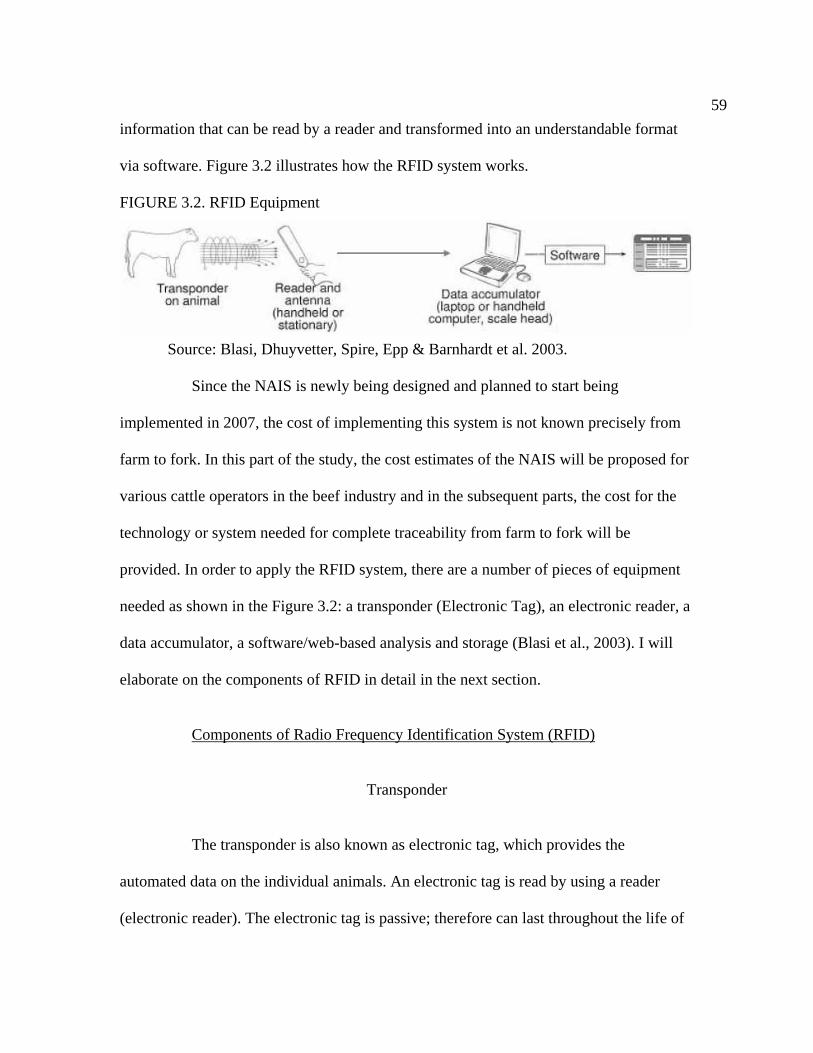
59information that can be read by a reader and transformed into an understandable format
via software. Figure 3.2 illustrates how the RFID system works.
FIGURE 3.2. RFID Equipment
Source: Blasi, Dhuyvetter, Spire, Epp & Barnhardt et al. 2003.
Since the NAIS is newly being designed and planned to start being
implemented in 2007, the cost of implementing this system is not known precisely from
farm to fork. In this part of the study, the cost estimates of the NAIS will be proposed for
various cattle operators in the beef industry and in the subsequent parts, the cost for the
technology or system needed for complete traceability from farm to fork will be
provided. In order to apply the RFID system, there are a number of pieces of equipment
needed as shown in the Figure 3.2: a transponder (Electronic Tag), an electronic reader, a
data accumulator, a software/web-based analysis and storage (Blasi et al., 2003). I will
elaborate on the components of RFID in detail in the next section.
Components of Radio Frequency Identification System (RFID)
Transponder
The transponder is also known as electronic tag, which provides the
automated data on the individual animals. An electronic tag is read by using a reader
(electronic reader). The electronic tag is passive; therefore can last throughout the life of
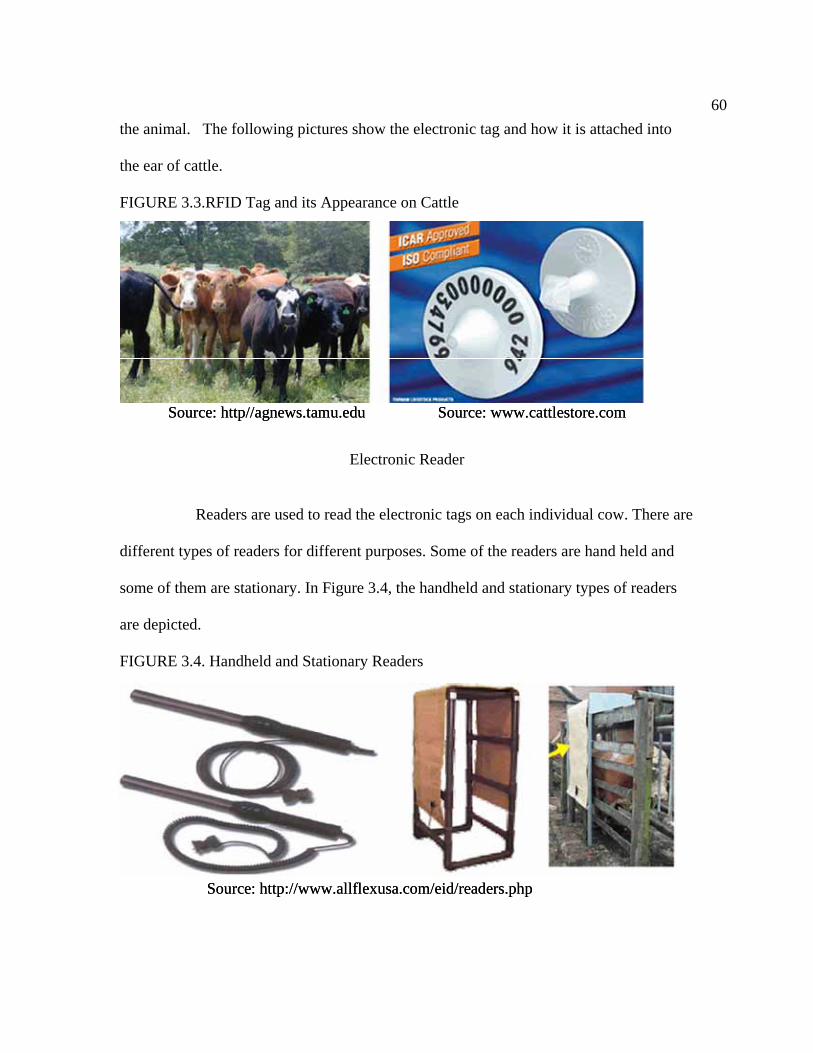
60the animal. The following pictures show the electronic tag and how it is attached into
the ear of cattle.
FIGURE 3.3.RFID Tag and its Appearance on Cattle
Electronic Reader
Readers are used to read the electronic tags on each individual cow. There are
different types of readers for different purposes. Some of the readers are hand held and
some of them are stationary. In Figure 3.4, the handheld and stationary types of readers
are depicted.
FIGURE 3.4. Handheld and Stationary Readers
Source: http//agnews.tamu.edu Source: www.cattlestore.comSource: http//agnews.tamu.edu Source: www.cattlestore.com
Source: http://www.allflexusa.com/eid/readers.phpSource: http://www.allflexusa.com/eid/readers.php
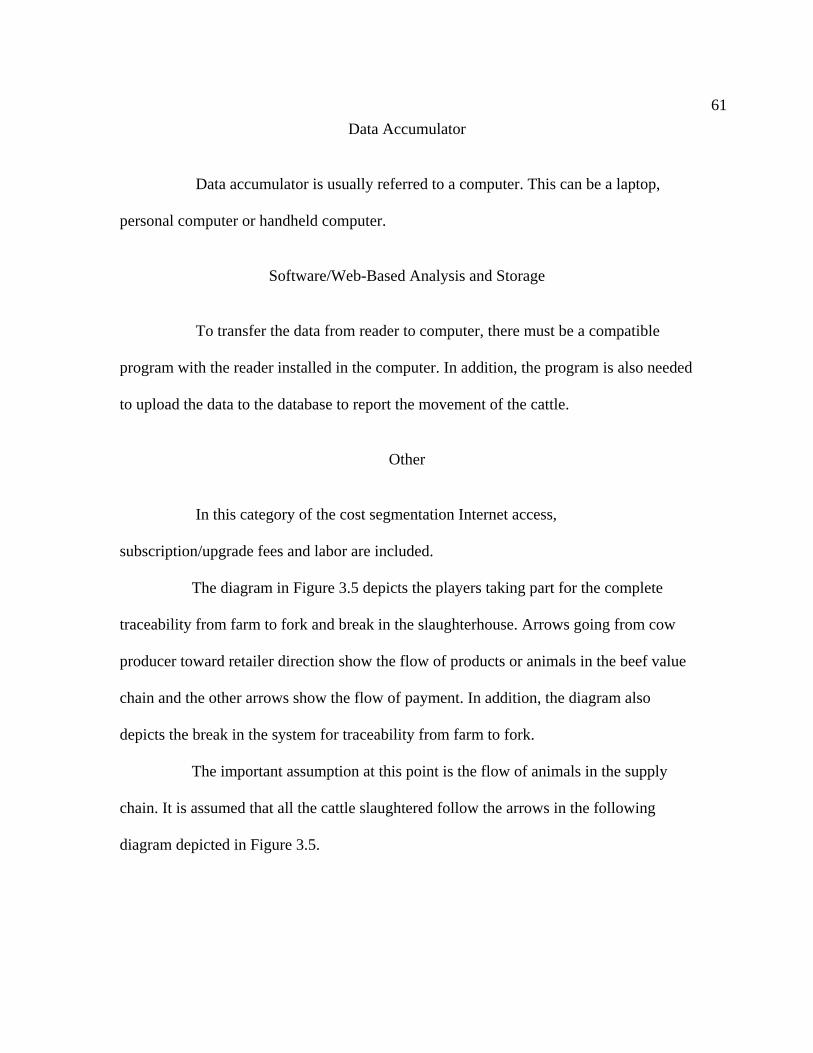
61Data Accumulator
Data accumulator is usually referred to a computer. This can be a laptop,
personal computer or handheld computer.
Software/Web-Based Analysis and Storage
To transfer the data from reader to computer, there must be a compatible
program with the reader installed in the computer. In addition, the program is also needed
to upload the data to the database to report the movement of the cattle.
Other
In this category of the cost segmentation Internet access,
subscription/upgrade fees and labor are included.
The diagram in Figure 3.5 depicts the players taking part for the complete
traceability from farm to fork and break in the slaughterhouse. Arrows going from cow
producer toward retailer direction show the flow of products or animals in the beef value
chain and the other arrows show the flow of payment. In addition, the diagram also
depicts the break in the system for traceability from farm to fork.
The important assumption at this point is the flow of animals in the supply
chain. It is assumed that all the cattle slaughtered follow the arrows in the following
diagram depicted in Figure 3.5.
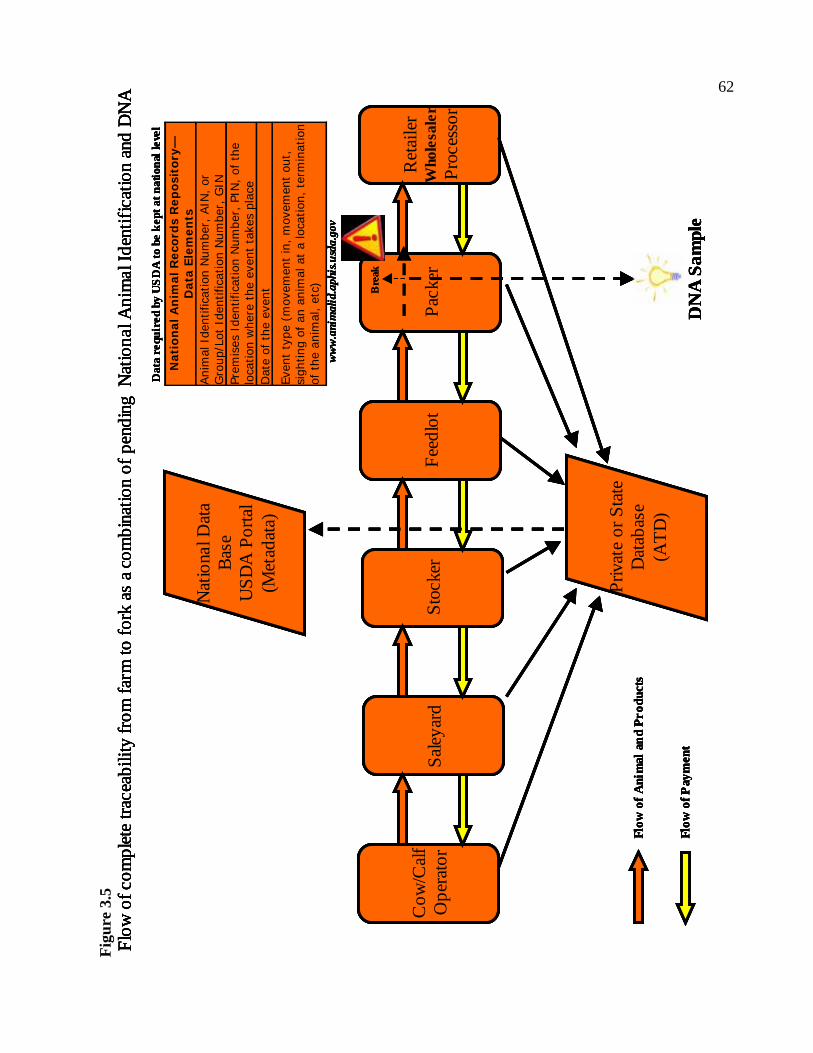
Figu
re 3
.5
Nati
onal A
nim
al R
eco
rds
Reposi
tory
—D
ata
Ele
ments
Ani
mal
Ide
ntifi
cation
Num
ber,
AIN
, or
G
roup
/Lot
Ide
ntifi
cation
Num
ber,
GIN
Pr
emis
es I
dent
ifica
tion
Num
ber,
PIN
, of
the
lo
cation
whe
re the
eve
nt tak
es p
lace
D
ate
of the
eve
nt
Even
t ty
pe (
mov
emen
t in
, m
ovem
ent ou
t,
sigh
ting
of an
ani
mal
at a
loca
tion
, te
rmin
atio
nof
the
ani
mal
, et
c)
Cow
/Calf
Ope
rato
rSa
leyar
dFe
edlo
tSt
ocke
rPa
cker
Ret
aile
rW
hole
sale
rPr
oces
sor
Nat
iona
l Dat
aBa
seU
SDA
Por
tal
(Met
adat
a)
Priv
ate
or S
tate
Dat
abas
e(A
TD)
ww
w.a
nim
alid
.aph
is.u
sda.
gov
Dat
a re
quir
ed b
y U
SD
A to
be
kept
at n
atio
nal l
evel
Flow
of A
nim
al a
nd P
rodu
cts
Flow
of P
aym
ent
Bre
ak
DN
A S
ampl
e
Flow
of c
ompl
ete
trace
abili
ty fr
om fa
rm to
fork
as
a com
bina
tion
of p
endi
ng N
atio
nal A
nim
al Id
entif
icat
ion
and
DN
A
Nati
onal A
nim
al R
eco
rds
Reposi
tory
—D
ata
Ele
ments
Ani
mal
Ide
ntifi
cation
Num
ber,
AIN
, or
G
roup
/Lot
Ide
ntifi
cation
Num
ber,
GIN
Pr
emis
es I
dent
ifica
tion
Num
ber,
PIN
, of
the
lo
cation
whe
re the
eve
nt tak
es p
lace
D
ate
of the
eve
nt
Even
t ty
pe (
mov
emen
t in
, m
ovem
ent ou
t,
sigh
ting
of an
ani
mal
at a
loca
tion
, te
rmin
atio
nof
the
ani
mal
, et
c)
Cow
/Calf
Ope
rato
rSa
leyar
dFe
edlo
tSt
ocke
rPa
cker
Ret
aile
rW
hole
sale
rPr
oces
sor
Nat
iona
l Dat
aBa
seU
SDA
Por
tal
(Met
adat
a)
Priv
ate
or S
tate
Dat
abas
e(A
TD)
ww
w.a
nim
alid
.aph
is.u
sda.
gov
Dat
a re
quir
ed b
y U
SD
A to
be
kept
at n
atio
nal l
evel
Flow
of A
nim
al a
nd P
rodu
cts
Flow
of P
aym
ent
Bre
ak
DN
A S
ampl
e
Flow
of c
ompl
ete
trace
abili
ty fr
om fa
rm to
fork
as
a com
bina
tion
of p
endi
ng N
atio
nal A
nim
al Id
entif
icat
ion
and
DN
A
Bre
ak
DN
A S
ampl
e
Flow
of c
ompl
ete
trace
abili
ty fr
om fa
rm to
fork
as
a com
bina
tion
of p
endi
ng N
atio
nal A
nim
al Id
entif
icat
ion
and
DN
A 62
63Cost Computation of Traceability from Farm to Fork
In order to obtain the per pound cost of the traceability all the way through the
value chain, per head cost of the traceability incurred at every point of the chain will be
summed up and divided by the average beef productivity of an individual animal.
Dhuyvetter and Blasi developed a model (www.beefstockerusa.org/rfid) to
compute the cost of RFID systems for different sizes and players in the supply chain, and
I used their model to compute the cost of RFID for various players in the beef value
chain.
The Dhuyvetter and Blasi’s model takes into account the following variables
to provide cost estimation of RFID system for various players in the beef supply chain.
( )( )
activitylOperationatheofCostMonthlyMRFIDtoGoesEuipmenttheofUsePercentageP
HerdofSizeSCostInterestAccuredCIA
YearTimeT
MonthTimetRateInterestMonthlyrRateInterestAnnualR
EquipmenttheofLifeExpectedEValueSalvageS
EquipmenttheofValueInitialIonDepreciatiAnnualD
H
L
V
V
===
==
=======
...
The equipment used in the model for cost computation is depreciated over a
number of years depending on the expected life of the equipment. Equation 3.1 can be
used to compute the annual depreciation of the equipment.
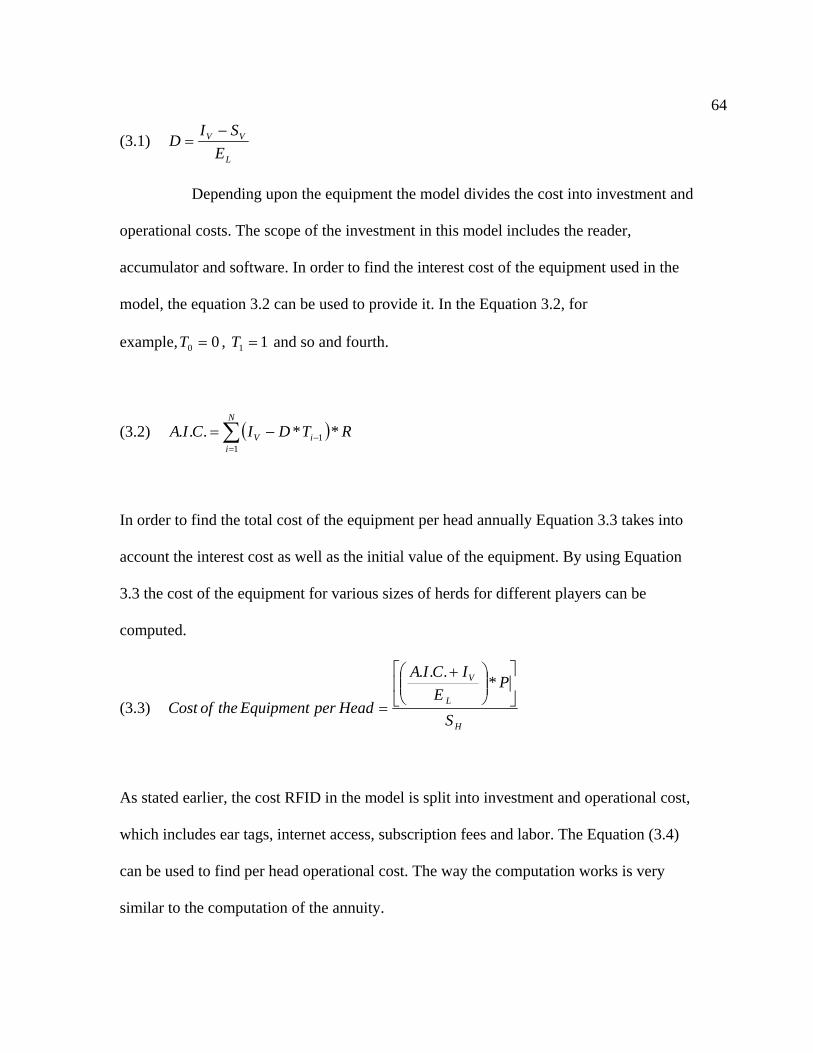
64
(3.1) L
VV
ESI
D−
=
Depending upon the equipment the model divides the cost into investment and
operational costs. The scope of the investment in this model includes the reader,
accumulator and software. In order to find the interest cost of the equipment used in the
model, the equation 3.2 can be used to provide it. In the Equation 3.2, for
example, 00 =T , 11 =T and so and fourth.
(3.2) ( )∑=
−−=N
iiV RTDICIA
11 **...
In order to find the total cost of the equipment per head annually Equation 3.3 takes into
account the interest cost as well as the initial value of the equipment. By using Equation
3.3 the cost of the equipment for various sizes of herds for different players can be
computed.
(3.3) H
L
V
S
PE
ICIA
HeadperEquipmenttheofCost⎥⎦
⎤⎢⎣
⎡⎟⎟⎠
⎞⎜⎜⎝
⎛ +
=
*...
As stated earlier, the cost RFID in the model is split into investment and operational cost,
which includes ear tags, internet access, subscription fees and labor. The Equation (3.4)
can be used to find per head operational cost. The way the computation works is very
similar to the computation of the annuity.
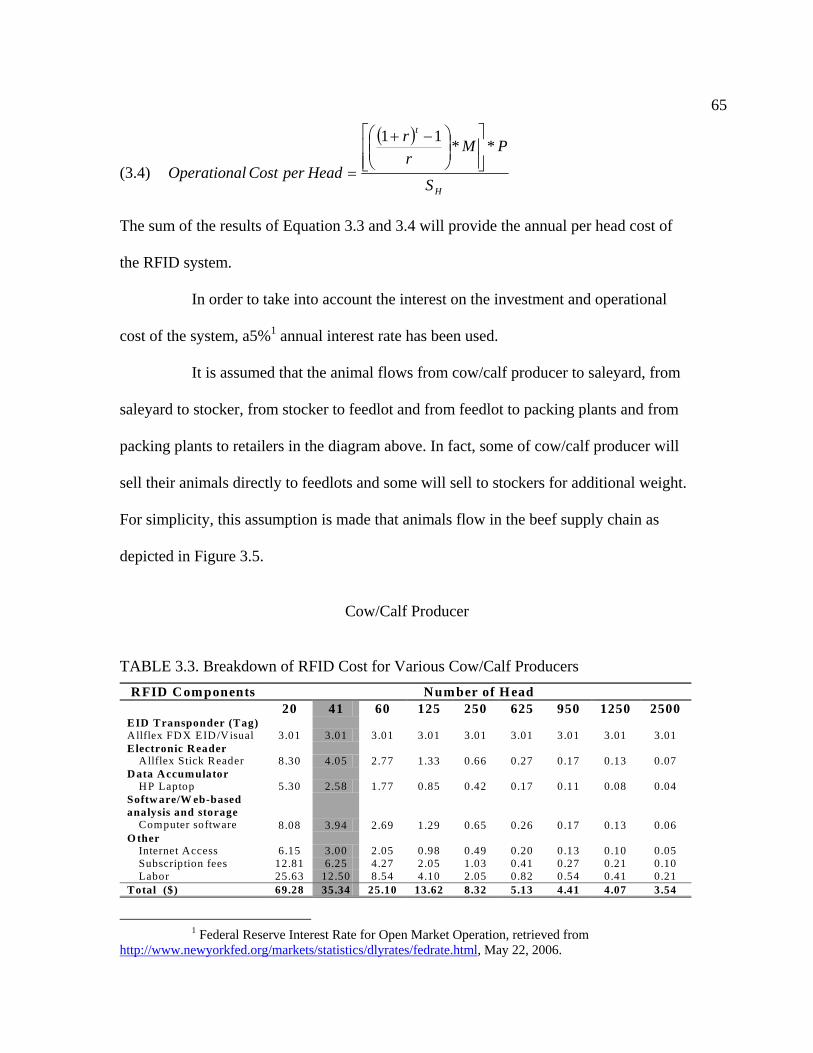
65
(3.4)
( )
H
t
S
PMrr
HeadperCostlOperationa
**11
⎥⎥⎦
⎤
⎢⎢⎣
⎡⎟⎟⎠
⎞⎜⎜⎝
⎛ −+
=
The sum of the results of Equation 3.3 and 3.4 will provide the annual per head cost of
the RFID system.
In order to take into account the interest on the investment and operational
cost of the system, a5%1 annual interest rate has been used.
It is assumed that the animal flows from cow/calf producer to saleyard, from
saleyard to stocker, from stocker to feedlot and from feedlot to packing plants and from
packing plants to retailers in the diagram above. In fact, some of cow/calf producer will
sell their animals directly to feedlots and some will sell to stockers for additional weight.
For simplicity, this assumption is made that animals flow in the beef supply chain as
depicted in Figure 3.5.
Cow/Calf Producer
TABLE 3.3. Breakdown of RFID Cost for Various Cow/Calf Producers
1 Federal Reserve Interest Rate for Open Market Operation, retrieved from
http://www.newyorkfed.org/markets/statistics/dlyrates/fedrate.html, May 22, 2006.
RFID Components Number of H ead 20 41 60 125 250 625 950 1250 2500
EID Transponder (Tag) Allflex FDX EID/Visual 3.01 3.01 3.01 3.01 3.01 3.01 3.01 3.01 3.01 Electronic Reader
Allflex Stick Reader 8.30 4.05 2.77 1.33 0.66 0.27 0.17 0.13 0.07 Data Accumulator
HP Laptop 5.30 2.58 1.77 0.85 0.42 0.17 0.11 0.08 0.04 Softw are/W eb-based analysis and storage
Computer software 8.08 3.94 2.69 1.29 0.65 0.26 0.17 0.13 0.06 O ther
Internet Access 6.15 3.00 2.05 0.98 0.49 0.20 0.13 0.10 0.05 Subscription fees 12.81 6.25 4.27 2.05 1.03 0.41 0.27 0.21 0.10 Labor 25.63 12.50 8.54 4.10 2.05 0.82 0.54 0.41 0.21
Total ($) 69.28 35.34 25.10 13.62 8.32 5.13 4.41 4.07 3.54
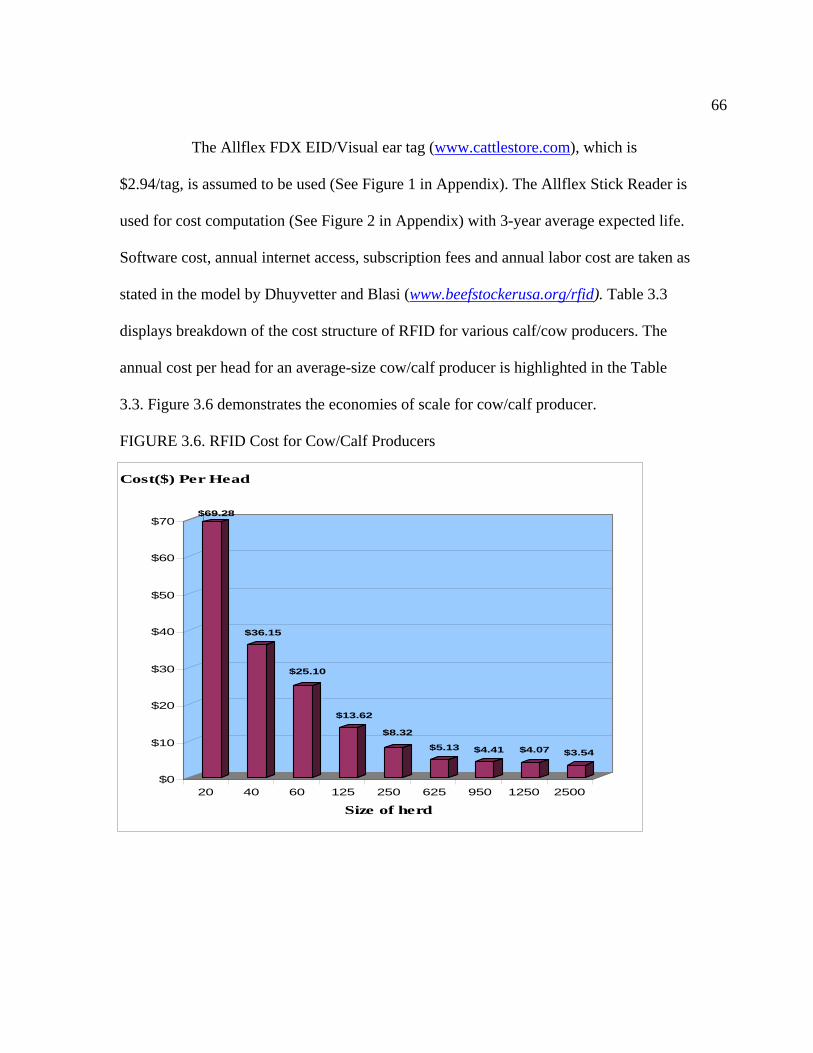
66
The Allflex FDX EID/Visual ear tag (www.cattlestore.com), which is
$2.94/tag, is assumed to be used (See Figure 1 in Appendix). The Allflex Stick Reader is
used for cost computation (See Figure 2 in Appendix) with 3-year average expected life.
Software cost, annual internet access, subscription fees and annual labor cost are taken as
stated in the model by Dhuyvetter and Blasi (www.beefstockerusa.org/rfid). Table 3.3
displays breakdown of the cost structure of RFID for various calf/cow producers. The
annual cost per head for an average-size cow/calf producer is highlighted in the Table
3.3. Figure 3.6 demonstrates the economies of scale for cow/calf producer.
FIGURE 3.6. RFID Cost for Cow/Calf Producers
$69.28
$36.15
$25.10
$13.62
$8.32
$5.13 $4.41 $4.07 $3.54
$0
$10
$20
$30
$40
$50
$60
$70
20 40 60 125 250 625 950 1250 2500
Size of herd
Cost($) Per Head
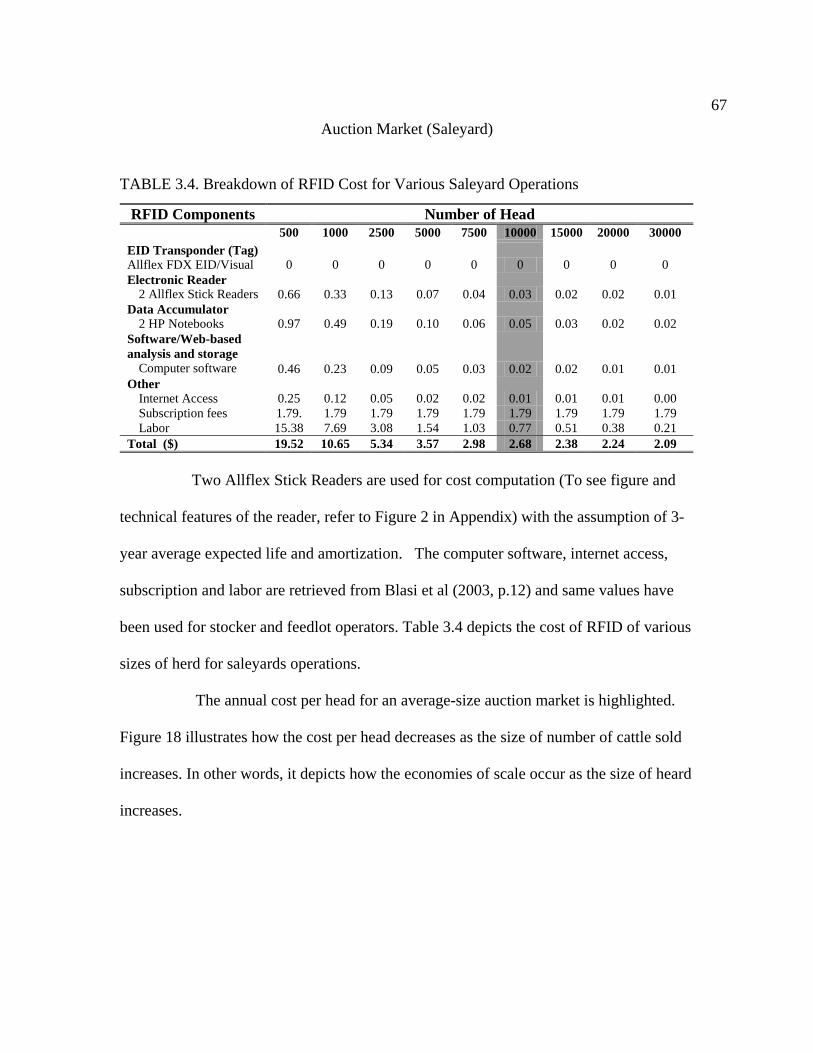
67Auction Market (Saleyard)
TABLE 3.4. Breakdown of RFID Cost for Various Saleyard Operations
Two Allflex Stick Readers are used for cost computation (To see figure and
technical features of the reader, refer to Figure 2 in Appendix) with the assumption of 3-
year average expected life and amortization. The computer software, internet access,
subscription and labor are retrieved from Blasi et al (2003, p.12) and same values have
been used for stocker and feedlot operators. Table 3.4 depicts the cost of RFID of various
sizes of herd for saleyards operations.
The annual cost per head for an average-size auction market is highlighted.
Figure 18 illustrates how the cost per head decreases as the size of number of cattle sold
increases. In other words, it depicts how the economies of scale occur as the size of heard
increases.
RFID Components Number of Head 500 1000 2500 5000 7500 10000 15000 20000 30000
EID Transponder (Tag) Allflex FDX EID/Visual 0 0 0 0 0 0 0 0 0 Electronic Reader
2 Allflex Stick Readers 0.66 0.33 0.13 0.07 0.04 0.03 0.02 0.02 0.01 Data Accumulator
2 HP Notebooks 0.97 0.49 0.19 0.10 0.06 0.05 0.03 0.02 0.02 Software/Web-based analysis and storage
Computer software 0.46 0.23 0.09 0.05 0.03 0.02 0.02 0.01 0.01 Other
Internet Access 0.25 0.12 0.05 0.02 0.02 0.01 0.01 0.01 0.00 Subscription fees 1.79. 1.79 1.79 1.79 1.79 1.79 1.79 1.79 1.79 Labor 15.38 7.69 3.08 1.54 1.03 0.77 0.51 0.38 0.21
Total ($) 19.52 10.65 5.34 3.57 2.98 2.68 2.38 2.24 2.09
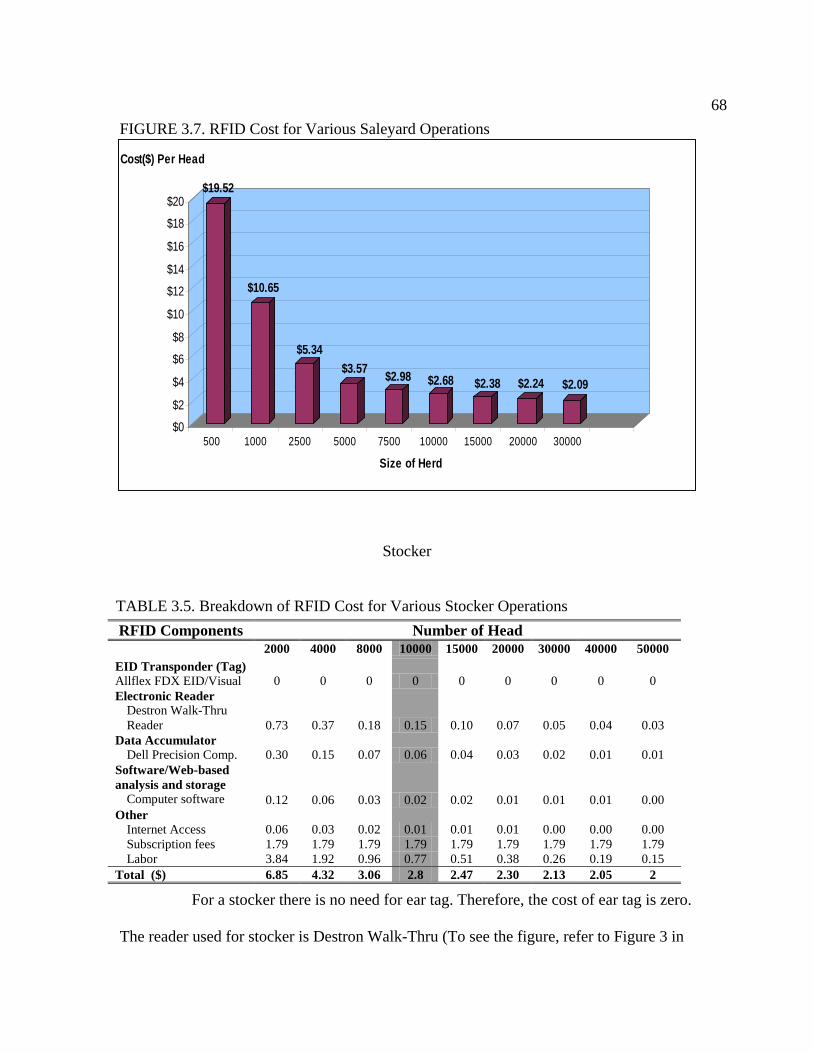
68FIGURE 3.7. RFID Cost for Various Saleyard Operations
Stocker
TABLE 3.5. Breakdown of RFID Cost for Various Stocker Operations
For a stocker there is no need for ear tag. Therefore, the cost of ear tag is zero.
The reader used for stocker is Destron Walk-Thru (To see the figure, refer to Figure 3 in
RFID Components Number of Head 2000 4000 8000 10000 15000 20000 30000 40000 50000
EID Transponder (Tag) Allflex FDX EID/Visual 0 0 0 0 0 0 0 0 0 Electronic Reader
Destron Walk-Thru Reader 0.73 0.37 0.18 0.15 0.10 0.07 0.05 0.04 0.03
Data Accumulator Dell Precision Comp. 0.30 0.15 0.07 0.06 0.04 0.03 0.02 0.01 0.01
Software/Web-based analysis and storage
Computer software 0.12 0.06 0.03 0.02 0.02 0.01 0.01 0.01 0.00 Other
Internet Access 0.06 0.03 0.02 0.01 0.01 0.01 0.00 0.00 0.00 Subscription fees 1.79 1.79 1.79 1.79 1.79 1.79 1.79 1.79 1.79 Labor 3.84 1.92 0.96 0.77 0.51 0.38 0.26 0.19 0.15
Total ($) 6.85 4.32 3.06 2.8 2.47 2.30 2.13 2.05 2
$19.52
$10.65
$5.34$3.57 $2.98 $2.68 $2.38 $2.24 $2.09
$0
$2
$4
$6
$8
$10
$12
$14
$16
$18
$20
500 1000 2500 5000 7500 10000 15000 20000 30000
Size of Herd
Cost($) Per Head
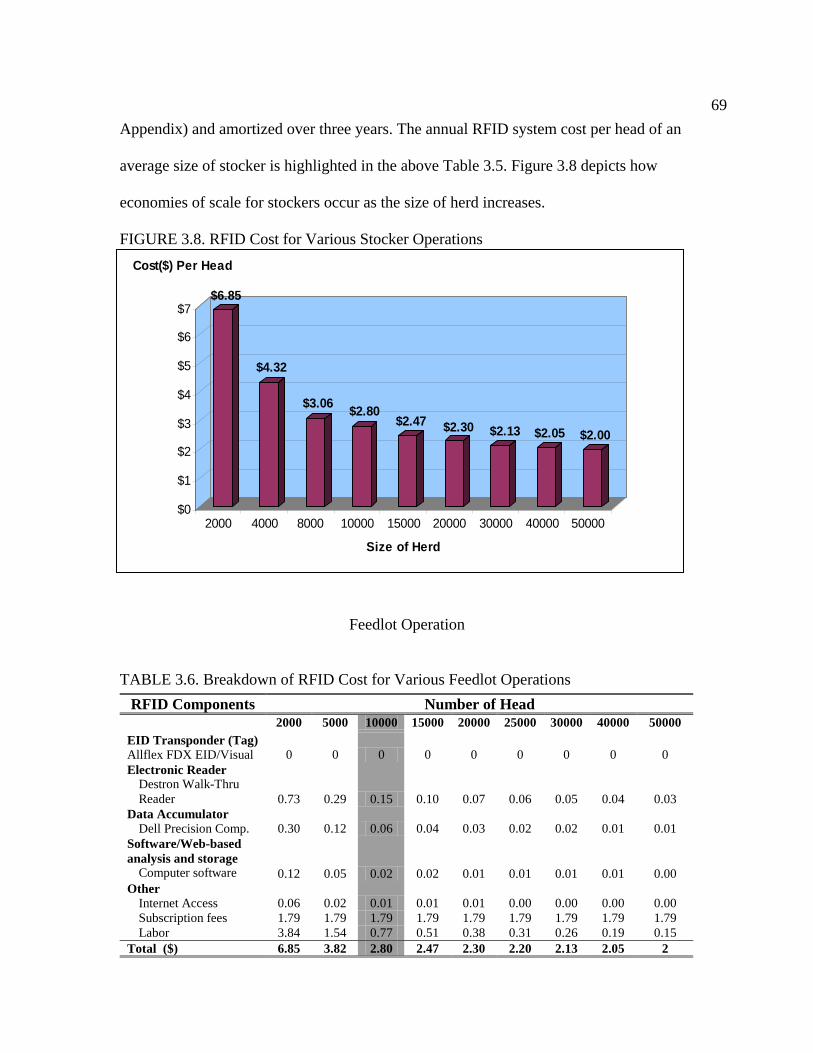
69Appendix) and amortized over three years. The annual RFID system cost per head of an
average size of stocker is highlighted in the above Table 3.5. Figure 3.8 depicts how
economies of scale for stockers occur as the size of herd increases.
FIGURE 3.8. RFID Cost for Various Stocker Operations
Feedlot Operation
TABLE 3.6. Breakdown of RFID Cost for Various Feedlot Operations RFID Components Number of Head
2000 5000 10000 15000 20000 25000 30000 40000 50000 EID Transponder (Tag) Allflex FDX EID/Visual 0 0 0 0 0 0 0 0 0 Electronic Reader
Destron Walk-Thru Reader 0.73 0.29 0.15 0.10 0.07 0.06 0.05 0.04 0.03
Data Accumulator Dell Precision Comp. 0.30 0.12 0.06 0.04 0.03 0.02 0.02 0.01 0.01
Software/Web-based analysis and storage
Computer software 0.12 0.05 0.02 0.02 0.01 0.01 0.01 0.01 0.00 Other
Internet Access 0.06 0.02 0.01 0.01 0.01 0.00 0.00 0.00 0.00 Subscription fees 1.79 1.79 1.79 1.79 1.79 1.79 1.79 1.79 1.79 Labor 3.84 1.54 0.77 0.51 0.38 0.31 0.26 0.19 0.15
Total ($) 6.85 3.82 2.80 2.47 2.30 2.20 2.13 2.05 2
$6.85
$4.32
$3.06 $2.80$2.47 $2.30 $2.13 $2.05 $2.00
$0
$1
$2
$3
$4
$5
$6
$7
2000 4000 8000 10000 15000 20000 30000 40000 50000
Size of Herd
Cost($) Per Head
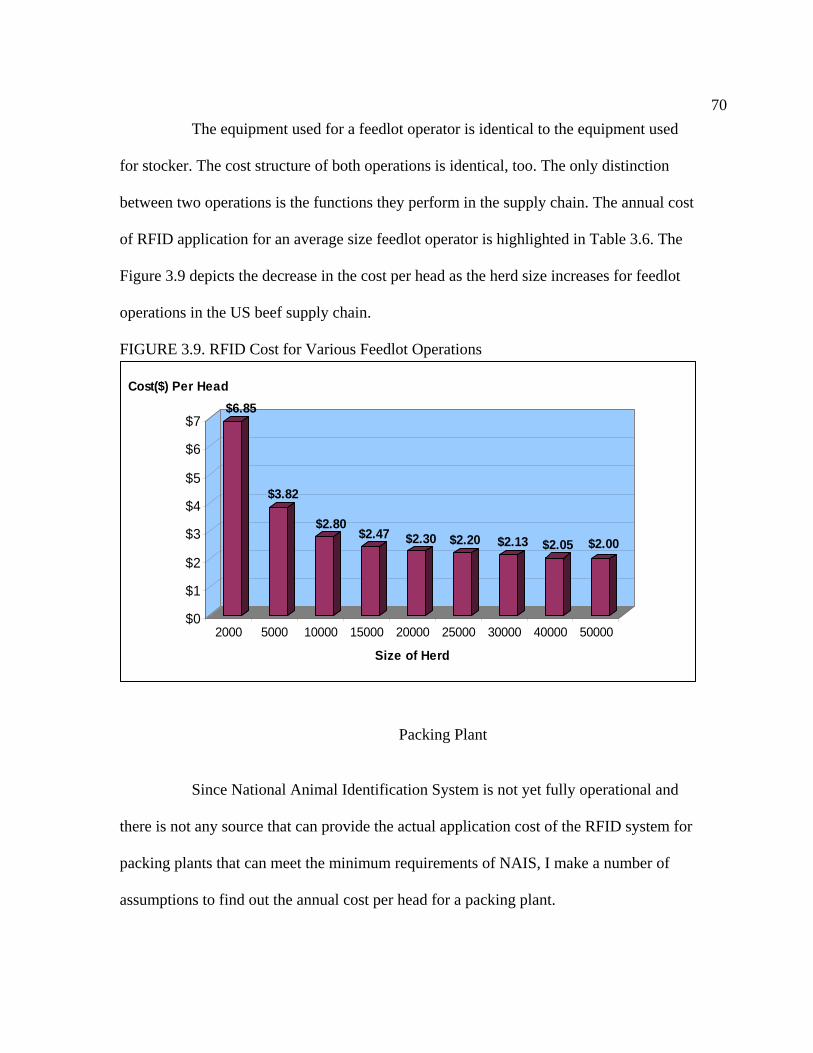
70The equipment used for a feedlot operator is identical to the equipment used
for stocker. The cost structure of both operations is identical, too. The only distinction
between two operations is the functions they perform in the supply chain. The annual cost
of RFID application for an average size feedlot operator is highlighted in Table 3.6. The
Figure 3.9 depicts the decrease in the cost per head as the herd size increases for feedlot
operations in the US beef supply chain.
FIGURE 3.9. RFID Cost for Various Feedlot Operations
3.4.5 Packing Plant/ Slaughterhouse
Packing Plant Since National Animal Identification System is not yet fully operational and
there is not any source that can provide the actual application cost of the RFID system for
packing plants that can meet the minimum requirements of NAIS, I make a number of
assumptions to find out the annual cost per head for a packing plant.
$6.85
$3.82
$2.80$2.47 $2.30 $2.20 $2.13 $2.05 $2.00
$0
$1
$2
$3
$4
$5
$6
$7
2000 5000 10000 15000 20000 25000 30000 40000 50000
Size of Herd
Cost($) Per Head
711. The equipment used for feedlot operation can be sufficient to implement
RFID not more than 50,000 head of cattle (computer, reader and labor). 2. Enrollment in a data management company is assumed to be $1.75/head
annually (Blasi et al., 2003, p.12) as it is used for feedlot operations.
Under these assumptions, maximum per head cost of RFID is going to be
$2/head as illustrated in the last column of Table 3.6. Since the size of packing plants is
not small, the computed cost per head will be lower than that because of the economies of
scale. However, I cannot provide an exact estimation how much lower it will be due to
lack of data. In addition, the four big plants account for 80% of the market and
overwhelmingly large in size relative to the other packing plants in the market; therefore,
per head cost for these packing plants will be lower than those packing plants which are
relatively smaller.
Traceability Cost from Slaughterhouse to Retailers
The cost from cow/calf producer to slaughterhouse estimated above is based
on the information in the model (www.beefstockerusa.org/rfid). However, for the
traceability from farm to fork, the cost should be computed from slaughterhouse to
retailer and added on top of the traceability cost from farm to slaughter.
The technology that will enable us to overcome the break in the
slaughterhouse as mentioned in the earlier sections of the study is Deoxyribonucleic Acid
(DNA) testing. In order to provide full traceability in compliance with the proposed
National Animal Identification System (NAIS), the RFID and DNA will be combined. In
other words, RFID system will enable us to record all the movements of the animal and
DNA will enable us to find out the source or more specifically the cattle from which the
72beef derived. The following diagram illustrates how the system will be merged and how
the DNA based traceability will work.
The proposed traceability system from farm to fork in the US will work
according to illustrated Figure 3.10. There will be two parts of the system: an electronic
identification system (RFID) and a DNA-based traceability system.
At point A or when animals are killed, samples from the carcasses will be
taken and these DNA samples will be linked to individual animal identity (for the
proposed case, the DNA samples will be linked to Animal Identification Number) and
samples will be analyzed and then the DNA profiles will be stored into the database. To
find the source of a pack of meat, the DNA sample will be taken at point B as depicted in
the diagram above and matches with the previously stored DNA profiles in database.
Once the cattle is identified by comparing the DNA samples, the movement
records of the animal can be accessed by using the animal identification number and all
the premises the infected animal had been and all other cattle it commingled with can be
determined. This process will provide a great opportunity to stall all other animals from
going into marketplace that are found to commingle with the infected animal without
taking steps to find out whether these animals are also infected.
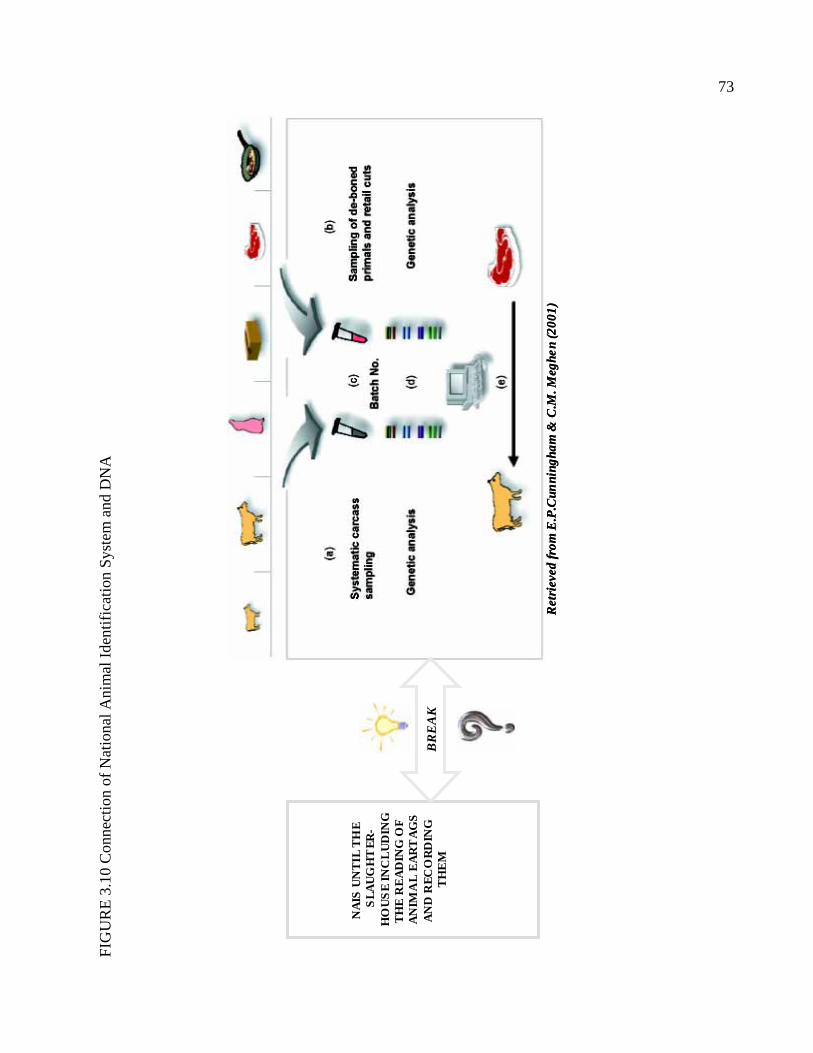
FIG
UR
E 3.
10 C
onne
ctio
n of
Nat
iona
l Ani
mal
Iden
tific
atio
n Sy
stem
and
DN
A
NA
IS U
NT
IL T
HE
SLA
UG
HT
ER-
HO
US
E IN
CL
UD
ING
TH
E R
EA
DIN
G O
F A
NIM
AL
EA
RT
AG
S
AN
D R
ECO
RD
ING
T
HE
MB
RE
AK
Ret
riev
ed fr
om E
.P.C
unni
ngha
m &
C.M
. Meg
hen
(200
1)
NA
IS U
NT
IL T
HE
SLA
UG
HT
ER-
HO
US
E IN
CL
UD
ING
TH
E R
EA
DIN
G O
F A
NIM
AL
EA
RT
AG
S
AN
D R
ECO
RD
ING
T
HE
MB
RE
AK
Ret
riev
ed fr
om E
.P.C
unni
ngha
m &
C.M
. Meg
hen
(200
1)
73
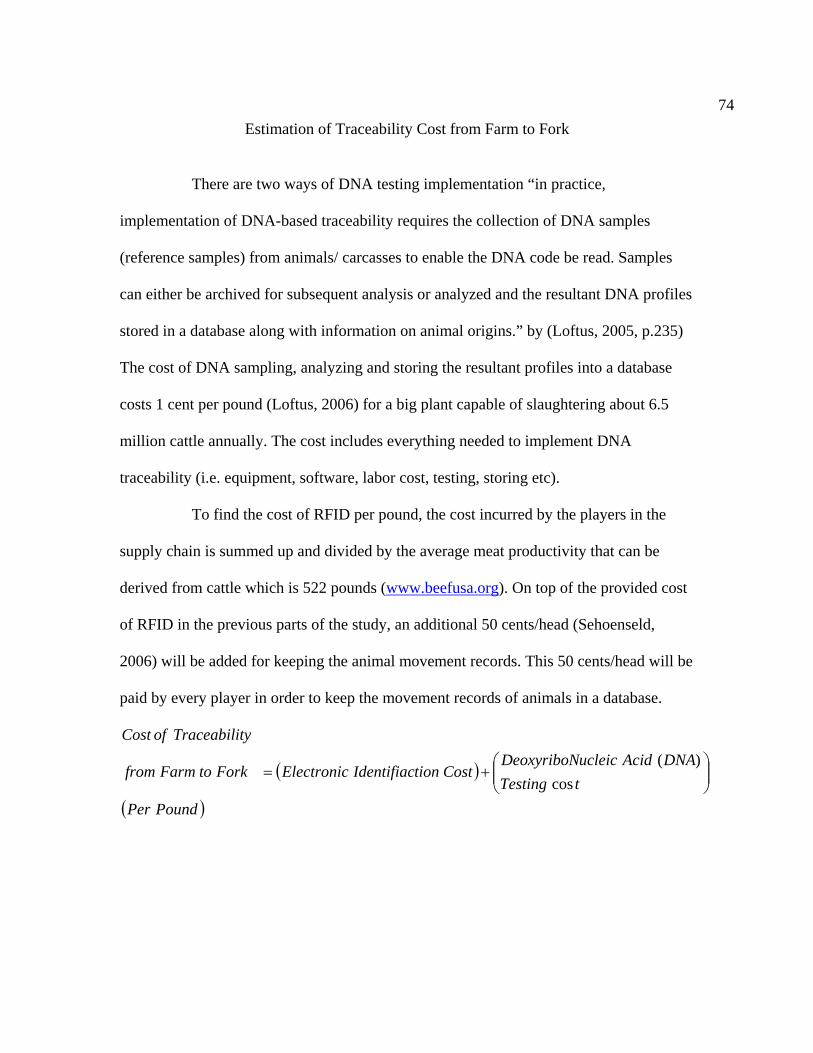
74Estimation of Traceability Cost from Farm to Fork
There are two ways of DNA testing implementation “in practice,
implementation of DNA-based traceability requires the collection of DNA samples
(reference samples) from animals/ carcasses to enable the DNA code be read. Samples
can either be archived for subsequent analysis or analyzed and the resultant DNA profiles
stored in a database along with information on animal origins.” by (Loftus, 2005, p.235)
The cost of DNA sampling, analyzing and storing the resultant profiles into a database
costs 1 cent per pound (Loftus, 2006) for a big plant capable of slaughtering about 6.5
million cattle annually. The cost includes everything needed to implement DNA
traceability (i.e. equipment, software, labor cost, testing, storing etc).
To find the cost of RFID per pound, the cost incurred by the players in the
supply chain is summed up and divided by the average meat productivity that can be
derived from cattle which is 522 pounds (www.beefusa.org). On top of the provided cost
of RFID in the previous parts of the study, an additional 50 cents/head (Sehoenseld,
2006) will be added for keeping the animal movement records. This 50 cents/head will be
paid by every player in order to keep the movement records of animals in a database.
( )
( )PoundPertTesting
DNAAciducleicDeoxyriboNCosttionIdentifiacElectronicForktoFarmfrom
tyTraceabiliofCost
⎟⎟⎠
⎞⎜⎜⎝
⎛+=
cos)(
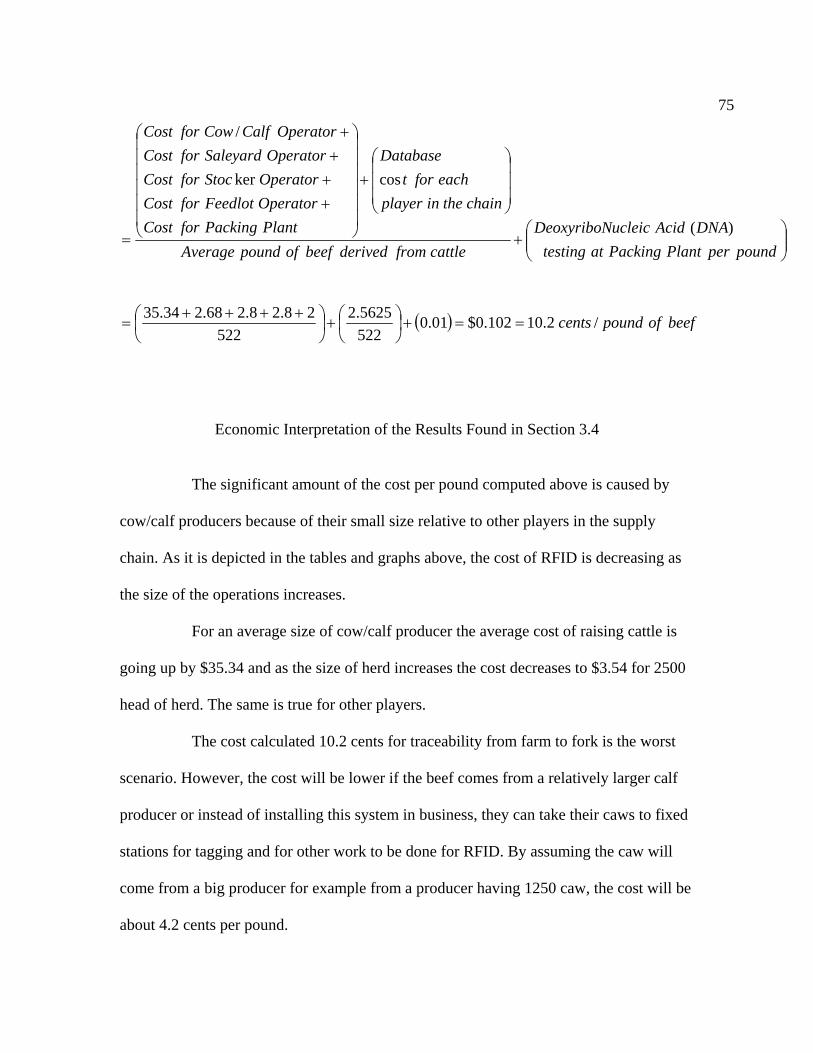
75
⎟⎟⎠
⎞⎜⎜⎝
⎛+
⎟⎟⎟
⎠
⎞
⎜⎜⎜
⎝
⎛+
⎟⎟⎟⎟⎟⎟
⎠
⎞
⎜⎜⎜⎜⎜⎜
⎝
⎛
++++
=poundperPlantPackingattesting
DNAAciducleicDeoxyriboNcattlefromderivedbeefofpoundAverage
chaintheinplayereachfort
Database
PlantPackingforCostOperatorFeedlotforCostOperatorStocforCostOperatorSaleyardforCost
OperatorCalfCowforCost
)(
cosker
/
( ) beefofpoundcents /2.10102.0$01.05225625.2
52228.28.268.234.35
==+⎟⎠⎞
⎜⎝⎛+⎟
⎠⎞
⎜⎝⎛ ++++
=
Economic Interpretation of the Results Found in Section 3.4
The significant amount of the cost per pound computed above is caused by
cow/calf producers because of their small size relative to other players in the supply
chain. As it is depicted in the tables and graphs above, the cost of RFID is decreasing as
the size of the operations increases.
For an average size of cow/calf producer the average cost of raising cattle is
going up by $35.34 and as the size of herd increases the cost decreases to $3.54 for 2500
head of herd. The same is true for other players.
The cost calculated 10.2 cents for traceability from farm to fork is the worst
scenario. However, the cost will be lower if the beef comes from a relatively larger calf
producer or instead of installing this system in business, they can take their caws to fixed
stations for tagging and for other work to be done for RFID. By assuming the caw will
come from a big producer for example from a producer having 1250 caw, the cost will be
about 4.2 cents per pound.

76Depending on the size of the players in the value chain, the cost of traceability
from farm to form will range from 4.2 to 10.2 cents per pound.
77
CHAPTER 4
WELFARE IMPLICATIONS
The core question by this study addressed is what consumers will gain by
having traceable products in their food supply chain. Before going to benefits of
consumers from traceability, I would like to elaborate on the foodborne disease related
death and the cost of the foodborne diseases.
In 2000, 2.1 million people died from diarrhea and a significant number of
these 2.1 million is attributed to tainted food and drinking water
(www.who.int/mediacentre/factsheets). Every year in the United States, there are 76
millions foodborne diseases cases caused by pathogens such as E.coli 0157, Listeria
moncytogenes and Salmonella and 325,000 of these cases end up in hospital
(www.researchandmarkets.com). About 5,000 of the 76 million cases end with death
every year in the United States (www.who.int/mediacentre/factsheets)
The Welfare of Traceability for Consumers
Traceability is a unique system that encourages a strong interaction between
consumers and producers and provides a positive impact on both of the players.
Traceability is becoming a tool for consumers to ensure safety of food products and
increase the profit for firms.
78It is true that the consumers have diversified economic behaviors, which are
well explained by their incomes or endowments. Because food products are most needed
in human life, and therefore, every consumer prefers safe and healthy product from a
reliable source of production. Why? Because consumers want to prevent any of the
following cases during or post consumption:
1. Consumption of contaminated food
2. Food borne illness
3. Future Medical expenses
The following incident is about Kevin Kowalcyk demonstrates the risk of
consuming contaminated food:
(http://www.safetables.org/Policy_&_Outreach/Speeches/speech_barbara_kowalcyk_200
4.html)
“Good afternoon, my name is Barbara Kowalcyk. I am a biostatistician from Mount Horeb, Wisconsin and a Board Member of Safe Tables Our Priority. I would like to thank the U.S. House of Representatives’ Food Safety Caucus for sponsoring this important event and taking the time to really listen to consumers about the costs that they face from contamination in America’s food.
Three years ago, my oldest child, Megan started Kindergarten. One night, as I was putting our 2 ½ year old son, Kevin, to bed, we talked about how Megan – his best friend - would be going to Kindergarten in just a few weeks. As I kissed him goodnight, Kevin said, proudly, “When I grow up, Mommy, I’m going to Kindergarten too.” This month Kevin should have started Kindergarten, but foodborne illness robbed him of that chance. On Tuesday, July 31, 2001, Kevin awoke with diarrhea and a mild fever. By Thursday morning, Kevin was much sicker and was hospitalized for dehydration and bloody stools. Later that afternoon, we were given the diagnosis: E. coli O157:H7. My husband, Mike and I were distraught – we had heard of E. coli and knew that it could kill. The doctors, however, reassured us that Kevin would be ok…as long as he didn’t develop Hemolytic Uremic Syndrome (HUS), a condition we had never even heard of.
The following day Kevin’s kidneys started failing and he was transferred to the Pediatric Intensive Care Unit at the University of Wisconsin’s Children’s Hospital. Kevin had developed HUS. My husband and I will never forget sitting in this tiny waiting room while grim-faced doctors informed us that this was one of the worst things that could have happened to our child. The best they could do was keep Kevin alive while the disease ran its course and hope they could fix everything when it was over.
Our family spent the next eight days living in that hospital – watching our beautiful child slip away from us. Kevin spent the first three days crawling around a crib in agony. He threw up black bile. He became drawn and his eyes were sunken. He looked like a malnourished
79third world child. And he smelled – a horrible and overwhelming smell – a smell that you could never forget. During those three long days, Kevin begged us to give him water or juice, but the doctors said it would only make him worse. Kevin finally convinced us to give him a sponge bath and, as soon as the washcloth came near his mouth, he grabbed it, bit down on it and sucked the water right out of it. It broke our hearts.
On Tuesday, August 7th, Kevin was placed on a ventilator and continuous dialysis. In hopes of preventing Kevin from remembering this horrible ordeal, doctors heavily sedated him. As the medication would wear off, Kevin would try to pull the tubes out so braces were put on his arms. His body began to swell. Doctors inserted tubes to drain fluid off both of his lungs. By the end of the week, he was receiving more medications than we could count to stabilize his blood pressure and heart rate. He had received eight units of blood. Then, on the evening of August 11th, those same grim-faced doctors ushered us back into that tiny waiting room. Kevin’s heart had stopped but they were able to resuscitate him. Kevin had a 10% chance of survival – if they could get him on a heart and lung machine. Did we want them to proceed? Yes, we said. Those same grim-faced doctors came back to the waiting room a second time. Kevin’s heart had stopped again and they had been able to resuscitate him. Did we still want them to proceed? Yes, we said. Those same grim-faced doctors came back to the waiting room a third time. Our beloved Kevin had died. He was only 2 years, 8 months and 1 day old.
What about the hidden financial costs of foodborne illness? My husband and I were lucky because we have good health insurance and a life insurance policy on our children. Even so, Kevin’s life insurance did not cover the entire cost of his funeral, and despite our good medical insurance, neither myself, my husband or my daughter, Megan, were entitled to grief counseling which we all desperately needed. Because of Kevin’s death, my marriage is statistically more likely to end in divorce and my surviving children are at risk of developing eating disorders. It is now three years since Kevin died and we continue to spend money every month on grief counseling to help ensure that our family doe not incur yet another loss. The price of foodborne illness is too high.
And what about the losses you can’t put a price on? The parents of a four year old are informed that their child will likely need a kidney transplant before she is fifteen. A perfectly healthy six year old loses her pancreas, becomes a diabetic and has to take 40 pills a day in order to eat. A nine year old is terrified to go to sleep for fear she will never wake up again. An active twelve-year-old girl is easily winded. A college freshman loses her hair and is told that her kidneys would never survive a pregnancy. A two-year-old child dies. The price of foodborne illness is too high”.
Due to contaminated food, Kevin lost his life. The medical cost the family
incurred was more than $100,000 (www.safetables.org) and even though the family had
good insurance package the insurer did not cover all of the cost. In addition, the family
incurred unquantifiable emotional cost by losing their child.
In 1997, major food-borne pathogens such as Salmonellosis,
Campylobacteriosis, E.coli O157, Cholera, naturally occurring toxins, unconventional
agents, persistent organic pollutants and metals, caused nearly $35 billion medical costs
80and productivity loss in the United States
(http://www.who.int/mediacentre/factsheets/fs237/en). These statistics demonstrate how
costly the foodborne disease can be to society.
The best way to protect ourselves from foodborne diseases and from the related
costs is to have safe food. The key instrument that will enable us to do this is
“traceability from farm to fork”. The cost of having traceable food, for example, beef will
range from 4.2 cents to 10.2 cents per pound. Traceability in the food value chain will
allow health authorities to easily determine the source of the tainted food and prevent it
from going into market or to gradually recall products already in the market before they
are consumed. The cost of foodborne disease, to society can be reduced and will increase
the welfare of the society. The proposed NAIS system, planned for full implementation
by 2009 will enable trace back to find all the premises the infected animal had been and
the cattle it commingled within 48 hours. Other cattle that commingled with the infected
animal would be found and prevented from going into market and the source of the
contamination will be fixed. The combined EID+DNA will enable determination of cattle
from which the beef was derived and trace it all the way back to the herd of origin.
Traceability itself alone cannot assure quality but it can enable authorities to
find out the liable player in the value chain and make firms in the value chain invest
sufficient resources to combat against food contamination. As Buzby, Frenzen and Rasco
(2001, p.1) state, “Economic theory suggests that firms that make or distribute food
products will invest fewer resources in reducing disease-causing contamination if they
expect not to pay for injuries due to contaminated products.” Therefore, traceability is the
81key tool that will make firms invest sufficient resources to reduce disease causing
contamination and produce “due diligence”.
The Benefits of Traceability for Firms
In competitive environments firms always strive to innovate and develop new
marketing and production mechanisms to successfully position or survive the existing
pressure in the market place. The competitive U.S. beef industry is also continuously
developing its technology and marketing strategy with the regard to maximizing its
ability of satisfying consumer needs and striving to remain a sustainable industry. Along
those lines U.S. beef industry has adopted multiple strategies for beef products in
domestic and export markets. One of the recent marketing strategies for the beef industry
as well as for other food industries has been the traceability, which has been
comprehensively described in previous sections. Recent contaminated beef outbreaks
caused consumers to lose confidence on the quality and safety of beef products and to
change their consumption patterns. Therefore, some of food industries players e.g. beef
firms developed and started to apply traceability as a mechanism of providing very
valuable information e.g. the origin of product to the consumers to avoid their concerns
and doubts. It is important to remember that traceability also provides information on the
quality of the product, because the traceability system allows players to observe all points
of an entire production process. The system has the ability to build trust and confidence
of the consumers over the quality and safety of the food products. hAnluain (2001, p.1)
states that:
“Trust is central in meat purchases, because you cannot judge what’s important by looking at the product, so you have to believe in the product you are getting. The only time you discover that your trust is broken is when a scare occurs,” said Mary McCarthy, a lecturer in food
82economics at University College Cork in Ireland. “Traceability reassures the consumer and protects the supplier or retailer.”
In addition to many other favoring characteristics and benefits the traceability
system is also extensively applied by some firms as an efficient tool to differentiate beef
products. The differentiability of beef products contributed to the sustainability and
competitiveness of the given firm in the market place and also generated sufficient profit
margins.
The most important and crucial point is the ease of adopting traceability into
the production process by any player in the beef value chain. For example, it will only
cost $2.68/head annually to a saleyard operator handling 10,000 head of cattle and
$2.8/head annually to a feedlot operator having 10,000 head of cattle. The traceability
application cost per head makes it relatively easy for the beef chain players to implement
traceability to differentiate their beef produce.
Since there is no legal barrier or financial constraint, the first applicant will
enjoy of benefits of traceability by charging premium prices or increasing sales. For
example, in Ireland a supermarket chain, Superquinn uses DNA traceability for the beef it
sells and as a result was able to increase its sales. hAnluain (2001, p.2) states “Our beef
sales have increased steadily over the past number of years, and in 2000 were 11 percent
ahead of 1999, the CEO of Seperquinn, Quinn said”. The increase in the beef sales
experienced by Superquinn draws much more attention than usual, because the total beef
consumption was estimated by European Officials to be 18% below the consumption rate
of 2000 towards the end of 2001 (hAnluain, 2001).
Firms that introduce traceability into their production practices can reap the
benefits of traceability by setting premium prices for the differentiated products.
83Consequently, the differentiability of beef products will enable the firm not only to
participate in premium markets but also in non-premium market by setting different
prices. Clemens (2003b, p.3) state, “Results from consumer focus groups indicate that
Japanese consumers will pay 20% more for domestic foods with specific safety
assurances and production information. This response is generally supported by price
differences at retail outlet.” Therefore, the major commercial motivation for the firms in
the beef industry to implement traceability is to have the ability of differentiating their
products and maximizing profit from premium price setting in the short-run since the
firms in beef value chain operate in a monopolistically competitive environment.
The following will provide details about the economic benefits of traceability
in the case of the product differentiation and premium pricing strategy. To illustrate the
economic effects of the traceability for an individual firm in beef value chain, a
monopolistically competitive market model is used. The model constituted by the
following combination of assumptions from both monopolistic and perfect competition
market environments:
• There are many identical firms that produce and supply beef products to the
consumers;
• This model may apply to all but identical players of the same status in the beef
value chain e.g. beef producers, processors, and retail outlets. Basically, the
model illustrates economic behaviors of the producers or processors as key
players. The mixture of different players e.g. processors and retailer is beyond
the focus of the model as they may have different marketing strategies.
84• In the short run case, one of beef firms differentiates its products with the use
of traceability to target the premium beef market. This part of the model
captures a monopolistic effect, which allows only one firm to exist in the
marketplace and to price its beef products monopolistically. The model
enables us to let other firms of the producer or processor type to enter into
beef market to lessen the existing monopolistic or market power or to
completely reduce it to the zero level. In the short run, only one firm has
market power to affect the price but other firms do not have this advantage. In
the long run other firms enter the premium market by using traceability and
produce at the price that is equal to average cost where marginal revenue
(MR) =marginal cost (MC).
• In the long run, other U.S. beef firms e.g. producers, processors and retail
outlets will realize the economic benefit of the traceability from targeting
premium market. In addition, consumers will increase demand for traceable
beef products that will urge other firms to apply traceability.
• Obviously, the monopolist will promote the specific benefits of traceable beef
products to the consumers, which will increase their awareness of the
importance of the system. Other firms will strive to apply the same
traceability technology to reposition their presence in the market place or to
be able to target the premium beef segment. It is likely that the broad
application of the traceability across many firms will reduce the premium
pricing strategy and reduce abnormal profits. Abnormal profits will be
replaced by zero economic profit in the long run due to the application of the
85same technology, traceability and marketing services associated with product
forwarding.
• Though the market structure and environment constitutes some assumptions
of the monopolistic power and pricing, it also allows free entry and exit for all
firms e.g. producer and processor because, the cost of traceability is
affordable. It does not require millions of dollars to incorporate it into
production process (see the cost provided in the previous part of the study for
various size and types of businesses in beef value chain).
• Differentiated products can be substituted with the products of other firms in
meat industry. The substitution depends on the prices and other features of the
substitutable products. Therefore, the demand curve is downward sloping,
which indicates that the price decrease is followed by the increase in the
quantity sold. However, consumer preferences over quality and safety factors
of the products will explicitly segregate the same type of beef product into
different market plots.
Figure 4.1 details a clear picture on short run effects of traceability on the
firm’s economic behavior. The primary objective of the firm is to profit by differentiating
in Figure 4.1.
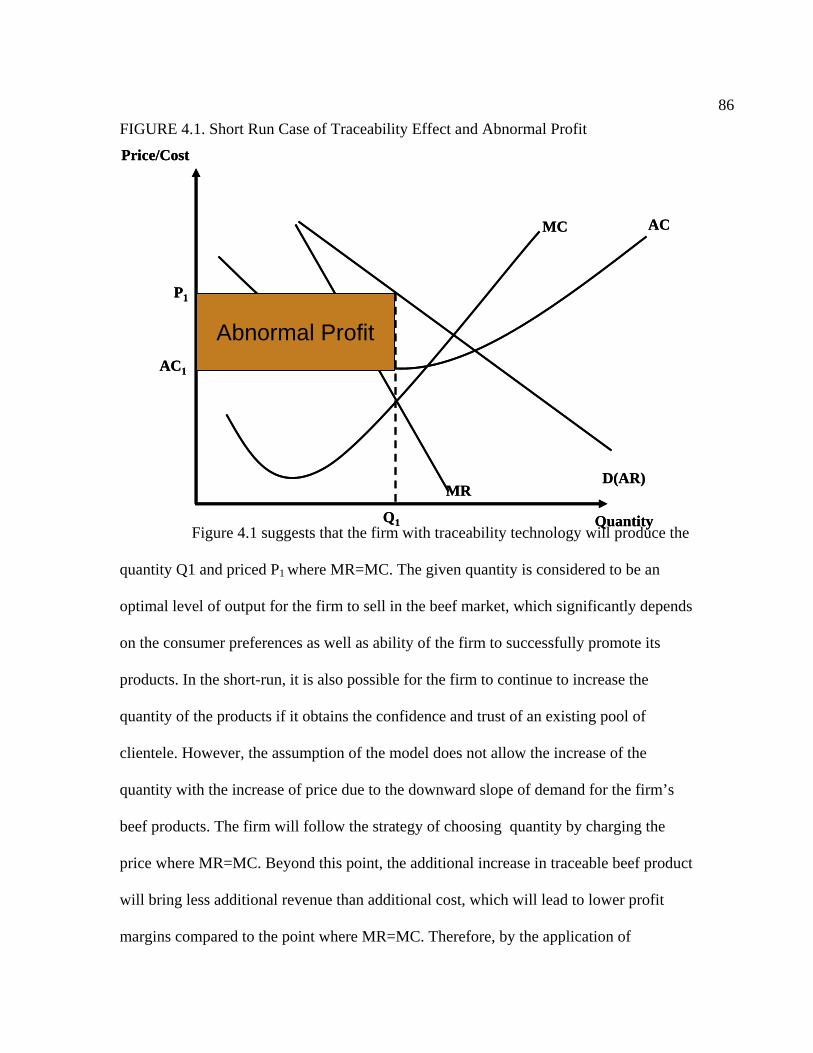
86FIGURE 4.1. Short Run Case of Traceability Effect and Abnormal Profit
Figure 4.1 suggests that the firm with traceability technology will produce the
quantity Q1 and priced P1 where MR=MC. The given quantity is considered to be an
optimal level of output for the firm to sell in the beef market, which significantly depends
on the consumer preferences as well as ability of the firm to successfully promote its
products. In the short-run, it is also possible for the firm to continue to increase the
quantity of the products if it obtains the confidence and trust of an existing pool of
clientele. However, the assumption of the model does not allow the increase of the
quantity with the increase of price due to the downward slope of demand for the firm’s
beef products. The firm will follow the strategy of choosing quantity by charging the
price where MR=MC. Beyond this point, the additional increase in traceable beef product
will bring less additional revenue than additional cost, which will lead to lower profit
margins compared to the point where MR=MC. Therefore, by the application of
Q1 Quantity
Price/Cost
Abnormal Profit
D(AR)MR
ACMC
P1
AC1
Q1 Quantity
Price/Cost
Abnormal Profit
D(AR)MR
ACMC
P1
AC1
87traceability, the firm will maximize its profits in the short- run at the point where MR and
MC intersect. It also concludes that the firm is the monopolist in short run with unique
market power.
Since there is no barrier to entry, other firms will be attracted by the abnormal
profits and will apply the same or similar traceability systems in their production
practices to obtain a share of the abnormal profit.
The key question to be answered is what will be the effect of the new entrants
on the early applicant of traceability system? What will happen to the abnormal profit
that is generated by differentiability of beef products? The new entrants will increase the
supply of the traceable products, which will reduce the price charged by the first firm
acting as a monopolist and will gain some of its clients. Figure 4.2 explicitly illustrates
the dynamics of monopolistically competitive market model in the long run case, where
other identical firms enter into the premium market.
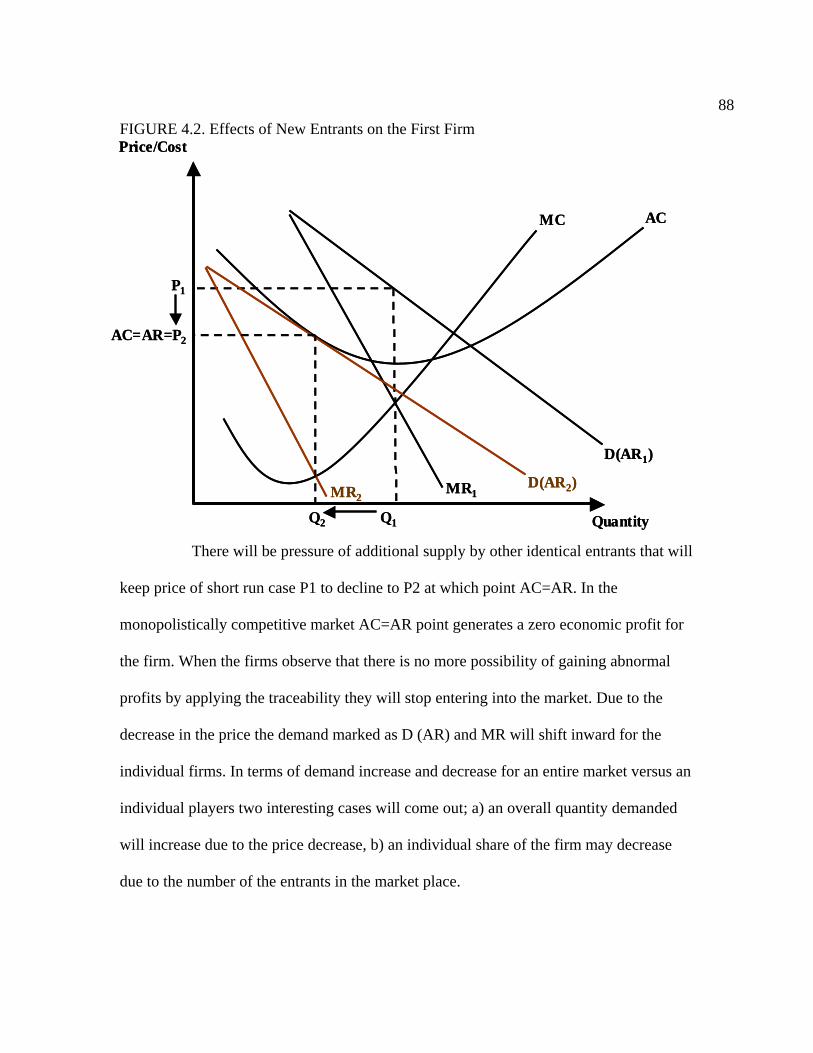
88FIGURE 4.2. Effects of New Entrants on the First Firm
There will be pressure of additional supply by other identical entrants that will
keep price of short run case P1 to decline to P2 at which point AC=AR. In the
monopolistically competitive market AC=AR point generates a zero economic profit for
the firm. When the firms observe that there is no more possibility of gaining abnormal
profits by applying the traceability they will stop entering into the market. Due to the
decrease in the price the demand marked as D (AR) and MR will shift inward for the
individual firms. In terms of demand increase and decrease for an entire market versus an
individual players two interesting cases will come out; a) an overall quantity demanded
will increase due to the price decrease, b) an individual share of the firm may decrease
due to the number of the entrants in the market place.
Q1 Quantity
Price/Cost
D(AR1)
MR1
ACMC
P1
AC=AR=P2
Q2
MR2D(AR2)
Q1 Quantity
Price/Cost
D(AR1)
MR1
ACMC
P1
AC=AR=P2
Q2
MR2D(AR2)
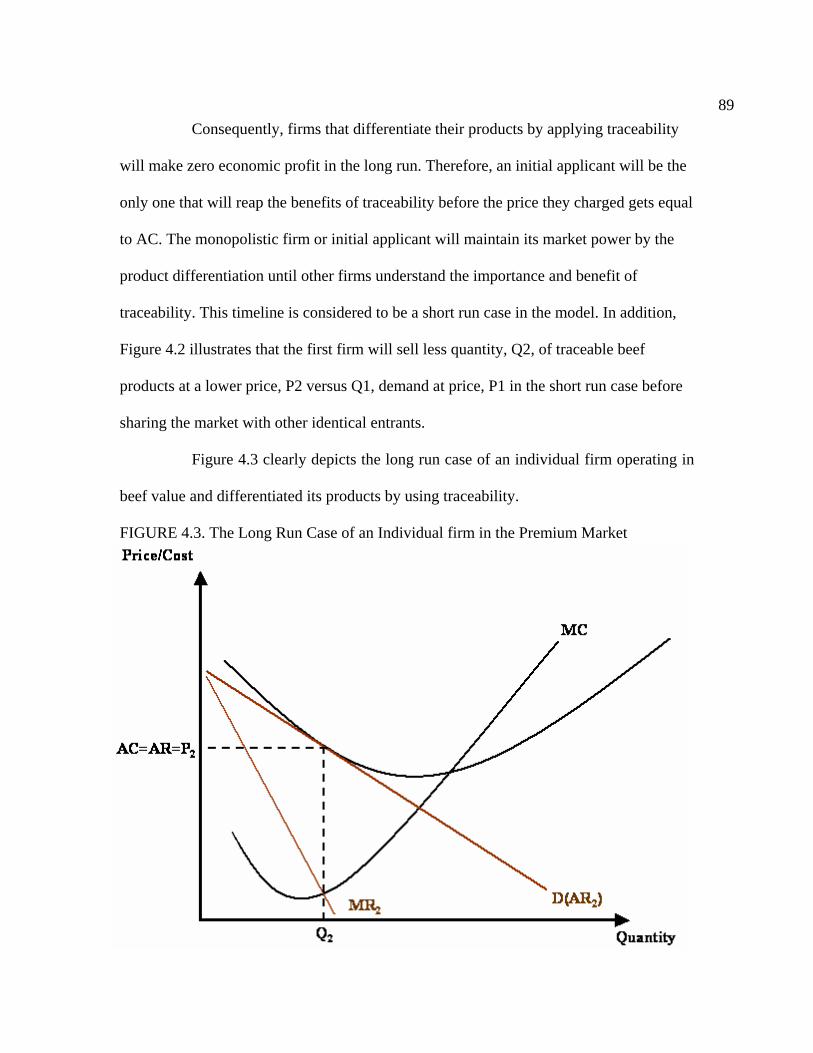
89Consequently, firms that differentiate their products by applying traceability
will make zero economic profit in the long run. Therefore, an initial applicant will be the
only one that will reap the benefits of traceability before the price they charged gets equal
to AC. The monopolistic firm or initial applicant will maintain its market power by the
product differentiation until other firms understand the importance and benefit of
traceability. This timeline is considered to be a short run case in the model. In addition,
Figure 4.2 illustrates that the first firm will sell less quantity, Q2, of traceable beef
products at a lower price, P2 versus Q1, demand at price, P1 in the short run case before
sharing the market with other identical entrants.
Figure 4.3 clearly depicts the long run case of an individual firm operating in
beef value and differentiated its products by using traceability.
FIGURE 4.3. The Long Run Case of an Individual firm in the Premium Market
FIGURE 4.3. The Long-Run Case of an Individual Firm in the Premium Market
90The unique characteristic of this model is that it merges two market models
into one by a single marketing strategy, the differentiation of beef products, initially by
one player and then, by other identical players.
The model suggests that any beef firm may apply traceability as marketing
strategy to differentiate its beef products. This opportunity will enable that firm to obtain
an extreme level of profit in short run that is known as an abnormal profit in the
economics. In other words, that firm will become a monopolist with a unique market
power. But the monopolist has to share its market, which is a premium beef market
segment with other entrants in the long run. Because other entrants e.g. beef producers,
processors and retail outlets will also apply the traceability to be able to differentiate their
products in the market place. As a result, the monopolist firm will lose an abnormal profit
advantage and share it with other entrants. The number of entrants will increase until
price of the beef product reaches to average cost to generate zero economic profit. It is
also true that the implementation of traceability as a successful marketing strategy and
food safety technology across the players in the value chain will generate safer and
quality beef supply. Consequently, the medical and productivity cost to economy will be
reduced.
It is beyond the scope of the current research to test the applicability of the
marketing mechanism by applying the traceability in the real world. A more
comprehensive analysis of traceability for the U.S. beef industry would be required to
better understand what challenges and successes have been achieved after the integration
of the traceability system in the production practices and willingness of consumers to pay
and to purchase traceable products.
91
CHAPTER 5
SUMMARY AND CONCLUSIONS
In this study traceability has been explored in detail. Necessary technical
information for application of traceability system has been provided. In addition, the
different traceability applications in different countries have been studied and compared.
The study also provides information on current trend in the United States and proposes a
way for farm to fork traceability in the US livestock industry as well as the
implementation cost of it per pound of beef.
It seems so far that the traceability is one of successful ways of obtaining the
confidence of consumers. Gradually, traceability will become an integrated part of every
firm in the USA that supplies food items to the market place. In fact, not only in the US,
but all over the world firms in the food industry will incorporate traceability into their
production systems to meet consumers’ expectations as well as government’s
expectations.
We know from previous chapters that the traceability enables firms to
overcome any costs related with product recall. The detailed and professionally organized
traceability will provide sufficient information to the interested parties to avoid any
disputes arising from the suspected food contaminations. The ability of tracing back all
the way to the very origin of product or product supplements is unique and important for
92the firm to be able to differentiate sufficient suppliers of raw material from insufficient
ones.
Due to different types of foodborne contamination outbreaks, firms are having
a difficult time convincing their customers about the safety of their products. Also, to be
more competitive and capture more market share, exporting like Australia, EU, Japan and
New Zealand are implementing thorough traceability system. Unfortunately, the United
States lags far behind its competitors and gradually having hard times to protect its
competitiveness. Therefore, it has become a crucial issue for the U.S.beef industry’s
outlook.
The study concludes that by differentiation of products, firms will have the
ability to set their own price and make abnormal profit in the short run. In fact, the first
applicant of the traceability will act as a monopoly before any other firm enters into the
differentiated product segment. In the long run, however, due to introduction of
traceability by other firms the supply of the traceable products will increase and price the
first applicant used to charge will decline. Also, the new entrants will draw some of the
customers of the first applicant. Due to these two major reasons, in the long run the firms
providing traceable products will make zero economic profit.
Traceability contributes positively to the economic welfare of consumers in
short run and long run. In addition, the study found that the traceability cost from farm to
fork will range from 4.2 to 10.2 cents per pound; however, the willingness of consumer to
pay extra 4.2 cents per pound of beef is not measured. Therefore, it is strongly suggested
the research focus on those issues is a doctoral level of commitment.
93
BIBLIOGRAPHY
Agricultural Marketing service. 2006. “Country of Origin Labeling, 2002 Farm Bill Provisions.” U.S. Department of Agriculture. http://www.ams.usda.gov/COOL/. Accessed at May 10, 2006.
Animal and Plant Health Inspection Service, U.S. Department of Agriculture. 2006.
www.aphis.usda.gov
Allflex Australia. 2006. www.allflex.com.au Allflex U.S. 2006. www.allflexusa.com Becker, T. 2000. “Consumer Perception of Fresh Meat Quality: A Framework for
Analysis.” British Food Journal, 102(3):158-176. Beef Stocker U.S.A. 2006. www.beefstockerusa.org/rfid Bailey D., J. Robb, and L. Checketts. 2005. “Perspective on Traceability and BSE
Testing in the U.S. Beef Industry.” Choices. Retrieved March 4, 2006 from http://www.choicesmagazine.org/2005-4/grabbag/2005-4-15.htm
Blasi, D.A., K.C. Dhuyvetter, M.F. Spire, M.P. Epp and B.B. Barnhardt. 2003. A Guide
for Electronic Identification of Cattle. Kansas State University, KA. U.S. Buzby, J.C., and P. Frenzen. 1999. “Food Safety and Product Liability.” Food Policy, 24:
637-651. Buzby, J.C., P.D. Frenzen and B.A. Rasco. 2001a. “Product Liability and Microbial
Foodborne Illness.” United States Department of Agriculture, Agricultural Economic Report No. 799. U.S.D.A., Beltsville, MD. p.41.
Buzby, J., P. Frenzen and B.A. Rasco. 2001b. “Product Liability and Food Safety: The
Resolution of Food Poisoning Laws.” In: Interdisciplinary Food Safety Research. N. Hooker and E.A. Murano (eds). CRC Press. Boca Raton, FL. p. 121-137.
Buzby, J.C., P. Frenzen and B.A. Rasco. 2002. “Jury Decisions and Awards in Personal
Injury Lawsuits Involving Food Borne Pathogens. J. Consumer Affairs, 36(2):220-238.
Canadian Cattle Identification Agency (CCIA), Canada. 2006. http://www.canadaid.com
94Clemens, R. 2003a. “Meat Traceability and Consumer Assurance in Japan.” Retrieved
February 2, 2006 from http://www.card.iastate.edu/publications/DBS/PDFFiles/03mbp5.pdf
Clemens, R. 2003b. “Meat Traceability in Japan.” Retrieved February 2, 2006 from
http://www.agmrc.org/NR/rdonlyres/90D9F247-84B7-4E10-9480-0C88153BF6B5/0/meattraceability.pdf
Department of Primary Industries, National Livestock Identification, Australia, 2006.
www.dpi.vic.gov.au Donnelly, D., D. Deines, J. Katz. 2002. “U.S. Premium Beef: Strategic Alliances in
Agribusiness.” Retrieved April 26, 2006 from http://www.business.uiuc.edu/kpmg-uiuccases/cases/uspb/USPBcase.pdf
Economic Research Service, U.S.D.A. 2006. http://www.ers.usda.gov
Food and Livestock Traceability.
www.researchandmarkets.com/feats/download_sample.asp?report_id=304482&file_name=Example%20Pages%20from%20Report&file_ext=pdf. Accessed at March17, 2006
Foreign Agricultural Service U.S. Mission to the European Union. 2006.
http://useu.usmission.gov/agri/petfood.html#Future Requirements: Proposals under Discussion. Accessed at February 10, 2006.
General Food Law. 2004. “Guidance on the Implementation of Articles 11, 12, 16, 17,
18, 19 and 20 of Regulation (EC) No 178/2002.” Retrieved February 2, 2006 from http://ec.europa.eu/food/food/foodlaw/guidance/guidance_rev_7_en.pdf
Golan, E, B. Krissoff, F. Kuchler, l. Calvin, K. Nelson, and G. Price. 2004. “Traceability in the U.S. Food Supply: Economic Theory and Industry Studies.” Retrieved January 25, 2006 from http://www.ers.usda.gov/publications/aer830
hAnluain, D. 2001. “CORK, Ireland – An Irish Company Has Developed a New Process
that Uses DNA Fingerprinting to Keep Track of Cows.” Retrieved June 3, 2006 from www.wired.com/news/medtech/0,1286,48005,00.html
Hobbs, J. E. 2003. “Consumer Demand for Traceability.” Retrieved January 28, 2006
from http://agecon.lib.umn.edu/cgi-bin/pdf_view.pl?paperid=8535&ftype=.pdf Hobbs, J. E. 2004a. “Information Asymmetry and the Role of Traceability Systems.”
Agribusiness, 20(4): 397-415.
95Hobbs, J., E. 2004b. “Traceability in the Canadian Red Meat Sector.” Retrieved April 25,
2006 from http://www.agr.gc.ca/spb/rad-dra/publications/perfreprt/trace_e.pdf Kelepouris, T.A., and K.C.Pramataris. 2005. “An Information Infrastructure for RFID-
Enabled Traceability in the Supply Chain.” Retrieved March 30, 2006 from http://www.eltrun.gr/papers/TraceabilityInfrastructure_WP2005-003.pdf
Lawrence J., D., D. Strohbehn, D. Loy and R. Clause. 2003. “Lessons Learned from the
Canadian Cattle Industry: National Animal Identification and The Mad Clause.” Retrieved March 10, 2006 from http://www.card.iastate.edu/publications/DBS/PDFFiles/03mrp7.pdf
Lawrence, J. D., and R.D. Maritn. 2004. “National Animal Identification: Background
and Basics for Producers.” Retrieved May 6, 2006 from http://www.iowabeefcenter.org/content/USAIP-Background&Basics.pdf
Livestock Marketing Information Center. 2006.
www.ag.ndsu.nodak.edu/aginfo/lsmkt/docs/ac022406.pdf. Accessed at May 19, 2006
Loftus, R. 2005. “Traceability of Biotech-Derived Animals: Application of DNA
Technology.” Revue Scientifique Technique Int. Epizooties, 24(1):231-242. Loftus, R. 2006. Phone interview, IdentiGEN Genetic Testing Service, Duplin, Ireland. Mark, D., R. 2004. “Effect of Animal Identification on Cattle market Structure.”
Retrieved April 1, 2006 from http://ucce.ucdavis.edu/files/filelibrary/1524/24489.pdf
McGrann, J., and H. Wiseman. 2001. “Animal Traceability across National Frontiers in
the European Union.” Revue Scientifique Technique Int. Epizooties, 20(2):406-412.
Meat Livestock Australia (MLA). 2006. www.mla.com.au Meat safety information about Australian Beef and Sheep Meat. 2006.
www.safemeat.com.au National Agricultural Statistics Service, U.S. Department of Agriculture. 2006.
http://www.nass.usda.gov/index.asp National Animal Identification System (NAIS), U.S. Department of Agriculture. 2006
http://animalid.aphis.usda.gov/nais/index.shtml
National Cattlemen’s Beef Association, U.S. 2006. www.beefusa.org
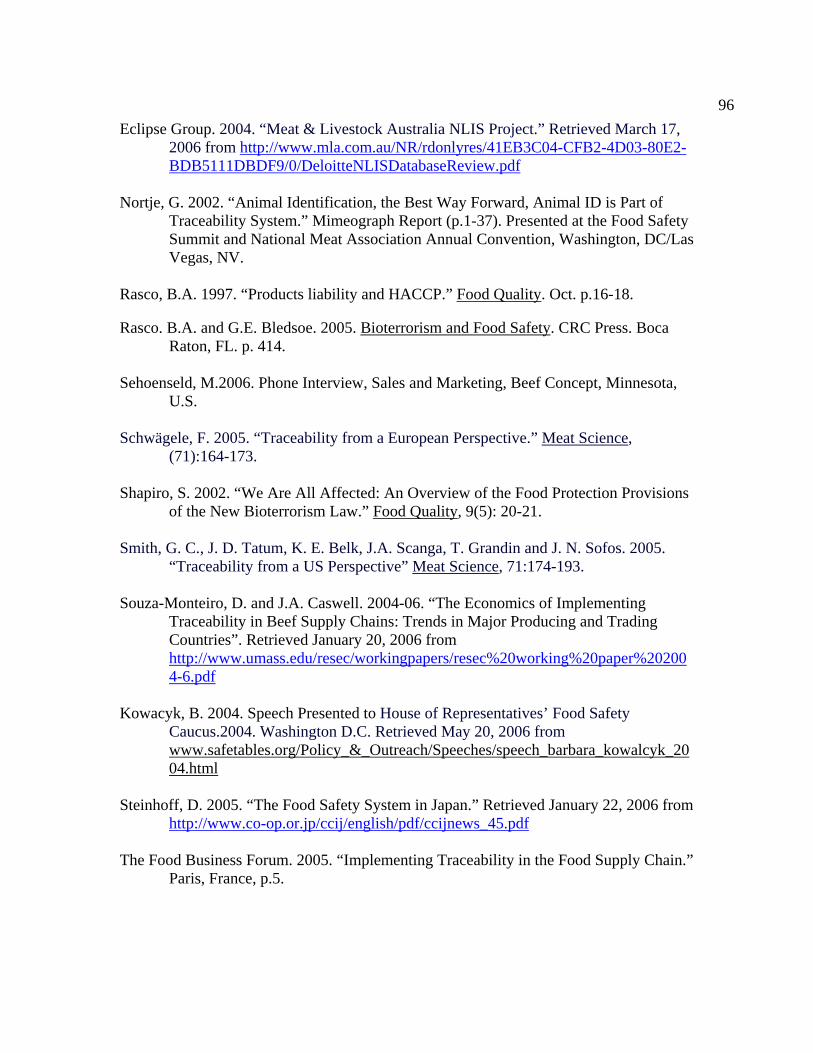
96Eclipse Group. 2004. “Meat & Livestock Australia NLIS Project.” Retrieved March 17,
2006 from http://www.mla.com.au/NR/rdonlyres/41EB3C04-CFB2-4D03-80E2-BDB5111DBDF9/0/DeloitteNLISDatabaseReview.pdf
Nortje, G. 2002. “Animal Identification, the Best Way Forward, Animal ID is Part of
Traceability System.” Mimeograph Report (p.1-37). Presented at the Food Safety Summit and National Meat Association Annual Convention, Washington, DC/Las Vegas, NV.
Rasco, B.A. 1997. “Products liability and HACCP.” Food Quality. Oct. p.16-18. Rasco. B.A. and G.E. Bledsoe. 2005. Bioterrorism and Food Safety. CRC Press. Boca
Raton, FL. p. 414.
Sehoenseld, M.2006. Phone Interview, Sales and Marketing, Beef Concept, Minnesota, U.S.
Schwägele, F. 2005. “Traceability from a European Perspective.” Meat Science,
(71):164-173. Shapiro, S. 2002. “We Are All Affected: An Overview of the Food Protection Provisions
of the New Bioterrorism Law.” Food Quality, 9(5): 20-21.
Smith, G. C., J. D. Tatum, K. E. Belk, J.A. Scanga, T. Grandin and J. N. Sofos. 2005. “Traceability from a US Perspective” Meat Science, 71:174-193.
Souza-Monteiro, D. and J.A. Caswell. 2004-06. “The Economics of Implementing Traceability in Beef Supply Chains: Trends in Major Producing and Trading Countries”. Retrieved January 20, 2006 from http://www.umass.edu/resec/workingpapers/resec%20working%20paper%202004-6.pdf
Kowacyk, B. 2004. Speech Presented to House of Representatives’ Food Safety
Caucus.2004. Washington D.C. Retrieved May 20, 2006 from www.safetables.org/Policy_&_Outreach/Speeches/speech_barbara_kowalcyk_2004.html
Steinhoff, D. 2005. “The Food Safety System in Japan.” Retrieved January 22, 2006 from
http://www.co-op.or.jp/ccij/english/pdf/ccijnews_45.pdf The Food Business Forum. 2005. “Implementing Traceability in the Food Supply Chain.”
Paris, France, p.5.
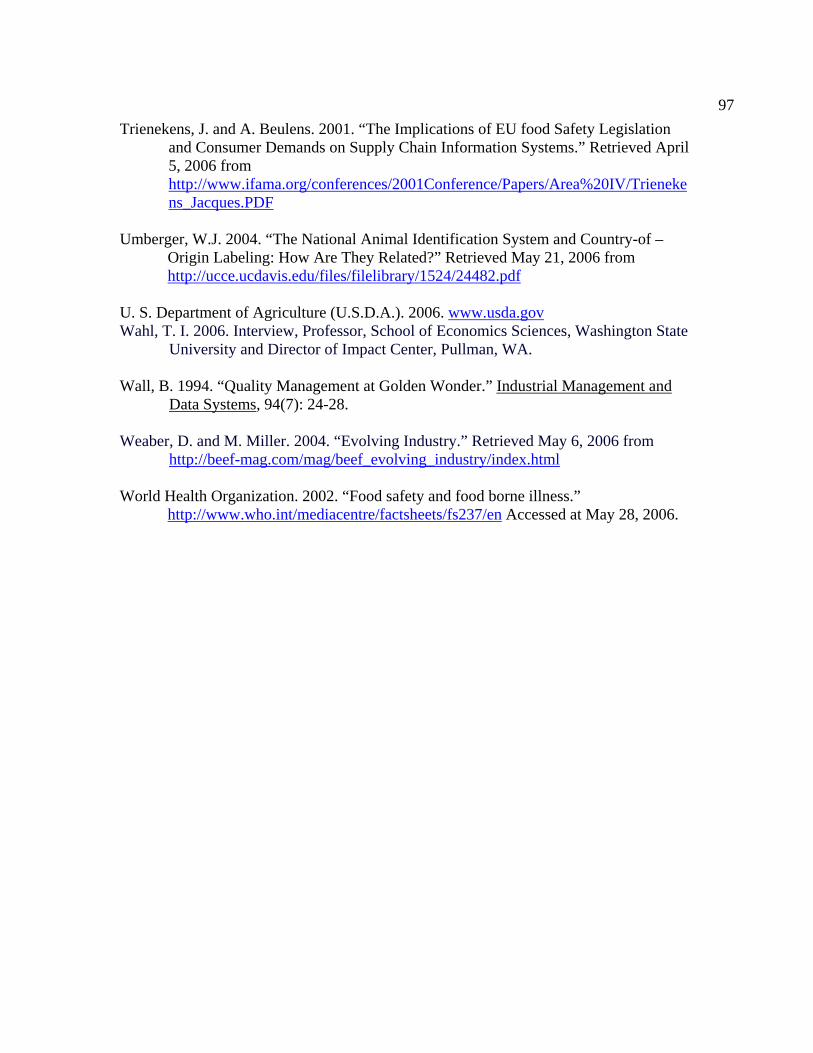
97Trienekens, J. and A. Beulens. 2001. “The Implications of EU food Safety Legislation
and Consumer Demands on Supply Chain Information Systems.” Retrieved April 5, 2006 from http://www.ifama.org/conferences/2001Conference/Papers/Area%20IV/Trienekens_Jacques.PDF
Umberger, W.J. 2004. “The National Animal Identification System and Country-of –
Origin Labeling: How Are They Related?” Retrieved May 21, 2006 from http://ucce.ucdavis.edu/files/filelibrary/1524/24482.pdf
U. S. Department of Agriculture (U.S.D.A.). 2006. www.usda.gov Wahl, T. I. 2006. Interview, Professor, School of Economics Sciences, Washington State
University and Director of Impact Center, Pullman, WA. Wall, B. 1994. “Quality Management at Golden Wonder.” Industrial Management and
Data Systems, 94(7): 24-28. Weaber, D. and M. Miller. 2004. “Evolving Industry.” Retrieved May 6, 2006 from
http://beef-mag.com/mag/beef_evolving_industry/index.html World Health Organization. 2002. “Food safety and food borne illness.”
http://www.who.int/mediacentre/factsheets/fs237/en Accessed at May 28, 2006.

98
APPENDIX A
FIGURES
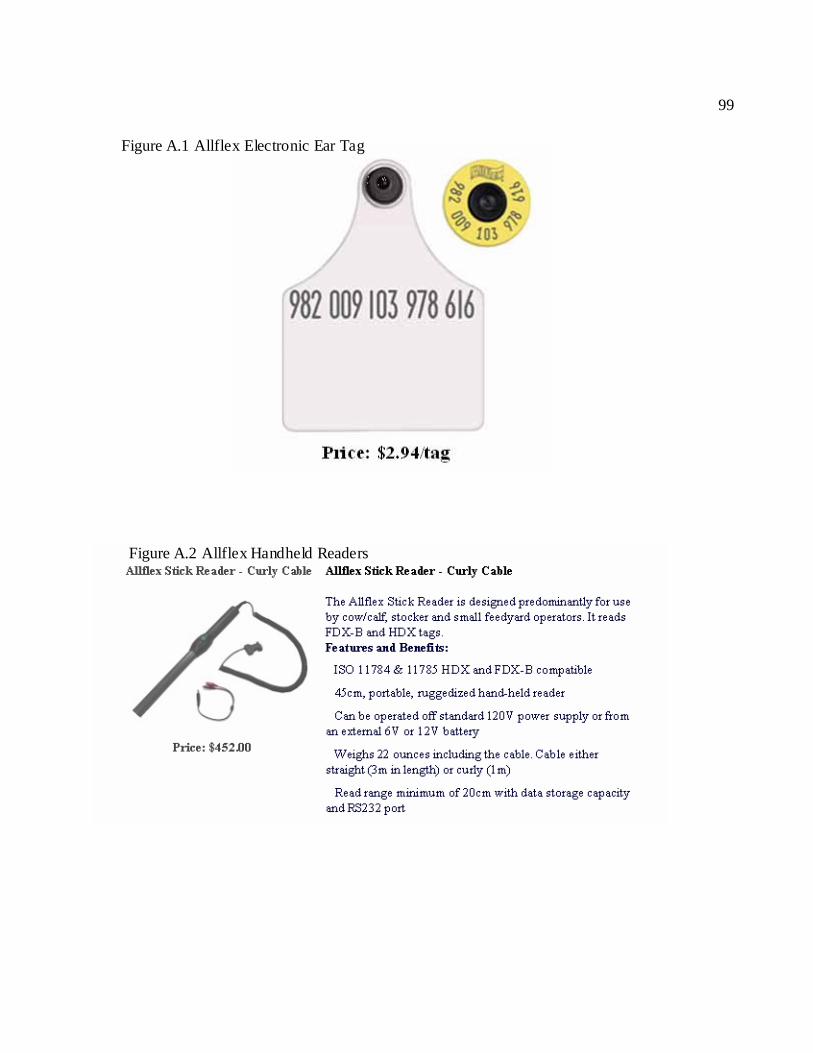
99
Figure A.2 Allflex Handheld Readers
Figure A.1 Allflex Electronic Ear Tag
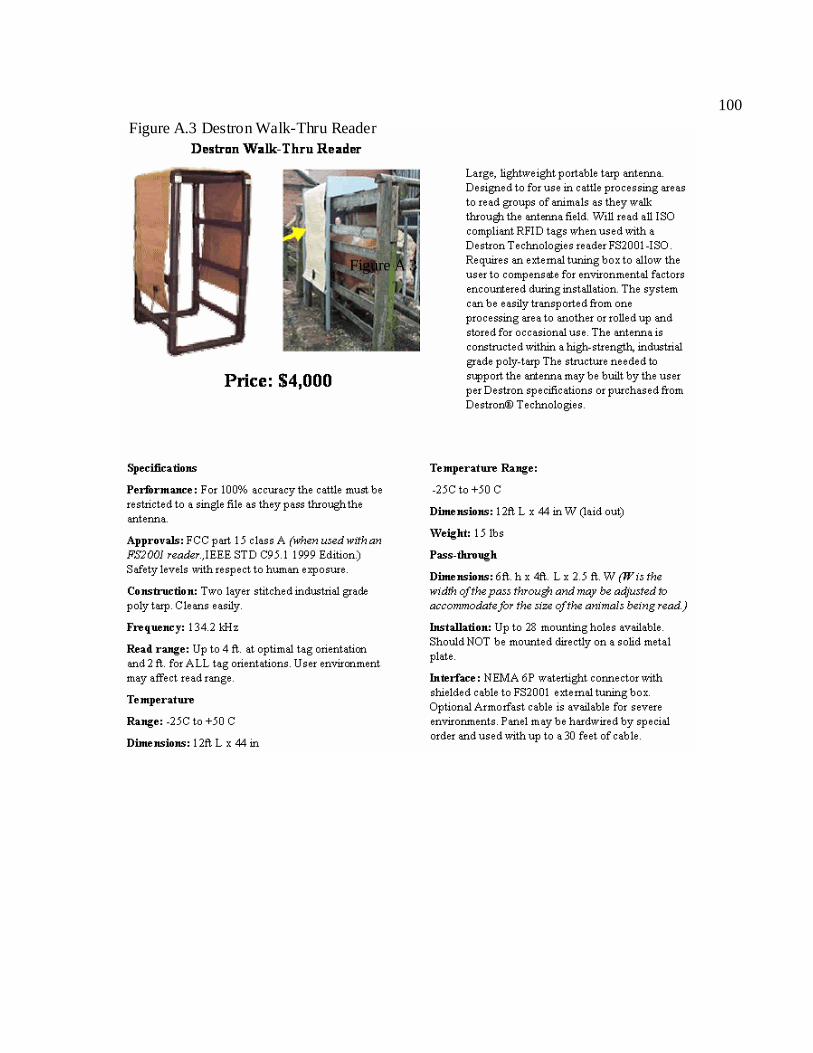
100
Figure A 3
Figure A.3 Destron Walk-Thru Reader