Embed Size (px)
Citation preview

TRACING COMBINED SEWAGE OVERFLOW DISCHARGE WITH QUATERNARY AMMONIUM COMPOUNDS
A Final Report of the Tibor T. Polgar Fellowship Program
Patrick C. Fitzgerald
Polgar Fellow
School of Marine and Atmospheric Sciences Stony Brook University Stony Brook, NY 11794
Project Adviser:
Bruce J. Brownawell School of Marine and Atmospheric Sciences
Stony Brook University Stony Brook, NY 11794
Fitzgerald, P.C. and B.J. Brownawell. 2012. Tracing Combined Sewage Overflow Plumes with Quaternary Ammonium Compounds. Section II: 1-31 pp. In D.J. Yozzo, S.H. Fernald, and H. Andreyko (eds.), Final Reports of the Tibor T. Polgar Fellowship Program, 2011. Hudson River Foundation.
II-1

ABSTRACT
Quaternary ammonium compounds are a novel class of chemical tracers for
sewage-derived contaminants. In this study, it is hypothesized that these tracers make it
possible to distinguish between treated and untreated sewage sources in estuarine surface
waters. Sites around the Lower Hudson Basin were sampled from May 2011 through
October 2011, with particular emphasis on the East River, Newtown Creek, and Gowanus
Canal. Corresponding measurements of fecal indicator bacteria were made by another
research group at these sites. Limited sampling was also conducted in the Hudson River
along the Manhattan shoreline and at Piermont at the municipal sewage outfall. Samples
were also collected during the raw sewage discharge that resulted from a failure in the
North River Wastewater Treatment Plant in July. Samples were analyzed using high
performance liquid chromatography with a time-of-flight mass spectrometer. Most
samples were analyzed for particulate phase tracers only.
The first successful measurements of quaternary ammonium compounds (QACs)
were made in estuarine surface waters of the U.S. The composition of these sewage-
specific tracers was found to vary with the amount of rainfall on the previous day, more
closely representing that of untreated sewage after large rainfalls. This finding lends
credence to the idea that combined sewage overflow is one of the largest sources of
contaminants to the water column in New York’s industrial canals. The total
concentration of QACs also exhibited a weak correlation with the abundance of fecal
indicator bacteria. A pronounced compositional change was also observed during the
North River Plant’s failure. Although the ability to discriminate between treated and
untreated sewage sources was not as great as expected, further specificity may be
possible by measuring tracers in the dissolved phase.
II-2

TABLE OF CONTENTS
Abstract……………………………………………….………………………… II-2
Table of Contents……………………………………………………………….. II-3
Lists of Figures and Tables……………………………………………………… II-4
Introduction……………………………………………………………………… II-5
Methods………………………………………………………………………….. II-13
Sampling Sites…………………………………………………………… II-13
Procedure…………………………………………………………………. II-16
Results……………………………………………………………………………. II-17
Discussion………………………………………………………………………… II-25
Acknowledgments………………………………………………………………... II-29
Literature Cited…………………………………………………………………… II-30
II-3

LISTS OF FIGURES AND TABLES
List of Figures
Figure 1. Three environmentally significant series of QACs……………… II-9
Figure 2. Maps of sampling locations……………………………………… II-15
Figure 3. Ranges of QAC concentrations at four sites…………………….. II-20
Figure 4. Ranges of QAC compositions at four sites………………………. II-21
Figure 5. Relationship between prior day rainfall and QAC composition… II-21
Figure 6. Relationship between behentrimonium and FIB concentrations… II-22
Figure 7. Relationship between FIB concentrations and prior day rainfall…. II-22
Figure 8. August QAC concentrations at Piermont……………………….... II-23
Figure 9. Particulate vs. dissolved partitioning at Piermont……………….. II-23
Figure 10. Changing conditions with distance from raw sewage discharge… II-24
Figure 11. Comparison of Compositions Across 10 kinds of sample………. II-27
List of Tables
Table 1. Grouping of analytes into more labile and less labile fractions….… II-10
Table 2. Sampling sites and dates………………………………………..….. II-16
Table 3. Summary of project data collection………………….……………. II-19
II-4

INTRODUCTION
Water quality in the Lower Hudson Basin has improved significantly over the last
few decades, thanks in part to investments in improved waste water treatment, such as the
1986 construction of the North River treatment plant in Manhattan. This improvement
has led to a renewed interest in recreational use of the river for activities such as
swimming and fishing. However, the Hudson still receives a tremendous amount of
sewage (not all of which is well-treated) and water quality issues persist. Combined
sewage overflow (CSO) systems, which integrate stormwater and wastewater, may cause
waste water treatment plants (WWTPs) to become overloaded during a precipitation
event, and force them to discharge poorly-treated sewage into the Hudson. These
systems are a significant source of pathogens, chemical contaminants, nutrients, and
debris to the estuary. It is also possible that the spread of untreated sewage in the
environment could promote the spread of antibiotic resistance (McLellan et al. 2007).
Sewage-derived pathogens are among the most serious threats to swimmers and shellfish
consumers (Donovan et al. 2008), and vary spatially and temporally in abundance
(NYCDEP 2010). The inconsistent presence of harmful microorganisms presents a
challenge to estuary managers seeking to issue safety advisories to the public. Although
CSOs are an important source of pathogens, these organisms also enter the water column
from other sources as well, and the relative contributions of these sources are poorly
understood (Simpson et al. 2010). Currently employed water quality analyses in the
Hudson do not impart a high degree of source-specificity, making it difficult to accurately
assess the environmental impact of New York’s aging CSO system. In this study, a novel
class of sewage-derived chemical tracers is explored: quaternary ammonium compounds
II-5

(QACs). These information-rich tracers have the potential to assess contamination
sources with high specificity.
The metric currently used to estimate the threat posed by pathogens in surface
waters is the abundance of fecal indicator bacteria (FIB). These organisms are not
necessarily pathogenic, but their abundance is thought to correlate with that of more
harmful sewage-derived pathogens (Wheeler et al. 2002). In the Lower Hudson Basin
and other estuaries, Enterococcus is the primary FIB, as it is ubiquitous in the guts of
endothermic organisms and can survive some time in salt water (Freis et al. 2008).
Enterococcus measurements are appealing because they can be done easily and cheaply
(after an initial investment in equipment). However, this technique does not provide
information regarding pathogen sources. More sophisticated molecular biological
techniques have been tested and are still developing (Simpson et al. 2010; Stoeckel and
Harwood 2007) to identify FIB by their original host organisms (humans, ducks, etc.).
While potentially powerful, the accuracy of molecular source-tracking is hindered by the
ever-fluctuating compositions of the gut flora found in animals, and because the
population of enteric bacteria in an animal’s digestive tract varies as a function of the
host’s health and diet (Simpson et al. 2010). Furthermore, identification of a host
organism is only one part of source trackdown, because pathogens from a single species
of host (notably humans) can still be introduced into the water column by a variety of
mechanisms.
Reduction of pathogen loading into the estuary is dependent on understanding
how pathogens enter the water column. CSO discharge is one of the most prominent
loading mechanisms, but high FIB abundances can still be measured at times during dry
II-6

spells or in areas of the Hudson Basin which are not proximate to a CSO outfall. Several
FIB sources have been identified, including:
• Undertreated sewage: This can be introduced to receiving waters through CSO
discharge, or as a result of mechanical failures in the wastewater treatment
process. Significant discharges of untreated sewage entered the Hudson as a
result of the fire at the North River WWTP in July 2011, and again in August
2011 when a waste pipe was damaged in Ossining, NY. Furthermore, illicit
discharges of wastewater can feed into storm drains, entering receiving waters
directly.
• Treated sewage: Although disinfection of wastewater removes most pathogenic
organisms, it is not always 100% effective. Particles can shelter some
microorganisms from disinfection, while organisms such as Giardia are resistant
to chlorination (Jarrol et al. 1981).
• Resuspended Sediments: Certain sewage-derived pathogens can persist in the
sediment for significant periods of time after settling out of the water column.
Resuspension of sediments by storms or ship wakes can then mix pathogens back
into the water column (Jeng et al. 2005) independent of CSO discharge.
• Surface runoff: Surfaces can be contaminated with bacteria from animal feces,
including pets, livestock, rodents, birds, and others. During rain events, this
contamination can be washed into storm drains, directly into estuaries (e.g.,
through streams), or into CSO systems—particularly on impervious surfaces in
urban areas with no riparian buffer zone.
II-7

• Groundwater: Leaking septic tanks and aging sewer lines can contaminate
groundwater with fecal organisms. Under the right conditions, pathogens can be
carried into the estuary by the flow of groundwater (Hagerdorn and Weisberg
2009).
Given the multiplicity of sources, it can be difficult to attribute high FIB abundances
in surface waters specifically to CSO. Chemical analyses which rely on the concentration
or presence/absence of a single tracer can be further confounded by the large amount of
dilution experienced by contaminants when sewage enters receiving waters. Tracers have
included compounds such as caffeine, silver ions, nitrogen isotopes, fluorescent
whitening agents (FWAs), pharmaceuticals, and others (Haack et al. 2009; Hagerdorn
and Weisberg 2009; Simpson et al. 2010). Although these tracers can provide useful
information about the extent of anthropogenic contamination in a waterway, they are
often limited by factors including natural background concentrations, or dilution to
concentrations below detection limits. Furthermore, as individual compounds, their
presence alone cannot distinguish between treated and untreated sewage. A valuable
analysis to complement existing tracers and generate more layers of information involves
the use of quaternary ammonium compounds (QACs), which possess unique properties as
tracers (Li and Brownawell 2009; Li and Brownawell 2010) but are to-date understudied
in surface waters.
QACs are a class of permanently charged organic cations, commonly used as
disinfectants, surfactants, and anti-static agents in a variety of personal care products,
cleaning products, and industrial processes. They all consist of one nitrogen atom with a
positive charge, bonded to four hydrocarbon groups. With large, hydrophobic carbon
II-8

chains and a positive charge, QACs are highly particle-reactive in estuarine water, a
property that increases in QACs with higher molecular weights. Due to widespread use,
QACs are ubiquitous in sewage and abundant in sewage-impacted waters. Many of these
compounds are not thoroughly degraded by microbial action in waste water treatment
(particularly the largest, least bioavailable compounds). It has recently been shown that
QACs are in many cases the most abundant organic contaminants measured in estuarine
sediments around New York Harbor (Li and Brownawell 2009; Li and Brownawell 2010;
Li 2009; Lara-Martin et al. 2010), and other sewage impacted estuaries including Long
Island Sound and Hempstead Harbor (unpublished) because of high loading rates and
significant persistence. Three homologous series of QACs have been identified as
environmental contaminants, including alkyltrimethyl ammonium chlorides (ATMAC),
benzalkonium chlorides (BAC), and dialkyldimethylammonium chlorides (DADMAC)
(Figure 1).
Figure 1. Three environmentally significant series of QACs: ATMAC, BAC, and DADMAC.
II-9

The large number of QACs which can be found in the Hudson River Estuary
contributes to their potential as a set of highly source-specific tracers. Because they vary
greatly in size, these compounds span a range of solubilities and bioavailabilities, and
thus exhibit different behavior in waste water treatment and the environment. The more
labile QACs (such as BACs, many of which can be used as algaecides at high
concentration) are efficiently metabolized by heterotrophic bacteria, particularly in the
sewage-acclimated microbial communities of WWTPs, and to some extent in waste-
receiving waters. There is a continuum of degradation in wastewater treatment plants as
a function of the alkyl chain length of QACs (Clara et al. 2007), with longer chain length
DADMACs (Figure 1) found to be essentially inert, and recent findings suggest that
many QACs are well-preserved once associated with estuarine sediments (Li and
Brownawell 2010; Lara-Martin et al. 2010). Thus, in poorly treated sewage, the fraction
of total QACs from the more labile group is higher, and in treated sewage, the labile
fraction is markedly diminished. This has been observed in sediments proximate to CSO
discharges (Li and Brownawell 2010), and it was proposed here that such distinctions can
be used to discriminate between treated and untreated sewage sources to receiving waters
by measuring the environmental concentrations of the compounds, and dividing the
aggregate concentration of “labile” compounds by the total QAC concentration. The
compounds are grouped as follows:
More labile QACs Less labile QACs ATMAC 16 BAC 16 ATMAC 18 DADMAC 16:16 BAC 12 DADMAC 8:10 BAC 18 DADMAC 16:18 BAC 14 DADMAC 10:10 DADMAC 14:14 DADMAC 18:18
DADMAC 14:16
Table 1. Grouping of analytes into more labile and less labile fractions.
II-10

This list does not include all analytes measured in the present study, in order to allow
direct comparison with harbor-wide sediment data reported by Li and Brownawell
(2010). Several compounds were added to the list of analytes since sediment data were
collected. Notably, ATMAC 22 (a common additive in personal care products,
commonly known as behentrimonium chloride) has since been discovered as one of the
most persistent QACs in New York Harbor (Lara-Martin et al. 2010). Another new
analyte, ATMAC 12, is much more soluble, is detected at high levels in the influent of
local WWTPs (unpublished data) and was anticipated to be present at much higher levels
in untreated sewage compared to biologically treated effluents from WWTPs.
A second piece of information lies in the partitioning of QACs between the
particulate and aqueous phases. In receiving waters, sewage becomes highly diluted, and
this dilution causes a portion of the QACs sorbed to particles to dissociate and enter the
aqueous phase. In the aqueous phase, they are more vulnerable to biodegradation and so
are less persistent. Accordingly, surface water which has received recent sewage
discharge (treated or otherwise) should contain a higher dissolved fraction of the more
soluble (“labile”) QACs, relative to water which has not experienced sewage discharge
for a period of several days. This difference should be observable in the environment by
filtering water samples and analyzing the particles and filtrate separately. Furthermore,
resuspended sediment should have a QAC pattern similar to that of “old” sewage
discharge, because the sediment in heavily sewage-impacted areas acquires most of its
QAC content from past discharge as it settles to the bottom.
Other sources of estuarine pathogens are not significant sources of QACs. As
very particle-reactive cations, QACs do not travel though the water table, as in some
II-11
cases pathogens and some nutrients can. For tracking groundwater contamination,
soluble tracers such as stable pharmaceuticals (e.g., carbamezapine and
sulfamethoxazole), FWAs and potentially caffeine may be useful tools if dilution is not
too great, as they can travel through groundwater (Swartz et al. 2006; Hagerdorn and
Weisberg 2009). However, the absence of QACs is itself a form of information. In rural
estuaries where groundwater is a suspected source of pathogens, it would be strong
evidence to find the presence of caffeine coupled with low levels of QACs, indicating
that pathogens assigned a human source are coming from the water table and not from
treatment plants. In the event that pathogens from animal feces are washed into the river
by runoff, again no QACs are expected to come from this pathway. Terrestrial surfaces
should not contain significant amounts of these compounds. Thus, while this study in the
highly sewage-impacted urban portion of the lower Hudson is most useful for
distinguishing between treated and poorly-treated sewage sources, QACs have potential
applications for additional source-specificity distinction between many possible pathogen
sources.
II-12

METHODS
Sampling sites
The majority of sampling was conducted by ship in collaboration with John Lipscomb
of Riverkeeper. These samples were taken in parallel with the FIB monitoring project
operated by Dr. Gregory O’Mullan of Queens College and Dr. Andrew Juhl of Lamont-
Doherty Earth Observatory. Shipside monitoring stations included:
• The East River (ER): This station was mid-channel near the mouth of Newtown
Creek. A tremendous amount of treated sewage is discharged into the East River
on a regular basis. Although it is very fast-flowing, the tidal reversal acts to
increase the residence time of contaminants in this section of the river.
• Newtown Creek—Dutchkills (DK): Once a natural creek, Newtown has long
served as an industrial canal. It receives CSO discharge and is also contaminated
with oil and other industrial contaminants, and is now a federal superfund site.
This station is at the intersection of Newtown and one of its tributaries, the
Dutchkills, not far from the mouth of the creek.
• Newtown Creek—Metropolitan Avenue Bridge (MB): This station is far in the
back of the canal, and thus is somewhat isolated from the East River, with
exchange of water between the two bodies occurring primarily as the result of
tidal mixing.
• Gowanus Canal (GC): This superfund site in Brooklyn is one of the most polluted
waterways in the country. In addition to CSO discharge, the canal is
contaminated by creosote and other industrially-derived pollutants. The sampling
station here is a short distance inland from the mouth of the canal.
II-13

• North River Plant (NR): This plant treats much of the sewage of upper Manhattan
and discharges it into the Hudson near 125th St. Sampling was conducted both at
the sewage outfall and at the nearby recreational pier.
• Dyckman St. Beach (DB): A small recreational pier is located on the Hudson at
the far north of Harlem. There is a CSO outfall pipe nearby.
• Piermont (PM): This site is north of New York City at a recreational pier in the
town of Piermont. A local WWTP discharges close to the pier; a limited number
of samples were collected at the outfall and just off the pier.
In addition to shipboard sampling, samples were taken from land in response to the
fire which disabled the North River Plant for three days in July 2011. Hundreds of
millions of gallons of undertreated sewage were redirected to a series of CSO outfalls
around Manhattan. Samples were taken near two of those outfalls on July 22nd, near the
end of the event. At 125th St., an outfall just south of the recreational pier was cordoned
off with a boom. Samples were taken from inside the boom as well as from the pier at
two distances away from the CSO. While sampling at these sites, the ebb tide was
observed to slacken to where the flow from the CSO towards the pier was very weak. At
Dyckman St. Beach, samples were taken from the pier proximate to the outfall, which
was also boomed off (Table 2).
II-14

(a) (b)
(c)
Figure 2. Maps of sampling locations: (a) Brooklyn sites including East River, Newtown-Dutchkills, Newtown-Metropolitan Ave. Bridge, and Gowanus Canal; (b) Stations along the Hudson River including North River Plant, Dyckman St. Beach, and Piermont; (c) Sites around North River Plant including WWTP outfall, CSO outfall, and two piers, 44m and 111m away from the CSO outfall, respectively.
II-15

Date Sites Prior Rainfall (inches) 24 hours 48 hours 72 hours
May 16th ER, DK, MB, GC 1.1 1.1 1.1 June 27th ER, DK, MB, GC, NR, PM 0 0 0 July 19th ER, DK, MB, GC 0.1 0.1 0.1 July 22nd NR, DB 0 0 0 August 16th ER, DK, MB, GC, NR, DB, PM 0.6 6.4 6.4 October 21st ER, DK, MB, GC 0 1.1 1.1 Table 2. Sampling sites and dates. Rainfall is given as a cumulative total over
three different intervals. Procedure
The analysis for surface water samples is based on the sediment analysis designed
by Li and Brownawell (2009), and further modified to include behentrimonium by Lara-
Martin et al. (2010). Surface water samples were collected in methanol-rinsed 1-L glass
bottles and fixed on-site as 1% formalin solutions to prevent further biodegradation of
analytes. In the laboratory, samples were filtered through pre-combusted Whatman GF/C
glass fiber filters under vacuum pressure to separate the particulate and dissolved phases.
Filters were then placed in vials and immersed in 10 ml of 10% HCl in methanol. To
extract analytes from the particulate phase, the filters were next sonicated at 60°C for one
hour in a water bath. After sonication, filters were centrifuged for 15 min at 2500 RPM,
and the solvent was decanted into a larger collection vial. This extraction process was
repeated two more times, and all three extracts were combined in the collection vial.
Extracts were evaporated to dryness with nitrogen gas and a 60°C water bath. For
purification, dry extracts were then resuspended in 2.5 ml of methanol and loaded onto a
weak anion-exchange resin (AG-1-X2 from BioRad). The analytes were then eluted using
12.5 ml of methanol.
II-16

Dissolved phase analytes were isolated from filtrate in select samples by solid
phase extraction, utilizing a method that is still under development, modified from the
procedure by Ferrer and Furlong (2001). Filtrate samples were converted to 25%
acetonitrile solutions and run through a Waters brand Oasis HLB cartridge under vacuum
pressure. Analytes were then eluted off the cartridge using 15 ml of 100% acetonitrile.
Both dissolved-phase and particulate extracts were analyzed with high performance
liquid chromatography using a time-of-flight mass spectrometer (HPLC-ToF-MS)
according to the procedure outlined by Li and Brownawell (2009; Li and Brownawell
2010).
RESULTS
QACs were successfully measured in surface water samples at all stations in the
Lower Hudson Basin (Table 3), although not all of the 19 targeted QACs were detected
in all samples. Samples exhibited a range of concentrations with a high of 31,200 ng/L,
and a low of 112 ng/L, both seen at Gowanus Canal (Figure 3), with a median of 652
ng/L. The composition of QACs ranged from 0% labile compounds to 52%, with a
median of 19% labile QACs by mass (Figure 4). Across all Brooklyn stations (ER, DK,
MB, GC), the labile fraction of QACs was found to have a positive relationship with the
amount of rainfall on the prior day, as measured at Central Park (Figure 5). Rainfall two
days prior to sampling was not found to have a significant relationship with the QAC
composition. Behentrimonium was among the most abundant QACs in all samples.
Behentrimonium concentration was found to have a weak positive relationship with the
abundance of Enterococcus (Figure 6). The relationship between behentrimonium and
Enterococcus had a higher correlation than the relationship between prior day rainfall and
II-17

Enterococcus (Figure 7). At the East River station, the total concentration of QACs was
less variable than in the industrial canals (Figure 3), as was the composition (Figure 4).
II-18

East
Riv
er
5/16
5.08
4.64
20%
1.1
1.1
1.1
669
160
2.83
0.02
41.7
6/27
1.61
3.80
7%
0 0 0 315
24
2.50
0.05
6.3
7/19
1.61
3.30
9%
0.1
0.1
0.1
230 5
2.36
0.18
1.3
8/16
4.58
4.22
14%
0.6
6.4
6.4
373
18
2.57
0.08
4.7
10/2
1
3.71
4.43
0%
0 1.1
1.1
1051
14
3.02
0.29
3.7
New
tow
n Du
tchk
ills
5/16
5.78
7.54
41%
1.1
1.1
1.1
1886
197
3.28
0.04
51.4
6/27
1.61
3.06
9%
0 0 0 185
11
2.27
0.06
2.9
7/19
2.30
3.22
7%
0.1
0.1
0.1
503 8
2.70
0.24
2.1
8/16
7.73
5.82
19%
0.6
6.4
6.4
906 8
2.96
0.43
2.1
10/2
1
7.89
5.35
10%
0 1.1
1.1
669 9 2.8
0.3
2.3
New
tow
n M
etro
Brid
ge
5/16
6.97
4.87
43%
1.1
1.1
1.1
554
97
2.7
0.0
25.3
6/27
1.61
2.59
6%
0 0 0 120
43
2.1
0.0
11.2
8/16
6.42
6.24
40%
0.6
6.4
6.4
1335
9 3.1
0.6
2.3
10/2
1
7.74
3.75
0%
0 1.1
1.1
121 3 2.1
0.2
0.8
Gow
anus
Can
al
5/16
10.0
9
8.95
48%
1.1
1.1
1.1
3119
6
121
4.5
1.0
31.6
6/27
1.61
2.51
15%
0 0 0 112
28
2.1
0.0
7.3
7/19
6.95
4.14
12%
0.1
0.1
0.1
1398
18
3.1
0.3
4.7
8/16
7.86
5.04
10%
0.6
6.4
6.4
1525
22
3.2
0.3
5.7
10/2
1
4.56
6.80
8%
0 1.1
1.1
2501
9 3.4
1.1
2.3
Pier
mon
t
6/27
4.40
26%
0 0 0 477 2.7
8/16
8.65
40%
0.6
6.4
6.4
1941
2
4.3
Site
Date
Ln(e
nter
o)
Ln(b
ehen
trim
oniu
m)
% d
isinf
ecta
nts
24 h
our r
ainf
all (
in)
48 h
our r
ainf
all (
in)
72 h
our r
ainf
all (
in)
Tota
l QA
Cs (
ng/L
)
Turb
idity
log[
tota
l QA
Cs]
(ng/
L)
Tota
l QA
Cs (
µg/g
)
TSS
(mg/
L)
Table 3. Summary of project data collection. Enterococcus measurements below the detection limit of 10 cells/100 ml are reported as half the detection limit.
II-19
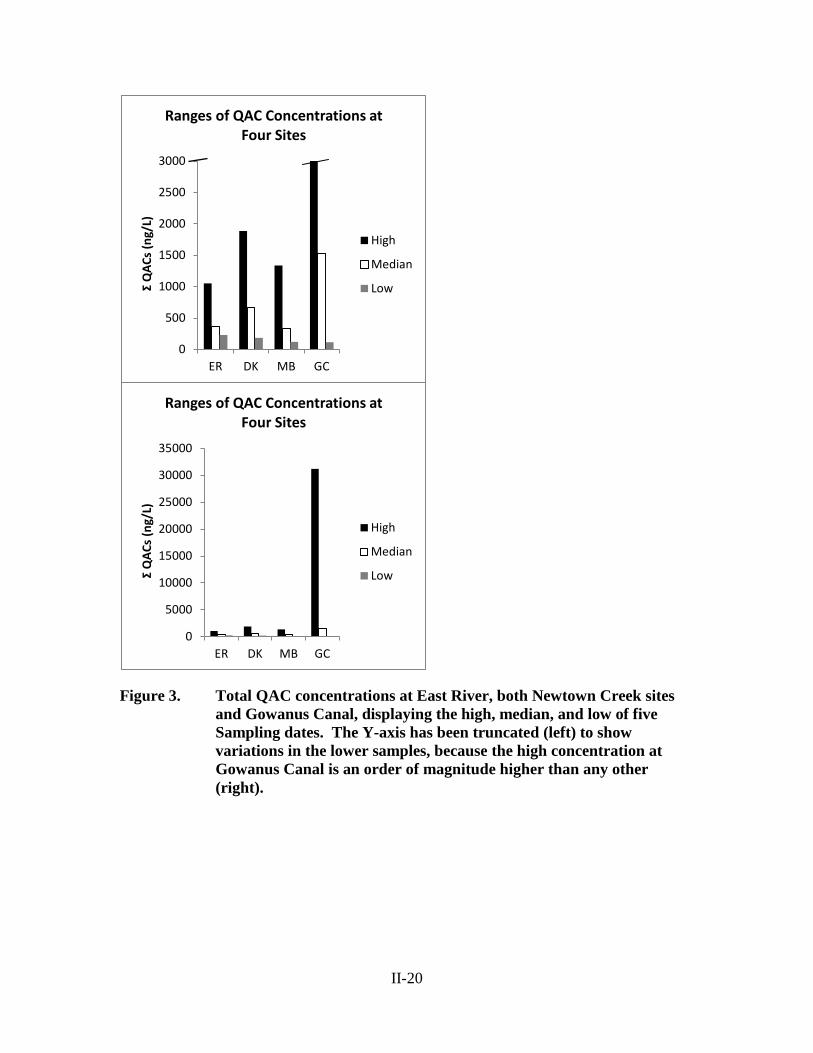
Figure 3. Total QAC concentrations at East River, both Newtown Creek sites and Gowanus Canal, displaying the high, median, and low of five Sampling dates. The Y-axis has been truncated (left) to show variations in the lower samples, because the high concentration at Gowanus Canal is an order of magnitude higher than any other
(right).
0
500
1000
1500
2000
2500
3000
ER DK MB GC
Ʃ Q
ACs
(ng/
L)
Ranges of QAC Concentrations at Four Sites
High
Median
Low
0
5000
10000
15000
20000
25000
30000
35000
ER DK MB GC
Ʃ Q
ACs
(ng/
L)
Ranges of QAC Concentrations at Four Sites
High
Median
Low
II-20

Figure 4. Labile fraction of QACs as a function of recent rainfall at East River, both Newtown Creek sites and Gowanus Canal, displaying the high, median, and low of five sampling dates.
Figure 5. Relationship between labile fraction of QACs and prior-day rainfall in the East River, both Newtown Creek Stations, and Gowanus Canal. Comparisons of mean values were determined for four of the dates where n=4 using a standard t-test conducted in Excel; the mean of the labile fraction percentage from the high-rain data set from May differs significantly from the low rain sets in June (P=0.0067) and October (P=0.0038); a higher mean for the labile fraction in May than that observed in August (0.6 inches of rain) was close to being
significant (P = 0.058).
0%
10%
20%
30%
40%
50%
60%
ER DK MB GC
Labi
le F
ract
ion
Ranges of QAC Compositions at Four Sites
High
Median
Low
y = 0.2738x + 0.0654 R² = 0.6986
0%
10%
20%
30%
40%
50%
60%
0 0.2 0.4 0.6 0.8 1 1.2
Labi
le F
ract
ion
Prior day Rainfall (inches)
Relationship Between Prior Day Rainfall and QAC Composition
II-21

Figure 6. Natural logarithm relationship between concentrations of behentrimonium and Enterococcus. Includes East River, both Newtown Creek sites, and Gowanus Canal.
Figure 7. Logarithmic relationship between the abundance of Enterococcus and prior day rainfall, at the East River, both Newtown sites, and
Gowanus Canal.
Dissolved phase QACs were successfully detected in some samples, including the
August Piermont (Figures 8, 9), August Gowanus Canal, and the sample taken at the
y = 0.4468x + 2.4993 R² = 0.5054
2
3
4
5
6
7
8
9
10
0 2 4 6 8 10 12
Ln [b
ehen
trim
oniu
m] (
ng/L
)
Ln [Enterococcus] (cells/ 100 ml)
Relationship Between Behentrimonium and FIB Concentrations
y = 3.2762x + 3.8142 R² = 0.2917
0.00
2.00
4.00
6.00
8.00
10.00
12.00
0 0.2 0.4 0.6 0.8 1 1.2
Ln(E
nter
ococ
cus)
cel
ls/1
00m
l
Prior day rainfall (inches)
Relationship Between FIB Concentrations and Prior Day Rainfall
II-22

125th St. CSO outfall during the North River accident. Preliminary data indicates that the
dissolved phase detections were poor in all samples taken during October. At Piermont,
the smallest QAC, ATMAC 12, is entirely found in the dissolved phase, while the larger
DADMACs are associated primarily with the particulate phase (<12% dissolved). Such
results could explain why the labile fractions determined in CSO affected waters were
lower than expected.
Figure 8. Concentrations of nineteen different QACs in a sample taken at Piermont. Measurements in the particulate and dissolved phases for each analyte are shown adjacent to each other.
Figure 9. Partitioning of nineteen different QACs between the dissolved and particulate phases in a water sample taken at Piermont.
0100020003000400050006000
Conc
entr
atio
n (n
g/L)
August QAC Concentrations at Piermont
Particulate
Dissolved
0%20%40%60%80%
100%
% o
f tot
al
Particulate vs. Dissolved Partitioning at Piermont (8/16/2011)
% Dissolved
% Particulate
II-23

Results from sampling conducted at approximately 125th St. during the North
River accident are illustrated in Figure 10. The concentrations are seen to have fallen
sharply with distance from the CSO, and the change of composition is consistent with a
loss of more labile components upon dilution. It should be noted that the concentrations
of total QACs in the main stem of the river was not dramatically elevated over average
levels measured in the lower estuary and the water in the river had experienced a couple
days of input of untreated sewage.
Figure 10. Changes in QAC composition and concentration with distance from a point source discharge near the North River WWTP during its July 2011 failure. These samples were taken near the end of the three-day
discharge.
0
1
2
3
4
5
0%
10%
20%
30%
40%
50%
60%
0 50 100 150
LOG
[Tot
al Q
ACs]
(ng/
L)
Labi
le F
ract
ion
Distance from point source (m)
Changing Conditions with Distance from Raw Sewage Discharge
Labile fraction
Total QACs
II-24

DISCUSSION
A significant result of this project is that the first successful detections of QACs
were made in estuarine surface waters in the U.S. or anywhere in the world.
Furthermore, the relationship between QAC composition and prior day rainfall at the
Brooklyn sites suggests that CSO discharge causes surface waters to become measurably
enriched in the more labile QACs which would otherwise be more depleted in waters
impacted by treated sewage (Figure 5). This enrichment of the labile fraction appears
muted at the East River site (Figure 4), because it receives a mixture of treated and
untreated sewage during large CSO events. A second piece of evidence to support this
idea is the fact that the East River experiences less variation in the total concentration of
QACs, compared to the Newtown and Gowanus sites (Figure 3). The constant input of
treated sewage into the East River has a dominant effect on the QAC
concentration/composition of that water body, even when untreated sewage is added.
Dissolved phase measurements, although limited in number of samples, provided
some useful information. At Piermont, a high level of dissolved QACs was discovered in
August (Figure 8). The dissolved-particulate partitioning, the high labile fraction seen
especially in the dissolved phase, and the large total concentration of QACs suggest that
poorly-treated sewage was being discharged into the river at this time. The prior day saw
0.6 inches of rain, and two days prior there was a record-setting rainfall of 6.4 inches, so
it is possible that a CSO discharge was responsible for this untreated sewage signal, or
that the local WWTP became overloaded and there was some bypass of untreated
sewage. In contrast, samples taken there in June had a much lower total concentration
and a lower labile fraction, resembling a treated sewage source (although no dissolved-
II-25

phase measurements were made that day). This further suggests that rainfall can have an
adverse effect on water quality at Piermont, but more information about the sewage
treatment operations and a larger number of samples are needed to test this. Dissolved
phase measurements made during a drier period in October did not detect any of the
analytes except the most abundant ones; however, the data for dissolved phase
measurement are very preliminary, and it is unclear if analytical sensitivity was sufficient
for this sample set. Further work must be done to perfect the dissolved phase analysis.
At the North River site, a dramatic change in the QAC population of the water
column was observed during the July raw sewage discharge. At the discharge point
source, the composition was enriched in the more labile QACs, relative to samples taken
at the point source there in June or August. However, this enrichment dissipated rapidly
with distance from the outfall, having attenuated to background levels (below the harbor-
wide median of 19%) within 111m (Figure 10). Dilution is a likely cause of this
attenuation. At the time of sample collection, discharge had already been happening for
two days. Freshly discharged particles were mixed with sewage-derived QACs which
had entered the estuary on previous days, and those older QACs were likely depleted in
labile compounds due to time spent in the river. At the Dyckman St. Beach, there was a
similar compositional change during the July failure event (30% labile QACs vs. 19%
during August), but the total concentration of QACs was unchanged; it is possible that
the discharge was beginning to diminish at the time of sampling as the WWTP came back
into operation.
II-26

Figure 11. Average QAC composition across several kinds of water samples, with particulate-phase measurements. (1) Influent taken from a WWTP on Long Island; (2) Effluent taken from that same WWTP after undergoing tertiary treatment; (3) Samples taken from the North River sites on July 22nd during the raw sewage discharge; (4) Highly contaminated sample found at the Piermont outfall during August; (5) Samples taken at Newtown Creek and Gowanus Canal after a pronounced CSO event in May, (6) Samples taken from the canals in August, after a lesser rainfall than May; (7) Samples taken from the canals during drier periods; (8) Samples taken during any weather in the East River and Hudson River (9) Sediment samples from CSO-impacted sites around NY/NJ harbor; (10) Sediment samples taken from non-CSO sites around NY/NJ harbor.
Comparisons across sites (Figure 11) are a useful way of considering the data.
Included for illustrative purposes, the WWTP influent and effluent cannot be directly
compared to sites from New York City, since the plant in question receives low flows and
different sewer shed inputs, and uses a different kind of treatment, but nonetheless it
indicates that compositional differences between treated and untreated sewage are
substantial. The highly contaminated samples from Piermont and the North River
accident have a labile fraction that is quite high, especially considering the amount of
0% 10% 20% 30% 40% 50% 60% 70% 80% 90%
NY/NJ Non-CSO Sed (10)NY/NJ CSO Sed (9)Non-CSO Sites (8)Canals No rain (7)Canals August (6)
Canals May (5)Piermont August (4)
North River Accident (3)WWTP Effluent (2)WWTP Influent (1)
Labile fraction
Comparison of Compositions Across 10 kinds of samples
II-27

dilution that occurs in some of those samples upon discharge. In the canals, May
compositions were labile QAC-enriched compared to dry weather compositions, which
yielded compositions very similar to those found at non-CSO sites. Unexpectedly, the
August canal samples also resembled dry-weather compositions. Either the 0.6-inch
rainfall the day before was not sufficient to trigger a large CSO event, degradation of the
labile QACs occurred rapidly between the rain and the time of sampling, or after
approximately a tidal cycle, the CSO signal in the canals was sufficiently diluted with
surrounding water that the signal was masked. Since the microbial populations of the
canals are highly acclimated to sewage contaminants, it is possible that labile QACs have
a shorter residence time in the canals than in less-impaired waterways. Sediment
measurements from non-CSO sites resemble the compositions found in the water column
during dry periods or away from CSO sites. Finally, prior sediment measurements made
near CSO outfalls had an intermediate composition, being more labile-enriched than dry-
weather water, but less enriched than CSO water. This intermediate composition may
reflect further loss of labile QACs prior to or after deposition, or that what is deposited
near the CSOs represents mixed input of QACs to the sediment in such sites, as the water
column above sees a range of concentrations and compositions depending on rainfall.
Compositional changes were generally not as pronounced as expected, based on
comparisons between raw sewage and treated sewage samples taken inside of WWTPs.
One possible explanation is that the difference would be greater if dissolved phase
measurements had been included. Since the most degradable QACs are also the most
soluble, they may have a more telling presence than anticipated in the dissolved phase,
particularly for fresh sewage discharge.
II-28

ACKNOWLEDGMENTS
This research would not have been possible without the help of Riverkeeper’s
John Lipscomb, who took me sampling. I also need to thank Dr. Gregory O’Mullan, Dr.
Andrew Juhl, and their FIB monitoring team, for providing data, and my fellow students
Anne Cooper Doherty and Shawn Fisher, for their support and advice.
II-29

REFERENCES
Clara, M., S. Scharf, C. Scheffknecht, and O. Gans. 2007. Occurrence of selected surfactants in untreated and treated sewage. Water Research 41:4339-4348.
Donovan, E., D.F. Stakal, K.M. Unice, J.D. Roberts, C. Haws, B. Finley, and M. Harris. 2008. Risk of gastrointestinal disease associated with exposure to pathogens in the sediment of the lower Passaic River. Applied and Environmental Microbiology. 74:1004-1018.
Ferrer, I. and E.T. Furlong. 2001. Identification of alkyl dimethylbenzylammonium surfactants in water samples by solid-phase extraction followed by ion trap LC/MS and LC/MS/MS. Environmental Science and Technology 35:2583-2588.
Freis J.S., G.W. Characklis, and R.T Noble. 2008. Sediment-water exchange of Vibrio sp. and fecal indicator bacteria: Implications for persistence and transport in the Neuse River Estuary, North Carolina, USA. Water Research 42:941-950.
Haack, S.K., J.W. Duris, L.R. Foarty, D.W. Kolpin, M.J. Focazio, E.T. Furlong, and M.T. Meyer. 2009. Comparing wastewater chemicals, indicator bacteria concentrations, and bacterial pathogen genes as fecal pollution indicators. Journal of Environmental Quality 38:248-258.
Hagerdorn, C., and S.B. Weisberg. 2009. Chemical-based fecal source tracking methods: current status and guidelines for evaluation. Reviews in Environmental Science & Biotechnology 8:275-287.
Jarrol, E.L., A.K. Bingham, and E.A. Meyer. 1981. Effect of chlorine on Giardia lamblia cyst viability. Applied and Environmental Microbiology 41:483-487.
Jeng, H.C., A.J. England, and H.B. Bradford. 2005. Indicator organisms associated with stormwater suspended particles and estuarine sediments. Journal of Environmental Science and Health, Part A 40:779-791.
Li, X. 2009. Quaternary ammonium compounds (QACs) in marine sediments: detection, occurrence and application as geochemical tracers. Doctoral dissertation. Stony Brook University, Stony Brook, New York.
Li, X., and B. Brownawell. 2009. Analysis of quaternary ammonium compounds in estuarine sediments by LC-ToF-MS: Very high positive mass defects of alkylamine ions as powerful diagnostic tools for identification and structural elucidation. Analytical Chemistry 81:7926–7935.
II-30

Li, X., and B. Brownawell. 2010. Quaternary ammonium compounds in urban estuarine sediment environments - a class of contaminants in need of increased attention? Environmental Science and Technology 44:7561-7568.
Lara-Martin, P., X. Li, R. Bopp, and B. Brownawell. 2010. Occurrence of alkyltrimethylammonium compounds in urban estuarine sediments: behentrimonium as a new emerging contaminant. Environmental Science and Technology 44:7569-7575.
McLellan, S., E. Hollis, M. Depas, M. Van Dyke, J. Harris, and C. Scopel. 2007. Distribution and fate of Escherichia coli in Lake Michigan following contamination with urban stormwater and combined sewer overflows. Journal of Great Lakes Research 33:566–580.
NYCDEP. 2010. New York Harbor Water Quality Report. New York City Department of Environmental Protection.
Simpson, J.M., J.W. Santo Domingo, and D.J. Reasoner. 2010. Microbial source tracking: state of the science. Environmental Science and Technology 36:5279- 5288.
Stoeckel, D.M., and V.J. Harwood. 2007. Performance, design, and analysis in microbial source tracking studies. Applied and Environmental Microbiology 73:2405-2415.
Swartz C.H., S. Reddy, M.J. Benotti, H. Yin, L.B. Barber, B. Brownawell, and R. Rudel. 2006. An analysis of steroid estrogens, alkylphenols, and other wastewater contaminants leaching into groundwater from a residential septic system on Cape Cod, MA. Environmental Science and Technology 40:4894-4902.
Wheeler, A.L., P.G. Hartel, D.G. Godfrey, J.L. Hill, and W.I. Segars. 2002. Potential of Enterococcus faecalis as a human fecal indicator for microbial source tracking. Journal of Environmental Quality 31:1286–1293.
II-31


![[ Overflow ]](https://img.pdfslide.net/doc/110x75/56814086550346895dac0ccd/-overflow-.jpg)