Embed Size (px)
Citation preview
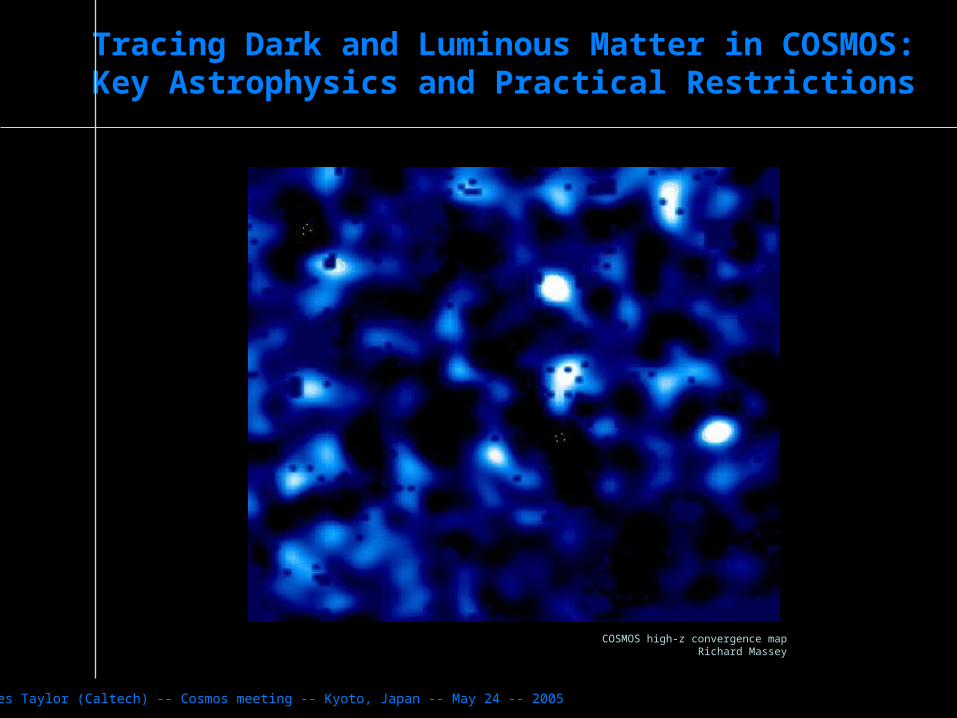
Tracing Dark and Luminous Matter in COSMOS:Key Astrophysics and Practical Restrictions
James Taylor (Caltech) -- Cosmos meeting -- Kyoto, Japan -- May 24 -- 2005
COSMOS high-z convergence mapRichard Massey
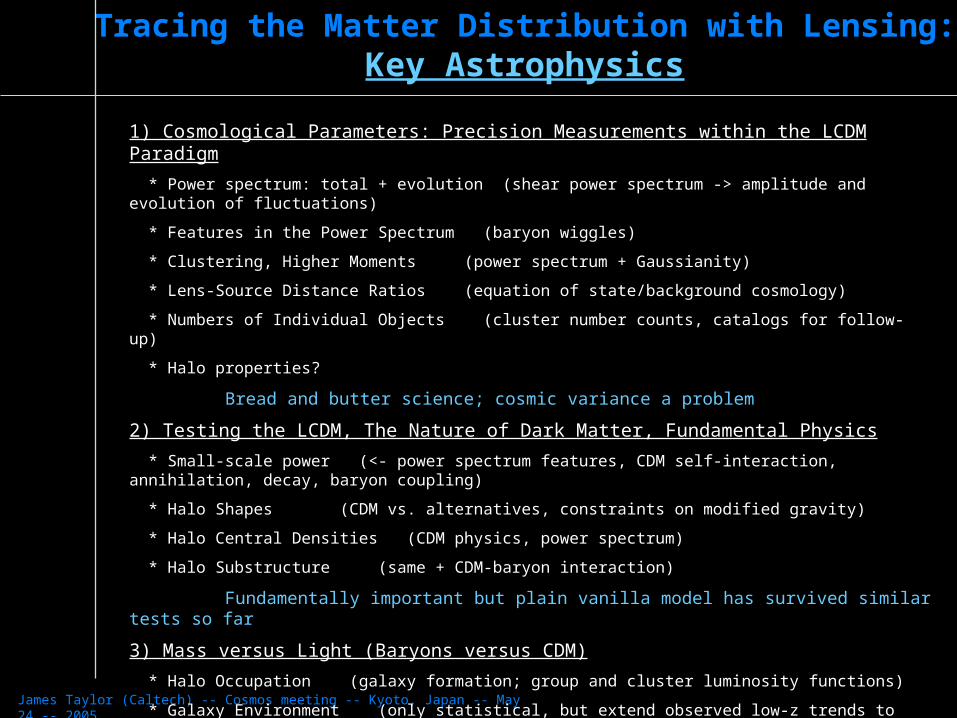
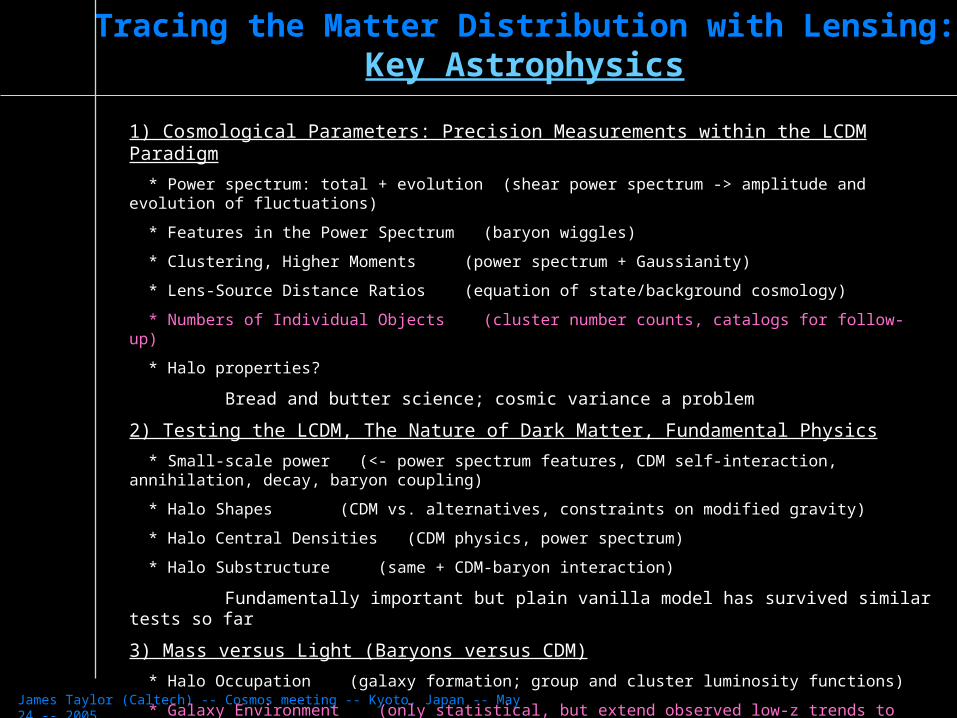
Tracing the Matter Distribution with Lensing:Key Astrophysics
James Taylor (Caltech) -- Cosmos meeting -- Kyoto, Japan -- May 24 -- 2005
1) Cosmological Parameters: Precision Measurements within the LCDM Paradigm
* Power spectrum: total + evolution (shear power spectrum -> amplitude and evolution of fluctuations)
* Features in the Power Spectrum (baryon wiggles)
* Clustering, Higher Moments (power spectrum + Gaussianity)
* Lens-Source Distance Ratios (equation of state/background cosmology)
* Numbers of Individual Objects (cluster number counts, catalogs for follow-up)
* Halo properties?
Bread and butter science; cosmic variance a problem
2) Testing the LCDM, The Nature of Dark Matter, Fundamental Physics
* Small-scale power (<- power spectrum features, CDM self-interaction, annihilation, decay, baryon coupling)
* Halo Shapes (CDM vs. alternatives, constraints on modified gravity)
* Halo Central Densities (CDM physics, power spectrum)
* Halo Substructure (same + CDM-baryon interaction)
Fundamentally important but plain vanilla model has survived similar tests so far
3) Mass versus Light (Baryons versus CDM)
* Halo Occupation (galaxy formation; group and cluster luminosity functions)
* Galaxy Environment (only statistical, but extend observed low-z trends to high z )
* (Individual) Galaxy Properties vs. Halo Properties (from gg lensing; fundamental issue in galaxy formation)
* Halo Central Densities (adiabatic contraction, feedback, galaxy formation physics)
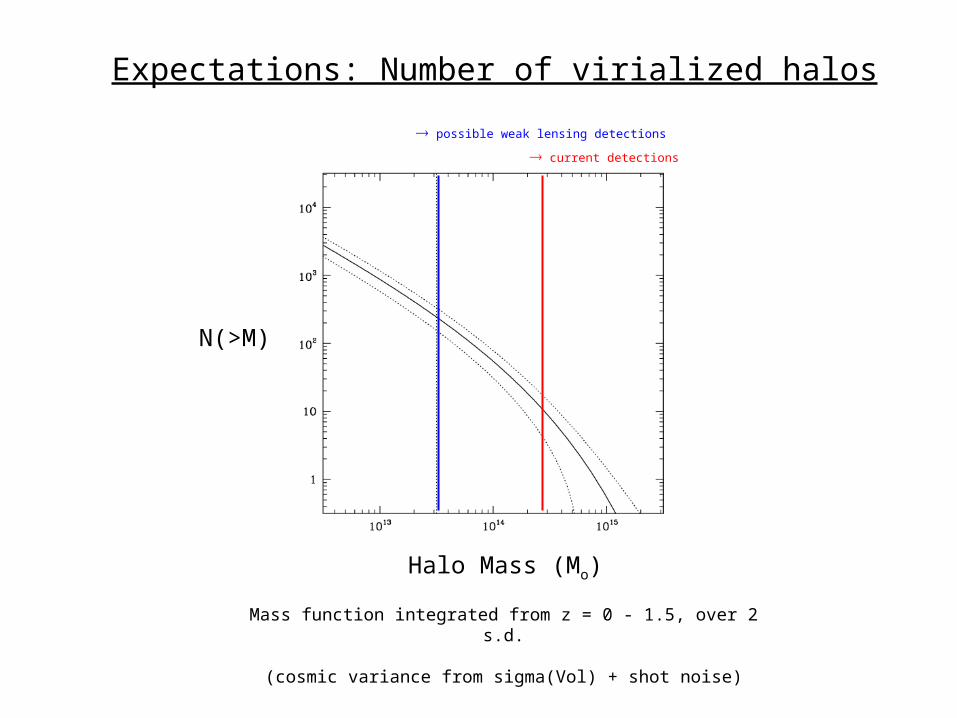
Expectations: Number of virialized halos
N(>M)
Halo Mass (Mo)
Mass function integrated from z = 0 - 1.5, over 2 s.d.
(cosmic variance from sigma(Vol) + shot noise)
possible weak lensing detections
current detections
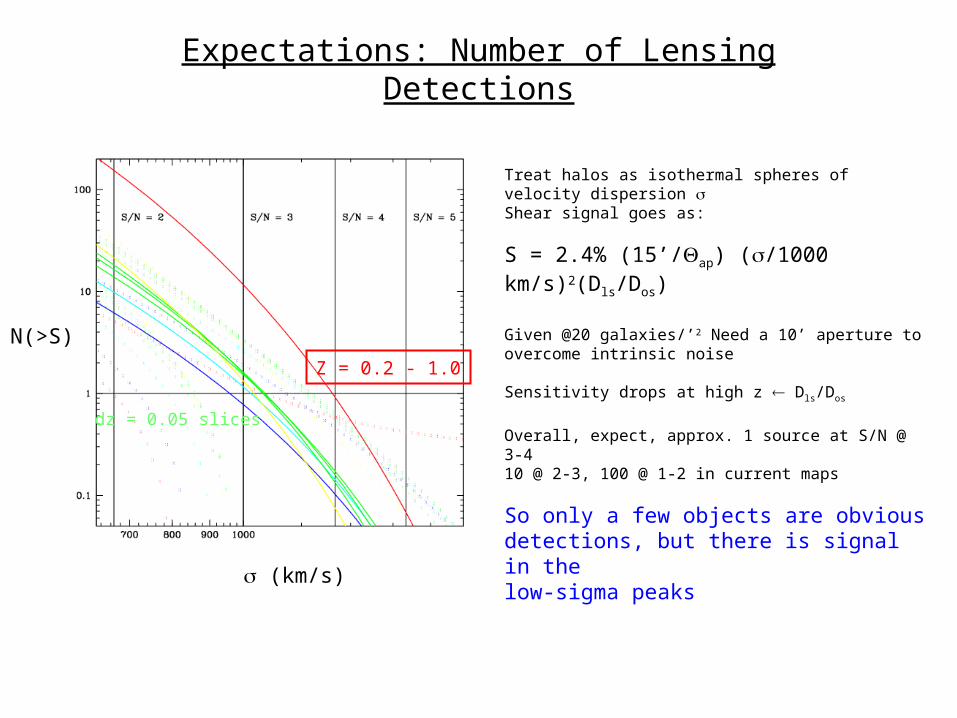
Expectations: Number of Lensing Detections
Treat halos as isothermal spheres of velocity dispersion Shear signal goes as:
S = 2.4% (15’/ap) (/1000 km/s)2(Dls/Dos)
Given @20 galaxies/’2 Need a 10’ aperture to overcome intrinsic noise
Sensitivity drops at high z Dls/Dos
Overall, expect, approx. 1 source at S/N @ 3-410 @ 2-3, 100 @ 1-2 in current maps
So only a few objects are obvious detections, but there is signal in thelow-sigma peaks
Z = 0.2 - 1.0
dz = 0.05 slices
N(>S)
(km/s)
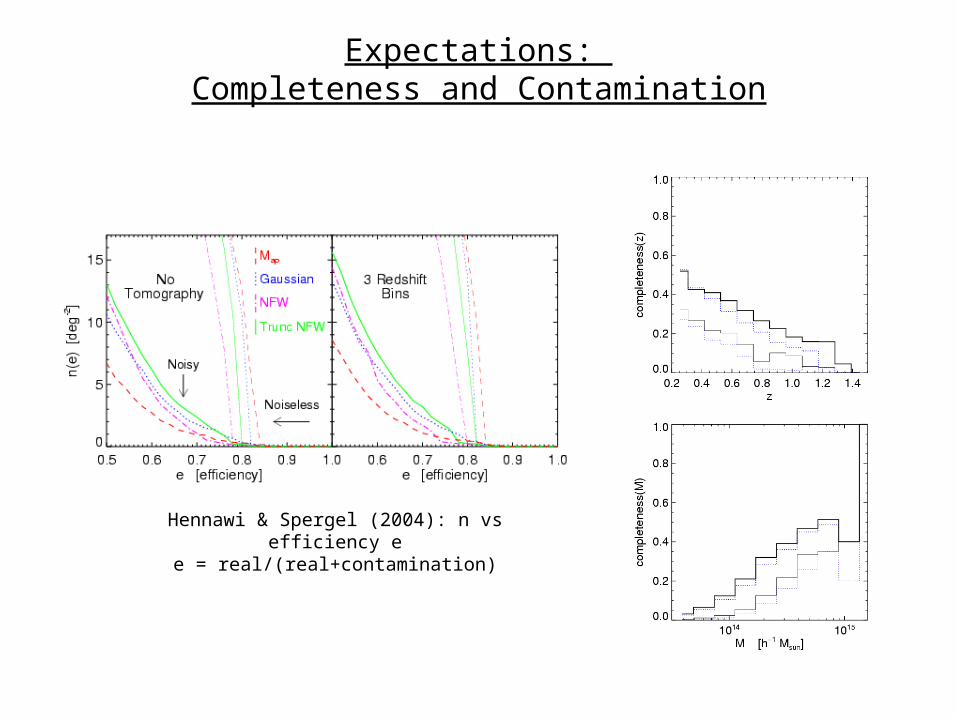
Expectations: Completeness and Contamination
Hennawi & Spergel (2004): n vs efficiency ee = real/(real+contamination)
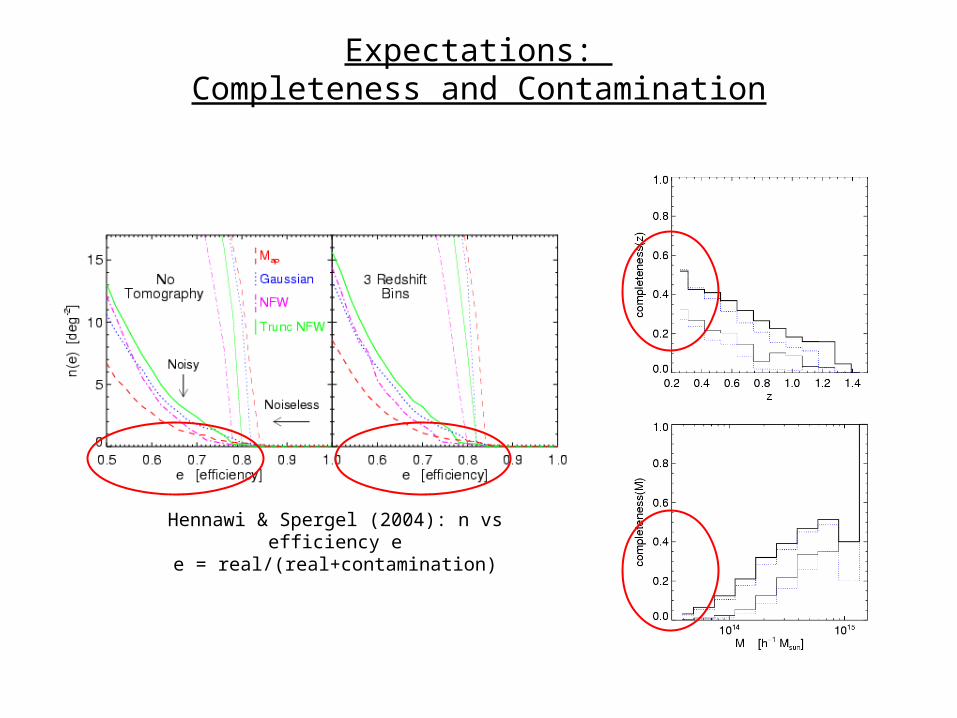
Expectations: Completeness and Contamination
Hennawi & Spergel (2004): n vs efficiency ee = real/(real+contamination)
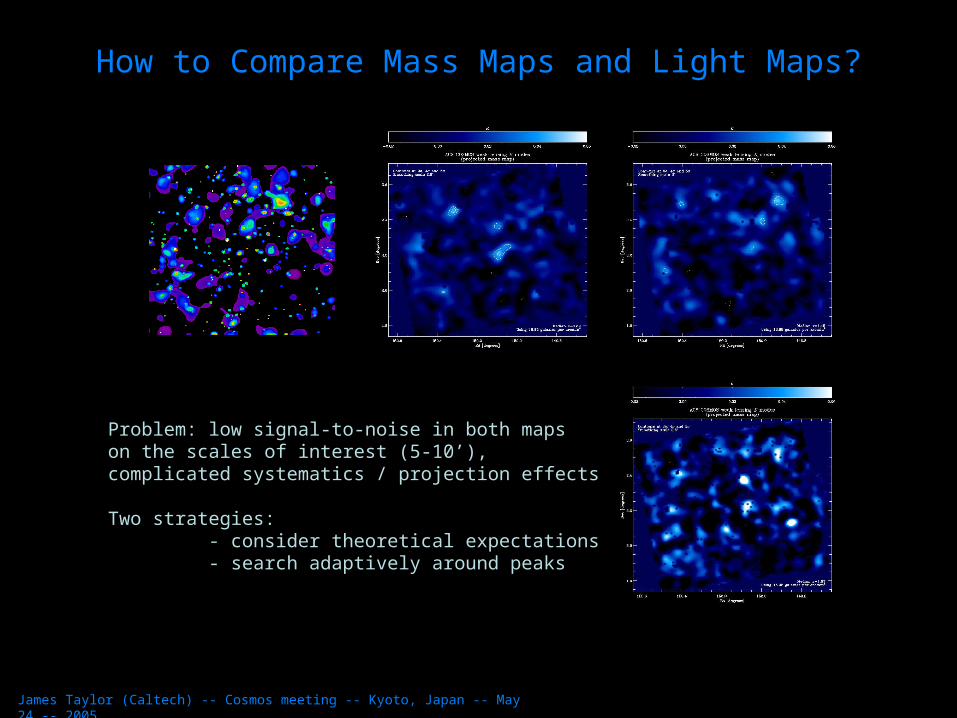
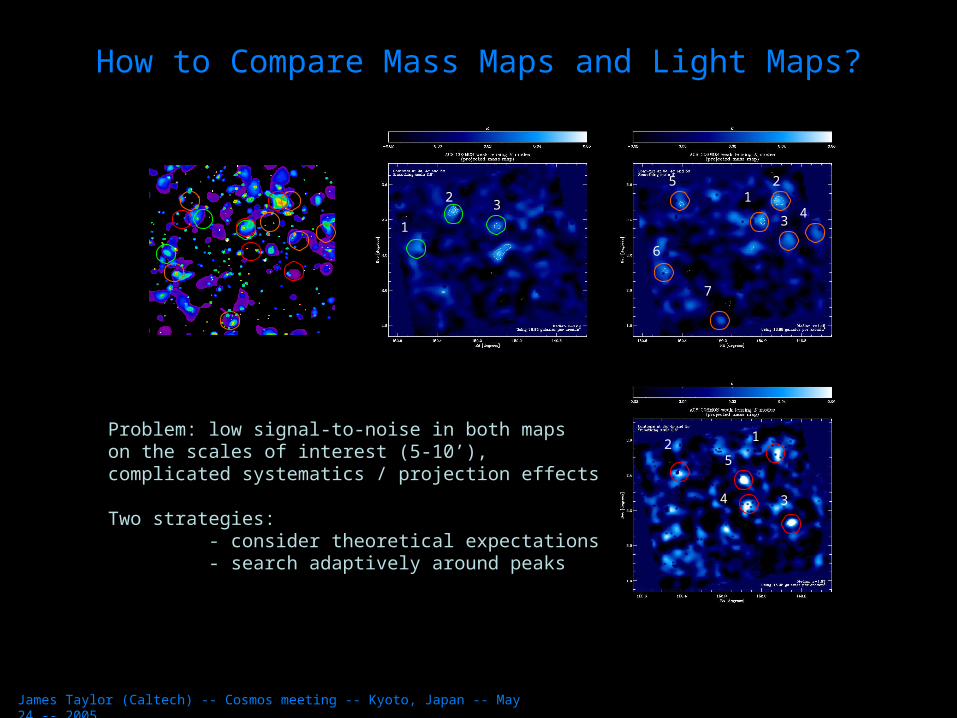
How to Compare Mass Maps and Light Maps?
Problem: low signal-to-noise in both mapson the scales of interest (5-10’), complicated systematics / projection effects
Two strategies: - consider theoretical expectations - search adaptively around peaks
James Taylor (Caltech) -- Cosmos meeting -- Kyoto, Japan -- May 24 -- 2005

How to Compare Mass Maps and Light Maps?
Problem: low signal-to-noise in both mapson the scales of interest (5-10’), complicated systematics / projection effects
Two strategies: - consider theoretical expectations - search adaptively around peaks
1
23
6
5
7
1
34
2
25
4 3
1
James Taylor (Caltech) -- Cosmos meeting -- Kyoto, Japan -- May 24 -- 2005
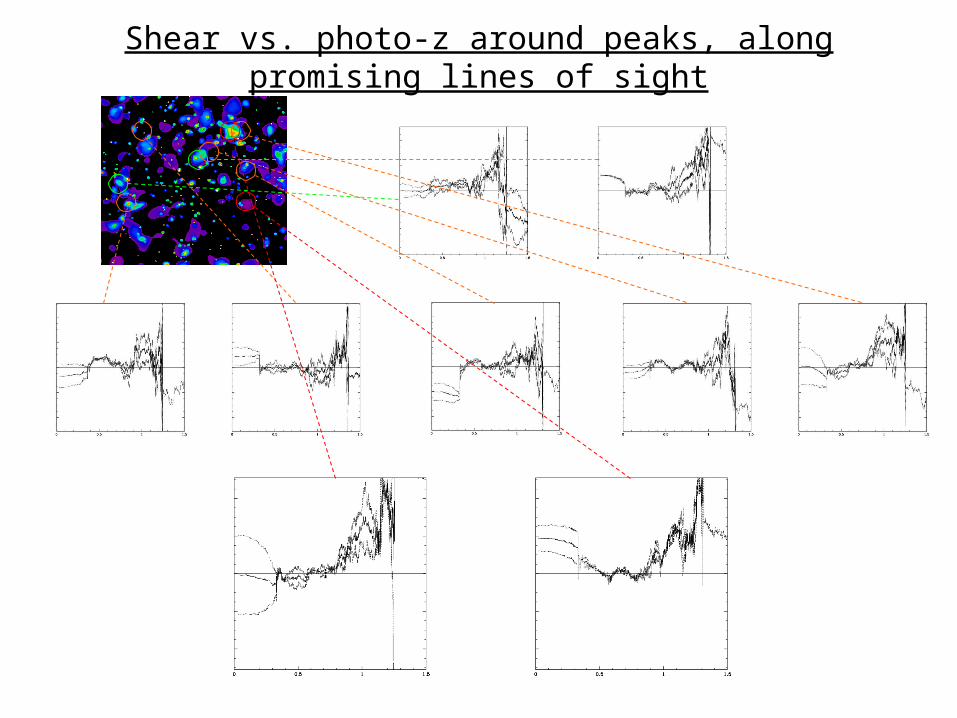
Shear vs. photo-z around peaks, along promising lines of sight
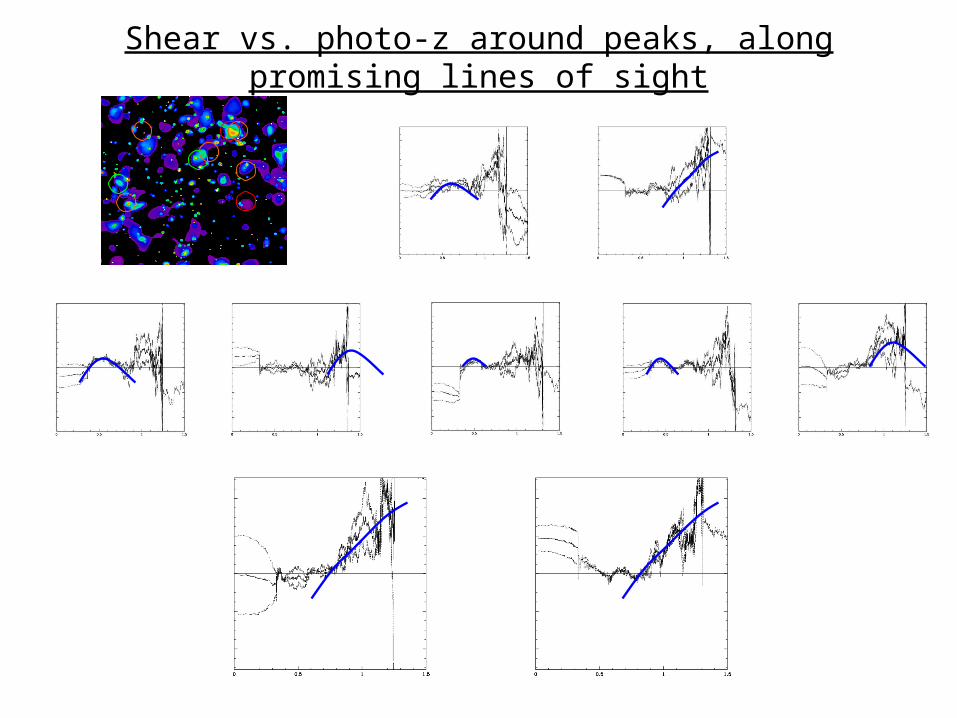
Shear vs. photo-z around peaks, along promising lines of sight
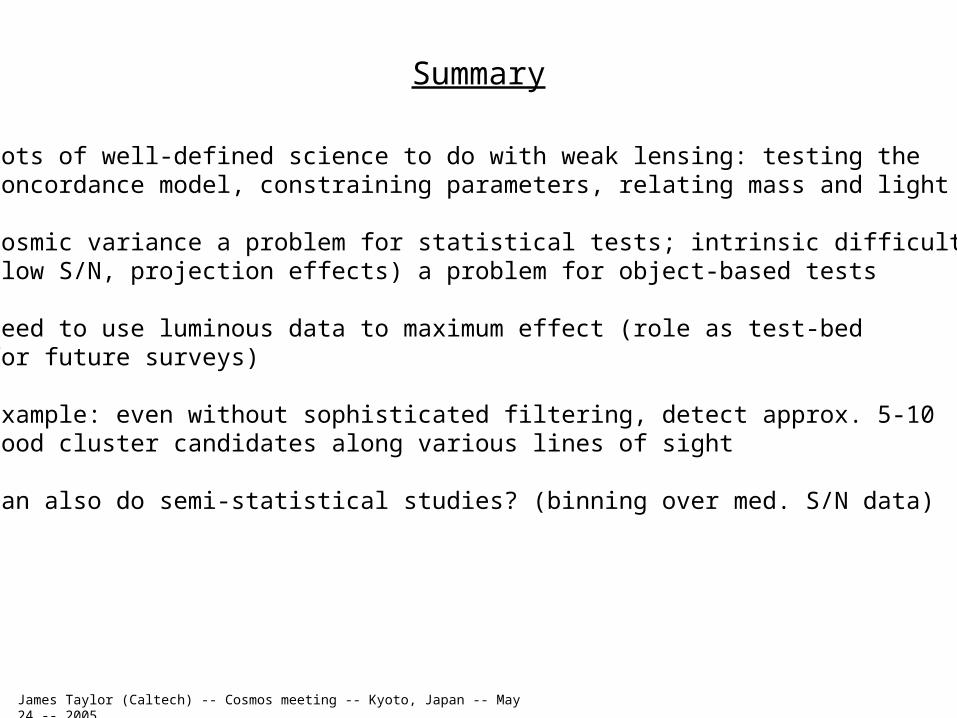
Summary
* Lots of well-defined science to do with weak lensing: testing the concordance model, constraining parameters, relating mass and light
* Cosmic variance a problem for statistical tests; intrinsic difficulties (low S/N, projection effects) a problem for object-based tests
* Need to use luminous data to maximum effect (role as test-bed for future surveys)
* Example: even without sophisticated filtering, detect approx. 5-10 good cluster candidates along various lines of sight
* Can also do semi-statistical studies? (binning over med. S/N data)
James Taylor (Caltech) -- Cosmos meeting -- Kyoto, Japan -- May 24 -- 2005
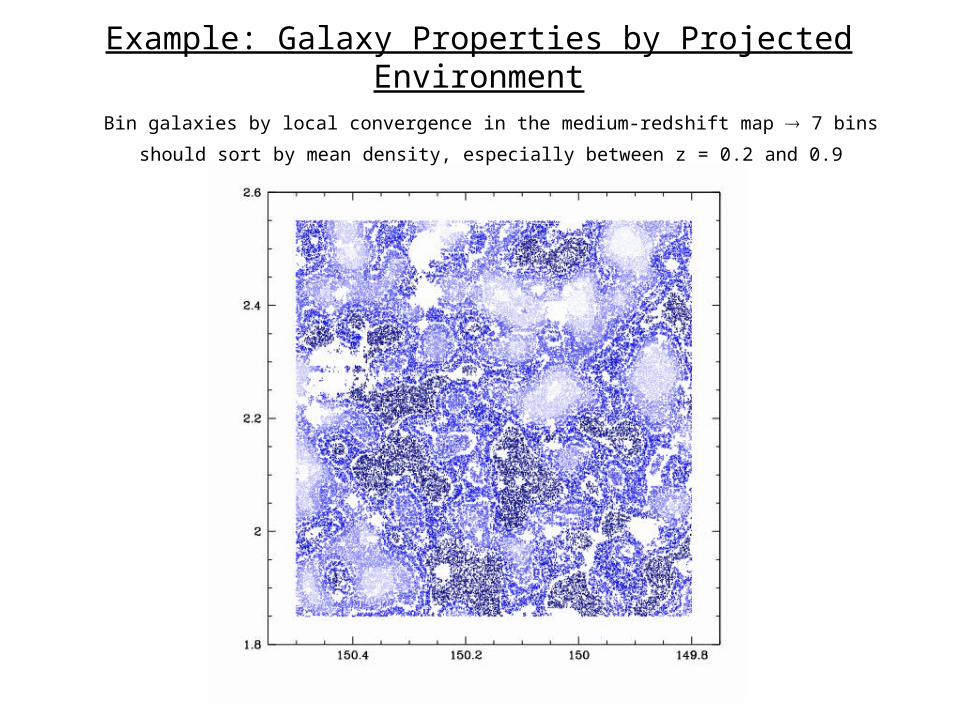
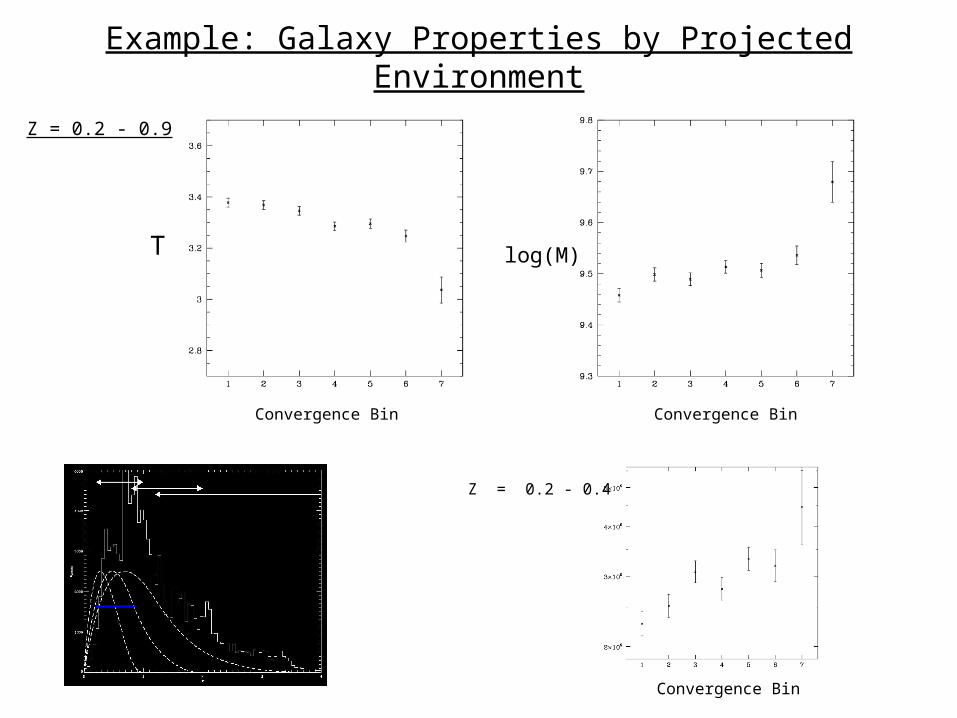
Example: Galaxy Properties by Projected Environment
Bin galaxies by local convergence in the medium-redshift map 7 bins
should sort by mean density, especially between z = 0.2 and 0.9
Example: Galaxy Properties by Projected Environment
Z = 0.2 - 0.9
Z = 0.2 - 0.4
Convergence BinConvergence Bin
Convergence Bin
T log(M)
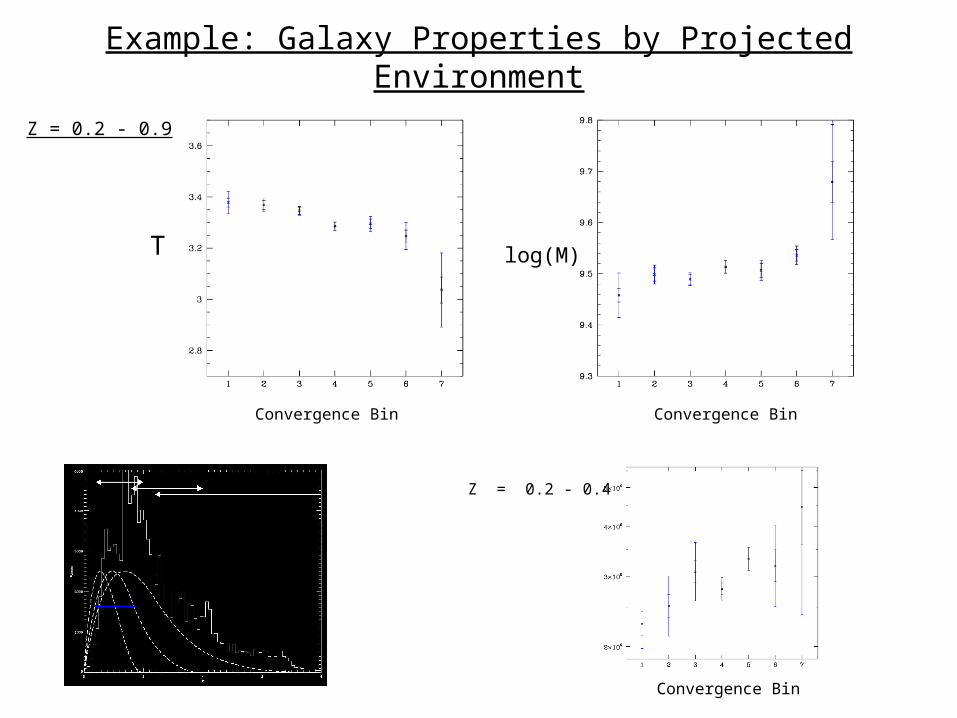
Example: Galaxy Properties by Projected Environment
Z = 0.2 - 0.9
Z = 0.2 - 0.4
Convergence BinConvergence Bin
Convergence Bin
T log(M)