Embed Size (px)
Citation preview
Tracing hyporheic zone-driven attenuation of polar organic pollutants using passive sampling
Jonas Mechelke, Etiënne L.M. Vermeirssen, Juliane Hollender
?
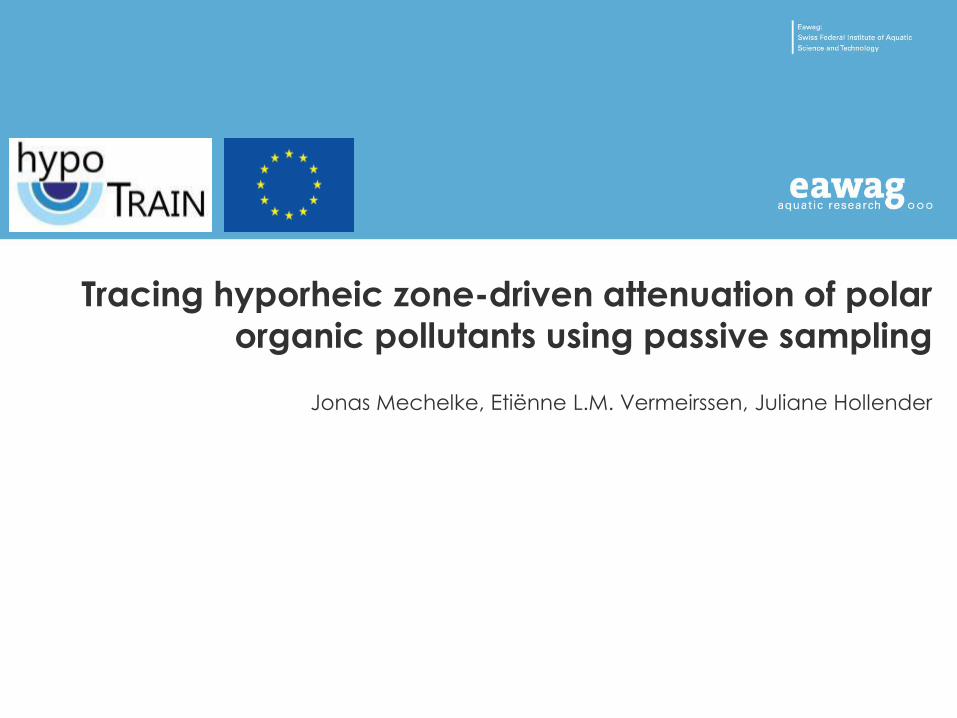
Natural fixed-bed bioreactor HypoTRAIN proposal, SEP-210147419
hypo: under; rheo(s): (to) flow;
hyporheic: ‘under the flow’
‘Defining’ the Hyporheic Zone
1
2
Central compartment
for pollutant attenuation
Self-purification
of lotic systems
Barrier against
aquifer contamination
H
y
p
o
t
h
e
s
e
s
Test hypotheses
Tracing biotransformation of polar (mobile)
organic pollutants in the HZ
1. Identification & quantification of organic pollutants
2. Identification of transformation products being indicative
of hyporheic (bio)transformation
Research Goal
2
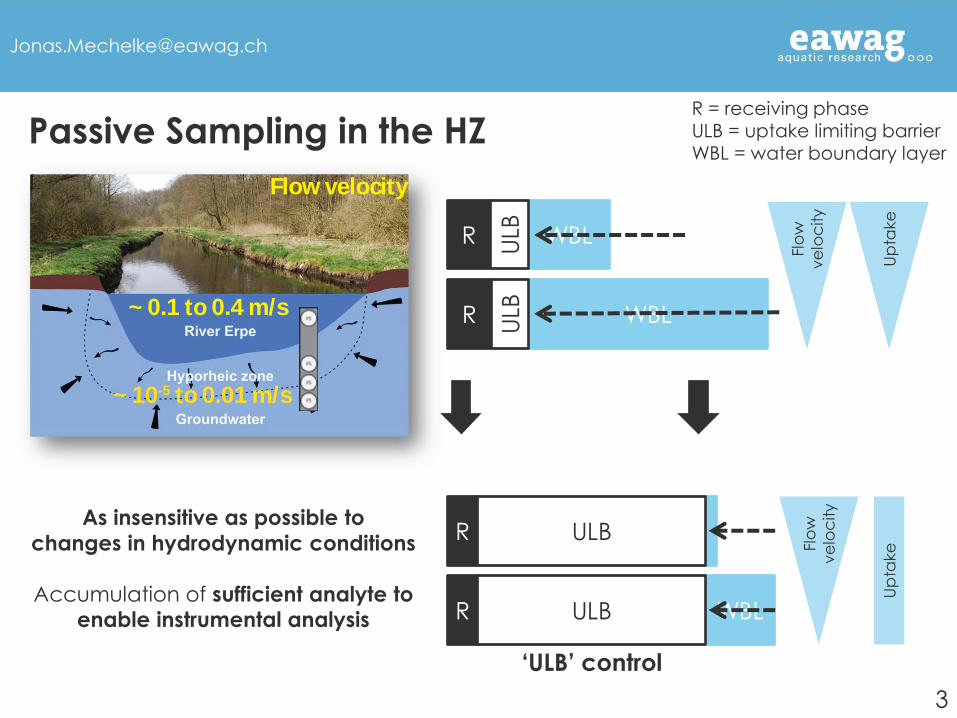
Passive Sampling in the HZ
Time-integrative passive sampler for
in-situ extraction of polar organic pollutants and respective
transformation products
WBL R ULB
WBL R ULB
Flo
w
ve
loc
ity
Up
take
R = receiving phase ULB = uptake limiting barrier
WBL = water boundary layer
R ULB
WBL R ULB
Flo
w
ve
loc
ity
Up
take
‘ULB’ control
As insensitive as possible to
changes in hydrodynamic conditions
Accumulation of sufficient analyte to enable instrumental analysis
3
Flow velocity
~ 0.1 to 0.4 m/s
~ 10-5 to 0.01 m/s
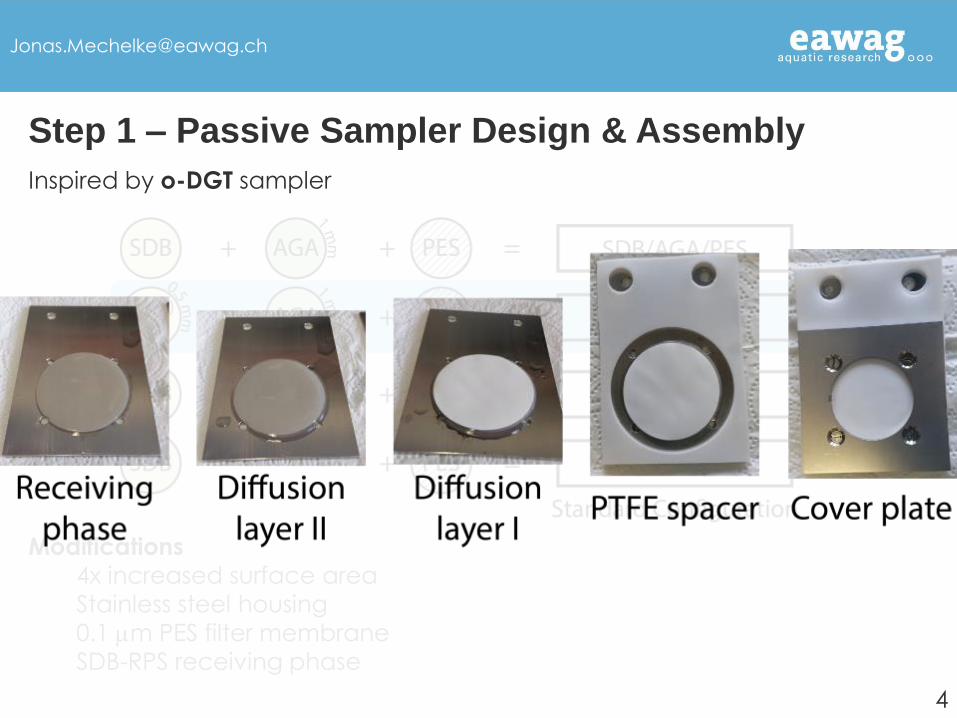
Inspired by o-DGT sampler
Step 1 – Passive Sampler Design & Assembly
Modifications
4x increased surface area
Stainless steel housing
0.1 m PES filter membrane
SDB-RPS receiving phase
4
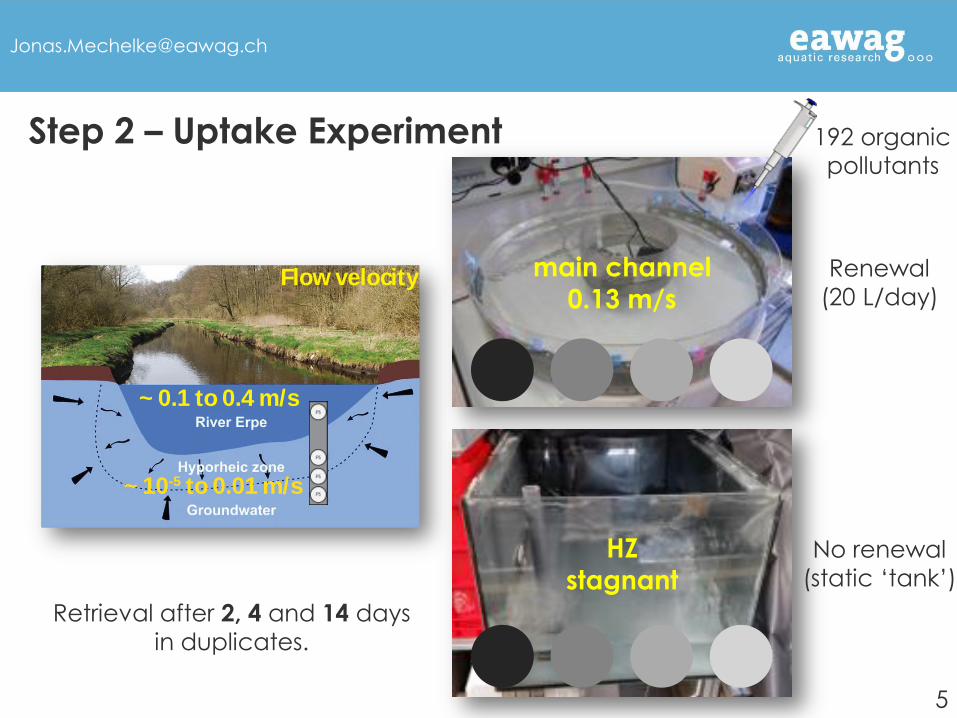
Step 2 – Uptake Experiment
Retrieval after 2, 4 and 14 days
in duplicates.
main channel
0.13 m/s
HZ
stagnant
192 organic pollutants
Renewal
(20 L/day)
No renewal
(static ‘tank’)
5
Flow velocity
~ 0.1 to 0.4 m/s
~ 10-5 to 0.01 m/s
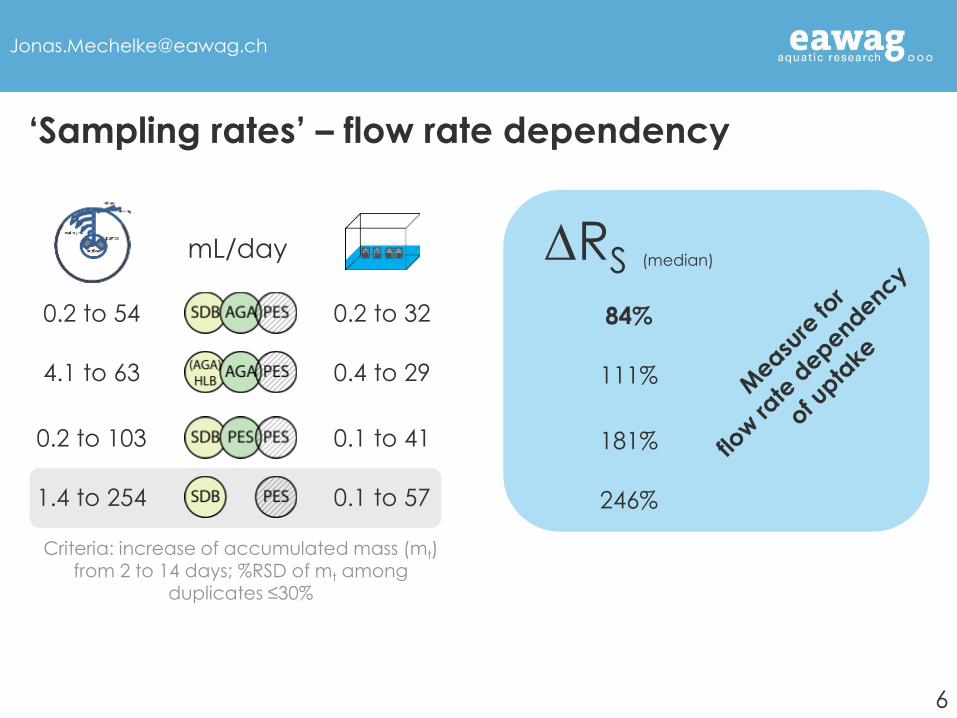
mL/day
‘Sampling rates’ – flow rate dependency
0.2 to 54
1.4 to 254
4.1 to 63
0.2 to 103
0.2 to 32
0.1 to 57
0.4 to 29
0.1 to 41
Criteria: increase of accumulated mass (mt)
from 2 to 14 days; %RSD of mt among duplicates ≤30%
DRS (median)
84%
111%
181%
246%
6
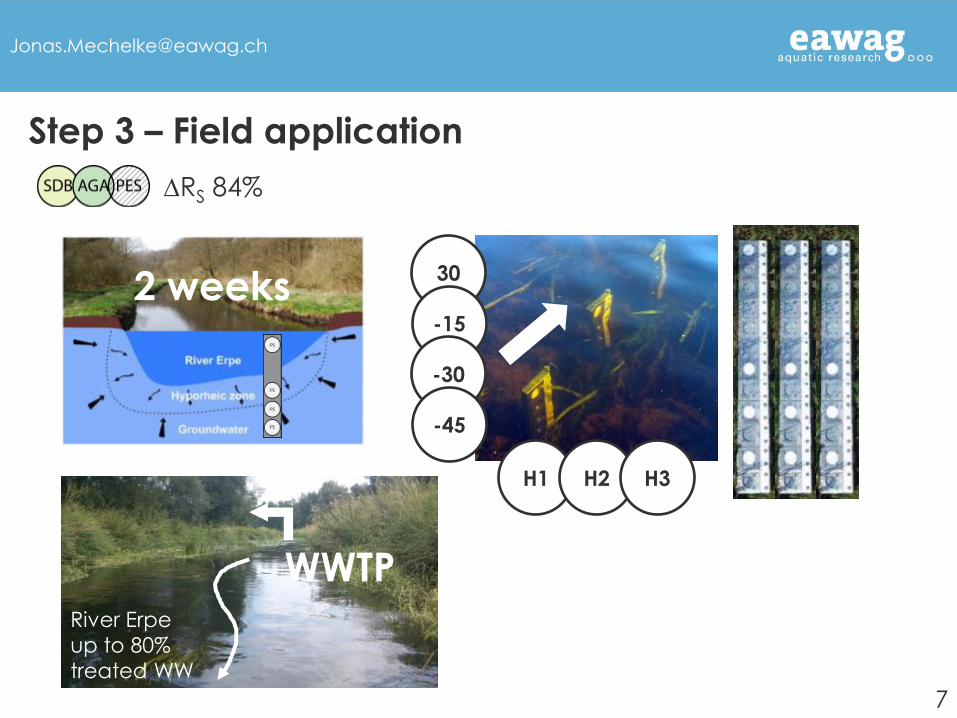
Step 3 – Field application
River Erpe
up to 80%
treated WW
WWTP
30
-15
-30
-45
H1 H2 H3
DRS 84%
7
2 weeks
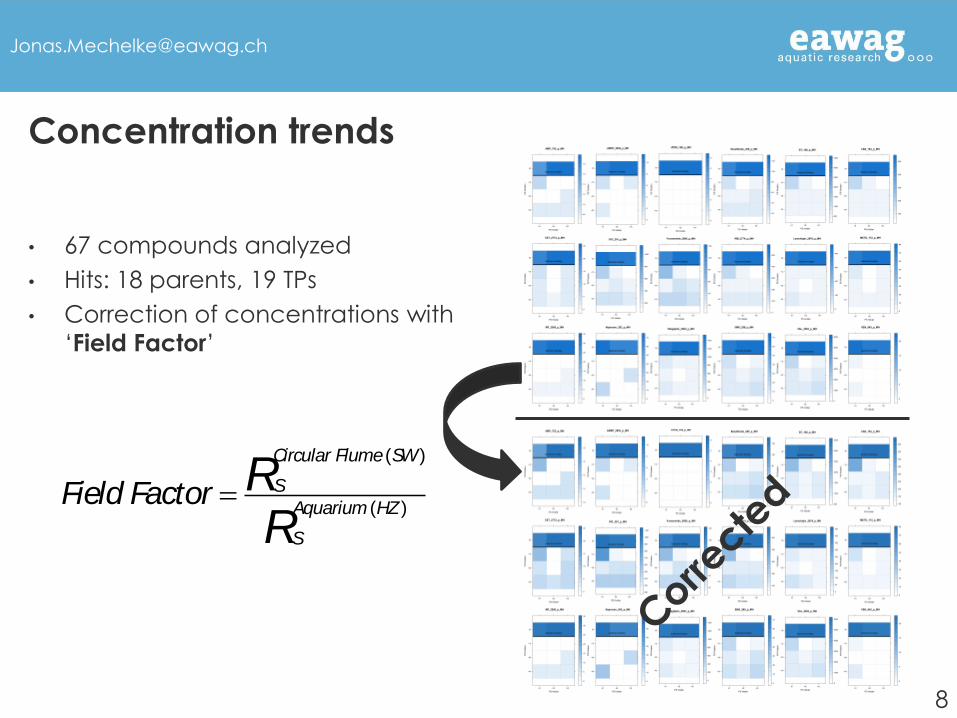
• 67 compounds analyzed
• Hits: 18 parents, 19 TPs
• Correction of concentrations with
‘Field Factor’
Concentration trends
( )
( )
Circular Flume SW
S
Aquarium HZ
S
Field Factor RR
8
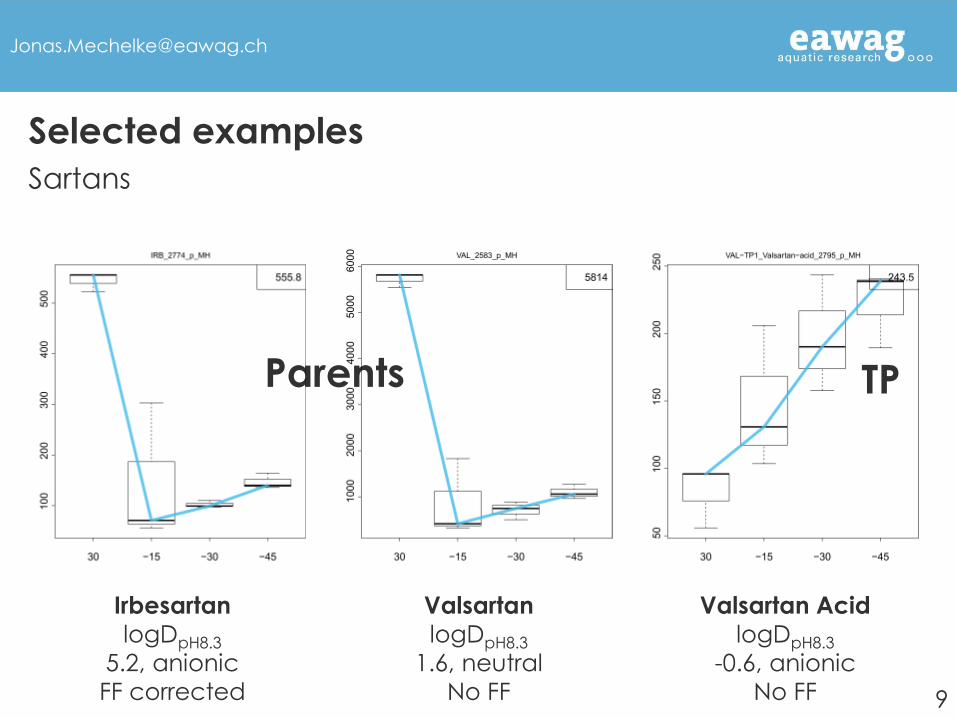
Selected examples
Sartans
Irbesartan
logDpH8.3
5.2, anionic
FF corrected
Valsartan
logDpH8.3
1.6, neutral
No FF
Valsartan Acid
logDpH8.3
-0.6, anionic
No FF
Parents TP
9
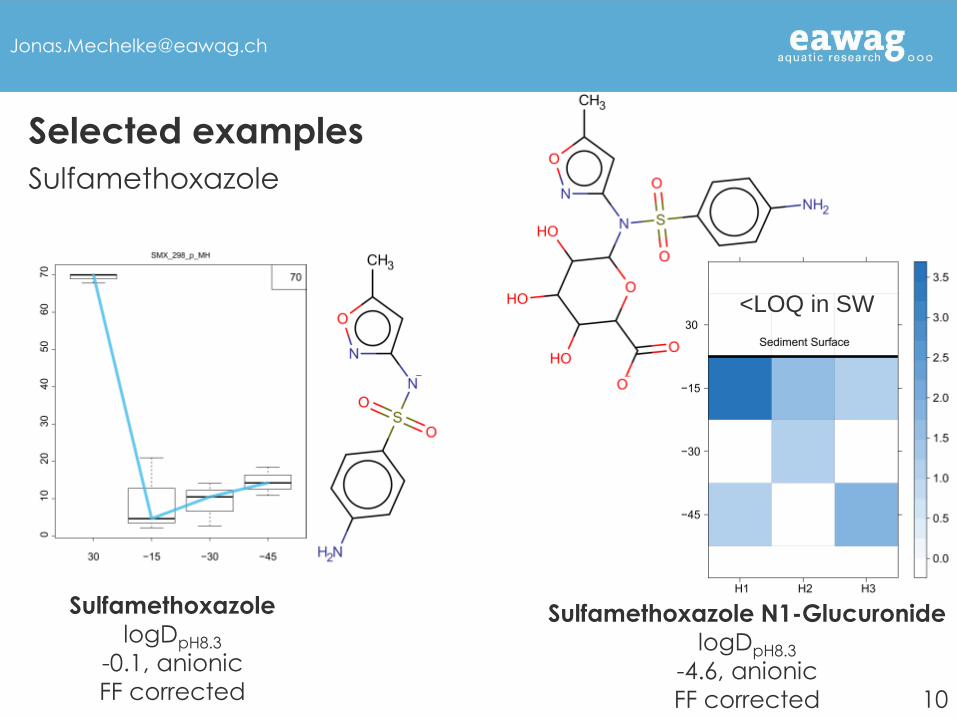
Sulfamethoxazole
Selected examples
Sulfamethoxazole N1-Glucuronide
logDpH8.3
-4.6, anionic
FF corrected
Sulfamethoxazole
logDpH8.3
-0.1, anionic
FF corrected
<LOQ in SW
10
• Uptake by ‘novel’ passive samplers not flow rate independent but less flow rate
dependent compared to standard configuration (SDB/PES) – though on the cost of
sampling rates
• Static tank experiment feasible without renewal due to minute sampling rates and marginal depletion.
• Field factors available for 116 organic pollutants to correct for differences in hydrodynamic conditions (SDB/AGA/PES)
• Suspect screening to elucidate further transformation products characteristic of HZ-driven biotransformation link parent attenuation to TP formation
Conclusions & Outlook
11

• Juliane Hollender
• Etiënne Vermeirssen
• Uchem colleagues
• Fellow ESRs
Acknowledgements
This project has received funding from the European Union’s Horizon 2020 research and innovation programme under the
Marie Sklodowska-Curie grant agreement No 641939.