Embed Size (px)
Citation preview
Track Nonlinear Energy Sinks for Impulsive Response Reduction
Jingjing Wang1, Nicholas Wierschem2, Billie F. Spencer, Jr.3, Xilin Lu4
1,4 State Key Laboratory of Disaster Reduction in Civil Engineering, Tongji
University, Shanghai 200092, China 2,3 Department of Civil and Environmental Engineering, University of Illinois,
Urbana 61801, IL,USA ABSTRACT
Nonlinear energy sinks (NESs) are a type of passive mass damper that can reduce structural responses with their nonlinear restoring force. A new type of NES featuring an auxiliary mass which moves along a specially shaped track is proposed in this paper. Following the derivation of the equation of motion, an analytical investigation is performed to reveal the dynamics of the system. Numerical analyses are then carried out to optimize system performance for the case when the NES is attached to a two degree-of-freedom primary structure that is subjected to impulsive loadings. Comparisons with a tuned mass damper (TMD) show that the response reduction of the primary structure achieved using the track NES is competitive with the TMD during ideal conditions, while the NES shows superior performance when uncertainty or changes to the primary structure are considered. INTRODUCTION
Structural control has a long history of successful application to response mitigation for structures subject to various types of dynamic excitation, including earthquake, wind, and blast. One of the most mature structural control methods is to use passive supplemental oscillators, such as tuned mass dampers (TMDs) to act as dynamic vibration absorbers. TMDs consist of a secondary mass, usually less than 5% of the primary structure to which it attaches, and increase the apparent damping in a primary structure by transferring input energy to the out-of-phase vibrating secondary mass (Housner et al. 1997). A key factor in the effectiveness of TMD systems is the tuning of the TMD, which is often done so that the TMD shares the same or almost the same fundamental frequency of the primary structure (Fahim Sadek et al.
1,2 Graduate Student 3,4 Professor
1997). However, while the TMD provides the advantages of simplicity and cost effectiveness, it is limited in the ability to adapt to changes in the structure. For example, when the natural frequency of the primary structure shifts due to structural degradation or other reasons, a linear TMD can act instead as a vibration amplifier, increasing the response amplitude of the primary structure (Sun et al. 2013).
Nonlinear energy sinks (NESs), on the other hand, can perform well in the presence of substantial changes in the dynamics of the structure, as the restoring force employed has an essential nonlinearity (i.e., the restoring force has no linear component and is not linearizable). While an NES functions as a damper by absorbing and dissipating energy, it also couples together the vibration modes of the linear structure; the result is the transfer of energy from lower to higher vibration modes of the primary structure where the energy can be dissipated rapidly (McFarland et al. 2005). This phenomenon is termed Targeted Energy Transfer (TET). The nonlinearity observed in NESs shows higher stiffness when displacement increases; thus, the hardening effect in the system is more apparent with increasing energy. This feature helps accommodate the dynamic change in the structure but also makes the efficacy of NES systems load-depended. NES systems behave differently for different magnitude excitations.
Several different experimental realizations of NES systems have been previously studied. A piano wire was used in the experimental verification of a two-degree-of-freedom system comprising a damped linear oscillator coupled to an essentially nonlinear attachment by McFarland et al. (2005). No-pretension wires also appeared in the subsequent study of a lightweight NES coupled to an impulsively loaded linear oscillator (McFarland et al. 2005). Wierschem et al. (2013) studied the wire NES attached to a building structure model and did thorough research on its optimization and effect. Implementations using elastomeric bumpers to provide a desired nonlinear restoring force show that the bumper NES is capable of dramatically reducing the response of a large-scale 6-storey base structure to impulsive ground motion (Wierschem et al. 2013). A bumper NES system has been tested on a larger 9-storey structure under both impulsive and blast excitations (Wierschem et al. in press; Wierschem et al. 2013). In the study of acoustic systems, nonlinear attachments made of membrane were first verified in (Cochelin et al. 2006). Bellet et al. (2010) presented a more complete study of a two degree-of-freedom model using membrane absorber.
In this paper, a new type of track NES is proposed. An analytical investigation is performed to reveal the dynamics of the NES and numerical analyses are carried out on this NES. The performance of the NES system is optimized for a two degree-of-freedom primary structure when subjected to impulsive loads. Comparisons of responses, measures, and force-displacement relationships are made with the locked system and a traditional TMD system. The results show that the track NES is competitive with the TMD during ideal conditions and is more robust efficient against the stiffness change in the base structure. TRACK NES AND PRIMARY STRUCTURE Track NES
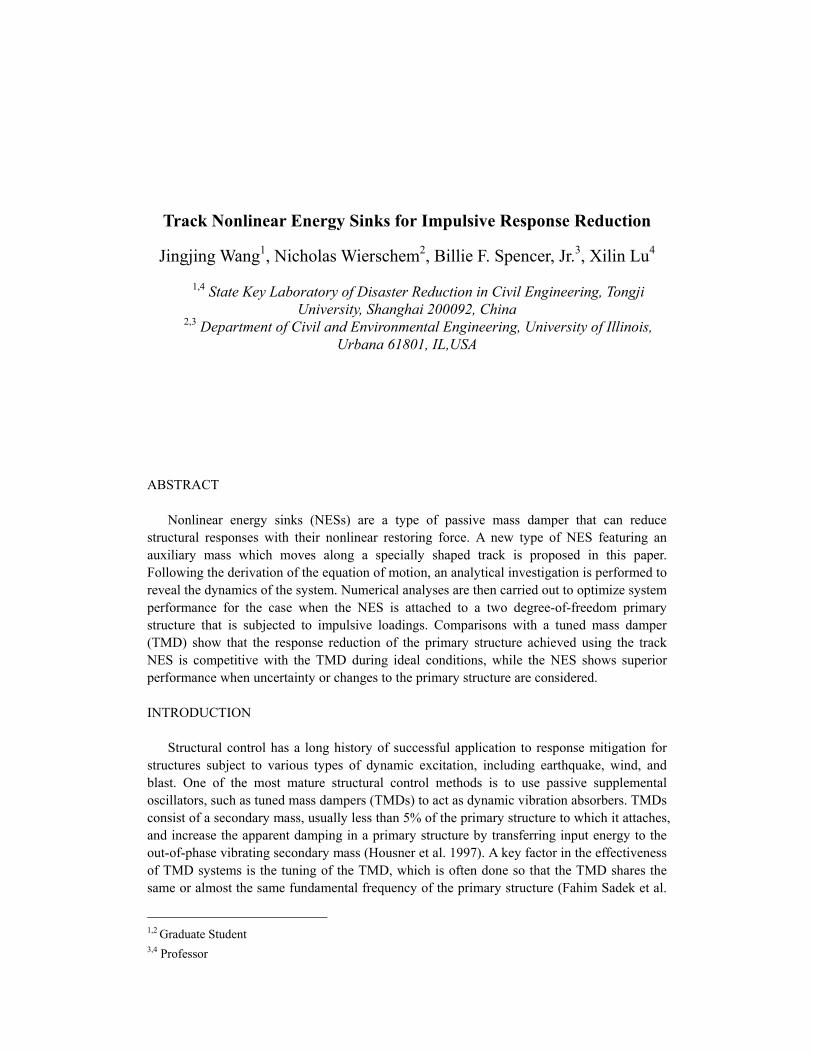
The system studied in this paper is referred to as a track NES. This system consists of a mass moving along a vertically curved path, as shown in Fig. 1a. One possible physical realization of this track NES is a cart that runs along a set of curved tracks (Fig. 1b). The track is specially shaped in the vertical plane to follow a desired profile. As the NES mass moves back and forth along the track, the reaction of the NES mass on the track is transferred to the primary structure to which the track is attached. As comprehensively discussed below, the direction of the normal force as well as the horizontal component of the normal force between the mass and the track changes depending on the slope of the shape of the track at each
position; thus, by carefully designing the track shape, various possibilities for the force-displacement relationship can be achieved, including essentially nonlinearities.
Fig. 1. Configuration of track NES
In deriving the dynamics of the track NES, the mass is assumed not to rotate, and as a
result, no rotational inertia force is considered in this study. Also, the mass is assumed to remain in contact with the track; thus, the restoring force is continuous.
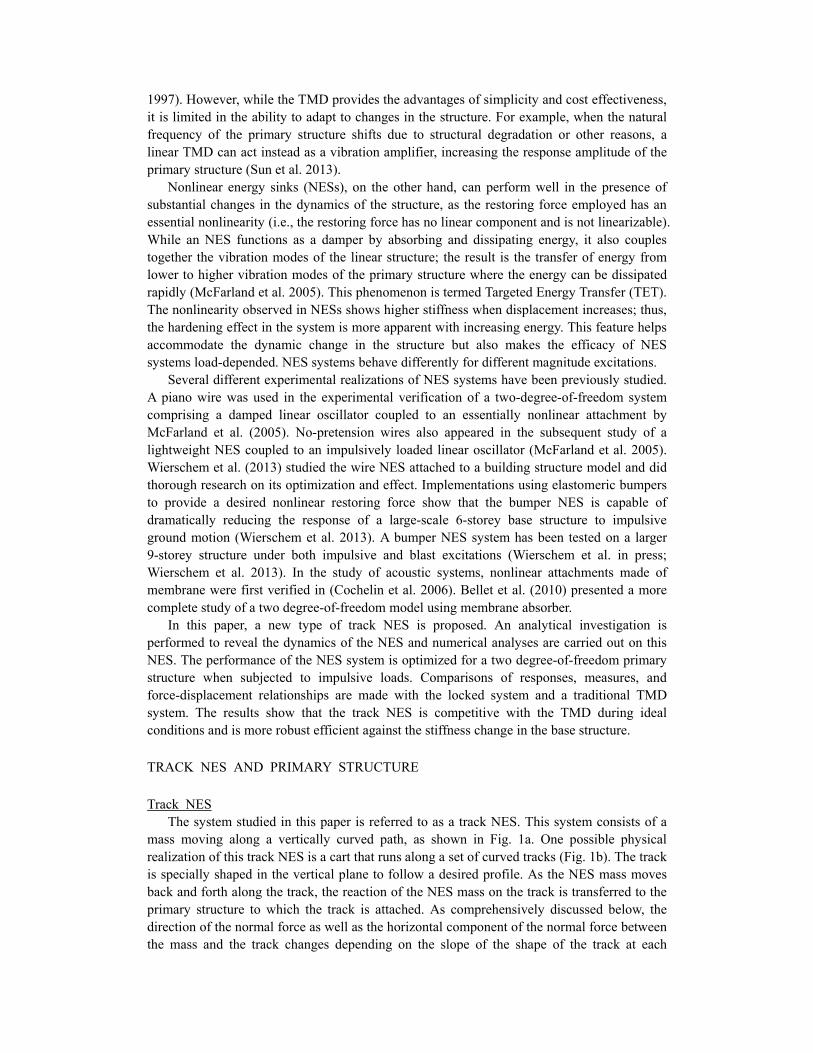
Fig. 2. Free body diagram of track NES
Fig. 2 shows the free body diagram of the NES mass. Nm
is the mass of NES. Nu and
Nv are the relative horizontal and vertical displacement of the NES to the track, respectively. z is the displacement of the track. ( )Nh u
is the shape of the track and defines the
relationship between the horizontal and vertical displacement of the NES mass. NF is the normal force between NES and track. θ is the angle of the track normal which is defined as a function of the track shape,
( )Nh u . g is the vertical acceleration due to gravity. The EOM of track NES is derived from energy perspective. The Lagrange’s approach
(Roy R. Craig and Andrew J. Kurdila 2006) is applied to seek out kinetic energy (2) and potential energy (3) separately. The EOM is formulated by assembling those two energy equations into the Lagrange’s equation (1).
Nu
Nv
( )Nh u
θ
z
Nm g
NF
o
(a) (b)
( )ii i i
d T T Vp t
dt q q q
∂ ∂ ∂− + =∂ ∂ ∂
(1)
In this formulation, damping is neglected and no external force on the NES is considered;
thus, no non-conservative force term is included in the equation.
( )2 2N N N N
1 1
2 2T m u z m v= + + (2)
( )N NV m gh u= (3)
Also, with the following relation,
( )N Nv h u=
(4)
Expand each term in (2) and (3).
( )N N NN N N
T dh dhm u z m u
u du du
∂ = + +∂
(5)
( )2 2
2N N N N N N2
N N N N
2d T dh dh d h
m u z m u m udt u du du du
∂ = + + + ∂
(6)
22
N N2N N N
T dh d hm u
u du du
∂ =∂
(7)
NN N
V dhm g
u du
∂ =∂
(8)
After combining like terms and dropping Nm in each term, the final expression of the
EOM for the NES mass is
( )( ) ( ) ( ) ( )2 2N N N N N N1 h u u h u h u u h u g z′ ′ ′′ ′+ ⋅ + ⋅ + = − (9)
Primary Structure
The linear model being used throughout the paper is a two degree-of-freedom shear building and is supposed to move only uniaxially. The mass is 24.3kg and 24.2kg and the stiffness is 6820N/m and 8220N/m for the first and second floors respectively. Their matrix
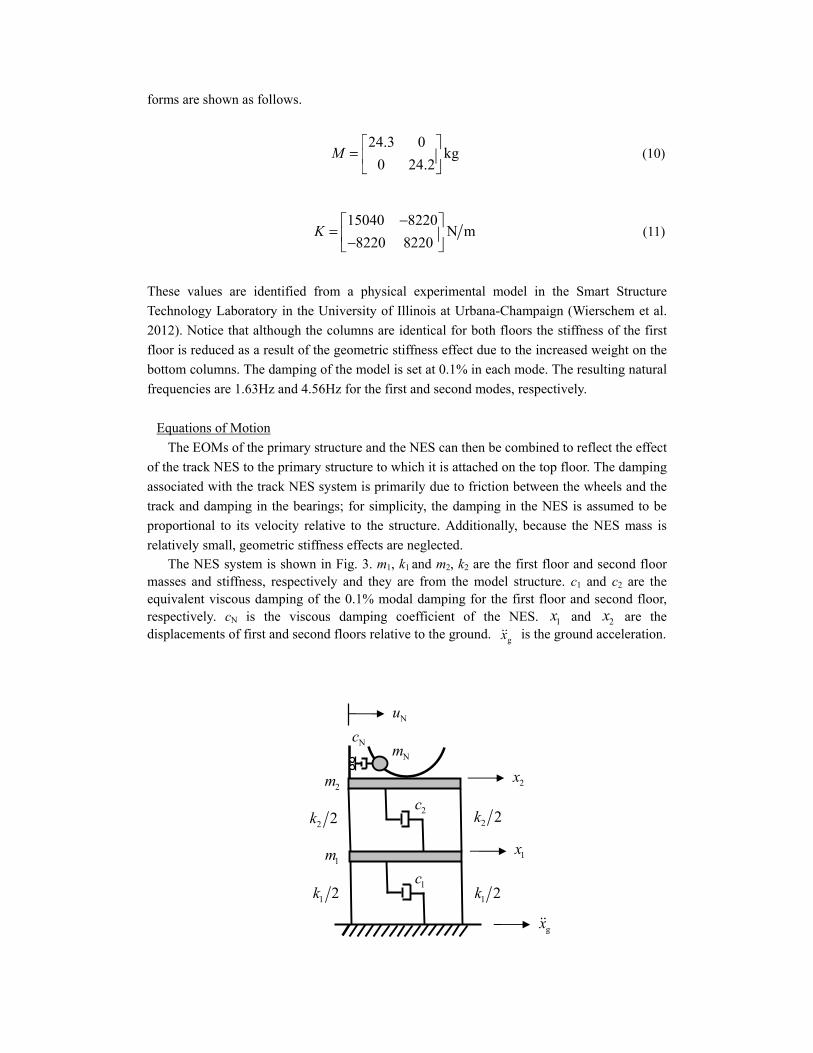
forms are shown as follows.
24.3 0
kg0 24.2
M
=
(10)
15040 8220
N m8220 8220
K−
= − (11)
These values are identified from a physical experimental model in the Smart Structure
Technology Laboratory in the University of Illinois at Urbana-Champaign (Wierschem et al.
2012). Notice that although the columns are identical for both floors the stiffness of the first
floor is reduced as a result of the geometric stiffness effect due to the increased weight on the
bottom columns. The damping of the model is set at 0.1% in each mode. The resulting natural
frequencies are 1.63Hz and 4.56Hz for the first and second modes, respectively.
Equations of Motion
The EOMs of the primary structure and the NES can then be combined to reflect the effect
of the track NES to the primary structure to which it is attached on the top floor. The damping
associated with the track NES system is primarily due to friction between the wheels and the
track and damping in the bearings; for simplicity, the damping in the NES is assumed to be
proportional to its velocity relative to the structure. Additionally, because the NES mass is
relatively small, geometric stiffness effects are neglected. The NES system is shown in Fig. 3. m1, k1 and m2, k2 are the first floor and second floor
masses and stiffness, respectively and they are from the model structure. c1 and c2 are the equivalent viscous damping of the 0.1% modal damping for the first floor and second floor, respectively. cN is the viscous damping coefficient of the NES. 1x and 2x are the displacements of first and second floors relative to the ground. gx is the ground acceleration.
1m
2m
NmNc
2c
1c1 2k 1 2k
2 2k 2 2k
Nu
2x
1x
gx
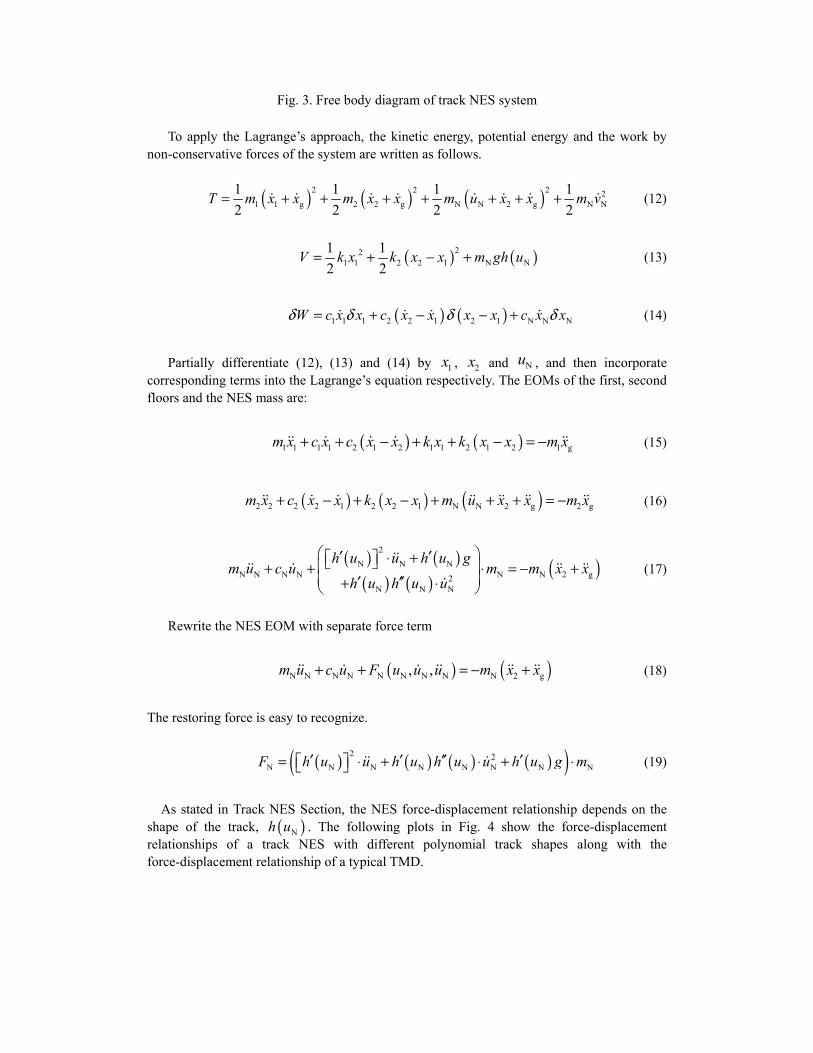
Fig. 3. Free body diagram of track NES system
To apply the Lagrange’s approach, the kinetic energy, potential energy and the work by non-conservative forces of the system are written as follows.
( ) ( ) ( )2 2 2 21 1 g 2 2 g N N 2 g N N
1 1 1 1
2 2 2 2T m x x m x x m u x x m v= + + + + + + +
(12)
( ) ( )221 1 2 2 1 N N
1 1
2 2V k x k x x m gh u= + − +
(13)
( ) ( )1 1 1 2 2 1 2 1 N N NW c x x c x x x x c x xδ δ δ δ= + − − +
(14)
Partially differentiate (12), (13) and (14) by 1x , 2x and Nu , and then incorporate
corresponding terms into the Lagrange’s equation respectively. The EOMs of the first, second floors and the NES mass are:
( ) ( )1 1 1 1 2 1 2 1 1 2 1 2 1 gm x c x c x x k x k x x m x+ + − + + − = −
(15)
( ) ( ) ( )2 2 2 2 1 2 2 1 N N 2 g 2 gm x c x x k x x m u x x m x+ − + − + + + = −
(16)
( ) ( )( ) ( )
( )2
N N NN N N N N N 2 g2
N N N
h u u h u gm u c u m m x x
h u h u u
′ ′⋅ + + + ⋅ = − + ′ ′′+ ⋅
(17)
Rewrite the NES EOM with separate force term
( ) ( )N N N N N N N N N 2 g, ,m u c u F u u u m x x+ + = − +
(18)
The restoring force is easy to recognize.
( ) ( ) ( ) ( )( )2 2N N N N N N N NF h u u h u h u u h u g m′ ′ ′′ ′= ⋅ + ⋅ + ⋅
(19)
As stated in Track NES Section, the NES force-displacement relationship depends on the
shape of the track, ( )Nh u . The following plots in Fig. 4 show the force-displacement
relationships of a track NES with different polynomial track shapes along with the force-displacement relationship of a typical TMD.
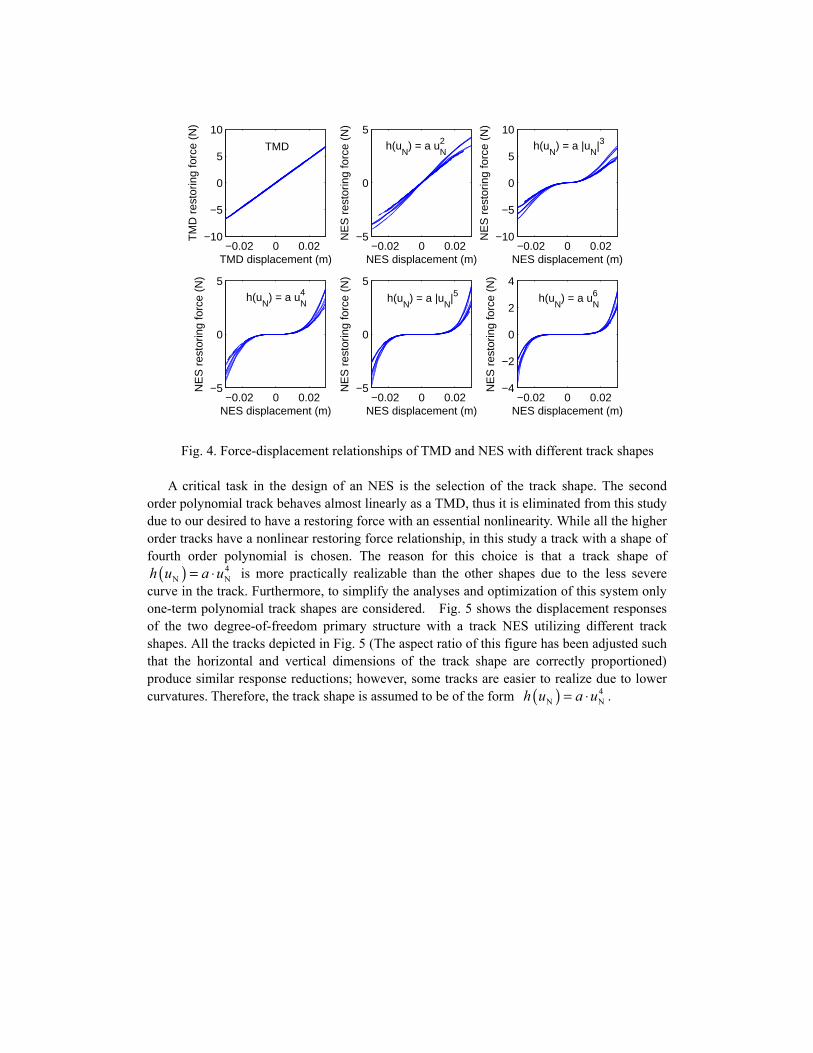
Fig. 4. Force-displacement relationships of TMD and NES with different track shapes
A critical task in the design of an NES is the selection of the track shape. The second order polynomial track behaves almost linearly as a TMD, thus it is eliminated from this study due to our desired to have a restoring force with an essential nonlinearity. While all the higher order tracks have a nonlinear restoring force relationship, in this study a track with a shape of fourth order polynomial is chosen. The reason for this choice is that a track shape of
( ) 4N Nh u a u= ⋅ is more practically realizable than the other shapes due to the less severe
curve in the track. Furthermore, to simplify the analyses and optimization of this system only one-term polynomial track shapes are considered. Fig. 5 shows the displacement responses of the two degree-of-freedom primary structure with a track NES utilizing different track shapes. All the tracks depicted in Fig. 5 (The aspect ratio of this figure has been adjusted such that the horizontal and vertical dimensions of the track shape are correctly proportioned) produce similar response reductions; however, some tracks are easier to realize due to lower curvatures. Therefore, the track shape is assumed to be of the form ( ) 4
N Nh u a u= ⋅ .
−0.02 0 0.02−10
−5
0
5
10
TMD displacement (m)
TM
D r
esto
ring
forc
e (N
)
TMD
−0.02 0 0.02−5
0
5
NES displacement (m)
NE
S r
esto
ring
forc
e (N
)
h(uN
) = a uN2
−0.02 0 0.02−10
−5
0
5
10
NES displacement (m)
NE
S r
esto
ring
forc
e (N
)
h(uN
) = a |uN
|3
−0.02 0 0.02−5
0
5
NES displacement (m)
NE
S r
esto
ring
forc
e (N
)
h(uN
) = a uN4
−0.02 0 0.02−5
0
5
NES displacement (m)
NE
S r
esto
ring
forc
e (N
)
h(uN
) = a |uN
|5
−0.02 0 0.02−4
−2
0
2
4
NES displacement (m)
NE
S r
esto
ring
forc
e (N
)
h(uN
) = a uN6
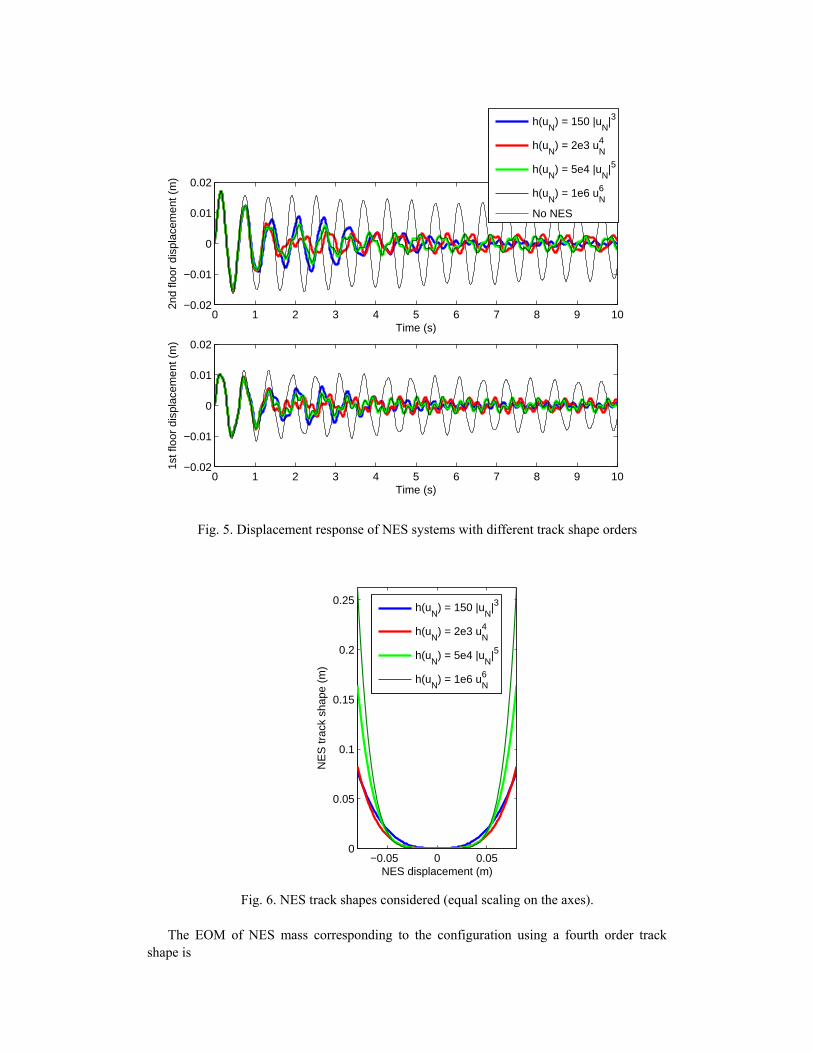
Fig. 5. Displacement response of NES systems with different track shape orders
Fig. 6. NES track shapes considered (equal scaling on the axes).
The EOM of NES mass corresponding to the configuration using a fourth order track
shape is
−0.05 0 0.050
0.05
0.1
0.15
0.2
0.25
NES displacement (m)
NE
S tr
ack
shap
e (m
)
h(uN
) = 150 |uN
|3
h(uN
) = 2e3 uN4
h(uN
) = 5e4 |uN
|5
h(uN
) = 1e6 uN6
0 1 2 3 4 5 6 7 8 9 10−0.02
−0.01
0
0.01
0.02
Time (s)
2nd
floor
dis
plac
emen
t (m
)
h(uN
) = 150 |uN
|3
h(uN
) = 2e3 uN4
h(uN
) = 5e4 |uN
|5
h(uN
) = 1e6 uN6
No NES
0 1 2 3 4 5 6 7 8 9 10−0.02
−0.01
0
0.01
0.02
Time (s)
1st f
loor
dis
plac
emen
t (m
)
( ) ( )2 6 2 5 2 3N N N N N N N N N N N 2 g16 48 4m u c u a u u a u u au g m m x x+ + + + ⋅ = − + (20)
where a is the coefficient in the track shape ( ) 4
N Nh u a u= ⋅ . OPTIMIZATION Performance Measures
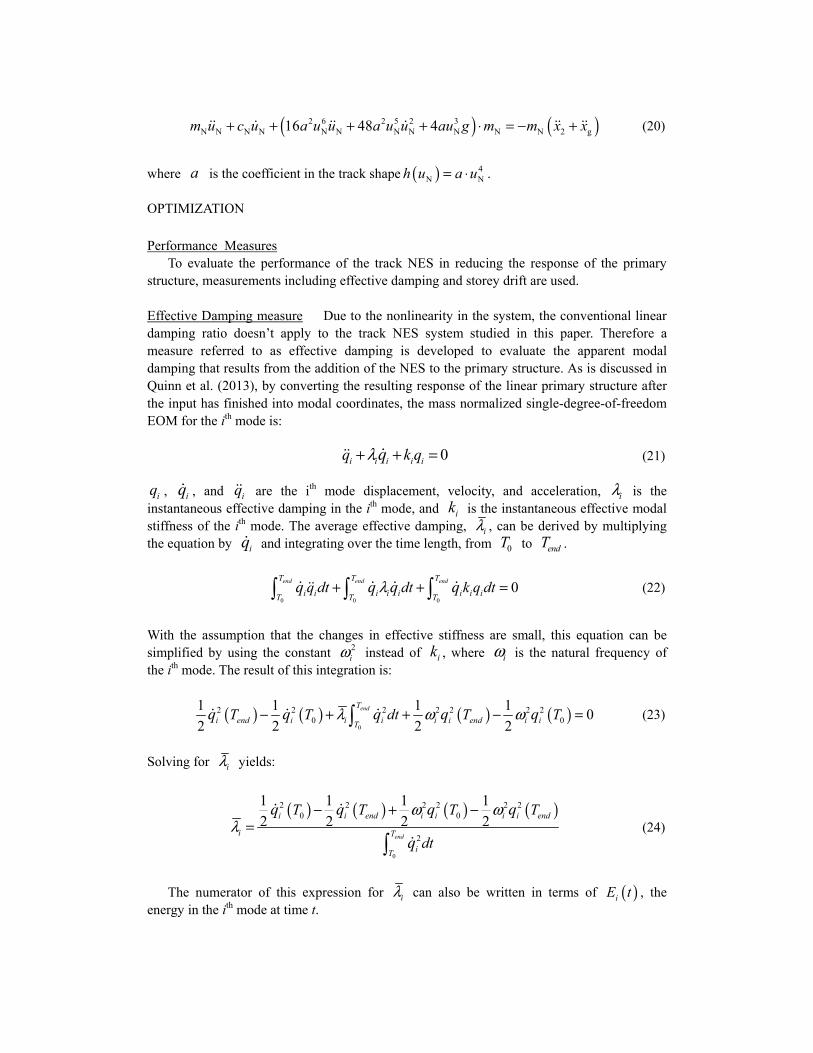
To evaluate the performance of the track NES in reducing the response of the primary structure, measurements including effective damping and storey drift are used. Effective Damping measure Due to the nonlinearity in the system, the conventional linear damping ratio doesn’t apply to the track NES system studied in this paper. Therefore a measure referred to as effective damping is developed to evaluate the apparent modal damping that results from the addition of the NES to the primary structure. As is discussed in Quinn et al. (2013), by converting the resulting response of the linear primary structure after the input has finished into modal coordinates, the mass normalized single-degree-of-freedom EOM for the ith mode is:
0i i i i iq k qqλ+ + = (21)
iq , iq , and iq are the ith mode displacement, velocity, and acceleration, iλ is the instantaneous effective damping in the ith mode, and ik is the instantaneous effective modal stiffness of the ith mode. The average effective damping, iλ , can be derived by multiplying the equation by iq and integrating over the time length, from 0T to endT .
0 0 0
0end end endT T T
i i i i i i i iT T Tq dt dt k q dtq q q qλ+ + = (22)
With the assumption that the changes in effective stiffness are small, this equation can be simplified by using the constant 2
iω instead of ik , where iω is the natural frequency of the ith mode. The result of this integration is:
( ) ( ) ( ) ( )0
2 2 2 2 2 2 20 0
1 1 1 10
2 2 2 2
endT
i end i i i i i end i iTT T dt T Tq q q q qλ ω ω− + + − = (23)
Solving for iλ yields:
( ) ( ) ( ) ( )
0
2 2 2 2 2 20 0
2
1 1 1 1
2 2 2 2end
i i end i i i i end
i T
iT
T T T T
dt
q q q q
q
ω ωλ
− + −=
(24)
The numerator of this expression for iλ can also be written in terms of ( )iE t , the
energy in the ith mode at time t.
( ) ( )
0
0
2end
i i endi T
iT
E T E T
dtqλ
−=
(25)
Finally, the effective damping ratio can be obtained via the following expression:
2i
ii
λζ ω= (26)
The accumulated ratio measure, known as effective damping, is an integral of the entire
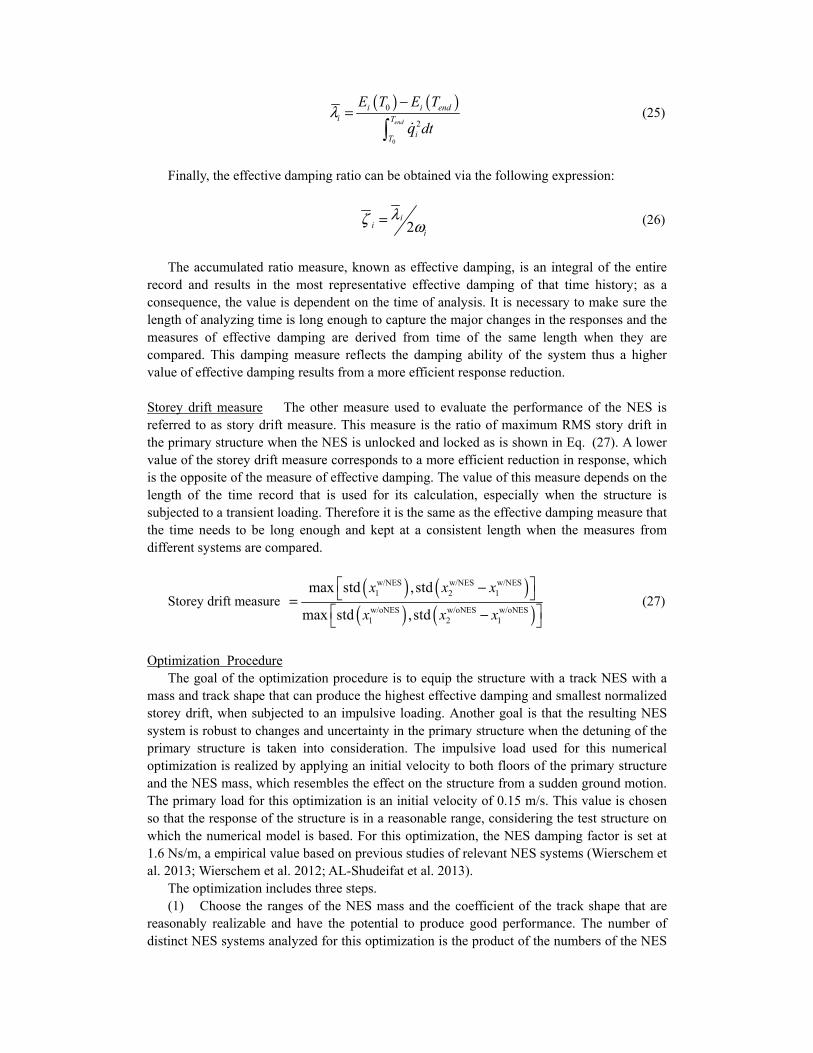
record and results in the most representative effective damping of that time history; as a consequence, the value is dependent on the time of analysis. It is necessary to make sure the length of analyzing time is long enough to capture the major changes in the responses and the measures of effective damping are derived from time of the same length when they are compared. This damping measure reflects the damping ability of the system thus a higher value of effective damping results from a more efficient response reduction. Storey drift measure The other measure used to evaluate the performance of the NES is referred to as story drift measure. This measure is the ratio of maximum RMS story drift in the primary structure when the NES is unlocked and locked as is shown in Eq. (27). A lower value of the storey drift measure corresponds to a more efficient reduction in response, which is the opposite of the measure of effective damping. The value of this measure depends on the length of the time record that is used for its calculation, especially when the structure is subjected to a transient loading. Therefore it is the same as the effective damping measure that the time needs to be long enough and kept at a consistent length when the measures from different systems are compared.
Storey drift measure ( ) ( )
( ) ( )w/NES w/NES w/NES1 2 1
w/oNES w/oNES w/oNES1 2 1
max std ,std
max std ,std
x x x
x x x
− = −
(27)
Optimization Procedure
The goal of the optimization procedure is to equip the structure with a track NES with a mass and track shape that can produce the highest effective damping and smallest normalized storey drift, when subjected to an impulsive loading. Another goal is that the resulting NES system is robust to changes and uncertainty in the primary structure when the detuning of the primary structure is taken into consideration. The impulsive load used for this numerical optimization is realized by applying an initial velocity to both floors of the primary structure and the NES mass, which resembles the effect on the structure from a sudden ground motion. The primary load for this optimization is an initial velocity of 0.15 m/s. This value is chosen so that the response of the structure is in a reasonable range, considering the test structure on which the numerical model is based. For this optimization, the NES damping factor is set at 1.6 Ns/m, a empirical value based on previous studies of relevant NES systems (Wierschem et al. 2013; Wierschem et al. 2012; AL-Shudeifat et al. 2013).
The optimization includes three steps. (1) Choose the ranges of the NES mass and the coefficient of the track shape that are
reasonably realizable and have the potential to produce good performance. The number of distinct NES systems analyzed for this optimization is the product of the numbers of the NES
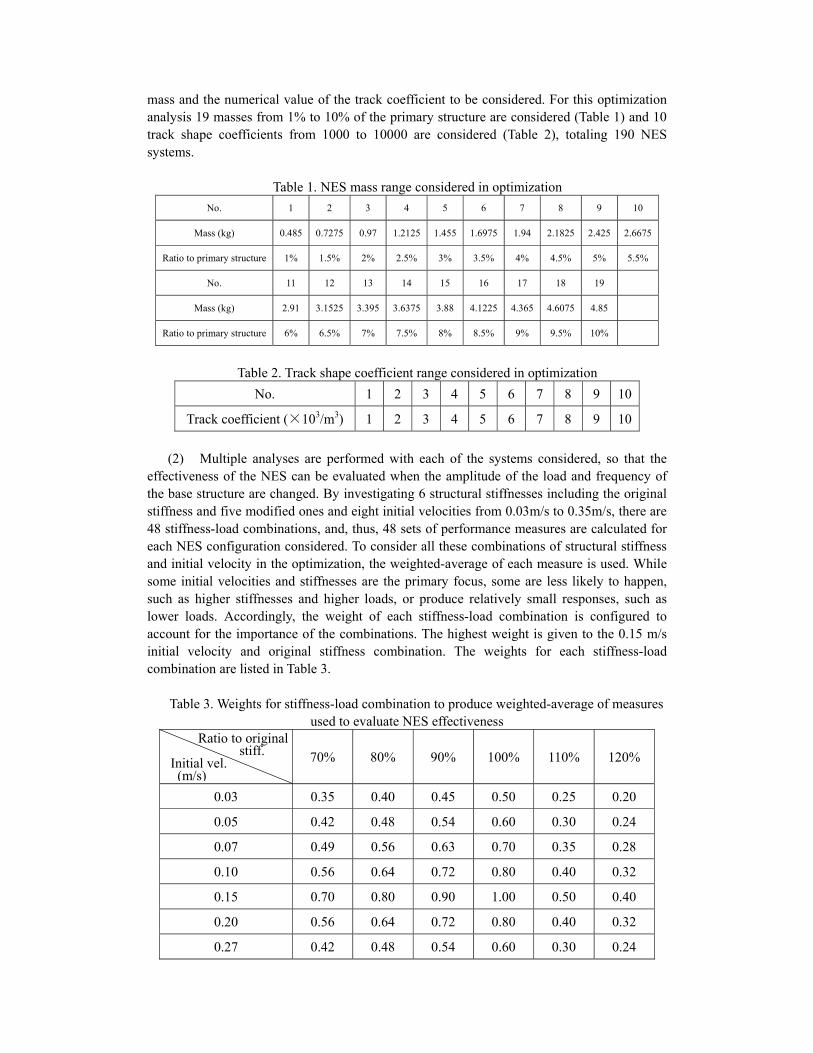
mass and the numerical value of the track coefficient to be considered. For this optimization analysis 19 masses from 1% to 10% of the primary structure are considered (Table 1) and 10 track shape coefficients from 1000 to 10000 are considered (Table 2), totaling 190 NES systems.
Table 1. NES mass range considered in optimization
No. 1 2 3 4 5 6 7 8 9 10
Mass (kg) 0.485 0.7275 0.97 1.2125 1.455 1.6975 1.94 2.1825 2.425 2.6675
Ratio to primary structure 1% 1.5% 2% 2.5% 3% 3.5% 4% 4.5% 5% 5.5%
No. 11 12 13 14 15 16 17 18 19
Mass (kg) 2.91 3.1525 3.395 3.6375 3.88 4.1225 4.365 4.6075 4.85
Ratio to primary structure 6% 6.5% 7% 7.5% 8% 8.5% 9% 9.5% 10%
Table 2. Track shape coefficient range considered in optimization
No. 1 2 3 4 5 6 7 8 9 10
Track coefficient (×103/m3) 1 2 3 4 5 6 7 8 9 10
(2) Multiple analyses are performed with each of the systems considered, so that the
effectiveness of the NES can be evaluated when the amplitude of the load and frequency of the base structure are changed. By investigating 6 structural stiffnesses including the original stiffness and five modified ones and eight initial velocities from 0.03m/s to 0.35m/s, there are 48 stiffness-load combinations, and, thus, 48 sets of performance measures are calculated for each NES configuration considered. To consider all these combinations of structural stiffness and initial velocity in the optimization, the weighted-average of each measure is used. While some initial velocities and stiffnesses are the primary focus, some are less likely to happen, such as higher stiffnesses and higher loads, or produce relatively small responses, such as lower loads. Accordingly, the weight of each stiffness-load combination is configured to account for the importance of the combinations. The highest weight is given to the 0.15 m/s initial velocity and original stiffness combination. The weights for each stiffness-load combination are listed in Table 3.
Table 3. Weights for stiffness-load combination to produce weighted-average of measures used to evaluate NES effectiveness
70% 80% 90% 100% 110% 120%
0.03 0.35 0.40 0.45 0.50 0.25 0.20
0.05 0.42 0.48 0.54 0.60 0.30 0.24
0.07 0.49 0.56 0.63 0.70 0.35 0.28
0.10 0.56 0.64 0.72 0.80 0.40 0.32
0.15 0.70 0.80 0.90 1.00 0.50 0.40
0.20 0.56 0.64 0.72 0.80 0.40 0.32
0.27 0.42 0.48 0.54 0.60 0.30 0.24
Ratio to original stiff.
Initial vel. (m/s)
0.32 0.35 0.40 0.45 0.50 0.25 0.20
(3) After running analyses over all those NES systems, the NES mass and the track
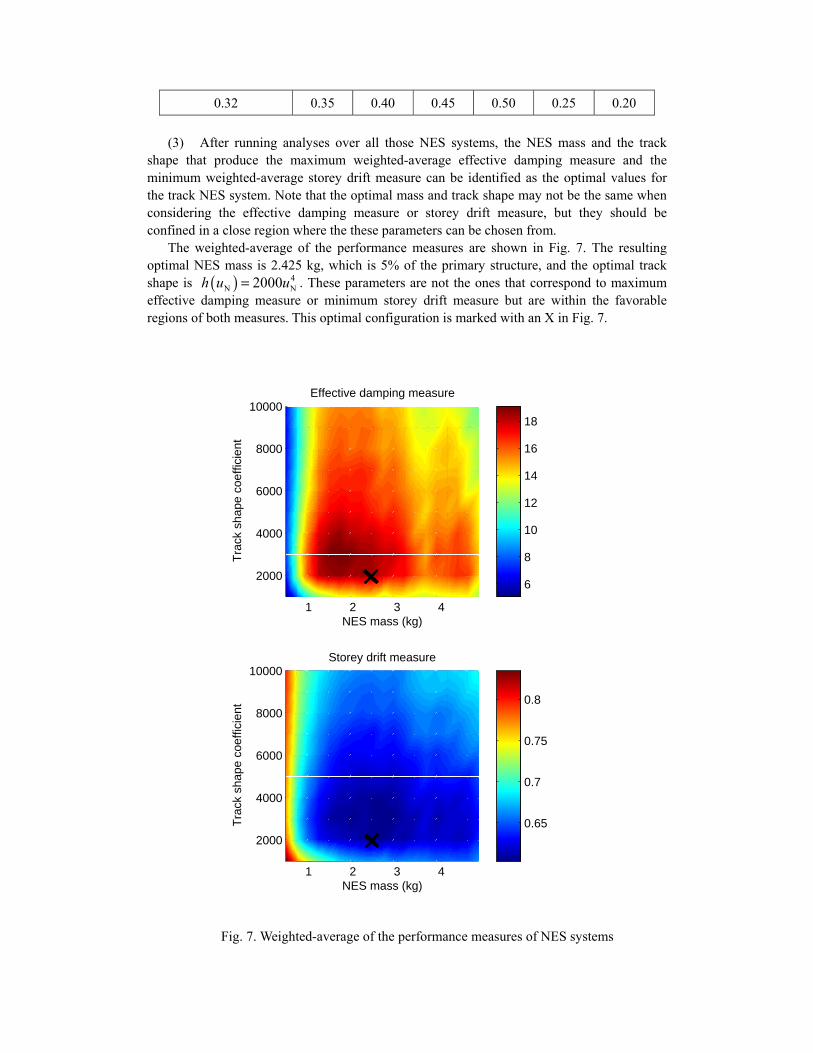
shape that produce the maximum weighted-average effective damping measure and the minimum weighted-average storey drift measure can be identified as the optimal values for the track NES system. Note that the optimal mass and track shape may not be the same when considering the effective damping measure or storey drift measure, but they should be confined in a close region where the these parameters can be chosen from.
The weighted-average of the performance measures are shown in Fig. 7. The resulting optimal NES mass is 2.425 kg, which is 5% of the primary structure, and the optimal track shape is ( ) 4
N N2000h u u= . These parameters are not the ones that correspond to maximum effective damping measure or minimum storey drift measure but are within the favorable regions of both measures. This optimal configuration is marked with an X in Fig. 7.
Fig. 7. Weighted-average of the performance measures of NES systems
1 2 3 4
2000
4000
6000
8000
10000
NES mass (kg)
Effective damping measure
Tra
ck s
hape
coe
ffici
ent
1 2 3 4
2000
4000
6000
8000
10000
NES mass (kg)
Storey drift measure
Tra
ck s
hape
coe
ffici
ent
6
8
10
12
14
16
18
0.65
0.7
0.75
0.8
COMPARISON
To evaluate the effectiveness of the optimized track NES system, the response of the NES system is compared to the response of the primary structure with the NES locked and a traditional TMD system. When NES is locked the system remains linear with the mass of NES added to the top floor. TMD System
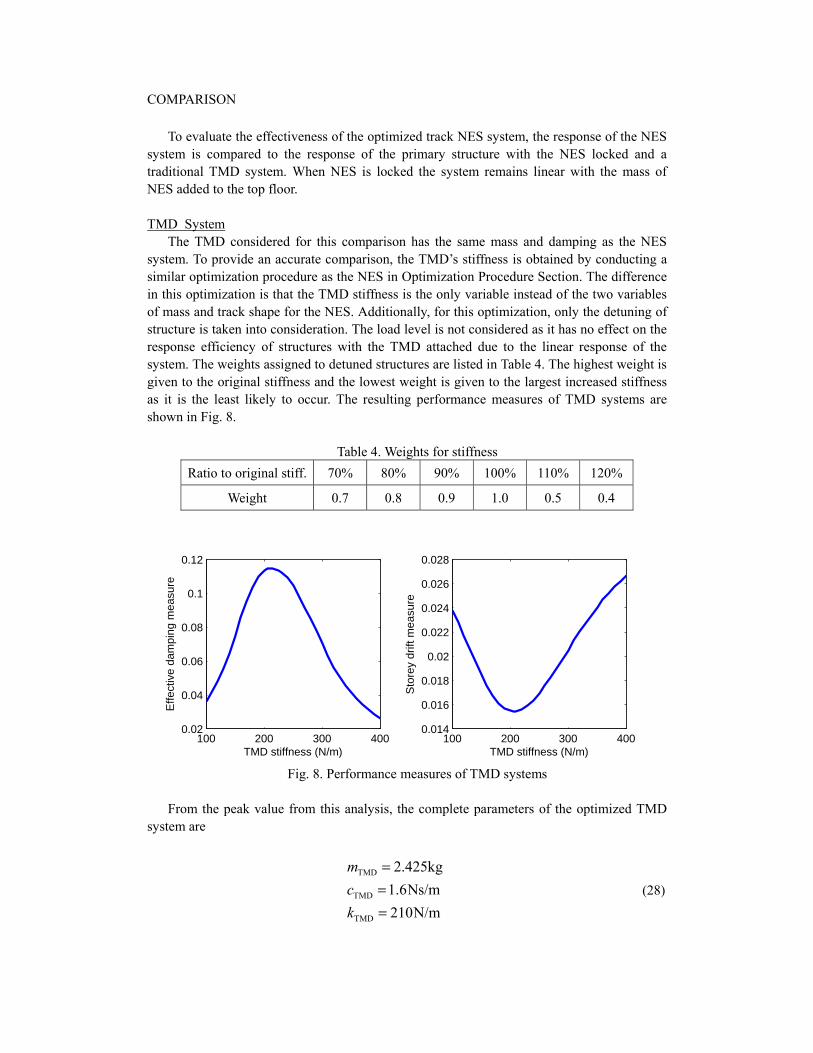
The TMD considered for this comparison has the same mass and damping as the NES system. To provide an accurate comparison, the TMD’s stiffness is obtained by conducting a similar optimization procedure as the NES in Optimization Procedure Section. The difference in this optimization is that the TMD stiffness is the only variable instead of the two variables of mass and track shape for the NES. Additionally, for this optimization, only the detuning of structure is taken into consideration. The load level is not considered as it has no effect on the response efficiency of structures with the TMD attached due to the linear response of the system. The weights assigned to detuned structures are listed in Table 4. The highest weight is given to the original stiffness and the lowest weight is given to the largest increased stiffness as it is the least likely to occur. The resulting performance measures of TMD systems are shown in Fig. 8.
Table 4. Weights for stiffness
Ratio to original stiff. 70% 80% 90% 100% 110% 120%
Weight 0.7 0.8 0.9 1.0 0.5 0.4
Fig. 8. Performance measures of TMD systems
From the peak value from this analysis, the complete parameters of the optimized TMD
system are
TMD
TMD
TMD
2.425kg
1.6Ns/m
210N/m
m
c
k
===
(28)
100 200 300 4000.02
0.04
0.06
0.08
0.1
0.12
TMD stiffness (N/m)
Effe
ctiv
e da
mpi
ng m
easu
re
100 200 300 4000.014
0.016
0.018
0.02
0.022
0.024
0.026
0.028
TMD stiffness (N/m)
Sto
rey
drift
mea
sure
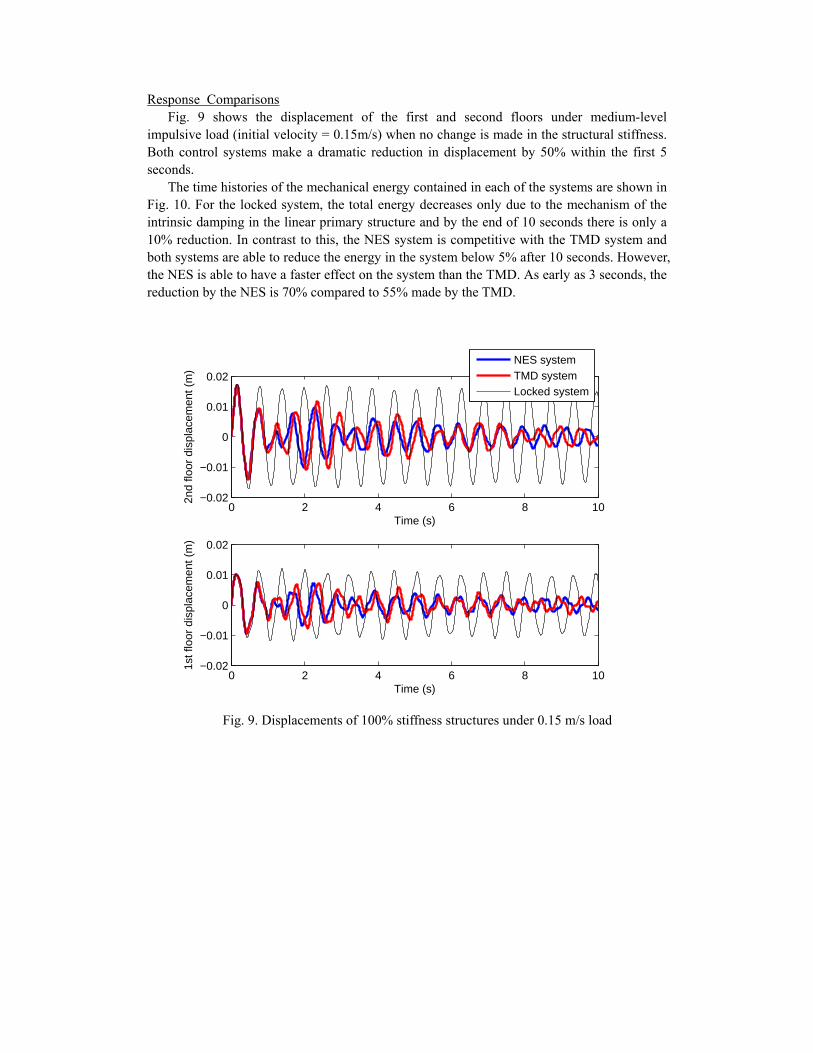
Response Comparisons Fig. 9 shows the displacement of the first and second floors under medium-level
impulsive load (initial velocity = 0.15m/s) when no change is made in the structural stiffness. Both control systems make a dramatic reduction in displacement by 50% within the first 5 seconds.
The time histories of the mechanical energy contained in each of the systems are shown in Fig. 10. For the locked system, the total energy decreases only due to the mechanism of the intrinsic damping in the linear primary structure and by the end of 10 seconds there is only a 10% reduction. In contrast to this, the NES system is competitive with the TMD system and both systems are able to reduce the energy in the system below 5% after 10 seconds. However, the NES is able to have a faster effect on the system than the TMD. As early as 3 seconds, the reduction by the NES is 70% compared to 55% made by the TMD.
Fig. 9. Displacements of 100% stiffness structures under 0.15 m/s load
0 2 4 6 8 10−0.02
−0.01
0
0.01
0.02
Time (s)
2nd
floor
dis
plac
emen
t (m
)
NES systemTMD systemLocked system
0 2 4 6 8 10−0.02
−0.01
0
0.01
0.02
Time (s)
1st f
loor
dis
plac
emen
t (m
)
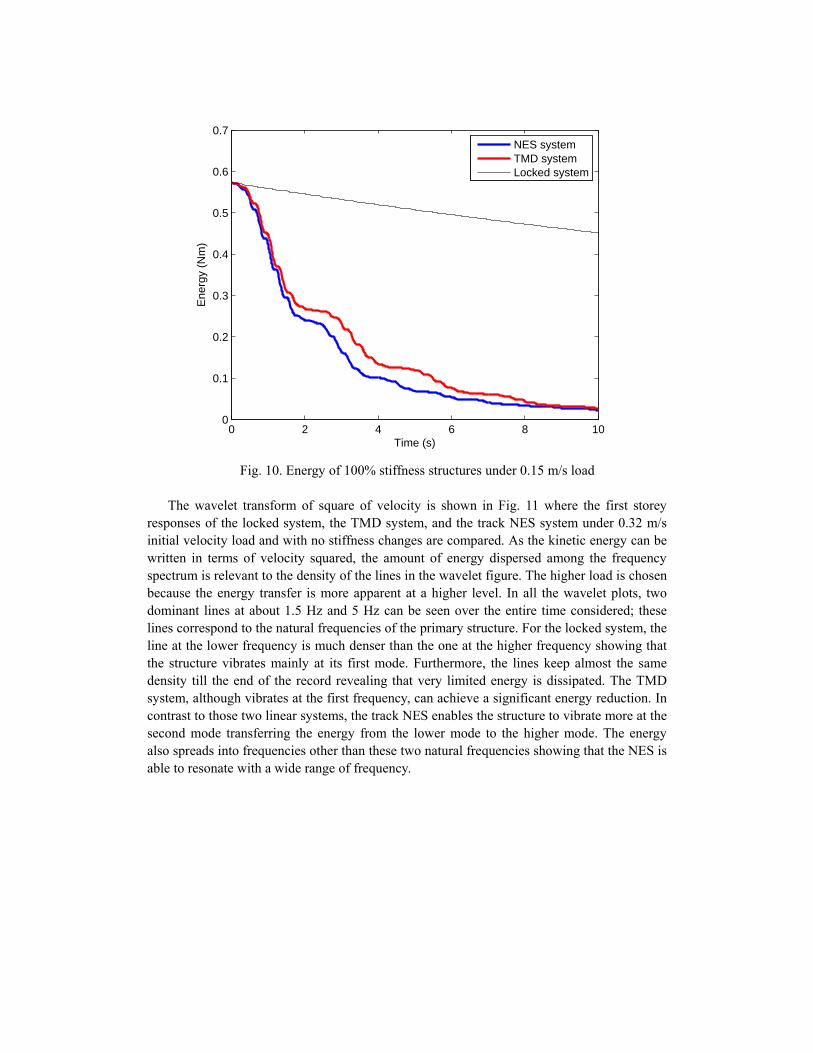
Fig. 10. Energy of 100% stiffness structures under 0.15 m/s load
The wavelet transform of square of velocity is shown in Fig. 11 where the first storey
responses of the locked system, the TMD system, and the track NES system under 0.32 m/s initial velocity load and with no stiffness changes are compared. As the kinetic energy can be written in terms of velocity squared, the amount of energy dispersed among the frequency spectrum is relevant to the density of the lines in the wavelet figure. The higher load is chosen because the energy transfer is more apparent at a higher level. In all the wavelet plots, two dominant lines at about 1.5 Hz and 5 Hz can be seen over the entire time considered; these lines correspond to the natural frequencies of the primary structure. For the locked system, the line at the lower frequency is much denser than the one at the higher frequency showing that the structure vibrates mainly at its first mode. Furthermore, the lines keep almost the same density till the end of the record revealing that very limited energy is dissipated. The TMD system, although vibrates at the first frequency, can achieve a significant energy reduction. In contrast to those two linear systems, the track NES enables the structure to vibrate more at the second mode transferring the energy from the lower mode to the higher mode. The energy also spreads into frequencies other than these two natural frequencies showing that the NES is able to resonate with a wide range of frequency.
0 2 4 6 8 100
0.1
0.2
0.3
0.4
0.5
0.6
0.7
Time (s)
Ene
rgy
(Nm
)
NES systemTMD systemLocked system
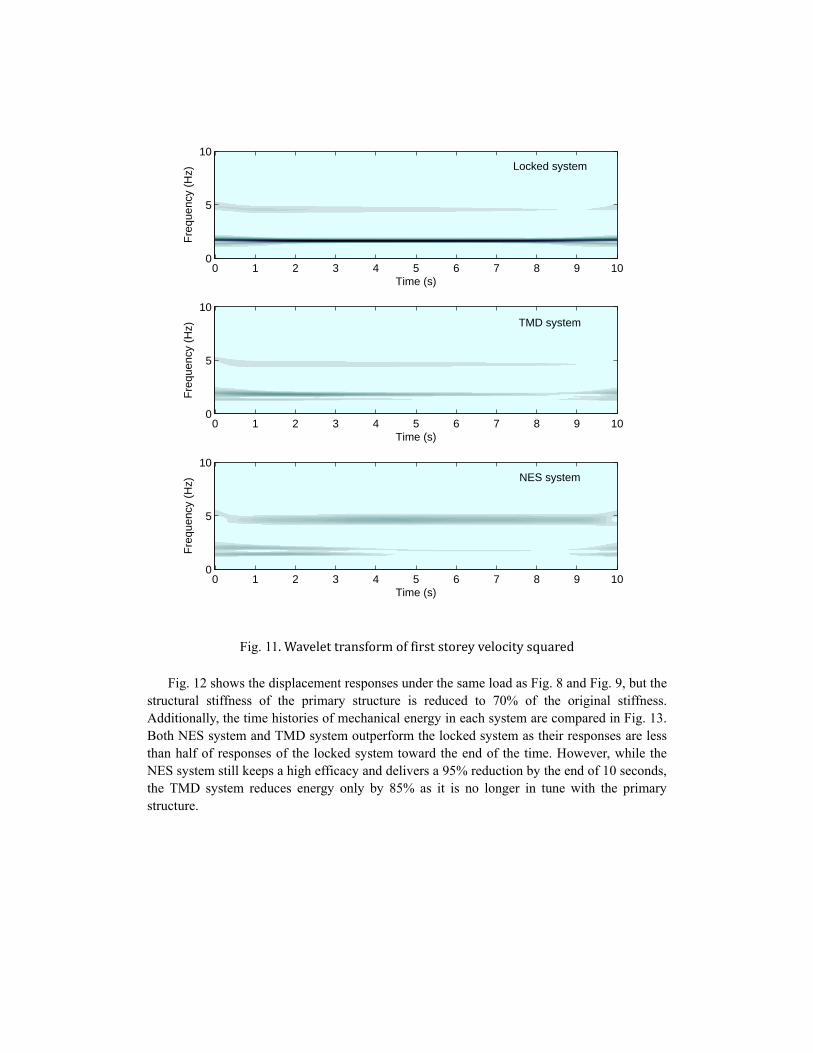
Fig. 11. Wavelet transform of first storey velocity squared
Fig. 12 shows the displacement responses under the same load as Fig. 8 and Fig. 9, but the structural stiffness of the primary structure is reduced to 70% of the original stiffness. Additionally, the time histories of mechanical energy in each system are compared in Fig. 13. Both NES system and TMD system outperform the locked system as their responses are less than half of responses of the locked system toward the end of the time. However, while the NES system still keeps a high efficacy and delivers a 95% reduction by the end of 10 seconds, the TMD system reduces energy only by 85% as it is no longer in tune with the primary structure.
Time (s)
Fre
quen
cy (
Hz)
0 1 2 3 4 5 6 7 8 9 100
5
10
Time (s)
Fre
quen
cy (
Hz)
0 1 2 3 4 5 6 7 8 9 100
5
10
Time (s)
Fre
quen
cy (
Hz)
0 1 2 3 4 5 6 7 8 9 100
5
10
Locked system
NES system
TMD system
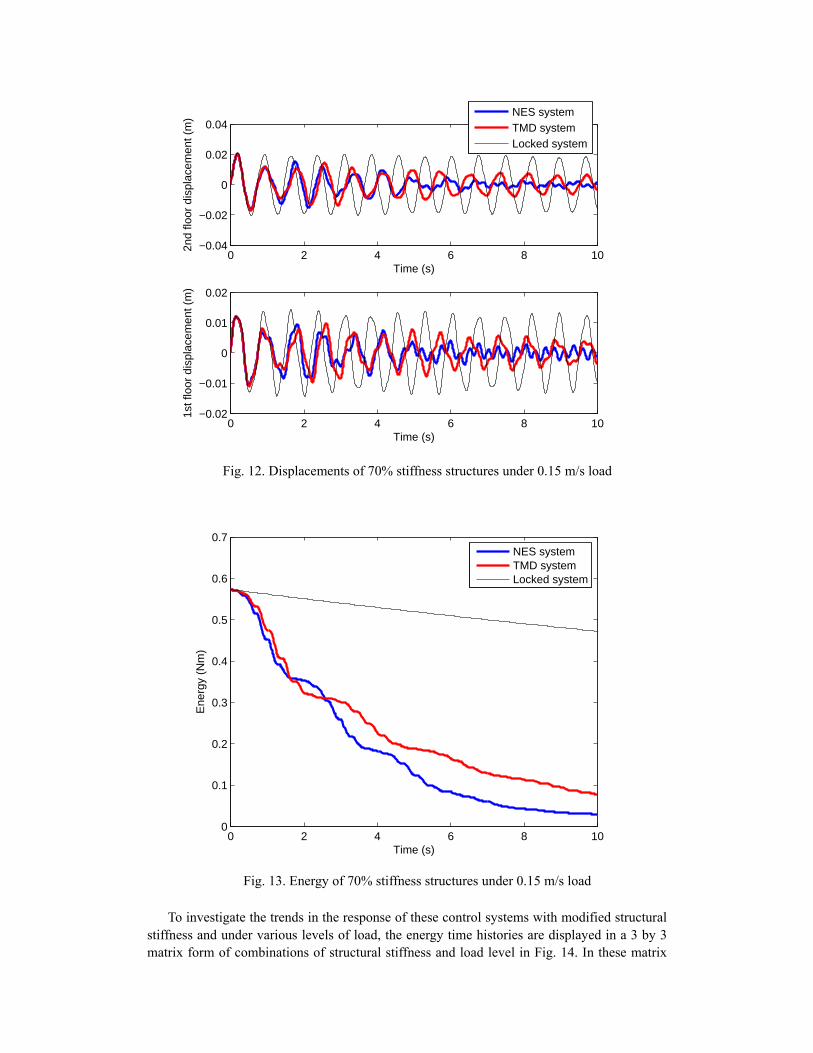
Fig. 12. Displacements of 70% stiffness structures under 0.15 m/s load
Fig. 13. Energy of 70% stiffness structures under 0.15 m/s load
To investigate the trends in the response of these control systems with modified structural stiffness and under various levels of load, the energy time histories are displayed in a 3 by 3 matrix form of combinations of structural stiffness and load level in Fig. 14. In these matrix
0 2 4 6 8 100
0.1
0.2
0.3
0.4
0.5
0.6
0.7
Time (s)
Ene
rgy
(Nm
)
NES systemTMD systemLocked system
0 2 4 6 8 10−0.04
−0.02
0
0.02
0.04
Time (s)
2nd
floor
dis
plac
emen
t (m
)
NES systemTMD systemLocked system
0 2 4 6 8 10−0.02
−0.01
0
0.01
0.02
Time (s)
1st f
loor
dis
plac
emen
t (m
)
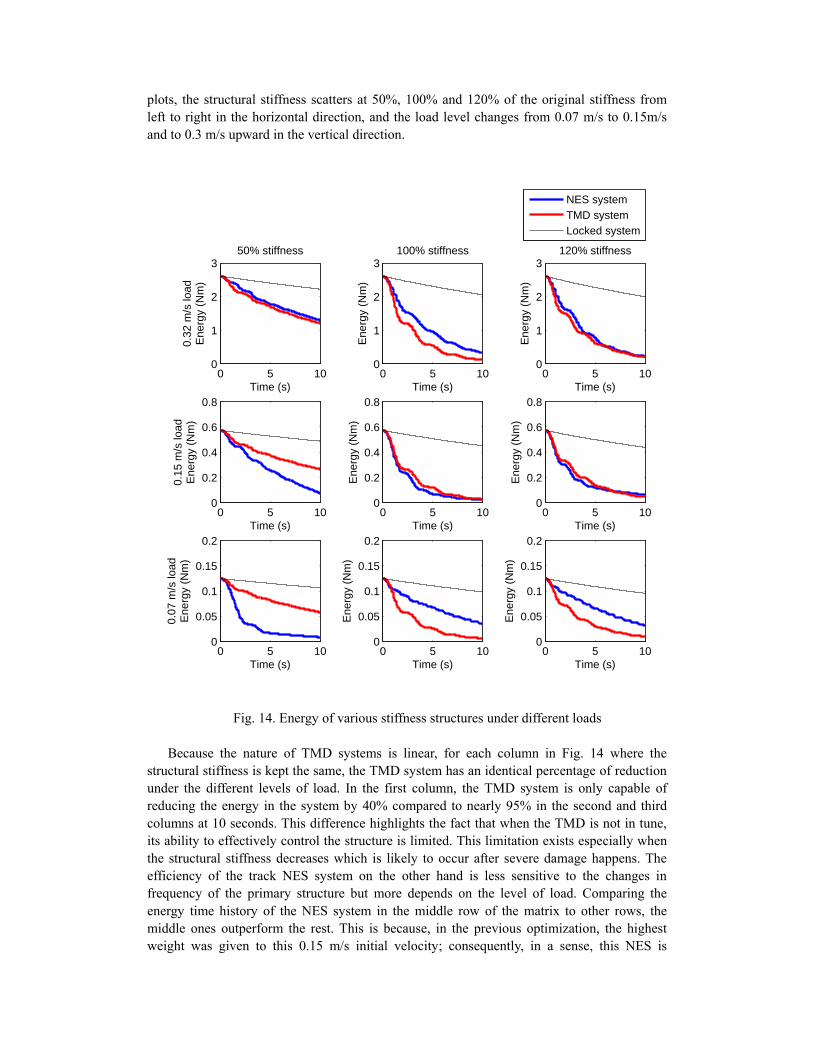
plots, the structural stiffness scatters at 50%, 100% and 120% of the original stiffness from left to right in the horizontal direction, and the load level changes from 0.07 m/s to 0.15m/s and to 0.3 m/s upward in the vertical direction.
Fig. 14. Energy of various stiffness structures under different loads
Because the nature of TMD systems is linear, for each column in Fig. 14 where the
structural stiffness is kept the same, the TMD system has an identical percentage of reduction under the different levels of load. In the first column, the TMD system is only capable of reducing the energy in the system by 40% compared to nearly 95% in the second and third columns at 10 seconds. This difference highlights the fact that when the TMD is not in tune, its ability to effectively control the structure is limited. This limitation exists especially when the structural stiffness decreases which is likely to occur after severe damage happens. The efficiency of the track NES system on the other hand is less sensitive to the changes in frequency of the primary structure but more depends on the level of load. Comparing the energy time history of the NES system in the middle row of the matrix to other rows, the middle ones outperform the rest. This is because, in the previous optimization, the highest weight was given to this 0.15 m/s initial velocity; consequently, in a sense, this NES is
0 5 100
1
2
3
Time (s)
0.32
m/s
load
Ene
rgy
(Nm
)
50% stiffness
0 5 100
0.2
0.4
0.6
0.8
Time (s)
0.15
m/s
load
Ene
rgy
(Nm
)
0 5 100
0.05
0.1
0.15
0.2
Time (s)
0.07
m/s
load
Ene
rgy
(Nm
)
0 5 100
1
2
3100% stiffness
Time (s)
Ene
rgy
(Nm
)
0 5 100
0.2
0.4
0.6
0.8
Time (s)
Ene
rgy
(Nm
)
0 5 100
0.05
0.1
0.15
0.2
Time (s)
Ene
rgy
(Nm
)
0 5 100
1
2
3
Time (s)
Ene
rgy
(Nm
)
120% stiffness
NES systemTMD systemLocked system
0 5 100
0.2
0.4
0.6
0.8
Time (s)E
nerg
y (N
m)
0 5 100
0.05
0.1
0.15
0.2
Time (s)
Ene
rgy
(Nm
)
designed for this specific load. In the upper row where the initial velocity increases, the NES system keeps nearly the same efficacy as the TMD system. In the lower row where the initial velocity decreases, the NES system outperforms the TMD system when the stiffness is reduced but underperforms the TMD system when the stiffness is increased or unchanged.
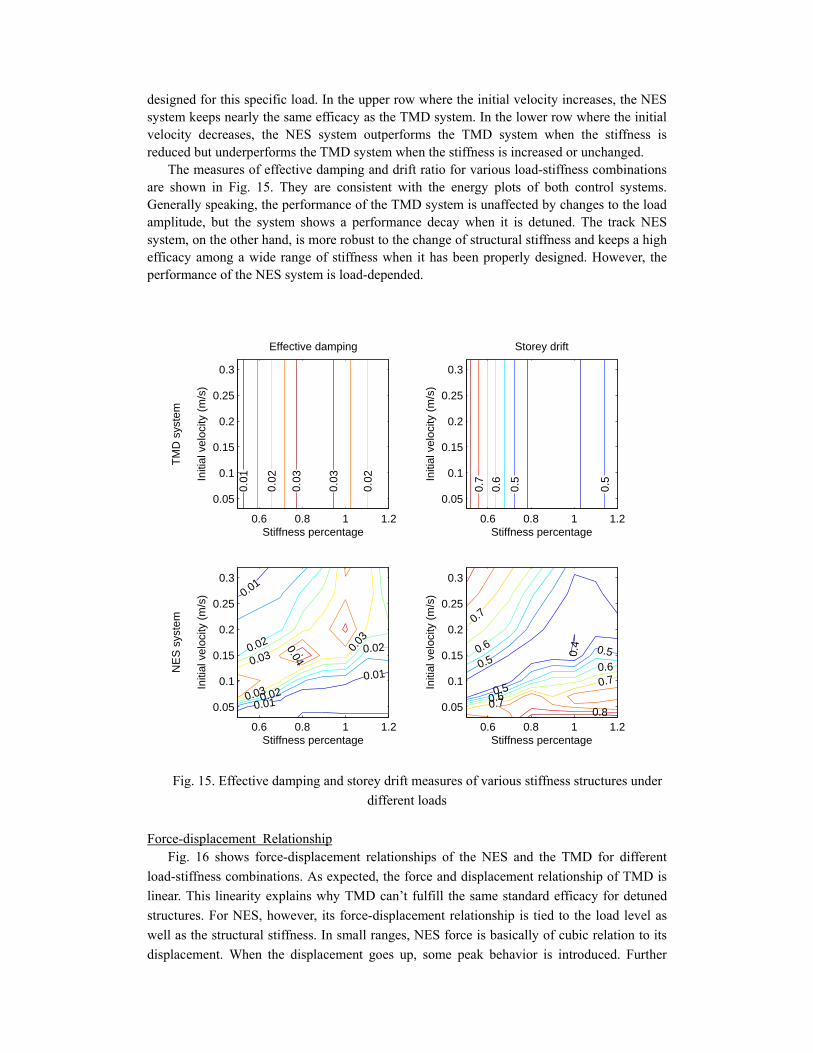
The measures of effective damping and drift ratio for various load-stiffness combinations are shown in Fig. 15. They are consistent with the energy plots of both control systems. Generally speaking, the performance of the TMD system is unaffected by changes to the load amplitude, but the system shows a performance decay when it is detuned. The track NES system, on the other hand, is more robust to the change of structural stiffness and keeps a high efficacy among a wide range of stiffness when it has been properly designed. However, the performance of the NES system is load-depended.
Fig. 15. Effective damping and storey drift measures of various stiffness structures under
different loads
Force-displacement Relationship
Fig. 16 shows force-displacement relationships of the NES and the TMD for different
load-stiffness combinations. As expected, the force and displacement relationship of TMD is
linear. This linearity explains why TMD can’t fulfill the same standard efficacy for detuned
structures. For NES, however, its force-displacement relationship is tied to the load level as
well as the structural stiffness. In small ranges, NES force is basically of cubic relation to its
displacement. When the displacement goes up, some peak behavior is introduced. Further
0.01
0.02
0.02
0.03
0.03
Stiffness percentage
TM
D s
yste
m
Initi
al v
eloc
ity (
m/s
)
Effective damping
0.6 0.8 1 1.2
0.05
0.1
0.15
0.2
0.25
0.3
0.01
0.01
0.01
0.02
0.02
0.020.03
0.03
0.03
0.04
Stiffness percentage
NE
S s
yste
m
Initi
al v
eloc
ity (
m/s
)
0.6 0.8 1 1.2
0.05
0.1
0.15
0.2
0.25
0.3
0.5
0.5
0.6
0.7
Stiffness percentage
Initi
al v
eloc
ity (
m/s
)
Storey drift
0.6 0.8 1 1.2
0.05
0.1
0.15
0.2
0.25
0.3
0.4
0.5
0.5
0.50.6
0.6
0.6
0.7
0.7
0.7
0.8
Stiffness percentage
Initi
al v
eloc
ity (
m/s
)
0.6 0.8 1 1.2
0.05
0.1
0.15
0.2
0.25
0.3
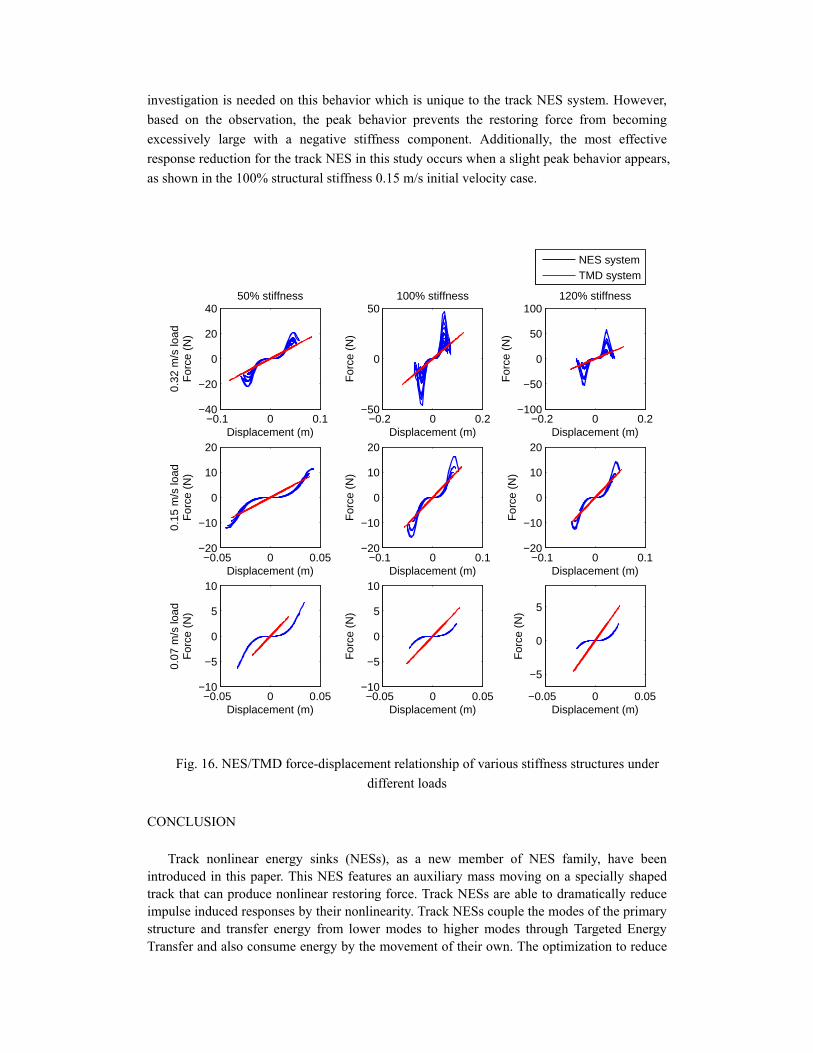
investigation is needed on this behavior which is unique to the track NES system. However,
based on the observation, the peak behavior prevents the restoring force from becoming
excessively large with a negative stiffness component. Additionally, the most effective
response reduction for the track NES in this study occurs when a slight peak behavior appears,
as shown in the 100% structural stiffness 0.15 m/s initial velocity case.
Fig. 16. NES/TMD force-displacement relationship of various stiffness structures under
different loads
CONCLUSION
Track nonlinear energy sinks (NESs), as a new member of NES family, have been introduced in this paper. This NES features an auxiliary mass moving on a specially shaped track that can produce nonlinear restoring force. Track NESs are able to dramatically reduce impulse induced responses by their nonlinearity. Track NESs couple the modes of the primary structure and transfer energy from lower modes to higher modes through Targeted Energy Transfer and also consume energy by the movement of their own. The optimization to reduce
−0.1 0 0.1−40
−20
0
20
40
Displacement (m)
0.32
m/s
load
For
ce (
N)
50% stiffness
−0.05 0 0.05−20
−10
0
10
20
Displacement (m)
0.15
m/s
load
For
ce (
N)
−0.05 0 0.05−10
−5
0
5
10
Displacement (m)
0.07
m/s
load
For
ce (
N)
−0.2 0 0.2−50
0
50100% stiffness
Displacement (m)
For
ce (
N)
−0.1 0 0.1−20
−10
0
10
20
Displacement (m)
For
ce (
N)
−0.05 0 0.05−10
−5
0
5
10
Displacement (m)
For
ce (
N)
−0.2 0 0.2−100
−50
0
50
100
Displacement (m)
For
ce (
N)
120% stiffness
NES systemTMD system
−0.1 0 0.1−20
−10
0
10
20
Displacement (m)
For
ce (
N)
−0.05 0 0.05
−5
0
5
Displacement (m)
For
ce (
N)
response of a two degree-of-freedom primary structure by using a track NES is reported in this paper. The results show that the track NES can mitigate the response of the structure considered to some given impulsive loads competitively compared to an in-tune TMD and, additionally, remain robust against detuning in the structure; however, the efficacy of NES system is shown to be vulnerable to changes in the level of loads. Additionally, evaluation of the force-displacement relationship of the track NES helps to reveal the effect of its nonlinearity compared to the linear force-displacement relationship of the TMD. This research demonstrates the potential of nonlinear energy sinks to mitigate impulsive loads on structures. Further study is underway to demonstrate experimentally the results found in this paper. REFERENCE AL-Shudeifat, Mohammad A., Nicholas Wierschem, D. Dane Quinn, Alexander F. Vakakis,
Lawrence A. Bergman, and Billie F. Spencer. 2013. “Numerical and Experimental Investigation of a Highly Effective Single-sided Vibro-impact Non-linear Energy Sink for Shock Mitigation.” International Journal of Non-Linear Mechanics 52 (June): 96–109.
Bellet, R., B. Cochelin, P. Herzog, and P.-O. Mattei. 2010. “Experimental Study of Targeted Energy Transfer from an Acoustic System to a Nonlinear Membrane Absorber.” Journal of Sound and Vibration 329 (14) (July): 2768–2791.
Cochelin, Bruno, Philippe Herzog, and Pierre-Olivier Mattei. 2006. “Experimental Evidence of Energy Pumping in Acoustics.” Comptes Rendus Mécanique 334 (11) (November): 639–644.
Fahim Sadek, Bijan Mohraz, Andrew W. Taylor, and Riley M. Chung. 1997. “A Method of Estimating the Parameters of Tuned Mass Dampers for Seismic Applications.” Earthquake Engineering & Structural Dynamics 26: 617–635.
Housner, G., L.A. Bergman, A.G. Caughey, and Chassiakos. 1997. “Structural Control: Past, Present, and Future.” Journal of Engineering Mechanics 123 (9): 897–971.
McFarland, D. Michael, Lawrence A. Bergman, and Alexander F. Vakakis. 2005. “Experimental Study of Non-linear Energy Pumping Occurring at a Single Fast Frequency.” International Journal of Non-Linear Mechanics 40 (6) (July): 891–899.
McFarland, D. Michael, Gaetan Kerschen, Jeffrey J. Kowtko, Young S. Lee, Lawrence A. Bergman, and Alexander F. Vakakis. 2005. “Experimental Investigation of Targeted Energy Transfers in Strongly and Nonlinearly Coupled Oscillators.” The Journal of the Acoustical Society of America 118 (2): 791.
Quinn, D. Dane, Alexander F. Vakakis, and Lawrence A. Bergman. 2013. “Effective Stiffening and Damping Enhancement of Structures With Strongly Nonlinear Local Attachments.”
Roy R. Craig, and Andrew J. Kurdila. 2006. Fundamentals of Structural Dynamics. 2nd ed. Wiley.
Sun, C., R.P. Eason, S. Nagarajaiah, and A.J. Dick. 2013. “Hardening Düffing Oscillator Attenuation Using a Nonlinear TMD, a Semi-active TMD and Multiple TMD.” Journal of Sound and Vibration 332 (4) (February): 674–686.
Wierschem, N. E., J. Luo, S. Hubbard, Fahnestock, L. A., B. F. Spencer Jr, A. F. Vakakis, and L. A. Bergman. “Experimental Testing of a Large 9-story Structure Equipped with Multiple Nonlinear Energy Sinks Subjected to an Impulsive Loading.”
Wierschem, N. E., B. F. Spencer Jr, L. A. Bergman, and A. F. Vakakis. 2013. “Numerical Study of Nonlinear Energy Sinks for Seismic Response Reduction.”
Wierschem, Nicholas E., Jie Luo, AL-Shudeifat Mohammad, Sean Hubbard, Richard Ott,
Larry A. Fahnestock, D. Dane Quinn, D. Michael McFarland, B. F. Spencer Jr, and Alexander Vakakis. 2013. “Simulation and Testing of a 6-story Structure Incorporating a Coupled Two Mass Nonlinear Energy Sink.”
Wierschem, Nicholas E., D. Dane Quinn, Sean A. Hubbard, Mohammad A. Al-Shudeifat, D. Michael McFarland, Jie Luo, Larry A. Fahnestock, Billie F. Spencer, Alexander F. Vakakis, and Lawrence A. Bergman. 2012. “Passive Damping Enhancement of a Two-degree-of-freedom System through a Strongly Nonlinear Two-degree-of-freedom Attachment.” Journal of Sound and Vibration 331 (25) (December): 5393–5407.
Wierschem, Nicholas E., Sean A. Hubbard, Jie Luo, Larry A. Fahnestock, B. F. Spencer Jr, D. Dane Quinn, D. Michael McFarland, Alexander F. Vakakis, and Lawrence A. Bergman. “Experimental Blast Testing of a Large 9-Story Struture Equipped with a System of Nonlinear Energy Sinks.” In press.
![NONLINEAR INTERACTION OF IMPULSIVE GRAVITATIONAL … · 2017. 4. 26. · The Khan-Penrose construction was later generalized by Nutku-Halil [28] who wrote down explicit solutions](https://img.pdfslide.net/doc/110x75/5fc3e913e2ff6621744b5050/nonlinear-interaction-of-impulsive-gravitational-2017-4-26-the-khan-penrose.jpg)


![[Murrey Jeneth] Impulsive Proposal](https://img.pdfslide.net/doc/110x75/563db8ff550346aa9a99002a/murrey-jeneth-impulsive-proposal.jpg)