Embed Size (px)
Citation preview
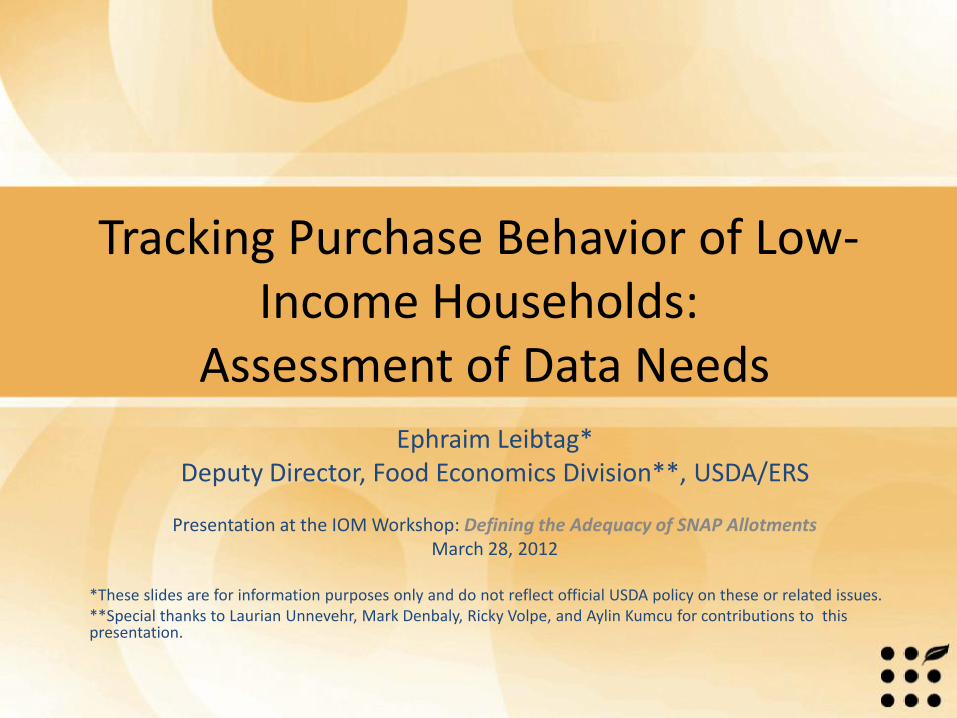
Tracking Purchase Behavior of Low-Income Households:
Assessment of Data Needs Ephraim Leibtag*
Deputy Director, Food Economics Division**, USDA/ERS
Presentation at the IOM Workshop: Defining the Adequacy of SNAP Allotments March 28, 2012
*These slides are for information purposes only and do not reflect official USDA policy on these or related issues. **Special thanks to Laurian Unnevehr, Mark Denbaly, Ricky Volpe, and Aylin Kumcu for contributions to this presentation.
Overview
• Motivation
• Available data
– Government sources
– Proprietary sources
• Research and trends using existing data
• Data gaps
• FoodAPS and beyond
Food Choice Policy Intervention
• New policies will challenge industry to market higher nutritional quality to consumers
• Shaping a “healthier” food environment will be a complex undertaking involving multiple sectors
• Opportunities for research to understand incentives and tradeoffs for consumers and industry
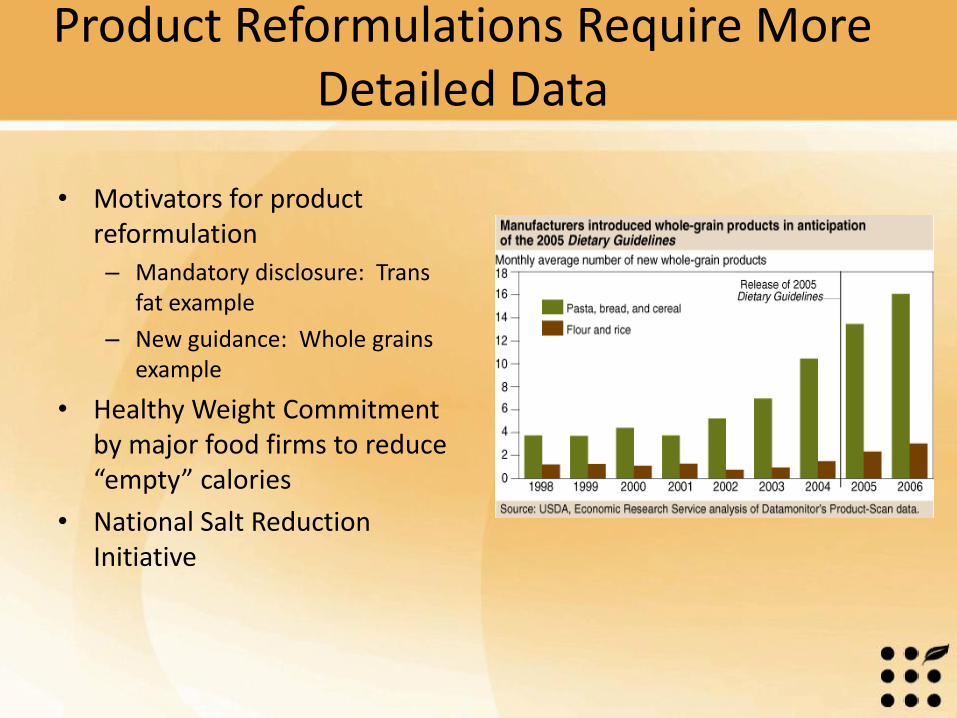
Product Reformulations Require More Detailed Data
• Motivators for product reformulation
– Mandatory disclosure: Trans fat example
– New guidance: Whole grains example
• Healthy Weight Commitment by major food firms to reduce “empty” calories
• National Salt Reduction Initiative

5
Food Expenditure Data Resources
• Store-based Data
– ERS Food Expenditure Data
• Census, USDA, BEA = Aggregate sales
– Proprietary data
• Scantrack (Nielsen) , Infoscan (IRI), C2ER (ACCRA)
• Consumer-based Data
– Consumer Expenditure Survey (BLS)
– Homescan (Nielsen), Consumer Network (IRI)
6
Nielsen Homescan Panel, 1998-2010
• 250,000+ unique household-by-year observations
• Scan food products purchased for food-at-home consumption: – Traditional supermarkets and grocery stores
– Nontraditional retailers
– Drug and convenience stores
• Price and quantity purchased recorded on a daily basis
• Market level data with 50 U.S. markets
Other Proprietary Consumer Data
7
• UPC Nutritional Information/New Product Introductions – Gladson
– Datamonitor
– Merging UPC and Scanner data
• Store Location Data – TDLinx

Food Assistance Expenditures on the Rise
0
20
40
60
80
100
120
1970 1973 1976 1979 1982 1985 1988 1991 1994 1997 2000 2003 2006 2009
Billion dollars USDA expenditures for food assistance, FY 1970-2011
All other programs SNAP
Source: ERS and FNS

0
50,000
100,000
150,000
200,000
250,000
300,000
350,000
400,000
1990 1991 1992 1993 1994 1995 1996 1997 1998 1999 2000 2001 2002 2003 2004 2005 2006 2007 2008 2009
Exp
en
dit
ure
($
bill
ion
s)
Food Expenditures at Constant Prices, 1990-2009
Food at home Food away
Source: USDA, ERS, calculations using USDA, ERS, Food Expenditure Tables: Table 1; and Bureau of Labor Statistics, Consumer Price Index.
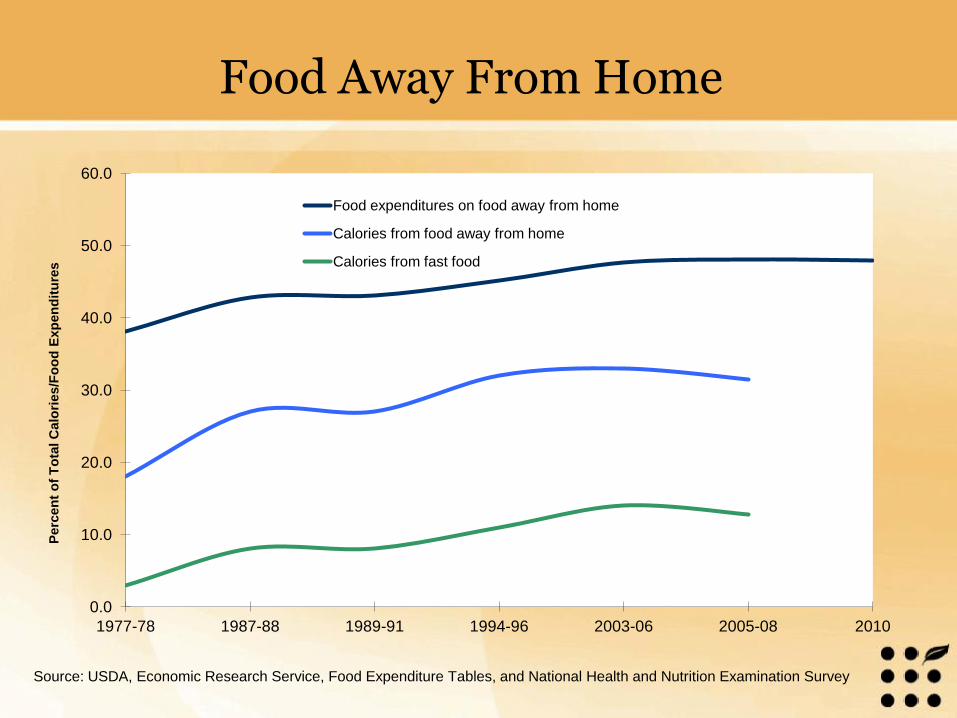
Food Away From Home
Source: USDA, Economic Research Service, Food Expenditure Tables, and National Health and Nutrition Examination Survey
0.0
10.0
20.0
30.0
40.0
50.0
60.0
1977-78 1987-88 1989-91 1994-96 2003-06 2005-08 2010
Perc
en
t o
f T
ota
l C
alo
ries/F
oo
d E
xp
en
dit
ure
s
Food expenditures on food away from home
Calories from food away from home
Calories from fast food
11
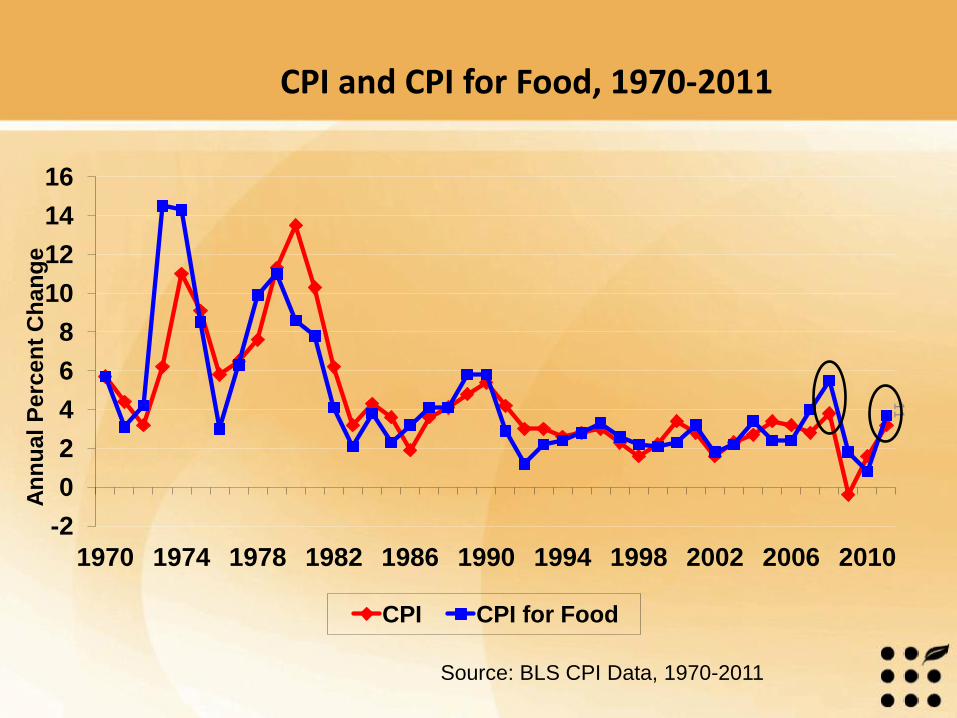
CPI and CPI for Food, 1970-2011
-2
0
2
4
6
8
10
12
14
16
1970 1974 1978 1982 1986 1990 1994 1998 2002 2006 2010
An
nu
al
Perc
en
t C
han
ge
CPI CPI for Food
Source: BLS CPI Data, 1970-2011
-
500
1,000
1,500
2,000
2,500
3,000
3,500
4,000
4,500
5,000
Lowest20% 20-40% 40-60% 60-80% 100%
Exp
en
dit
ure
($
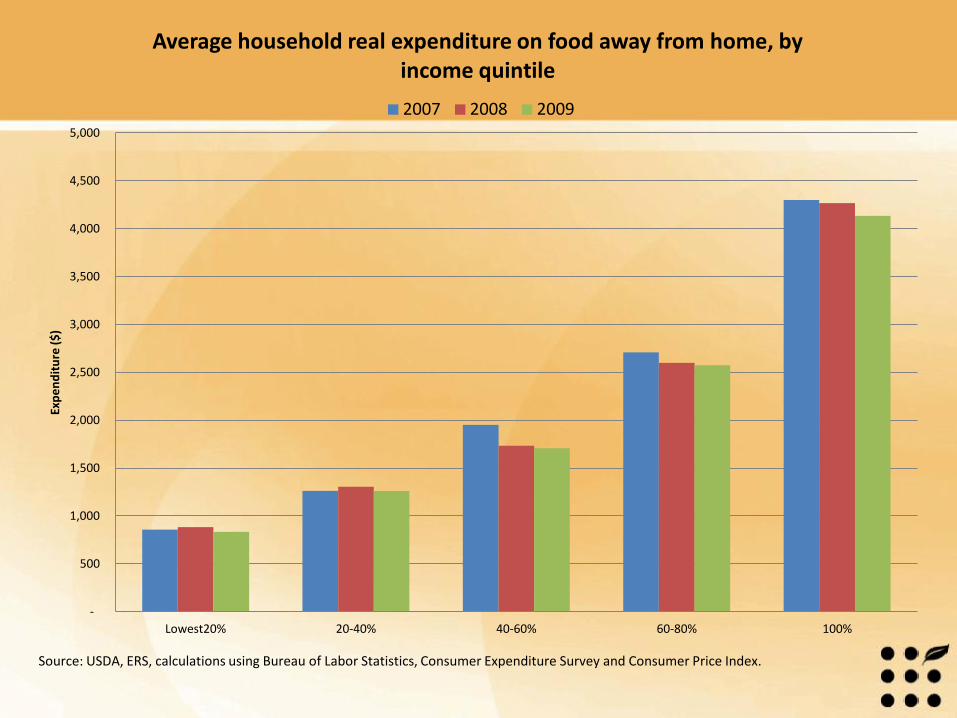
) Average household real expenditure on food away from home, by
income quintile
2007 2008 2009
Source: USDA, ERS, calculations using Bureau of Labor Statistics, Consumer Expenditure Survey and Consumer Price Index.
-
500
1,000
1,500
2,000
2,500
3,000
3,500
4,000
4,500
5,000
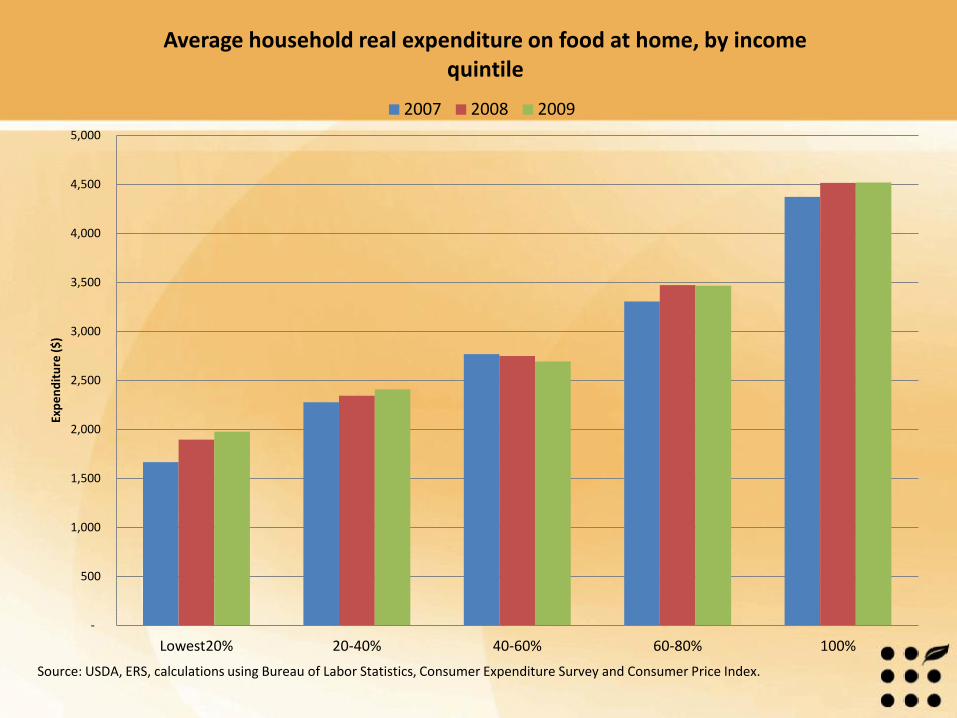
Lowest20% 20-40% 40-60% 60-80% 100%
Exp
en
dit
ure
($
) Average household real expenditure on food at home, by income
quintile
2007 2008 2009
Source: USDA, ERS, calculations using Bureau of Labor Statistics, Consumer Expenditure Survey and Consumer Price Index.

Research Examples using Homescan
• ERS has used Homescan in a variety of research projects
– Consumer expenditures
– Food price variation
• Do the poor pay more?
• By geography
• By store format
– Shopping behavior
• Coupon use
• Private labels
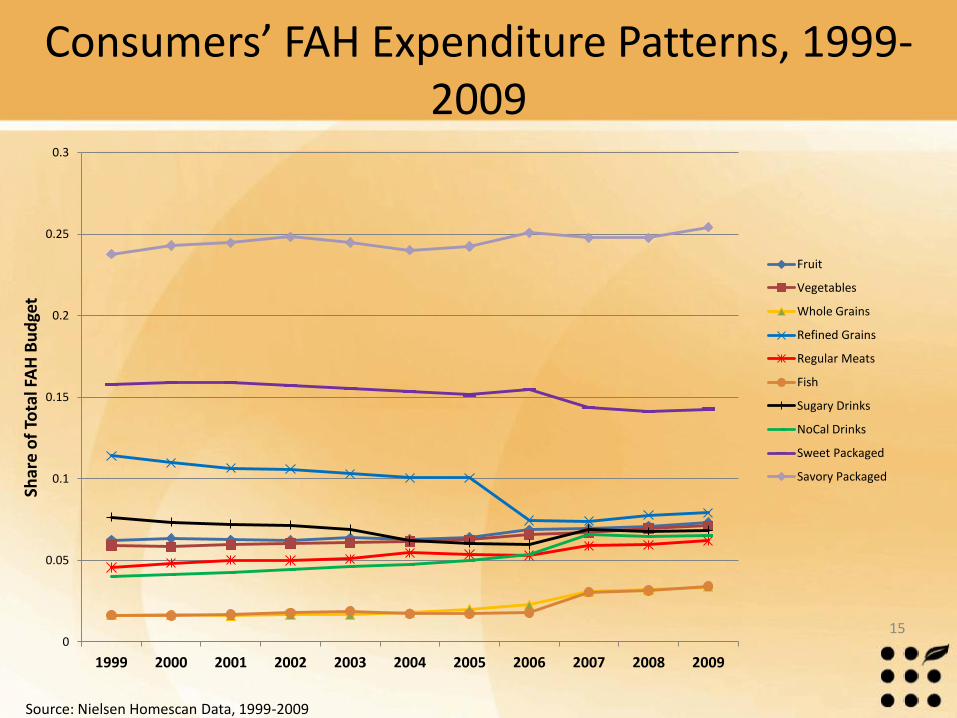
Consumers’ FAH Expenditure Patterns, 1999-2009
0
0.05
0.1
0.15
0.2
0.25
0.3
1999 2000 2001 2002 2003 2004 2005 2006 2007 2008 2009
Shar
e o
f To
tal F
AH
Bu
dge
t
Fruit
Vegetables
Whole Grains
Refined Grains
Regular Meats
Fish
Sugary Drinks
NoCal Drinks
Sweet Packaged
Savory Packaged
15
Source: Nielsen Homescan Data, 1999-2009
Fruit and Vegetable Price Variation
• Leibtag & Kumcu (May 2011) examined importance of regional variation in prices
– Key finding: fruit and vegetable prices vary substantially across markets
– 30-70% more expensive in highest-priced markets as compared to lowest-priced markets
– Implications for purchasing power of programs to improve food security, e.g. WIC
16
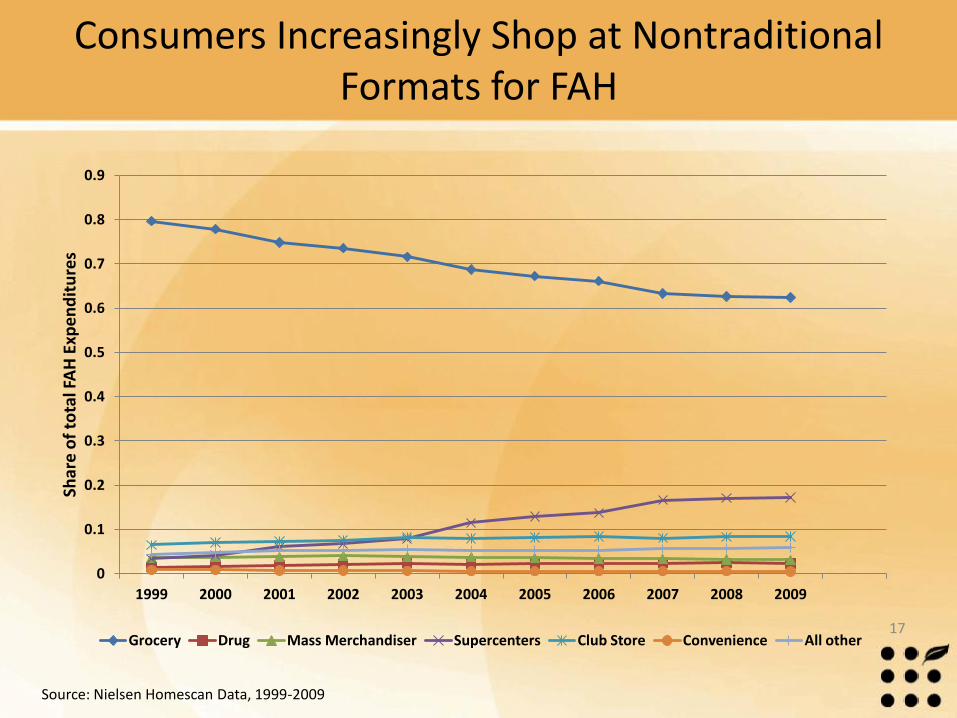
Consumers Increasingly Shop at Nontraditional Formats for FAH
0
0.1
0.2
0.3
0.4
0.5
0.6
0.7
0.8
0.9
1999 2000 2001 2002 2003 2004 2005 2006 2007 2008 2009
Shar
e o
f to
tal F
AH
Exp
en
dit
ure
s
Grocery Drug Mass Merchandiser Supercenters Club Store Convenience All other 17
Source: Nielsen Homescan Data, 1999-2009
18
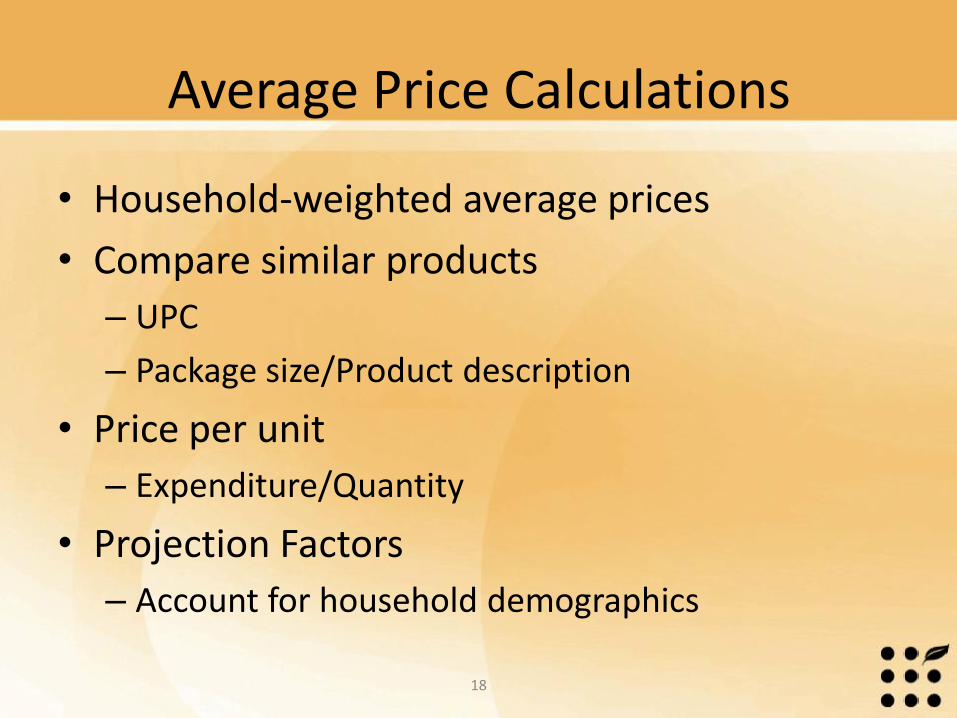
Average Price Calculations
• Household-weighted average prices
• Compare similar products
– UPC
– Package size/Product description
• Price per unit
– Expenditure/Quantity
• Projection Factors
– Account for household demographics
19
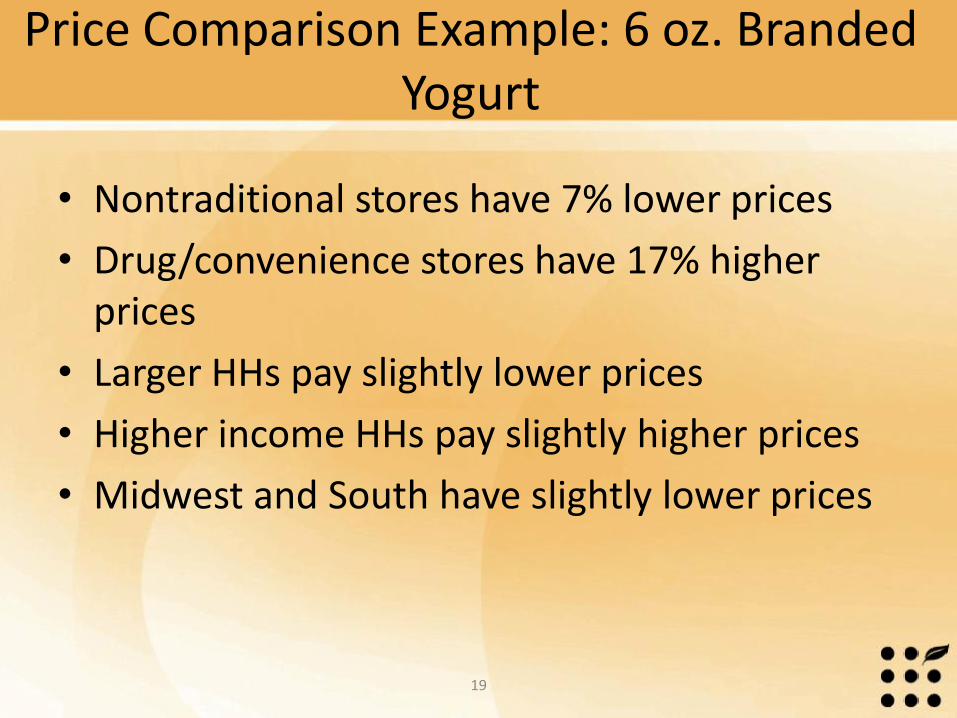
Price Comparison Example: 6 oz. Branded Yogurt
• Nontraditional stores have 7% lower prices
• Drug/convenience stores have 17% higher prices
• Larger HHs pay slightly lower prices
• Higher income HHs pay slightly higher prices
• Midwest and South have slightly lower prices

Homescan Data Quality Studies
• Data quality
– vs. CEX
– vs. Store Scanner Data
– Survey responses
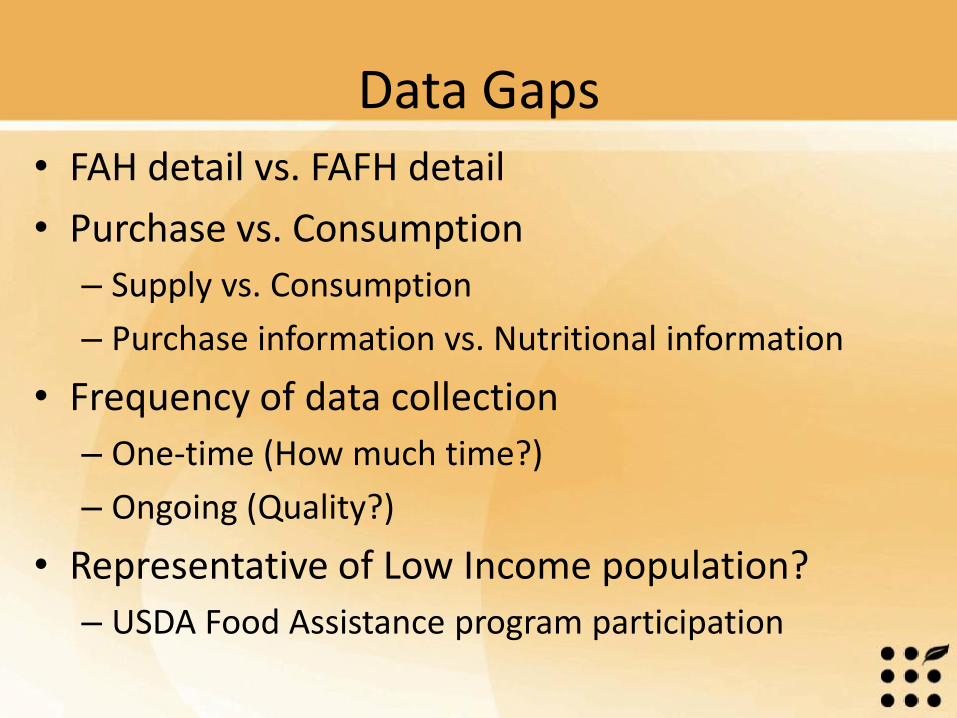
Data Gaps • FAH detail vs. FAFH detail
• Purchase vs. Consumption
– Supply vs. Consumption
– Purchase information vs. Nutritional information
• Frequency of data collection
– One-time (How much time?)
– Ongoing (Quality?)
• Representative of Low Income population?
– USDA Food Assistance program participation
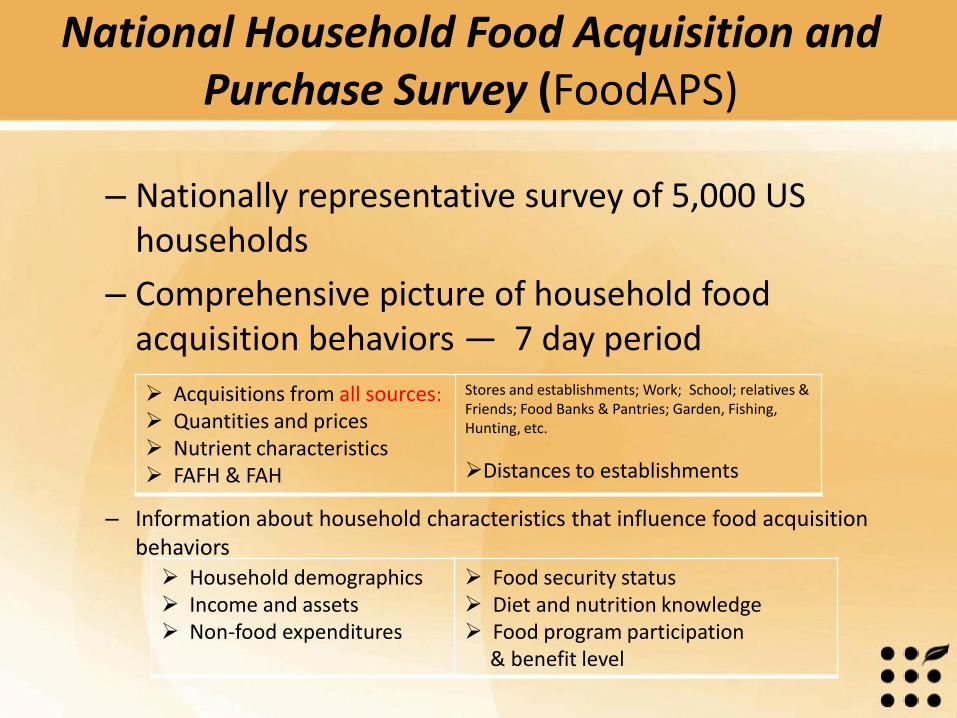
National Household Food Acquisition and Purchase Survey (FoodAPS)
– Nationally representative survey of 5,000 US households
– Comprehensive picture of household food acquisition behaviors — 7 day period
– Information about household characteristics that influence food acquisition behaviors
Acquisitions from all sources:
Quantities and prices Nutrient characteristics FAFH & FAH
Stores and establishments; Work; School; relatives & Friends; Food Banks & Pantries; Garden, Fishing, Hunting, etc.
Distances to establishments
Household demographics Income and assets Non-food expenditures
Food security status Diet and nutrition knowledge Food program participation & benefit level
23
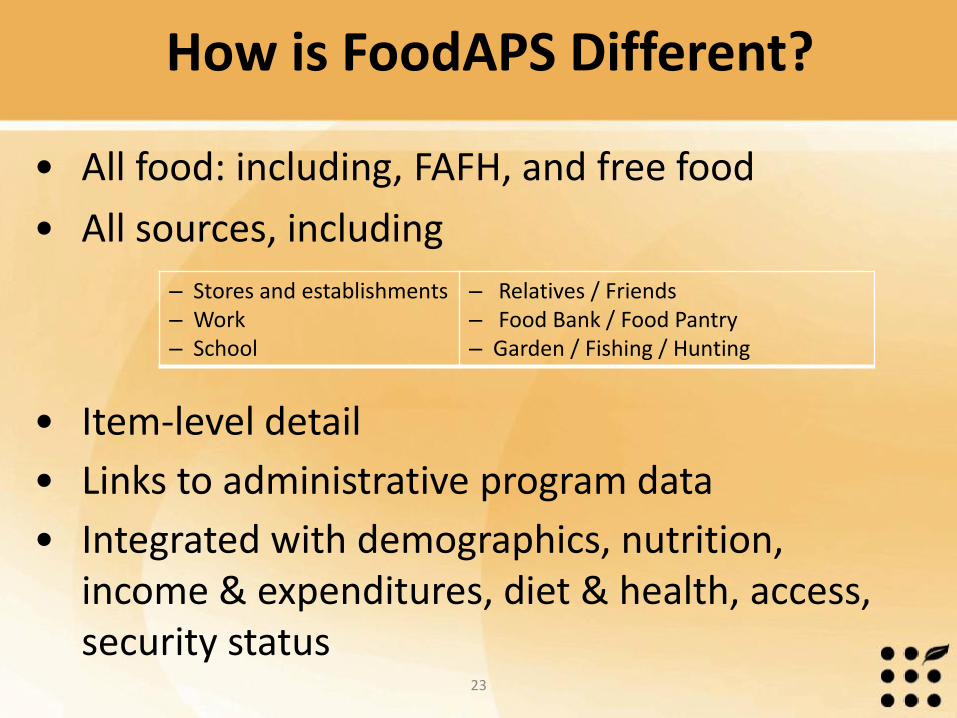
• All food: including, FAFH, and free food
• All sources, including
• Item-level detail
• Links to administrative program data
• Integrated with demographics, nutrition, income & expenditures, diet & health, access, security status
How is FoodAPS Different?
– Stores and establishments – Work – School
– Relatives / Friends – Food Bank / Food Pantry – Garden / Fishing / Hunting
24
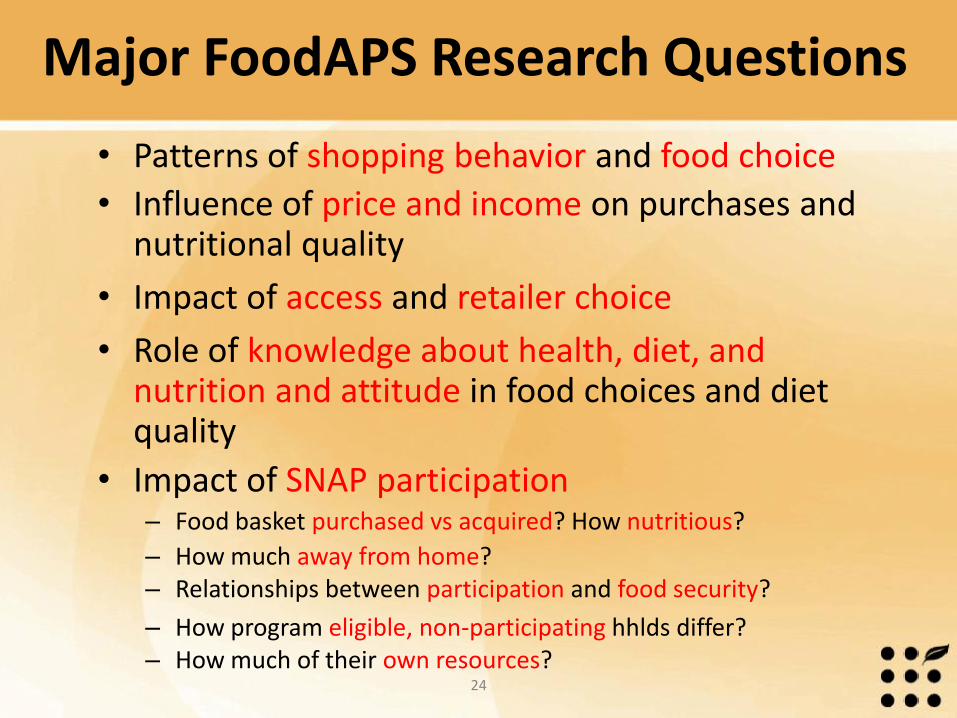
• Patterns of shopping behavior and food choice
• Influence of price and income on purchases and nutritional quality
• Impact of access and retailer choice
• Role of knowledge about health, diet, and nutrition and attitude in food choices and diet quality
• Impact of SNAP participation – Food basket purchased vs acquired? How nutritious?
– How much away from home? – Relationships between participation and food security?
– How program eligible, non-participating hhlds differ? – How much of their own resources?
Major FoodAPS Research Questions
25
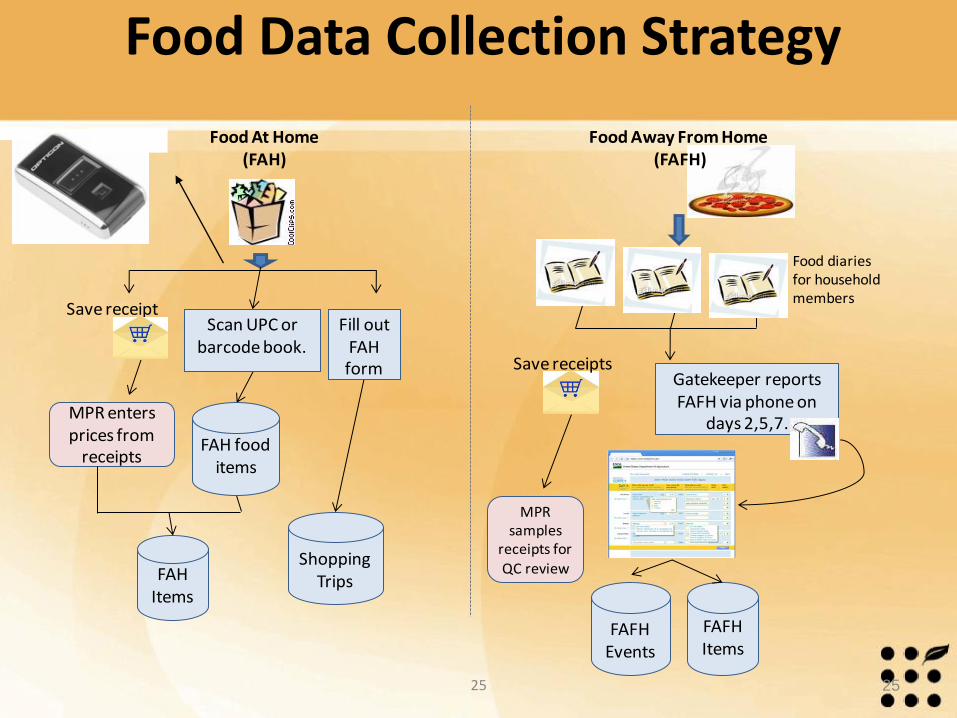
Food Data Collection Strategy
25
Save receiptScan UPC or
barcode book.
Gatekeeper reports FAFH via phone on
days 2,5,7. MPR enters prices from
receipts
FAHItems
Food At Home (FAH)
FAH food items
Food Away From Home(FAFH)
Food diaries for household members
MPR samples
receipts for
QC reviewShopping
Trips
Fill out FAHform
FAFHEvents
FAFHItems
Save receipts
26
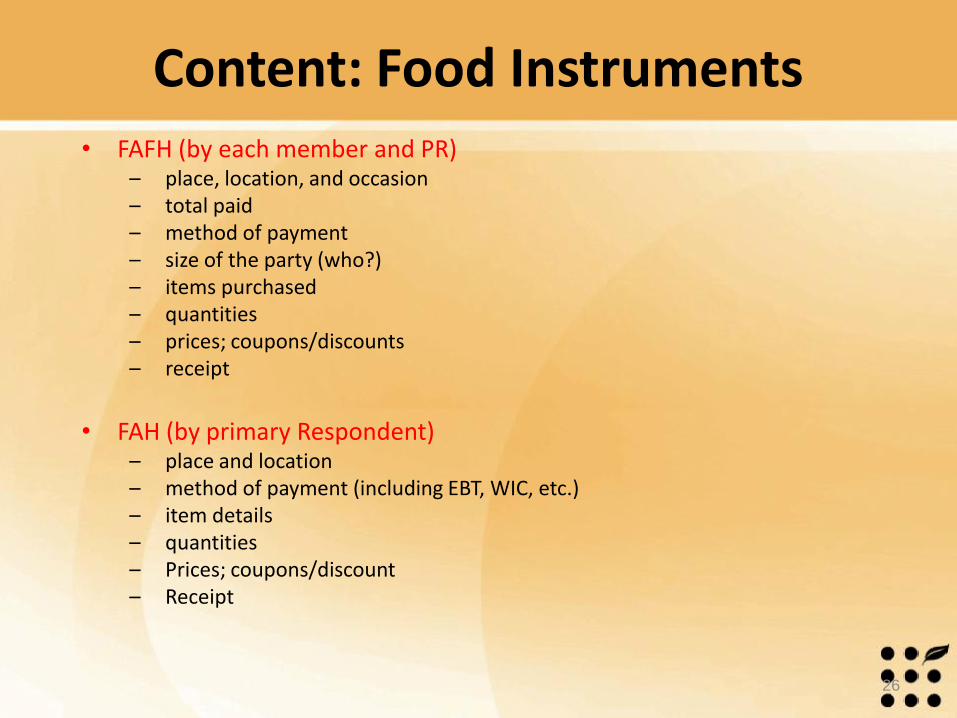
Content: Food Instruments • FAFH (by each member and PR)
– place, location, and occasion – total paid – method of payment – size of the party (who?) – items purchased – quantities – prices; coupons/discounts – receipt
• FAH (by primary Respondent) – place and location – method of payment (including EBT, WIC, etc.) – item details – quantities – Prices; coupons/discount – Receipt
27
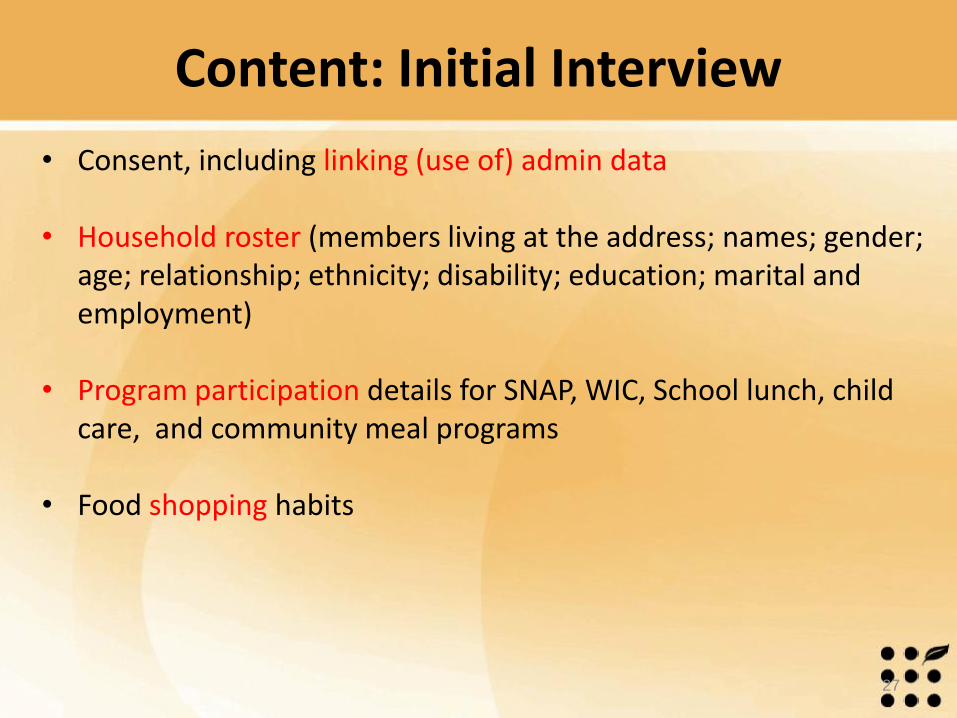
Content: Initial Interview
• Consent, including linking (use of) admin data
• Household roster (members living at the address; names; gender; age; relationship; ethnicity; disability; education; marital and employment)
• Program participation details for SNAP, WIC, School lunch, child care, and community meal programs
• Food shopping habits
28
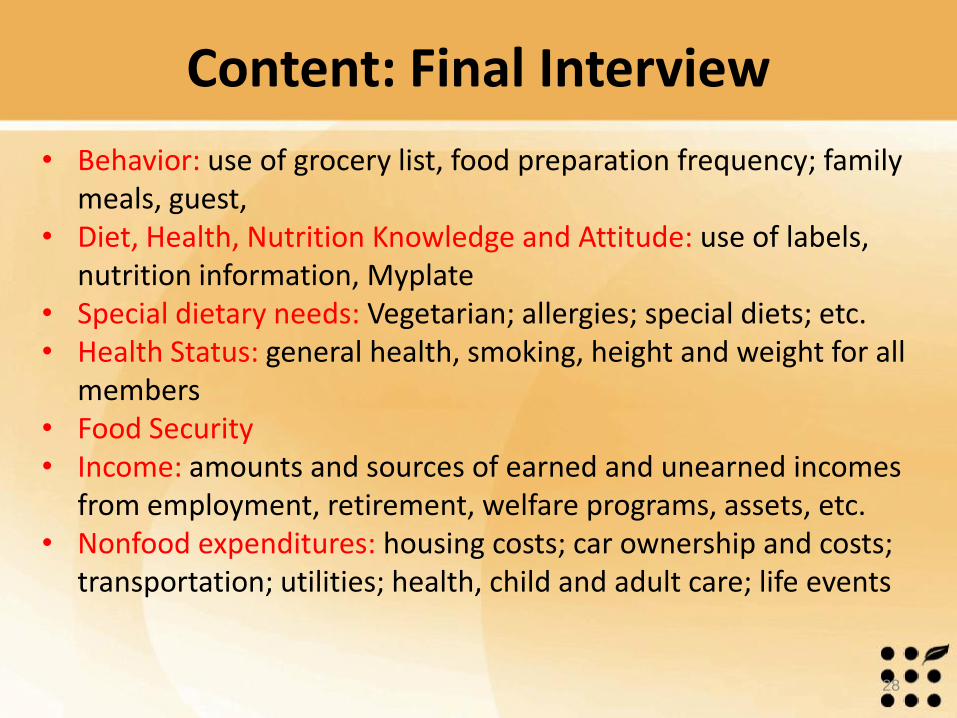
Content: Final Interview
• Behavior: use of grocery list, food preparation frequency; family meals, guest,
• Diet, Health, Nutrition Knowledge and Attitude: use of labels, nutrition information, Myplate
• Special dietary needs: Vegetarian; allergies; special diets; etc. • Health Status: general health, smoking, height and weight for all
members • Food Security • Income: amounts and sources of earned and unearned incomes
from employment, retirement, welfare programs, assets, etc. • Nonfood expenditures: housing costs; car ownership and costs;
transportation; utilities; health, child and adult care; life events
29
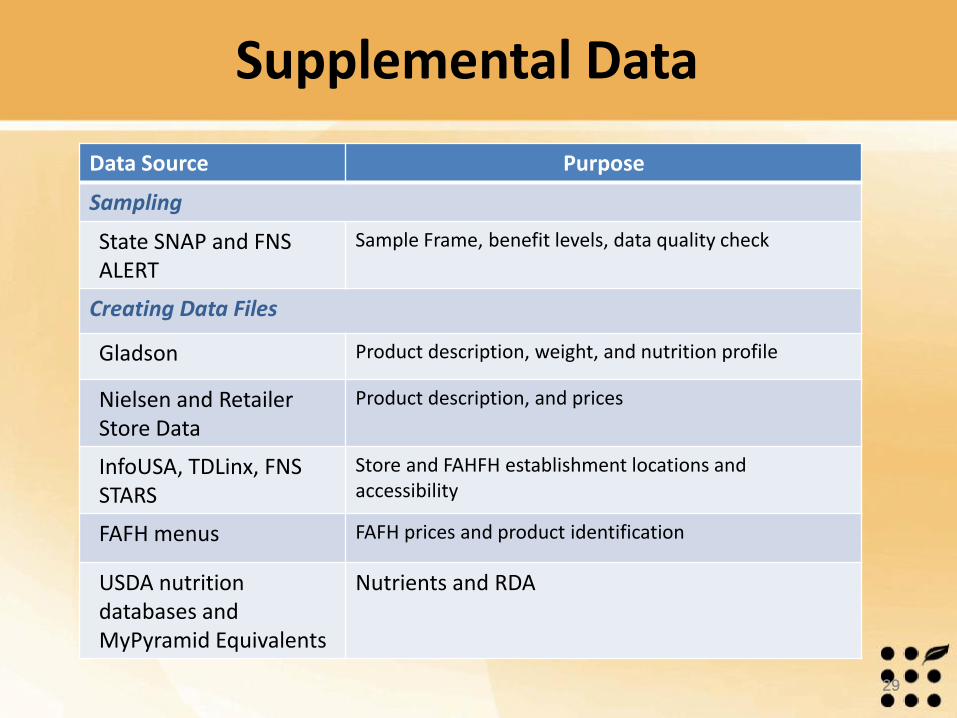
Supplemental Data
29
Data Source Purpose
Sampling
State SNAP and FNS ALERT
Sample Frame, benefit levels, data quality check
Creating Data Files
Gladson Product description, weight, and nutrition profile
Nielsen and Retailer Store Data
Product description, and prices
InfoUSA, TDLinx, FNS STARS
Store and FAHFH establishment locations and accessibility
FAFH menus FAFH prices and product identification
USDA nutrition databases and MyPyramid Equivalents
Nutrients and RDA
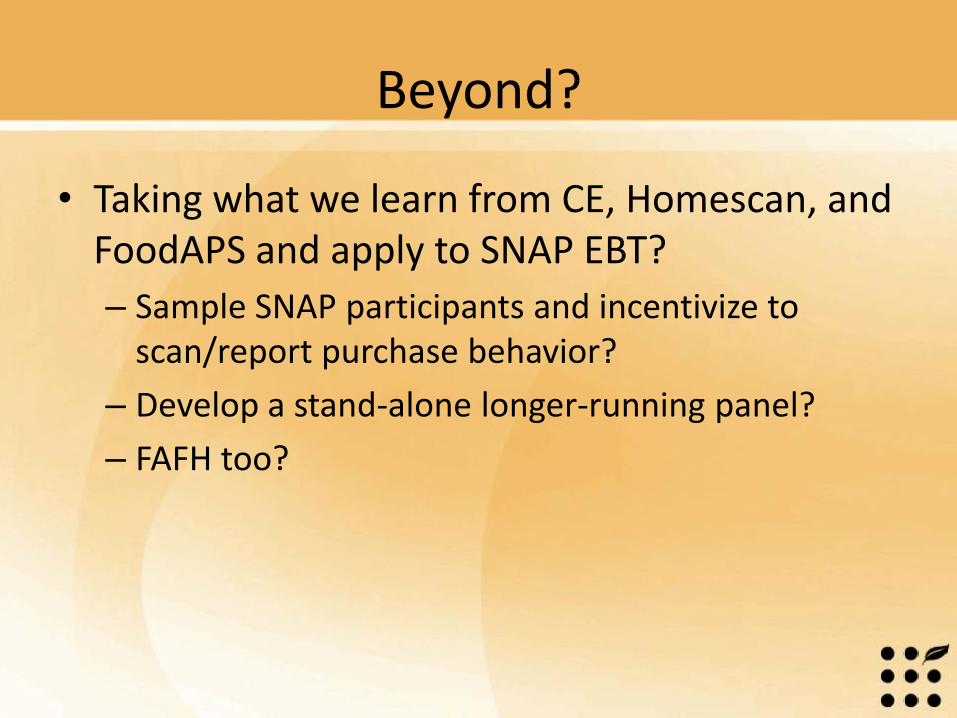
Beyond?
• Taking what we learn from CE, Homescan, and FoodAPS and apply to SNAP EBT?
– Sample SNAP participants and incentivize to scan/report purchase behavior?
– Develop a stand-alone longer-running panel?
– FAFH too?

31
Questions?
Contact Information:
Ephraim Leibtag, PhD
202-694-5349
Thank you for your time!