Embed Size (px)
Citation preview
Tracking the dynamic representation of consonantsfrom auditory periphery to cortex
Narayan Sankaran,1,a) Jayaganesh Swaminathan,2 Christophe Micheyl,2 Sridhar Kalluri,2
and Simon Carlile1
1Auditory Neuroscience Laboratory, School of Medical Sciences, The University of Sydney, Sydney,New South Wales 2006, Australia2Starkey Hearing Research Center, 2150 Shattuck Avenue, Suite 408, Berkeley, California 94704, USA
(Received 9 April 2018; revised 29 August 2018; accepted 9 October 2018; published online 31October 2018)
In order to perceive meaningful speech, the auditory system must recognize different phonemes
amidst a noisy and variable acoustic signal. To better understand the processing mechanisms under-
lying this ability, evoked cortical responses to different spoken consonants were measured with
electroencephalography (EEG). Using multivariate pattern analysis (MVPA), binary classifiers
attempted to discriminate between the EEG activity evoked by two given consonants at each peri-
stimulus time sample, providing a dynamic measure of their cortical dissimilarity. To examine the
relationship between representations at the auditory periphery and cortex, MVPA was also applied
to modelled auditory-nerve (AN) responses of consonants, and time-evolving AN-based and EEG-
based dissimilarities were compared with one another. Cortical dissimilarities between consonants
were commensurate with their articulatory distinctions, particularly their manner of articulation,
and to a lesser extent, their voicing. Furthermore, cortical distinctions between consonants in two
periods of activity, centered at 130 and 400 ms after onset, aligned with their peripheral dissimilar-
ities in distinct onset and post-onset periods, respectively. In relating speech representations across
articulatory, peripheral, and cortical domains, the understanding of crucial transformations in the
auditory pathway underlying the ability to perceive speech is advanced.VC 2018 Acoustical Society of America. https://doi.org/10.1121/1.5065492
[AKCL] Pages: 2462–2472
I. INTRODUCTION
To discriminate between utterances of the words barkand park, the auditory system must differentially encode the
phonemes /b/ and /p/. Furthermore, since either word may be
spoken across a range of different styles, accents, articula-
tory contexts, rates, and background noises, the auditory sys-
tem must extract the acoustically invariant features of a
given phoneme from a highly variable signal. Despite
numerous advances in our understanding of the neural mech-
anisms underlying noise-robust speech perception, the signal
processing transformations in the auditory pathway that con-
vert a noisy, variable acoustic input into intelligible speech
are not fully understood.
Employing closed-set recognition tasks, decades of psy-
chophysical research has examined the perceived distinc-
tions between different consonants for normal hearing (NH)
and hearing-impaired (HI) listeners in both quiet and under
degraded listening conditions (Miller and Nicely, 1955;
Phatak et al., 2008; Phatak et al., 2009; Walden and
Montgomery, 1975; Phillips et al., 2010; Wang et al., 1978;
Bilger and Wang, 1976; Doyle et al., 1981). An analysis of
the resulting confusion matrices reveals the existence of
perceptually similar consonant sets, or “confusion groups.”
These perceptual distinctions are often aligned with those
based on articulatory descriptions, such as the voicing, man-
ner, and place of articulation of the consonant (Phatak et al.,2008; Miller and Nicely, 1955; Allen, 1994). For example,
under certain listening conditions unvoiced plosives such as
(/p/, /t/, /k/) are often confusable with one another in NH and
HI English-speaking listeners, as are certain fricative conso-
nants (/S/, /s/, /f/), whereas consonant pairs that span differ-
ent manner of articulation categories (e.g., /p/ and /S/) are
perceptually distinct.
How these perceptual and articulatory distinctions are
reflected in cortex is a question of significant theoretical and
translational interest. Prior studies have used intracranial
high-density electrode arrays, or electrocorticography
(ECoG), to measure cortical activity during speech listening
(Dichter et al., 2016; Mesgarani et al., 2014; Chang et al.,2010; see Leonard and Chang, 2014 for a review).
Mesgarani et al. (2014) showed that different electrode sites
across superior temporal gyrus responded to different subsets
of phonemes in a manner consistent with their articulatory
properties (particularly their manner of articulation). Chang
et al. (2010) uncovered neural evidence of categorical pho-
neme perception, whereby stimuli varying along an acoustic
continuum produced neurally distinct categories. In leverag-
ing the fine spatial and temporal resolution offered by
ECoG, these studies provide compelling evidence for the
neural basis of phoneme perception. However, as the
a)Current address: Department of Neurological Surgery and Center for
Integrative Neuroscience, University of California, San Francisco, 675
Nelson rising Lane, San Francisco, CA 94158, USA. Electronic mail:
2462 J. Acoust. Soc. Am. 144 (4), October 2018 VC 2018 Acoustical Society of America0001-4966/2018/144(4)/2462/11/$30.00
recording procedure is highly invasive—involving special-
ized neurosurgical procedures—it remains unfeasible for
investigating speech processing in many real-world condi-
tions, sampling large listening populations, or easily embed-
ding in brain computer interface (BCI)-based listening
technologies. Furthermore, ECoG recordings are typically
anatomically restricted to a portion of the cortex, and may
therefore fail to capture more distributed components of the
neuronal population coding involved in speech (Huth et al.,2016).
Other studies have examined the encoding of speech
using electroencephalography (EEG)—a non-invasive record-
ing technique (DiLiberto et al., 2015; Khalighinejad et al.,2017). In particular, Khalighinejad et al. (2017) examined dif-
ferences in the event-related potentials (ERPs) corresponding
to each phoneme within a continuous speech stream. In line
with prior perceptual and neural research, phonemes with sim-
ilar phonetic features evoked similar cortical responses (e.g.,
ERPs elicited by vowels were similar to one another, while
dissimilar from that of plosive consonants). While these dis-
tinctions were resolved enough to delineate broad categories
of phonemes, it remains to be seen whether EEG offers the
finer resolution necessary to elucidate distinctions among con-sonants, which are most impacted by noisy listening condi-
tions and hearing impairment.
The current study sought to robustly evaluate the cortical
representation of consonants using EEG, and differed from
prior work in several key aspects. Rather than continuous
speech, listeners were presented with a closed set of conso-
nants in vowel-consonant-vowel (VCV) format. This stimulus
choice has several advantages. First, current findings can be
related most directly to the extensive body of psychophysical
results employing closed set consonant recognition tasks.
Second, by minimizing the influence of higher-order semantic
and lexical effects that exist in running speech, VCVs provide
more control over potential explanatory variables and facili-
tate an isolated measurement of the neural activity associated
specifically with phoneme perception. Third, though VCVs
provided more control than running speech, we also sought to
measure an ecologically valid neural representation that hon-
ors the acoustic variability of real world listening. To manage
this trade-off, individual VCV tokens within each consonant
category contained a high degree of utterance variability (see
Sec. II for details). In addition to the stimulus design, the cur-
rent study took a novel analytical approach; applying multi-
variate pattern analysis (MVPA) to neural responses.
Specifically, binary classifiers were trained and tested on their
ability to discriminate between the EEG activity evoked by
two different consonants. Within this framework, two conso-
nants are cortically dissimilar to the extent that classifiers can
accurately discriminate between their evoked activity. In con-
trast with the ERP-based methods used previously
(Khalighinejad et al., 2017), this approach enabled a multivar-
iate characterization of spatiotemporal neural features, with-
out averaging across all sensor channels and repeat
observations. Finally, to quantify distinctions between conso-
nants at the auditory periphery, consonants were first mod-
elled in terms of their auditory nerve (AN) synapse output,
and MVPA was then applied to the AN responses. Examining
the relationship between time evolving EEG-based and AN-
based consonant representations provided a global view of
how sensory information is transformed into higher-level cor-
tical representations.
II. METHOD
A. Participants
Eighteen paid participants were recruited through the
Starkey Hearing Research Center (Berkeley, CA). Data from
three subjects were excluded from the analysis due to high
impedance values or excessive line noise. The remaining 15
subjects (10 female; mean¼ 26.1 yr, SD¼ 10.4) had normal
hearing as confirmed by clinical audiometry (ANSI/ASA
S3.21-2004 R2009).
B. Stimuli
A set of consonants were chosen whose perceptual and
articulatory properties were such that explicit hypotheses
could be formed regarding their dissimilarity structure.
Specifically, the set spanned several perceptual confusion
groups (with multiple exemplars in each), and also clustered
similarly when grouped by their articulatory properties (see
Table I). Consonants were {/b/, /d/, /g/, /p/, /t/, /k/, /m/, /n/, /s/,
/S/, /f/} presented in the medial position of vowel-consonant-
vowel (VCV) syllables. Each consonant was presented in five
different vowel contexts, each with six different speaking
styles that varied in either rate (fast, slow), effort (loud, soft),
or intonation (statement, question). Additionally, each token
contained three natural repetitions, resulting in 90 unique
utterances of each consonant [5 vowels � 6 styles � 3 repeti-tions]. Stimuli were part of the Oldenburg Logatome Speech
Corpus (Wesker et al., 2005) and were spoken by a single
German female speaker. In pilot-testing, stimuli were selected
such that the non-English background of the speaker did not
introduce perceptible phonetic deviations from that of
American-English. Speech tokens were normalized to 99%
amplitude, low-pass filtered with 8 kHz cut-off frequency, and
presented at 48 kHz with 16-bit resolution. Temporal bound-
aries of phonemes within each VCV utterance were labelled
by the Munich automatic segmentation system (MAUS),
which used a procedure similar to hidden Markov model
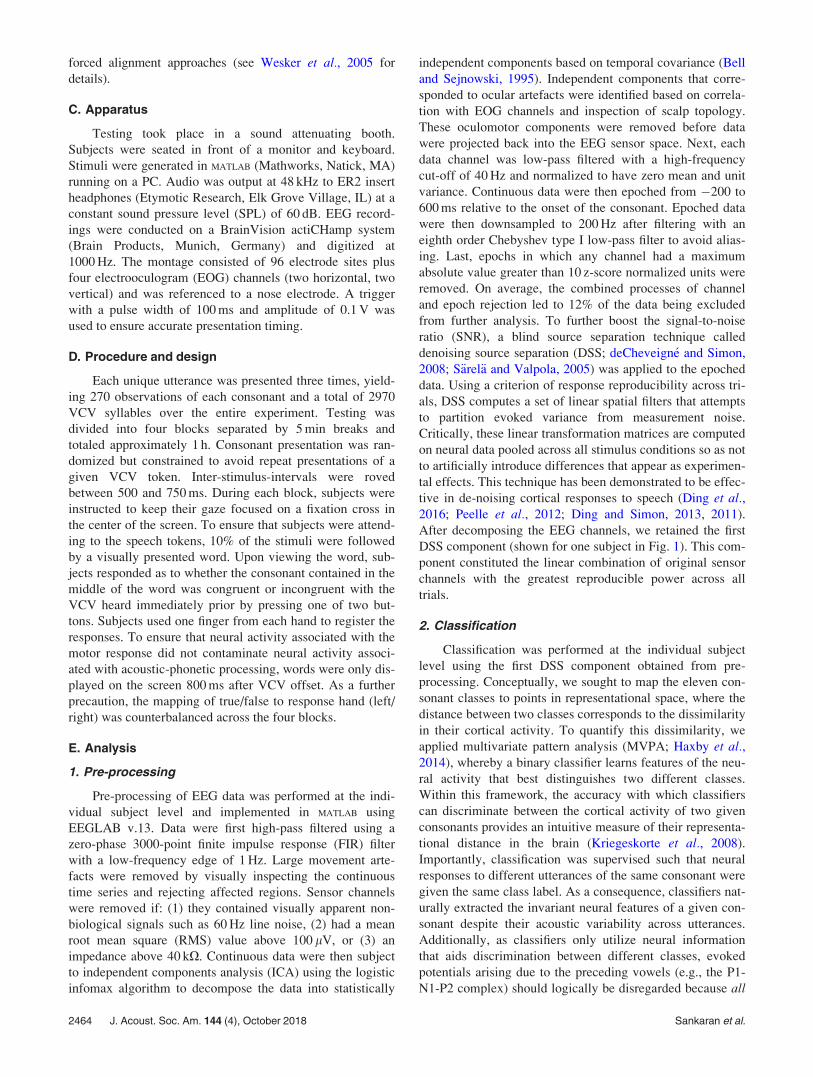
TABLE I. Consonants used in the current stimulus set and their correspond-
ing articulatory features.
Consonant Voicing Manner of articulation Place of articulation
/b/ voiced plosive bilabial
/d/ voiced plosive alveolar
/g/ voiced plosive velar
/p/ unvoiced plosive bilabial
/t/ unvoiced plosive alveolar
/k/ unvoiced plosive velar
/f/ unvoiced fricative labiodental
/s/ unvoiced fricative alveolar
/S/ unvoiced fricative postalveolar
/m/ voiced nasal bilabial
/n/ voiced nasal alveolar
J. Acoust. Soc. Am. 144 (4), October 2018 Sankaran et al. 2463
forced alignment approaches (see Wesker et al., 2005 for
details).
C. Apparatus
Testing took place in a sound attenuating booth.
Subjects were seated in front of a monitor and keyboard.
Stimuli were generated in MATLAB (Mathworks, Natick, MA)
running on a PC. Audio was output at 48 kHz to ER2 insert
headphones (Etymotic Research, Elk Grove Village, IL) at a
constant sound pressure level (SPL) of 60 dB. EEG record-
ings were conducted on a BrainVision actiCHamp system
(Brain Products, Munich, Germany) and digitized at
1000 Hz. The montage consisted of 96 electrode sites plus
four electrooculogram (EOG) channels (two horizontal, two
vertical) and was referenced to a nose electrode. A trigger
with a pulse width of 100 ms and amplitude of 0.1 V was
used to ensure accurate presentation timing.
D. Procedure and design
Each unique utterance was presented three times, yield-
ing 270 observations of each consonant and a total of 2970
VCV syllables over the entire experiment. Testing was
divided into four blocks separated by 5 min breaks and
totaled approximately 1 h. Consonant presentation was ran-
domized but constrained to avoid repeat presentations of a
given VCV token. Inter-stimulus-intervals were roved
between 500 and 750 ms. During each block, subjects were
instructed to keep their gaze focused on a fixation cross in
the center of the screen. To ensure that subjects were attend-
ing to the speech tokens, 10% of the stimuli were followed
by a visually presented word. Upon viewing the word, sub-
jects responded as to whether the consonant contained in the
middle of the word was congruent or incongruent with the
VCV heard immediately prior by pressing one of two but-
tons. Subjects used one finger from each hand to register the
responses. To ensure that neural activity associated with the
motor response did not contaminate neural activity associ-
ated with acoustic-phonetic processing, words were only dis-
played on the screen 800 ms after VCV offset. As a further
precaution, the mapping of true/false to response hand (left/
right) was counterbalanced across the four blocks.
E. Analysis
1. Pre-processing
Pre-processing of EEG data was performed at the indi-
vidual subject level and implemented in MATLAB using
EEGLAB v.13. Data were first high-pass filtered using a
zero-phase 3000-point finite impulse response (FIR) filter
with a low-frequency edge of 1 Hz. Large movement arte-
facts were removed by visually inspecting the continuous
time series and rejecting affected regions. Sensor channels
were removed if: (1) they contained visually apparent non-
biological signals such as 60 Hz line noise, (2) had a mean
root mean square (RMS) value above 100 lV, or (3) an
impedance above 40 kX. Continuous data were then subject
to independent components analysis (ICA) using the logistic
infomax algorithm to decompose the data into statistically
independent components based on temporal covariance (Bell
and Sejnowski, 1995). Independent components that corre-
sponded to ocular artefacts were identified based on correla-
tion with EOG channels and inspection of scalp topology.
These oculomotor components were removed before data
were projected back into the EEG sensor space. Next, each
data channel was low-pass filtered with a high-frequency
cut-off of 40 Hz and normalized to have zero mean and unit
variance. Continuous data were then epoched from �200 to
600 ms relative to the onset of the consonant. Epoched data
were then downsampled to 200 Hz after filtering with an
eighth order Chebyshev type I low-pass filter to avoid alias-
ing. Last, epochs in which any channel had a maximum
absolute value greater than 10 z-score normalized units were
removed. On average, the combined processes of channel
and epoch rejection led to 12% of the data being excluded
from further analysis. To further boost the signal-to-noise
ratio (SNR), a blind source separation technique called
denoising source separation (DSS; deCheveign�e and Simon,
2008; S€arel€a and Valpola, 2005) was applied to the epoched
data. Using a criterion of response reproducibility across tri-
als, DSS computes a set of linear spatial filters that attempts
to partition evoked variance from measurement noise.
Critically, these linear transformation matrices are computed
on neural data pooled across all stimulus conditions so as not
to artificially introduce differences that appear as experimen-
tal effects. This technique has been demonstrated to be effec-
tive in de-noising cortical responses to speech (Ding et al.,2016; Peelle et al., 2012; Ding and Simon, 2013, 2011).
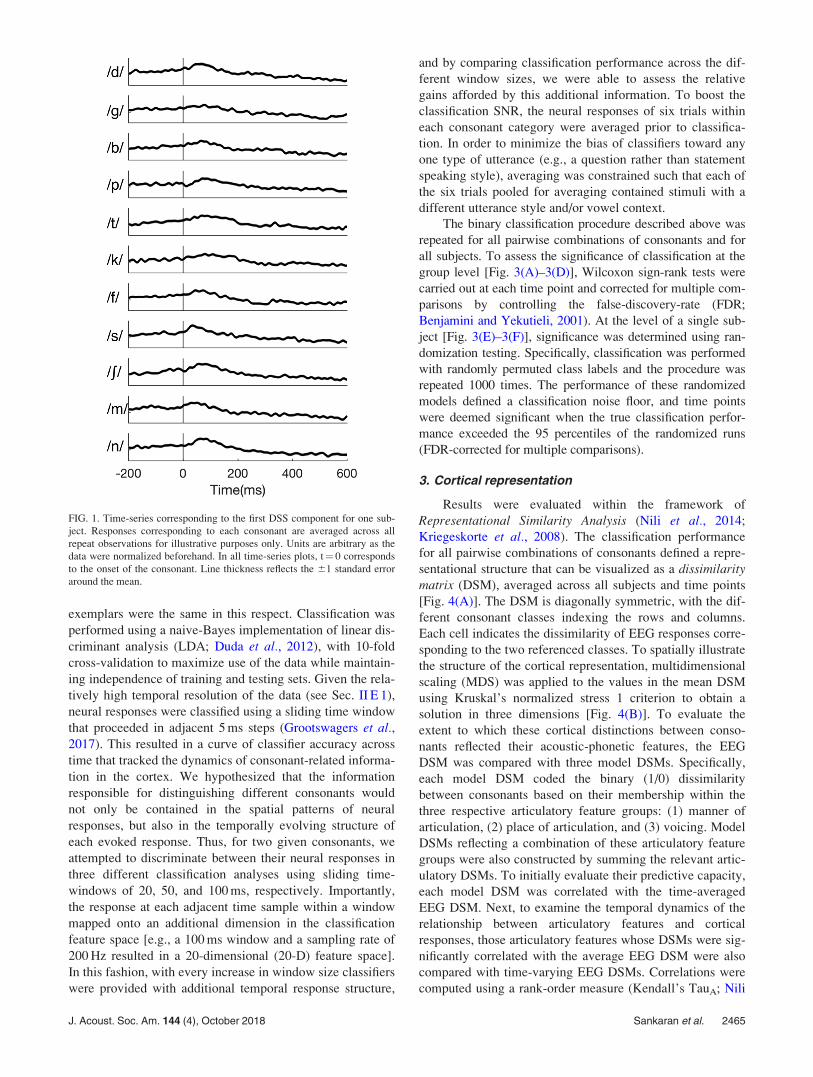
After decomposing the EEG channels, we retained the first
DSS component (shown for one subject in Fig. 1). This com-
ponent constituted the linear combination of original sensor
channels with the greatest reproducible power across all
trials.
2. Classification
Classification was performed at the individual subject
level using the first DSS component obtained from pre-
processing. Conceptually, we sought to map the eleven con-
sonant classes to points in representational space, where the
distance between two classes corresponds to the dissimilarity
in their cortical activity. To quantify this dissimilarity, we
applied multivariate pattern analysis (MVPA; Haxby et al.,2014), whereby a binary classifier learns features of the neu-
ral activity that best distinguishes two different classes.
Within this framework, the accuracy with which classifiers
can discriminate between the cortical activity of two given
consonants provides an intuitive measure of their representa-
tional distance in the brain (Kriegeskorte et al., 2008).
Importantly, classification was supervised such that neural
responses to different utterances of the same consonant were
given the same class label. As a consequence, classifiers nat-
urally extracted the invariant neural features of a given con-
sonant despite their acoustic variability across utterances.
Additionally, as classifiers only utilize neural information
that aids discrimination between different classes, evoked
potentials arising due to the preceding vowels (e.g., the P1-
N1-P2 complex) should logically be disregarded because all
2464 J. Acoust. Soc. Am. 144 (4), October 2018 Sankaran et al.
exemplars were the same in this respect. Classification was
performed using a naive-Bayes implementation of linear dis-
criminant analysis (LDA; Duda et al., 2012), with 10-fold
cross-validation to maximize use of the data while maintain-
ing independence of training and testing sets. Given the rela-
tively high temporal resolution of the data (see Sec. II E 1),
neural responses were classified using a sliding time window
that proceeded in adjacent 5 ms steps (Grootswagers et al.,2017). This resulted in a curve of classifier accuracy across
time that tracked the dynamics of consonant-related informa-
tion in the cortex. We hypothesized that the information
responsible for distinguishing different consonants would
not only be contained in the spatial patterns of neural
responses, but also in the temporally evolving structure of
each evoked response. Thus, for two given consonants, we
attempted to discriminate between their neural responses in
three different classification analyses using sliding time-
windows of 20, 50, and 100 ms, respectively. Importantly,
the response at each adjacent time sample within a window
mapped onto an additional dimension in the classification
feature space [e.g., a 100 ms window and a sampling rate of
200 Hz resulted in a 20-dimensional (20-D) feature space].
In this fashion, with every increase in window size classifiers
were provided with additional temporal response structure,
and by comparing classification performance across the dif-
ferent window sizes, we were able to assess the relative
gains afforded by this additional information. To boost the
classification SNR, the neural responses of six trials within
each consonant category were averaged prior to classifica-
tion. In order to minimize the bias of classifiers toward any
one type of utterance (e.g., a question rather than statement
speaking style), averaging was constrained such that each of
the six trials pooled for averaging contained stimuli with a
different utterance style and/or vowel context.
The binary classification procedure described above was
repeated for all pairwise combinations of consonants and for
all subjects. To assess the significance of classification at the
group level [Fig. 3(A)–3(D)], Wilcoxon sign-rank tests were
carried out at each time point and corrected for multiple com-
parisons by controlling the false-discovery-rate (FDR;
Benjamini and Yekutieli, 2001). At the level of a single sub-
ject [Fig. 3(E)–3(F)], significance was determined using ran-
domization testing. Specifically, classification was performed
with randomly permuted class labels and the procedure was
repeated 1000 times. The performance of these randomized
models defined a classification noise floor, and time points
were deemed significant when the true classification perfor-
mance exceeded the 95 percentiles of the randomized runs
(FDR-corrected for multiple comparisons).
3. Cortical representation
Results were evaluated within the framework of
Representational Similarity Analysis (Nili et al., 2014;
Kriegeskorte et al., 2008). The classification performance
for all pairwise combinations of consonants defined a repre-
sentational structure that can be visualized as a dissimilaritymatrix (DSM), averaged across all subjects and time points
[Fig. 4(A)]. The DSM is diagonally symmetric, with the dif-
ferent consonant classes indexing the rows and columns.
Each cell indicates the dissimilarity of EEG responses corre-
sponding to the two referenced classes. To spatially illustrate
the structure of the cortical representation, multidimensional
scaling (MDS) was applied to the values in the mean DSM
using Kruskal’s normalized stress 1 criterion to obtain a
solution in three dimensions [Fig. 4(B)]. To evaluate the
extent to which these cortical distinctions between conso-
nants reflected their acoustic-phonetic features, the EEG
DSM was compared with three model DSMs. Specifically,
each model DSM coded the binary (1/0) dissimilarity
between consonants based on their membership within the
three respective articulatory feature groups: (1) manner of
articulation, (2) place of articulation, and (3) voicing. Model
DSMs reflecting a combination of these articulatory feature
groups were also constructed by summing the relevant artic-
ulatory DSMs. To initially evaluate their predictive capacity,
each model DSM was correlated with the time-averaged
EEG DSM. Next, to examine the temporal dynamics of the
relationship between articulatory features and cortical
responses, those articulatory features whose DSMs were sig-
nificantly correlated with the average EEG DSM were also
compared with time-varying EEG DSMs. Correlations were
computed using a rank-order measure (Kendall’s TauA; Nili
FIG. 1. Time-series corresponding to the first DSS component for one sub-
ject. Responses corresponding to each consonant are averaged across all
repeat observations for illustrative purposes only. Units are arbitrary as the
data were normalized beforehand. In all time-series plots, t¼ 0 corresponds
to the onset of the consonant. Line thickness reflects the 61 standard error
around the mean.
J. Acoust. Soc. Am. 144 (4), October 2018 Sankaran et al. 2465
et al., 2014). Additionally, to account for any covariance
between model DSMs themselves, partial correlations were
utilized, whereby the relationship between a given model
and EEG DSM was assessed while controlling for other
models. Significance of model correlations was assessed
using Wilcoxon sign-rank tests. Time-averaged comparisons
were Bonferroni corrected to control for multiple compari-
sons, while the time-evolving correlation analysis controlled
the FDR.
4. Covariance across subjects
To compare the DSMs of individual subjects with one
another, we used rank-order correlation (Kendall’s TauA).
This resulted in an nSubjects � nSubjects matrix in which
each cell indicated the correlation between the two respec-
tive subjects’ DSMs. We then averaged one half of the diag-
onally symmetric matrix to obtain the mean inter-subject
correlation. This process was repeated at each time-point to
obtain a curve of average correlation across time (Fig. 5).
Significance at each time-point was determined using ran-
domization testing, whereby the row and column labels of
individual DSMs were randomly shuffled before each repeat
correlation (n¼ 1000). The 95% confidence intervals of
these randomized runs determined the correlation noise floor
and significance was corrected for multiple comparisons by
controlling the FDR.
5. Auditory-nerve modelling
In order to probe transformations in consonant represen-
tations occurring between auditory periphery and cortex,
stimuli were modelled in terms of their discharge rate at the
output of the AN synapse. This was achieved using a phe-
nomenological model of the auditory periphery (Zilany and
Bruce, 2006; Zilany et al., 2009; Zilany et al., 2014). The
AN model has been rigorously validated against real physio-
logical AN responses to both simple and complex stimuli,
including tones, broadband noise, and speech-like sounds
(see Heinz, 2010 for a detailed review of the AN model).
Model threshold tuning curves have been well fit to the char-
acteristic frequency (CF; the frequency at which nerve fibers
respond to the lowest sound level) dependent variation in
bandwidth for normal-hearing cats. Many properties associ-
ated with nonlinear cochlear tuning are captured by the AN
model, including compression, suppression, broadened tun-
ing, and best-frequency shifts with increases in sound level.
The stochastic nature of AN responses is accounted for by a
non-homogeneous Poisson process that was modified to
include the effects of both absolute and relative refractory
periods. Although the Zilany and Bruce (2006) model was
chosen for this study, the results presented here do not
depend on this choice and several other AN models exist
that would be expected to produce similar results (see
Lopez-Poveda, 2005, for a review).
We chose to model consonants at the AN synapse stage
of auditory processing for several reasons. First, onset activ-
ity followed by neural adaptation in the AN synapse plays a
crucial role in the coding of transients, which are prominent
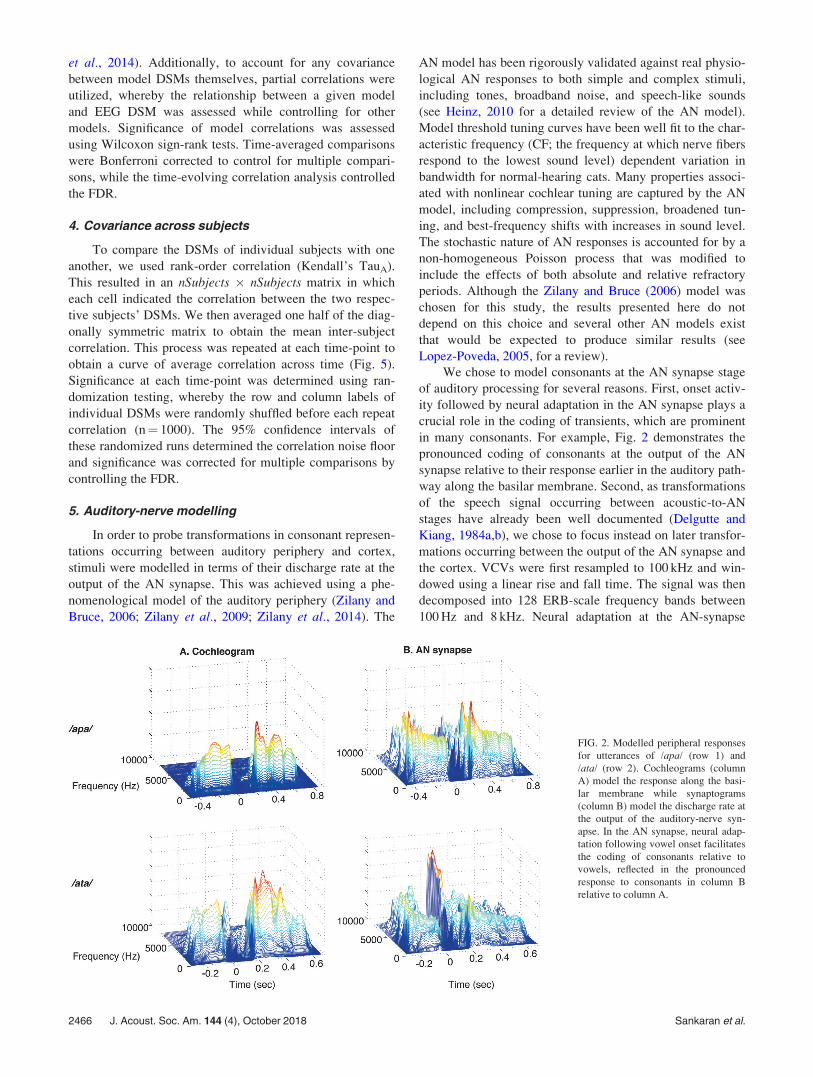
in many consonants. For example, Fig. 2 demonstrates the
pronounced coding of consonants at the output of the AN
synapse relative to their response earlier in the auditory path-
way along the basilar membrane. Second, as transformations
of the speech signal occurring between acoustic-to-AN
stages have already been well documented (Delgutte and
Kiang, 1984a,b), we chose to focus instead on later transfor-
mations occurring between the output of the AN synapse and
the cortex. VCVs were first resampled to 100 kHz and win-
dowed using a linear rise and fall time. The signal was then
decomposed into 128 ERB-scale frequency bands between
100 Hz and 8 kHz. Neural adaptation at the AN-synapse
FIG. 2. Modelled peripheral responses
for utterances of /apa/ (row 1) and
/ata/ (row 2). Cochleograms (column
A) model the response along the basi-
lar membrane while synaptograms
(column B) model the discharge rate at
the output of the auditory-nerve syn-
apse. In the AN synapse, neural adap-
tation following vowel onset facilitates
the coding of consonants relative to
vowels, reflected in the pronounced
response to consonants in column B
relative to column A.
2466 J. Acoust. Soc. Am. 144 (4), October 2018 Sankaran et al.
stage was modelled using both exponential and power law
dynamics (see Zilany et al., 2009, for more details). For each
VCV utterance, spectrograms of AN-synapse activity (syn-
aptograms) were computed by finding the energy in each fre-
quency channel across a 10 ms frame with a 50% overlap
between adjacent frames.
6. Auditory-nerve representation
We sought to derive distances between the different con-
sonants based on the similarity of their respective AN
responses at each time point, constituting the peripheral ana-
logue of the EEG DSMs. To achieve this, MVPA was now
applied to the peripheral data, whereby binary classifiers were
both trained and tested on their ability to discriminate between
the AN-responses of a given consonant-pair. First, the 90
unique AN synaptograms corresponding to different utteran-
ces of the same consonant were treated as “observations,” and
each frequency-channel � time synaptogram was epoched in
an identical fashion to the EEG data (from �200 to 600 ms
relative to consonant onset). We then applied principle com-
ponents analysis (PCA) to reduce the dimensionality of AN
datasets. PCA reduced the 128 frequency-channels to 18 com-
ponents while retaining 99% of the variance. Pairwise classifi-
cation of consonants was then performed in an identical
fashion to the prior EEG analysis—using a linear discriminant
classifier with 10-fold cross validation. Importantly, the tem-
poral characteristics of the sliding classification window were
identical to the earlier EEG analysis (100 ms window moving
in 5 ms steps), ensuring that comparisons made between corti-
cal and peripheral domains were temporally unbiased. To test
significance of AN classification, a noise-floor was generated
by repeatedly attempting to classify stochastically generated
AN spike-trains (n¼ 500). The classification of all pairwise
combinations of consonants based on their respective AN-
responses resulted in peripheral DSMs at each time point
[Fig. 6(B)].
7. Cortical-peripheral covariance
To examine the relationship between stimulus represen-
tations in the cortex and periphery, EEG-based DSMs at
every time-point were compared with AN-based DSMs at
every time point using rank-order correlation (Kendall’s
TauA). This resulted in a timepoints � timepoints matrix of
correlation values indexing the degree of covariance
between the two domains at various time lags (Fig. 7).
III. RESULTS
Our primary goal was to determine whether distinctions
between different consonants were observable in their
corresponding evoked EEG activity. Visually examining the
average neural responses for each consonant in one subject
(Fig. 1), we found that mean responses were ill-fit for
elucidating any distinctions between different consonants.
Because of this, we adopted a multivariate machine-learning
approach, whereby classifiers were trained and tested on
their ability to discriminate between responses based on fine-
grained spatiotemporal patterns of activation (see methods).
On average, we found that classifiers could successfully
discriminate between the neural activity evoked in response
to two different consonants. Figure 3(A) displays the average
classification accuracy for discriminating between all pair-
wise combinations of consonant-evoked responses across all
participants. Before onset, accuracy is at chance (50%)
because consonant-related information is yet to activate the
cortex. However, classifier performance rises after onset and
peaks within approximately 200–300 ms, suggesting that, on
average, cortical distinctions between consonants were max-
imal during this period. We found that average classification
performance improved monotonically with increases in the
classification-window size (from 20 to 100 ms), underscoring
the discriminant utility provided by additional temporal
information (see Sec. II E 2). Critically, the differences in
classification performance across individual consonant-pairs
were highly correlated across the three different window
sizes (all correlations had Pearson’s r� 0.96; p � 0.001),
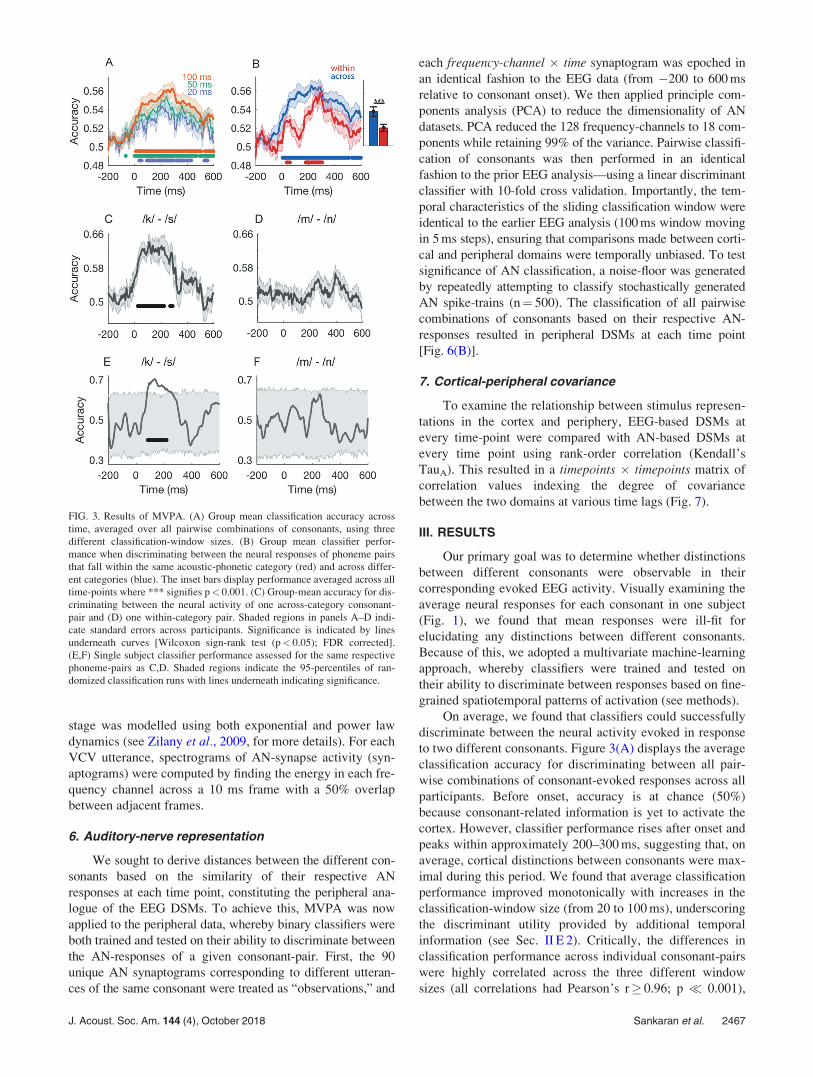
FIG. 3. Results of MVPA. (A) Group mean classification accuracy across
time, averaged over all pairwise combinations of consonants, using three
different classification-window sizes. (B) Group mean classifier perfor-
mance when discriminating between the neural responses of phoneme pairs
that fall within the same acoustic-phonetic category (red) and across differ-
ent categories (blue). The inset bars display performance averaged across all
time-points where *** signifies p< 0.001. (C) Group-mean accuracy for dis-
criminating between the neural activity of one across-category consonant-
pair and (D) one within-category pair. Shaded regions in panels A–D indi-
cate standard errors across participants. Significance is indicated by lines
underneath curves [Wilcoxon sign-rank test (p< 0.05); FDR corrected].
(E,F) Single subject classifier performance assessed for the same respective
phoneme-pairs as C,D. Shaded regions indicate the 95-percentiles of ran-
domized classification runs with lines underneath indicating significance.
J. Acoust. Soc. Am. 144 (4), October 2018 Sankaran et al. 2467
indicating that changes in the window size did not alter the
relative pattern of discriminability between consonants, only
the absolute performance of the classifiers. For this reason,
all subsequent analyses are based on a 100 ms classification
window.
Next, we tested whether patterns of cortical similarity
between consonants reflected their perceptual and articula-
tory groupings. We hypothesized that discriminability would
be poorer (lower accuracy) when classifying EEG responses
of two consonants within the same perceptual confusion
group, but greater when classifying responses of consonant-
pairs that span multiple groups. For our stimulus set, prior
literature indicate the following confusion groups: unvoicedplosives (/p/, /t/, /k/), voiced plosives (/b/, /d/, /g/), fricatives(/s/, /S/, /f/), and nasals (/m/, /n/) (Miller and Nicely, 1955;
Allen, 2005; Phatak et al., 2008). The average classification
performance, assessed separately for within and across group
consonant pairs, is shown in Fig. 3(B). At the group level,
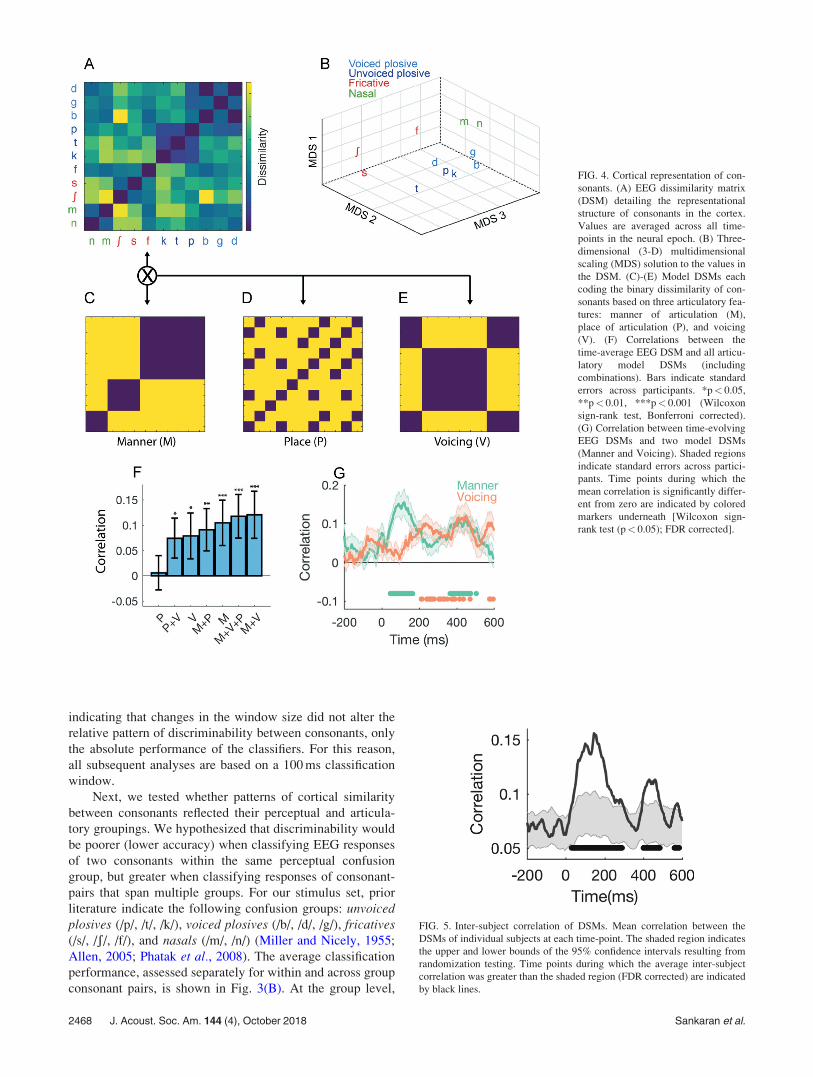
FIG. 4. Cortical representation of con-
sonants. (A) EEG dissimilarity matrix
(DSM) detailing the representational
structure of consonants in the cortex.
Values are averaged across all time-
points in the neural epoch. (B) Three-
dimensional (3-D) multidimensional
scaling (MDS) solution to the values in
the DSM. (C)-(E) Model DSMs each
coding the binary dissimilarity of con-
sonants based on three articulatory fea-
tures: manner of articulation (M),
place of articulation (P), and voicing
(V). (F) Correlations between the
time-average EEG DSM and all articu-
latory model DSMs (including
combinations). Bars indicate standard
errors across participants. *p< 0.05,
**p< 0.01, ***p< 0.001 (Wilcoxon
sign-rank test, Bonferroni corrected).
(G) Correlation between time-evolving
EEG DSMs and two model DSMs
(Manner and Voicing). Shaded regions
indicate standard errors across partici-
pants. Time points during which the
mean correlation is significantly differ-
ent from zero are indicated by colored
markers underneath [Wilcoxon sign-
rank test (p< 0.05); FDR corrected].
FIG. 5. Inter-subject correlation of DSMs. Mean correlation between the
DSMs of individual subjects at each time-point. The shaded region indicates
the upper and lower bounds of the 95% confidence intervals resulting from
randomization testing. Time points during which the average inter-subject
correlation was greater than the shaded region (FDR corrected) are indicated
by black lines.
2468 J. Acoust. Soc. Am. 144 (4), October 2018 Sankaran et al.
results were consistent with the hypothesis stated above.
That is, performance was higher, on average, when discrimi-
nating between responses of consonant pairs belonging to
different confusion groups. This was also evidenced at the
level of individual consonant pairs. For example, EEG
responses to /k/ and /s/ were highly dissimilar from one
another [Fig. 3(C)], but results suggest that the two nasals
(/m/ and /n/) evoked more similar patterns of cortical activa-
tion [Fig. 3(D)]. The same trends persisted at the single
subject level [Figs. 3(E) and 3(F)], suggesting that the above
group-level results reflect veridical neural distinctions rather
than noise. Nevertheless, the low SNR of single-subject clas-
sification, as indicated by the 95 percentile bands, precludes
a strong interpretation of current results at the resolution of
an individual listener.
Using the accuracy of each pairwise classification as a
measure of cortical dissimilarity between two given conso-
nants, we visualized the collective representational structure
in tabular form as a DSM averaged across all time-points
[Fig. 4(A); hotter color corresponds to greater dissimilarity].
Again, clustering of consonants in a manner consistent with
perceptual groupings is evident in the DSM. For example,
/k/ is similar to /t/ and /p/, but distant from /f/, /s/, and /S/.
We used multidimensional scaling (MDS) to more intui-
tively illustrate the structure of the DSM [Fig. 4(B)]. MDS
attempts to optimally preserve the structure of the DSM,
therefore the distance between two consonants in the MDS
solution can be construed as their representational distance
in the cortex. Visual inspection of the MDS solution revealed
that the nasals (/m/ and /n/) and sibilant fricatives (/s/ and
/S/) clustered together in distinct regions of representational
space. To a lesser extent, voiced (/b/, /d/, /g/) and unvoiced
(/p/, /t/, /k/) plosives were distinguished in MDS space. To
explicitly test whether EEG dissimilarities between conso-
nants reflected their articulatory features, we compared the
geometric structure of the EEG DSM with several articula-
tory model DSMs [Figs. 4(C)–4(E)] that coded dissimilarity
as a binary [1/0] measure of a given consonant-pair’s mem-
bership within the [different/same] articulatory feature
group, respectively. Correlations between the time-averaged
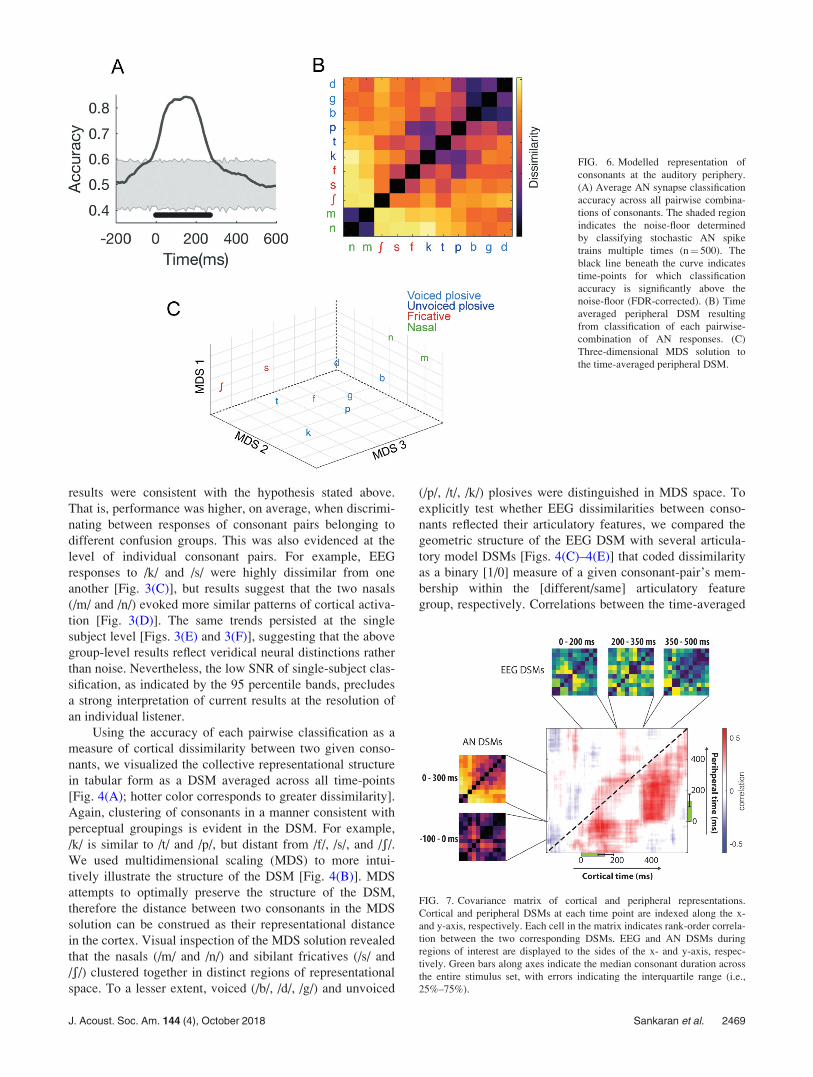
FIG. 6. Modelled representation of
consonants at the auditory periphery.
(A) Average AN synapse classification
accuracy across all pairwise combina-
tions of consonants. The shaded region
indicates the noise-floor determined
by classifying stochastic AN spike
trains multiple times (n¼ 500). The
black line beneath the curve indicates
time-points for which classification
accuracy is significantly above the
noise-floor (FDR-corrected). (B) Time
averaged peripheral DSM resulting
from classification of each pairwise-
combination of AN responses. (C)
Three-dimensional MDS solution to
the time-averaged peripheral DSM.
FIG. 7. Covariance matrix of cortical and peripheral representations.
Cortical and peripheral DSMs at each time point are indexed along the x-
and y-axis, respectively. Each cell in the matrix indicates rank-order correla-
tion between the two corresponding DSMs. EEG and AN DSMs during
regions of interest are displayed to the sides of the x- and y-axis, respec-
tively. Green bars along axes indicate the median consonant duration across
the entire stimulus set, with errors indicating the interquartile range (i.e.,
25%–75%).
J. Acoust. Soc. Am. 144 (4), October 2018 Sankaran et al. 2469
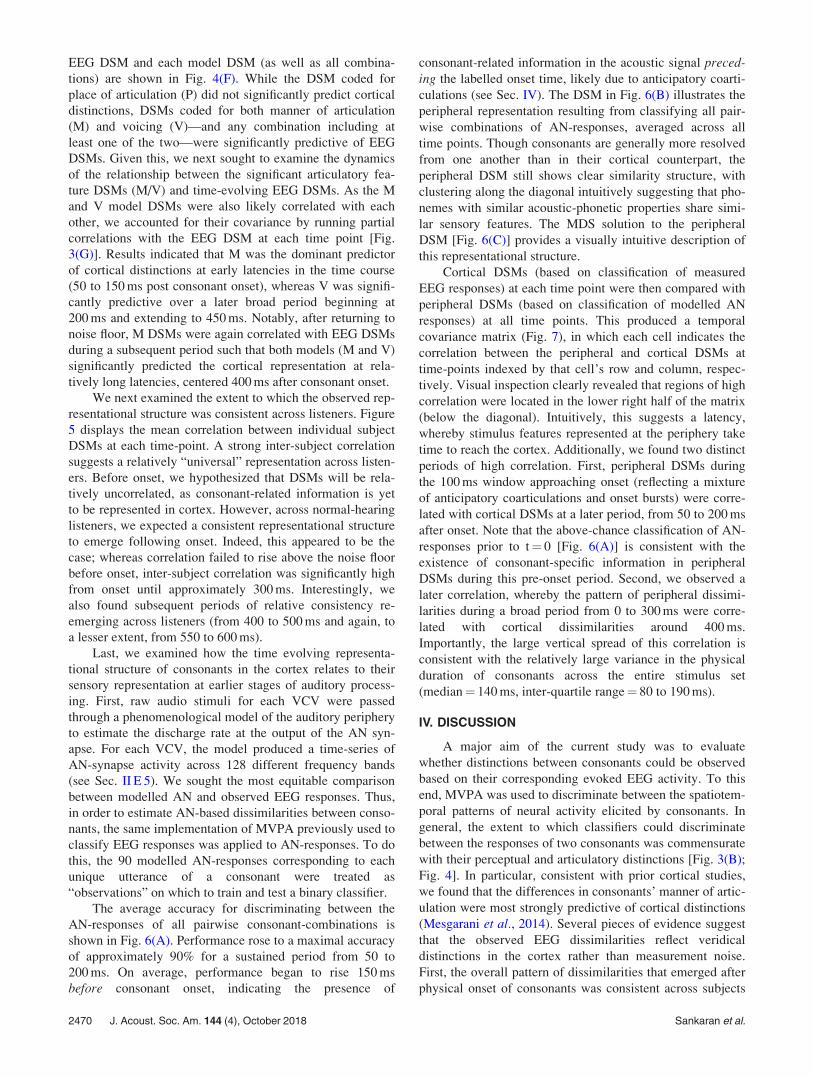
EEG DSM and each model DSM (as well as all combina-
tions) are shown in Fig. 4(F). While the DSM coded for
place of articulation (P) did not significantly predict cortical
distinctions, DSMs coded for both manner of articulation
(M) and voicing (V)—and any combination including at
least one of the two—were significantly predictive of EEG
DSMs. Given this, we next sought to examine the dynamics
of the relationship between the significant articulatory fea-
ture DSMs (M/V) and time-evolving EEG DSMs. As the M
and V model DSMs were also likely correlated with each
other, we accounted for their covariance by running partial
correlations with the EEG DSM at each time point [Fig.
3(G)]. Results indicated that M was the dominant predictor
of cortical distinctions at early latencies in the time course
(50 to 150 ms post consonant onset), whereas V was signifi-
cantly predictive over a later broad period beginning at
200 ms and extending to 450 ms. Notably, after returning to
noise floor, M DSMs were again correlated with EEG DSMs
during a subsequent period such that both models (M and V)
significantly predicted the cortical representation at rela-
tively long latencies, centered 400 ms after consonant onset.
We next examined the extent to which the observed rep-
resentational structure was consistent across listeners. Figure
5 displays the mean correlation between individual subject
DSMs at each time-point. A strong inter-subject correlation
suggests a relatively “universal” representation across listen-
ers. Before onset, we hypothesized that DSMs will be rela-
tively uncorrelated, as consonant-related information is yet
to be represented in cortex. However, across normal-hearing
listeners, we expected a consistent representational structure
to emerge following onset. Indeed, this appeared to be the
case; whereas correlation failed to rise above the noise floor
before onset, inter-subject correlation was significantly high
from onset until approximately 300 ms. Interestingly, we
also found subsequent periods of relative consistency re-
emerging across listeners (from 400 to 500 ms and again, to
a lesser extent, from 550 to 600 ms).
Last, we examined how the time evolving representa-
tional structure of consonants in the cortex relates to their
sensory representation at earlier stages of auditory process-
ing. First, raw audio stimuli for each VCV were passed
through a phenomenological model of the auditory periphery
to estimate the discharge rate at the output of the AN syn-
apse. For each VCV, the model produced a time-series of
AN-synapse activity across 128 different frequency bands
(see Sec. II E 5). We sought the most equitable comparison
between modelled AN and observed EEG responses. Thus,
in order to estimate AN-based dissimilarities between conso-
nants, the same implementation of MVPA previously used to
classify EEG responses was applied to AN-responses. To do
this, the 90 modelled AN-responses corresponding to each
unique utterance of a consonant were treated as
“observations” on which to train and test a binary classifier.
The average accuracy for discriminating between the
AN-responses of all pairwise consonant-combinations is
shown in Fig. 6(A). Performance rose to a maximal accuracy
of approximately 90% for a sustained period from 50 to
200 ms. On average, performance began to rise 150 ms
before consonant onset, indicating the presence of
consonant-related information in the acoustic signal preced-ing the labelled onset time, likely due to anticipatory coarti-
culations (see Sec. IV). The DSM in Fig. 6(B) illustrates the
peripheral representation resulting from classifying all pair-
wise combinations of AN-responses, averaged across all
time points. Though consonants are generally more resolved
from one another than in their cortical counterpart, the
peripheral DSM still shows clear similarity structure, with
clustering along the diagonal intuitively suggesting that pho-
nemes with similar acoustic-phonetic properties share simi-
lar sensory features. The MDS solution to the peripheral
DSM [Fig. 6(C)] provides a visually intuitive description of
this representational structure.
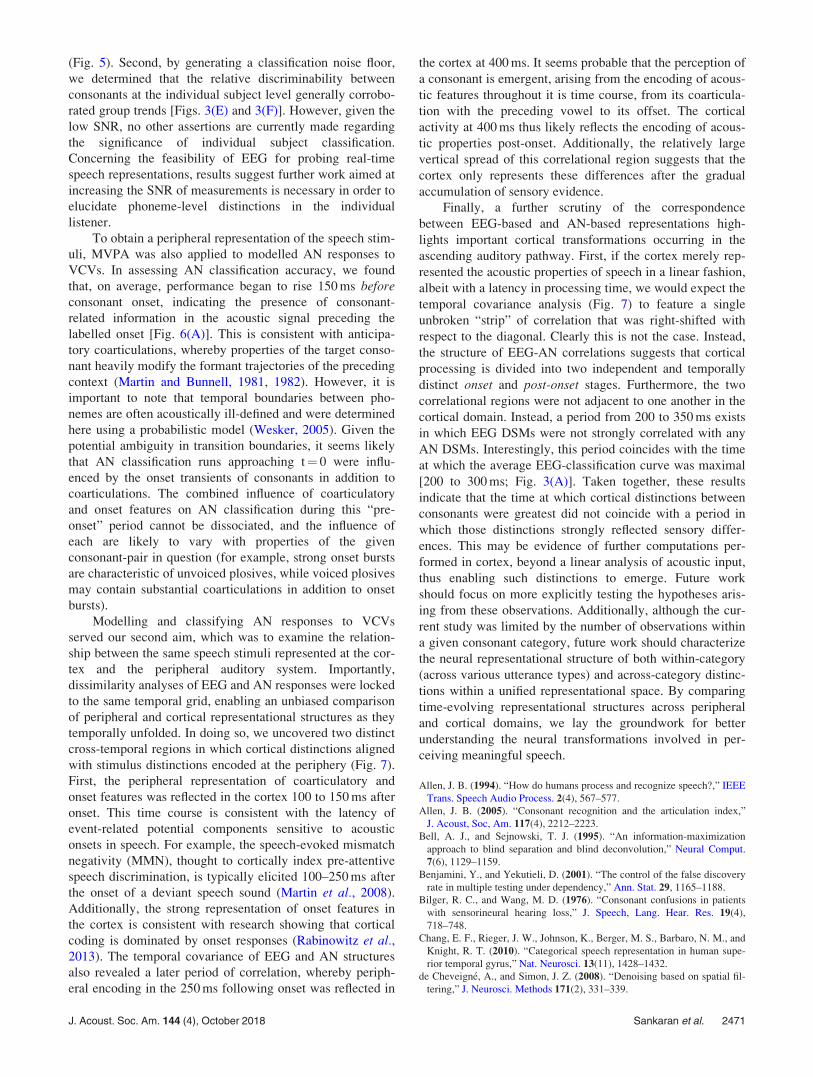
Cortical DSMs (based on classification of measured
EEG responses) at each time point were then compared with
peripheral DSMs (based on classification of modelled AN
responses) at all time points. This produced a temporal
covariance matrix (Fig. 7), in which each cell indicates the
correlation between the peripheral and cortical DSMs at
time-points indexed by that cell’s row and column, respec-
tively. Visual inspection clearly revealed that regions of high
correlation were located in the lower right half of the matrix
(below the diagonal). Intuitively, this suggests a latency,
whereby stimulus features represented at the periphery take
time to reach the cortex. Additionally, we found two distinct
periods of high correlation. First, peripheral DSMs during
the 100 ms window approaching onset (reflecting a mixture
of anticipatory coarticulations and onset bursts) were corre-
lated with cortical DSMs at a later period, from 50 to 200 ms
after onset. Note that the above-chance classification of AN-
responses prior to t¼ 0 [Fig. 6(A)] is consistent with the
existence of consonant-specific information in peripheral
DSMs during this pre-onset period. Second, we observed a
later correlation, whereby the pattern of peripheral dissimi-
larities during a broad period from 0 to 300 ms were corre-
lated with cortical dissimilarities around 400 ms.
Importantly, the large vertical spread of this correlation is
consistent with the relatively large variance in the physical
duration of consonants across the entire stimulus set
(median¼ 140 ms, inter-quartile range¼ 80 to 190 ms).
IV. DISCUSSION
A major aim of the current study was to evaluate
whether distinctions between consonants could be observed
based on their corresponding evoked EEG activity. To this
end, MVPA was used to discriminate between the spatiotem-
poral patterns of neural activity elicited by consonants. In
general, the extent to which classifiers could discriminate
between the responses of two consonants was commensurate
with their perceptual and articulatory distinctions [Fig. 3(B);
Fig. 4]. In particular, consistent with prior cortical studies,
we found that the differences in consonants’ manner of artic-
ulation were most strongly predictive of cortical distinctions
(Mesgarani et al., 2014). Several pieces of evidence suggest
that the observed EEG dissimilarities reflect veridical
distinctions in the cortex rather than measurement noise.
First, the overall pattern of dissimilarities that emerged after
physical onset of consonants was consistent across subjects
2470 J. Acoust. Soc. Am. 144 (4), October 2018 Sankaran et al.
(Fig. 5). Second, by generating a classification noise floor,
we determined that the relative discriminability between
consonants at the individual subject level generally corrobo-
rated group trends [Figs. 3(E) and 3(F)]. However, given the
low SNR, no other assertions are currently made regarding
the significance of individual subject classification.
Concerning the feasibility of EEG for probing real-time
speech representations, results suggest further work aimed at
increasing the SNR of measurements is necessary in order to
elucidate phoneme-level distinctions in the individual
listener.
To obtain a peripheral representation of the speech stim-
uli, MVPA was also applied to modelled AN responses to
VCVs. In assessing AN classification accuracy, we found
that, on average, performance began to rise 150 ms beforeconsonant onset, indicating the presence of consonant-
related information in the acoustic signal preceding the
labelled onset [Fig. 6(A)]. This is consistent with anticipa-
tory coarticulations, whereby properties of the target conso-
nant heavily modify the formant trajectories of the preceding
context (Martin and Bunnell, 1981, 1982). However, it is
important to note that temporal boundaries between pho-
nemes are often acoustically ill-defined and were determined
here using a probabilistic model (Wesker, 2005). Given the
potential ambiguity in transition boundaries, it seems likely
that AN classification runs approaching t¼ 0 were influ-
enced by the onset transients of consonants in addition to
coarticulations. The combined influence of coarticulatory
and onset features on AN classification during this “pre-
onset” period cannot be dissociated, and the influence of
each are likely to vary with properties of the given
consonant-pair in question (for example, strong onset bursts
are characteristic of unvoiced plosives, while voiced plosives
may contain substantial coarticulations in addition to onset
bursts).
Modelling and classifying AN responses to VCVs
served our second aim, which was to examine the relation-
ship between the same speech stimuli represented at the cor-
tex and the peripheral auditory system. Importantly,
dissimilarity analyses of EEG and AN responses were locked
to the same temporal grid, enabling an unbiased comparison
of peripheral and cortical representational structures as they
temporally unfolded. In doing so, we uncovered two distinct
cross-temporal regions in which cortical distinctions aligned
with stimulus distinctions encoded at the periphery (Fig. 7).
First, the peripheral representation of coarticulatory and
onset features was reflected in the cortex 100 to 150 ms after
onset. This time course is consistent with the latency of
event-related potential components sensitive to acoustic
onsets in speech. For example, the speech-evoked mismatch
negativity (MMN), thought to cortically index pre-attentive
speech discrimination, is typically elicited 100–250 ms after
the onset of a deviant speech sound (Martin et al., 2008).
Additionally, the strong representation of onset features in
the cortex is consistent with research showing that cortical
coding is dominated by onset responses (Rabinowitz et al.,2013). The temporal covariance of EEG and AN structures
also revealed a later period of correlation, whereby periph-
eral encoding in the 250 ms following onset was reflected in
the cortex at 400 ms. It seems probable that the perception of
a consonant is emergent, arising from the encoding of acous-
tic features throughout it is time course, from its coarticula-
tion with the preceding vowel to its offset. The cortical
activity at 400 ms thus likely reflects the encoding of acous-
tic properties post-onset. Additionally, the relatively large
vertical spread of this correlational region suggests that the
cortex only represents these differences after the gradual
accumulation of sensory evidence.
Finally, a further scrutiny of the correspondence
between EEG-based and AN-based representations high-
lights important cortical transformations occurring in the
ascending auditory pathway. First, if the cortex merely rep-
resented the acoustic properties of speech in a linear fashion,
albeit with a latency in processing time, we would expect the
temporal covariance analysis (Fig. 7) to feature a single
unbroken “strip” of correlation that was right-shifted with
respect to the diagonal. Clearly this is not the case. Instead,
the structure of EEG-AN correlations suggests that cortical
processing is divided into two independent and temporally
distinct onset and post-onset stages. Furthermore, the two
correlational regions were not adjacent to one another in the
cortical domain. Instead, a period from 200 to 350 ms exists
in which EEG DSMs were not strongly correlated with any
AN DSMs. Interestingly, this period coincides with the time
at which the average EEG-classification curve was maximal
[200 to 300 ms; Fig. 3(A)]. Taken together, these results
indicate that the time at which cortical distinctions between
consonants were greatest did not coincide with a period in
which those distinctions strongly reflected sensory differ-
ences. This may be evidence of further computations per-
formed in cortex, beyond a linear analysis of acoustic input,
thus enabling such distinctions to emerge. Future work
should focus on more explicitly testing the hypotheses aris-
ing from these observations. Additionally, although the cur-
rent study was limited by the number of observations within
a given consonant category, future work should characterize
the neural representational structure of both within-category
(across various utterance types) and across-category distinc-
tions within a unified representational space. By comparing
time-evolving representational structures across peripheral
and cortical domains, we lay the groundwork for better
understanding the neural transformations involved in per-
ceiving meaningful speech.
Allen, J. B. (1994). “How do humans process and recognize speech?,” IEEE
Trans. Speech Audio Process. 2(4), 567–577.
Allen, J. B. (2005). “Consonant recognition and the articulation index,”
J. Acoust, Soc, Am. 117(4), 2212–2223.
Bell, A. J., and Sejnowski, T. J. (1995). “An information-maximization
approach to blind separation and blind deconvolution,” Neural Comput.
7(6), 1129–1159.
Benjamini, Y., and Yekutieli, D. (2001). “The control of the false discovery
rate in multiple testing under dependency,” Ann. Stat. 29, 1165–1188.
Bilger, R. C., and Wang, M. D. (1976). “Consonant confusions in patients
with sensorineural hearing loss,” J. Speech, Lang. Hear. Res. 19(4),
718–748.
Chang, E. F., Rieger, J. W., Johnson, K., Berger, M. S., Barbaro, N. M., and
Knight, R. T. (2010). “Categorical speech representation in human supe-
rior temporal gyrus,” Nat. Neurosci. 13(11), 1428–1432.
de Cheveign�e, A., and Simon, J. Z. (2008). “Denoising based on spatial fil-
tering,” J. Neurosci. Methods 171(2), 331–339.
J. Acoust. Soc. Am. 144 (4), October 2018 Sankaran et al. 2471
Delgutte, B., and Kiang, N. Y. (1984a). “Speech coding in the auditory
nerve: III. Voiceless fricative consonants,” J. Acoust. Soc. Am. 75(3),
887–896.
Delgutte, B., and Kiang, N. Y. (1984b). “Speech coding in the auditory
nerve: IV. Sounds with consonant-like dynamic characteristics,”
J. Acoust. Soc. Am. 75(3), 897–907.
Dichter, B. K., Bouchard, K. E., and Chang, E. F. (2016). “Dynamic struc-
ture of neural variability in the cortical representation of speech sounds,”
J. Neurosci. 36(28), 7453–7463.
Di Liberto, G. M., O’Sullivan, J. A., and Lalor, E. C. (2015). “Low-fre-
quency cortical entrainment to speech reflects phoneme-level processing,”
Curr. Biol. 25(19), 2457–2465.
Ding, N., Melloni, L., Zhang, H., Tian, X., and Poeppel, D. (2016).
“Cortical tracking of hierarchical linguistic structures in connected
speech,” Nat. Neurosci. 19(1), 158–164.
Ding, N., and Simon, J. Z. (2011). “Neural coding of continuous speech in
auditory cortex during monaural and dichotic listening,” J. Neurophysiol.
107(1), 78–89.
Ding, N., and Simon, J. Z. (2013). “Adaptive temporal encoding leads to a
background-insensitive cortical representation of speech,” J. Neurosci.
33(13), 5728–5735.
Doyle, K. J., Danhauer, J. L., and Edgerton, B. J. (1981). “Features from
normal and sensorineural listeners’ nonsense syllable test errors,” Ear
Hear. 2(3), 117–121.
Duda, R. O., Hart, P. E., and Stork, D. G. (2012). Pattern Classification(Wiley, New York).
Grootswagers, T., Wardle, S. G., and Carlson, T. A. (2017). “Decoding
dynamic brain patterns from evoked responses: A tutorial on multivariate
pattern analysis applied to time series neuroimaging data,” J. Cognit.
Neurosci. 29(4), 677–697.
Haxby, J. V., Connolly, A. C., and Guntupalli, J. S. (2014). “Decoding neu-
ral representational spaces using multivariate pattern analysis,” Ann. Rev.
Neurosci. 37, 435–456.
Heinz, M. G. (2010). “Computational modeling of sensorineural hearing
loss,” in Computational Models of the Auditory System, edited by R.
Meddis, E. A. Lopez-Poveda, A. N. Popper, and R. R. Fay (Springer, New
York), pp. 177–202.
Huth, A. G., de Heer, W. A., Griffiths, T. L., Theunissen, F. E., and Gallant,
J. L. (2016). “Natural speech reveals the semantic maps that tile human
cerebral cortex,” Nature 532(7600), 453–458.
Khalighinejad, B., da Silva, G. C., and Mesgarani, N. (2017). “Dynamic
encoding of acoustic features in neural responses to continuous speech,”
J. Neurosci. 37(8), 2176–2185.
Kriegeskorte, N., Mur, M., and Bandettini, P. A. (2008). “Representational
similarity analysis—connecting the branches of systems neuroscience,”
Front. Syst. Neurosci. 2, 4.
Leonard, M. K., and Chang, E. F. (2014). “Dynamic speech representations
in the human temporal lobe,” Trends Cognit. Sci. 18(9), 472–479.
Lopez-Poveda, EA. (2005). “Spectral processing by the peripheral auditory
system: Facts and models,” Int. Rev. Neurobiol. 70, 7–48.
Martin, B. A., Tremblay, K. L., and Korczak, P. (2008). “Speech evoked
potentials: From the laboratory to the clinic,” Ear Hear. 29(3), 285–313.
Martin, J. G., and Bunnell, H. T. (1981). “Perception of anticipatory coarti-
culation effects,” J. Acoust. Soc. Am. 69(2), 559–567.
Martin, J. G., and Bunnell, H. T. (1982). “Perception of anticipatory coarti-
culation effects in vowel–stop consonant–vowel sequences,” J. Exp.
Psychol.: Hum. Percept. Perform. 8(3), 473–488.
Mesgarani, N., Cheung, C., Johnson, K., and Chang, E. F. (2014). “Phonetic
feature encoding in human superior temporal gyrus,” Science 343(6174),
1006–1010.
Miller, G. A., and Nicely, P. E. (1955). “An analysis of perceptual confu-
sions among some English consonants,” J. Acoust. Soc. Am. 27(2),
338–352.
Nili, H., Wingfield, C., Walther, A., Su, L., Marslen-Wilson, W., and
Kriegeskorte, N. (2014). “A toolbox for representational similarity analy-
sis,” PLoS Comput. Biol. 10(4), e1003553.
Peelle, J. E., Gross, J., and Davis, M. H. (2012). “Phase-locked responses to
speech in human auditory cortex are enhanced during comprehension,”
Cereb. Cortex 23(6), 1378–1387.
Phatak, S. A., Lovitt, A., and Allen, J. B. (2008). “Consonant confusions in
white noise,” J. Acoust. Soc. Am. 124(2), 1220–1233.
Phatak, S. A., Yoon, Y. S., Gooler, D. M., and Allen, J. B. (2009).
“Consonant recognition loss in hearing impaired listeners,” J. Acoust. Soc.
Am. 126(5), 2683–2694.
Phillips, S. L., Richter, S. J., and McPherson, D. (2009). “Voiced initial
consonant perception deficits in older listeners with hearing loss and
good and poor word recognition,” J. Speech, Lang. Hear. Res. 52(1),
118–129.
Rabinowitz, N. C., Willmore, B. D., King, A. J., and Schnupp, J. W. (2013).
“Constructing noise-invariant representations of sound in the auditory
pathway,” PLoS Biol. 11(11), e1001710.
S€arel€a, J., and Valpola, H. (2005). “Denoising source separation,” J. Mach.
Learn. Res. 6(Mar), 233–272.
Walden, B. E., and Montgomery, A. A. (1975). “Dimensions of consonant
perception in normal and hearing-impaired listeners,” J. Speech, Lang.,
Hear. Res. 18(3), 444–455.
Wang, M. D., Reed, C. M., and Bilger, R. C. (1978). “A comparison of the
effects of filtering and sensorineural hearing loss on patterns of consonant
confusions,” J. Speech, Lang., Hear. Res. 21(1), 5–36.
Wesker, T., Meyer, B., Wagener, K., Anem€uller, J., Mertins, A., and
Kollmeier, B. (2005). “Oldenburg logatome speech corpus (OLLO) for
speech recognition experiments with humans and machines,” in NinthEuropean Conference on Speech Communication and Technology.
Zilany, M. S., and Bruce, I. C. (2006). “Modeling auditory-nerve responses
for high sound pressure levels in the normal and impaired auditory periph-
ery,” J. Acoust. Soc. Am. 120(3), 1446–1466.
Zilany, M. S., Bruce, I. C., and Carney, L. H. (2014). “Updated parameters
and expanded simulation options for a model of the auditory periphery,”
J. Acoust. Soc. Am. 135(1), 283–286.
Zilany, M. S., Bruce, I. C., Nelson, P. C., and Carney, L. H. (2009). “A phe-
nomenological model of the synapse between the inner hair cell and audi-
tory nerve: Long-term adaptation with power-law dynamics,” J. Acoust.
Soc. Am. 126(5), 2390–2412.
2472 J. Acoust. Soc. Am. 144 (4), October 2018 Sankaran et al.
Tracking the dynamic representation of consonants from auditory periphery to cortexNarayan Sankaran, Jayaganesh Swaminathan, Christophe Micheyl, Sridhar Kalluri, and Simon Carlile
Citation: The Journal of the Acoustical Society of America 144, 2462 (2018); doi: 10.1121/1.5065492View online: https://doi.org/10.1121/1.5065492View Table of Contents: http://asa.scitation.org/toc/jas/144/4Published by the Acoustical Society of America