Embed Size (px)
Citation preview
Tracking the movements of rig – Final Report for NZMRF Page 1 of 18
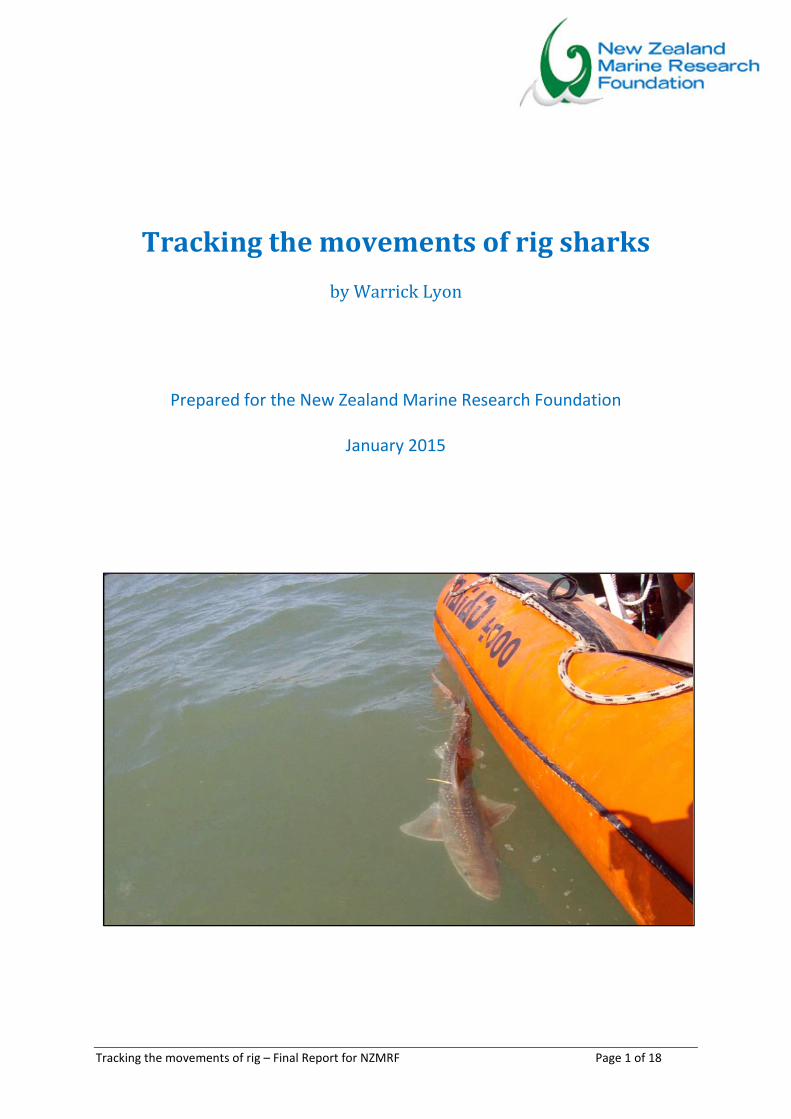
Tracking the movements of rig sharks
by Warrick Lyon
Prepared for the New Zealand Marine Research Foundation
January 2015
Tracking the movements of rig – Final Report for NZMRF Page 2 of 18
Contents Executive Summary .............................................................................................................................. 3
Acknowledgments ................................................................................................................................ 3
Introduction ......................................................................................................................................... 4
Objectives ............................................................................................................................................ 5
Method ................................................................................................................................................ 6
Results, discussion and conclusions ..................................................................................................... 9
Outputs .............................................................................................................................................. 12
Project material development ........................................................................................................... 12
Extension and Adoption ..................................................................................................................... 12
Financial summary ............................................................................................................................. 13
References ......................................................................................................................................... 13
Appendix ............................................................................................................................................ 14
Table 1: Tagged rig details, including biological measurements (M3 is a mature male), track
length, and the season tagged, all are within Porirua Harbour. ..................................................... 9
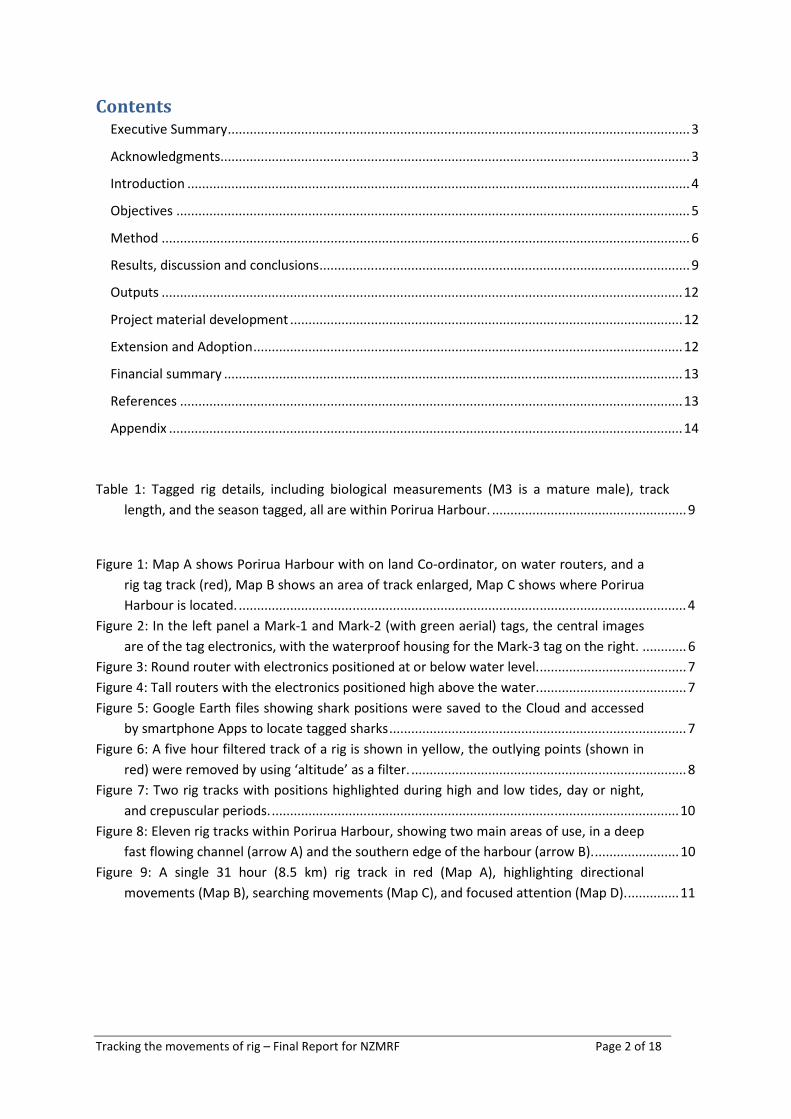
Figure 1: Map A shows Porirua Harbour with on land Co-ordinator, on water routers, and a
rig tag track (red), Map B shows an area of track enlarged, Map C shows where Porirua
Harbour is located. .......................................................................................................................... 4
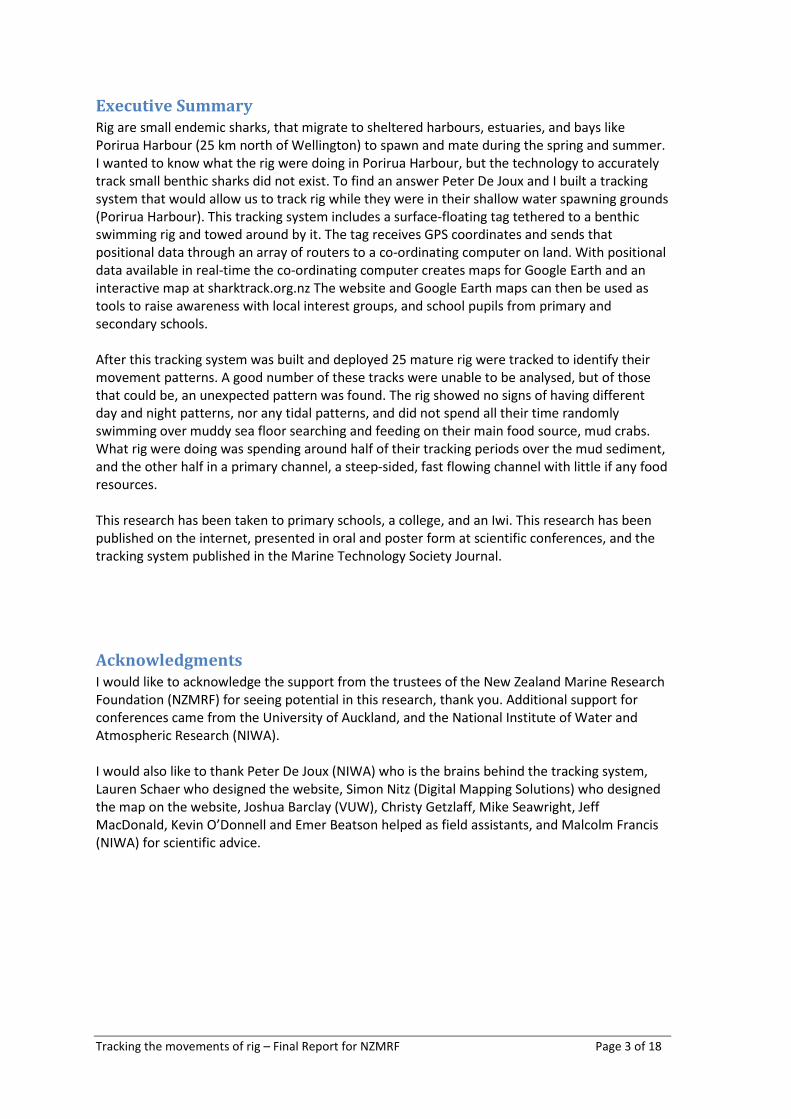
Figure 2: In the left panel a Mark-1 and Mark-2 (with green aerial) tags, the central images
are of the tag electronics, with the waterproof housing for the Mark-3 tag on the right. ............ 6
Figure 3: Round router with electronics positioned at or below water level. ........................................ 7
Figure 4: Tall routers with the electronics positioned high above the water. ........................................ 7
Figure 5: Google Earth files showing shark positions were saved to the Cloud and accessed
by smartphone Apps to locate tagged sharks ................................................................................. 7
Figure 6: A five hour filtered track of a rig is shown in yellow, the outlying points (shown in
red) were removed by using ‘altitude’ as a filter. ........................................................................... 8
Figure 7: Two rig tracks with positions highlighted during high and low tides, day or night,
and crepuscular periods. ............................................................................................................... 10
Figure 8: Eleven rig tracks within Porirua Harbour, showing two main areas of use, in a deep
fast flowing channel (arrow A) and the southern edge of the harbour (arrow B). ....................... 10
Figure 9: A single 31 hour (8.5 km) rig track in red (Map A), highlighting directional
movements (Map B), searching movements (Map C), and focused attention (Map D). .............. 11
Tracking the movements of rig – Final Report for NZMRF Page 3 of 18
Executive Summary
Rig are small endemic sharks, that migrate to sheltered harbours, estuaries, and bays like Porirua Harbour (25 km north of Wellington) to spawn and mate during the spring and summer. I wanted to know what the rig were doing in Porirua Harbour, but the technology to accurately track small benthic sharks did not exist. To find an answer Peter De Joux and I built a tracking system that would allow us to track rig while they were in their shallow water spawning grounds (Porirua Harbour). This tracking system includes a surface-floating tag tethered to a benthic swimming rig and towed around by it. The tag receives GPS coordinates and sends that positional data through an array of routers to a co-ordinating computer on land. With positional data available in real-time the co-ordinating computer creates maps for Google Earth and an interactive map at sharktrack.org.nz The website and Google Earth maps can then be used as tools to raise awareness with local interest groups, and school pupils from primary and secondary schools. After this tracking system was built and deployed 25 mature rig were tracked to identify their movement patterns. A good number of these tracks were unable to be analysed, but of those that could be, an unexpected pattern was found. The rig showed no signs of having different day and night patterns, nor any tidal patterns, and did not spend all their time randomly swimming over muddy sea floor searching and feeding on their main food source, mud crabs. What rig were doing was spending around half of their tracking periods over the mud sediment, and the other half in a primary channel, a steep-sided, fast flowing channel with little if any food resources. This research has been taken to primary schools, a college, and an Iwi. This research has been published on the internet, presented in oral and poster form at scientific conferences, and the tracking system published in the Marine Technology Society Journal.
Acknowledgments
I would like to acknowledge the support from the trustees of the New Zealand Marine Research Foundation (NZMRF) for seeing potential in this research, thank you. Additional support for conferences came from the University of Auckland, and the National Institute of Water and Atmospheric Research (NIWA). I would also like to thank Peter De Joux (NIWA) who is the brains behind the tracking system, Lauren Schaer who designed the website, Simon Nitz (Digital Mapping Solutions) who designed the map on the website, Joshua Barclay (VUW), Christy Getzlaff, Mike Seawright, Jeff MacDonald, Kevin O’Donnell and Emer Beatson helped as field assistants, and Malcolm Francis (NIWA) for scientific advice.
Tracking the movements of rig – Final Report for NZMRF Page 4 of 18
Introduction
Until 10 years ago I did not know that Porirua Harbour, my local estuary growing up in Mana, was full of sharks for half the year. After learning this I wanted to learn as much as I could about the rig that use Porirua Harbour. Rig, which are also known as spotted dogfish (Mustelus
lenticulatus) are from the Family Triakidae (Smoothounds), and are small endemic sharks found throughout New Zealand waters (Francis and Francis 1992). Rig make seasonal inshore migrations where they congregate in sheltered harbours and estuaries like Porirua Harbour to spawn and mate during spring and summer (Graham 1956; Francis and Mace 1980; Francis 1988). Rig give birth from late October to early December (Jones and Hadfield 1985; Francis and Francis 1992), when juveniles are born at 20–30 cm TL after an 11 month non-placental ovoviviparous gestation period (Francis and Mace 1980; Francis and Francis 1992). Following that, is a polyandrous mating where 42 % of litters have more than one father (Boomer et al. 2013). Males reach maturity at 72–87 cm (3.7–5 years) and females between 82 cm (4.7 years) and 102 cm (Francis and Francis 1992). Maximum size and age for rig is 1.5 m for females and 1.2 m for males, longevity probably exceeds 15 years, and may exceed 20 years (Francis and Ó Maolagáin 2000; Francis 2013).
Figure 1: Map A shows Porirua Harbour with on land Co-ordinator, on water routers, and a rig tag track (red), Map
B shows an area of track enlarged, Map C shows where Porirua Harbour is located.
A lot is known about rig biology, but I wanted to know i) how many rig use Porirua Harbour? ii) how long do they stay? iii) where in the harbour do they spend their time? These questions led me back to University to undertake a Ph.D. Questions 1 and 2 were easy enough to answer, but how could I learn where the rig spend their time? After looking at the tracking technology available and finding that the only viable way to track the long term movements of rig (acoustic tracking) had very poor positional accuracy ~300 m, I decided I needed to find a different way to find where rig spend their time. I then asked a colleague if we could build our own tracking system that would tell me where the rig were moving within Porirua Harbour with accuracy of
Tracking the movements of rig – Final Report for NZMRF Page 5 of 18
around 10–15 m. After discussing a number of options that included, triangulation, and using cell phone technology we decided on a GPS receiver combined with a radio transmitter that were housed in a float that remained on the water surface and was towed around the harbour by a 6 m tether between the float and the shark. When developed, tested, and in use these floating tags can send their GPS coordinates a maximum of 500 m in all directions, if the signal needs to travel further it uses a mesh of routers placed around the harbour that then pass the signal back to a coordinating computer on land (Figure 1), where data can be processed in real time. Being able to collect rig movement data I now have a better understanding of the ecosystem within Porirua Harbour and have been able to pass this new knowledge on to local schools as part of their science or biology programmes.
Objectives
The objectives for this research were to:
1. Build a shallow water tracking system to track rig in Porirua Harbour.
2. Identify the movement patterns of adult rig during their spawning season and to present this information on a website for educational purposes.
3. Speak to five local schools and to local interest groups with the view to passing on the
knowledge derived from this research.
4. Publish this research in a peer reviewed journal which will acknowledge your support.
Tracking the movements of rig – Final Report for NZMRF Page 6 of 18
Method
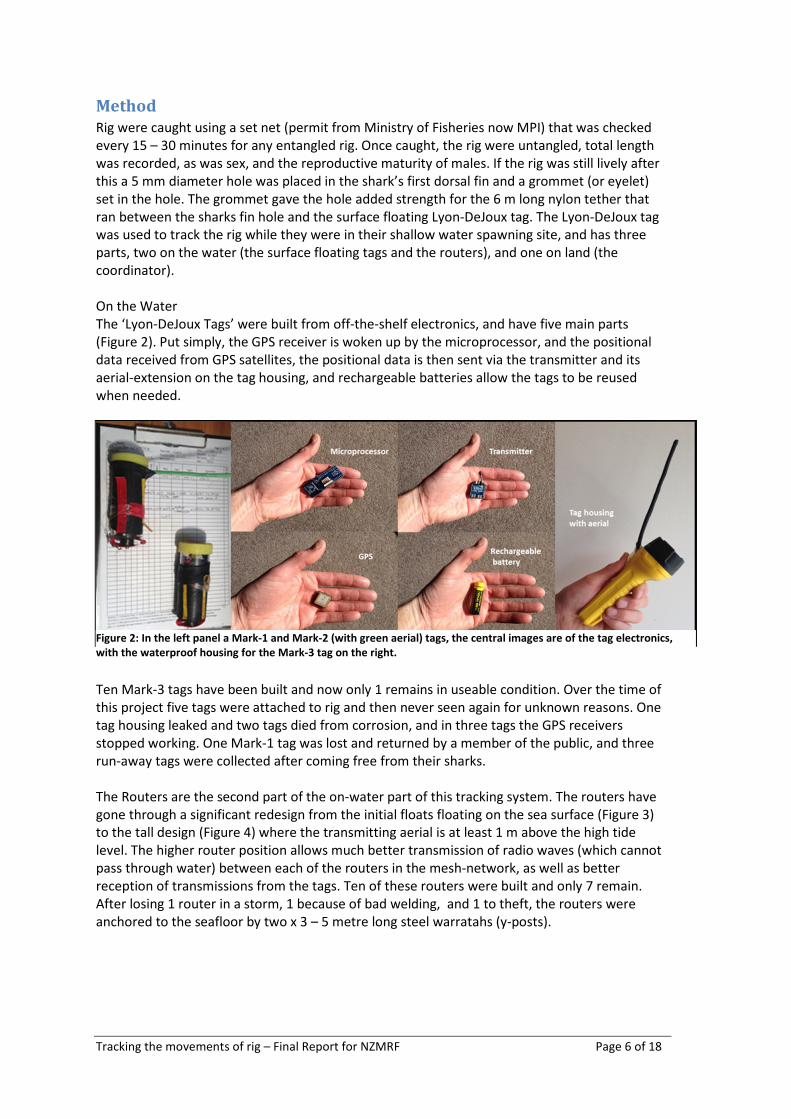
Rig were caught using a set net (permit from Ministry of Fisheries now MPI) that was checked every 15 – 30 minutes for any entangled rig. Once caught, the rig were untangled, total length was recorded, as was sex, and the reproductive maturity of males. If the rig was still lively after this a 5 mm diameter hole was placed in the shark’s first dorsal fin and a grommet (or eyelet) set in the hole. The grommet gave the hole added strength for the 6 m long nylon tether that ran between the sharks fin hole and the surface floating Lyon-DeJoux tag. The Lyon-DeJoux tag was used to track the rig while they were in their shallow water spawning site, and has three parts, two on the water (the surface floating tags and the routers), and one on land (the coordinator). On the Water The ‘Lyon-DeJoux Tags’ were built from off-the-shelf electronics, and have five main parts (Figure 2). Put simply, the GPS receiver is woken up by the microprocessor, and the positional data received from GPS satellites, the positional data is then sent via the transmitter and its aerial-extension on the tag housing, and rechargeable batteries allow the tags to be reused when needed.
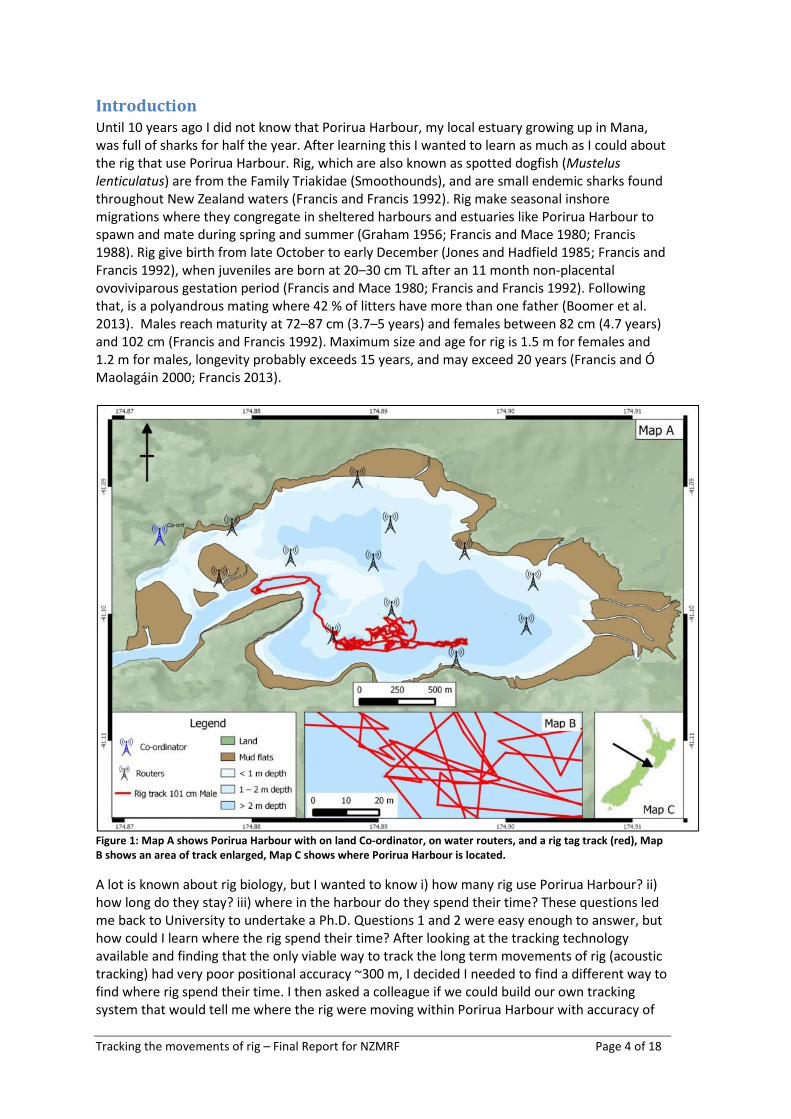
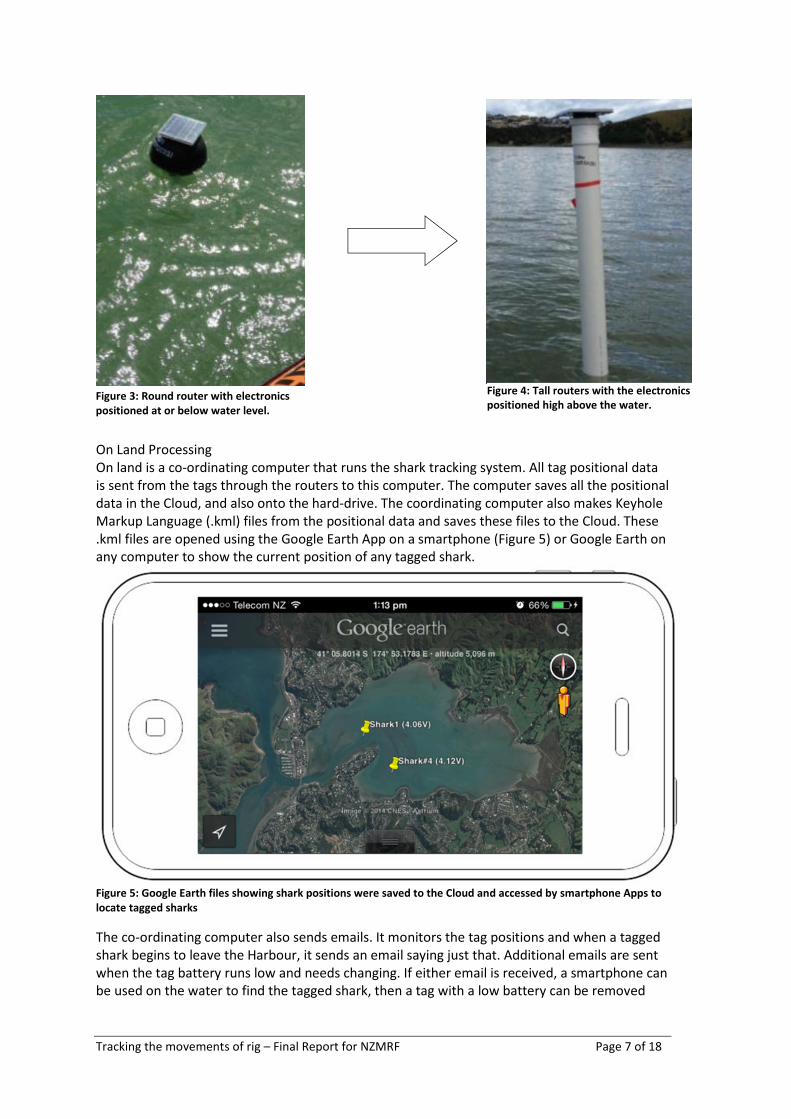
Ten Mark-3 tags have been built and now only 1 remains in useable condition. Over the time of this project five tags were attached to rig and then never seen again for unknown reasons. One tag housing leaked and two tags died from corrosion, and in three tags the GPS receivers stopped working. One Mark-1 tag was lost and returned by a member of the public, and three run-away tags were collected after coming free from their sharks. The Routers are the second part of the on-water part of this tracking system. The routers have gone through a significant redesign from the initial floats floating on the sea surface (Figure 3) to the tall design (Figure 4) where the transmitting aerial is at least 1 m above the high tide level. The higher router position allows much better transmission of radio waves (which cannot pass through water) between each of the routers in the mesh-network, as well as better reception of transmissions from the tags. Ten of these routers were built and only 7 remain. After losing 1 router in a storm, 1 because of bad welding, and 1 to theft, the routers were anchored to the seafloor by two x 3 – 5 metre long steel warratahs (y-posts).
Figure 2: In the left panel a Mark-1 and Mark-2 (with green aerial) tags, the central images are of the tag electronics,
with the waterproof housing for the Mark-3 tag on the right.
Tracking the movements of rig – Final Report for NZMRF Page 7 of 18
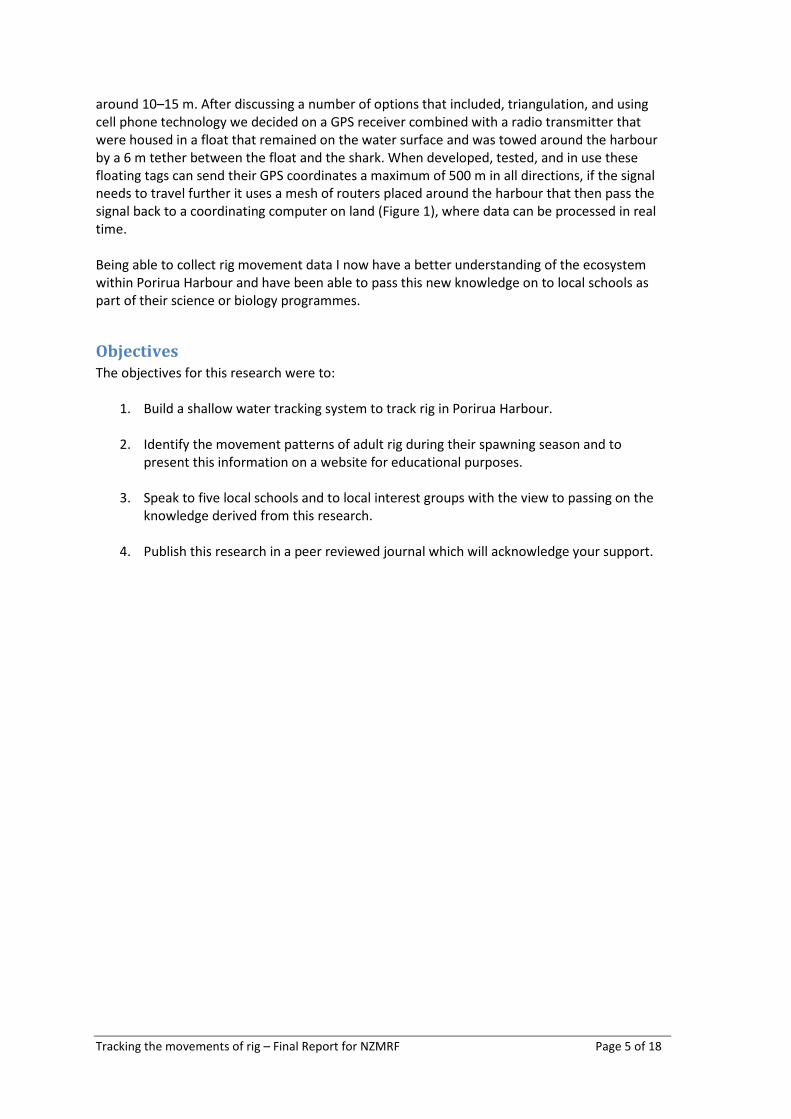
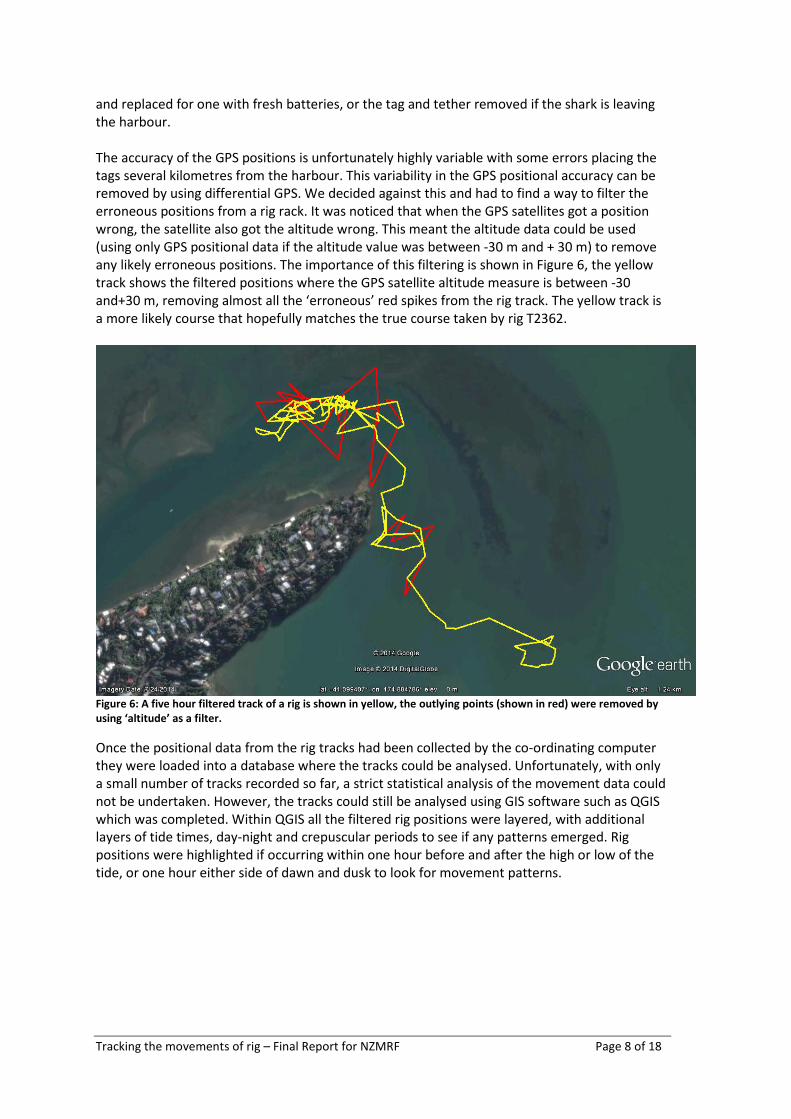
On Land Processing On land is a co-ordinating computer that runs the shark tracking system. All tag positional data is sent from the tags through the routers to this computer. The computer saves all the positional data in the Cloud, and also onto the hard-drive. The coordinating computer also makes Keyhole Markup Language (.kml) files from the positional data and saves these files to the Cloud. These .kml files are opened using the Google Earth App on a smartphone (Figure 5) or Google Earth on any computer to show the current position of any tagged shark.
Figure 5: Google Earth files showing shark positions were saved to the Cloud and accessed by smartphone Apps to
locate tagged sharks
The co-ordinating computer also sends emails. It monitors the tag positions and when a tagged shark begins to leave the Harbour, it sends an email saying just that. Additional emails are sent when the tag battery runs low and needs changing. If either email is received, a smartphone can be used on the water to find the tagged shark, then a tag with a low battery can be removed
Figure 4: Tall routers with the electronics
positioned high above the water. Figure 3: Round router with electronics
positioned at or below water level.
Tracking the movements of rig – Final Report for NZMRF Page 8 of 18
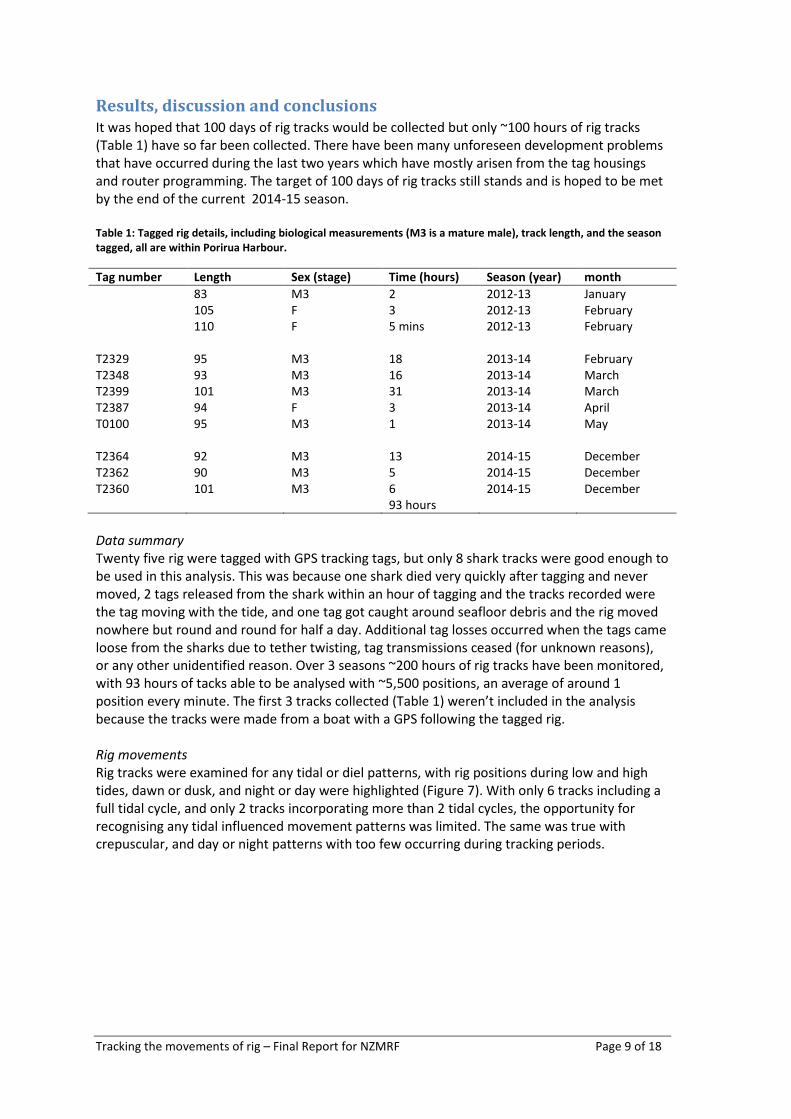
and replaced for one with fresh batteries, or the tag and tether removed if the shark is leaving the harbour. The accuracy of the GPS positions is unfortunately highly variable with some errors placing the tags several kilometres from the harbour. This variability in the GPS positional accuracy can be removed by using differential GPS. We decided against this and had to find a way to filter the erroneous positions from a rig rack. It was noticed that when the GPS satellites got a position wrong, the satellite also got the altitude wrong. This meant the altitude data could be used (using only GPS positional data if the altitude value was between -30 m and + 30 m) to remove any likely erroneous positions. The importance of this filtering is shown in Figure 6, the yellow track shows the filtered positions where the GPS satellite altitude measure is between -30 and+30 m, removing almost all the ‘erroneous’ red spikes from the rig track. The yellow track is a more likely course that hopefully matches the true course taken by rig T2362.
Figure 6: A five hour filtered track of a rig is shown in yellow, the outlying points (shown in red) were removed by
using ‘altitude’ as a filter.
Once the positional data from the rig tracks had been collected by the co-ordinating computer they were loaded into a database where the tracks could be analysed. Unfortunately, with only a small number of tracks recorded so far, a strict statistical analysis of the movement data could not be undertaken. However, the tracks could still be analysed using GIS software such as QGIS which was completed. Within QGIS all the filtered rig positions were layered, with additional layers of tide times, day-night and crepuscular periods to see if any patterns emerged. Rig positions were highlighted if occurring within one hour before and after the high or low of the tide, or one hour either side of dawn and dusk to look for movement patterns.
Tracking the movements of rig – Final Report for NZMRF Page 9 of 18
Results, discussion and conclusions
It was hoped that 100 days of rig tracks would be collected but only ~100 hours of rig tracks (Table 1) have so far been collected. There have been many unforeseen development problems that have occurred during the last two years which have mostly arisen from the tag housings and router programming. The target of 100 days of rig tracks still stands and is hoped to be met by the end of the current 2014-15 season. Table 1: Tagged rig details, including biological measurements (M3 is a mature male), track length, and the season
tagged, all are within Porirua Harbour.
Tag number Length Sex (stage) Time (hours) Season (year) month
83 M3 2 2012-13 January 105 F 3 2012-13 February 110 F 5 mins 2012-13 February T2329 95 M3 18 2013-14 February T2348 93 M3 16 2013-14 March T2399 101 M3 31 2013-14 March T2387 94 F 3 2013-14 April T0100 95 M3 1 2013-14 May T2364 92 M3 13 2014-15 December T2362 90 M3 5 2014-15 December T2360 101 M3 6 2014-15 December 93 hours
Data summary
Twenty five rig were tagged with GPS tracking tags, but only 8 shark tracks were good enough to be used in this analysis. This was because one shark died very quickly after tagging and never moved, 2 tags released from the shark within an hour of tagging and the tracks recorded were the tag moving with the tide, and one tag got caught around seafloor debris and the rig moved nowhere but round and round for half a day. Additional tag losses occurred when the tags came loose from the sharks due to tether twisting, tag transmissions ceased (for unknown reasons), or any other unidentified reason. Over 3 seasons ~200 hours of rig tracks have been monitored, with 93 hours of tacks able to be analysed with ~5,500 positions, an average of around 1 position every minute. The first 3 tracks collected (Table 1) weren’t included in the analysis because the tracks were made from a boat with a GPS following the tagged rig. Rig movements
Rig tracks were examined for any tidal or diel patterns, with rig positions during low and high tides, dawn or dusk, and night or day were highlighted (Figure 7). With only 6 tracks including a full tidal cycle, and only 2 tracks incorporating more than 2 tidal cycles, the opportunity for recognising any tidal influenced movement patterns was limited. The same was true with crepuscular, and day or night patterns with too few occurring during tracking periods.
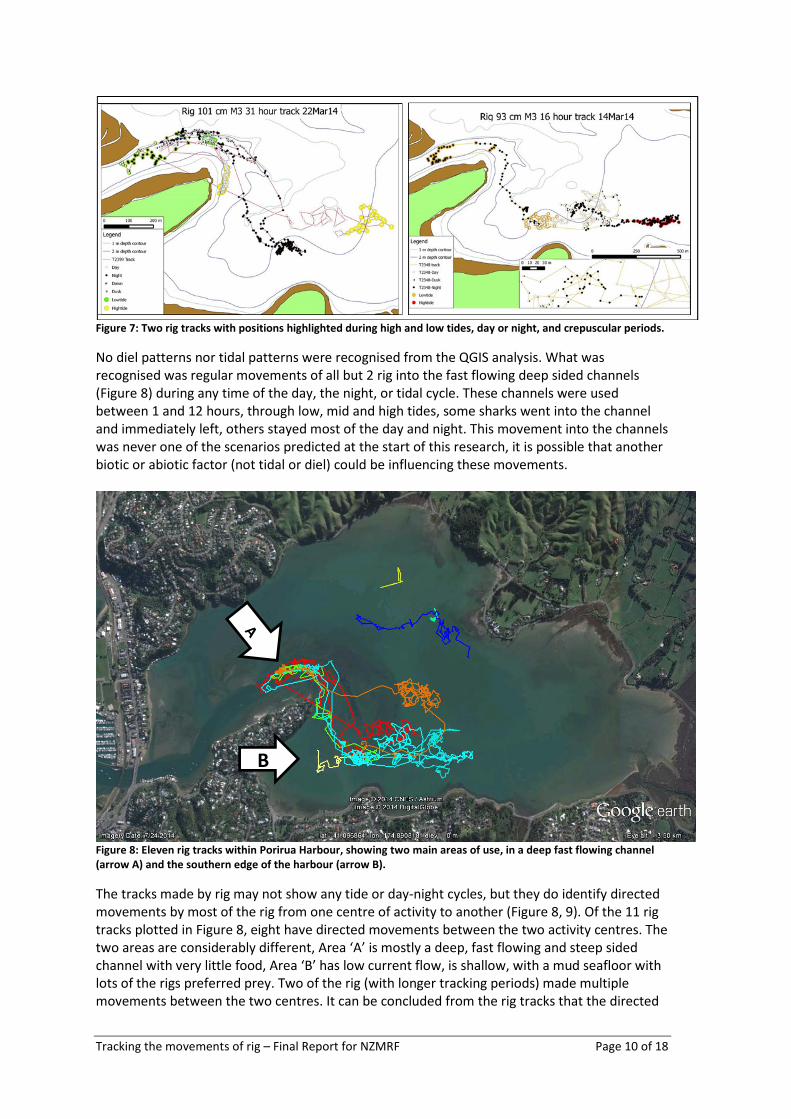
Tracking the movements of rig – Final Report for NZMRF Page 10 of 18
Figure 7: Two rig tracks with positions highlighted during high and low tides, day or night, and crepuscular periods.
No diel patterns nor tidal patterns were recognised from the QGIS analysis. What was recognised was regular movements of all but 2 rig into the fast flowing deep sided channels (Figure 8) during any time of the day, the night, or tidal cycle. These channels were used between 1 and 12 hours, through low, mid and high tides, some sharks went into the channel and immediately left, others stayed most of the day and night. This movement into the channels was never one of the scenarios predicted at the start of this research, it is possible that another biotic or abiotic factor (not tidal or diel) could be influencing these movements.
Figure 8: Eleven rig tracks within Porirua Harbour, showing two main areas of use, in a deep fast flowing channel
(arrow A) and the southern edge of the harbour (arrow B).
The tracks made by rig may not show any tide or day-night cycles, but they do identify directed movements by most of the rig from one centre of activity to another (Figure 8, 9). Of the 11 rig tracks plotted in Figure 8, eight have directed movements between the two activity centres. The two areas are considerably different, Area ‘A’ is mostly a deep, fast flowing and steep sided channel with very little food, Area ‘B’ has low current flow, is shallow, with a mud seafloor with lots of the rigs preferred prey. Two of the rig (with longer tracking periods) made multiple movements between the two centres. It can be concluded from the rig tracks that the directed
B
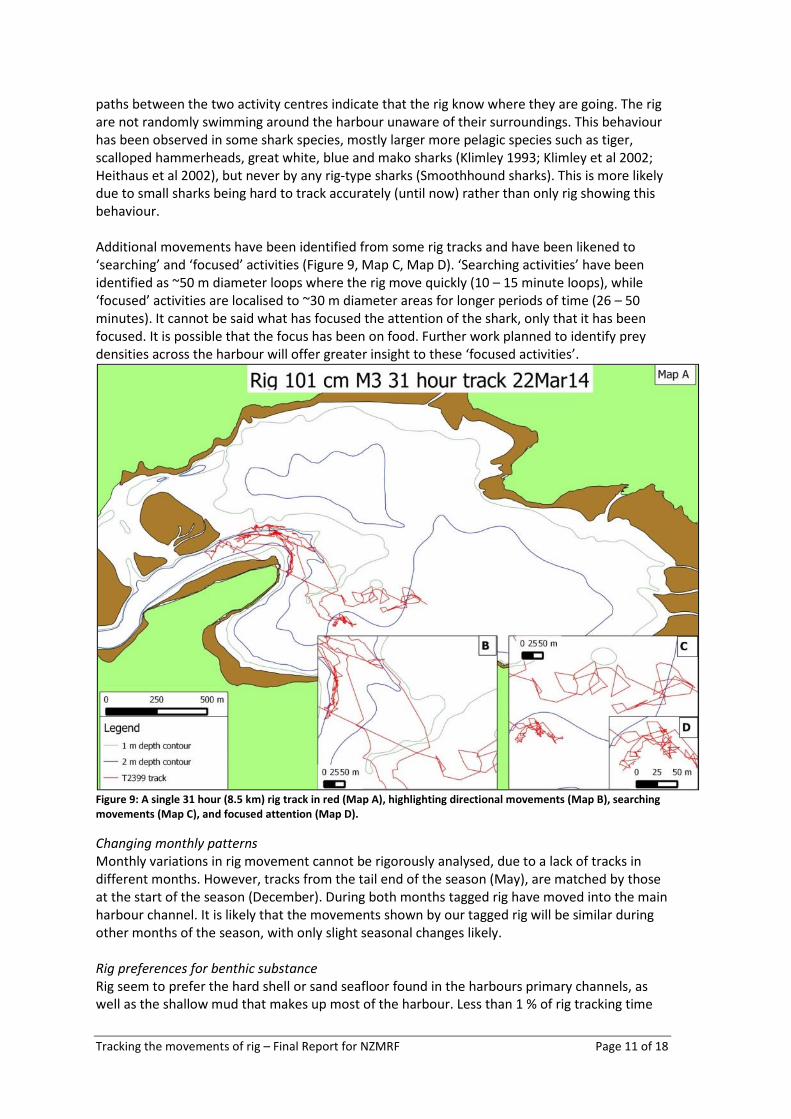
Tracking the movements of rig – Final Report for NZMRF Page 11 of 18
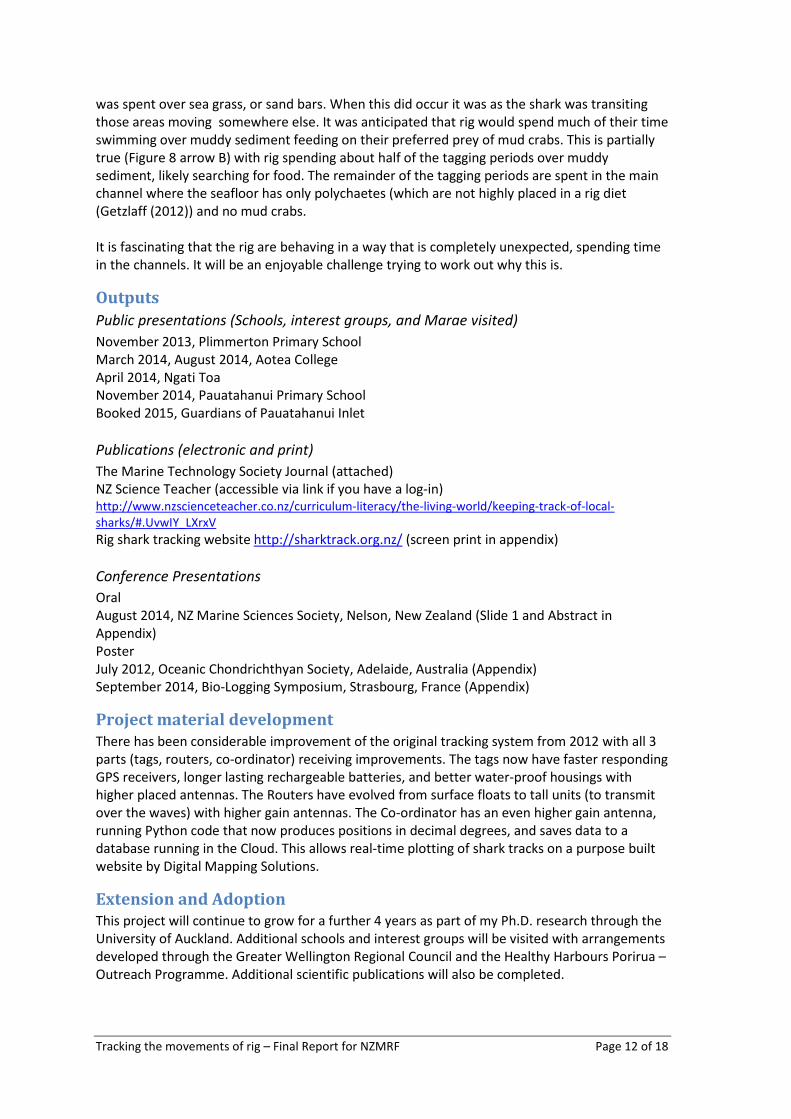
paths between the two activity centres indicate that the rig know where they are going. The rig are not randomly swimming around the harbour unaware of their surroundings. This behaviour has been observed in some shark species, mostly larger more pelagic species such as tiger, scalloped hammerheads, great white, blue and mako sharks (Klimley 1993; Klimley et al 2002; Heithaus et al 2002), but never by any rig-type sharks (Smoothhound sharks). This is more likely due to small sharks being hard to track accurately (until now) rather than only rig showing this behaviour. Additional movements have been identified from some rig tracks and have been likened to ‘searching’ and ‘focused’ activities (Figure 9, Map C, Map D). ‘Searching activities’ have been identified as ~50 m diameter loops where the rig move quickly (10 – 15 minute loops), while ‘focused’ activities are localised to ~30 m diameter areas for longer periods of time (26 – 50 minutes). It cannot be said what has focused the attention of the shark, only that it has been focused. It is possible that the focus has been on food. Further work planned to identify prey densities across the harbour will offer greater insight to these ‘focused activities’.
Figure 9: A single 31 hour (8.5 km) rig track in red (Map A), highlighting directional movements (Map B), searching
movements (Map C), and focused attention (Map D).
Changing monthly patterns
Monthly variations in rig movement cannot be rigorously analysed, due to a lack of tracks in different months. However, tracks from the tail end of the season (May), are matched by those at the start of the season (December). During both months tagged rig have moved into the main harbour channel. It is likely that the movements shown by our tagged rig will be similar during other months of the season, with only slight seasonal changes likely. Rig preferences for benthic substance
Rig seem to prefer the hard shell or sand seafloor found in the harbours primary channels, as well as the shallow mud that makes up most of the harbour. Less than 1 % of rig tracking time
Tracking the movements of rig – Final Report for NZMRF Page 12 of 18
was spent over sea grass, or sand bars. When this did occur it was as the shark was transiting those areas moving somewhere else. It was anticipated that rig would spend much of their time swimming over muddy sediment feeding on their preferred prey of mud crabs. This is partially true (Figure 8 arrow B) with rig spending about half of the tagging periods over muddy sediment, likely searching for food. The remainder of the tagging periods are spent in the main channel where the seafloor has only polychaetes (which are not highly placed in a rig diet (Getzlaff (2012)) and no mud crabs. It is fascinating that the rig are behaving in a way that is completely unexpected, spending time in the channels. It will be an enjoyable challenge trying to work out why this is.
Outputs
Public presentations (Schools, interest groups, and Marae visited)
November 2013, Plimmerton Primary School March 2014, August 2014, Aotea College April 2014, Ngati Toa November 2014, Pauatahanui Primary School Booked 2015, Guardians of Pauatahanui Inlet
Publications (electronic and print)
The Marine Technology Society Journal (attached) NZ Science Teacher (accessible via link if you have a log-in) http://www.nzscienceteacher.co.nz/curriculum-literacy/the-living-world/keeping-track-of-local-sharks/#.UvwIY_LXrxV
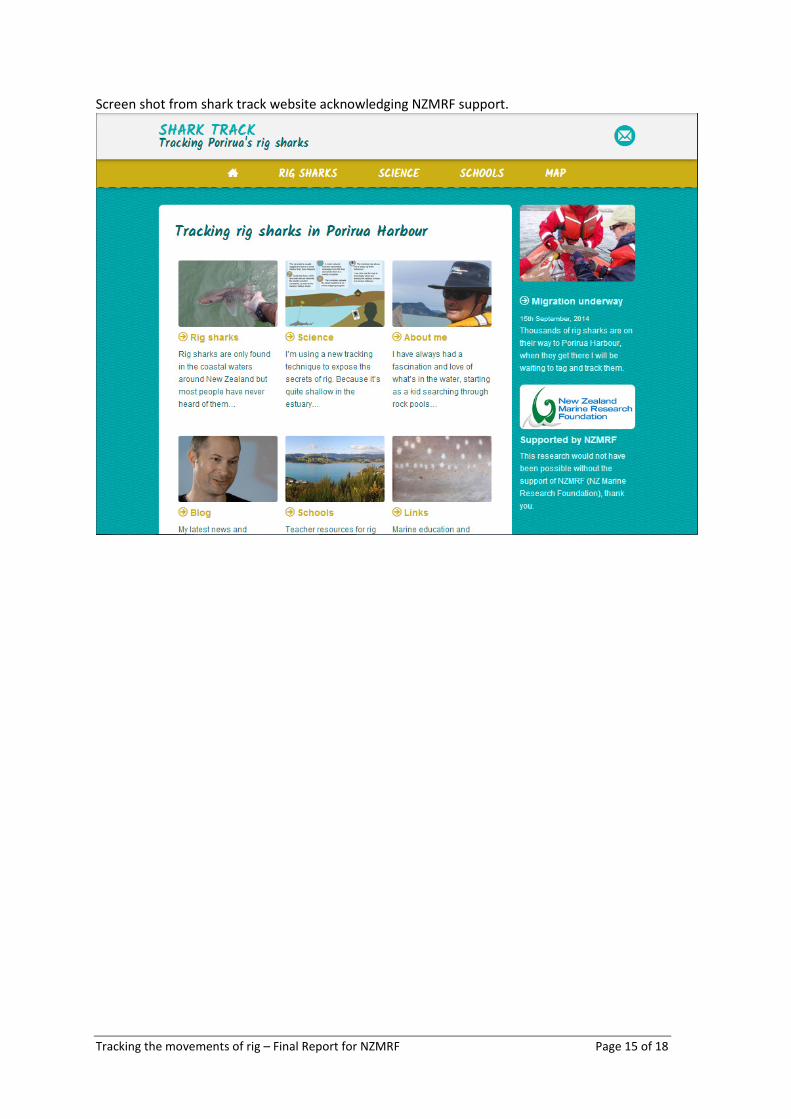
Rig shark tracking website http://sharktrack.org.nz/ (screen print in appendix)
Conference Presentations
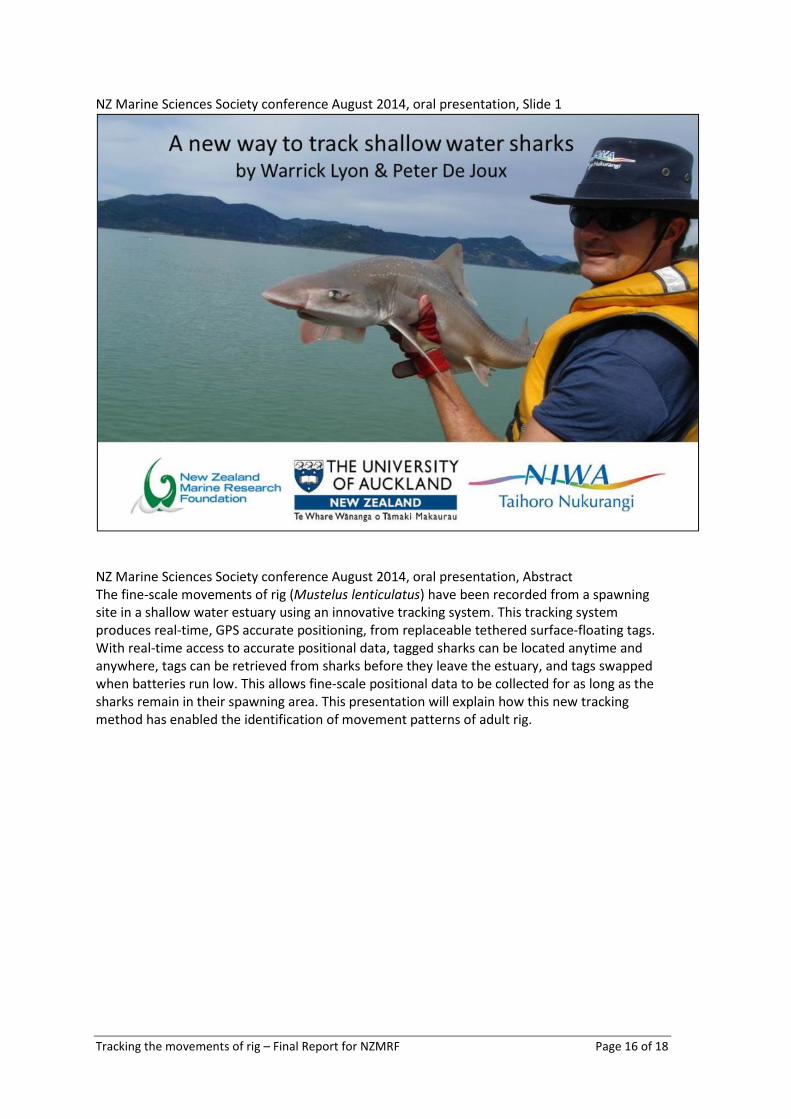
Oral August 2014, NZ Marine Sciences Society, Nelson, New Zealand (Slide 1 and Abstract in Appendix) Poster July 2012, Oceanic Chondrichthyan Society, Adelaide, Australia (Appendix) September 2014, Bio-Logging Symposium, Strasbourg, France (Appendix)
Project material development
There has been considerable improvement of the original tracking system from 2012 with all 3 parts (tags, routers, co-ordinator) receiving improvements. The tags now have faster responding GPS receivers, longer lasting rechargeable batteries, and better water-proof housings with higher placed antennas. The Routers have evolved from surface floats to tall units (to transmit over the waves) with higher gain antennas. The Co-ordinator has an even higher gain antenna, running Python code that now produces positions in decimal degrees, and saves data to a database running in the Cloud. This allows real-time plotting of shark tracks on a purpose built website by Digital Mapping Solutions.
Extension and Adoption
This project will continue to grow for a further 4 years as part of my Ph.D. research through the University of Auckland. Additional schools and interest groups will be visited with arrangements developed through the Greater Wellington Regional Council and the Healthy Harbours Porirua – Outreach Programme. Additional scientific publications will also be completed.
Tracking the movements of rig – Final Report for NZMRF Page 13 of 18
A researcher from England (Dr Matthew Witt) has shown interest in using this tracking technology to track basking sharks in southern England. This research will continue, I am hoping that as time goes on the track periods will get longer and longer, as small failings are identified and rectified, tag development will never cease.
Financial summary
W LYON Original = $15000 Field Assistant = $6000
Paid 24.10.12 2133.57
12.11.12
6000
04.02.13 3635.88 11.11.13 3794.84 Website 2000
Final Report 3435.71 (from $4000)
Totals received $9,564.29 $6,000
References
Boomer, J. J., Harcourt, R. G., Francis, M. P., Walker, T. I., Braccini, J. M., & Stow, A. J. (2013). Frequency of Multiple Paternity in Gummy Shark, Mustelus antarcticus, and Rig, Mustelus
lenticulatus, and the Implications of Mate Encounter Rate, Postcopulatory Influences, and Reproductive Mode. Journal of Heredity, 104(3), 371-379. doi: 10.1093/jhered/est010
Francis, M. P. (1988). Movement patterns of rig (Mustelus lenticulatus) tagged in southern New Zealand. New Zealand Journal of Marine and Freshwater Research, 22, 259-272.
Francis, M. P. (2013). Temporal and Spatial Patterns of Habitat Use by Juveniles of a Small Coastal Shark (Mustelus lenticulatus) in an Estuarine Nursery. Plos One, 8(2). doi: 10.1371/journal.pone.0057021
Francis, M. P., & Francis, R. I. C. C. (1992). Growth rate estimates for New Zealand rig (Mustelus
lenticulatus). Australian journal of marine and freshwater research, 43, 1157-1176. Francis, M. P., & Mace, J. T. (1980). Reproductive biology of Mustelus lenticulatus from Kaikoura
and Nelson. New Zealand Journal of Marine and Freshwater Research, 14, 303-311. Francis, M. P., & Ó Maolagáin, C. (2000). Age, growth and maturity of a New Zealand endemic
shark (Mustelus lenticulatus) estimated from vertebral bands. Marine and Freshwater
Research, 51, 35-42. Getzlaff, C. (2012). Diet and foraging behaviour of juvenile rig (Mustelus lenticulatus) from New
Zealand harbours and estuaries. (M.Sc. thesis), Massey University, Palmerston North. Graham, D. H. (1956). A treasury of New Zealand fishes. Wellington: Reed. Heithaus, M.R., Dill, L.M., Marshall, G.J., & Buhleier, B. (2002). Habitat use and foraging behavior
of tiger sharks (Galeocerdo cuvier) in a seagrass ecosystem. Marine Biology 140, 237 – 248.
Jones, J. B., & Hadfield, J. D. (1985). Fishes from Porirua and Pauatahanui Inlets: occurrence in gill nets. New Zealand Journal of Marine and Freshwater Research, 19, 477-484.
Klimley, A. P. (1993). Highly directional swimming by scalloped hammerhead sharks, Sphyrna
lewini, and subsurface irradiance, temperature, bathymetry, and geomagnetic field. Marine Biology, 117(1), 1-22.
Klimley, A.P., Beavers, S. C., Curtis, T.H., & Jorgensen, S.J. (2002). Movements and Swimming Behavior of Three Species of Sharks in La Jolla Canyon, California. Environmental Biology
of Fishes, 63(2), 117-135.
Tracking the movements of rig – Final Report for NZMRF Page 14 of 18
Appendix
Appendix 1 – Outputs
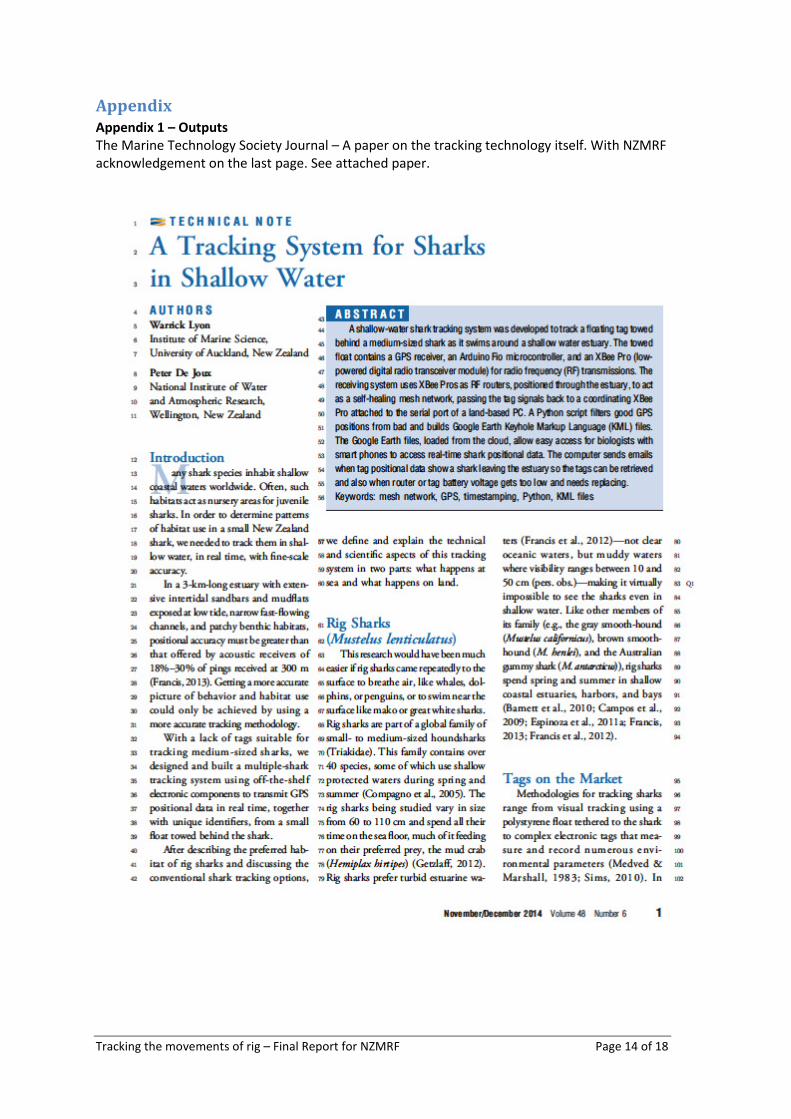
The Marine Technology Society Journal – A paper on the tracking technology itself. With NZMRF acknowledgement on the last page. See attached paper.
Tracking the movements of rig – Final Report for NZMRF Page 15 of 18
Screen shot from shark track website acknowledging NZMRF support.
Tracking the movements of rig – Final Report for NZMRF Page 16 of 18
NZ Marine Sciences Society conference August 2014, oral presentation, Slide 1
NZ Marine Sciences Society conference August 2014, oral presentation, Abstract The fine-scale movements of rig (Mustelus lenticulatus) have been recorded from a spawning site in a shallow water estuary using an innovative tracking system. This tracking system produces real-time, GPS accurate positioning, from replaceable tethered surface-floating tags. With real-time access to accurate positional data, tagged sharks can be located anytime and anywhere, tags can be retrieved from sharks before they leave the estuary, and tags swapped when batteries run low. This allows fine-scale positional data to be collected for as long as the sharks remain in their spawning area. This presentation will explain how this new tracking method has enabled the identification of movement patterns of adult rig.
Tracking the movements of rig – Final Report for NZMRF Page 17 of 18
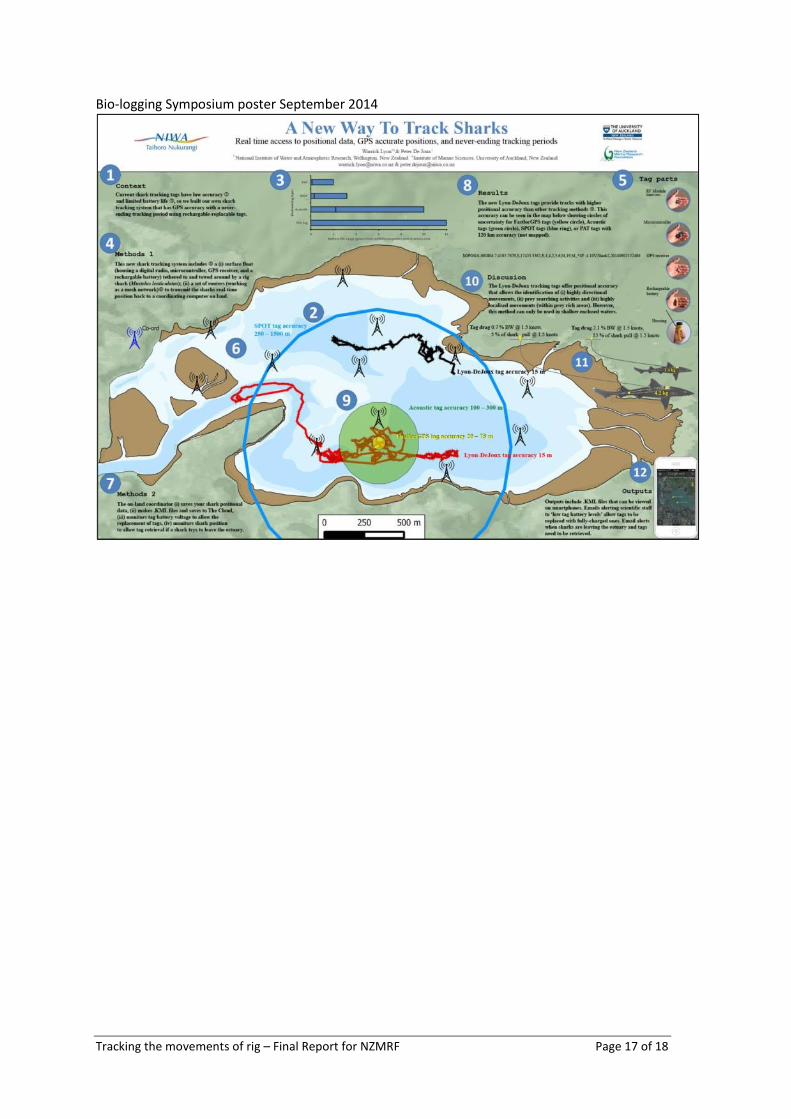
Bio-logging Symposium poster September 2014
Tracking the movements of rig – Final Report for NZMRF Page 18 of 18
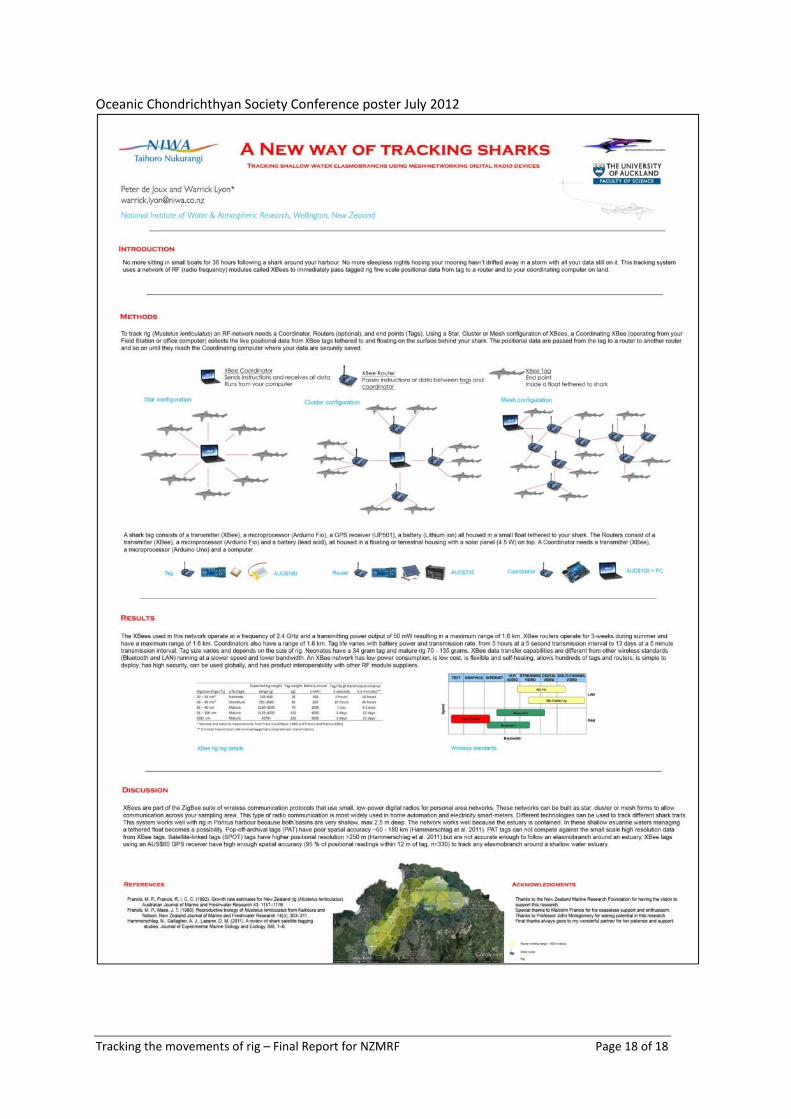
Oceanic Chondrichthyan Society Conference poster July 2012