Embed Size (px)
Citation preview
Vol.:(0123456789)1 3
Contributions to Mineralogy and Petrology (2018) 173:56 https://doi.org/10.1007/s00410-018-1482-1
ORIGINAL PAPER
Tracking the prograde P–T path of Precambrian eclogite using Ti-in-quartz and Zr-in-rutile geothermobarometry
L. Tual1,2 · C. Möller1 · M. J. Whitehouse2
Received: 19 January 2018 / Accepted: 13 June 2018 / Published online: 22 June 2018 © The Author(s) 2018
AbstractA Fe–Ti-rich garnet, clinopyroxene, and quartz eclogite sample from the 1.0 Ga Sveconorwegian orogen, SW Sweden, contains abundant quartz, rutile, and zircon in distinct micro-textural sites: garnet core, garnet rim, and matrix, constituting an ideal case for investigation of the behavior of Zr-in-rutile and Ti-in-quartz at high-pressure and temperature. A P–T path, peaking at 16.5–19 kbar and 850–900 °C, has been constrained independently for the same rock by pseudosection modelling; input pressures from this model were used for trace element geothermometry of each garnet micro-textural domain. Trace element thermo(baro)metry, based on in situ Secondary Ion Mass Spectrometry analyses of Ti contents in quartz and Zr contents in rutile, yields P–T estimates of progressive crystallization of quartz and rutile along the prograde metamorphic path. For inclusions in the garnet cores, Zr-in-rutile geothermometry yields 700–715 °C and Ti-in-quartz 620–640 °C at 7 kbar. For inclusions in the garnet rims, temperature estimates are 760–790 °C (Zr-in-rutile) and 740–920 °C (Ti-in-quartz) at 12–18 kbar. Finally, matrix rutile records 775–800 °C and locally ~ 900 °C, and quartz records temperatures up to 900 °C at 18 kbar. Ti-in-quartz estimates for the metamorphic peak (inclusions in the garnet rims and matrix) conform to the pseu-dosection, but appear too low for the early prograde stage (garnet cores), possibly due to lack of equilibrium at T < 700 °C. The pseudosection shows that rutile was produced by continuous ilmenite breakdown during the early stages of prograde metamorphism, a reaction that was completed at ~ 730 °C. Rutile grains in the garnet rims and the matrix grew subsequently larger by recrystallization of previously produced rutile. However, recrystallized rutile does not predominantly record peak temperatures, but instead yield 745–840 °C between 12 and 18 kbar. In the pseudosection, this temperature range broadly coincides with a stage during which (Ti-bearing) hornblende was consumed and clinopyroxene produced (i.e., dehydra-tion); the Zr contents thus appear to reflect the last stage of efficient rutile recrystallization, catalysed by fluids released by the dehydration of hornblende preceding the metamorphic peak. Concurrently, combination of the isopleths for Ti content in quartz and Zr content in rutile (i.e. independent from pseudosection modelling) yields pressure and temperature condi-tions in almost perfect agreement with the P–T path as deduced from the pseudosection. The variation in Ti concentration in quartz is small regardless of crystal size, and the Ti-in-quartz geothermometer provides both precise and accurate peak temperatures of 875–920 °C, without a significant diffusional reequilibration. The lack of significant Ti diffusion in quartz is consistent with an inferred short residence time at high temperature. This study illustrates that Zr-in-rutile and Ti-in-quartz geothermobarometry can robustly constrain prograde P–T conditions and yield further insights into recrystallization pro-cesses at high temperature. The combination of these methods and integration of the results with pseudosection modelling is a versatile tool for investigating the petrologic history of high-grade rocks.
Keywords Ti-in-quartz · Zr-in-rutile · Eclogite · Sveconorwegian · Prograde P–T path
Introduction
Accurate estimates of the P–T evolution of tectonic units are fundamental for geodynamic interpretation, especially in eclogite-facies rocks that carry important record of deep crustal processes during orogenesis. Besides equilibrium phase diagrams, trace element geothermometers such as
Communicated by Timothy L. Grove.
Electronic supplementary material The online version of this article (https ://doi.org/10.1007/s0041 0-018-1482-1) contains supplementary material, which is available to authorized users.
* L. Tual [email protected]
Extended author information available on the last page of the article
Contributions to Mineralogy and Petrology (2018) 173:56
1 3
56 Page 2 of 15
zirconium-in-rutile and titanium-in-quartz (hereinafter referred to as Zr-in-rutile and Ti-in-quartz, respectively; Zack et al. 2004; Watson et al. 2006; Wark and Watson 2006; Ferry and Watson 2007; Thomas et al. 2010) have proven independent means of P–T estimation for metamorphic ter-ranes (e.g., Kooijman et al. 2012; Ewing et al. 2013; Ashley et al. 2013). The Zr-in-rutile geothermometer is particularly useful for determination of equilibration temperatures of high-grade metamorphic rocks such as granulite, for which Fe–Mg exchange geothermometry is problematic (e.g., Zack et al. 2004; Baldwin and Brown 2008; Luvizotto and Zack 2009; Zhang et al. 2009; Jiao et al. 2011; Kooijman et al. 2012; Ewing et al. 2013; Štípská et al. 2014; Korhonen et al. 2014; Liu et al. 2015). Ti incorporation in quartz is more dependent on pressure than Zr in rutile (e.g., Thomas et al. 2010). Consequently, if Ti-in-quartz and Zr-in-rutile results are paired, P and T can be constrained from the intersec-tion of the two equilibrium lines in the P–T field (Thomas et al. 2010). Alternatively, if pressure can be determined by independent means (geobarometry or other constraints from phase equilibria), Ti-in-quartz and Zr-in-rutile can be used as two independent geothermometers. The Ti-in-quartz and Zr-in-rutile geothermometers both rely on the equilibrium between quartz, rutile, and zircon. However, our under-standing of the behavior of this equilibrium at high pressure and temperature is still limited. Examples include apparent large temperature range recorded in quartz (e.g., Ewing et al. 2013) and intra- and inter-grain Zr concentration variation in granulite rutile (e.g., Zack and Kooijman 2017 and refer-ences therein).
The selected Fe–Ti-rich eclogite sample from the Sveconorwegian orogen, southern Sweden contains abun-dant quartz, rutile, and zircon in distinct microstructural sites (garnet core, garnet rims, and matrix), assemblages particularly suitable for study of Ti-in-quartz and Zr-in-rutile during prograde and peak metamorphic recrystalli-zation, from c. 670 to 850–900 °C. To investigate this, we analyzed in situ quartz and rutile inclusions by secondary ion mass spectrometry (SIMS). The prograde P–T stages and peak P–T conditions have been independently constrained by pseudosection modelling coupled with phase equilibria and chemical zoning of garnet (Tual et al. 2017). Our results show that whereas Zr-in-rutile accurately records the early stages of the prograde part of the P–T path, Ti-in-quartz records more systematically peak temperatures up to 920 °C. The phase equilibria model suggests that rutile recrystal-lization was dependent on a major dehydration reaction and does not systematically records peak temperature. We show that, when combined, the three independent methods Ti-in-quartz, Zr-in-rutile, and P–T pseudosection model not only yield robust constraints on pressure and temperature, but also provide important insights on crystallization processes during metamorphism.
Tectonic setting
The Sveconorwegian orogen is a 500 km-wide belt in SW Scandinavia (Fig. 1; parts of the Baltic Shield), which underwent accretion to collisional orogeny in the time period 1.14–0.92 Ga (Bingen et al. 2005, 2008). Today, the eroded orogen exposes deep sections of the moun-tain chain. Eclogites are present in the easternmost part of the orogen, the Eastern Segment, which is the litho-logical continuation of the Baltica crust (Fig. 1; Möller and Andersson 2018 and references therein). The eclog-ites occur within a recumbent fold nappe, which lies just underneath the contact with the Idefjorden Terrane (Fig. 1b; Möller et al. 2015). The nappe represents a part of the Baltica continental crust that experienced westward tectonic burial at eclogite-facies conditions beneath the western Sveconorwegian terranes, followed by eastward, foreland-directed, tectonic exhumation at granulite-facies temperatures (Möller et al. 2015; Möller and Andersson 2018; Tual et al. 2015, 2017). The timing of eclogite meta-morphism and exhumation at 40 km depth is bracketed between 0.99 and 0.97 Ga (U–Pb ages of zircon; Johans-son et al. 2001; Möller et al. 2015).
P–T evolution and petrography
In addition to common garnet-clinopyroxene dominated rocks, some eclogite bodies in the Eastern Segment con-tain layers of Mg–Al-rich kyanite-bearing eclogite and Fe–Ti-rich eclogite. The two latter rock types provide detailed information on the P–T evolution (Möller 1998, 1999; Möller et al. 2015; Tual et al. 2015, 2017). Most eclogites were partially re-equilibrated during decom-pression at high-pressure granulite- and upper amphib-olite-facies, but sizable garnet grains preserve records of the prograde metamorphic evolution, and remnant grains of other peak-pressure minerals (clinopyroxene, rutile, ± quartz, and ± kyanite) are locally preserved in the matrix. The mineral assemblages, micro-textures, and chemical zoning of garnet in these rocks have allowed deduction of a sequence of metamorphic stages and a clockwise P–T evolution (Möller 1998, 1999; Tual et al. 2017). Growth zoning in garnet is preserved despite high temperatures during peak metamorphism and decompres-sion, which testifies limited diffusion and short residence times at high temperature (op. cit.).
The sample chosen for this study (MU6) is from a Fe–Ti-r ich layer in a 2 × 1.5 km large mafic body (WGS84: 57°09′21.3″N 12°42′49.4″E; Lilla Ammås). The high-pressure assemblage is
Contributions to Mineralogy and Petrology (2018) 173:56
1 3
Page 3 of 15 56
garnet + clinopyroxene + quartz + rutile + accessory apa-tite and zircon. Amphibole, ilmenite, and plagioclase are present in lower amounts, as early prograde and retrograde phases. The sample is rich in quartz, rutile, and zircon in distinct microstructural domains, and is, therefore, particularly appropriate for Zr-in-rutile and Ti-in-quartz geothermobarometry. The calculated P–T pseudosection for this sample shows two main prograde stages spanning from 670 to 850–900 °C (Fig. 2; Tual et al. 2017). Below, we report the petrography and mineral chemistry of sam-ple MU6; further details including mineral analyses and pseudosection calculation for this sample are provided in Möller (1998) and Tual et al. (2017).
Mineral compositions are given in mol% unless stated otherwise. Cpfu = cations per formula unit. XFe = Fe2+/(Fe2++Mg); Prp = 100 × Mg/(Ca + Fe2+ + Mg + Mn); Alm = 100 × Fe2+/(Ca + Fe2+ + Mg + Mn); Sps = 100 × Mn/(Ca + Fe2+ + Mg + Mn); An = 100 × Ca/(Ca + Na + K); Jd = 100 × Na cpfu. In pseudosections, the mole fraction of grossular is defined as z(g) = 100 × [Ca/(Ca + Fe2++Mg)], because a Mn-free model is used. However, for the sake of simplicity, and given the low proportion of spessartine in garnet, modelled z(g) is considered equivalent to measured Grs = 100 × Ca/(Ca + Fe2+ + Mg + Mn). Mineral propor-tions are estimated through image analysis of the thin sec-tion (pseudo-coloring of minerals and pixel ratio determined using Photoshop®). The symbol “⟶” is used to describe the zoning from core to rim.
Garnet is 3–5 mm large, constitutes ~ 60% of the sam-ple, and has a distinct core-and-rim structure. The cores contain elongated inclusion trails of rutile, quartz, pla-gioclase, and locally hornblende, which follow straight, gently bent, or locally sigmoidal patterns (Fig. 3a). An inclusion-poor zone in the inner rim of garnet separates the core from the outer rim; in the outer rim, rutile and quartz grains are 5–10 times larger than in the core, and their orientations follow the garnet rim (Fig. 3a–d). Three garnet grains (A, C, and E) with distinct core-and-rim domains were selected for Ti-in-quartz and Zr-in-rutile analysis. Garnet A has a comparably large core domain with abundant small rutile inclusions and a distinct rim (especially in the upper part of the grain in Fig. 3b). The core of garnet C (Fig. 3c) has rounded quartz inclusions interspersed between elongated rutile trails and contains a higher proportion of quartz inclusions than garnet A. Garnet E has inclusion trails with a sigmoidal shape (Fig. 3d), which contains abundant rutile and quartz inclu-sions of various sizes, and elongated quartz in its core is unusually large (~ 100 µm). Garnet is chemically zoned: Alm55⟶46, Prp17⟶32, Sps3⟶1, XFe0.76⟶0.61. The grossular content increases slightly from the gar-net inner to outer core (Grs = 24⟶27), is uniform in the inclusion-free outer core, and decreases towards the outermost rim (Grs = 28⟶25). A final decrease in the outermost rim is also common (Grs = 26⟶24), usually associated with a slight increase in pyrope (Prp28⟶30).
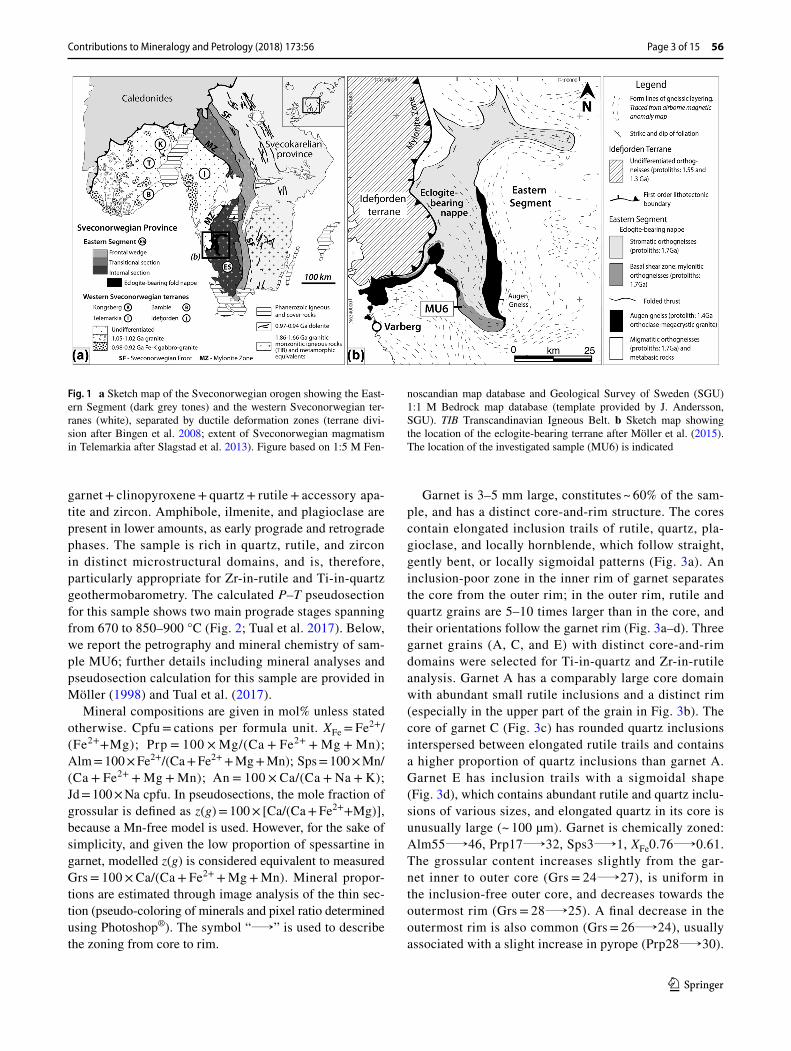
Fig. 1 a Sketch map of the Sveconorwegian orogen showing the East-ern Segment (dark grey tones) and the western Sveconorwegian ter-ranes (white), separated by ductile deformation zones (terrane divi-sion after Bingen et al. 2008; extent of Sveconorwegian magmatism in Telemarkia after Slagstad et al. 2013). Figure based on 1:5 M Fen-
noscandian map database and Geological Survey of Sweden (SGU) 1:1 M Bedrock map database (template provided by J. Andersson, SGU). TIB Transcandinavian Igneous Belt. b Sketch map showing the location of the eclogite-bearing terrane after Möller et al. (2015). The location of the investigated sample (MU6) is indicated
Contributions to Mineralogy and Petrology (2018) 173:56
1 3
56 Page 4 of 15
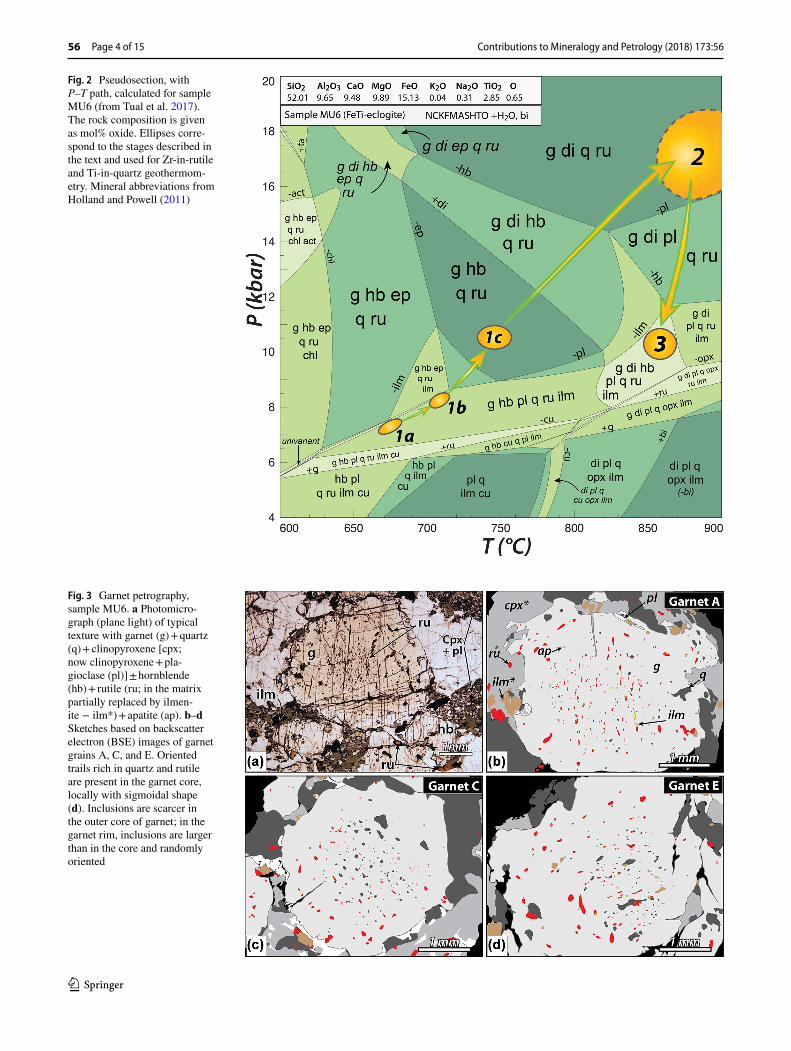
Fig. 2 Pseudosection, with P–T path, calculated for sample MU6 (from Tual et al. 2017). The rock composition is given as mol% oxide. Ellipses corre-spond to the stages described in the text and used for Zr-in-rutile and Ti-in-quartz geothermom-etry. Mineral abbreviations from Holland and Powell (2011)
Fig. 3 Garnet petrography, sample MU6. a Photomicro-graph (plane light) of typical texture with garnet (g) + quartz (q) + clinopyroxene [cpx; now clinopyroxene + pla-gioclase (pl)] ± hornblende (hb) + rutile (ru; in the matrix partially replaced by ilmen-ite − ilm*) + apatite (ap). b–d Sketches based on backscatter electron (BSE) images of garnet grains A, C, and E. Oriented trails rich in quartz and rutile are present in the garnet core, locally with sigmoidal shape (d). Inclusions are scarcer in the outer core of garnet; in the garnet rim, inclusions are larger than in the core and randomly oriented
Contributions to Mineralogy and Petrology (2018) 173:56
1 3
Page 5 of 15 56
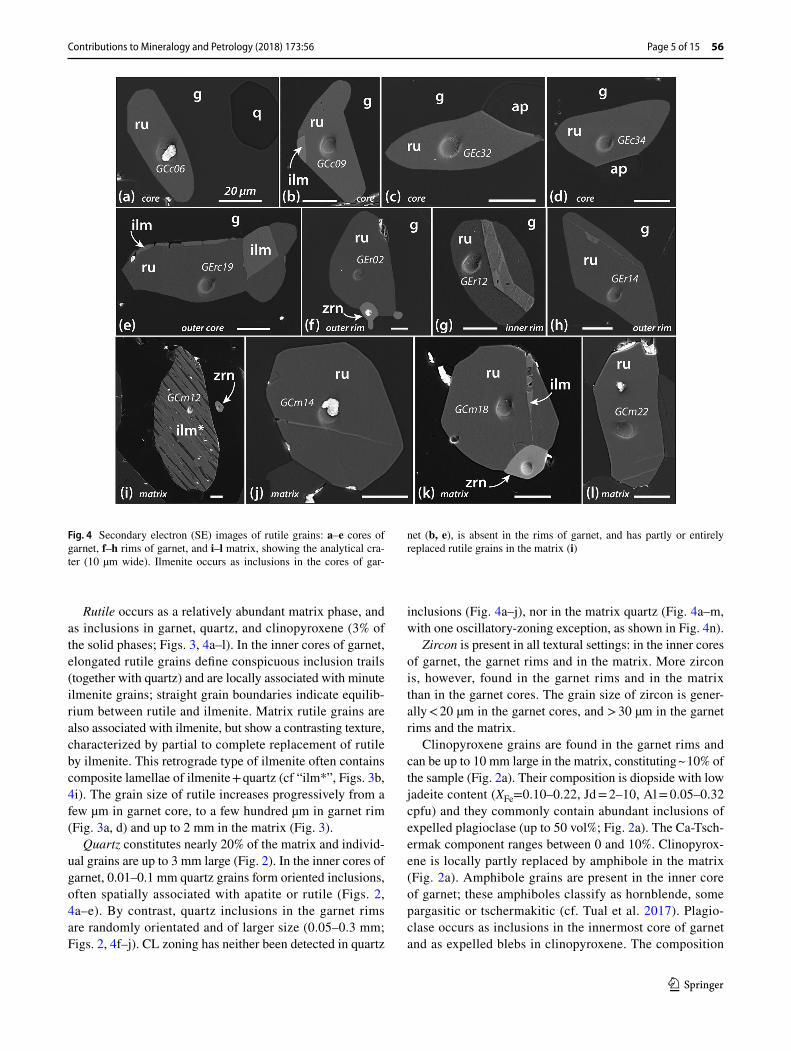
Rutile occurs as a relatively abundant matrix phase, and as inclusions in garnet, quartz, and clinopyroxene (3% of the solid phases; Figs. 3, 4a–l). In the inner cores of garnet, elongated rutile grains define conspicuous inclusion trails (together with quartz) and are locally associated with minute ilmenite grains; straight grain boundaries indicate equilib-rium between rutile and ilmenite. Matrix rutile grains are also associated with ilmenite, but show a contrasting texture, characterized by partial to complete replacement of rutile by ilmenite. This retrograde type of ilmenite often contains composite lamellae of ilmenite + quartz (cf “ilm*”, Figs. 3b, 4i). The grain size of rutile increases progressively from a few µm in garnet core, to a few hundred µm in garnet rim (Fig. 3a, d) and up to 2 mm in the matrix (Fig. 3).
Quartz constitutes nearly 20% of the matrix and individ-ual grains are up to 3 mm large (Fig. 2). In the inner cores of garnet, 0.01–0.1 mm quartz grains form oriented inclusions, often spatially associated with apatite or rutile (Figs. 2, 4a–e). By contrast, quartz inclusions in the garnet rims are randomly orientated and of larger size (0.05–0.3 mm; Figs. 2, 4f–j). CL zoning has neither been detected in quartz
inclusions (Fig. 4a–j), nor in the matrix quartz (Fig. 4a–m, with one oscillatory-zoning exception, as shown in Fig. 4n).
Zircon is present in all textural settings: in the inner cores of garnet, the garnet rims and in the matrix. More zircon is, however, found in the garnet rims and in the matrix than in the garnet cores. The grain size of zircon is gener-ally < 20 µm in the garnet cores, and > 30 µm in the garnet rims and the matrix.
Clinopyroxene grains are found in the garnet rims and can be up to 10 mm large in the matrix, constituting ~ 10% of the sample (Fig. 2a). Their composition is diopside with low jadeite content (XFe=0.10–0.22, Jd = 2–10, Al = 0.05–0.32 cpfu) and they commonly contain abundant inclusions of expelled plagioclase (up to 50 vol%; Fig. 2a). The Ca-Tsch-ermak component ranges between 0 and 10%. Clinopyrox-ene is locally partly replaced by amphibole in the matrix (Fig. 2a). Amphibole grains are present in the inner core of garnet; these amphiboles classify as hornblende, some pargasitic or tschermakitic (cf. Tual et al. 2017). Plagio-clase occurs as inclusions in the innermost core of garnet and as expelled blebs in clinopyroxene. The composition
Fig. 4 Secondary electron (SE) images of rutile grains: a–e cores of garnet, f–h rims of garnet, and i–l matrix, showing the analytical cra-ter (10 µm wide). Ilmenite occurs as inclusions in the cores of gar-
net (b, e), is absent in the rims of garnet, and has partly or entirely replaced rutile grains in the matrix (i)
Contributions to Mineralogy and Petrology (2018) 173:56
1 3
56 Page 6 of 15
of expelled plagioclase in clinopyroxene is An = 45–55; inclusions in garnet cores vary strongly from An = 40 to 81. Minor late hydration has led to local formation of chlorite and sericite.
In summary, the rock underwent prograde metamorphism at increasing pressures through the amphibolite-facies to the eclogite-facies. During the first stage (M1), the inner core of garnet formed and grew in equilibrium with horn-blende + rutile + quartz + plagioclase + ilmenite + zircon, concomitant with deformation at first (locally bent to sig-moidal inclusion trails; M1a to M1b on Fig. 2) followed by an inclusion-free stage (up to M1c, Fig. 2). Clinopyrox-ene entered the assemblage at c. 12.5 kbar. Clinopyroxene was produced by the continuous dehydration breakdown of hornblende to clinopyroxene + garnet until, at c. 14.5 kbar, hornblende was consumed. Garnet continued to grow throughout eclogite-facies conditions (clinopyroxene-pre-sent and plagioclase-absent fields, Fig. 2) at higher P–T conditions. The matrix assemblage (M2, garnet + clinopy-roxene + quartz + rutile) equilibrated at the metamorphic peak, and was subsequently modified during decompression (M3). Plagioclase + clinopyroxene intergrowths formed dur-ing decompression from a more sodic high-pressure clino-pyroxene. A second generation of ilmenite formed at the expense of matrix rutile. Minor chlorite and sericite formed at a late stage by small-scale local fluid infiltration at low temperature.
Methods
The Ti-in-quartz and Zr-in-rutile geothermometers are mod-erately and slightly pressure sensitive, respectively; hence, the estimation of pressure by an independent method is pref-erable. The pseudosection model of sample MU6 (Fig. 2; Tual et al. 2017) allows independent and relatively precise estimation of pressures associated with discrete metamor-phic stages: garnet core (M1a to M1c), garnet rim (M1c to M2), and matrix equilibration (M2).
Pseudosection calculation
Pseudosection calculation, with results and interpretation (Fig. 2), is given in detail in Tual et al. (2017). Below, we summarize the relevant data associated with constraining pressure for different metamorphic stages. The pseudosec-tion was calculated using THERMOCALC 3.3 and database ds55 (Powell et al. 1998) in the system NCKFMASHTO (Na2O–CaO–K2O–FeO–MgO–Al2O3–SiO2–H2O–TiO2–O) with H2O in excess. Mineral abbreviations (in Fig. 2) are those used by THERMOCALC (Holland and Powell 2011).
The ellipses in the pseudosection (Fig. 2) correspond to stages in the prograde history. The first stage, M1a,
constrained by mineral inclusions and the composition of the inner core of garnet, shows the onset of garnet growth at c. 7–7.5 kbar and 675–700 °C. The assemblage is gar-net + amphibole + rutile + plagioclase + quartz + ilmen-ite (+ biotite, Fig. 5). The M1b stage, at 8–8.5kbar and 705–720 °C, is constrained by the composition of the outer cores of garnet, commonly inclusion-poor. The inclusion-rich domains in the inner rims of garnet corresponds roughly to conditions from the M1c stage to ~ 11–12 kbar at 775 °C, based on the garnet composition. The garnet rims contain clinopyroxene inclusions; hence, the rock is inferred to have passed through a clinopyroxene-in field during growth of the garnet rim. Finally, the M2 stage at ~ 16 to 18.5 kbar at 850–900 °C is based on the matrix minerals and the outer rims of garnet. Further constraints on the metamorphic peak are provided in Tual et al. (2017) using mineral modes and compositions from a sample of different bulk composition.
The pseudosection-based P–T estimates for the prograde stages of the P–T path provide pressure estimates for input in geothermometry calculations; the temperature estimates provided by the pseudosection allow comparison with those from Zr-in-rutile and Ti-in-quartz geothermometry. The pressure values used are: (1) 7 kbar, inner garnet core cor-responding to M1a; (2) 12 kbar, inclusion-poor domain in garnet, i.e., the uppermost limit for outer core of garnet and lowermost limit for the inner rim of garnet (M1c); (3) 18 kbar, corresponding to the uppermost P limit for garnet rim and matrix outer rim of garnet and matrix (M2).
Sample preparation
Rock slabs (0.5 mm thick) were prepared and polished for in situ analyses. Four garnet grains and their surround-ing matrices were selected using reflected light binocular microscopy. The selection was based on (1) abundance of rutile and quartz inclusions in garnet, (2) distinct core-and-rim domains in garnet, (3) close proximity of matrix quartz and rutile, (4) grain size of garnet: large round garnet grains were preferred (4–5 mm in diameter). Selected grains were cut off from the slab and mounted in the centremost part of a 25 mm epoxy disc. Gold coating (30 nm) was used for SIMS analyses; carbon coating for scanning electron microscopy (SEM) analyses.
Ti concentrations in quartz and Zr concentrations in rutile were determined by SIMS using a CAMECA IMS1280 large-geometry instrument (NordSIMS laboratory, Museum of Natural History in Stockholm). For both methods, an aperture-projected O2
− primary beam was used to generate analytical spots of 10 µm on the sample, with correspond-ing beam currents of ca. 3 or 5nA. Positive secondary ions were optimized in a 45 eV energy window, filtered at a mass resolution (M/∆M) of 4000 to eliminate interfering species, and detected in peak-hopping mode using an ion-counting
Contributions to Mineralogy and Petrology (2018) 173:56
1 3
Page 7 of 15 56
electron multiplier for trace elements at < 106 cps or a Fara-day cup for matrix peaks.
For rutile, the species 48Ti and 90Zr were measured, Zr concentrations being derived from the relative 90Zr/48Ti ratio between the unknowns and a rutile reference material, R10b, which has a Zr content of 759 µg g−1 (Luvizotto et al. 2009). Typical within-run uncertainties on the 90Zr/48Ti ratio were ~ 3% (s.e.), while an external precision of ~ 12% (RSD) was obtained from 12 measurements of R10b. These analytical uncertainties are propagated together with the reported ca. 1% uncertainty on the concentration in R10b and are clearly the dominant contribution to overall uncertainty (Online resource 1).
For quartz, the species 27Al, 28Si, 40Ca, 47Ti, and 48Ti were measured; Al and Ca being used to detect the pos-sible presence of other minerals as inclusions that might adversely affect the measurement by contributing extraneous Ti. Ti concentrations were calibrated using the 47Ti/28Si ratio against a smoky quartz reference material from Shandong Province, China, which has a Ti concentration of 57 µg g−1 (Audétat et al. 2015). Data exhibiting extreme excursions of 27Al/28Si (in some cases tripping the electron multiplier) or 40Ca/28Si ratio were excluded from consideration. In contrast to Zr in rutile, overall uncertainty in Ti concentration of quartz is dominated by the ~ 7% uncertainty in the content of the reference material, propagated together with typical within-run uncertainties of < 1% and an external precision of ~ 2% (n = 10; Online resource 2).
Zr‑in‑rutile and Ti‑in‑quartz
Rutile and quartz grains were imaged using backscattered electron (BSE) and secondary electron (SE) image modes. BSE images are best to identify micro-inclusions and ilmen-ite exsolutions, whereas SE images show best micro-frac-tures, grain boundaries, and analytical pits (Fig. 4). In addi-tion, quartz grains were imaged using cathodoluminescence (CL) to identify discrete zoning pattern or grain boundaries in quartz. Imaging was performed using a Hitachi 3400N scanning electron microscope fitted with a miniGatan CL detector and 10–15 kV acceleration voltage (Lund Univer-sity, Sweden).
Temperature calculations from Zr-in-rutile were made using the calibration of Tomkins et al. (2007) and the three different and independently constrained pressure values of 7, 12, and 18 kbar (Sect. Pseudosection calculation). Tem-perature calculations for Ti-in-quartz follow the calibration of Thomas et al. (2010), using the independently constrained values for three pressures (Sect. Pseudosection calculation).
Results
Results of Zr‑in‑rutile
Analyses of Zr, Nb, and Ta were performed on 147 spots (10 µm) in rutile grains. The full set of data is tabulated in
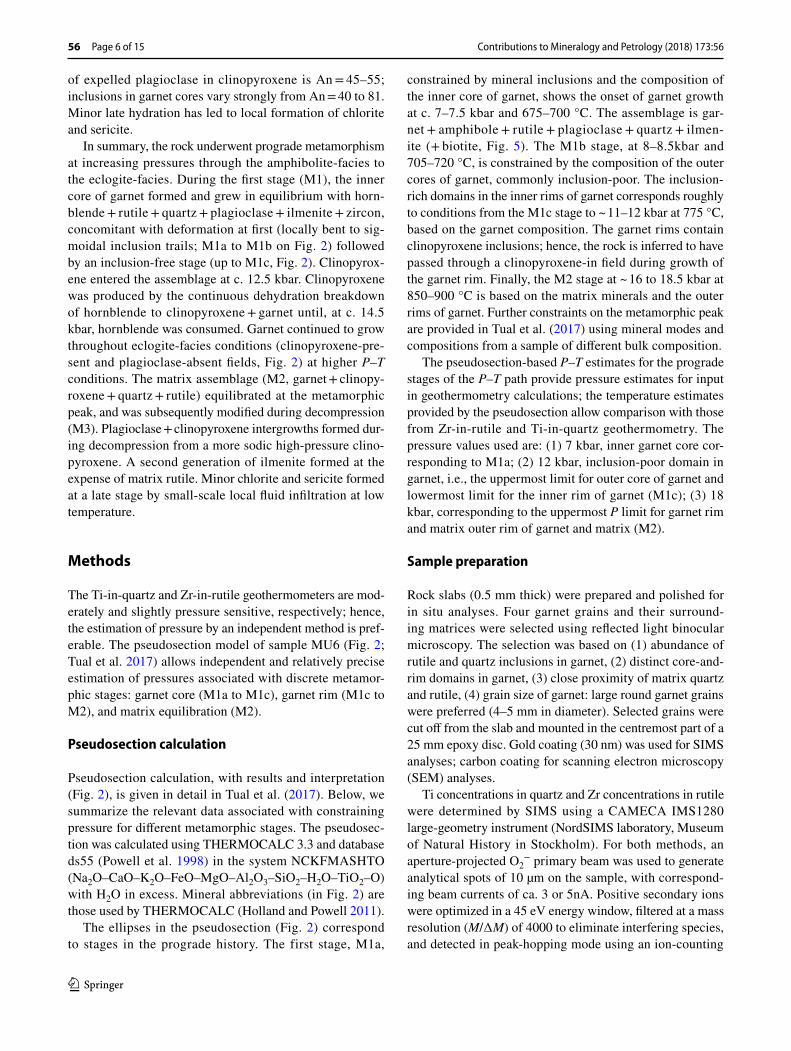
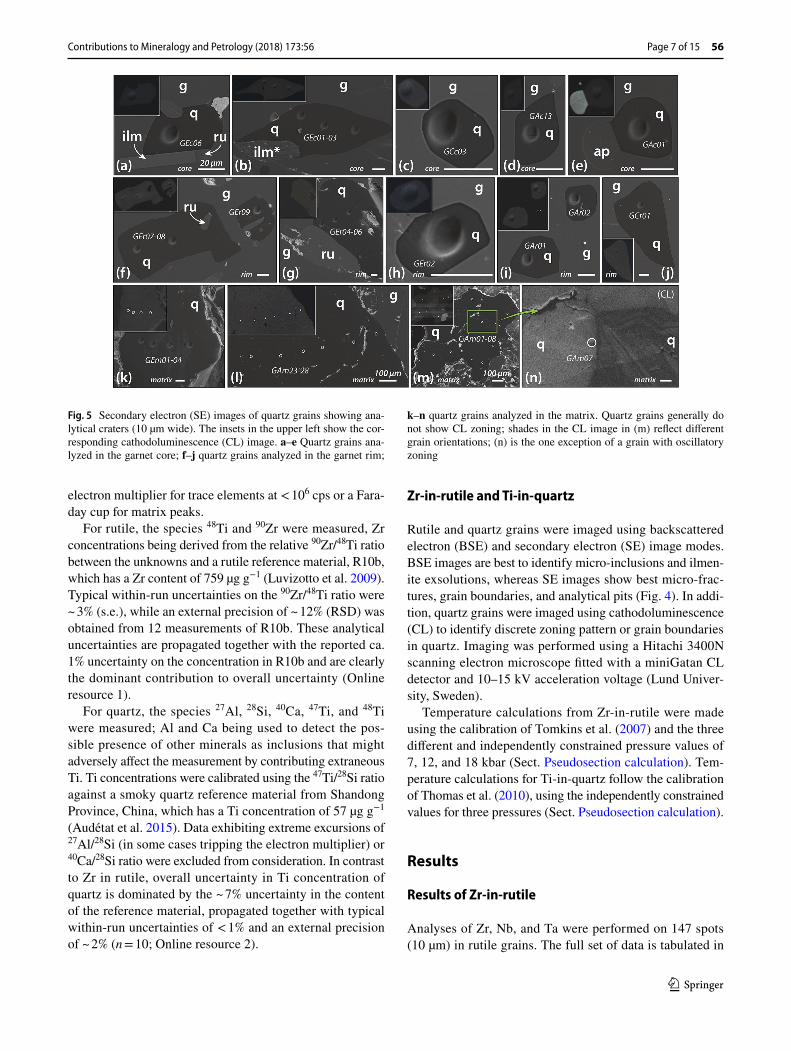
Fig. 5 Secondary electron (SE) images of quartz grains showing ana-lytical craters (10 µm wide). The insets in the upper left show the cor-responding cathodoluminescence (CL) image. a–e Quartz grains ana-lyzed in the garnet core; f–j quartz grains analyzed in the garnet rim;
k–n quartz grains analyzed in the matrix. Quartz grains generally do not show CL zoning; shades in the CL image in (m) reflect different grain orientations; (n) is the one exception of a grain with oscillatory zoning
Contributions to Mineralogy and Petrology (2018) 173:56
1 3
56 Page 8 of 15
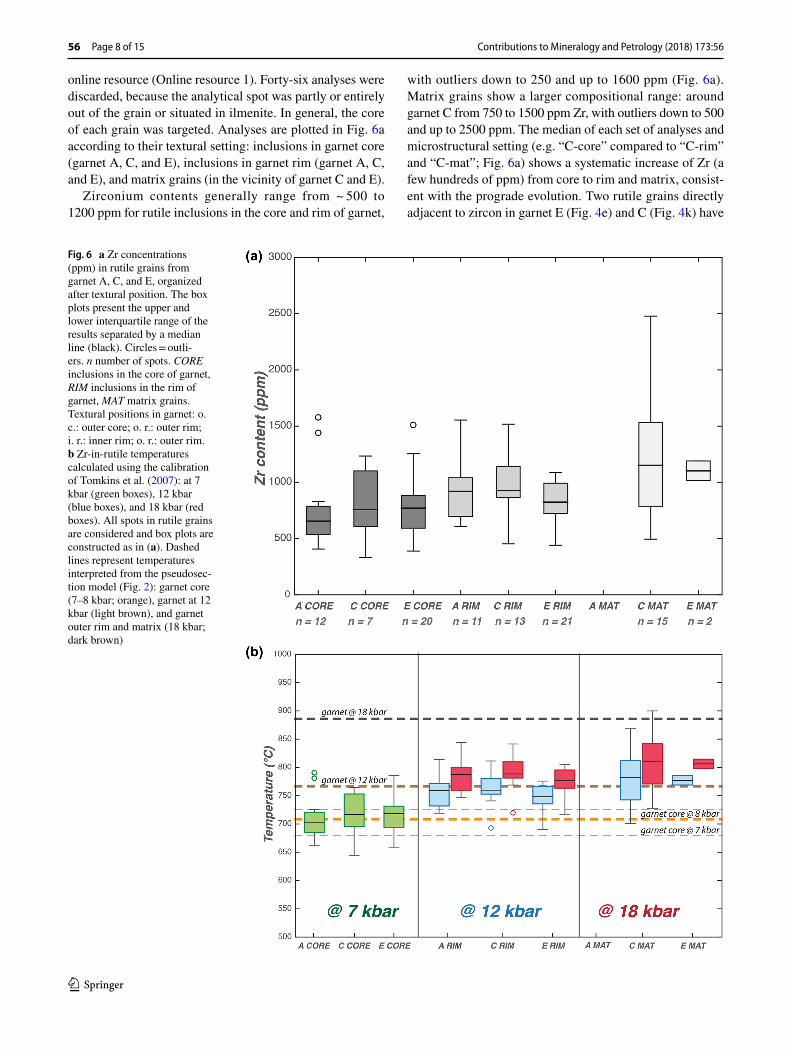
online resource (Online resource 1). Forty-six analyses were discarded, because the analytical spot was partly or entirely out of the grain or situated in ilmenite. In general, the core of each grain was targeted. Analyses are plotted in Fig. 6a according to their textural setting: inclusions in garnet core (garnet A, C, and E), inclusions in garnet rim (garnet A, C, and E), and matrix grains (in the vicinity of garnet C and E).
Zirconium contents generally range from ~ 500 to 1200 ppm for rutile inclusions in the core and rim of garnet,
with outliers down to 250 and up to 1600 ppm (Fig. 6a). Matrix grains show a larger compositional range: around garnet C from 750 to 1500 ppm Zr, with outliers down to 500 and up to 2500 ppm. The median of each set of analyses and microstructural setting (e.g. “C-core” compared to “C-rim” and “C-mat”; Fig. 6a) shows a systematic increase of Zr (a few hundreds of ppm) from core to rim and matrix, consist-ent with the prograde evolution. Two rutile grains directly adjacent to zircon in garnet E (Fig. 4e) and C (Fig. 4k) have
Fig. 6 a Zr concentrations (ppm) in rutile grains from garnet A, C, and E, organized after textural position. The box plots present the upper and lower interquartile range of the results separated by a median line (black). Circles = outli-ers. n number of spots. CORE inclusions in the core of garnet, RIM inclusions in the rim of garnet, MAT matrix grains. Textural positions in garnet: o. c.: outer core; o. r.: outer rim; i. r.: inner rim; o. r.: outer rim. b Zr-in-rutile temperatures calculated using the calibration of Tomkins et al. (2007): at 7 kbar (green boxes), 12 kbar (blue boxes), and 18 kbar (red boxes). All spots in rutile grains are considered and box plots are constructed as in (a). Dashed lines represent temperatures interpreted from the pseudosec-tion model (Fig. 2): garnet core (7–8 kbar; orange), garnet at 12 kbar (light brown), and garnet outer rim and matrix (18 kbar; dark brown)
Contributions to Mineralogy and Petrology (2018) 173:56
1 3
Page 9 of 15 56
significantly lower Zr contents than other grains from the same garnet and setting (709 instead of ~ 871 ppm and 495 instead of ~ 1352 ppm, respectively). These analyses are, however, included in the data set plotted in Fig. 6.
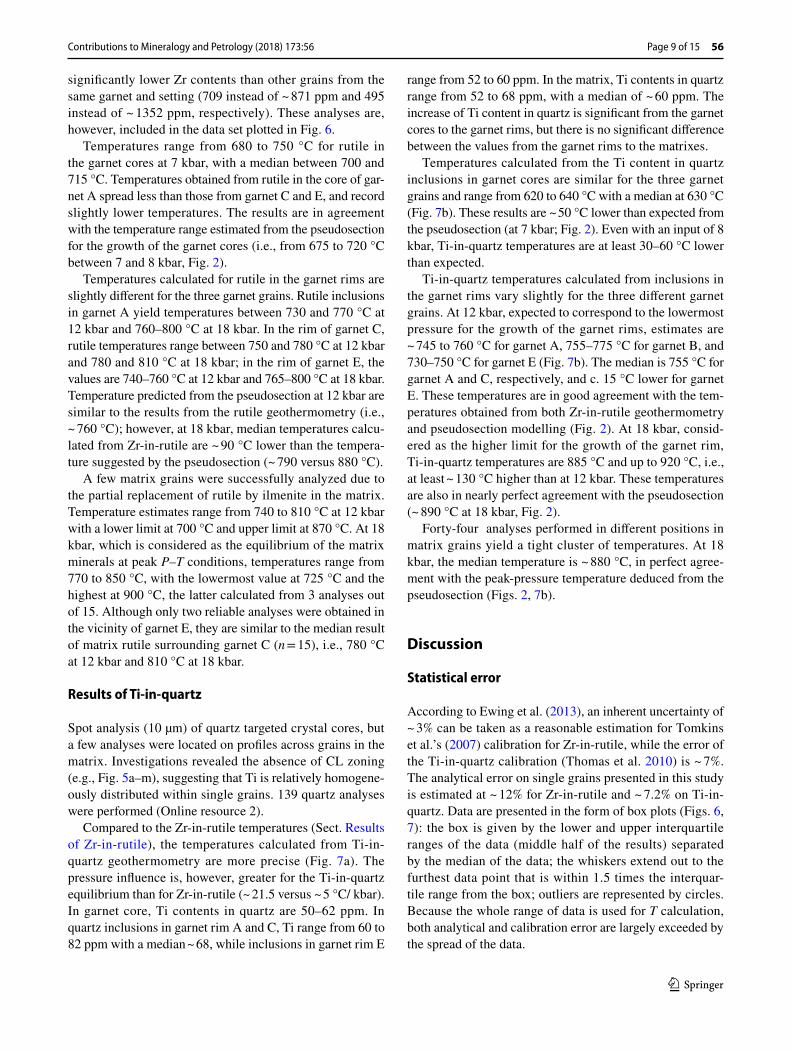
Temperatures range from 680 to 750 °C for rutile in the garnet cores at 7 kbar, with a median between 700 and 715 °C. Temperatures obtained from rutile in the core of gar-net A spread less than those from garnet C and E, and record slightly lower temperatures. The results are in agreement with the temperature range estimated from the pseudosection for the growth of the garnet cores (i.e., from 675 to 720 °C between 7 and 8 kbar, Fig. 2).
Temperatures calculated for rutile in the garnet rims are slightly different for the three garnet grains. Rutile inclusions in garnet A yield temperatures between 730 and 770 °C at 12 kbar and 760–800 °C at 18 kbar. In the rim of garnet C, rutile temperatures range between 750 and 780 °C at 12 kbar and 780 and 810 °C at 18 kbar; in the rim of garnet E, the values are 740–760 °C at 12 kbar and 765–800 °C at 18 kbar. Temperature predicted from the pseudosection at 12 kbar are similar to the results from the rutile geothermometry (i.e., ~ 760 °C); however, at 18 kbar, median temperatures calcu-lated from Zr-in-rutile are ~ 90 °C lower than the tempera-ture suggested by the pseudosection (~ 790 versus 880 °C).
A few matrix grains were successfully analyzed due to the partial replacement of rutile by ilmenite in the matrix. Temperature estimates range from 740 to 810 °C at 12 kbar with a lower limit at 700 °C and upper limit at 870 °C. At 18 kbar, which is considered as the equilibrium of the matrix minerals at peak P–T conditions, temperatures range from 770 to 850 °C, with the lowermost value at 725 °C and the highest at 900 °C, the latter calculated from 3 analyses out of 15. Although only two reliable analyses were obtained in the vicinity of garnet E, they are similar to the median result of matrix rutile surrounding garnet C (n = 15), i.e., 780 °C at 12 kbar and 810 °C at 18 kbar.
Results of Ti‑in‑quartz
Spot analysis (10 µm) of quartz targeted crystal cores, but a few analyses were located on profiles across grains in the matrix. Investigations revealed the absence of CL zoning (e.g., Fig. 5a–m), suggesting that Ti is relatively homogene-ously distributed within single grains. 139 quartz analyses were performed (Online resource 2).
Compared to the Zr-in-rutile temperatures (Sect. Results of Zr-in-rutile), the temperatures calculated from Ti-in-quartz geothermometry are more precise (Fig. 7a). The pressure influence is, however, greater for the Ti-in-quartz equilibrium than for Zr-in-rutile (~ 21.5 versus ~ 5 °C/ kbar). In garnet core, Ti contents in quartz are 50–62 ppm. In quartz inclusions in garnet rim A and C, Ti range from 60 to 82 ppm with a median ~ 68, while inclusions in garnet rim E
range from 52 to 60 ppm. In the matrix, Ti contents in quartz range from 52 to 68 ppm, with a median of ~ 60 ppm. The increase of Ti content in quartz is significant from the garnet cores to the garnet rims, but there is no significant difference between the values from the garnet rims to the matrixes.
Temperatures calculated from the Ti content in quartz inclusions in garnet cores are similar for the three garnet grains and range from 620 to 640 °C with a median at 630 °C (Fig. 7b). These results are ~ 50 °C lower than expected from the pseudosection (at 7 kbar; Fig. 2). Even with an input of 8 kbar, Ti-in-quartz temperatures are at least 30–60 °C lower than expected.
Ti-in-quartz temperatures calculated from inclusions in the garnet rims vary slightly for the three different garnet grains. At 12 kbar, expected to correspond to the lowermost pressure for the growth of the garnet rims, estimates are ~ 745 to 760 °C for garnet A, 755–775 °C for garnet B, and 730–750 °C for garnet E (Fig. 7b). The median is 755 °C for garnet A and C, respectively, and c. 15 °C lower for garnet E. These temperatures are in good agreement with the tem-peratures obtained from both Zr-in-rutile geothermometry and pseudosection modelling (Fig. 2). At 18 kbar, consid-ered as the higher limit for the growth of the garnet rim, Ti-in-quartz temperatures are 885 °C and up to 920 °C, i.e., at least ~ 130 °C higher than at 12 kbar. These temperatures are also in nearly perfect agreement with the pseudosection (~ 890 °C at 18 kbar, Fig. 2).
Forty-four analyses performed in different positions in matrix grains yield a tight cluster of temperatures. At 18 kbar, the median temperature is ~ 880 °C, in perfect agree-ment with the peak-pressure temperature deduced from the pseudosection (Figs. 2, 7b).
Discussion
Statistical error
According to Ewing et al. (2013), an inherent uncertainty of ~ 3% can be taken as a reasonable estimation for Tomkins et al.’s (2007) calibration for Zr-in-rutile, while the error of the Ti-in-quartz calibration (Thomas et al. 2010) is ~ 7%. The analytical error on single grains presented in this study is estimated at ~ 12% for Zr-in-rutile and ~ 7.2% on Ti-in-quartz. Data are presented in the form of box plots (Figs. 6, 7): the box is given by the lower and upper interquartile ranges of the data (middle half of the results) separated by the median of the data; the whiskers extend out to the furthest data point that is within 1.5 times the interquar-tile range from the box; outliers are represented by circles. Because the whole range of data is used for T calculation, both analytical and calibration error are largely exceeded by the spread of the data.

Contributions to Mineralogy and Petrology (2018) 173:56
1 3
56 Page 10 of 15
Petrological interpretation of Zr‑in‑rutile and Ti‑in‑quartz geothermometry
Consistency with the pseudosection modelling
Measured Zr contents in rutile grains vary with textural
setting: they increase from the core to the rim of garnet, and further to the matrix (Fig. 6a). Ti contents in quartz inclu-sions show a similar increase from the core to the rim of gar-net, but the Ti contents in matrix quartz are similar or lower than in quartz inclusions in the rims of garnet (Fig. 7a). Adding appropriate values of pressure to the temperature
Fig. 7 a Ti concentrations (ppm) in quartz grains from garnet A, C,, and E, organized after textural position. The box plots represent the upper and lower interquartile ranges of the results separated by a median line (black). Circles = outli-ers. n number of spots. CORE inclusions in the garnet core, RIM inclusions in the garnet rim, MAT matrix grains. b Ti-in quartz temperatures calculated using the calibration of Thomas et al. (2010): at 7 kbar (green boxes), 12 kbar (blue boxes), and 18 kbar (red boxes). All spots in quartz grains are considered and box plots are constructed as in (a). Dashed lines represent temperatures interpreted from the pseudosec-tion model (Fig. 2): garnet core (7–8 kbar; orange), garnet at 12 kbar (light brown), and garnet outer rim and matrix (18 kbar; dark brown)
Contributions to Mineralogy and Petrology (2018) 173:56
1 3
Page 11 of 15 56
calculations leads to marked differences in estimated tem-perature for the three different textural settings (Figs. 6b, 7b), supporting the previously modelled P–T path (Fig. 2). The higher interquartile range of Ti-in-quartz temperatures from inclusions in the garnet cores overlaps the lower inter-quartile range from the ones in the garnet rims and matrix (Fig. 7b), which is interpreted to reflect the continuous pro-grade growth and recrystallization.
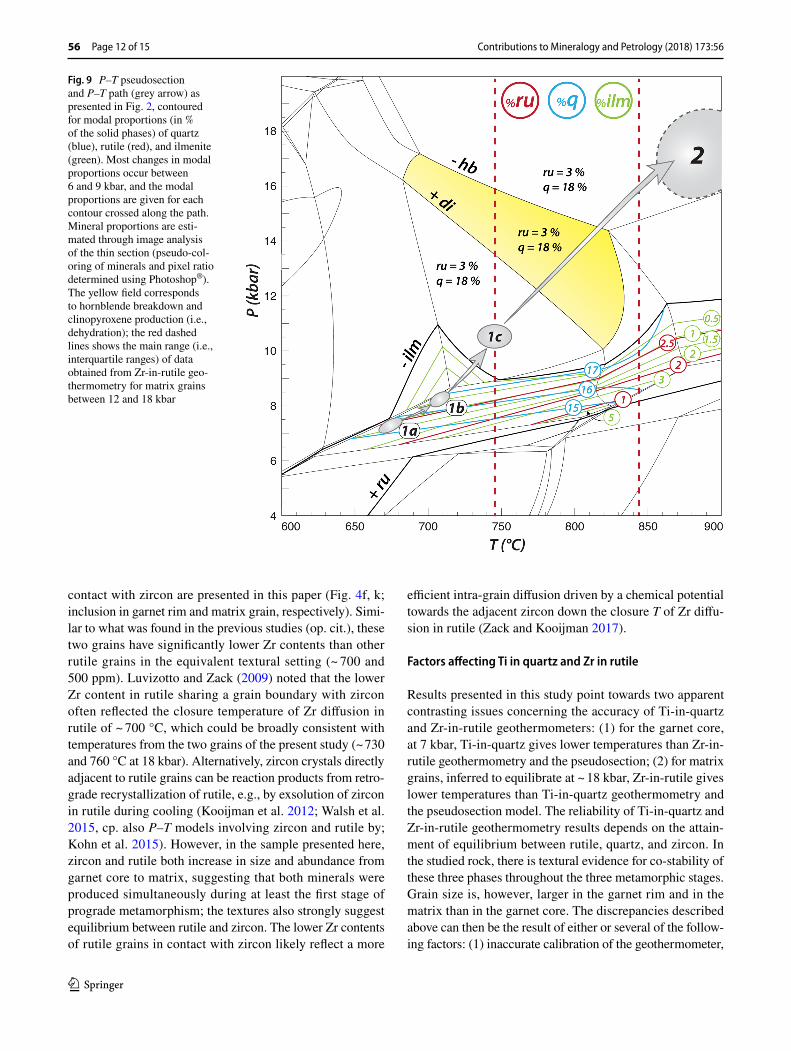
When compared to the pseudosection, the Zr-in-rutile and Ti-in-quartz estimates give information on crystallization and recrystallization processes in the rock. For example, Zr-in-rutile temperatures from inclusions in the garnet cores match the temperature read off the pseudosection for that same stage. This suggests that the growth of rutile grains included in the garnet core was synchronous with, rather than earlier than, the growth of the garnet core. In fact, cal-culation of modal proportions of rutile, quartz, and ilmenite (Fig. 9) shows that growth (as opposed to recrystallization) of rutile and quartz is restricted within the field in which the garnet core grew, at 6–9 kbar. The equilibration of rutile and quartz during continued heating and pressure increase must have largely taken place by recrystallization of the existing grains. From 12.5 to 14.5 kbar, the dehydration of Ti-bearing hornblende (~ 2 wt% TiO2) to clinopyroxene + garnet must have contributed also to an increase in the production of rutile. Consequently, the results from Zr-in-rutile and Ti-in-quartz geothermometry are consistent with continuous pro-grade crystallization, recrystallization, and reequilibration
of the matrix phases during the growth of garnet, until the instance at which the grains were included in garnet and shielded from further reaction.
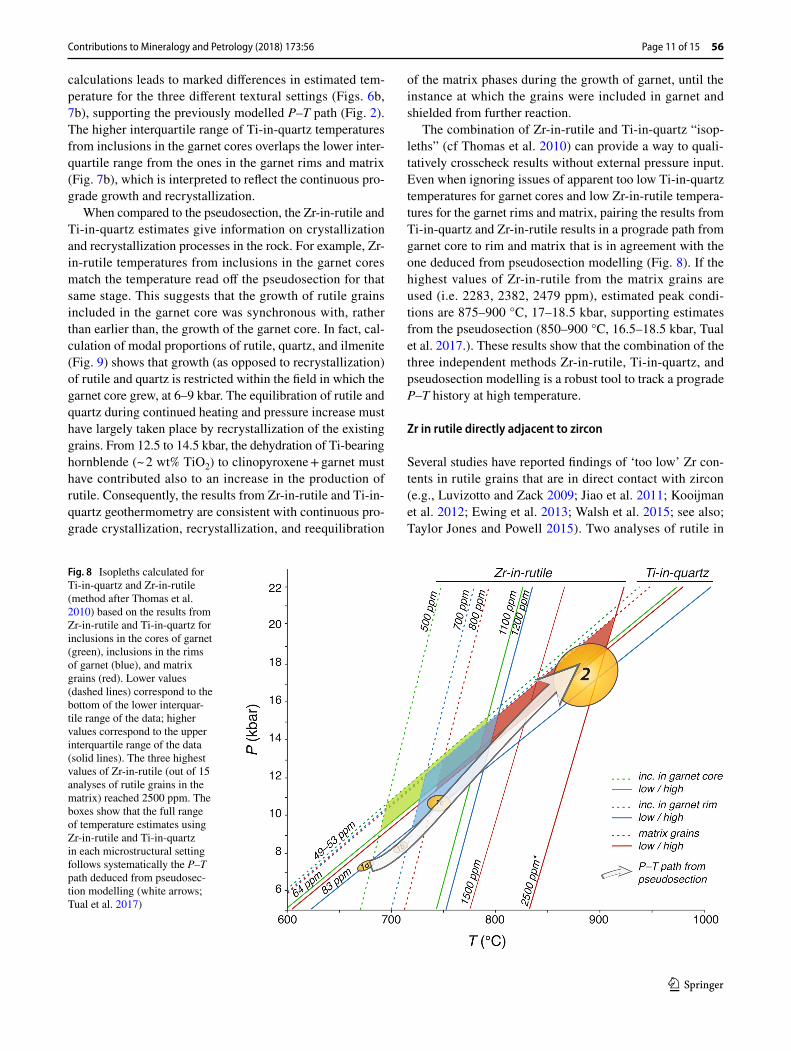
The combination of Zr-in-rutile and Ti-in-quartz “isop-leths” (cf Thomas et al. 2010) can provide a way to quali-tatively crosscheck results without external pressure input. Even when ignoring issues of apparent too low Ti-in-quartz temperatures for garnet cores and low Zr-in-rutile tempera-tures for the garnet rims and matrix, pairing the results from Ti-in-quartz and Zr-in-rutile results in a prograde path from garnet core to rim and matrix that is in agreement with the one deduced from pseudosection modelling (Fig. 8). If the highest values of Zr-in-rutile from the matrix grains are used (i.e. 2283, 2382, 2479 ppm), estimated peak condi-tions are 875–900 °C, 17–18.5 kbar, supporting estimates from the pseudosection (850–900 °C, 16.5–18.5 kbar, Tual et al. 2017.). These results show that the combination of the three independent methods Zr-in-rutile, Ti-in-quartz, and pseudosection modelling is a robust tool to track a prograde P–T history at high temperature.
Zr in rutile directly adjacent to zircon
Several studies have reported findings of ‘too low’ Zr con-tents in rutile grains that are in direct contact with zircon (e.g., Luvizotto and Zack 2009; Jiao et al. 2011; Kooijman et al. 2012; Ewing et al. 2013; Walsh et al. 2015; see also; Taylor Jones and Powell 2015). Two analyses of rutile in
Fig. 8 Isopleths calculated for Ti-in-quartz and Zr-in-rutile (method after Thomas et al. 2010) based on the results from Zr-in-rutile and Ti-in-quartz for inclusions in the cores of garnet (green), inclusions in the rims of garnet (blue), and matrix grains (red). Lower values (dashed lines) correspond to the bottom of the lower interquar-tile range of the data; higher values correspond to the upper interquartile range of the data (solid lines). The three highest values of Zr-in-rutile (out of 15 analyses of rutile grains in the matrix) reached 2500 ppm. The boxes show that the full range of temperature estimates using Zr-in-rutile and Ti-in-quartz in each microstructural setting follows systematically the P–T path deduced from pseudosec-tion modelling (white arrows; Tual et al. 2017)
Contributions to Mineralogy and Petrology (2018) 173:56
1 3
56 Page 12 of 15
contact with zircon are presented in this paper (Fig. 4f, k; inclusion in garnet rim and matrix grain, respectively). Simi-lar to what was found in the previous studies (op. cit.), these two grains have significantly lower Zr contents than other rutile grains in the equivalent textural setting (~ 700 and 500 ppm). Luvizotto and Zack (2009) noted that the lower Zr content in rutile sharing a grain boundary with zircon often reflected the closure temperature of Zr diffusion in rutile of ~ 700 °C, which could be broadly consistent with temperatures from the two grains of the present study (~ 730 and 760 °C at 18 kbar). Alternatively, zircon crystals directly adjacent to rutile grains can be reaction products from retro-grade recrystallization of rutile, e.g., by exsolution of zircon in rutile during cooling (Kooijman et al. 2012; Walsh et al. 2015, cp. also P–T models involving zircon and rutile by; Kohn et al. 2015). However, in the sample presented here, zircon and rutile both increase in size and abundance from garnet core to matrix, suggesting that both minerals were produced simultaneously during at least the first stage of prograde metamorphism; the textures also strongly suggest equilibrium between rutile and zircon. The lower Zr contents of rutile grains in contact with zircon likely reflect a more
efficient intra-grain diffusion driven by a chemical potential towards the adjacent zircon down the closure T of Zr diffu-sion in rutile (Zack and Kooijman 2017).
Factors affecting Ti in quartz and Zr in rutile
Results presented in this study point towards two apparent contrasting issues concerning the accuracy of Ti-in-quartz and Zr-in-rutile geothermometers: (1) for the garnet core, at 7 kbar, Ti-in-quartz gives lower temperatures than Zr-in-rutile geothermometry and the pseudosection; (2) for matrix grains, inferred to equilibrate at ~ 18 kbar, Zr-in-rutile gives lower temperatures than Ti-in-quartz geothermometry and the pseudosection model. The reliability of Ti-in-quartz and Zr-in-rutile geothermometry results depends on the attain-ment of equilibrium between rutile, quartz, and zircon. In the studied rock, there is textural evidence for co-stability of these three phases throughout the three metamorphic stages. Grain size is, however, larger in the garnet rim and in the matrix than in the garnet core. The discrepancies described above can then be the result of either or several of the follow-ing factors: (1) inaccurate calibration of the geothermometer,
Fig. 9 P–T pseudosection and P–T path (grey arrow) as presented in Fig. 2, contoured for modal proportions (in % of the solid phases) of quartz (blue), rutile (red), and ilmenite (green). Most changes in modal proportions occur between 6 and 9 kbar, and the modal proportions are given for each contour crossed along the path. Mineral proportions are esti-mated through image analysis of the thin section (pseudo-col-oring of minerals and pixel ratio determined using Photoshop®). The yellow field corresponds to hornblende breakdown and clinopyroxene production (i.e., dehydration); the red dashed lines shows the main range (i.e., interquartile ranges) of data obtained from Zr-in-rutile geo-thermometry for matrix grains between 12 and 18 kbar
Contributions to Mineralogy and Petrology (2018) 173:56
1 3
Page 13 of 15 56
including the influence of pressure, (2) retrograde diffusion of Ti in quartz and Zr in rutile, (3) kinetics, leading to a relatively more efficient (faster) incorporation of Zr in rutile than Ti in quartz during the first prograde stage (garnet core and rim), and the opposite scenario at peak metamorphic conditions (matrix equilibration).
Calibrations The calibration and pressure dependence of Zr-in-rutile presented in Tomkins et al. (2007) has proven reliable in a number of studies (e.g., Racek et al. 2008; Koo-ijman et al. 2012; Ewing et al. 2013; Štípská et al. 2014). The Ti-in-quartz calibration (Thomas et al. 2010) has, how-ever, been discussed by Huang and Audétat (2012) who inferred that quartz which grew at slow rates and relatively “low” temperatures (600–800 °C) might result in an under-estimation of T, and presented a recalibration of the Ti-in-quartz geothermometer. In the rock subject to the present study, it is unlikely that the garnet core grew slower than the rim, because the surface/volume ratio decreases towards garnet rim growth. Instead, the garnet core can be expected to grow relatively “faster” than the rim, also allowing inclu-sions to become larger towards the rim. Moreover, as the Ti-in-quartz temperatures are similar to those obtained by Zr-in-rutile and the pseudosection at 12 kbar (775 °C), there is no justification for choosing another calibration. Finally, Thomas et al. (2015) confirmed that the initial calibration of Thomas et al. (2010) is the most reliable available from 5 to 20 kbar.
Diffusion There is no clear CL zoning in quartz grains (except for one grain with oscillatory zoning, Fig. 5) and there is limited variation in Ti content (Fig. 7a) among quartz grains of different sizes, and across single large grains in the matrix. The Ti-in-quartz data presented in this study are precise and consistent over the sample scale for each textural setting, similar to what has been described for other samples by Thomas et al. (2015). As shown in Fig. 8, the slope of the P–T path is similar to the slope of the Ti-in-quartz equilibrium line, which explains the small variation of Ti content in quartz during the prograde path. In this respect, our case differs from that of Ewing et al. (2013), who showed a larger range for Ti-in-quartz tem-peratures than for Zr-in-rutile temperatures, and inferred this difference to be the result of net loss of Ti in quartz. Experiments performed by Cherniak et al. (2007) showed that Ti in quartz will diffuse over a distance of 500 µm during a 1 Ma episode at 800 °C. We do not, however, observe net loss of Ti in quartz grains included in garnet core or in the matrix. Our results are consistent with those of Spear and Wark (2009) who showed that no systematic diffusion occurs even for small quartz grains (< 70 µm), when quartz grains are shielded by garnet. Although high temperatures are recorded, our study indicates that diffu-
sion did not affect the matrix grains, in turn, suggesting short residence time at high temperature. Finally, the first part of the decompression path was near-isothermal and crosses higher values of Ti-in-quartz isopleths (Fig. 8); hence, no Ti diffusion in quartz is expected until the rock starts to cool (at pressures < 10 kbar).
Partial replacement of rutile by ilmenite took place in the matrix, with accompanying recrystallization of rutile and resetting of Zr-in-rutile temperatures. Zr diffusion in (apparently) well-preserved grains cannot be ruled out with-out more detailed profiles over these single matrix grains. In granulite-facies rocks, it can be expected that rutile grains have been affected by Zr loss, because the crystallization temperature might exceed the closure temperature of Zr dif-fusion (Cherniak et al. 2007; Baldwin and Brown 2008). The first part of the decompression path (coeval with the partial replacement of rutile by ilmenite) was near-isothermal and follows closely the Zr-in-rutile isopleths (Fig. 8); therefore, Zr diffusion in rutile is expected first at pressures lower than 10 kbar.
Kinetic effects and influence of fluid release Kinetic effects can result in chemical disequilibrium, even though minerals appear in textural equilibrium. The relative diffusion rates of Ti and Zr and the growth rate of garnet are parameters that could influence Ti-in-quartz and Zr-in-rutile results.
At the growth of the garnet core, quartz, ilmenite, rutile, and zircon coexisted and Zr-in-rutile temperatures fit with the pseudosection. Zirconium is available, allowing its equi-librium with rutile. Even though rutile is growing and ilmen-ite progressively breaking down and releasing Ti (Fig. 9), Ti-in-quartz estimates remain at least ~ 55 °C lower than what the pseudosection and Zr-in-rutile geothermometry suggest. It is considered unlikely that rutile incorporates excess Zr; therefore, the problem should lie in quartz incorporating too little Ti. Various explanations have been suggested for lower than expected Ti contents in quartz. Ashley et al. (2014) pro-posed that crystal plastic flow might hinder the incorporation of Ti in quartz. By contrast, Nachlas and Hirth (2015) dem-onstrated that ductile shearing improves the incorporation and equilibration of Ti and other trace elements in quartz. Moreover, Kidder et al. (2013) showed that Ti-in-quartz can be reliable at temperatures as low as greenschist-facies. In the rock studied in this paper, the garnet cores grew under deformation, under the lowest temperature recorded by the rock (amphibolite-facies), and must have grown relatively fast. Our preferred interpretation is that fast growth led to the incorporation of incompletely Ti-equilibrated quartz grains.
At the core-to-rim transition (12 kbar), both Zr-in-rutile and Ti-in-quartz results are in agreement with results from the pseudosection. This pressure is close to the terminal breakdown of ilmenite (Fig. 9; although extremely sensitive on the whole-rock Fe3+ content, Tual et al. 2017). For this
Contributions to Mineralogy and Petrology (2018) 173:56
1 3
56 Page 14 of 15
stage, all data suggest mutual equilibrium of rutile, quartz, and zircon.
At peak pressure and temperature, Ti-in-quartz tempera-tures—but only few Zr-in-rutile temperatures—in the stud-ied sample fit with the pseudosection model. Zr-in-rutile has been considered the most reliable geothermometer at high temperatures (e.g., Zack and Luvizottow 2006; Zhang et al. 2009; Kooijman et al. 2012; Ewing et al. 2013). Yet, in our sample, most matrix rutile has incorporated too lit-tle Zr to match the peak P–T conditions. According to the pseudosection model (Fig. 9), quartz and rutile were pro-duced in the ilmenite-bearing stability fields, but thereafter remained in relative constant modal amounts. At 12 kbar, there is no discrepancy between Zr-in-rutile results and Ti-in-quartz results, but rutile appears only partially equili-brated between ~ 12 and 18 kbar. Prograde reequilibration at 12–15 kbar was dominated by the progressive breakdown of hornblende and growth of clinopyroxene + garnet (yel-low field, Fig. 9); the consumption of Ti-bearing hornblende must also have resulted in renewed production of rutile. In the investigated sample, this stage is also characterized by a substantial increase in grain size, including the grain size of rutile. Dehydration of amphibole and associated fluid release through the matrix may have enhanced grain boundary diffu-sion of elements as well as recrystallization of matrix phases, including rutile. This process took place along the P–T path between 775 and 820 °C (Fig. 9), which closely correlate to the main range of Zr-in-rutile temperatures results between 12 and 18 kbar (Figs. 6b, 9). The termination of hydrous fluid production at 820 °C and 14.5 kbar may have led to a cessation of rutile recrystallization. A few matrix grains do, however, record Zr concentrations up to ~ 2500 ppm, confirming a peak temperature ~ 900 °C (Fig. 8).
Conclusions
In situ (SIMS) analyses of quartz and rutile in each type of micro-textural domain show that whereas Zr-in-rutile records best early stages of the prograde part of the P–T path, Ti-in-quartz records best the peak conditions. A pseu-dosection model, showing the variation in modal abundance of different phases along the P–T path, demonstrates that temperatures recorded in matrix rutile grains reflect recrys-tallization from smaller precursors and that this process was simultaneous with the main dehydration reaction in the rock (continuous breakdown of hornblende and formation of clinopyroxene). Our study shows that Ti concentration in quartz is constant regardless of crystal size, and can provide both precise and accurate results even at high temperatures. The use of the three independent methods Ti-in-quartz, Zr-in-rutile, and a P–T pseudosection model is a robust mean to
constrain P–T evolution and, furthermore, provide important insights on crystallization processes during metamorphism.
Acknowledgements This study was financially supported by the Kung-liga Fysiografiska Sällskapet i Lund to L. Tual. L. Tual thanks M. Smit for inspiring discussions and G. Fontorbe for Matlab tips. We grate-fully acknowledge U. Söderlund for reviewing an early draft of this manuscript, T. Zack (University of Gothenburg) for providing the rutile standard, and A.S. Bouvier (Université de Lausanne) for providing the quartz standard. We thank the great technical support and guidance of K. Lindén and L. Ilyinsky at NordSIMS. Reviews by J. Thomas and P. Tropper, and editorial handling from S. Reddy are highly appreci-ated. The NordSIMS facility is operated under a contract between the research funding agencies of Denmark, Iceland, Norway, Sweden, the Geological Survey of Finland, and the Swedish Museum of Natural History. This paper is NordSIMS publication No. 560.
Open Access This article is distributed under the terms of the Crea-tive Commons Attribution 4.0 International License (http://creat iveco mmons .org/licen ses/by/4.0/), which permits unrestricted use, distribu-tion, and reproduction in any medium, provided you give appropriate credit to the original author(s) and the source, provide a link to the Creative Commons license, and indicate if changes were made.
References
Ashley KT, Webb LE, Spear FS, Thomas JB (2013) P-T-D histories from quartz: a case study of the application of the Ti-in-quartz thermobarometer to progressive fabric development in metape-lites. Geochem Geophys Geosyst 14(9):3821–3843
Ashley KT, Carlson WD, Law RD, Tracy RJ (2014) Ti resetting in quartz during dynamic recrystallization: mechanisms and signifi-cance. Am Miner 99(10):2025–2030
Audétat A, Garbe-Schönberg D, Kronz A, Pettke T, Rusk B, Donovan JJ, Lowers HA (2015) Characterisation of a natural quartz crystal as a reference material for microanalytical determination of Ti, Al, Li, Fe, Mn, Ga and Ge. Geostand Geoanal Res 39(2):171–184
Baldwin JA, Brown M (2008) Age and duration of ultrahigh tempera-ture metamorphism in the Anápolis–Itauçu Complex, Southern Brasília Belt, central Brazil–constraints from U–Pb geochronol-ogy, mineral rare earth element chemistry and trace element ther-mometry. J Metamorph Geol 26(2):213–233
Bingen B, Skår Ø, Marker M, Sigmond EM, Nordgulen Ø, Ragnhild-stveit J, Mansfeld J, Tucker RD, Liégeois JP (2005) Timing of continental building in the Sveconorwegian orogen, SW Scandi-navia. Nor J Geol 85(1–2):87–116
Bingen B, Nordgulen Ø, Viola G (2008) A four-phase model for the Sveconorwegian orogeny, SW Scandinavia. Nor J Geol 88:43–72
Cherniak DJ, Watson EB, Wark DA (2007) Ti diffusion in quartz. Chem Geol 236(1):65–74
Ewing TA, Hermann J, Rubatto D (2013) The robustness of the Zr-in-rutile and Ti-in-zircon thermometers during high-temperature metamorphism (Ivrea-Verbano Zone, northern Italy). Contrib Miner Petrol 165(4):757–779
Ferry JM, Watson EB (2007) New thermodynamic models and revised calibrations for the Ti-in-zircon and Zr-in-rutile thermometers. Contrib Miner Petrol 154(4):429–437
Holland TJB, Powell R (2011) An improved and extended internally consistent thermodynamic dataset for phases of petrological inter-est, involving a new equation of state for solids. J Metamorph Geol 29:333–383

Contributions to Mineralogy and Petrology (2018) 173:56
1 3
Page 15 of 15 56
Huang R, Audétat A (2012) The titanium-in-quartz (Ti-in-quartz) ther-mobarometer: a critical examination and re-calibration. Geochim Cosmochim Acta 84:75–89
Jiao S, Guo J, Mao Q, Zhao R (2011) Application of Zr-in-rutile ther-mometry: a case study from ultrahigh-temperature granulites of the Khondalite belt, North China Craton. Contrib Miner Petrol 162(2):379–393
Johansson L, Möller C, Söderlund U (2001) Geochronology of eclog-ite facies metamorphism in the Sveconorwegian Province of SW Sweden. Precambr Res 106:261–275
Kidder S, Avouac JP, Chan YC (2013) Application of titanium-in-quartz thermobarometry to greenschist facies veins and recrys-tallized quartzites in the Hsüehshan range. Taiwan Solid Earth 4(1):1–21
Kohn MJ, Corrie SL, Markley C (2015) The fall and rise of metamor-phic zircon. Am Miner 100(4):897–908
Kooijman E, Smit MA, Mezger K, Berndt J (2012) Trace ele-ment systematics in granulite facies rutile: implications for Zr geothermometry and provenance studies. J Metamorph Geol 30(4):397–412
Korhonen FJ, Clark C, Brown M, Taylor RJM (2014) Taking the temperature of Earth’s hottest crust. Earth Planet Sci Lett 408:341–354
Liu YC, Deng LP, Gu XF, Groppo C, Rolfo F (2015) Application of Ti-in-zircon and Zr-in-rutile thermometers to constrain high-temperature metamorphism in eclogites from the Dabie orogen, central China. Gondwana Res 27(1):410–423
Luvizotto GL, Zack T (2009) Nb and Zr behavior in rutile during high-grade metamorphism and retrogression: an example from the Ivrea–Verbano Zone. Chem Geol 261(3):303–317
Luvizotto GL, Zack T, Meyer HP, Ludwig T, Triebold S, Kronz A, Jacob DV et al (2009) Rutile crystals as potential trace element and isotope mineral standards for microanalysis. Chem Geol 261(3):346–369
Möller C (1998) Decompressed eclogites in the Sveconorwegian (–Grenvillian) orogen of SW Sweden: petrology and tectonic impli-cations. J Metamorph Geol 16:641 656
Möller C (1999) Sapphirine in SW Sweden: a record of Sveconorwe-gian (–Grenvillian) late-orogenic tectonic exhumation. J Meta-morph Geol 17:127–141
Möller C, Andersson J (2018) Metamorphic zoning and behaviour of an underthrusting continental plate. J Metamorph Geol 36:567–589
Möller C, Andersson J, Dyck B, Antal Lundin I (2015) Exhumation of an eclogite terrane as a hot migmatitic nappe, Sveconorwe-gian orogen. Lithos 226:147–168 (Hirajama T, Medaris G (eds) High- and ultrahigh-pressure metamorphism, from micro-scopic to orogenic scale. Lithos (Special Issue))
Nachlas WO, Hirth G (2015) Experimental constraints on the role of dynamic recrystallization on resetting the Ti in quartz thermoba-rometer. J Geophys Res Solid Earth 120(12):8120–8137
Powell R, Holland TJBH., Worley B (1998) Calculating phase dia-grams involving solid solutions via non linear equations, with examples using THERMOCALC. J Metamorph Geol 16:577–588
Racek M, Štípská P, Powell R (2008) Garnet–clinopyroxene intermedi-ate granulites in the St. Leonhard massif of the Bohemian Massif: ultrahigh temperature metamorphism at high pressure or not? J Metamorph Geol 26(2):253–271
Slagstad T, Roberts NMW, Marker M, Røhr TS, Schiellerup H (2013) A non-collisional, accretionary Sveconorwegian orogen. Terra Nova 25(1):30–37
Spear FS, Wark DA (2009) Cathodoluminescence imaging and tita-nium thermometry in metamorphic quartz. J Metamorph Geol 27(3):187–205
Štípská P, Powell R, Racek M (2014) Rare eclogite-mafic granulite in felsic granulite in Blanský les: precursor of intermediate granulite in the Bohemian Massif? J Metamorph Geol 32(4):325–345
Taylor Jones K, Powell R (2015) Interpreting zirconium in rutile ther-mometric results. J Metamorph Geol 33(2):115–122
Thomas JB, Watson EB, Spear FS, Shemella PT, Nayak SK, Lanzirotti A (2010) Ti-in-quartz under pressure: the effect of pressure and temperature on the solubility of Ti-in-quartz. Contrib Miner Petrol 160(5):743–759
Thomas JB, Watson EB, Spear FS, Wark DA (2015) Ti-in-quartz recrystallized: experimental confirmation of the original Ti-in-quartz calibrations. Contrib Miner Petrol 169(3):1–16
Tomkins HS, Powell R, Ellis DJ (2007) The pressure dependence of the zirconium in rutile thermometer. J Metamorph Geol 25(6):703–713
Tual L, Pinan-Llamas A, Möller C (2015) High-temperature deforma-tion in the basal shear zone of an eclogite-bearing fold nappe, Sveconorwegian Orogen, Sweden. Precambr Res 265:104–120 (In: Roberts N, Viola G, Slagstad T (eds) The structural, meta-morphic and magmatic evolution of Mesoproterozoic orogens)
Tual L, Pitra P, Möller C (2017) P–T evolution of Precambrian eclogite in the Sveconorwegian orogen, SW Sweden. J Metamorph Geol 35(5):493–515
Walsh AK, Kelsey DE, Kirkland CL, Hand M, Smithies RH, Clark C, Howard HM (2015) P–T–t evolution of a large, long-lived, ultrahigh-temperature Grenvillian belt in central Australia. Gond-wana Res 28(2):531–564
Wark DA, Watson EB (2006) TitaniQ: a titanium-in-quartz geother-mometer. Contrib Miner Petrol 152(6):743–754
Watson EB, Wark DA, Thomas JB (2006) Crystallization thermometers for zircon and rutile. Contrib Miner Petrol 151(4):413–433
Zack T, Kooijman E (2017) Petrology and geochronology of rutile. Rev Mineral Geochem 83(1):443–467
Zack T, Luvizottow GL (2006) Application of rutile thermometry to eclogites. Mineral Petrol 88(1–2):69–85
Zack T, Moraes R, Kronz A (2004) Temperature dependence of Zr-in-rutile: empirical calibration of a rutile thermometer. Contrib Miner Petrol 148(4):471–488
Zhang RY, Iizuka Y, Ernst WG, Liou JG, XU ZQ, Tsujimori T, Jahn BM et al (2009) Metamorphic P–T conditions and thermal struc-ture of Chinese Continental Scientific Drilling main hole eclog-ites: Fe–Mg partitioning thermometer vs. Zr in rutile thermom-eter. J Metamorph Geol 27(9):757–772
Affiliations
L. Tual1,2 · C. Möller1 · M. J. Whitehouse2
1 Department of Geology, Lund University, Sölvegatan 12, 223 62 Lund, Sweden
2 Swedish Museum of Natural History, Box 50 007, 104 05 Stockholm, Sweden