Embed Size (px)
Citation preview
NBER WORKING PAPER SERIES
TRADE AND INDUSTRIALISATION AFTER GLOBALISATION’S 2ND UNBUNDLING:HOW BUILDING AND JOINING A SUPPLY CHAIN ARE DIFFERENT AND WHY IT MATTERS
Richard Baldwin
Working Paper 17716http://www.nber.org/papers/w17716
NATIONAL BUREAU OF ECONOMIC RESEARCH1050 Massachusetts Avenue
Cambridge, MA 02138December 2011
The views expressed herein are those of the author and do not necessarily reflect the views of the NationalBureau of Economic Research.
NBER working papers are circulated for discussion and comment purposes. They have not been peer-reviewed or been subject to the review by the NBER Board of Directors that accompanies officialNBER publications.
© 2011 by Richard Baldwin. All rights reserved. Short sections of text, not to exceed two paragraphs,may be quoted without explicit permission provided that full credit, including © notice, is given tothe source.

Trade And Industrialisation After Globalisation’s 2nd Unbundling: How Building And JoiningA Supply Chain Are Different And Why It MattersRichard BaldwinNBER Working Paper No. 17716December 2011JEL No. F1,F2,F21,F23,F43
ABSTRACT
Revolutionary transformations of industry and trade occurred from 1985 to the late-1990s – theregionalisation of supply chains. Before 1985, successful industrialisation meant building a domesticsupply chain. Today, industrialisers join supply chains and grow rapidly because offshored productionbrings elements that took Korea and Taiwan decades to develop domestically. These changes havenot been fully reflected in “high development theory” – a lacuna that may lead to misinterpretationof data and inattention to important policy questions.
Richard BaldwinCigale 21010 LausanneSWITZERLANDand CEPRand also [email protected]
Trade and industrialisation after globalisation’s 2nd unbundling: How building and joining a supply chain are different and why it matters
Richard Baldwin
Graduate Institute, Geneva
November 2011; First draft: September 2011
Abstract
Revolutionary transformations of industry and trade occurred from 1985 to the late-1990s – the regionalisation of supply chains. Before 1985, successful industrialisation meant building a domestic supply chain. Today, industrialisers join supply chains and grow rapidly because offshored production brings elements that took Korea and Taiwan decades to develop domestically. These changes have not been fully reflected in “high development theory” – a lacuna that may lead to misinterpretation of data and inattention to important policy questions.
1. INTRODUCTION
For most of the 19th and 20th centuries, “industrialised” and “rich” were synonymous. No surprise then that economists have long theorised about how nations industrialise and trade’s role in this. Recent work by Rodrik (2011a, b) serves to further spotlight the key role that manufacturing plays in development. Lindauer and Prichett (2002) distinguish three generations of development theories, or “Big Ideas”. The first (1945 to 1982) said governments should drive rapid industrialization; dirigiste policies were needed to get past coordination failures caused by the lumpiness and complexity of industry. Trade was necessary for importing key inputs, but relying on export markets was questionable.
Widespread failure of this ‘import-substitution industrialisation’ – or ISI to cognoscenti – was brought home by the 1980s debt crises. Second-generation theories (1982-2002 ‘Washington Consensus’) focused on the same strategic goal (creating lumpy, complex industry) but with different tactics. Governments alone could not succeed; markets also mattered. And now exports were critical to achieving scale while import-competition was critical to market discipline.
By 2002, second-generation Big Ideas were past their sell-by-date, according to Lindauer and Prichett. Many developing nations that followed the precepts saw slowing or even negative growth. The good news, which Lindauer and Prichett call “puzzling”, was the roaring success of Asia, especially China. The world needed what Paul Krugman dubbed a counter-counter-revolution in “high development theory” (Krugman 1992). The world is still looking.
As Dani Rodrik wrote: “Maybe the right approach is to give up looking for ‘big ideas’ altogether,” (Rodrik 2005); there is one “economics”, but many ways to apply it (Rodrik 2008). However, as Lindauer and Prichett point out: “The current nostrum of one size doesn’t fit all is not itself a big idea, but a way of expressing the absence of any big ideas."
This paper does not propose a third-generation Big Idea. Rather it suggests that:
High development theorising has overlooked the revolutionary transformation of industry and trade that occurred from 1985 to the late-1990s.
The quest for Big Ideas may have failed because development economists are looking at 21st century industrialisation using 20th century perceptions of trade and industry.
In a nutshell, the missing element boils down to supply chains.
1.1. Building versus joining a supply chain When first generation theories worked (ISI) – as it did for the US, Germany, Japan, etc. – industrialisation meant building the whole supply chain at home. The touchstone fact was that no nation could become globally competitive without a broad and deep industrial base. Building such a supply chain took decades, so considerations of scale, coordination, and commitment posed massive development challenges.
The radical change in the nature of globalisation – what is sometimes called globalisation’s 2nd unbundling – upended this touchstone fact. The 2nd unbundling opened a new industrialisation path. Today, nations can industrialise by joining a supply chain – there is no need to build a supply chain. Indeed in some industries the concept of a one-nation supply chain has disappeared. No nation today produces all the parts and components necessary to make aircraft, cars, or electronics. Some nations are headquarter-economies, others are factory-economies, but no one has the whole value chain. This matters.
In less than a decade, joining a supply chain transmuted several East Asian industries from uncompetitive, tariff-sheltered relics into world-class exporters. China is the most impressive of these, and Vietnam is the most recent.
In North America, Mexico has followed this path. In Europe, uncompetitive Soviet-era industry often became competitive by joining
‘Factory Europe’.
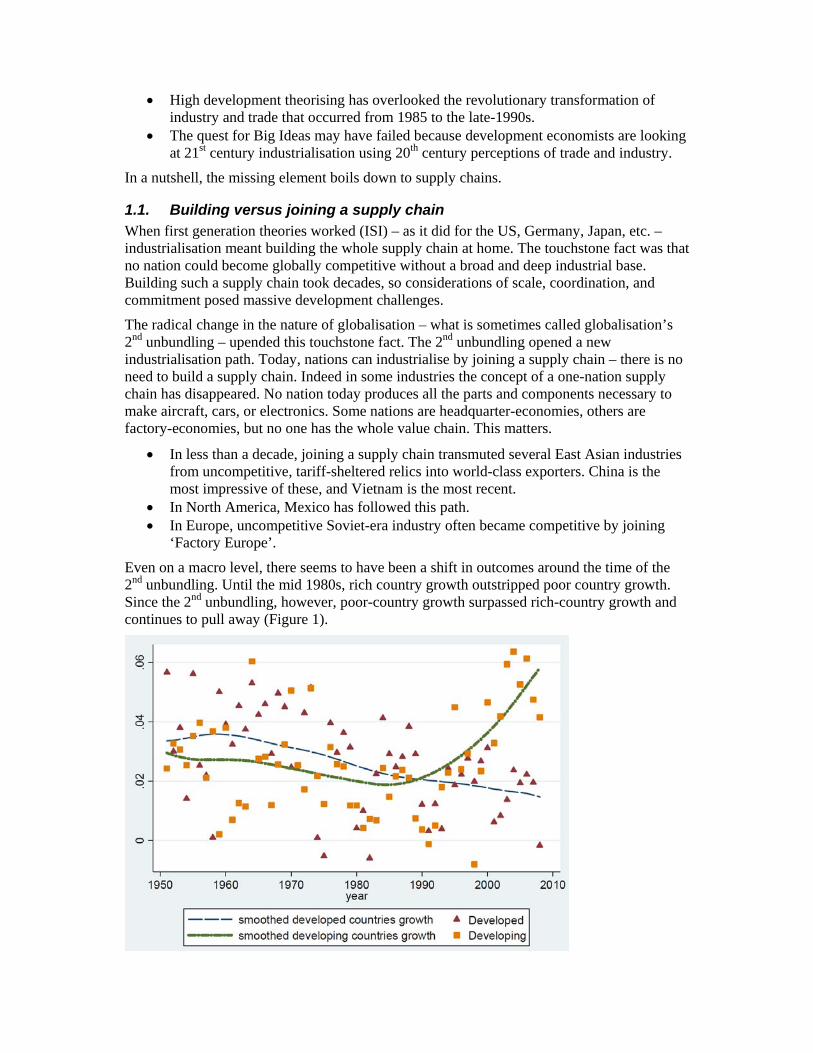
Even on a macro level, there seems to have been a shift in outcomes around the time of the 2nd unbundling. Until the mid 1980s, rich country growth outstripped poor country growth. Since the 2nd unbundling, however, poor-country growth surpassed rich-country growth and continues to pull away (Figure 1).
Figure 1: Developed and developing country growth after the 2nd unbundling. Source: Rodrik (2011a).
Given this rather stark change in fortunes, it is surprising that supply-chains have not played a greater role in ‘high development’ theory. Leading formal models continue to view industry as black boxes where output and exports are packages containing only the nation’s productive factors and technology.1
1.2. Why differences matter The role of governments, trade, and multinationals is completely different when a nation joins a supply chain. Two points:
Industrialisation is easier and faster; but Industrialisation is less meaningful.
It became faster and easier since the supply chain makes industry less lumpy and interconnected domestically; it became less meaningful for the same reasons. That Korea could export domestically-designed car engines was testimony to its rich-nation status. Now, exporting sophisticated manufactured goods is no longer the hallmark of having arrived. It may simply reflect a nation’s position in a global value chain.
Moreover the challenges facing policy makers are quite different. Under the 20th century view of industry, a deep industrial base was a prerequisite for export success, but a large market was necessary to support the industrial base. The search for markets was thus a key element of trade and industrialisation policy. With international supply-chains, however, exporting is easy. Demand is not the key goal. Instead, policy makers face many new questions: Which supply chains should be joined? Should nations strive to set up their own global value chains? What is the optimal technology policy (intellectual property rights, etc.)? Different nations are trying different things without their efforts being guided by formal models that explicitly incorporate supply chains.
This lacuna may account for some part of the empirical failure of Big Ideas. It is easy to see how a comparison between Brazil and China is puzzling when one ignores supply chains.
China – which is physically in the middle of ‘Factory Asia’ – is not using Chinese factors of production, Chinese technology, or relying on Chinese policy for most of Chinese exports.
The Chinese content of its ‘processing exports’ is less than 20% (Ma and Van Assche 2010), and processing exports accounted for more than half of the nation’s boom in manufactured trade.
Of course China-specific factors also matter, but if you want to fully understand Chinese export success, you have to look at the productive factors, technology, and government policies of Japan, Korea, Taipei, and ASEAN nations – that is where many of the critical components, and most of the design, marketing, and management expertise lie.
Brazil is too far from ‘Factory North America’ and ‘Factory Europe’ to enjoy such a free ride.
1 See for example, Hausmann, Hwang and Rodrik (2007), Hausmann, and Klinger (2007), Lederman and Maloney (2007), Klinger and Lederman (2007), and Brambilla, Ledermann and Porto (2010). Rodrik (2011a, b) continue the tradition.
Most of what Brazil exports depends solely on ‘things Brazilian’.
To take one more example of the failure to account of the 2nd unbundling, consider the lessons drawn by the Spence Growth Commission (2008). The Commission’s factual basis rests on 13 success stories. Every single case started well before the 2nd unbundling (which unfolded from the mid-1980s to the late-1990s). Two of the 8 ended before the 2nd unbundling started (Brazil and Japan) and a remarkable 6 of the 13 ended just as the 2nd unbundling was completed. The Report’s lessons are all very sensible – good governance, judicious use of domestic and global markets, etc. – but it seems rather brave to suggest that lessons from Japan’s and Korea’s industrialisation in the 1970s and 1980s can be applied to the world of global value chains. Of course, supply chains are mentioned, but one reads analysis such as: “It should also be said that the global supply chains that run through countries like China and India represent a significant opportunity and not just a threat” (p.94).
1.3. Plan of paper The next section briefly recalls the main outlines of globalisation’s 1st and 2nd unbundlings to set the stage for an illustrative case study (autos) in Section 3. Section 4 seeks to crystallise the economic logic linking trade and industry when industrialisation meant building a supply chain. Section 5 extends the framework to allow explicit consideration of supply chains, their internationalisation, and the role of multinationals. The penultimate section explores why the difference between building and joining a supply chain matters. Section 7 presents concluding remarks.
2. GLOBALISATION AS TWO UNBUNDLINGS
Globalisation is often viewed as driven by the gradual lowering of natural and manmade trade costs. This is a serious misunderstanding.
Globalisation made a giant leap when steam power slashed shipping costs; It made another when ICT decimated coordination costs.
The implications of the two are dramatically different; understanding why requires a bit of background.2
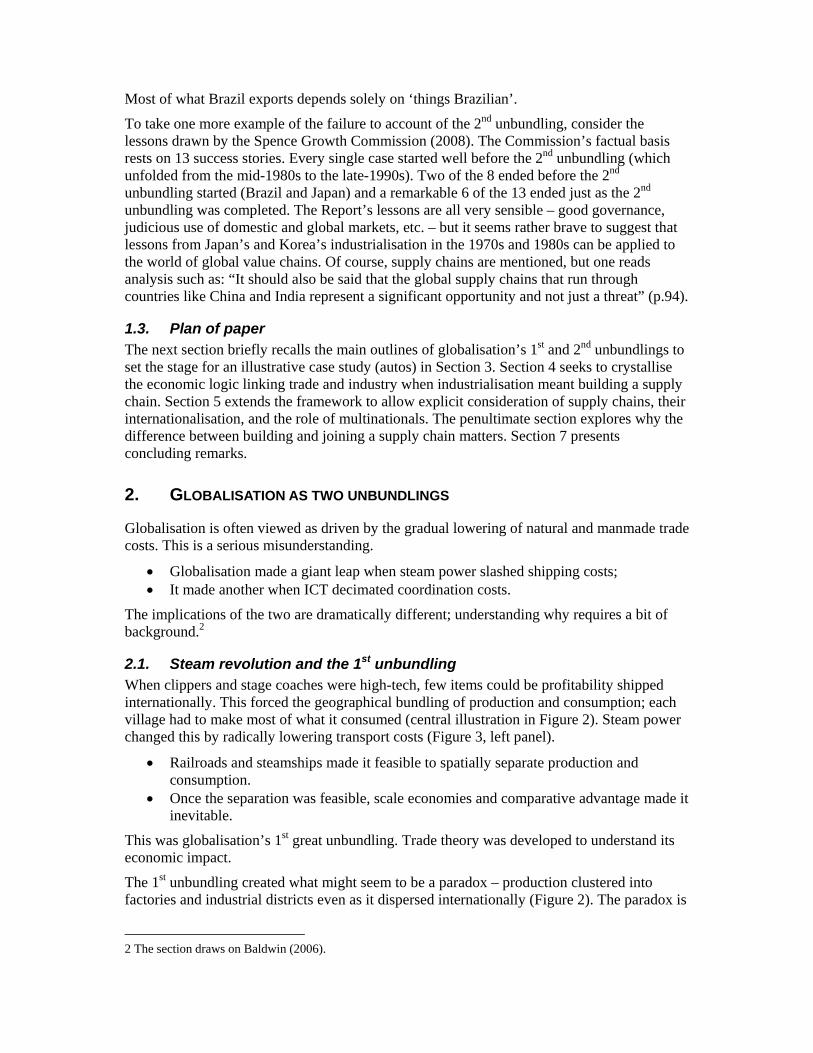
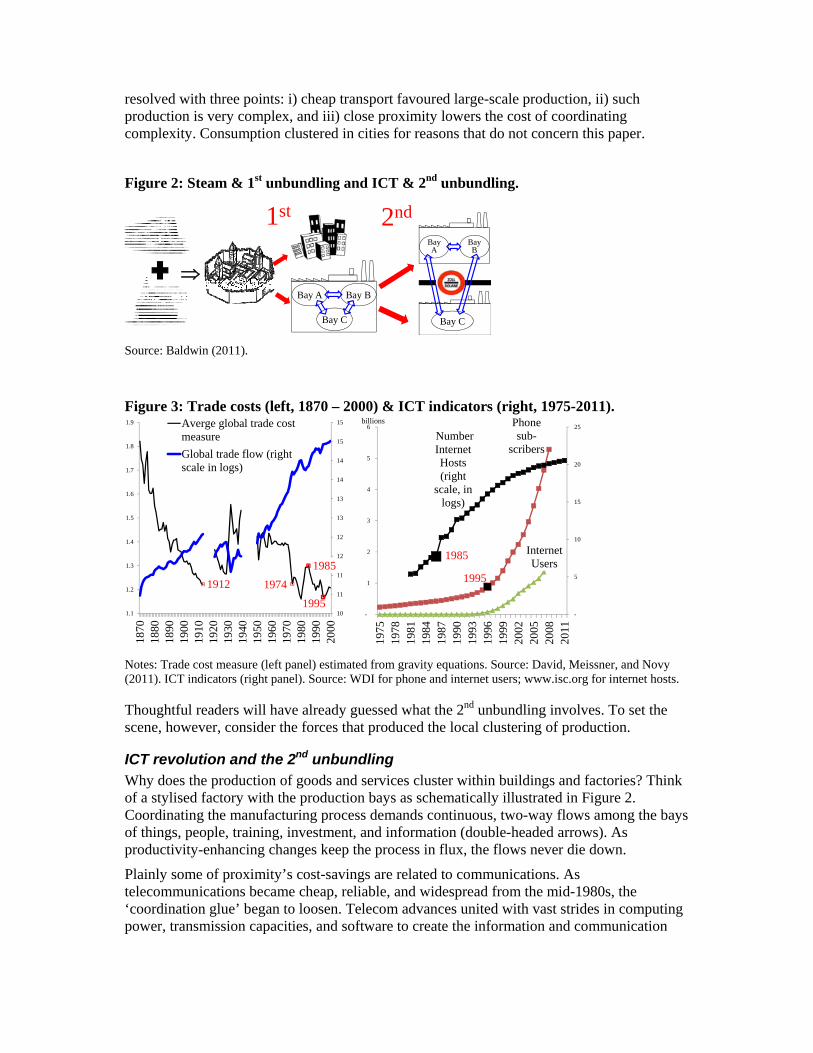
2.1. Steam revolution and the 1st unbundling When clippers and stage coaches were high-tech, few items could be profitability shipped internationally. This forced the geographical bundling of production and consumption; each village had to make most of what it consumed (central illustration in Figure 2). Steam power changed this by radically lowering transport costs (Figure 3, left panel).
Railroads and steamships made it feasible to spatially separate production and consumption.
Once the separation was feasible, scale economies and comparative advantage made it inevitable.
This was globalisation’s 1st great unbundling. Trade theory was developed to understand its economic impact.
The 1st unbundling created what might seem to be a paradox – production clustered into factories and industrial districts even as it dispersed internationally (Figure 2). The paradox is
2 The section draws on Baldwin (2006).
resolved with three points: i) cheap transport favoured large-scale production, ii) such production is very complex, and iii) close proximity lowers the cost of coordinating complexity. Consumption clustered in cities for reasons that do not concern this paper.
Figure 2: Steam & 1st unbundling and ICT & 2nd unbundling.
Bay BBay A
Bay C
Bay B
Bay A
Bay C
1st 2nd
Source: Baldwin (2011).
Figure 3: Trade costs (left, 1870 – 2000) & ICT indicators (right, 1975-2011).
1995
Phonesub-
scribers
Internet Users
1985
Number Internet Hosts (right
scale, in logs)
-
5
10
15
20
25
-
1
2
3
4
5
6
1975
1978
1981
1984
1987
1990
1993
1996
1999
2002
2005
2008
2011
billions
1912 1974
1985
199510
11
11
12
12
13
13
14
14
15
15
1.1
1.2
1.3
1.4
1.5
1.6
1.7
1.8
1.9
1870
1880
1890
1900
1910
1920
1930
1940
1950
1960
1970
1980
1990
2000
Averge global trade costmeasure
Global trade flow (rightscale in logs)
Notes: Trade cost measure (left panel) estimated from gravity equations. Source: David, Meissner, and Novy (2011). ICT indicators (right panel). Source: WDI for phone and internet users; www.isc.org for internet hosts.
Thoughtful readers will have already guessed what the 2nd unbundling involves. To set the scene, however, consider the forces that produced the local clustering of production.
ICT revolution and the 2nd unbundling Why does the production of goods and services cluster within buildings and factories? Think of a stylised factory with the production bays as schematically illustrated in Figure 2. Coordinating the manufacturing process demands continuous, two-way flows among the bays of things, people, training, investment, and information (double-headed arrows). As productivity-enhancing changes keep the process in flux, the flows never die down.
Plainly some of proximity’s cost-savings are related to communications. As telecommunications became cheap, reliable, and widespread from the mid-1980s, the ‘coordination glue’ began to loosen. Telecom advances united with vast strides in computing power, transmission capacities, and software to create the information and communication

technology (ICT) revolution.3
It became increasingly economical to geographically separate manufacturing stages – to unbundle the factories.
Once the separation was feasible, scale economies and comparative advantage made it inevitable.
This was globalisation’s 2nd unbundling; production stages previously performed in close proximity were dispersed to reduce production costs. Theories to understand its implications are only now emerging.4
The unbundling, however, was not global. It was regional. Take for example the North American auto industry. “During the 1950s, ¾ of all auto parts were made in or near Michigan, whereas the state is now responsible for only one-quarter” (Klier and Rubenstein 2008). Figure 4 shows that today many parts plants are no longer in Michigan but they are clustered within a 1000 kilometres. The plants further afield, for example in Mexico, are themselves clustered.
Figure 4: Distance of engine part factories from Detroit.
Source: www.chicagofed.org/digital_assets/others/events/2005/automotive_outlook_symposium/2005_aos_klier.pdf
The timing of the 2nd unbundling has not been definitively identified. The right panel of Figure 3 shows ICT indicators that suggest the shock that created it unrolled from say, 1985 to the late 1990s; I take 1985 to 1995 to be concrete. Transport costs jumped around a bit during this period (oil prices), but were on average unchanged since the early 1970s (left panel, Figure 3).
3 Email, editable files (*.xls, *.doc, etc), and more specialised web-based coordination software packages revolutionised peoples’ ability to manage multifaceted procedures across great distances. Working methods and product designs shifted to make production more modular.
4 Blinder (2006), Grossman and Rossi-Hansberg (2006, 2008), Markusen (2006), Baldwin and Robert-Nicoud (2007) are recent contributions. See Jones and Kierzkowski (1990), Deardorff (1998a,b), and Venables (1999 for the seminal work.

2.2. Transformed international commerce The 2nd unbundling transformed trade for a very simple reason.
Production dispersion did not end the need to coordinate production stages – it internationalised it (rightmost illustration in Figure 2).
This gave rise to 21st century trade – the heart of which might be called the trade-investment-services nexus (Baldwin 2011). Specifically, the nexus reflects the intertwining of: i) trade in parts and components, ii) international movement of investment in production facilities, personnel training, technology, and long-term business relationships, and iii) services to coordinate the dispersed production, especially infrastructure services such as telecoms, internet, express parcel delivery, air cargo, trade-related finance, customs clearance, etc.
The most radical change in terms of theory and outcomes was the way the 2nd unbundling made it easy for rich-nation firms to combine the high technology they developed at home with low-wage workers abroad. The first examples came in 1985 across the US-Mexico border (Hanson and Feenstra 1997) and within East Asia (Ando and Kimura 2005). This created an important distinction – what might be called 20th versus 21st century trade.
20th century trade is the selling of goods made in factories in one nation to customers in another; the trade system is largely about demand, i.e. selling things.
In this world, goods are ‘packages’ of a single nation’s productive factors, technology, social capital, governance capacity, etc. Of course, 20th century trade is still with us.
21st century trade involves continuous, two-way flows of things, people, training, investment, and information that used to take place within factories and offices; the trade system is also about supply, i.e. making things.
Goods are ‘packages’ of a many nations’ productive factors, technology, social capital, and governance capacity; a nation’s trade pattern is inseparable from its position in the supply chain.
2.3. Transformed industrialisation The 2nd unbundling also transformed industrialisation. Before the ICT revolution and the 2nd unbundling, it was impossible to develop a globally competitive industry without a broad and deep industrial base. The nation needed all three Figure 2 production bays inside the country. After the 2nd unbundling, advanced-nation firms offshored labour-intensive segments of their supply chain to developing nations.
This completely changed the industrialisation process in the developing nations that received these offshored stages. Bay B arrived with everything needed to export – world-class technology, management, quality control, a ready-made market, etc.. All the developing nation had to add was i) reasonably reliable workers, ii) a hospitable business environment, iii) proximity to an advanced technology nation willing to offshore some of its factories. Note that proximity matters greatly since key personnel must still visit the offshored factory, so being within an easy day’s travel is a tremendous advantage.
Of these changes, it would seem that those involving technology were the most radical. As rich-nation manufacturers sought to produce certain parts, or complete certain manufacturing stages more cheaply, they moved production facilities abroad. The output had to mesh seamlessly with the continually evolving production processes in other nations, so the multinational typically deployed its firm-specific technology in the foreign factory. This ‘technology lending’ – which is very different than ‘technology transfer’ – could revolutionise a developing nation’s industry almost overnight.
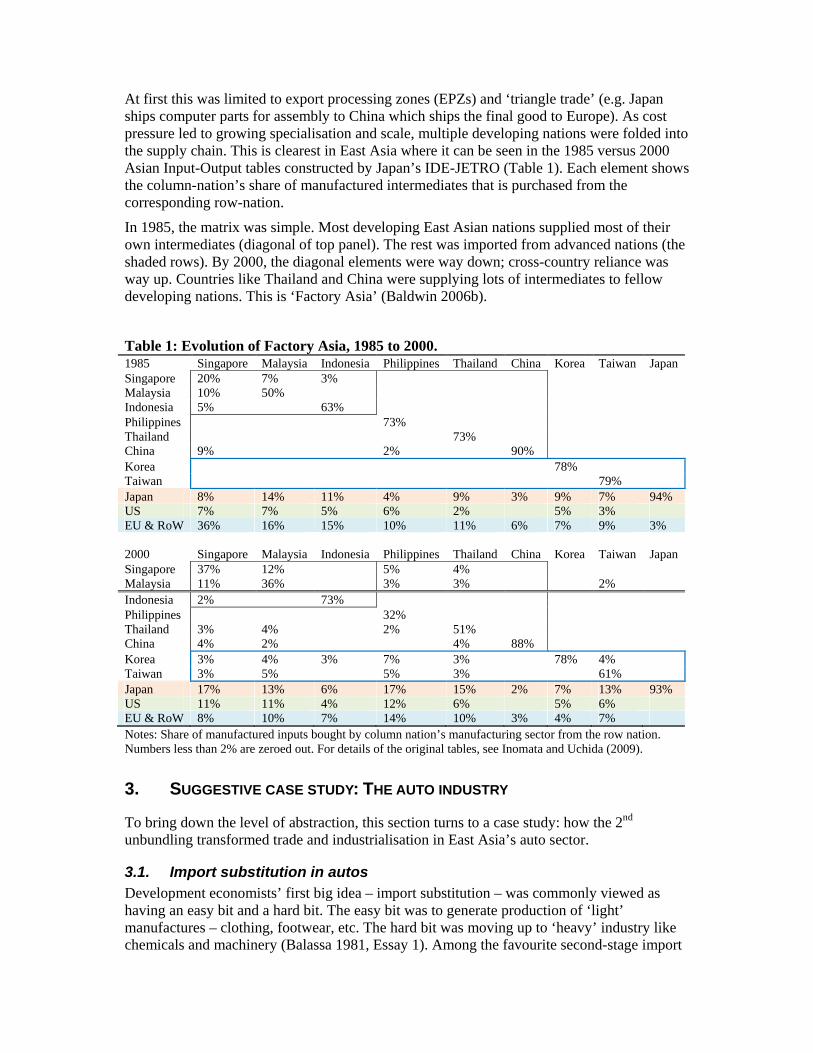
At first this was limited to export processing zones (EPZs) and ‘triangle trade’ (e.g. Japan ships computer parts for assembly to China which ships the final good to Europe). As cost pressure led to growing specialisation and scale, multiple developing nations were folded into the supply chain. This is clearest in East Asia where it can be seen in the 1985 versus 2000 Asian Input-Output tables constructed by Japan’s IDE-JETRO (Table 1). Each element shows the column-nation’s share of manufactured intermediates that is purchased from the corresponding row-nation.
In 1985, the matrix was simple. Most developing East Asian nations supplied most of their own intermediates (diagonal of top panel). The rest was imported from advanced nations (the shaded rows). By 2000, the diagonal elements were way down; cross-country reliance was way up. Countries like Thailand and China were supplying lots of intermediates to fellow developing nations. This is ‘Factory Asia’ (Baldwin 2006b).
Table 1: Evolution of Factory Asia, 1985 to 2000. 1985 Singapore Malaysia Indonesia Philippines Thailand China Korea Taiwan Japan Singapore 20% 7% 3% Malaysia 10% 50% Indonesia 5% 63% Philippines 73% Thailand 73% China 9% 2% 90% Korea 78% Taiwan 79% Japan 8% 14% 11% 4% 9% 3% 9% 7% 94% US 7% 7% 5% 6% 2% 5% 3% EU & RoW 36% 16% 15% 10% 11% 6% 7% 9% 3% 2000 Singapore Malaysia Indonesia Philippines Thailand China Korea Taiwan Japan Singapore 37% 12% 5% 4% Malaysia 11% 36% 3% 3% 2% Indonesia 2% 73% Philippines 32% Thailand 3% 4% 2% 51% China 4% 2% 4% 88% Korea 3% 4% 3% 7% 3% 78% 4% Taiwan 3% 5% 5% 3% 61% Japan 17% 13% 6% 17% 15% 2% 7% 13% 93% US 11% 11% 4% 12% 6% 5% 6% EU & RoW 8% 10% 7% 14% 10% 3% 4% 7% Notes: Share of manufactured inputs bought by column nation’s manufacturing sector from the row nation. Numbers less than 2% are zeroed out. For details of the original tables, see Inomata and Uchida (2009).
3. SUGGESTIVE CASE STUDY: THE AUTO INDUSTRY
To bring down the level of abstraction, this section turns to a case study: how the 2nd unbundling transformed trade and industrialisation in East Asia’s auto sector.
3.1. Import substitution in autos Development economists’ first big idea – import substitution – was commonly viewed as having an easy bit and a hard bit. The easy bit was to generate production of ‘light’ manufactures – clothing, footwear, etc. The hard bit was moving up to ‘heavy’ industry like chemicals and machinery (Balassa 1981, Essay 1). Among the favourite second-stage import
substitution targets was the automobile industry.
Even in the 1970s, making a automobile required a massively complex network of suppliers, and a broad array of advanced technologies, advanced management capacities, and a skilled workforce – exactly the wrong entry-level industry one might think. Why then was it such a favourite among development planners?
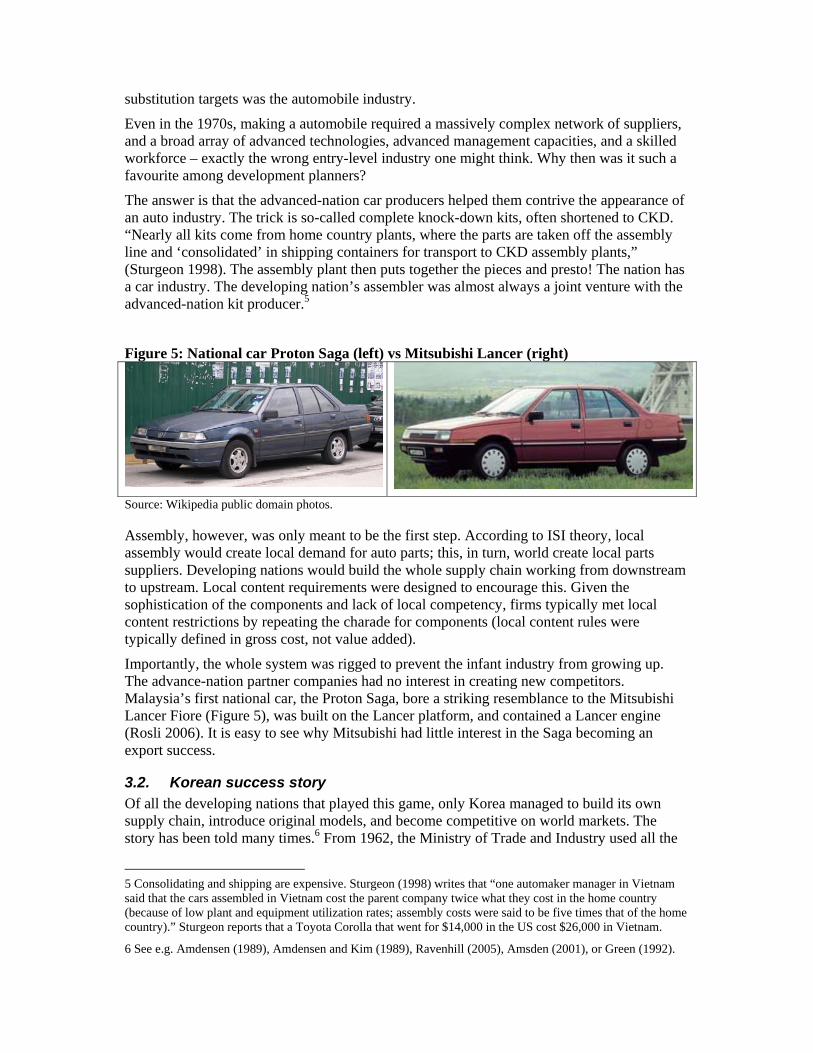
The answer is that the advanced-nation car producers helped them contrive the appearance of an auto industry. The trick is so-called complete knock-down kits, often shortened to CKD. “Nearly all kits come from home country plants, where the parts are taken off the assembly line and ‘consolidated’ in shipping containers for transport to CKD assembly plants,” (Sturgeon 1998). The assembly plant then puts together the pieces and presto! The nation has a car industry. The developing nation’s assembler was almost always a joint venture with the advanced-nation kit producer.5
Figure 5: National car Proton Saga (left) vs Mitsubishi Lancer (right)
Source: Wikipedia public domain photos.
Assembly, however, was only meant to be the first step. According to ISI theory, local assembly would create local demand for auto parts; this, in turn, world create local parts suppliers. Developing nations would build the whole supply chain working from downstream to upstream. Local content requirements were designed to encourage this. Given the sophistication of the components and lack of local competency, firms typically met local content restrictions by repeating the charade for components (local content rules were typically defined in gross cost, not value added).
Importantly, the whole system was rigged to prevent the infant industry from growing up. The advance-nation partner companies had no interest in creating new competitors. Malaysia’s first national car, the Proton Saga, bore a striking resemblance to the Mitsubishi Lancer Fiore (Figure 5), was built on the Lancer platform, and contained a Lancer engine (Rosli 2006). It is easy to see why Mitsubishi had little interest in the Saga becoming an export success.
3.2. Korean success story Of all the developing nations that played this game, only Korea managed to build its own supply chain, introduce original models, and become competitive on world markets. The story has been told many times.6 From 1962, the Ministry of Trade and Industry used all the
5 Consolidating and shipping are expensive. Sturgeon (1998) writes that “one automaker manager in Vietnam said that the cars assembled in Vietnam cost the parent company twice what they cost in the home country (because of low plant and equipment utilization rates; assembly costs were said to be five times that of the home country).” Sturgeon reports that a Toyota Corolla that went for $14,000 in the US cost $26,000 in Vietnam.
6 See e.g. Amdensen (1989), Amdensen and Kim (1989), Ravenhill (2005), Amsden (2001), or Green (1992).
tools of industrial policy – subsidised loans, tax breaks, distorted tariff schedules, import bans, etc. – to develop a car industry via import substitution.
Korea started with assembly, but multinationals were forced to accept weaker positions than usual; control was handed to chaebols – family-owned conglomerates (Amsden 2001). Four firms were established in the first big push: Shinjin, Hyundai, Asia Motors, and Kia. The second big push came as part of the Heavy and Chemical Industries Project (1973). This required the companies to submit plans for a low-cost car whose specifications, timetable, and costs were laid down by the government. The result was Korea’s first home-designed car – Hyundai’s Pony – and a Mazda-designed car by Kia called “Brisa”. Local content of these reached 85%, but major components were still imported (Green 1992).
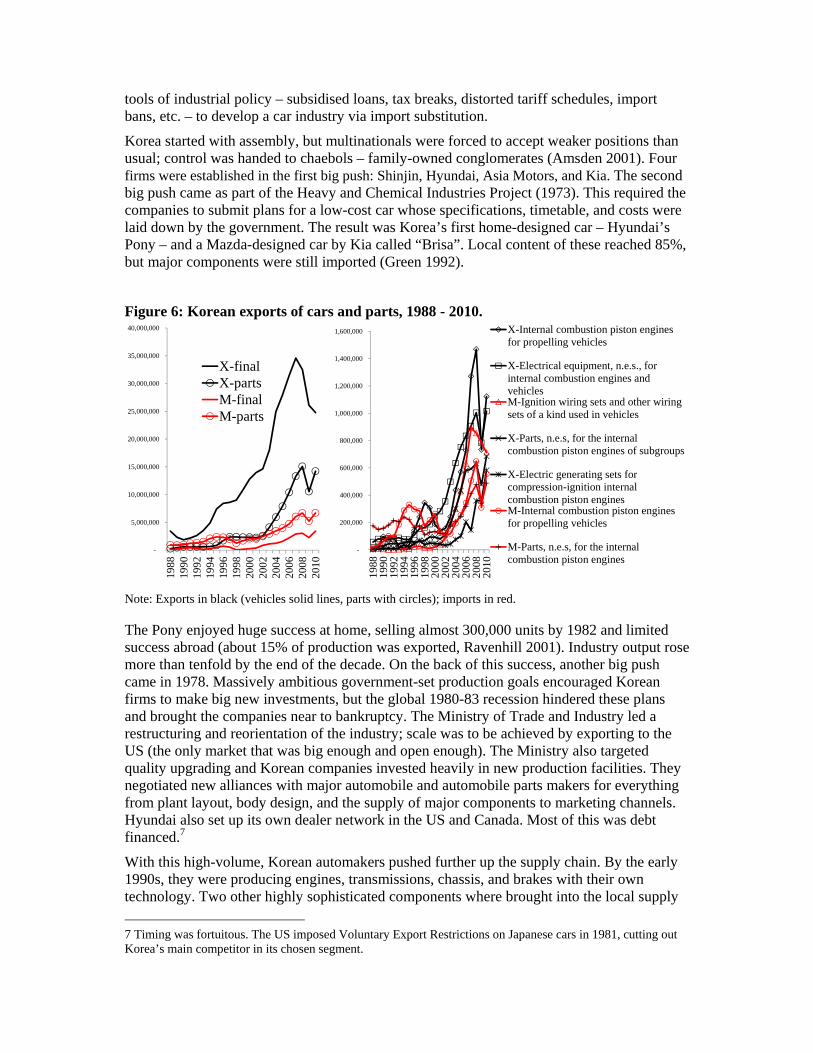
Figure 6: Korean exports of cars and parts, 1988 - 2010.
-
200,000
400,000
600,000
800,000
1,000,000
1,200,000
1,400,000
1,600,000
1988
1990
1992
1994
1996
1998
2000
2002
2004
2006
2008
2010
X-Internal combustion piston enginesfor propelling vehicles
X-Electrical equipment, n.e.s., forinternal combustion engines andvehiclesM-Ignition wiring sets and other wiringsets of a kind used in vehicles
X-Parts, n.e.s, for the internalcombustion piston engines of subgroups
X-Electric generating sets forcompression-ignition internalcombustion piston enginesM-Internal combustion piston enginesfor propelling vehicles
M-Parts, n.e.s, for the internalcombustion piston engines
-
5,000,000
10,000,000
15,000,000
20,000,000
25,000,000
30,000,000
35,000,000
40,000,000
1988
1990
1992
1994
1996
1998
2000
2002
2004
2006
2008
2010
X-finalX-partsM-finalM-parts
Note: Exports in black (vehicles solid lines, parts with circles); imports in red.
The Pony enjoyed huge success at home, selling almost 300,000 units by 1982 and limited success abroad (about 15% of production was exported, Ravenhill 2001). Industry output rose more than tenfold by the end of the decade. On the back of this success, another big push came in 1978. Massively ambitious government-set production goals encouraged Korean firms to make big new investments, but the global 1980-83 recession hindered these plans and brought the companies near to bankruptcy. The Ministry of Trade and Industry led a restructuring and reorientation of the industry; scale was to be achieved by exporting to the US (the only market that was big enough and open enough). The Ministry also targeted quality upgrading and Korean companies invested heavily in new production facilities. They negotiated new alliances with major automobile and automobile parts makers for everything from plant layout, body design, and the supply of major components to marketing channels. Hyundai also set up its own dealer network in the US and Canada. Most of this was debt financed.7
With this high-volume, Korean automakers pushed further up the supply chain. By the early 1990s, they were producing engines, transmissions, chassis, and brakes with their own technology. Two other highly sophisticated components where brought into the local supply
7 Timing was fortuitous. The US imposed Voluntary Export Restrictions on Japanese cars in 1981, cutting out Korea’s main competitor in its chosen segment.
chain in 1996 (the Engine Control Unit, and the Transmission Control Unit).
The nature of this success story was completely transformed by the 1997 Asian crisis. From the mid-1980s until the end of the 1990s, Korean exports were dominated by cars (left panel, Figure 6). Now however the Korean auto industry is a full-fledged participant in the global value chain approach. Yet because they built a supply chain before the 2nd unbundling, Korea is a headquarter economy rather than a factory economy. As Figure 6 shows, its exports of cars and car parts are booming, along with its imports of parts. For example, Korea is an important exporter of engines, but an important importer of the ignition wiring sets used in those engines (right panel).
3.3. Malaysian failure and Thai success Until 1982, Malaysian auto industrialisation focused on kit assembly. The already small market was shared by more than a dozen assemblers. “The resulting market fragmentation made it difficult for components producers to achieve economies of scales, thus, the locally produced parts and components were expensive. This hindered further localization: in 1979, the average local content achieved was merely 8 per cent” (Fuangkajonsak 2006). Policy became radically more state-directed under Prime Minister Mahathir bin Mohamed. In 1981, he established the government-owned Heavy Industries Corporation of Malaysia (HICOM) which aimed to establish a Japanese-like fully integrated automobile industry, i.e. to build the whole supply chain. A ‘national car project’ – Proton – was launched as joint venture with Mitsubishi (HICOM held 70% of the shares).
Unfortunately, the first fruit of this effort (the Saga, Figure 5) appeared in 1985 – the year the second unbundling started to destroy the economic foundations of single-nation automobile production.8 Tariffs and taxes meant that the Saga was 20-30% cheaper than similar models domestically (Fujita 1997); its market share rose to 73% (Uzir Mahidin and Kanageswary, 2004). Exports started in 1989, mostly to Britain under the GSP scheme which allowed in up to 14,000 units duty free; Wad and Chandra note that these were sold below the Malaysian domestic price (2011 p.166).
Proton upgraded from assembling imported key components and parts to manufacturing them locally. Localisation efforts, however, did not go smoothly. Saga continued to rely on Mitsubishi for technology and design. Despite its local and export success, Proton volumes remained small by industry standards (under 100,000 units per year for all models). A second big push came in the 1990s as Proton introduced new models and produced them with varying engine sizes. Malaysian production more than doubled from 1990 to 1997. Proton’s plans, however, were even more ambitious. It announced a new project, ‘Proton City’, which would become an integrated automobile manufacturing city with a production capacity rising to 250,000 units in 2003. During this Proton expansion, a second national car company was set up (Perodua a joint venture with Daihatsu that produced the Kancil – a modified Daihatsu Mira).
For many governments, the 1997 Crisis was the moment they realised that the ISI dream was over. Building a supply chain, like Japan and Korea had done, was not optimal and indeed not possible after the 2nd unbundling. Quite simply, offshoring had killed import substitution. The Malaysian government, however, persisted in pursuing its 1980-era strategy as far as possible. Perodua was sold to its Japanese partner, but Proton was re-nationalised in 2000 and the new, highly advanced plant was completed (Tanjung Malim, with a production capacity
8 Moreover much of the experience gained in the 1960s and 1970s was lost when the government excluded the Chinese-Malaysian firms that had done most of the assembly.
of 500,000 vehicles per year).
Proton introduced the first Malaysian-designed car – the Waja (Impian in Britain) – with the help of technology it acquired when it bought the British car company Lotus. Proton moved up the value chain to manufacturing its own engine in 2002. Given the high costs of parts production, Proton’s domestic market share continues to fall into 2010. Much of its production capacity is idle. The government is looking for a foreign partner for Proton.
After four decades of import substitution, Malaysian auto sector employment was about 50,000 – 70% working for Proton or Perodua – about 80% of whom classified as unskilled (Wad and Chandra 2011).
3.3.1. Thailand Thailand’s 1960s auto-industrialisation plan also aimed for the whole supply chain, starting with CKD assembly. The Thai Board of Investment provided incentives that attracted automakers from the US, Japan, and Europe (Fujita 1997). Thailand raised local content requirements and effective rates of protection progressively. Japanese part suppliers established production in Thailand at the request of assemblers with whom they had close relationships in Japan. Japanese assemblers also developed their own Thai supplier networks by helping local part firms raise their quality via technical assistance (Kriengkrai 2008).
The economic slowdown and the progressive raising of the local content led GM, Ford, and Fiat to withdraw in the early 1980s just before Thailand’s GDP growth took off. The booming domestic vehicle sales from 1987 came just as Japanese auto companies embraced the 2nd unbundling. Unlike Malaysia, Thailand abandoned the old wave to ride the new wave.
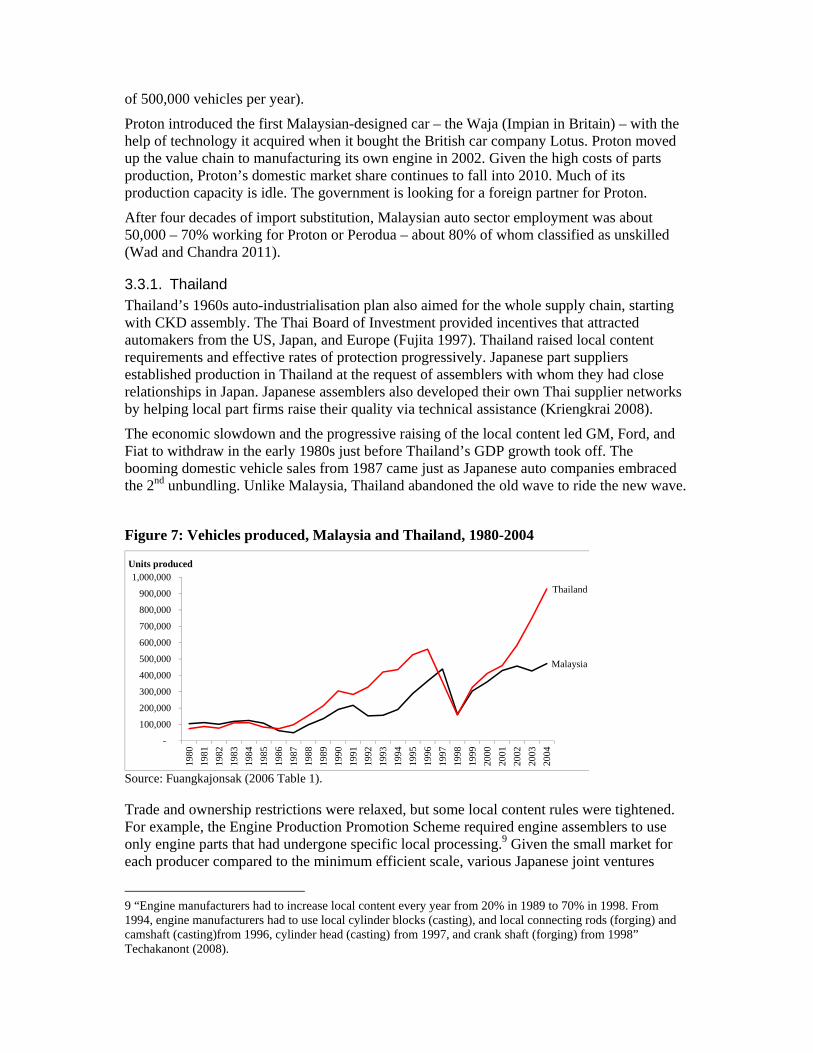
Figure 7: Vehicles produced, Malaysia and Thailand, 1980-2004
Malaysia
Thailand
-
100,000
200,000
300,000
400,000
500,000
600,000
700,000
800,000
900,000
1,000,000
1980
1981
1982
1983
1984
1985
1986
1987
1988
1989
1990
1991
1992
1993
1994
1995
1996
1997
1998
1999
2000
2001
2002
2003
2004
Units produced
Source: Fuangkajonsak (2006 Table 1).
Trade and ownership restrictions were relaxed, but some local content rules were tightened. For example, the Engine Production Promotion Scheme required engine assemblers to use only engine parts that had undergone specific local processing.9 Given the small market for each producer compared to the minimum efficient scale, various Japanese joint ventures
9 “Engine manufacturers had to increase local content every year from 20% in 1989 to 70% in 1998. From 1994, engine manufacturers had to use local cylinder blocks (casting), and local connecting rods (forging) and camshaft (casting)from 1996, cylinder head (casting) from 1997, and crank shaft (forging) from 1998” Techakanont (2008).
collaborated on the local production of the five compulsory parts (Techakanont 2008). The implementation of advanced technology in local factories enhanced Thai industrial capacities. Another unique policy move was the concentration on one market segment – light pickup trucks and vans. Domestic taxes shifted domestic demand heavily towards these (more than 60% sales inside in Thailand) and this was mirrored in Japanese FDI patterns, and later in export patterns.
The next step was exporting – a goal that the Thai government had embraced since the mid-1980s. However rather than intervening directly, the government sought to convince Japanese companies that it would avoid the sort of techno-nationalism policy that hindered FDI in Malaysia. The 1993 ‘Export Promotion Project’ also provided incentives for assembling automobiles for export (tariff exemptions on parts, an 8-year tax holiday, etc.). Local content restrictions were eliminated in 1998 and tariffs and excise taxes were liberalised in 1999. The Thaksin government introduced a bevy of incentives aimed at creating the ‘Detroit of the East’. This worked.
3.4. Comparison of outcomes Differences in results only show up dramatically after the 1997 Crisis (Wad 2009); Figure 7.
Thailand embraced the second unbundling and strove to become part of the global supply chains of as many giant auto firms as it could;
Malaysia persisted with its 1980s strategy of emulating what Korea did in the 1980s and Japan did in the 1970s.
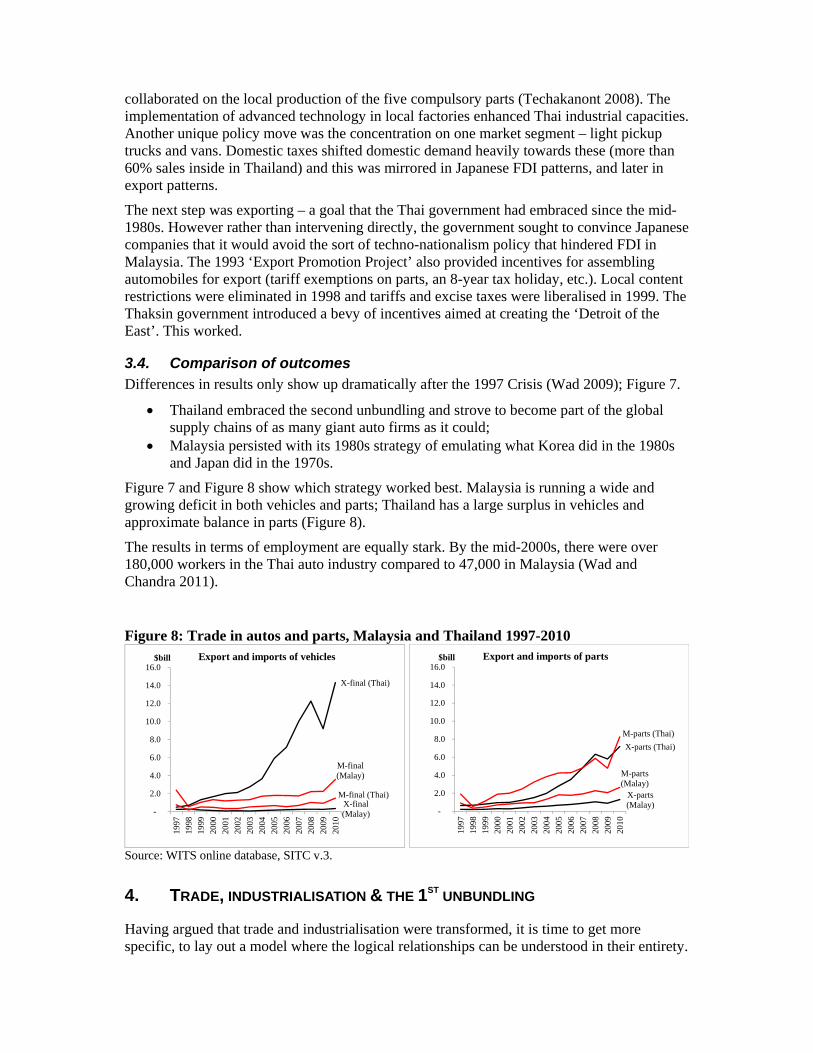
Figure 7 and Figure 8 show which strategy worked best. Malaysia is running a wide and growing deficit in both vehicles and parts; Thailand has a large surplus in vehicles and approximate balance in parts (Figure 8).
The results in terms of employment are equally stark. By the mid-2000s, there were over 180,000 workers in the Thai auto industry compared to 47,000 in Malaysia (Wad and Chandra 2011).
Figure 8: Trade in autos and parts, Malaysia and Thailand 1997-2010
X-final (Malay)
M-final (Malay)
X-final (Thai)
M-final (Thai)
-
2.0
4.0
6.0
8.0
10.0
12.0
14.0
16.0
1997
1998
1999
2000
2001
2002
2003
2004
2005
2006
2007
2008
2009
2010
$bill Export and imports of vehicles
X-parts (Malay)
M-parts (Malay)
X-parts (Thai)
M-parts (Thai)
-
2.0
4.0
6.0
8.0
10.0
12.0
14.0
16.0
1997
1998
1999
2000
2001
2002
2003
2004
2005
2006
2007
2008
2009
2010
$bill Export and imports of parts
Source: WITS online database, SITC v.3.
4. TRADE, INDUSTRIALISATION & THE 1ST UNBUNDLING
Having argued that trade and industrialisation were transformed, it is time to get more specific, to lay out a model where the logical relationships can be understood in their entirety.

The first step is to present a framework that captures the basic elements of traditional ISI thinking (this section). The framework is then extended to consider supply chains (Section 5).
4.1. Industrialisation before the 2nd unbundling When coordination costs were high enough to keep manufacturing bundled into factories; theorists could safely ignore supply chains. The focus was on lumpiness and complexity (e.g. Clare-Rodriguez 1996, and Rodrik 1996). Their basic points can be made graphically.
4.1.1. Great Britain versus the rest Lumpiness of industry comes with external economies of scale and we capture complexity by assuming that the external economies are linked to the nation’s range of industrial competencies.10 Nations are not endowed with competencies; creating a new competency requires a fixed investment of labour. The diagram (Figure 9) reflects these keystone assumptions. The salient points are: i) industry’s marginal-cost curve is downward sloped (external economies mean that the broader is a nation’s range of competencies the lower is its marginal cost); ii) traditional manufacturing techniques (cottage industry) are not subject to scale economies of any kind, so its marginal cost is flat (second to top line).
Figure 9: 20th century industrialisation.
Source: Author’s elaboration of first generation development theory ideas.
The world price of industrial goods is shown as pzw, but this is not the price of imports inside
the nation as two wedges intervene: the natural trade costs captured by (a mnemonic for transport costs), and the domestic tariff factor, Tz. (NB: when transport is costless = 1; when tariffs are zero, Tz = 1.) The domestic price is thus the highest line (we assume the nation has tariffs high enough to make cottage industry profitable). Natural and manmade barriers also
10 We think of these as specialised training, producer services, etc. For example, Amsden (2001 p.4) lists 3 generic capabilities needed for industry: production capabilities (e.g. production management, production engineering, logistics, finance, etc.), project execution capabilities (personnel training, undertaking feasibility studies, project execution, project engineering, procurement, etc.), and innovation capabilities (pure science, basic research, applied research, advanced development, etc.)
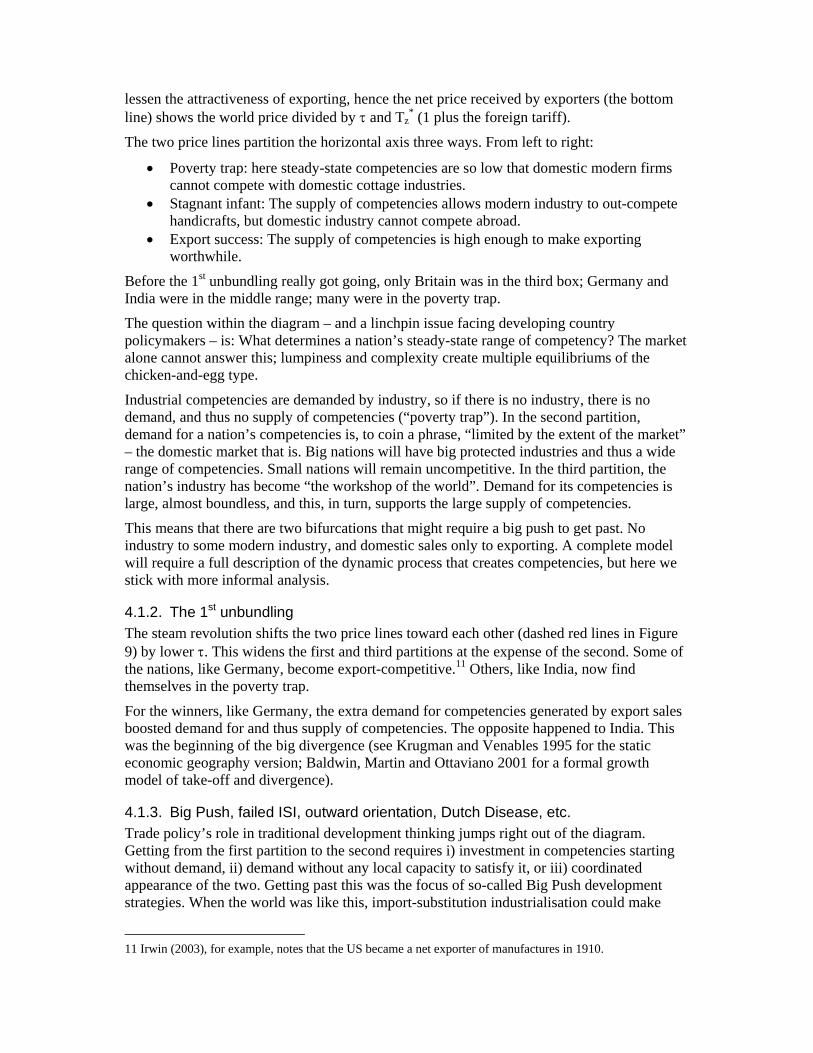
lessen the attractiveness of exporting, hence the net price received by exporters (the bottom line) shows the world price divided by and Tz
* (1 plus the foreign tariff).
The two price lines partition the horizontal axis three ways. From left to right:
Poverty trap: here steady-state competencies are so low that domestic modern firms cannot compete with domestic cottage industries.
Stagnant infant: The supply of competencies allows modern industry to out-compete handicrafts, but domestic industry cannot compete abroad.
Export success: The supply of competencies is high enough to make exporting worthwhile.
Before the 1st unbundling really got going, only Britain was in the third box; Germany and India were in the middle range; many were in the poverty trap.
The question within the diagram – and a linchpin issue facing developing country policymakers – is: What determines a nation’s steady-state range of competency? The market alone cannot answer this; lumpiness and complexity create multiple equilibriums of the chicken-and-egg type.
Industrial competencies are demanded by industry, so if there is no industry, there is no demand, and thus no supply of competencies (“poverty trap”). In the second partition, demand for a nation’s competencies is, to coin a phrase, “limited by the extent of the market” – the domestic market that is. Big nations will have big protected industries and thus a wide range of competencies. Small nations will remain uncompetitive. In the third partition, the nation’s industry has become “the workshop of the world”. Demand for its competencies is large, almost boundless, and this, in turn, supports the large supply of competencies.
This means that there are two bifurcations that might require a big push to get past. No industry to some modern industry, and domestic sales only to exporting. A complete model will require a full description of the dynamic process that creates competencies, but here we stick with more informal analysis.
4.1.2. The 1st unbundling
The steam revolution shifts the two price lines toward each other (dashed red lines in Figure 9) by lower . This widens the first and third partitions at the expense of the second. Some of the nations, like Germany, become export-competitive.11 Others, like India, now find themselves in the poverty trap.
For the winners, like Germany, the extra demand for competencies generated by export sales boosted demand for and thus supply of competencies. The opposite happened to India. This was the beginning of the big divergence (see Krugman and Venables 1995 for the static economic geography version; Baldwin, Martin and Ottaviano 2001 for a formal growth model of take-off and divergence).
4.1.3. Big Push, failed ISI, outward orientation, Dutch Disease, etc. Trade policy’s role in traditional development thinking jumps right out of the diagram. Getting from the first partition to the second requires i) investment in competencies starting without demand, ii) demand without any local capacity to satisfy it, or iii) coordinated appearance of the two. Getting past this was the focus of so-called Big Push development strategies. When the world was like this, import-substitution industrialisation could make
11 Irwin (2003), for example, notes that the US became a net exporter of manufactures in 1910.
sense. Indeed, in the 1960s and 1970s, it often worked for light industries. Colonialism (captive markets), and the 1960s push for South-South free trade agreements can be seen as trying to boost domestic market size for nations in the middle partition.
First generation Big-Push-ISI theorists wrongly assumed that moving from the first partition to the second would launch a self-sustaining dynamo of rising output and accumulating competencies that would eventually lead to the third partition (export competitiveness). Revelation of this fallacy accounted for much of the dissatisfaction with the theory. Second generation theorists turned their focus to the second bifurcation (transition from second to third partition).
Getting over the second bifurcation required a second big-push that involves: i) exporting at a loss initially, ii) investment in competencies for which there is not yet any demand, or iii) the coordination appearance of export demand and extra competencies.12 The Korean and Malaysian auto experiences – as well as many others – embodied efforts to select option iii).
The diagram is useful for organising thinking on many development chestnuts. The Dutch Disease can be seen here. The marginal cost curve depends upon local wages. For nations in the second partition (modern, but uncompetitive industry), the non-industrial sector will typically set the reservation wage and this, plus some industrial premium, determines the modern-sector wage. A boom in commodity prices, or improved productivity in the non-industrial sector would raise the industrial marginal cost curve and thus harm the competitiveness of the national industry for any given range of competencies. Depending upon the nation’s initial position and shock size, the nation may de-industrialise (shift into partition one from two, or two from three).
Big exchange rate devaluations are like the Dutch Disease in reverse and thus can potentially shift a nation from partition one to two, or two to three. Of course, it need not work this way. If the nation’s initial comparative advantage is poor (it is far from the second bifurcation), the devaluation may only produce a transitory boost in sales but no permanent increase in industrial competency.
5. TRADE, INDUSTRIALISATION & THE 2ND UNBUNDLING
To think carefully about things like Malaysia’s versus Thailand’s autos policies, we need to get away from the black box view of industry – the 20th century view that a nation’s output is made only with its own factors employing its own technology. We introduce the framework assuming 2nd unbundling has not yet happened.
5.1. Industry with a supply chain The key assumptions of the expanded framework are:
Production of the final good requires intermediate inputs (parts); The parts range from simple to highly sophisticated – the more sophisticated ones are
more intensive in their use of competencies; To reflect developing nation realities, Home is least competitive in the most
sophisticated parts.
More sophisticated parts are more expensive for Home (the developing nation) to make
12 Of course, the steady state range of competencies will be the collective outcome of investment decisions, so for some nations, the multiple equilibrium analysis is not relevant – their cost of creating competencies is so high that even with the whole world as their market, the steady state would be in the first partition.
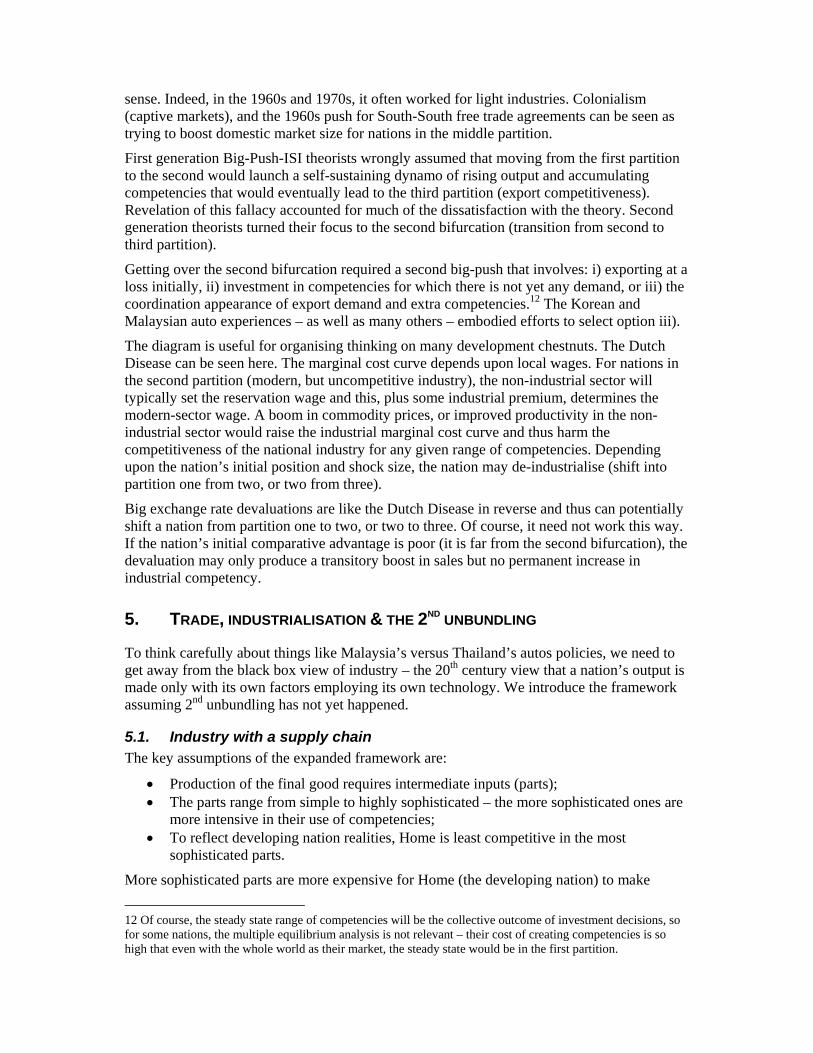
(Figure 10). A judicious choice of units let us compare marginal costs and prices across intermediates.13
Trade in parts is costly; in addition to transportation and tariffs, coordination costs are added when parts and final goods are manufactured in different nations.
Figure 10: A simple supply chain.
Intermediate ordered by sophistication
Imported
pyw/(’’Ty
*’)
Pyw’’Ty’
Locally produced; exported & local sales
Locally produced; local sales only
MC intermediates [n]
pyw/(T*
y)
pywTy
Source: Author’s elaboration.
These costs add a new wedge, (a mnemonic for coordination), to the separation of the two price lines – the domestic price (top) and net export price (bottom).
The range of competencies – denoted by ‘n’ (competencies range from zero to n) – is embedded in the position of the marginal cost curve for intermediates (MC Intermediates in the diagram).
A nation with a wider range of competencies would, all else equal, have a lower MC Intermediates curve.
Observe that final good production is pushed into the background to focus on the supply chain.
Figure 10 is drawn assuming that the final good is produced in Home (without downstream production there would be no demand for Home intermediates and thus no production or importation of intermediates). Although it does not appear directly, the chicken-and the-egg lumpiness of industry is still here. If Home does not produce a sufficiently broad array of intermediates, it will not be competitive in the downstream good.
Given prices, the nation produces all parts up to a threshold level of sophistication (left partition of the x-axis); it imports the rest (right partition).
13 For example if intermediate good number 1 has a price of $1 per kilogram, and good 12 has a price of $1000 per kilogram, we measure 1 in kilos and 12 in grams, so both have a price of $1. This makes marginal costs comparable across intermediates.

ICT costs are high to start with, so no parts are exported.
Where are our three cases from Figure 9? For example, suppose Home protects the downstream industry in order to create a demand for upstream intermediates, hoping that their supply would be forthcoming. If this works, the nation gets modern industry, which here means downstream production and production of some intermediates but no exports.
The third possibility is that the domestic market is so small that nothing works. Protection of the downstream goods creates no modern production of parts or final goods (poverty trap). Such a situation is depicted in Figure 11; Home’s marginal cost of producing intermediates is everywhere above the import price; there is no modern production downstream or upstream.
Figure 11: A simple supply chain: Poverty trap case
Intermediate ordered by sophistication
$
pyw/(T*
y)
pywTy
Imported intermediates
MC intermediates [n = 0]
Source: Author’s elaboration.
5.2. 2nd unbundling without multinationals
Now the ICT revolution happens and this brings down coordination costs, . How does this change the diagram? To answer this, we have to address the role of multinationals.
Multinational corporations have been thoroughly involved in the internationalisation of supply chains, often playing a dominant role. However, before considering the implications of multinationals’ involvement, it is instructive to think about a ‘pure’ 2nd unbundling – one without MNCs. This allows us to motivate the rather obvious observation that the 2nd unbundling makes industry less ‘lumpy’ and thus makes industrialisation easier and quicker, even without multinationals. This distinction also helps separate out two very different implications of the ICT revolution. It facilitates geographical separation of production stages, and it heightens the rewards to and need for combining advance-nations’ technology with cheap labour abroad.
Starting from the Figure 10 case (only domestic sales), we lower so the price lines get closer together as shown (just as falling transport costs narrow the gap Figure 9). The new, dashed price-lines now partition the range of intermediates into three segments.
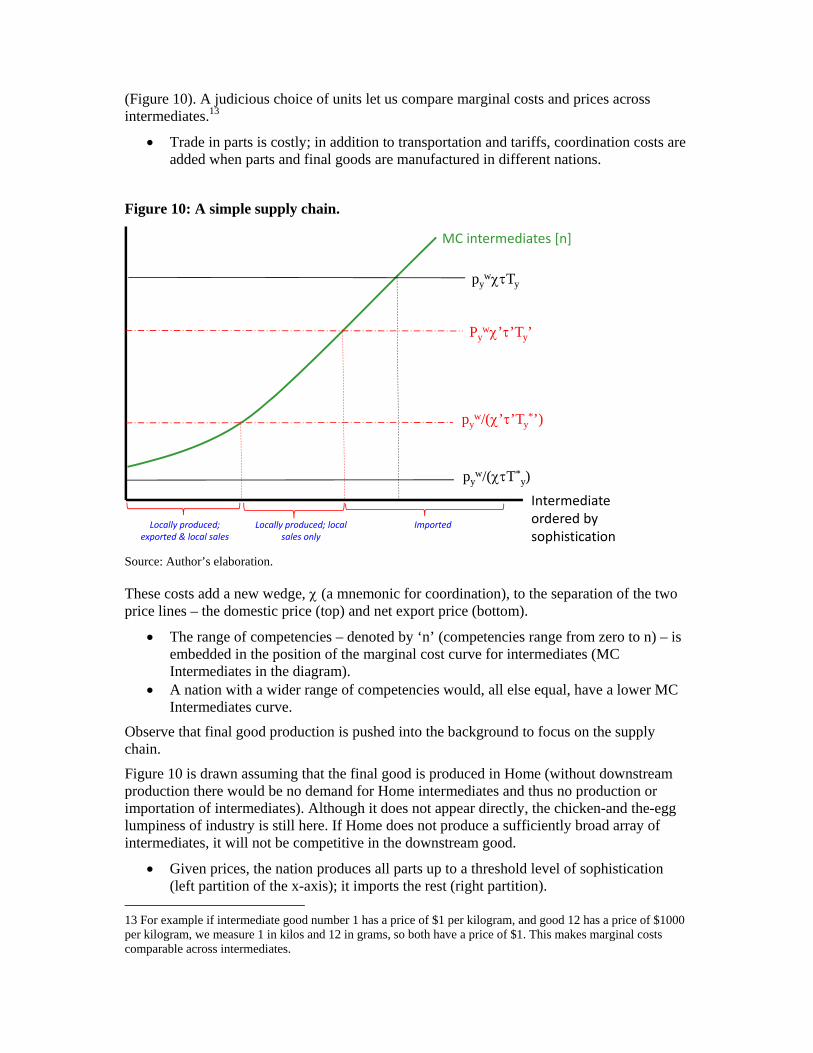
The rightmost segment represents the intermediates Home imports (Home marginal cost is above the import price).
The middle segment defines the intermediates Home produces but does not export (Home marginal cost is low enough to beat imports but not low enough to be competitive abroad).
The leftmost segment is new. It depicts a range of intermediates where Home is now competitive in world markets.
We immediately see two first-order effects of the ICT revolution: 1) the range of intermediates produced at Home shrinks, and 2) trade in intermediates rises – both imports and exports (as in Figure 6 and Figure 8).
The first effect stems from the fact that at the high end of the range, imports displace domestic production of intermediates. While bad news for any specific factors involved in the newly uncompetitive intermediates, this is good news for downstream competitiveness. Since the imports are cheaper (that’s why they are imported), competitiveness of the final-good downstream sector is improved. More local downstream production is good news for intermediate producers in the middle segment. The second effect stems from the way that lower coordination costs allow Home to export the parts where it has the greatest comparative advantage (leftmost segment).
5.2.1. Informal dynamics: Existing industry case We can use this framework to think about the impact of the second unbundling on a nation, say Korea, which had a broad and deep industrial base before the second unbundling. As far as total demand for competencies, there are two positive and one negative effect. The negative channel is the displacement of locally produced high-end intermediates with imports. The positive channel is the extra production of low-end parts for export, and the improved competitiveness of the downstream product which may promote additional domestic and/or export sales.
Figure 12: Moving up the value chain: Geese in formation.
Intermediate ordered by sophistication
$
Imported intermediates
pyw/(’’Ty
*’)
Pyw’’Ty’
Locally produced intermediates; exported & local sales only
Locally produced intermediates; local sales only
MC intermediates [n]
MC intermediates [n’]
Source: Author’s elaboration.
If the overall effect is positive and large enough, overall demand for competencies will rise – basically due to the new demand arising from the newly export-competitive intermediates,
but also possibly from the extra final-good exports caused by the lower cost of intermediates.14 As usual, this will induce fresh investment in competencies. The knock-on effect of expanding the competency range will be a lowering of the MC Intermediates curve as shown in Figure 12. This in turn induces what could be called “moving up the value chain”. Both thresholds – the one for domestic production and the one for exporting – shift to the right implying that the nation exports more sophisticated goods. This would create something like the famous ‘flying geese’ development pattern.15
Notice that something like New Economic Geography’s cost-linked circular causality, i.e. cluster economics – is going on here. The new exports create a demand and thus supply of competencies that lower the nation’s marginal cost and thus lead to a second round of new exports which in turn create new demand/supply of competencies. The process eventually arrives as a steady state as ‘n’ stops rising and the thresholds stabilise. In the meantime, however, it would look like export-led growth involving an above-normal rate of savings/investment and a rapid expansion of production and employment in industry. Moreover, the nation would be expanding the range of products it exports.
The framework can also be used to think about development of a nation that initially has no domestic production of the final good – say, the Philippines in autos. In this case, there is no local demand for intermediates and the top price line in Figure 12is irrelevant (as is the corresponding threshold). After the second unbundling, the nation starts to export industrial goods but only intermediates (those in the leftmost segment). The cost-linked circular causality starts as before and the nation “moves up the value chain”, exporting increasingly sophisticated parts as its range of competencies widens.
5.3. Multinationals and the 2nd unbundling A critical aspect of global value chains is the cross-border application of advanced know-how (product and process technologies, finance, management, marketing, design, etc.). There is a good reason for this. As manufacturers from advanced economies seek to produce certain parts, or complete certain manufacturing stages more cheaply, they move production facilities abroad. However the output of these new factories must continue to mesh seamlessly with the continually evolving production processes located in other nations. The factories are thus often owned, controlled, or in long-term relations with the parent company. What’s more, combing high technology and low wages is profitable – or at least very cost effective and essential to maintaining competitiveness if everyone else is doing it.
This suggests that the analysis so far missed a critical element of the 2nd unbundling – the application of firm-specific, advanced-nation technology in developing nation factories. This has important implications for the connections between trade and industrialisation – the sort of thing that explains how Thailand or Vietnam could so rapidly expand its exports of vehicles and parts.
To study these new implications, we modify the workhorse diagram to allow for very specific forms of cross-border movement of technology. We do not use the standard moniker – technology transfer – since it is entirely inadequate to today’s realities in at least two ways. First, the internationalisation of supply chains involves cross-border applications of very specific slices of the parent company’s know-how. This is not the diffusion of a broad range of productivity enhancing techniques that is typically assumed in a growth model. A Japanese
14 Technically, the opening shifts the production mix towards a less competency intensive range of intermediates, so a simple rise in total production may not raise overall demand for competencies.
15 The original ideas are in Akamatsu (1962); the model in Kojima (2000).
auto maker, for example, might help a Philippine company learn to sew leather seats onto a frame made in Japan, so they can sell Lexus’s for less. There would be little or no Filipino learning, however, about the design and construction of the frame and its electronics. Second, if the company can manage it, there will be no transfer of technology at all. Corporations take great care to reduce the dissemination of know-how to the local economy.
As such, this cross-border deployment of technology should be thought of more as ‘technology lending’. If the multinational decides to switch the production of the particular part from, say China to Vietnam, the producer in China may not be able to continue producing the same part.
To capture these aspects in the framework, we start from a situation where the developing nation is not making the downstream product (say, cars). We begin, in other words, from the Figure 11 situation where there is no intermediates production initially. From this initial condition, the multinational ‘lends’ a narrow range of technology to a producer located in the developing nation with the aim of getting the offshoring part produced at the lowest possible cost for the requisite quality. An example would be Nokia teaching a Malaysian firm to produce and fasten the plastic screen cover to one of its handsets.
In the diagram, this shows up as downward jump in Home’s marginal costs but only for the particular part that is offshored. This is illustrated in Figure 13. The key is that with the help of the technology-lending, Home switches from a zero-indigenous-industry situation to being a globally competitive exporter of a particular part.
Two implications follow immediately from the case at hand.
First, industry can appear extremely quickly.
There is no need for the time-consuming nurturing of an industrial base and investment in a broad range of technical competencies. The multinational arrives and production starts in little more than the time it takes to build the factory.
Second, this industrialisation process bears very little resemblance to the successful import substitution policies followed by, say, the US, or even Korea and Taiwan.
This industrialisation looks like a big success from the perspective of exporting. After all, the nation is now exporting what shows up as advanced industry goods in the trade statistics. If the analyst is still viewing the world with 20th century industrialisation theory in mind, this is a very good sign. By the time Korea and Taiwan got to the stage of exporting such things, they were firmly on the road to being rich nations; they had definitively left underdevelopment behind. However from the perspective of 21st century trade and industry, exporting a good tells us much less about the exporting nation’s capacities. There may be only one factory in the whole country that resembles modern industry. This is sometimes call enclave industrialisation.
The preceding example is akin to the ‘trade in tasks’ discussed by Grossman and Rossi-Hansberg (2008). The offshoring involves no two-way trade in goods. While such forms of production sharing do exist, they are not the only kind. In many industries, so-called vertical specialisation trade is prevalent. This is where the developing nation imports sophisticated parts, adds some value, and re-exports the output. This is also called outward processing trade. We can easily capture this type of trade by re-interpreting Figure 13.
The diagram focuses on the intermediates; the downstream good is in the background. To capture outward processing trade, we assume that the downstream good (typically a component rather than a final consumer good) is being produced in the developing nation under consideration (in this case an intermediate good itself rather than a final good.

Figure 13: A supply chain with multinationals and ‘technology lending’.
Intermediate ordered by sophistication
$
pyw/(’’Ty
*’)
Pyw’’Ty’
Locally produced; exports only
MC intermediates [no], with technology ‘lending’
Source: Author’s elaboration.
As a consequence, production of the downstream good requires the full range of intermediates arranged along the horizontal axes of Figure 13. Home production is competitive only in a narrow range of intermediates – the range where technology lending occurred. All other intermediates are imported.
In this case, the industrialisation becomes associated with the rapid emergence of both imports and exports of parts. All this would be associated with long-term foreign involvement with the newly created industry. Here the story has been told in a way that makes it look very much like the sort of industry that grew rapidly in export-processing zones in the 1990s.
5.4. How the second unbundling killed import substitution Before moving to policy issues, it is worth pointing out that the demise of 20th century industrialisation strategies may have been caused by 2nd-unbundling industrialisation. Or as mentioned before, offshoring may have killed import substitution.
We start by noting that import substitution seems to have disappeared as a viable development strategy at approximately the same time as the 2nd unbundling got going in manufacturing. For example, countries in East Asia followed dual-track industrialisation strategies since the 1970s. On one hand, they pursued import substitution in an effort to create industries via import protection. On the other hand, they encouraged export platforms that employed their workers to produce goods (usually components) for export – often employed directly or indirectly by multinationals.
As the 1980s and 1990s proceeded, the classic import substitution track failed increasingly while the export-oriented track increasingly succeeded. Eventually, many of these nations embraced policies that turned their whole country into what can be thought of as one great big export processing zone.
An unintended result of all this offshore-friendly policy was that it boosted the
competitiveness of advanced-nation manufacturing firms. Before offshoring, expensive Japanese labour had to be used for almost all aspects of making Toyotas. High labour costs partly offset Japan’s technology edge. This helped, for example, Proton compete with Japanese cars in the Malaysia market.
By allowing, say, Toyota, to combine its high-technology with cheap East Asian labour, offshoring enhanced Toyota’s cost edge over Proton. The key point is that offshoring does not allow Proton to borrow Japan’s technology; it only allows Toyota to borrow developing nations’ low-wage labour.
Note the important distinction here between the competitiveness of advanced-nation manufacturing firms and competitiveness of advanced-nation industry workers. The offshoring allows the combination of advanced-nation technology with developing nation labour. This clearly makes the offshoring company’s products more competitive, but it tells us nothing directly about how it changes incentives to create jobs in the advanced nation.
6. WHY DOES IT MATTER?
The Lindauer-Prichett first two generations of ‘high development theory’ disagreed on how best to overcome the chicken-and-egg lumpiness of 20th century industry. They share, however, the goal of building the whole domestic supply chain.16 What Lindauer and Prichett (2002) call third generation theories stress diversity, but they continue to use a 20th century view of trade and industry.17 There are at least two issues that arise when the third-generation development models ignore the supply chain.
Misinterpretation of the data, and Inattention to certain policy questions.
6.1. Misinterpreting the data Using a 20th century view of industry to interpret 21st century data can lead to incorrect inferences. The 20th century view is that a nation’s exports embody the nation’s technology, labour, capital, etc. – the inclusion of foreign factors or technology is a second order issue. As such, a nation’s exports tell us something about that nation’s technology, labour, capital, etc. This approach fails, however, for products and nations where international supply chains are important. Product characteristics may tell us something about the embodied factors and technology, but very little about the nationality of those factors and technologies. To take a well-known example, China’s Ipod exports tell us more about the US industry than it does about Chinese industry. The factor and technology content of a nation’s exports will depend upon the nation’s position in the international supply chain as well as upon its own supply of factors and technology.
The same problem becomes more severe when the considering periods, countries, and 16 The simple framework skipped over all the bread-and-butter of development advice that Laudauer and Pritchett (2007) say define the first and second generation – things like, the role of governments, capital accumulation, trade, etc. This omission is not meant to suggest that these are unimportant – they are important. The omission was intended to illustrate common foundations of traditional thinking on industrialisation, and to show that this thinking is rooted in 19th and 20th century experiences where supply chains could only be internationalised to a limited extent and then only between advanced nations like the US and Canada, or Germany and France.
17 See for example, Hausmann, Hwang and Rodrik (2007), Hausmann, and Klinger (2007), Lederman and Maloney (2007), Klinger and Lederman (2007), Brambilla, Ledermann and Porto (2010) which stress the importance of the composition of a nation’s export portfolio.
producers where the 2nd unbundling has advanced rapidly. As we saw in Table 1, the local content of industrial output shifted massively from 1985 to 2000.
To make the point more precisely, consider the widely cited Hausmann, Hwang and Rodrik (2007) model (HHR henceforth). The message-in-the model is that nations should search for their own nation-specific comparative advantage and modify this comparative advantage by shifting into more sophisticated goods. The 20th century concept of industry is baked into their model when they assume industry can be modelled as a black box linking national factors and technology to national output; the nation’s production contains only its own productive factors and technology. Nothing like Thailand’s export of pickup trucks and engine parts, or China’s processing trade is possible.
When they get to empirics, they use the 20th century view of industry to link country characteristics to goods; exports of poor nations must be technology-poor in the sense of being products where a nation’s labour is especially low. From the perspective of 21st century trade, these deductions make little sense. For example, Thailand’s car exports tell us more about Japanese technology than they do about Thai technology.
With our simple framework in mind, we can immediately see a problem with this. The good exported may embody a large amount of foreign-nation factors and technology, so the product-country link is tenuous. In the Figure 13 case of ‘technology lending’, the product-country link may be entirely spurious as the developing nation is using advance-nation technology even in the segment of the value chain it has.
The growth implications could also be misinterpreted. We suppose a particular camera is made in Japan and thus associated with a high measured productivity – what HHR call PRODY. Then Sony offshores assembly to China. However suppose that in contrast to the HHR model, the productivity of Chinese assembly workers is the same in cameras, cotton shirts, or anything else. In this world, we might see an association between China’s exports of things Japan used to export and Chinese growth, but it would have nothing to do with the HHR message-in-the-model. The creation of any assembly job raises Chinese output since labour productivity in assembly exceeds labour productivity in agriculture. Thus we would see an association between a rise in China’s export sophistication index and its growth, but it has nothing to do with the sophistication of its export mix. If HHR are right, nations might want to target the production of high-tech goods. If the alternative view is right, all that matters is getting more assembly jobs.
6.2. Different policy questions High development theory generally ignores or skips over the changed nature of industrialisation. For example, Rodrik (2011a) argues that: “continued rapid growth in the developing world will require pro-active policies that foster structural transformation and spawn new industries - the kind of policies that today's advanced economies employed themselves on the way to becoming rich.” This, of course, assumes that building a supply chain – which is what advanced economies did – is the same as joining a supply chain – which is the only option facing more developing nations today.
The lack of focus on supply chains may also miss policy issues raised by the new path to industrialisation. There are really two sets of questions. The first concerns issues facing nations that are trying to join a supply chain. The second concern issues facing nations – like Korea – who industrialised in the old fashioned way and now are facing a ‘hollowing out’ of their industry.
6.2.1. New industrialisers
A taste of the sort of new policy issues that arise can be had by considering an example. As Humphrey and Schmitz (2002) write, the Sinos Valley in southern Brazil had a cluster of small shoe manufacturers in the 1960s producing for the domestic market. In the 1980s, buyers from the US arrived and integrated Brazilian firms into the US footwear value chain.
This facilitated upgrading as the “US buyers studied the market, developed models and product specifications, helped producers in the choice of technology, and organisation of production, inspected quality on site, and organised transport and payment.” Process and product quality rose. The author notes: “the danger of this strategy became evident when Chinese producers undercut Brazilian products in the US market in the early 1990s, and Brazilian producers were faced with sharply declining prices.”
The largest local firms upgraded in terms of production process but not in terms of design and marketing. Local business associations promulgated plans for raising the image of Brazil’s footwear and reinforcing design capabilities, but these came to nought. Should the Brazilian government have been active in encouraging a diversification of buyers, or an upgrading to more niche products, or encouraged firms to do more design and marketing in Brazil?
This touches on a whole set of issues concerning the most appropriate complementary policies. Once new industrial jobs start appearing, what should be done to ensure raising productivity and sustainability of the production? Should a government activity diversify the nationality of the supply chains its workers are joining? What sort of implications does this sort of fast-and-easy industrialisation have for education and training policies? Should foreign language skills be emphasised more? If so, which languages? Is the encouragement of labour unions a good idea for the development strategy?
Of course, these questions are not entirely new – they are related to the localisation struggle of ISI polices in the 1970s and early 1980s. However, as the Thai versus Malay auto sector experiences show, thinking about localisation policies without putting global value chains at the heart of the economic logic can lead to some very misguided policies. Today’s nations might do better to look at Thailand starting from the late 1980s, rather than Korea and Taiwan.
Another example concerns the contrast between Thailand’s and the Philippine’s joining “strategies”. Thailand has very successfully attracted a great deal of industry activity in the automobile sector. The Philippines, by contrast, engages in outward processing production in a wide range of products and few final vehicles. How should we evaluate these outcomes and the policy choices that fostered them? What should we recommend to the next supply-chain joiner, say Vietnam or Cambodia?
Some nations, such as China, have explicit policies of encouraging the replacement of imported intermediates with local production. They also actively encourage local manufacturers to imitate foreign producers who are selling to the local market. This is plainly a twist on the old import-substitution policies, and it seems to be working. But is it the right policy? Should other developing nations try to emulate them, or is it only working because of China’s enormous internal market?
Consider the Figure 13 example where the developing nation gets a narrow slice of intermediate production. Should its policy makers try to expand this range? If yes, should they try to fill in below (produce less sophisticated products), or try to build up (produce more sophisticated products)?
Issues of geography are clearly more important for joining a supply chain, but they are not
well understood - in part because high-level development theory ignores supply chains. One hypothesis is that geography matters because 21st century trade – the trade-investment-services nexus – requires technicians and managers to travel among production facilities. While the price of air tickets has fall, the opportunity cost of time has not. This is probably why supply chains are regionalised rather than globalised: Factory Asia, Factory North America, and Factory Europe, for example.
These considerations give rise to additional sets of policy concerns. As geography seems to be so important, it would seem critical to distinguish between policies that might work in the neighbourhood of an existing supply chain and policies that might be needed in faraway nations. Surely, we should develop a different set of policy advice for, say, Vietnam, and, say, South Africa, or Argentina.
A much larger question concerns the ultimate destination of offshoring-led industrialisation. Right now, the world seems divided into headquarter economies and factory economies (Baldwin 2006a). The factory economies have lots of industry and rapidly growing exports of manufactured goods, but how to they ensure their place in the supply chain is not supplanted by the next low-wage country to get its governance problems under control? Ultimately, how do factory economies become headquarter economies?
6.2.2. “Newly industrialised nations”
The development nations that industrialised before the second unbundling (e.g. Korea, Taiwan, and India, South Africa and Brazil to a certain extent) face a very different set of policy challenges. Should they encourage their industrial companies to join the supply chains of US and Japanese companies? Should they encourage their manufacturing firms from offshoring certain segments of the production, or encourage it? If so, which segments? Should their governments institute complimentary policies that help their firms continue up the value chain? Should they try to prevent nations like China from moving up the value chain?
7. CONCLUDING REMARKS
Some nations got rich without industrialising – but not many. This is why ‘high development theory’ – as Paul Krugman calls it – focuses on industrial development and trade’s roles in fostering it. Recent empirical explorations led by Dani Rodrik continue to find evidence that manufacturing is different. The current generation of high-development thinking, however, eschews big ideas since yesteryear’s big ideas fail to account for the facts. Some nations are booming while others are stagnating, but there seems to be little correlation between outcomes and the old Big Ideas (ISI), or their replacement (Washington Consensus).
One part of the weak correlation might be due to the revolutionary transformation of industry and trade that occurred from 1985 to the late-1990s but which has not been completely incorporated into development theory. Starting in 1985, with an important acceleration in the late 1990s, most successful developing-nation industrialisers joined the supply chains of rich-nation firms. As mentioned in the introduction:
Joining a supply chain made industrialisation radically less complex and radically faster because supply-chain industry is less lumpy and less interconnected domestically.
The ICT revolution lowered the cost of coordinating complex activities at distance and this made the geographical dispersion of supply chains feasible and profitable. Rich-nation firms
offshored segments of their value chains to developing nations. As the output had to mesh seamlessly with continually evolving production processes in other nations, the multinational typically deployed its firm-specific technology in the foreign factory – especially since this combination of rich-nation technology and low-wage labour could be very profitable.
This ‘technology lending’ – which is very different from the ‘technology transfer’ of old ISI theory – could revolutionise the output of a developing nation’s industry almost overnight. Offshored factories arrived with everything needed. Much of this was regional as key personnel still had to travel among factories. Oversimplifying to make the point, all the developing nation had to do was be located near a supply chain, provide reliable workers, and establish a hospitable business environment.
But easier and faster does not necessarily mean better. As mentioned in the introduction:
The 2nd unbundling made industrialisation less meaningful.
Before the 2nd unbundling, a nation had to have a deep and wide industrial base before it could export, e.g. car engines. Exporting engines was a sign of victory. Now it is a sign that the nation is located along a particular segment of an international value chain.
I am not sure that a full understanding of the 2nd unbundling’s development implications will eventually lead to new Big Ideas. I am sure, however, that ignoring such implications will guarantee continuing puzzlement. Global supply chains are now a fixed point in the typology of developing-nation industrial planners; no winning industrialisation effort in the past 20 years has been able to ignore them. The goal of this paper is to make the prima facie argument that incorporation of such considerations into development theory may yield important insights.
REFERENCES
Akamatsu, Kaname (1961). “A Theory of Unbalanced Growth in the World Economy”. Weltwirtschaftliches Archiv, no.86, pp.196-217.
Akamatsu, Kaname (1962). “A Historical Pattern of Economic Growth in Developing Countries”, The Developing Economies, Tokyo, Preliminary Issue No.1, pp.3-25.
Amsden, Alice (2001). The rise of the rest: Challenges to the West from late-industrialising nations, Oxford University Press, Oxford.
Amsden, Alice H. (1989) Asia's Next Giant: South Korea and Late Industrialization. New York: Oxford University Press.
Amsden, Alice H., and Linsu Kim (1989) “A Comparative Analysis of Local and Transnational Corporations in the Korean Automobile Industry.” Management Behind Industrialization: Readings in Korean Business eds. Dong-Ki Kim and Linsu Kim. Seoul: Korea University Press, 579-96.
Balassa, Bela (1981). “The process of industrial development and alternative development strategies”, Graham Lecture, Essays in International Finance No. 141, Princeton University.
Balassa, Bela (1981). The newly industrialising countries in the world economy, Pergamon Press, New York.
Balassa, Bela (1982). Development strategies in semi-industrial economies, World Bank, Washington.
Baldwin, Richard (2006a). “Globalisation: the great unbundling(s),” Chapter 1, in Globalisation challenges for Europe, Secretariat of the Economic Council, Finnish Prime Minister’s Office, Helsinki, 2006; ISBN 952-5631-15-X.
Baldwin, Richard (2006b). "Managing the Noodle Bowl: The Fragility of East Asian Regionalism," CEPR DP 5561; published in Singapore Economic Review, 53, 3, 449-478. 2008.
Baldwin, Richard (2011). “21st Century Regionalism: Filling the gap between 21st century trade and 20th century trade rules”, CEPR Policy Insight No. 56.
Baldwin, Richard and Frederic Robert-Nicoud (2007). “Offshoring: General equilibrium effects on wages, production and trade”, NBER Working Paper 12991.
Baldwin, Richard and Frédéric Robert-Nicoud (2010). "Trade-in-goods and trade-in-tasks: An Integrating Framework," NBER Working Papers 15882.
Baldwin, Richard, Philippe Martin, and Gianmarco Ottaviano (2001). " Global Income Divergence, Trade, and Industrialization: The Geography of Growth Take-Offs," Journal of Economic Growth, pages 5-37, March.
Birdsall, Nancy, Augusto de la Torre, and Felipe Valencia Caicedo (2010). “The Washington Consensus: Assessing a Damaged Brand”, Working Paper 213, Center for Global Development, Washington.
Blinder, A. S., (2006). Offshoring: The Next Industrial Revolution? Foreign Affairs 85(2), 113-128.
Blinder, Alan (2009). “How Many U.S. Jobs Might Be Offshorable,” World Economy, vol. 10(2), pages 41-78, April.
Brambilla, Irene, Daniel Lederman, and Guido Porto (2010). "Exports, Export Destinations, and Skills," NBER Working Papers 15995.
Clemens, Michael and Jeffrey Williamson (2004). "Why did the Tariff--Growth Correlation Change after 1950?," Journal of Economic Growth, vol. 9(1), pages 5-46.
Deardorff, A. V. (1998a). Fragmentation in Simple Trade Models, RSIE Discussion Paper 422, University of Michigan, January 8, 1998. www.spp.umich.edu/rsie/workingpapers/wp.html
Deardorff, A. V. (1998b). Fragmentation across cones, RSIE Discussion Paper 427, Discussion Paper No. 427, August 7, 1998. www.spp.umich.edu/rsie/workingpapers/wp.html
ESCAP (2002). Development of the automotive sector in selected countries of the ESCAP region: Proceedings and country papers presented at the Regional Consultative Meeting on Promotion of Intraregional Trade and Economic Cooperation in the Automotive Sector, United Nations. Economic and Social Commission for Asia and the Pacific, 2002.
Feenstra, Robert and Gordon Hanson (1997). "Foreign direct investment and relative wages: Evidence from Mexico's maquiladoras," Journal of International Economics, Elsevier, vol. 42(3-4), pages 371-393, May.
Fuangkajonsak, Wanrawee (2006). Industrial policy options for developing countries: The case of the automotive sector in Thailand & Malaysia”, Fletcher MA, March
Fujita, Maa (1998). 'Industrial Policies and Trade Liberalization ? The Automotive Industry in Thailand and Malaysia' in Keiji Omura (ed.) The Deepening Economic Interndependence in the APEC Region, APEC Study Center, Institute of Developing Economies, 1998.
Green, Andrew (1992). “South Korea's Automobile Industry: Development and Prospects”, Asian Survey, Vol. 32, No. 5.
Grossman, G. and E. Rossi-Hansberg (2006). The Rise of Offshoring: It’s Not Wine for Cloth Anymore, July 2006. Paper presented at Kansas Fed’s Jackson Hole conference for Central Bankers. http://www.kc.frb.org/
Grossman, G. and E. Rossi-Hansberg (2008). “Trading Tasks: A Simple Theory of Offshoring,” American Economic Review.
Grossman, Gene and Esteban Rossi-Hansberg (2008). "Trading Tasks: A Simple Theory of Offshoring," American Economic Review, American Economic Association, vol. 98(5), pages 1978-97.
Hausmann R. and B. Klinger B. (2007). "The Structure of the Product Space and the Evolution of Comparative Advantage" April 2007, KSG working paper.
Hausmann, Ricardo, Jason Hwang, and Dani Rodrik (2007). "What you export matters," Journal of Economic Growth, vol. 12(1), pages 1-25.

Humphrey, John and Hubert Schmitz (2002). “How does insertion in global value chains affect upgrading in industrial clusters?” Institute of Development Studies, University of Sussex.is Trade Structure and Growth and it is
Inomata Satoshi and Yoko Uchida (2009). “Asia Beyond the Crisis -Visions from International Input-Output Analyses”, Spot Survey No.31, IDE-JETRO, December
Irwin, Douglas (2003). "Explaining America's Surge in Manufactured Exports, 1880-1913," The Review of Economics and Statistics, vol. 85(2), pages 364-376.
Irwin, Douglas A. (2003). “Explaining America's Surge in Manufactured Exports, 1880-1913”, The Review of Economics and Statistics, Vol. 85, No. 2 (May, 2003), pp. 364-376
Jones, R. W. and H. Kierzkowski (1990). The Role of Services in Production and International Trade: A Theoretical Framework, in R. Jones and A. Krueger (eds.), The Political Economy of International Trade, Oxford: Basil Blackwell.
Klier, Thomas and JamesRubenstein (2008). ”Who really made your car? ” Chicag-o Fed Letter, Number 255a.
Klinger, Bailey, Daniel Lederman (2006). "Innovation and export portfolios," Policy Research Working Paper Series 3983, The World Bank.
Kojima, Kiyoshi (2000). “The 'flying geese' model of Asian economic development: origin, theoretical extensions, and regional policy implications”, Journal of Asian Economics 11, pp.375-401.
Kojima, Kiyoshi (2003, 2005, 2006), Ganko-kei Keizai Hattenron [Flying-Geese-Style Economic Growth], vol. 1: Nihonkeizai, Aziakeizai, Sekai keizai [Japanese Economy, Asian Economy, World Economy]; vol. 2: Azia to Sekai no Shinchitsujo [Asia and World in a New Order]; and vol. 3: Kokusaikeizai to Kinyukiko [International Economy and Monetary System], Tokyo: Bunshindo.
Koopman, Robert, Zhi Wang, and Shang-Jin Wei (2008) “How Much of Chinese Exports is Really Made In China? Assessing Domestic Value-Added When Processing Trade is Pervasive” NBER Working Paper 14109.
Krugman, Paul (1992). “Toward a Counter Counter-Revolution in Development Theory'.' Proceedings of the World Bank Annual Conference on Development Economics, 15-38. New York: Oxford University Press.
Krugman, Paul R & Venables, Anthony (1995). "Globalization and the Inequality of Nations," The Quarterly Journal of Economics, MIT Press, vol. 110(4), pages 857-80, November.
Lederman, Daniel, and William Maloney (2007). "Trade structure and growth," Chapter 2 in Lederman, Daniel and William F. Maloney, editors, 2007, "Natural Resources: Neither Curse nor Destiny," Stanford University Press for the World Bank, Wash, DC.
Lindauer, David and Lant Pritchett (2002). “What's the Big Idea?: The Third Generation of Policies for Economic Growth”, Economía, Volume 3, Number 1, Fall, pp. 1-28.
Markusen, James (2006). Modeling the offshoring of white-collar services: from comparative advantage to the new theories of trade and fdi, in S. L. Brainard and S. Collins (eds.), Brookings Trade Forum 2005: Offshoring White-Collar Work, Washington: the Brookings Institution, 1-34.
Milberg, W. and D. Winkler (2010). “Trade Crisis and Recovery: Restructuring of Global Value Chains,” in G. Gereffi et al., editors, Global Value Chains in a Post-Crisis World: A Development Perspective, Washington: The World Bank.
Murphy, Kevin M., Andrei Shleifer, and Robert W. Vishny (1992). “The Transition to a Market Economy: Pitfalls of Partial Reform,” The Quarterly Journal of Economics, Vol. 107, No. 3. (Aug., 1992), pp. 889-906.
Pack, H. and Westphal, L. E. (1986). “Industrial Strategy and Technological Change: Theory versus Reality”, Journal of Development Economics 22 (1): 87-128.
Ravenhill, John (2005). FDI in the Korean auto industry”, Les Études de l’Ifri 3, January.
Richter, J. H. (1959). “Trends in International Trade: Review Article”, Quarterly Journal of Economics, Vol. 73, No. 4, pp. 576-595.

Rodriguez-Clare, Andres (1996). "The division of labor and economic development," Journal of Development Economics, Elsevier, vol. 49(1), pages 3-32, April.
Rodrik, Dani (1995). “Getting Interventions Right: How South Korea and Taiwan Grew”, Economic Policy, Vol. 10, No. 20 (April), pp. 53-107.
Rodrik, Dani (2008). One economics, many recipes: Globalization, institutions, and economic growth, Princeton University Press, Princeton.
Rodrik, Dani, Arvind Subramanian and Francesco Trebbi (2004). Institutions Rule: The Primacy of Institutions Over Geography and Integration in Economic Development.� Journal of Economic Growth. Vol. 9, No. 2. (June 2004), pp. 131-165.
Rodrik, Dani. 2005. “Growth Strategies”. in: Handbook of Economic Growth. Philippe Aghion and Steven N. Durlauf (eds.). Elsevier, Amsterdam.
Rosenstein-Rodan, Paul (1943), “Problems of Industrialization of Eastern and Southeastern Europe.” Economic Journal 53(210-211) June-September, 1943, 202-211.
Rosli (2006). “The automobile industry and performance of Malaysian auto production,” Journal of Economic Cooperation, 27, pp 89-114.
Spence Report (2008). The growth report: Strategies for sustained growth and inclusive development”, Commission on Growth and Development, World Bank.
Sturgeon, Timothy (1998). “The automotive industry in Vietnam: Prospects for development in a globalizing economy”, Appendix IV of the Industrial Competitiveness Review, Development Strategy Institute, Ministry of Planning and Investment, Vietnam, July.
Techakanont, Kriengkrai (2008). “The Evolution of Automotive Clusters and Global Production Network in Thailand”, Discussion Paper No. 0006, Thammasat University, March.
Uzir Mahidin, Mohd, and R. Kanageswary (2004). “The development of the automobile industry and the road ahead”, Department of Statistics Malaysia.
Wad, Peter and V.G.R. Chandran Govindaraju (2011). “Automotive industry in Malaysia: an assessment of its development”, International Journal of Automotive Technology and Management, Vol. 11, No. 2.
Wad, Robert (2009). “The automobile industry of Southeast Asia: Malaysia and Thailand”, Journal of the Asia Pacific Economy, Vol. 14, No. 2, May 2009, 172–193
Venables, A. J. (1999). Fragmentation and multinational production, European Economic Review 43, 935-945.
World Bank (1993). The East Asian Miracle, World Bank, Washington.
Rodrik, Dani (2011a).”Unconditional convergence”, CEPR Discussion Paper No. 8631, London, November
Rodrik, Dani (2011b).”The future of convergence”, NBER WP No. 17400, Cambridge US, November