Embed Size (px)
Citation preview

TRADE POLICY AND SUSTAINABLE DEVELOPMENT MEETING
Geneva, 6 -- 8 October 2015
TRADE AND TRADE POLICY, GLOBAL VALUE CHAINS AND REGIONAL INTEGRATION IN AFRICAN COUNTRIES
Session-2
M r. C h a rles A D J A S I University of Stellenbosch
Business School

TRADE AND TRADE POLICY, GLOBAL VALUE CHAINS AND REGIONAL INTEGRATION IN AFRICAN COUNTRIES
UNCTAD TRADE POLICY AND SUSTAINABLE DEVELOPMENT MEETING
6–8 OCTOBER 2015 ROOM XXIV, PALAIS DES NATIONS, GENEVA
University of Stellenbosch
Business School
Charles Adjasi.
1

Plan
• Trends in Trade and Performance of the Economy • Intra Regional Trade and Cross Border Trade • Challenges of Trade • Focus of Trade Policy for Africa • Cases of traditional and emerging regional trade in
Africa
2

Africa’s Trade • Africa has seen a rise in trade (albeit its marginal contribution
in world trade) • Growth in trade dipped in the 80-90s and since picked up • Largely uniform trend amongst RECs
-10
-5
0
5
10
15
20
25
30
1950 - 1960
1960 - 1970
1970 - 1980
1980 - 1990
1990 - 2000
2000 - 2010
2010 - 2014
Trade growth (Exports)
3
0
10
20
30
40
50
60
70
80
90
1963
1967
1971
1975
1979
1983
1987
1991
1995
1999
2003
2007
2011
Africa Trade Performance (1963-2011)
Exports ofgoods &services (% ofGDP)Trade (% ofGDP)

Trade Diversification
• Exports in Africa are still concentrated, although trends are changing • In terms of regional trends EAC more diversified, Least diversified is ECCAS
region
4
0
0.1
0.2
0.3
0.4
0.5
0.6
0.7
0.8
0.9
2004 2005 2006 2007 2008 2009 2010 2011 2012 2013
Eastern, Southern and South-EasternAsia
CEMAC (Economic and MonetaryCommunity of Central Africa)
COMESA (Common Market forEastern and Southern Africa)
EAC (East African Community)
ECCAS (Economic Community ofCentral African States)
ECOWAS (Economic Community ofWest African States)
SADC (Southern African DevelopmentCommunity)
UMA (Arab Maghreb Union)
WAEMU (West African Economic andMonetary Union)
Trade Concentration/Diversification

Economic Performance • Although export growth has been good and economic growth has picked up since the 90s but there are still strains on current accounts
Poverty rates have reduced but are still very high in most countries
5
-15
-10
-5
0
5
10
15
1963
1966
1969
1972
1975
1978
1981
1984
1987
1990
1993
1996
1999
2002
2005
2008
2011
Africa Trade and Economic Growth (1963-2011)
Exports of goodsand services(annual %growth)External balanceon goods andservices (% ofGDP)GDP growth(annual %)
0
10
20
30
40
50
60
70
80
ALG
BEN
BWA
BFA
CPV
EGY
ETH
GHA KE
NLS
OLB
RM
DG MLI
MAR SL
EZA
FTG
OTU
NU
GA
ZMB
Poverty rate-most recent at National Poverty Lines
Poverty rate
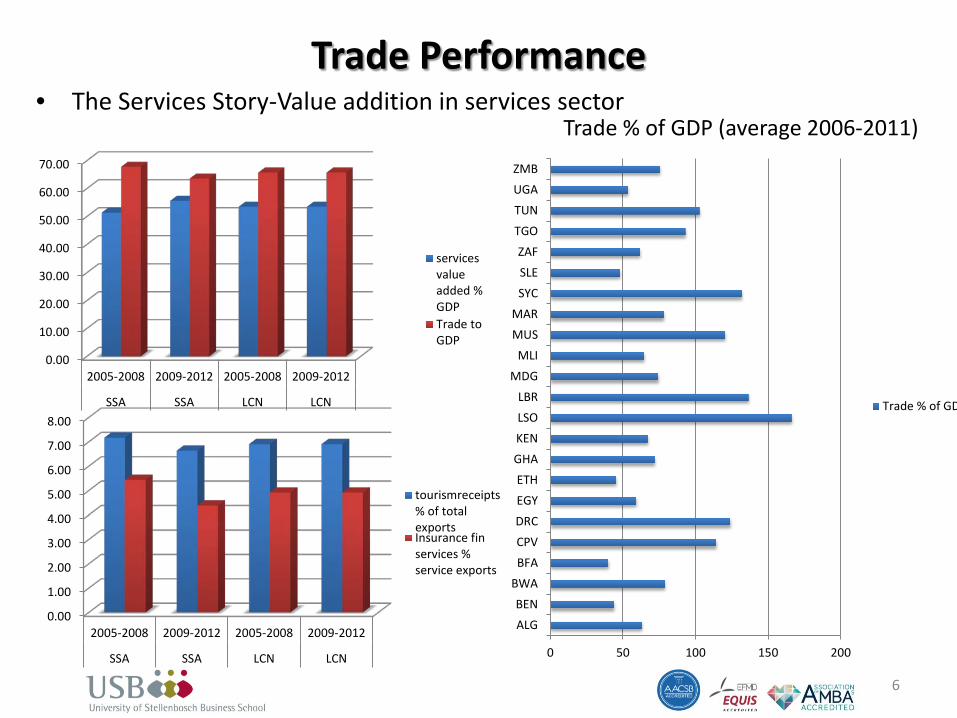
Trade Performance • The Services Story-Value addition in services sector
6
0 50 100 150 200
ALGBEN
BWABFACPVDRCEGYETH
GHAKENLSOLBR
MDGMLI
MUSMAR
SYCSLEZAF
TGOTUNUGAZMB
Trade % of GDP (average 2006-2011)
Trade % of GD
0.00
10.00
20.00
30.00
40.00
50.00
60.00
70.00
2005-2008 2009-2012 2005-2008 2009-2012
SSA SSA LCN LCN
servicesvalueadded %GDPTrade toGDP
0.00
1.00
2.00
3.00
4.00
5.00
6.00
7.00
8.00
2005-2008 2009-2012 2005-2008 2009-2012
SSA SSA LCN LCN
tourismreceipts% of totalexportsInsurance finservices %service exports

The Services-Growth nexus

Trade Policy
• Has largely been based on the following: – Eliminating/reducing procedural barriers to free
trade e.g., import licenses, export taxes, tariff and NTBs
– Avoiding import bans – Creating SEZs (EPZs) – Promoting intra-region trade via REC, CET (REC)
8

Trade tax and fiscal space A major challenge that remains is that of high trade taxes-tariff revenue is still a core component of government revenue
9
Country Export taxes % of tax revenue
ALG 0.03 BEN 0.14 BWA 0.01 DRC 1.32 EGY 0.22 ETH 7.22 GHA 1.53 LSO 1.17 LBR 0.76 MAR 0.76 ZAF 0.01 TGO 0.47 TUN 0.16 UGA 0.08
0 20 40 60 80
ALGBENBFA
BWACPVDRCEGYETH
GHAKENLBRLSO
MARMDG
MLIMUS
SLESYC
TGOTUNUGAZAF
ZMB
Trade Taxes % of revenue
Trade Taxes % ofrevenue

Intra Regional Trade
• Intra regional trade is growing but lags behind that of East and South Asia • Led mostly be EAC & SADC • Upward trend since late 2000s
0
10
20
30
40
50
60
2005 2006 2007 2008 2009 2010 2011 2012 2013 2014
Eastern, Southern and South-Eastern Asia
CEMAC
COMESA
EAC
ECCAS
ECOWAS
SADC
WAEMU
AMU (Arab Maghreb Union)
Africa
Intra Regional Trade
10

Intra Regional Trade • However-Complexity (spaghetti bowl problem) and associated trading
costs (uncoordinated policies, regulations etc)
11
• Recent developments-Tripartite Free Trade Area agreement COMESA, EAC and SADC, will help reduce this complexity and TC
• Prospects for CFTA
Source: Acharya et al. (2011)

Informal Cross Border Trade
-,500
-,300
-,100
,100
,300
Tho
usan
ds h
eads
Niger
Mali
Burkina Faso
Chad
Togo
Benin
Ghana
Nigeria
Source: FAOStat Source: FAO Stat
• ICBT in Africa-43% of GDP, almost equivalent to the formal trade sector (Lesser &. Moisé-Leeman, 2009).
• ICBT in Africa is very profitable. Uganda's ICBT to its five neighbouring countries an estimated US$231.7 million, (around 86% of official export flows to these countries (Omiti, 2009; Lesser &. Moisé-Leeman (2009).
• ICBT a long standing traditional historical local and social economy trade W/A trade in livestock
12
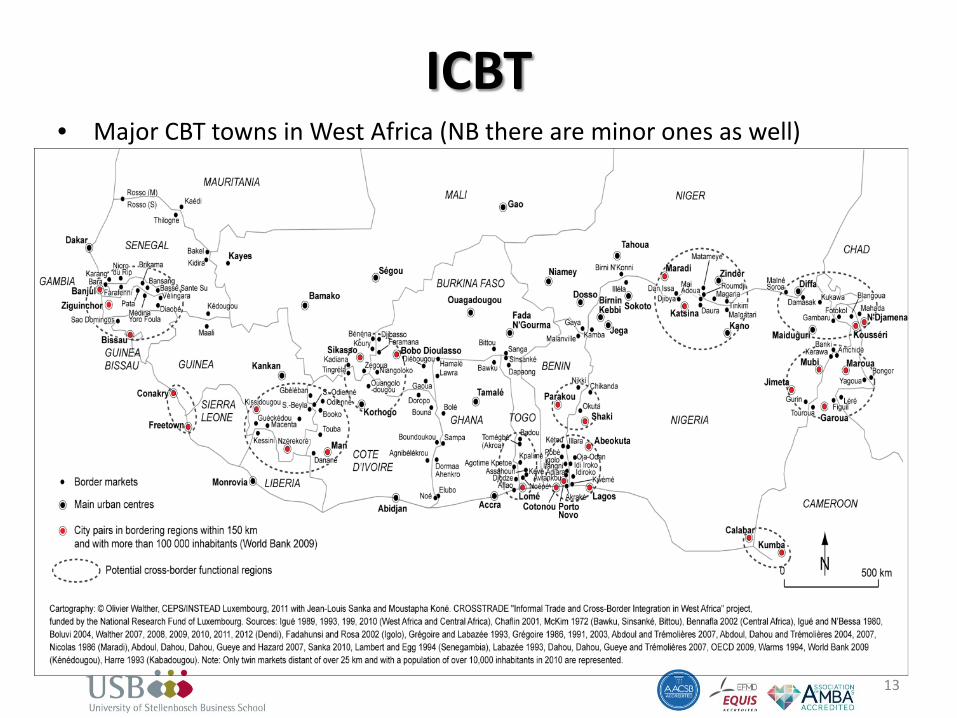
ICBT • Major CBT towns in West Africa (NB there are minor ones as well)
13

Africa’s Trade in the Global Value Chain (draws largely from AEO 2014)
• Africa’s integration into global value chains is comparable to other regions • Southern & North Africa lead integration of African regions into global
value chains
0
20
40
60
80
100
120
SouthernAfrica
NorthAfrica
WestAfrica
EastAfrica
CentralAfrica
IndianOcean
Valu
e ad
ded
expo
rts (
USD
Bill
ion)
Forwardintegration
Backwardintegration
Africa REC and GVC (2011) • Trends in GVC integration (2011)
0.00
0.10
0.20
0.30
0.40
0.50
0.60
0.70
0.80
Shar
e of
tota
l val
ue a
dded
exp
orts
Forwardintegration
14

Growth of global value chain integration, 1995-2011
15
-0.5 0 0.5 1 1.5
Russia and Central Asia
Southeast Asia
Latin America
Middle East
Europe
Oceania
North America
South Asia w/o India
East Asia w/o China
Africa
China
India
Growth 1995-2011
Backwardintegration
Forwardintegration
0.00
0.10
0.20
0.30
0.40
0.50
0.60
Afric
aCO
GRW
ACA
F
UG
AKE
NER
I
MU
S
MAR EG
YSD
S
LSO
AGO
BWA
ZAF
MW
IM
RT SLE
BFA
NER ST
PLB
RG
AB BEN
GM
B
Shar
e of
fore
ign
valu
e ad
ded
in
exp
orts
2011 Backward integration 1995 Backward integration
• Africa has increased its backward integration a
sign of value addition to exports & deep integration into GVC
• Lesotho & Mauritius have led in this direction

Regional value chain integration by sector, 2011
• Manufacturing (automotive) leads global and regional value chain
• Finance leads regional & GVC participation rates in services
16
,0
,5
,10
,15
,20
,25
0.00
0.10
0.20
0.30
0.40
0.50
0.60
0.70
0.80
USD
mns
Shar
e of
tota
l val
ue a
dded
exp
orts
Forward integrationBackward integration
0200 000400 000600 000800 0001000 0001200 000
0.00 0.02 0.04 0.06 0.08 0.10 0.12 0.14
Fina
nce
Met
alO
ther
man
ufac
turin
gCo
nstr
uctio
nEl
ec. a
nd m
achi
nery
Recy
clin
gTr
ansp
ort e
quip
men
tU
tiliti
esIn
t. tr
ade
Mai
nten
ance
Food
and
bev
erag
esO
il an
d ch
emic
alTr
ansp
ort
Educ
atio
n an
d he
alth
Woo
d an
d pa
per
Tele
com
Who
lesa
leHo
spita
lity
Reta
ilFi
shin
gTe
xtile
and
app
arel
Min
ing
Agric
ultu
re
Amou
nt o
f for
eign
Afr
ican
val
ue a
dded
in
Afric
an e
xpor
ts ('
000
USD
; 201
1)
Shar
e of
fore
ign
Afric
an v
alue
add
ed in
Afr
ican
ex
port
s (20
11)
Share of foreign African value added in total exported value added (left axis)
Foreign African value added in exports (right axis)

Some Challenges of Trade High Trade Transactions Costs
• Poor institutions and infrastructure
• Lack of policy convergence • Road blocks, red tape and slow
custom clearances • CEO of Massmart interview with
Fin 24 in 2009 “[When] we supply goods into Lagos, it might take 12 weeks on the water, [but it can take] 14 weeks to clear”
• Restrictive free movement. Africans need visas to get into at least two thirds of other African countries.
Country Time to cross the border (hours)
Time waited to pick up freight once inside the port (hours)
Burkina Faso 25.36 23.38
Ghana 30.33 24.71
Cameroon 26.55 12.38
Chad 11.65 12.38
Uganda 15.25 11.75
Kenya 8.18 5.93
Zambia 26.5 16.55
(USD per 20MT truck of general merchandize)Transfer Cost Category Nigeria Cameroon Unofficial customs payments at border 450 644 Other unofficial payments at border 262 191 Unofficial payments behind border 461 2,738 Current official customs payments at border - 1,478 Payments if simplified customs procedures were applied - 2,745 Potential charges if full tariff assessment were applied - 75,800 - 113,700
17 Source: adapted from Teravaninthorn and Raballand (2009)

Road blocks and trade transactions cost-e.g. from W/A
0 0.5 1 1.5 2 2.5
MaliNigeriaGhana
SenegalBurkina FasoCote d'Ivoire
Togo
Coste (2014)
Corridor Distnace
(km)
No. of Control Points
Average Cost per Truck (USD)
Size of Truck
Ekok - Mamfe - Bamenda 250 12 633 20 MTAbonshie - Kombo - Bamenda 220 11 581 20 MTMaga - Limani 150 13 521 40 MTBoukoula -Guider 80 7 290 40 MTDemsa - Garoua 45 4 676 40 MTOnitsha - Mfum 320 25 461 20 MT
Frequency of Road Controls and Costs Associated
• Number of roadblocks per 100 km (2011)
18
Traffic congestion at the Malaba Border Post between Kenya and Uganda. © TradeMark East Africa - See more at: http://www.tradeforum.org/article/Trade-facilitation-to-bring-billions-in-exports-to-East-Africa/#sthash.ns4bUurj.dpuf
Source: World Bank 2013

New Trade Policy for Africa?
• More emphasis on enhancing trade for sustainable development
1. Local economics- social & traditional economy 2. Formalize ICBT, 3. Harmonize regulations border procedures and policies to
strengthen REC & enhance intra-African trade 4. Promote services sector 5. FDI linked for linkages such as
1. Infrastructure 2. GVC 3. Technology and learning by doing 4. Employment and welfare development for local economy
• These will result in deep participation in GVC
19

Cases of traditional local economy industries for trade
• W/A- leather and beef Mali/Niger; fabrication and automotive design Suame-Ghana
• S/A-traditional economy of wool and mohair manufacturing-blankets and clothing), trout fish in Lesotho, automotive, citrus, grape and wine-SA
• E/A- textile industry-Ethiopia, logistics-Kenya • N/A-automotive-Morocco (citrus, fruits, textiles-Zara)/Egypt
20

Emerging Trade in services • Shoprite • Massmart
21
SABMiller sourcing agricultural input from smallholder farmers in order to include them in our supply chain. Success in Uganda, Tanzania and Zambia, now in Ghana, Nigeria etc

Emerging Intra Regional Trade/FDI Trade in Services Pan African Banks
22

Emerging Trends DANGOTE Group • Dangote Group:
– Cement - – Sugar - – Salt - – Flour & Semolina – Pasta & Noodles – Tomato Paste – Vegetable Oil Refinery – Packaging Materials – Logistics – Real Estate – Food & Beverages
• Pan-Africa Operations in Cement – South Africa – Senegal – Zambia – Tanzania – Ethiopia – Republic of Congo – Gabon
• MTN Group
23

To Conclude
• Trade policy in Africa – Local trade & social economics – Natural partners – Harmonize policies and regulations to enhance Intra
Regional Trade – Services sector – FDI related
• Thank you
24