Embed Size (px)
Citation preview

For comments, suggestions or further inquiries please contact:
Philippine Institute for Development Studies
The PIDS Discussion Paper Seriesconstitutes studies that are preliminary andsubject to further revisions. They are be-ing circulated in a limited number of cop-ies only for purposes of soliciting com-ments and suggestions for further refine-ments. The studies under the Series areunedited and unreviewed.
The views and opinions expressedare those of the author(s) and do not neces-sarily reflect those of the Institute.
Not for quotation without permissionfrom the author(s) and the Institute.
DISCUSSION PAPER SERIES NO. 99-12
The Research Information Staff, Philippine Institute for Development Studies3rd Floor, NEDA sa Makati Building, 106 Amorsolo Street, Legaspi Village, Makati City, PhilippinesTel Nos: 8924059 and 8935705
May 1999
Trade, Competitiveness and Financein the Philippine
Manufacturing Sector, 1980-1995
Josef T. Yap

TRADE, COMPETITIVENESS AND FINANCE IN THE PHILIPPINE MANUFACTURING SECTOR, 1980-1995
Josef T. Yap1
The Philippine Development Experience Introduction
The East Asian miracle of the 1960s up to the mid-1990s and the East Asian debacle in 1997 put in perspective two crucial factors that affect sustainable economic growth and development. The first is outward orientation which is a necessary ingredient for increasing the competitiveness of an economy, and the second is a sound financial structure that is required for efficient resource allocation and macroeconomic stability. The primary objective of this paper, is to analyze how these two factors interact with each other, i.e. how the level of financial development affected the evolution of the Philippine current account. Of particular concern is the trade sector, with emphasis on the dynamics of competitiveness and the pattern of exports in the Philippine manufacturing sector.
The Philippines was pointedly left out of the list of High Powered Asian Economies (HPAEs) identified by the World Bank (1993) in its study of the East Asian miracle. This is due primarily to her erratic economic performance which has been characterized by boom-bust cycles. During the period 1970-1997, for which data is presented in Table 1, the Philippines experienced three BOP crises. The first and most acute was in 1983-85 following the onset of the international debt crisis, the second was in 1990-92 in the aftermath of Gulf War; and the last was in the second half of 1997 as the Philippines was drawn into the financial crisis. Even when the economy’s performance was being considered as exceptional by the international community, the peak GDP growth rate was only 5.7 percent, which was recorded in 1996. Not surprisingly, this growth was the second lowest in Southeast Asia in that year. The Orthodox View
1Research Fellow, Philippine Institute for Development Studies (PIDS). This paper would not have been
possible without the excellent research assistance of Ma. Teresa Dueñas-Caparas. The author would also like to gratefully acknowledge the vast contribution of Dr. Caesar B. Cororaton to this paper in terms of estimates of capital stock and productivity. The usual disclaimer applies.
The performance of the Philippine economy during the post-war period has been directly
linked to the fortunes of its industrial sector. The various studies on this sector came up with the following major conclusions (Medalla et al. 1995):

2
1. That the more than three decades of protection had been very costly in terms of its inherent penalty on exports, its serious adverse impact on resource allocation, and dynamic efficiency losses arising from lack of competition;
2. That a reform toward a more liberal and neutral trade policy is necessary topropel the economy to a higher level of industrialization.
This is the basic neoclassical view which revolves around the issue of comparative advantage. Economic protection in the past meant that resources of the country flowed into sectors where thePhilippines did not possess a comparative advantage. Hence, production, particularly in the industrysector, became highly inefficient. Moreover, such policies prevented export-led industrialization totake root in the Philippine economy. Filipino entrepreneurs simply made profit behind the protectivecover of tariff walls and nontariff barriers to trade and did not aggressively seek to manufactureproducts where the Philippines had a distinct comparative advantage in the world market.
That the Philippine economy is largely inefficient is without question. This trend can begleaned by comparing labor productivity across time and across countries in East Asia. Table 2shows that labor productivity in the Philippines largely stagnated between the period 1975 and 1996. The overall labor productivity of Malaysia, Indonesia, Singapore and Thailand more than doubledin this period while the index for the Philippines even declined by one point. The agriculture andmanufacturing sectors exhibited the same pattern.
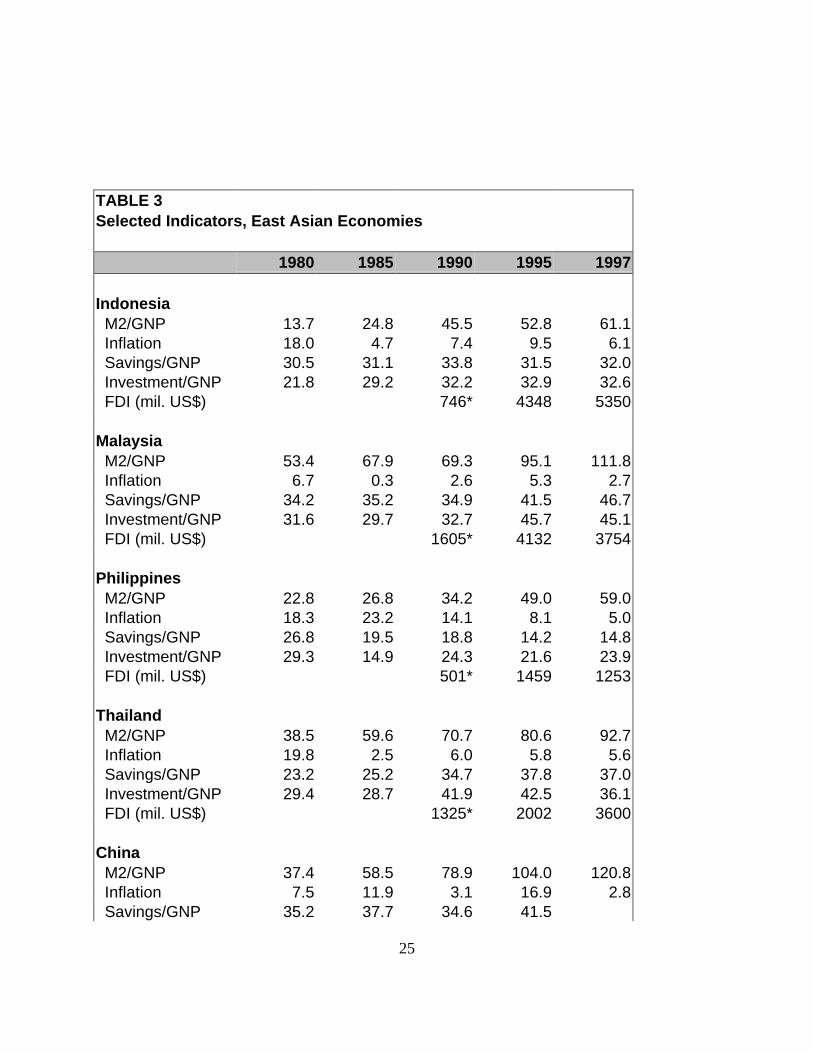
Apart from reference to the neoclassical argument, the poor performance in terms of laborproductivity can also be attributed to the low saving and investment rates in the Philippines (Table3). A low rate of capital accumulation leads to a low marginal product of labor and low averagelabor productivity. The variance in the investment rate between the Philippines and the moredeveloped Southeast Asian economies can be explained partly by the ability to attract of foreign directinvestment. In turn both FDI and domestic investment are largely affected by the degree ofmacroeconomic stability in an economy.
The Financial Sector and Macroeconomic Stability
The dismal record of the Philippines in terms of macroeconomic stability is reflected in herhigher inflation rate (Table 3). Econometric studies cite import costs and money supply as theexplanatory variables with the highest impact on Philippine inflation. Rapid monetary growth isusually related to a large public deficit but a closer analysis of the Philippine financial system willreveal that the instability of the banking sector during the postwar period contributed largely to macroeconomic imbalances.
The development of the financial system of the Philippines does not provide an exemplarycase of smoothly-operating financial markets fuelling investment and growth. On the contrary,
3
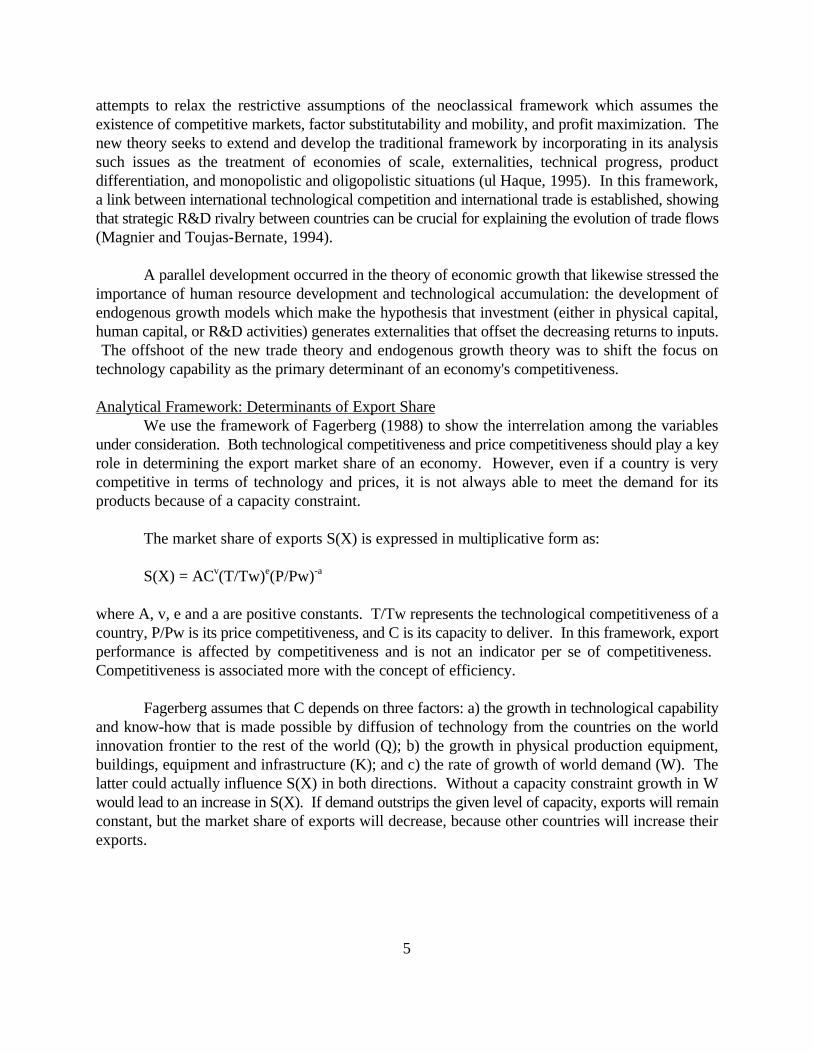
structural features of the process of financial intermediation have been at the root of the recurringliquidity and solvency crises in various parts of the Philippine banking system and capital markets.Rather than providing channels to alleviate financial constraints, the malfunctioning of the financialsystem has been a source of macroeconomic problems. The structural problems relate to thesegmented nature of the Philippine financial markets, the lack of competition among financialinstitutions, wide-ranging interlocking directorates and ownership patterns across the bankingindustry and other economic sectors, the shallowness of financial markets and the unresolved externaldebt overhang (Vos and Yap, 1996).
The structure of the financial sector, specifically the banking industry, reflects the patrimonialnature of the Philippine state and the dominance of a predatory oligarchy which leads
to an ineffective and inefficient bureaucracy.2 Banks in the Philippines are largely familial in naturewherein family conglomerates milked the loan portfolios of their own banks causing liquidityproblems. The situation was exacerbated by the inability of the Philippine Central Bank to regulateand supervise banks effectively creating instability in the banking system. The existence of apatrimonial oligarchic state (as opposed to a patrimonial administrative state as in Thailand andIndonesia) could also explain why the protectionist policies in the Philippines deteriorated into rent-seeking activity while similar measures were a means to capital accumulation in other countries.
As a result, the Philippine financial system has had a strong dualistic nature, in which animportant informal financial market segment coexists with the formal banking system. Informalmoney-lenders fund, at relatively high cost, small businesses and household firms which have littleor no access to the formal banking system. Large private corporations are the preferred borrowersof the highly-concentrated formally banking system. The interlocking interests of banks andcorporate enterprises strongly direct the allocation of funds, often overriding normal financial riskassessment. Over-leveraged firms and bad loans have been systemic problems which have requiredCentral Bank (now known as the Bangko Sentral ng Pilipinas or BSP) and government interventionto bail out ailing financial institutions, often at substantial macroeconomic costs. At the same time,financial markets have remained rather thin. While financial deepening has proceeded at anaccelerated pace in neighboring Asian countries, the mobilization of savings through the financialsystem has stagnated in the Philippines. This is reflected in a lower M2/GNP ratio up to the 1980s(Table 3 and Table 1 for M3/GNP).
Various attempts at financial reform and liberalization during the 1970s and 1980s succeededin reducing some of the structural problems of the Philippine financial system (cf. Intal and Llanto,1998). Adjustment policies in early 1990s, particularly the liberalization of the capital account, sought to resolve the economy’s fiscal and foreign exchange constraints. This would include therehabilitation of the BSP wherein the national government took over its bad loans. The M2/GNPratio of the Philippines increased sharply after 1992 although this is largely a result of theliberalization of the capital account. Some reforms, however, exacerbated the weaknesses, such asthe increased concentration of the banking sector after the financial liberalization measures of 1981.
2The book of Paul D. Hutchcroft (1998) provides an excellent description and analysis of the political economy
of the Philippine banking system and the overall Philippine development experience.

4
Moreover, emphasis has been placed on increasing competition in the financial sector--mainly byallowing the entry of more foreign banks-- rather than strengthening the supervisory and regulatoryrole of the BSP.
Framework and Objectives
An objective of this paper is to examine the linkage between trade patterns andcompetitiveness--or the lack thereof-- in the Philippine manufacturing sector using data between 1980and 1995. The most popular and influential standard for competitiveness is related to unit labor costs whereby a country attempts to keep wage increases in line with productivity changes. By keepingwage costs under control, a country can make its exports competitive--a higher market share forexports invariably reflects greater competitiveness. Recent evidence, however, has shown that unitlabor cost is a weak indicator of a country's competitiveness (Fagerberg, 1988). A more reliablemeasure would be productivity performance associated with technological development. Hencecompetitiveness will be directly associated with measures of productivity.
Even with improvements in the technological capability of an economy, however, its tradeperformance may not show a commensurate response; or else the trade specialization of an economydiverges from the pattern dictated by its technological capability. If there is a weak relationshipbetween these two variables, the next step is to determine to what extent this can be explained by anunstable macroeconomic environment, particularly in terms of exchange rate volatility and inflation. These variables usually work their way through the investment rate. Related to this is aninappropriate level of the real effective exchange rate which reflects an overvalued currency.
Meanwhile, a poorly functioning financial system can contribute to macroeconomic instabilityor hampers the flow of resources to sectors with high productivity growth thus failing to takeadvantage of export opportunities. Another major objective of this paper is to determine how thelevel of financial development has affected the trade pattern.
Productivity, Competitiveness and Trade Patterns
Theoretical Developments
International competitiveness in a macroeconomic sense is defined as the "ability of a countryto produce goods and services that meet the test of international markets and simultaneously tomaintain and expand the real income of its citizens" (ul Haque, 1995). The concern with internationalcompetitiveness stems primarily from the view that growth of the HPAEs was export-oriented. Whileit is still debated whether exports were the engine or merely a handmaiden of growth, increasing thecompetitiveness of the economy is definitely associated with greater efficiency and hence greateropportunities for economic growth.
Two advances in economic theory have brought nonprice competitiveness--referring mainlyto technological capability--to the forefront. The development of the New Trade Theory represents
5
attempts to relax the restrictive assumptions of the neoclassical framework which assumes theexistence of competitive markets, factor substitutability and mobility, and profit maximization. Thenew theory seeks to extend and develop the traditional framework by incorporating in its analysissuch issues as the treatment of economies of scale, externalities, technical progress, productdifferentiation, and monopolistic and oligopolistic situations (ul Haque, 1995). In this framework,a link between international technological competition and international trade is established, showingthat strategic R&D rivalry between countries can be crucial for explaining the evolution of trade flows(Magnier and Toujas-Bernate, 1994).
A parallel development occurred in the theory of economic growth that likewise stressed theimportance of human resource development and technological accumulation: the development ofendogenous growth models which make the hypothesis that investment (either in physical capital,human capital, or R&D activities) generates externalities that offset the decreasing returns to inputs. The offshoot of the new trade theory and endogenous growth theory was to shift the focus ontechnology capability as the primary determinant of an economy's competitiveness.
Analytical Framework: Determinants of Export ShareWe use the framework of Fagerberg (1988) to show the interrelation among the variables
under consideration. Both technological competitiveness and price competitiveness should play a keyrole in determining the export market share of an economy. However, even if a country is verycompetitive in terms of technology and prices, it is not always able to meet the demand for itsproducts because of a capacity constraint.
The market share of exports S(X) is expressed in multiplicative form as:
S(X) = ACv(T/Tw)e(P/Pw)-a
where A, v, e and a are positive constants. T/Tw represents the technological competitiveness of acountry, P/Pw is its price competitiveness, and C is its capacity to deliver. In this framework, exportperformance is affected by competitiveness and is not an indicator per se of competitiveness. Competitiveness is associated more with the concept of efficiency.
Fagerberg assumes that C depends on three factors: a) the growth in technological capabilityand know-how that is made possible by diffusion of technology from the countries on the worldinnovation frontier to the rest of the world (Q); b) the growth in physical production equipment,buildings, equipment and infrastructure (K); and c) the rate of growth of world demand (W). Thelatter could actually influence S(X) in both directions. Without a capacity constraint growth in Wwould lead to an increase in S(X). If demand outstrips the given level of capacity, exports will remainconstant, but the market share of exports will decrease, because other countries will increase theirexports.

6
Investment, Macroeconomic Stability and FinanceA major concern of the present study is how macroeconomic stability and the structure of the
financial sector affect the capacity constraint, specifically investment. Factors that affect the level ofcapital accumulation will also influence the capacity constraint and ultimately impact on export shares.
Conventional investment theories focus on the cost of capital and the replacement cost, ascompared to market value of new capital goods. They fail to consider, first, that most investmentdecisions face inherent uncertainty about future benefits and costs; second, that investors can controlthe timing of investment, waiting for relevant information that may reduce investment uncertainty andthird, that most investment decisions are partly or completely irreversible; once the capital stock isinstalled, it cannot be put to new uses without incurring a substantial economic cost.3
These crucial features have led to a new option approach that sees an investment opportunityas an option to buy an asset at different points in time, balancing the value of waiting with theopportunity of cost of postponing investment decisions. The option approach shows that the standardnet-present-value rule of investment (investment when NPV>0) must be modified. The correct ruleis that the anticipated return on the new investment project must exceed the purchase and installationcost by an amount equal to the value of keeping the investment option alive (NPV > value of optionto wait).
The Aoptions@ approach to investment enhances the role of uncertainty in investmentdecisions. Any hint of instability in key macroeconomic parameters will lead to postponement ofinvestment projects. An important policy implication is that uncertainty tends to make investmentless responsive to incentives such as subsidies and tax concessions and that huge incentives wouldtherefore be necessary to counteract the impact of high uncertainty on private investment.
Meanwhile, a growing body of theory and evidence suggests a positive, first-orderrelationship between financial development and economic growth (Levine, 1997). A well functioningsystem serves to reduce uncertainty surrounding investment decisions. As theory suggests, financialinstruments, markets and institutions arise to mitigate the effects of information and transaction costs.
One framework showing the role of financial systems in economic growth is the functionalapproach, which focuses on the ties between growth and the quality of functions provided by thefinancial system. These functions include facilitating the trading of risk, allocating capital, monitoringmanagers, mobilizing savings, and easing the trading of goods, services and financial contracts (Figure1). The role of institutions is also considered.
The key point is that given information and transaction frictions, a financial system is requiredto expend resources evaluating the creditworthiness of projects, scrutinize the management structureof firms and design arrangements to ease risk management and facilitate transactions. These functions
3Dixit and Pindyck (1994) as cited by Schmidt-Hebbel, et al. (1996).

7
affect investment decisions and influence the pace of technological innovation thereby affecting thecapability of an economy to deliver.
The importance of macroeconomic stability and a well-developed financial system arediscussed by Fanelli and Frenkel (1995) in a very convenient framework that is developedqualitatively. Increased uncertainty induced by volatility of macroeconomic aggregates encourages"flexibility" in the behavior of economic agents. AFlexibility@, which is roughly equivalent to a wait-and-see attitude, translates into mutations in the productive structure of the economy through variouschannels. One is the preference for short-run investment projects which leads to a drop in theinvestment rate or the concentration of capital in low-risk projects that are capital intensive and useestablished technologies.
The impact of Aflexibility@ on investment also manifests itself in the development oftechnological capability of the economy. Since much of the technological learning in developingcountries is related to purchases of new capital equipment, the fall in investment weakens the processof technical change. Macroeconomic instability will also encourage defensive strategies on the partof investors, reducing their willingness to incorporate innovation into the productive process.
These mutations also impact on the structure of financial intermediation. As Fanelli andFrenkel argue, there is a generalized movement of the demand for financial assets towards short-termones as well as toward assets denominated in foreign currencies. This implies that liquid or veryshort-term papers become more expensive than those of longer maturity periods. Liquidity becomesa very relevant attribute, together with profitability, at the moment of decision. This in turn has aneffect on the generation of credit whereby the conditions to gain access to long-term funds areincreasingly difficult. If credit is available, it is denominated in foreign currency. Firms which earnrevenues largely from domestic operations are obliged to take higher exchange risks.4
The institutional framework is also important in determining the nature of the micro-macrointeractions since the amount and quality of self-regulating mechanisms determines the rate at whichthe effects of an economic disturbance is distributed over time. In the context of financialdevelopment, the efficacy and efficiency of financial intermediation also depends on the quality ofbank supervision and the degree of sophistication of screening mechanisms employed by commercialbanks. In other words, initial microeconomic conditions also matter.
Evolution of the Philippine Manufacturing Sector
The anti-protectionist-neoclassical view became dominant among government technocratsstarting in the late 1970s and as a result a major trade reform program was implemented in 1980. Theobjective was to make the Philippines more outward oriented by opening up its economy. After thetrade reform process was disrupted because of the external debt crisis in 1984-85, major import
4Fanelli and Frenkel (1995), p. 12.
8
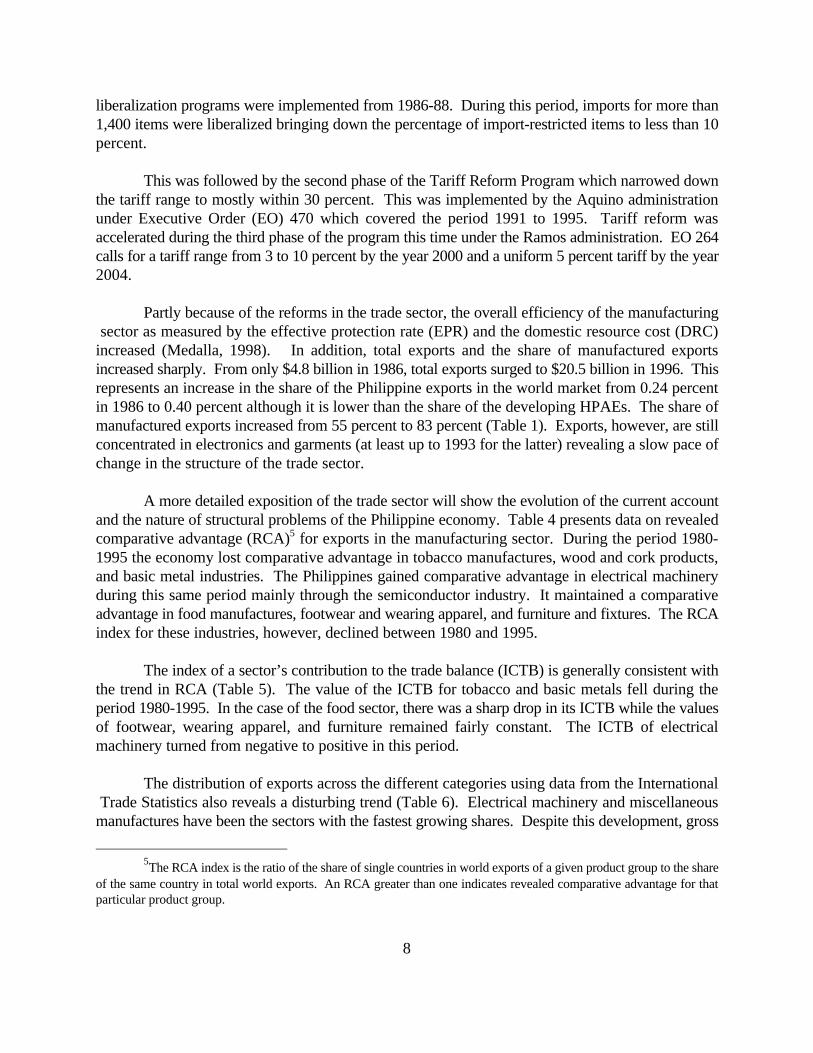
liberalization programs were implemented from 1986-88. During this period, imports for more than1,400 items were liberalized bringing down the percentage of import-restricted items to less than 10percent.
This was followed by the second phase of the Tariff Reform Program which narrowed downthe tariff range to mostly within 30 percent. This was implemented by the Aquino administrationunder Executive Order (EO) 470 which covered the period 1991 to 1995. Tariff reform wasaccelerated during the third phase of the program this time under the Ramos administration. EO 264calls for a tariff range from 3 to 10 percent by the year 2000 and a uniform 5 percent tariff by the year2004.
Partly because of the reforms in the trade sector, the overall efficiency of the manufacturing sector as measured by the effective protection rate (EPR) and the domestic resource cost (DRC)increased (Medalla, 1998). In addition, total exports and the share of manufactured exportsincreased sharply. From only $4.8 billion in 1986, total exports surged to $20.5 billion in 1996. Thisrepresents an increase in the share of the Philippine exports in the world market from 0.24 percentin 1986 to 0.40 percent although it is lower than the share of the developing HPAEs. The share ofmanufactured exports increased from 55 percent to 83 percent (Table 1). Exports, however, are stillconcentrated in electronics and garments (at least up to 1993 for the latter) revealing a slow pace ofchange in the structure of the trade sector.
A more detailed exposition of the trade sector will show the evolution of the current accountand the nature of structural problems of the Philippine economy. Table 4 presents data on revealedcomparative advantage (RCA)5 for exports in the manufacturing sector. During the period 1980-1995 the economy lost comparative advantage in tobacco manufactures, wood and cork products,and basic metal industries. The Philippines gained comparative advantage in electrical machineryduring this same period mainly through the semiconductor industry. It maintained a comparativeadvantage in food manufactures, footwear and wearing apparel, and furniture and fixtures. The RCAindex for these industries, however, declined between 1980 and 1995.
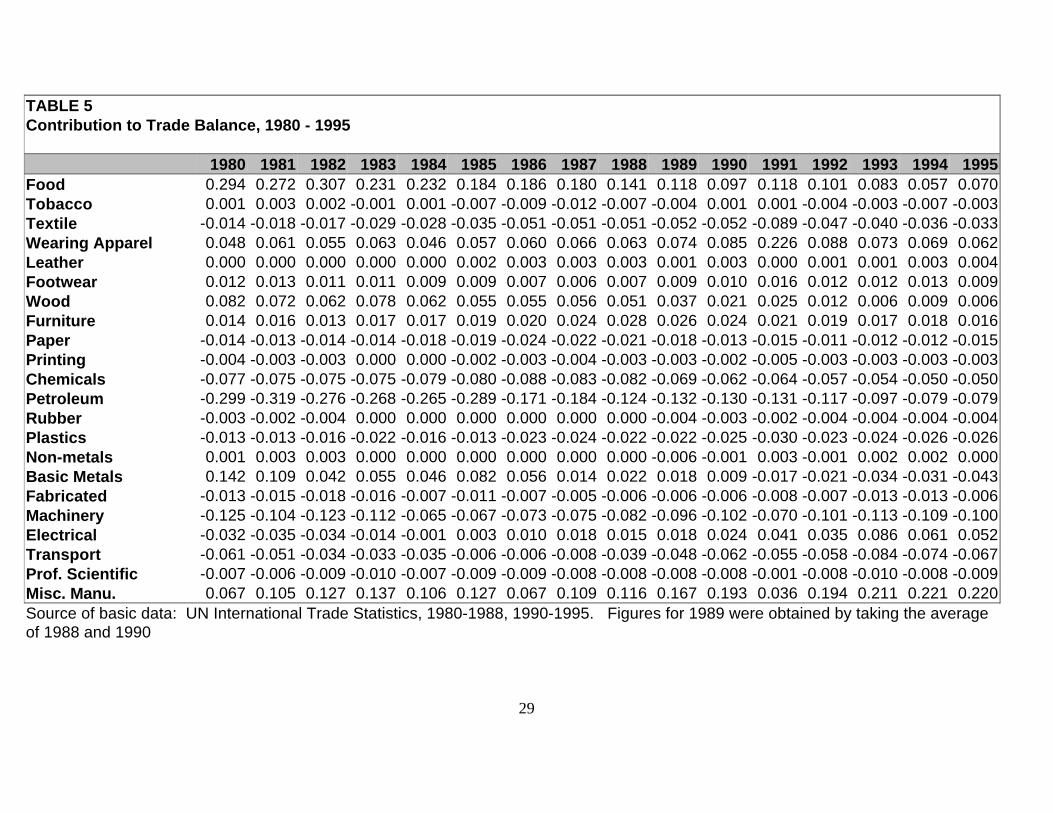
The index of a sector’s contribution to the trade balance (ICTB) is generally consistent withthe trend in RCA (Table 5). The value of the ICTB for tobacco and basic metals fell during theperiod 1980-1995. In the case of the food sector, there was a sharp drop in its ICTB while the valuesof footwear, wearing apparel, and furniture remained fairly constant. The ICTB of electricalmachinery turned from negative to positive in this period.
The distribution of exports across the different categories using data from the International Trade Statistics also reveals a disturbing trend (Table 6). Electrical machinery and miscellaneousmanufactures have been the sectors with the fastest growing shares. Despite this development, gross
5The RCA index is the ratio of the share of single countries in world exports of a given product group to the share
of the same country in total world exports. An RCA greater than one indicates revealed comparative advantage for thatparticular product group.

9
value added of electrical machinery was only 2 percent of GDP in 1997. Meanwhile specialtransactions, consisting mainly of re-exports, is the main component of miscellaneous manufactures.
The deceptive export configuration explains why despite the increasing share of manufactured exports, the share of value added of the manufacturing sector in total output has remained stagnantfor the past twenty years and is even lower than the value in 1980 (Table 1). Estimates of totalfactor productivity for the Philippine manufacturing sector show a steady decline in the period 1956-1975 which became sharper from 1975 to 1980 (Hooley, 1985). The trend continued into the 1980sup to 1992 (Cororaton et al. 1995). The year-on-year growth of value added in the manufacturingsector in real terms has actually declined for thirteen consecutive quarters--from 1995Q4 to 1998Q4.
Medalla attributes the conflicting trends--a rise in efficiency measures in the manufacturingsector and continuing structural problems--to three factors: 1) adjustment, oftentimes a painful one,to a more open trade regime; 2) a persistently overvalued currency; and 3) the switch in relativeprotection between agriculture and manufacturing, this time in favor of the former. One could addto this list a relatively low investment rate in the Philippines and poor infrastructure.
An inevitable outcome of a more open trade regime is that inefficient local firms are weededout almost immediately because of the deluge of imports. It will take some time before the resourcesare re-invested in more efficient sectors which are usually export-oriented. The restructuring processis akin to the "J-curve" effect of a currency devaluation. In this case, the manufacturing sectorcontracts because of the closure of noncompetitive firms but it should start to grow rapidly onceresources are used more efficiently. This explanation, however, conveniently ignores the fact that thebulk of trade liberalization took place in the late 1980s but the marked slowdown of themanufacturing sector occurred between 1995 and 1997 in spite of accelerated economic growth upto 1996.
The restructuring process would have been smoother if the currency were allowed todepreciate in real terms following the increase in demand for imports. The lower value of the pesowould have acted as a cover for import-competing industries. Because of the overvaluation of thepeso, import-competing firms were hit with a double-whammy: lower tariffs and an artificially strongpeso both of which made imports cheap. An overvalued currency could also explain why exports areheavily concentrated in commodities that are import-dependent. Because it is relatively cheap toimport, exporters focus on products whose inputs can be sourced from abroad making labor theprimary source of value added.
Overall, the Philippines has taken great strides to enhance its outward orientation and isbordering on being a completely open economy by the year 2004. This progression is dovetailed tothe process of globalization. Despite the policy reforms, however, manufacturing growth has notperformed up to expectations. Apart from the factors discussed in this section, the reasons may dealwith the structural aspects related to macroeconomic stability and weaknesses in the financialinstitutions.

10
Empirical Results
Based on the analytical framework, the following general functions were estimated using datafrom 1980-1995.
RCAit = β1 + β2ρit + β3Pit/P* + β4Kit + εit (1)
I/GVAit = γ1 + γ2 σ + γ5e + γ4 M3/GNP + γ7FDI/GDP + εit (2)
The index i refers to a particular manufacturing sector while t is a index for time.6
The revealed comparative advantage (RCA) index for the various manufacturing sectors wascomputed and was used as the measure of trade performance and an indicator of the trade pattern inthe Philippines. Competitiveness of each sector was determined using a productivity measure, ρ. Thesimplest would be growth in labor productivity.7 A more complicated procedure would be toestimate the Total Factor Productivity (TFP) for each sector.
TFP is a concept of efficiency where the economy's productive inputs like labor and capitalare jointly used in production. It can be measured in two ways: 1) the deterministic approach, and2) the stochastic approach. The deterministic approach is further divided into two categories; (a)index number approach, and (b) growth accounting approach. The latter two methodologies aresimple and TFP estimates can be easily computed. However, a weakness of these approaches is theresidual treatment of TFP which could render biased estimates.
The stochastic approach, on the other hand, assumes the existence of an unobservableproduction frontier function and from this, the actual production frontier is compared. In doing so,the residual treatment is eliminated and all factors contributing to production are accounted for. Thisapproach can be used both for time series and cross-section data. Cororaton (1998) applied boththe growth accounting and stochastic approach to Philippine manufacturing sector data.
The implicit price index for each sector i Pit was used as an indicator of price competitivenesssince unit labor costs are not available for the given sectoral breakdown. The price index was scaledby an import price index for non-fuel products, P*, to get a measure of relative prices. The capabilityof an economy to deliver or its capacity is related to existing capital stock, K. Estimates of K foreach sector were obtained by Cororaton using the perpetual inventory method. These values of K,which were also used to obtain the productivity figures, were used for the econometric estimation.
6In the actual estimation, only 12 manufacturing sectors were included. These sectors both had nonzero RCA and
an available estimate of capital stock.
7Labor productivity for a particular sector is simply value added in that sector divided by employment in that sector.

11
Since K is generated by investment, it is through the latter variable that the link between tradeand financial development can be established. The investment rate per sector (I/GVA), defined tobe sectoral investment divided by sectoral gross value added, is modelled to be determined byvolatility in the real effective exchange rate, σ, and the level of financial sector development whichis captured by the ratio of broad money M3 to GNP. The technique employed by Schwert (1989)was used to estimate volatility of the real effective exchange rate.
The amount of foreign direct investment (FDI) scaled by GDP should also affect investment. The experience of the developing HPAEs shows that the entry of foreign investment spurred an inincrease domestic investment that was put in place to support the requirements of MNCs. The realeffective exchange rate, e, is added to incorporate the effects of an overvalued currency.
In the various estimates of the first equation (see Table 7)8, the coefficients for the growthin labor productivity, TFP using the growth accounting approach and TFP using the stochastic areall insignificant. As a matter of fact, the coefficient of labor productivity growth is negative andsignificant at the 10 percent level. The results show unambiguously that there is no empirical supportfor a link between the productivity measures and export performance. Changes in technology andproductivity in the domestic manufacturing sector did not influence the pattern of Philippine exportsduring the period 1980-1995.
The variable representing relative prices carries the correct negative sign but the coefficientis not significant. What would be troubling though is the consistent negative sign of the coefficientfor capital stock which is significant at the 10 percent level. It seems that increased investmentactivity that augments the capital stock does not contribute to better export performance and mayeven hamper it. This result, combined with the earlier observation that technological competitivenessand export performance are not related, is a clear indication that the export sector has its owndynamics, independent of the developments in the local manufacturing sector. A dichotomy existsbetween the domestic manufacturing sector and the export sector.
Estimates on the first equation were also run with σ and FDI/GDP as explanatory variables. Real exchange rate volatility may affect export performance directly since it affects the rate of returnof exporters and hence their profit risk (Medhora 1998). FDI affects export performance in twoways. First, it relaxes the capacity constraint by providing more capital inputs for production. Andsecond, to the extent that the FDI is export-oriented, it directly contributes to the level of exports,and hence a higher market share. The results, however, did not improve with the inclusion of thesetwo variables in Equation 1. Perhaps the results would differ if FDI by sector were used. Unfortunately such data are not readily available.
8Other specifications, which are not reported, include a variable to control for the growth of world trade which may
affect RCA. This did not significantly change the results shown in Table 7.

12
Estimates of the second equation (Table 8) show a significant positive relationship betweenthe investment rate and the measure of financial development. Because of the adverse relationshipbetween capital stock and RCA obtained in the first equation, a conclusive statement on the impactof financial development on export structure cannot be made. A different line of analysis will beadopted and discussed in the latter part of the paper.
Another variable that is significant is foreign direct investment although it carries a negativecoefficient. Apparently the entry of FDI displaces some local investment or else it leads tocomplacency among domestic entrepreneurs. This result, however, must be studied more carefully. Certainly it does not imply that policies discouraging FDI should be implemented.
The measure of exchange rate volatility is not significant although the level of REER carriesa significant negative coefficient. A higher REER implies an appreciating peso in real terms whichhurts import competing industries and exporters. This would of course discourage investment inthese two important sectors. Other measures of exchange rate volatility could also be used to model more closely the extent of macroeconomic instability. If the inflation rate is used instead of exchangerate volatility there is a minor improvement in the equation but the variable for macroeconomicinstability remains insignificant.
Competitiveness, Finance and Macroeconomic Stability
Major Hypothesis
The dichotomy between the domestic manufacturing sector and the export sector is the reasonwhy the share of manufacturing value added to GDP has been stagnant despite the dramatic rise inthe share of manufactured exports. One possible reason for the dichotomy is that the more efficientsectors are not allocated enough credit. This sections aims to provide empirical evidence to test thishypothesis.
In a world of perfect capital markets where the Modigliani and Miller and the Fisherseparation theorems would be valid, the performance of firms and economic sectors could beexplained without reference to the developments in the financial sector. But at the onset it wasobserved that the financial sector of the Philippines is far from perfect. Apart from the usual problemsof asymmetric information in financial markets, the Philippine financial system has been hampered bystructural problems related mainly to the oligarchic banking system. Access to credit thus is a keydeterminant of economic performance.
The Role of Export Finance
Export finance is another area that may offer an explanation for the weak link betweenproductivity growth and export performance . A survey of exporters revealed that only a minoritywere covered by the BSP’s rediscount window, which was the most important export financingscheme in the Philippines at least in the 1980s. Only about 500 out of about 6,000 direct exporters

13
had access to the export loan discount scheme. As a result, export loans outstanding declined from14 percent of export value in 1982 to just one percent in 1986-88 (Rhee, et al. 1990).
Indirect exporters were not eligible for the CB's preshipment export finance window eventhough they are several times more numerous than direct exporters. This failure to assure equalaccess to working capital financing for indirect exporters hindered the development of backwardlinkages as well as the development of trading companies (Rhee, et al. 1990). One mechanismsuggested to expand the coverage to indirect exporters is the introduction of the domestic letter ofcredit.
The underdevelopment of the export financial system was generally a product of theunderdevelopment of the entire financial system. For example, heavy collateral requirements bycommercial banks has been cited as the major impediment to wider access to export financing. Apreshipment export finance guarantee could have been designed to overcome this constraint. Sucha scheme existed in the Philippines but had only a limited role at least in the 1980s. This could beexplained by a shallow financial base that prevented effective risk sharing among the various partiesinvolved.
Framework and Empirical Results
In the absence of robust financial data at the firm level, the methodology of Rajan andZingales (1998) will be adopted. In their study, the growth of a particular industry is linked to theexternal financial dependence of that industry and the degree of financial development of theeconomy. Their hypothesis is that industries that are more dependent on external finance grow fasterin economies that are more financially developed.
To test this hypothesis, Rajan and Zingales estimate the technological demand for externalfinance that a firm operating in a specific industry would choose in a perfect capital market. Sincethe US comes closest to the criteria for a well functioning capital market, the observed ratio ofexternal finance (defined to be the difference between investment and cash generated from operations)in the US for a particular industry is used as a benchmark. The external dependency ratio (EDR) forthe various manufacturing sectors is shown in Table 9.
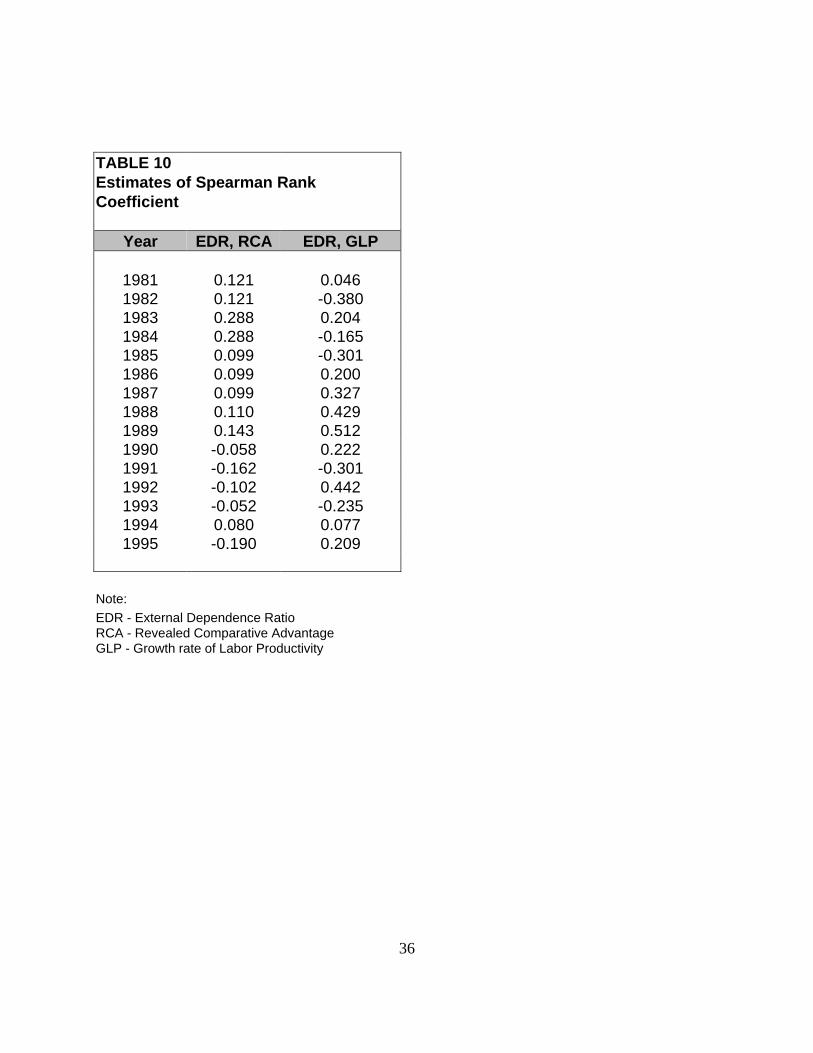
To test the relationship between the level of financial development on the one hand andcompetitiveness and trade pattern on the other, the EDR is compared with the growth rate ofproductivity--the measure of competitiveness--and RCA. In both cases, the sectors are ranked, firstby labor productivity growth and then by RCA. A rank correlation coefficient using the EDR rankingas a basis for comparison is then computed for both cases.
In the context of a financially underdeveloped economy like the Philippines, there should bea negative correlation between the ranking obtained from EDR and the ranking obtained from the growth rate of labor productivity. This implies that inadequate access to credit prevents firms witha high EDR from reaching their potential growth, leading to low productivity performance. A similarexplanation could be made in case of the RCA measure. A negative correlation would imply that he

14
economy is unable to develop a comparative advantage in particular sectors because of lack of accessto credit.
The estimates of the rank correlation coefficients are shown in Table 10. There is no generalpattern for the sample period 1980-1995 for both RCA and growth of labor productivity. Moreover,the values are closer to zero than to one. It would seem that access to credit plays no major role indetermining competitiveness or the trade pattern.
Based on this evidence, the dichotomy between the export sector and the domesticmanufacturing sector could be attributed more directly to real factors rather than financial constraints. What could be emphasized though is that the financial sector was a major source of macroeconomicinstability leading to high inflation rates, an overvalued currency and a low investment rate.
Micro-Macro and Real-Financial Interactions
General Analysis
The dichotomy between the export sector and domestic manufacturing sector transcends theusual dualistic structure that exists between the traditional and modern sectors. A possible explanationfor this structure in the manufacturing sector is provided by Dohner and Intal (1989). Philippineexport promotion measures allowed producers to obtain imported inputs at world market prices,leading to the development of export processing based on imported materials and the low wages ofPhilippine labor. The retention and augmentation of the system of protection for manufacturing firmsproducing for the domestic market meant that value-added margins of these export producers wouldremain very thin; the higher cost and lower quality of domestic materials precluded the growth ofdomestic sourcing. The high degree of protection of the domestic markets also tended to limit exportproducts to industries where the transport cost of materials was low and labor input requirementshigh. Garments and electronic components, which have been the top two export categories since1982, fit those requirements perfectly. Dohner and Intal describe export growth as intensive ratherthan extensive.
This explanation--citing the highly protectionist system as the main factor behind the narrowexport base--is largely consistent with the orthodox or neoclassical economic view. The naturalpolicy recommendation would be a more open trade regime. Corollary to the orthodox position isthe problem of an overvalued currency. An artificially cheap peso encouraged exports that areimport intensive. Exporters offset the penalty of a low exchange rate by relying heavily on higherquality imports of raw materials and intermediate goods made relatively inexpensive by theovervalued peso.
The experience of the developed HPAEs provides a striking contrast to the neoclassicalblueprint. Instead of working to get prices right, the economies of Japan, Korea and Taiwanimplemented policies to get the fundamentals right. Among the major thrusts was to enhance their

15
technology capability through the judicious use of policy interventions (Lall, 1995). The developedHPAEs relied heavily on licensing agreements and reverse engineering and were selective on, evensometimes hostile to foreign direct investment (Lall, 1994).
Meanwhile, developing HPAEs and Singapore sourced the technological development of theirexport sector primarily from foreign direct investment. In this situation, the link between productivitygrowth in the manufacturing sector and export performance would depend on the level of FDI anddegree of technology transfer. The evolution of the Philippine export sector since 1975 and itscontrast to the experience of the developing HPAEs can largely be explained by the nature and extentof FDI flows into the economy.
Table 3 shows that the Philippines was a laggard in terms of attracting FDI mainly becauseof the adverse macroeconomic and political environment. The pattern of export growth in thePhilippines in the last two decades was simply a response to the trend towards the internationalizationof the division of labor where the industries which lost their comparative advantage in the moredeveloped countries found their way into economies characterized by a relatively low wage scale(Broad, 1988). The inability of the export sector to effectively diversify into other commoditiesindicates that the Philippines was simply riding on the worldwide trend towards industry relocationrather than seriously implementing an industrial policy, particularly an export program. UnlikeSingapore and Malaysia, there was no coherent strategy implemented to insure effective technologytransfer.
A key finding of Cororaton, et al. (1995) is that foreign direct investment has not generallybeen contributing to the technical progress of the manufacturing sector. This conclusion is consistentwith the survey results of Lindsey (1989) from the manufacturing sector where he finds that: 1) mostof the equipment brought in by investors are already in use in the Philippines; 2) research anddevelopment activities are limited to quality control instead of basic research; 3) there is minimaldiffusion of technology to local firms; and 4) the processes used are very simple, leaving little roomfor skills development.
Implications for Policy
To bring about a more integrated economy, the standard response was followed by economicmanagers in the Philippines: adopting a program akin to the Washington consensus. Several analystshave cautioned against strict adherence to this framework (Rodrik 1992, Guerrieri 1994, Ffrench-Davis 1994). Structural transformation has a major influence on the acquisition of comparativeadvantage and is a cause of economic growth. Guerrieri argues that the economic metamorphosisshould not be considered as an automatic by-product of an outward-oriented strategy and soundmacroeconomic policies, as free trade orthodoxy regards it. Neoliberal economics largely disregardsthe key role played by technology in changing trade patterns and hence misses the structuraldimension of a country’s competitiveness.
Echoing this sentiment, Lall (1995) argues that the more important and pervasive source of

16
market failure is likely to be learning processes in production rather than scale economies orexternalities. This fact is particularly important for developing countries, which are latecomers toindustrialization and thus face established competitors that have already undergone the learningprocess.
Depending on the extent of the learning costs involved, as well as the efficiency of therelevant factor markets and supporting institutions, there may be a valid case for selective and variableinfant industry protection and for the gradual exposure of existing activities to import competition. Since protection itself reduces the incentive to invest in capability building, however, it has to becarefully designed, sparingly granted, strictly monitored, and offset by measures to force firms to aimfor world standards of efficiency. The most effective offset to the disincentives to capabilitydevelopment that arise from protection seems to be strong pressures to enter export markets, as acommitment to exporting disciplines not only firms but also those who design and administer policy. In Lall's view the true contribution of export orientation to industrialization was to provide the rightframework for selective interventions.
The emerging external environment, however, constrains the available policy options. As Lall(1994) points out: “...the international scene, the GATT, and the pressures exerted by the developedWestern countries, are inimical to selective intervention...Many instruments of industrial policy areincreasingly constrained in the name of liberalization.” He correctly asserts, however, that if thereis a valid case for intervention, then a review of the international rules of the game is warranted.
The recent performance of the Philippine manufacturing sector supports the aforementionedconcerns. Despite the reforms implemented in the late 1980s and accelerated in the early 1990s, themanufacturing sector experienced a deceleration even prior to the 1997 financial crisis.
Meanwhile, the liberalization of the financial system and the capital account in order to spurfinancial development also has its downside risks as painfully revealed by the 1997 East Asianfinancial crisis. These twin liberalizations could fuel what is termed “financierism” which ischaracterized by the growing supremacy of financial activity over productive activity (Ffrench-Davis,1994). The adverse effects of financierism could be attributed to the inadequate regulatory structurein place at the time of liberalizing the financial system. Some analysts put the blame squarely on thecorrupt practices in some of the East Asian countries citing the behest loans in Korea and cronycapitalism in Indonesia.
What is certain is that the situation is more complicated than this. Many of the East Asianeconomies that were buffeted by the crisis had relatively strong macroeconomic fundamentals andwere dragged into crisis by the financial panic of foreign investors. Krugman (1999) for instance does not agree that Asian economies are being punished for crony capitalism since the “the scale ofpunishment seems wholly disproportionate to the crime.” He has joined the bandwagon of thosecalling for the reform of the international financial architecture.
The ideology of liberalization should not cloud the objective of policy reforms: theimprovement of the technological capability of the manufacturing sector, the establishment of a

17
dynamic link between the manufacturing and export sectors, and the development of a stable financialsystem. Granted that globalization is an irreversible process, the Philippines must strive to attractforeign direct investment and achieve the success of the developing HPAEs in this regard. Simultaneously economic managers must apply strategic interventions to facilitate the transfer oftechnology. These would include:
1. Encourage the practice of “mirroring” similar to the case of Korea. An expatriateengineer would be assigned a local counterpart whom he should train. The local engineer wouldeventually assume the responsibility of the foreign engineer.
2. Encourage multinational corporations to link up with a domestic firm and develop thelatter as a source of intermediate inputs. Such subcontracting was practiced extensively in Singaporeand Malaysia.
3. The government must set clear strategies and policies on technology development--whether adoption, modification, or generation--by industry.
4. Develop in parallel the human resource capital to cope with the requirements oftechnology transfer.
These recommendations are consistent with the findings of a recent PIDS study (Yap, 1998)showing that the Philippines has many weak links at the microeconomic level preventing the benefitsfrom macroeconomic reforms from being realized. This would include a low level of technologicalcapability that hampers backward and forward linkages in industries; a poor record in human resourcedevelopment that contributes to low labor productivity; extremely slow alleviation of poverty andincome inequality that gnaws at the basic fabric of social cohesion; and inadequate infrastructure thatdiscourages domestic and foreign investment. These shortcomings are at the root of coordinationfailures that threaten macroeconomic stability.
Policy recommendations for the financial sector have to be studied more carefully given therecent experience in East Asia. The study of Rhee et al (1990) recommended the establishment ofa foreign currency loan scheme for exporters to take advantage of the lower international interestrates. Presumably this need was addressed when the capital market was liberalized. Unfortunately,the dollar-denominated loans were not limited to exporters and borrowers without a natural exchangerate hedge also availed of these loans. This situation was one of the primary causes of the downwardeconomic spiral when the crisis struck.
There are, of course, the standardized proposals for reform of the banking sector. It has beenrecommended that prudential regulation and supervision be strengthened by implementingcomprehensive risk-based assessment and supervision instead of focusing primarily on credit risk. In addition, there is a need for more stringent information disclosure requirements, adequateaccounting and auditing standards, as well as clearer rules and greater transparency in assetclassification and provisioning (Intal and Llanto, 1998).

18
These reforms, however, must take into consideration political and institutional factors whichare at the core of the problems in the banking sector. For example, no matter how comprehensivethe risk assessment that is required, it is ineffective if bank supervisors fall prey to the pressures ofparticularistic interests. While making reforms more difficult to implement, these factors arefundamental in nature and would definitely bring about a beneficial transformation of Philippinesociety.
References
Agenor, P. (1995): “Competitiveness and External Trade Performance of the French ManufacturingIndustry,” International Monetary Fund Working Paper 95-137.
Broad, R. (1988): Unequal Alliance: The World Bank, the International Monetary Fund andthe Philippines. Berkeley: University of California Press.
Cororaton, C. B. et al. (1995): "Estimation of Total Factor Productivity of Philippine ManufacturingIndustries: The Estimates" Philippine Institute for Development Studies Discussion Paper95-32 (November).
Cororaton, C. B. (1998): “Total Factor Productivity of the Philippine Manufacturing Sector: 1956-1995" Manuscript (October).
Fagerberg, J. (1988): “International Competitiveness,” The Economic Journal 98 (June).
Fanelli, J. M. and R. Frenkel (1995): “Micro-Macro Interaction in Economic Development,” UNCTAD Review.
French-Davis, R. (1994): “The Macroeconomic Framework for Investment and Development: TheLinks Between Financial and Trade Reforms,” in The New Paradigm of SystemicCompetitiveness: Toward More Integrated Policies in Latin America. OECD DevelopmentCentre.
Guerrieri, P. (1994): “International Competitiveness, Trade Integration and TechnologicalInterdependence,” in The New Paradigm of Systemic Competitiveness: Toward MoreIntegrated Policies in Latin America. OECD Development Centre.
Haque, I. ul (1995): “Technology and Competitiveness.” Chapter 2 in Trade, Technology andInternational Competitiveness edited y I. ul Haque. The World Bank.
Hooley, R. (1985): “Productivity Growth in Philippine Manufacturing: Retrospect and FutureProspects,” PIDS Monograph Series No. 9. Makati: Philippine Institute for DevelopmentStudies.

19
Hutchcroft, P. D. (1998): Booty Capitalism: The Politics of Banking in the Philippines. Manila:Ateneo de Manila University Press.
Intal, P. S., Jr. and G. M. Llanto (1998): “Financial Reform and Development in the Philippines,1980-1997: Imperatives, Performance and Challenges.” PIDS Discussion Paper Series No.98-02.
Krugman, P. (1999): “The Return of Depression Economics,” Foreign Affairs 78, 1 (January/February)
Lall, S. (1994): “The East Asian Miracle: Does the Bell Toll for Industrial Strategy?” WorldDevelopment 22,4.
Lall, S. (1995): “The Creation of Comparative Advantage: The Role of Industrial Policy,” Chapter5 in Trade, Technology and International Competitiveness edited y I. ul Haque. The WorldBank.
Levine, R. (1997): “Financial Development and Economic Growth: Views and Agenda,” Journal ofEconomic Literature XXXV (June).
Lindsey, C. W. (1989): "Commodities, Technology and Trade: Transnational Corporations andPhilippine Economic Development," Philippine Review of Economics and Business 26, 1.
Magnier, A. and J. Toujas-Bernate (1994): “Technology and Trade: Empirical Evidences for theMajor Five Industrialized Countries,” Weltwirtschaftliches Archiv 130,3.
Medalla, E. M. et al. (1995): Catching Up With Asia's Tigers. Makati: Philippine Institute for Development Studies.
Medalla, E. M. (1998). "Trade and Industrial Policy.” PIDS Discussion Paper Series No. 98-05.
Medhora, R. (1998): “Exchange Rates, Real-Financial and Micro-Macro linkages,” Manuscript.
Rhee, Y. W. et al. (1990): “Export Finance--Issues and Directions: Case Study of the Philippines,” The World Bank.
Rajan, R. G. and L. Zingales (1998): “Financial Dependence and Growth,” American Economic Review. 88, 3 (June).
Rodrik, D. (1992): “The Limits of Trade Policy Reform in Developing Countries,” Journal of Economic Perspectives 6, 1 (Winter).

20
Schmidt-Hebbel, K., L. Serven, A. Solimano (1996): ASaving and Investment: Paradigms, Puzzles,Policies,@ The World Bank Research Observer 11,1 (February).
Schwert, G. W. (1989): “Why Does Stock Market Volatility Change over Time?” The Journal ofFinance XLIV, 5 (December).
Vos, R. and J. T. Yap (1996): The Philippine Economy: East Asia’s Stray Cat? Structure, Finance and Adjustment. London: Macmillan Press Ltd.
The World Bank (1993). The East Asian Miracle: Economic Growth and Public Policy. New York: Oxford University Press.
Yap, J.T. (1998): “Beyond 2000: Assessment of Economic Performance and an Agenda for Sustainable Growth, Integrative Report. “ PIDS Discussion Paper Series No. 98-28.

21
Figure 1. A Theoretical Approach toFinance and Growth
Market Frictions--information costs--transactions costs
Financial markets andintermediaries
Financial functions--mobilize savings
--allocate resources--exert corporate control
--facilitate risk management--ease of trading of goods,
services, contracts
Channels to growth--capital accumulation
--technological innovation
Growth
Source: Financial Development and Economic Growth (Levine 1997)

22
TABLE 1
The Philippines, Selected Economic Indicators
1970-74 1975-79 1980-82 1983-85 1986-89 1990-92 1993-97
Income (growth rates)
Real GDP 5.4 6.2 4.1 -4.3 5.2 0.9 4.4
-Agriculture 2.8 4.5 2.8 -2.1 3.3 0.2 2.5
-Industry 8.0 7.9 4.0 -8.9 5.8 -0.5 5.3
-Manufacturing 7.9 5.2 2.6 -6.1 5.7 0.2 4.5
-Services 5.0 5.4 4.9 -1.1 5.6 1.8 4.7
Real GDP (%share)
-Agriculture 27.4 24.5 23.3 23.2 23.9 22.6 21.6
-Industry 35.3 39.6 40.7 38.0 35.2 34.9 35.2
-Manufacturing 28.0 27.9 27.2 25.5 25.2 25.4 25.0
-Services 37.4 35.9 36.0 38.8 40.9 42.5 43.2
External Sector
Degree of openness (% of GDP) a/ 40.5 41.6 53.7 48.7 58.7 70.3 97.2
Value of Exports (US$) 1583 3209 5510 5008 6364 8950 17615
Share of Manufactured Exports 8.6 24.4 41.0 51.1 60.7 72.1 80.7
Current Balance/GDP (%) 0.7 -5.3 -6.8 -4.1 -0.6 -3.3 -4.9
BOP/GDP (%) 1.8 -1.2 -2.4 0.6 1.9 1.8 0.8
Real Effec. Exchange Rate Index b/ 98.9 96.8 102.5 86.4 68.8 71.2 83.6
Public Sector
Public sector deficit/GDP c/ -8.4 -13.6 -5.4 -3.9 -2.9 -0.6
Monetary Sector
Money Supply-M3 (growth rate) 23.2 18.9 18.6 11.8 14.6 15.0 22.6
M3/GNP 24.3 29.1 29.0 25.9 24.9 27.7 36.9
Labor Sector
Unemployment rate (%) 5.6 7.5 8.9 11.2 10.4 9.5 9.1
Underemployment rate (%) d/ 13.4 11.6 26.3 30.8 24.6 21.8 21.2

23
Real wage (non-agricultural, pesos) 93.2 63.0 58.0 68.7 72.1 80.8 82.8
TABLE 1 (continued)
The Philippines, Selected Economic Indicators
1970-74 1975-79 1980-82 1983-85 1986-89 1990-92 1993-97
Sectoral employment (% share)
-Agriculture 52 52.1 51.6 50.0 47.6 45.3 43.3
-Industry 15.8 15.3 14.7 14.5 14.7 15.8 16.0
-Services 32.2 32.5 33.8 35.5 37.7 39.2 40.6
Prices
Inflation rate (%) 18.8 9.9 13.4 26.8 5.9 13.1 9.4
Internal terms of trade (% change) e/ 5.4 -1.4 -5.4 -0.7 -0.2 -1.4 -1.4
Population
Population growth rate (%) 2.8 2.7 2.6 2.5 2.4 2.6 1.8
GNP per capita (US$) 336 587 723 547 700 831 1070
Real pesos of 1985 10507 11642 12762 11641 10885 11559 11923
a/ Defined as the ratio of the sum of imports and exports of goods and services to GDP; both terms at constant pricesb/ Trade weighted real exchange ratec/ Includes general government, state-monitored corporations and Central bankd/ Defined as workers working less than 40 hours per weeke/ Ratio of implicit GDP deflator of agriculture to that of non-agriculture
Sources: NSO, National Income Accounts; NSO, Philippine Statistical Yearbook; Central Bank, Annual Report

24
TABLE 2Indices Of Average Labor ProductivityOverall, Agriculture and Manufacturing (1975=100)
1975 1980 1985 1990 1996
China overall 100 122 131 140 ...
Indonesia overall 100 a/ 126 131 148 204 b/
(1993 prices) agri 100 a/ 104 121 114 160 b/
mftg 100 a/ 155 194 242 310 b/
Malaysia overall 100 125 138 161 216(1978 prices) agri 100 133 158 201 281
mftg 100 104 118 143 181
Philippines overall 100 119 92 102 99(1985 prices) agri 100 117 100 109 108
mftg 100 119 96 108 100
Singapore overall 100 116 137 171 233(1985 prices) agri 100 114 194 177 288
mftg 100 115 128 171 272
Thailand overall 100 116 132 181 297(1988 prices) agri 100 101 113 118 234
mftg 100 121 133 178 210a/ 1976; b/ 1995Sources: Intal and Basilio, "The International Economic Environment and the PhilippineEconomy ", PIDS Discussion Paper (1998) ADB Key Indicators, 1988 & 1997
25
TABLE 3Selected Indicators, East Asian Economies
1980 1985 1990 1995 1997
Indonesia M2/GNP 13.7 24.8 45.5 52.8 61.1 Inflation 18.0 4.7 7.4 9.5 6.1 Savings/GNP 30.5 31.1 33.8 31.5 32.0 Investment/GNP 21.8 29.2 32.2 32.9 32.6 FDI (mil. US$) 746* 4348 5350
Malaysia M2/GNP 53.4 67.9 69.3 95.1 111.8 Inflation 6.7 0.3 2.6 5.3 2.7 Savings/GNP 34.2 35.2 34.9 41.5 46.7 Investment/GNP 31.6 29.7 32.7 45.7 45.1 FDI (mil. US$) 1605* 4132 3754
Philippines M2/GNP 22.8 26.8 34.2 49.0 59.0 Inflation 18.3 23.2 14.1 8.1 5.0 Savings/GNP 26.8 19.5 18.8 14.2 14.8 Investment/GNP 29.3 14.9 24.3 21.6 23.9 FDI (mil. US$) 501* 1459 1253
Thailand M2/GNP 38.5 59.6 70.7 80.6 92.7 Inflation 19.8 2.5 6.0 5.8 5.6 Savings/GNP 23.2 25.2 34.7 37.8 37.0 Investment/GNP 29.4 28.7 41.9 42.5 36.1 FDI (mil. US$) 1325* 2002 3600
China M2/GNP 37.4 58.5 78.9 104.0 120.8 Inflation 7.5 11.9 3.1 16.9 2.8 Savings/GNP 35.2 37.7 34.6 41.5

26
Investment/GNP 34.1 35.5 38.6 41.7 FDI (mil. US$) 3105* 35849 45300
TABLE 3 (continued)
Selected Indicators, East Asian Economies
1980 1985 1990 1995 1997
Korea M2/GNP 34.1 36.6 38.5 44.1 48.9 Inflation 28.7 2.5 8.6 4.5 4.5 Savings/GNP 24.8 34.7 36.4 37.1 35.7 Investment/GNP 33.0 30.6 37.2 37.4 35.4 FDI (mil. US$) 863* 1776 2341
Singapore M2/GNP 66.4 69.8 90.5 83.7 84.0 Inflation 8.5 4.1 3.5 1.7 2.0 Savings/GNP 40.2 39.2 45.3 49.9 48.7 Investment/GNP 48.1 41.0 35.7 33.4 36.4 FDI (mil. US$) 3592* 8210 10000
Sources: International Finance Statistics, IMF World Investment Report1998

28
TABLE 4Revealed Comparative AdvantagePhil Share/ World Share per industry
1980 1981 1982 1983 1984 1985 1986 1987 1988 1989 1990 1991 1992 1993 1994 1995Food manufactures 4.74 4.52 5.36 3.97 4.05 3.80 3.48 3.05 2.91 2.79 2.64 2.50 2.41 2.23 1.66 1.40Beverage industries 0.00 0.00 0.00 0.00 0.00 0.00 0.00 0.00 0.00 0.00 0.00 0.00 0.00 0.00 0.00 0.00Tobacco manufactures 1.39 2.05 1.88 1.58 1.34 1.29 1.07 0.72 0.62 0.57 1.14 1.41 0.60 0.42 0.31 0.25Textile manufactures 0.49 0.47 0.47 0.32 0.37 0.33 0.35 0.32 0.29 0.22 0.14 0.24 0.23 0.21 0.28 0.27Footwear and wearing app. 2.80 3.33 3.11 3.16 2.11 2.42 2.08 1.67 1.70 2.12 2.42 5.41 2.22 1.96 1.84 1.77Wood and cork prod. 6.11 6.60 6.38 6.98 5.72 5.27 4.89 3.69 3.21 2.67 1.84 2.09 1.26 0.81 0.81 0.73Furniture and fixtures 2.67 3.09 2.87 3.30 3.28 3.35 2.89 2.67 2.98 3.24 2.80 2.33 2.07 2.01 1.97 1.79Paper and paper prod. 0.00 0.00 0.00 0.00 0.00 0.00 0.00 0.00 0.00 0.00 0.11 0.12 0.14 0.12 0.11 0.08Publishing and printing 0.00 0.00 0.00 0.00 0.00 0.00 0.00 0.00 0.00 0.00 0.00 0.00 0.00 0.00 0.00 0.00Leather and leather prod. 0.00 0.00 0.00 0.00 0.00 0.51 0.52 0.47 0.50 0.76 0.91 1.06 0.85 0.70 0.79 0.93Rubber products 0.00 0.00 0.00 0.00 0.00 0.00 0.00 0.00 0.00 0.00 0.00 0.00 0.00 0.00 0.00 0.00Chemical & chemical prod. 0.14 0.19 0.19 0.20 0.25 0.56 0.86 0.63 0.47 0.46 0.42 0.46 0.31 0.26 0.24 0.20Petroleum and coal prod. 0.03 0.03 0.03 0.13 0.09 0.05 0.14 0.14 0.22 0.23 0.22 0.29 0.30 0.27 0.23 0.24Non-metallic mineral prod. 0.36 0.28 0.34 0.00 0.00 0.00 0.00 0.00 0.00 0.00 0.17 0.20 0.22 0.22 0.20 0.17Basic metal industries 3.21 2.62 2.05 1.95 1.44 2.01 1.96 1.28 1.53 1.35 1.45 1.23 1.10 0.86 0.77 0.74Metal industries 0.00 0.00 0.00 0.00 0.00 0.00 0.00 0.00 0.00 0.00 0.04 0.05 0.03 0.36 0.04 0.04Machinery exc. Electrical 0.00 0.00 0.00 0.00 0.00 0.00 0.00 0.00 0.00 0.00 0.00 0.00 0.00 0.00 0.00 0.00Electrical machinery 0.17 0.22 0.27 0.51 0.79 0.63 0.73 0.73 0.68 0.76 0.92 2.07 1.17 1.55 1.25 1.24Transport equipment 0.07 0.08 0.05 0.05 0.06 0.05 0.06 0.09 0.02 0.02 0.06 0.03 0.05 0.08 0.12 0.13Misc. manufactures 3.63 4.74 5.77 5.44 6.21 6.07 5.13 4.71 4.43 4.51 4.53 0.70 4.69 4.92 5.27 5.51Source of basic data: UN International Trade Statistics, 1980-1988, 1990-1995. Figures for 1989 were obtained by taking the averageof 1988 and 1990
29
TABLE 5Contribution to Trade Balance, 1980 - 1995
1980 1981 1982 1983 1984 1985 1986 1987 1988 1989 1990 1991 1992 1993 1994 1995Food 0.294 0.272 0.307 0.231 0.232 0.184 0.186 0.180 0.141 0.118 0.097 0.118 0.101 0.083 0.057 0.070Tobacco 0.001 0.003 0.002 -0.001 0.001 -0.007 -0.009 -0.012 -0.007 -0.004 0.001 0.001 -0.004 -0.003 -0.007 -0.003Textile -0.014 -0.018 -0.017 -0.029 -0.028 -0.035 -0.051 -0.051 -0.051 -0.052 -0.052 -0.089 -0.047 -0.040 -0.036 -0.033Wearing Apparel 0.048 0.061 0.055 0.063 0.046 0.057 0.060 0.066 0.063 0.074 0.085 0.226 0.088 0.073 0.069 0.062Leather 0.000 0.000 0.000 0.000 0.000 0.002 0.003 0.003 0.003 0.001 0.003 0.000 0.001 0.001 0.003 0.004Footwear 0.012 0.013 0.011 0.011 0.009 0.009 0.007 0.006 0.007 0.009 0.010 0.016 0.012 0.012 0.013 0.009Wood 0.082 0.072 0.062 0.078 0.062 0.055 0.055 0.056 0.051 0.037 0.021 0.025 0.012 0.006 0.009 0.006Furniture 0.014 0.016 0.013 0.017 0.017 0.019 0.020 0.024 0.028 0.026 0.024 0.021 0.019 0.017 0.018 0.016Paper -0.014 -0.013 -0.014 -0.014 -0.018 -0.019 -0.024 -0.022 -0.021 -0.018 -0.013 -0.015 -0.011 -0.012 -0.012 -0.015Printing -0.004 -0.003 -0.003 0.000 0.000 -0.002 -0.003 -0.004 -0.003 -0.003 -0.002 -0.005 -0.003 -0.003 -0.003 -0.003Chemicals -0.077 -0.075 -0.075 -0.075 -0.079 -0.080 -0.088 -0.083 -0.082 -0.069 -0.062 -0.064 -0.057 -0.054 -0.050 -0.050Petroleum -0.299 -0.319 -0.276 -0.268 -0.265 -0.289 -0.171 -0.184 -0.124 -0.132 -0.130 -0.131 -0.117 -0.097 -0.079 -0.079Rubber -0.003 -0.002 -0.004 0.000 0.000 0.000 0.000 0.000 0.000 -0.004 -0.003 -0.002 -0.004 -0.004 -0.004 -0.004Plastics -0.013 -0.013 -0.016 -0.022 -0.016 -0.013 -0.023 -0.024 -0.022 -0.022 -0.025 -0.030 -0.023 -0.024 -0.026 -0.026Non-metals 0.001 0.003 0.003 0.000 0.000 0.000 0.000 0.000 0.000 -0.006 -0.001 0.003 -0.001 0.002 0.002 0.000Basic Metals 0.142 0.109 0.042 0.055 0.046 0.082 0.056 0.014 0.022 0.018 0.009 -0.017 -0.021 -0.034 -0.031 -0.043Fabricated -0.013 -0.015 -0.018 -0.016 -0.007 -0.011 -0.007 -0.005 -0.006 -0.006 -0.006 -0.008 -0.007 -0.013 -0.013 -0.006Machinery -0.125 -0.104 -0.123 -0.112 -0.065 -0.067 -0.073 -0.075 -0.082 -0.096 -0.102 -0.070 -0.101 -0.113 -0.109 -0.100Electrical -0.032 -0.035 -0.034 -0.014 -0.001 0.003 0.010 0.018 0.015 0.018 0.024 0.041 0.035 0.086 0.061 0.052Transport -0.061 -0.051 -0.034 -0.033 -0.035 -0.006 -0.006 -0.008 -0.039 -0.048 -0.062 -0.055 -0.058 -0.084 -0.074 -0.067Prof. Scientific -0.007 -0.006 -0.009 -0.010 -0.007 -0.009 -0.009 -0.008 -0.008 -0.008 -0.008 -0.001 -0.008 -0.010 -0.008 -0.009Misc. Manu. 0.067 0.105 0.127 0.137 0.106 0.127 0.067 0.109 0.116 0.167 0.193 0.036 0.194 0.211 0.221 0.220Source of basic data: UN International Trade Statistics, 1980-1988, 1990-1995. Figures for 1989 were obtained by taking the averageof 1988 and 1990

30
TABLE 6Share to Total Exports, 1980 – 1995
1980 1981 1982 1983 1984 1985 1986 1987 1988 1989 1990 1991 1992 1993 1994 1995Food 34.78 33.23 41.96 29.16 29.30 25.64 25.24 22.73 21.10 19.07 17.32 16.90 15.94 14.40 10.65 12.14Tobacco 0.50 0.84 0.93 0.67 0.53 0.52 0.43 0.32 0.27 0.26 0.60 0.79 0.34 0.23 0.17 0.12Textile 1.30 1.22 1.24 0.84 0.98 0.85 0.97 1.11 0.95 0.67 0.43 0.78 0.74 0.65 0.87 0.82Wearing App. 4.68 5.90 5.89 6.14 4.36 5.39 5.68 6.21 5.92 6.93 8.32 21.25 8.59 7.50 6.66 6.06Leather 0.00 0.00 0.00 0.00 0.00 0.21 0.24 0.28 0.30 0.42 0.53 0.62 0.54 0.47 0.56 0.63Footwear 1.16 1.28 1.24 1.10 0.86 0.84 0.64 0.55 0.64 0.81 0.95 1.52 1.19 1.25 1.30 0.88Wood 7.94 6.96 6.68 7.69 5.95 5.24 5.17 5.32 4.81 3.49 2.36 2.61 1.55 1.10 1.08 0.88Furniture 1.33 1.53 1.43 1.67 1.64 1.81 1.85 2.28 2.60 2.45 2.31 2.02 1.84 1.79 1.78 1.58Paper 0.00 0.00 0.00 0.00 0.00 0.00 0.00 0.00 0.00 0.00 0.26 0.29 0.31 0.25 0.23 0.19Printing 0.00 0.00 0.00 0.00 0.00 0.00 0.00 0.00 0.00 0.00 0.00 0.00 0.00 0.00 0.00 0.00Chemicals 0.42 0.50 0.60 0.72 1.00 2.33 4.12 3.35 2.64 2.45 2.28 2.56 1.59 1.32 1.28 1.13Petroleum 0.63 0.55 0.64 2.21 1.53 0.74 1.27 1.65 2.04 2.13 2.21 2.63 2.42 2.01 1.59 1.50Rubber 0.00 0.00 0.00 0.00 0.00 0.00 0.00 0.00 0.00 0.00 0.00 0.00 0.00 0.00 0.00 0.00Plastics 0.19 0.32 0.19 0.19 0.17 0.59 0.63 0.69 0.71 0.63 0.57 0.67 0.71 0.63 0.58 0.62Non-metals 0.65 0.41 0.50 0.00 0.00 0.00 0.00 0.00 0.00 0.00 0.31 0.37 0.41 0.42 0.38 0.32Basic Metals 20.99 15.37 11.87 10.80 7.82 10.99 10.13 7.32 10.18 9.04 8.06 6.72 5.37 4.03 3.63 3.82Fabricated 0.00 0.00 0.00 0.00 0.00 0.00 0.00 0.00 0.00 0.00 0.04 0.06 0.04 0.43 0.05 0.04Machinery 0.00 0.00 0.00 0.00 0.00 0.00 0.00 0.00 0.00 0.00 0.84 3.73 1.97 1.89 1.73 2.53Electrical 0.92 1.44 1.83 3.90 6.85 5.62 7.30 8.38 8.39 8.89 10.08 22.41 13.35 20.29 17.42 17.39Transport 0.52 0.57 0.38 0.46 0.49 0.46 0.63 0.99 0.20 0.23 0.59 0.31 0.55 0.85 1.23 1.20Prof. Scientific 0.34 0.36 0.23 0.00 0.00 0.00 0.00 0.00 0.00 0.00 0.00 0.71 0.00 0.00 0.00 0.00Misc. Manu. 18.00 23.63 28.65 28.17 33.26 32.87 29.91 32.78 32.85 33.96 34.91 4.11 35.61 39.21 39.65 41.80Source of basic data: UN International Trade Statistics, 1980-1988, 1990-1995. Figures for 1989 were obtained by taking theaverage of 1988 and 1990Note: Breakdown of Misc. Manufactures: Toys, sporting goods, etc., gold, silver ware, jewelry, musical instruments, othermanufactured goods special transactions gold, non monetary nes.

31
TABLE 7Estimation of Equation 1
Estimation of Equation 1Using Growth Rate of Labor Productivity
Dependent Variable: RCA?Method: GLS (Cross Section Weights)Sample: 1981 1995Included observations: 15Total panel (balanced) observations 165Cross sections without valid observations dropped
Variable Coefficient Std. Error t-Statistic Prob.
C 0.169304 0.073901 2.290947 0.0233GLP? -0.001219 0.000559 -2.180934 0.0306
RELP? -3.826360 2.255614 -1.696372 0.0918K? -3.44E-05 1.77E-05 -1.947312 0.0532
RCA?(-1) 0.929035 0.016572 56.06052 0.0000
Weighted Statistics
R-squared 0.909251 Mean dependent var 1.795564
Adjusted R-squared 0.906983 S.D. dependent var 1.396951
S.E. of regression 0.426053 Sum squared resid 29.04335
Log likelihood 83.07333 F-statistic 400.7776
Durbin-Watson stat 2.332512 Prob(F-statistic) 0.000000
Estimation of Equation 1Using Growth Rate of TFP (Growth Accounting Approach)
Dependent Variable: RCA?
Method: GLS (Cross Section Weights)Sample: 1981 1995
Included observations: 15
Total panel (balanced) observations 180
Variable Coefficient Std. Error t-Statistic Prob.
C 0.131304 0.084445 1.554896 0.1218
TG? 0.144839 0.095450 1.517425 0.1310
RELP? -2.746532 2.570912 -1.068310 0.2869
K? -3.64E-05 1.94E-05 -1.877880 0.0621
RCA?(-1) 0.931458 0.015758 59.11175 0.0000

32
Weighted Statistics
R-squared 0.915674 Mean dependent var1.541699
Adjusted R-squared 0.913746 S.D. dependent var1.272487
S.E. of regression 0.373717 Sum squared resid24.44122
Log likelihood 91.13248 F-statistic475.0681
Durbin-Watson stat 2.308555 Prob(F-statistic)0.000000
Estimation of Equation 1Using Growth Rate of TFP (Stochastic Approach)
Dependent Variable: RCA?
Method: GLS (Cross Section Weights)
Date: 11/19/98 Time: 11:36
Sample: 1981 1995
Included observations: 15
Total panel (balanced) observations 180
Variable Coefficient Std. Error t-Statistic Prob.
C -0.060769 0.195637 -0.310623 0.7565
TS? 20.13391 17.27408 1.165556 0.2454
RELP? -2.237510 2.451574 -0.912683 0.3627
K? -3.31E-05 1.79E-05 -1.844362 0.0668
RCA?(-1) 0.927263 0.016447 56.38029 0.0000
Weighted Statistics
R-squared 0.903338 Mean dependent var1.707719
Adjusted R-squared 0.901128 S.D. dependent var1.330213
S.E. of regression 0.418271 Sum squared resid30.61633
Log likelihood 107.3332 F-statistic408.8559
Durbin-Watson stat 2.285064 Prob(F-statistic)0.000000
Variable Definitions:RCA? - revealed comparative advantage by sector (indexed by ?)GLP? - growth rate of labor productivity by sector (indexed by ?)TG? - growth rate of total factor productivity by sector (indexed by ?) using growth accountingapproachTS? - growth rate of total factor productivity by sector (indexed by ?) using stochastic approachRELP? - relative price per sector; defined as Pi/P* where Pi is the implicit price index of sector i and P* isthe price index of non-oil imports. P* is not available on a sectoral basis.K? - capital stock by sector

33
Table 8Estimation of Equation 2
Estimate of Equation 2 Using REER Volatility
Dependent Variable: INVA?
Method: GLS (Cross Section Weights)
Date: 11/19/98 Time: 12:48
Sample: 1981 1995
Included observations: 15
Total panel (balanced) observations 180
Variable Coefficient Std. Error t-Statistic Prob.
C 0.006326 0.003867 1.635895 0.1037
SIGMA -1.84E-05 0.000693 -0.026515 0.9789
M3GNP 0.000306 0.000121 2.524540 0.0125
FDIGDP -0.002243 0.000979 -2.291524 0.0231
REER -0.000137 5.01E-05 -2.729968 0.0070
INVA?(-1) 0.730557 0.053361 13.69080 0.0000
Weighted Statistics
R-squared 0.534363 Mean dependent var0.016618
Adjusted R-squared 0.520983 S.D. dependent var0.020799
S.E. of regression 0.014396 Sum squared resid0.036058
Log likelihood 816.4368 F-statistic39.93638
Durbin-Watson stat 2.509469 Prob(F-statistic)0.000000
Estimate of Equation 2 Using Inflation as Volatility Measure
Dependent Variable: INVA?Method: GLS (Cross Section Weights)Date: 04/29/99 Time: 11:49Sample: 1981 1995Included observations: 15Total panel (balanced) observations 180
Variable Coefficient Std. Error t-Statistic Prob.
C 0.007200 0.003515 2.048365 0.0420INFL -3.76E-05 3.63E-05 -1.034215 0.3025
M3GNP 0.000267 0.000126 2.120790 0.0354FDIGDP -0.002290 0.000914 -2.505885 0.0131REER -0.000127 4.97E-05 -2.558213 0.0114
INVA?(-1) 0.718011 0.054607 13.14881 0.0000

34
Weighted Statistics
R-squared 0.490294 Mean dependent var 0.016001
Adjusted R-squared 0.475647 S.D. dependent var 0.019529
S.E. of regression 0.014141 Sum squared resid 0.034796
Log likelihood 816.6738 F-statistic 33.47463
Durbin-Watson stat 2.512686 Prob(F-statistic) 0.000000
Variable Definitions:
INVA? - investment per sector as a ratio to sectoral value added (indexed by ?)SIGMA - measure of exchange rate volatilityM3GNP - ratio of total domestic liquidity to GNPFDIGDP - ratio of foreign direct investment to GDPREER - real effective exchange rate (1980 =100), an increase in REER implies an appreciationINFL - inflation rate

35
TABLE 9Values of EDR
ISIC Code Industrial SectorsExternal
Dependence
314 Tobacco -0.45361 Pottery -0.15323 Leather -0.14
3211 Spinning -0.09324 Footwear -0.08372 Non-ferrous metal 0.01322 Apparel 0.03353 Petroleum refineries 0.04369 Non metal products 0.06313 Beverages 0.08371 Iron and Steel 0.09311 Food products 0.14
3411 Pulp, paper 0.153513 Synthetic resins 0.16341 Paper and products 0.18342 Printing and publishing 0.20352 Other chemicals 0.22355 Rubber products 0.23332 Furniture 0.24381 Metal Products 0.24
3511 Basic exclud fert 0.25331 Wood products 0.28384 Transportation equipment 0.31354 Petroleum and coal products 0.33
Source: Rajan, R. And L. Zingales, "Financial Dependence and Growth"
36
TABLE 10Estimates of Spearman RankCoefficient
Year EDR, RCA EDR, GLP
1981 0.121 0.0461982 0.121 -0.3801983 0.288 0.2041984 0.288 -0.1651985 0.099 -0.3011986 0.099 0.2001987 0.099 0.3271988 0.110 0.4291989 0.143 0.5121990 -0.058 0.2221991 -0.162 -0.3011992 -0.102 0.4421993 -0.052 -0.2351994 0.080 0.0771995 -0.190 0.209
Note:EDR - External Dependence RatioRCA - Revealed Comparative AdvantageGLP - Growth rate of Labor Productivity