Embed Size (px)
Citation preview

New Measures of Trade Creation and Trade Diversion
by
Christopher S. P. Magee*
Abstract
This paper uses a panel data set to estimate the effects of regional agreements on trade flows
controlling for country pair, importer-year, and exporter-year fixed effects. These fixed effects capture all
of the determinants of trade flows normally included in gravity model specifications as well as controlling
for yearly shocks that affects countries’ trade levels. In most cases, controlling for the fixed effects
greatly reduces the estimated impact of regional agreements on trade. The estimates reveal that the
average regional agreement has significant anticipatory effects on trade flows and continues to affect
trade for up to 11 years after the trade deal begins. Customs unions influence trade over a longer period
of time than do free trade areas. Finally, the paper shows that a trade agreement often has very different
impacts on each of the countries involved and presents estimated trade effects for individual countries in
year five of the agreements.
JEL Classification: F15
* Department of Economics, Bucknell University, Lewisburg, PA 17837; [email protected]; phone (570) 577-1752; fax (570) 577-3451. I am indebted to helpful suggestions from Jonathan Eaton, Amy Wolaver, Steve Magee, Carsten Kowalczyk, Scott Baier, and participants at the Midwest International Economics Meetings.
1
1. Introduction
Since Jacob Viner (1950) described how the welfare effects of a regional trade agreement (RTA)
depended on the trade creation and trade diversion generated, economists have been interested in
estimating these two effects. Empirical work estimating these effects is particularly important since
theoretical work suggests that regional agreements may be beneficial or harmful depending on the
particular countries involved and the extent of trade creation relative to trade diversion (see Panagariya
(2000) for a survey). As Burfisher, Robinson, and Thierfelder (2001, 139) put it, “whether or not a
regional trade agreement benefits its members will depend on parameter values and initial economic
structure – it is essentially an empirical issue that must be settled by data analysis.”
Because of data limitations, most studies do not attempt to measure the welfare effects of regional
agreements, but instead take the first step down that path by estimating the impacts of the agreements on
trade flows. Existing studies estimate changes in trade patterns due to regionalism in two distinct ways.
Ex post studies examine trade flows after the RTA has been implemented and compare the actual levels
of trade with a prediction of trade in the absence of the RTA. Ex ante studies use trade patterns and
estimated elasticities or computable general equilibrium models prior to the agreement to calculate the
predicted effect of eliminating trade barriers with a partner country.
Both methods as currently implemented, however, are subject to criticism. As Panagariya (2000,
325) explains, “there are sufficiently serious problems with both empirical approaches that the results
based on them are unlikely to change the minds on either side of the regionalism debate.” Ex post studies
must establish a counterfactual of trade that would have occurred in the absence of the agreement, but
Clausing (2001, 679) comments that this exercise “has proved difficult.” One common way of predicting
trade flows in the absence of the RTA is by using the gravity model to predict bilateral trade based on the
distance between countries, the size of their economies, and other variables such as whether the two
countries speak the same language. The effects of the agreement on trade are then measured by RTA
dummy variables.
2
There are a number of weaknesses inherent in such an approach, however. First, Wonnacott and
Lutz (1989) and Krugman (1991) have proposed a “natural trading partner” hypothesis that countries will
tend to form regional agreements if they already have significant bilateral trade, and that such agreements
are likely to be trade creating. Magee (2003) uses a simultaneous equations model to show empirically
that higher bilateral trade flows do increase the likelihood that countries will form free trade agreements.
Thus, coefficients on RTA dummy variables are capturing more than just the effects of the agreement;
they also incorporate the possibility that “high levels of intra-bloc trade may be due not to the formation
of preferential trading arrangements but rather to historical or political relationships between bloc
members” (Haveman and Hummels, 1998, p. 62). Soloaga and Winters (2001) make a similar argument.
Bayoumi and Eichengreen (1995) attempt to deal with this criticism by estimating the gravity model in
first differences so that unobserved country pair characteristics that are constant over time will drop out.
This method will not control for time-varying omitted variables, however, as Haveman and Hummels
(1998) point out.
Gravity model estimates of RTA effects are also sensitive to the sample of countries included in
the analysis. Haveman and Hummels (1998, 52) show that changing the sample of countries results in a
different prediction of trade in the absence of the RTA, and thus estimates of RTA effects “vary
dramatically in their conclusions.” Pomfret (1997, 254) also cites a number of “implausible results” in
studies using the gravity model to measure the trade effects of RTAs and concludes that “there are clearly
shortcomings” in this approach. More recently, Ghosh and Yamarik (2004) argue that the gravity-model
results are very sensitive to the variables included in the regressions and to the prior beliefs of the
researchers. They find a dramatic drop in the number of regional agreements that are trade creating when
they incorporate the researcher’s prior beliefs into the estimation.
Ex ante studies of trade creation and diversion fall into two camps. Some studies, such as
Karemera and Ojah (1998) estimate import demand elasticities within industries prior to the formation of
a trade agreement. These elasticities are then used to project the effects of eliminating tariffs with a
trading partner. Wylie (1995) criticizes this approach, however, as missing important general equilibrium
3
impacts of trade agreements. As he argues (p. 81), “the tariff changes, substitution elasticities, and
resulting macroeconomic stimulative effects themselves are probably of less potential importance in
stimulating trade and growth than the reduced uncertainty” of the policy environment.1 An alternative is
to estimate computable general equilibrium models of trade, as Brown, Deardorff, and Stern (1992) have
done. Clausing (2001) and Wylie (1995) both point out that CGE estimates are very sensitive to the
assumptions and parameters built into the model, however. The net result is that “the empirical work has
failed to reach firm conclusions on even the most basic issue regarding preferential trading agreements:
whether trade creation outweighs trade diversion.” (Clausing, 2001, 678)
This paper estimates the effect of regional agreements on trade flows after controlling for country
pair, importer-year, and exporter-year fixed effects. This estimation technique is similar in principle to
the ex post studies described above in that the method is to compare existing levels of trade under an RTA
to a hypothesized counterfactual level of trade in the absence of the RTA. The predicted counterfactual
used in this paper, however, eliminates many of the criticisms of gravity model studies. First, the
estimation includes an importer-exporter fixed effect that controls for unobserved reasons why two
countries may have historically had high levels of bilateral trade. Thus, the method adopted in this paper
solves the problem that countries forming RTAs may have higher trade volumes even in the absence of
the agreement. Year fixed effects for each importing and exporting country are also included to capture
the effects of importer and exporter changes in output, income per capita, population, and other variables
included in gravity model specifications. The fixed effects are more flexible, however, in that they also
capture any aggregate shocks to the countries’ trade flows in a given year. Controlling for aggregate
shocks is particularly important since Krueger (1999) concludes that NAFTA did not have a large effect
on trade in the first three years of its existence relative to the impacts of shocks such as the “tequila crisis”
1 This argument is consistent with testimony at 1997 ITC hearings on NAFTA by executives who indicated that
NAFTA’s tariff reductions were less important than its investment guarantees and other provisions (U.S.
International Trade Commission, 1997, page 2-29).
4
and cuts in Mexican nontariff barriers prior to NAFTA. Finally, the use of fixed effects eliminates the
need to choose which variables to include as controls in the regression, and thus it alleviates the criticism
of Ghosh and Yamarik (2004) that the researcher’s prior beliefs are influencing the results presented. The
models estimated in the paper also allow regional agreements to have different impacts on trade flows
over time so that the dynamic effects of trade deals can be measured.
The new estimates in this paper reveal several interesting results. First, regional agreements have
a clear anticipatory effect on trade flows – there is a significant increase in trade during the four years
leading up to the beginning of the average RTA. The change in bilateral trade also continues to be
influenced by the formation of a regional agreement for many years after its start – the estimates here find
significant positive effects of RTAs on bilateral trade flows up to 11 years after the agreement begins.
This dynamic analysis of regionalism is an advance over most previous measures of RTA trade effects,
which have been primarily static cross-section estimates that do not consider the maturity of the trade
deal. The paper also shows that the type of agreement signed changes both the overall trade effect and the
time path of trade effects. On average, a customs union (CU) has long-lasting impacts on intra-bloc trade
while a free trade agreement (FTA) has shorter and, in the long-run, smaller impacts on trade within the
region. Preferential trading arrangements have the smallest effects on trade flows, and these effects do
not begin until several years after the trading bloc forms. For countries joining a new regional agreement,
intra-bloc trade effects amount to less than 3 percent of the country’s total imports on average in year five
of the trade deal. Estimates of the trade diverting effects of regional agreements are much smaller and are
sensitive to the specification of the model. Finally, the paper uses predicted values from the regressions
and actual trade flows to show separate measures of the effect of an agreement on each country’s imports.
The results indicate that the impacts on each country differ greatly even within a common regional
agreement.
2. Data and Empirical Methods
5
The trade flow data used in this study come from Statistics Canada’s World Trade Analyzer data
set, which provides bilateral trade flows (measured in millions of 1998 dollars) for each year from 1980 to
1998 between 133 countries that are members or observer governments of the WTO. The WTO provides
a list of the regional agreements about which they have been notified at www.wto.org and it classifies
each agreement as a customs union, free trade agreement, or “preferential arrangement.”
The gravity model introduced by Tinbergen (1962) has long been the most prominently used
method of measuring the trade effects of regional trade agreements. The simplest form of the gravity
model assumes that trade between two countries depends on the distance between them and the size of the
countries’ economies. The effects of regional agreements are then measured by including dummy
variables for each RTA. Most researchers also include some other variables presumed to affect bilateral
trade such as the countries’ populations or income levels and whether the countries are landlocked, share
a common border, speak the same language, and have a colonial tie. Thus, a typical gravity model
specification is
(1) ijtijtk
kijt
ktd
kijt
krtajtitijtijt X)TDRTA()Yln()Yln()ln(D)mln( ε+α+β+β+β+β+β+α= ∑321 ,
where ijtm is the trade flow from country i to j in year t, ijD is the bilateral distance, itY and jtY are the
GDP levels of the two countries, 1=kijtRTA if countries i and j belong to regional trade agreement k,
1=kijtTD if one of the two countries is a member of regional agreement k, and ijtX is a vector of other
dyad characteristics. A positive coefficient estimate of krtaβ indicates that trade is rising between
members of the regional bloc while a negative coefficient estimate of ktdβ suggests imports from
countries outside the trading bloc are falling. Including fixed effects for each year ( tα in equation 1)
captures the time trend in trade and any shocks that affect global trade flows in a particular year.
Santos Silva and Tenreyo (2006) discuss several problems with estimating equation (1) by
ordinary least squares. First, when there is heteroskedasticity, OLS estimation of the log-linearized
6
gravity model provides biased estimates. Second, trade values can be zero. Since the natural log of zero
is undefined, the researcher must either drop the country pairs with no trade (the most common solution),
estimate the model using )mln( ijt+1 as the dependent variable, or set up a nonlinear estimator. Santos
Silva and Tenreyo show that a Poisson pseudo-maximum likelihood estimator of the gravity model
provides consistent estimates of the parameters even with heteroskedastic errors, is robust to measurement
error in the dependent variable, and allows the country pairs with no trade to be included in the analysis.
A separate problem with estimating equation (1) is that a pair of countries with strong cultural
and historical ties is likely to have greater than normal trade and is also more likely to form a regional
trade agreement. Thus, the error term is correlated with the RTA dummy variables and the coefficient
estimates are biased. Including variables such as whether the countries speak the same language and have
a common colonial relationship is one way researchers have attempted to address this issue, but there
remain many unobserved ties between nations that both increase trade and make regional agreements
more likely. An alternative method of dealing with unobserved country-pair characteristics that affect
trade flows is to include a fixed effect for each dyad ( ijα ). This fixed effect will capture the impact on
trade of any factors that are specific to the country pair but constant over the time period being examined
(such as distance, sharing a border, being landlocked or an island, having a common language, and any
other unobserved historical or cultural ties). Equation (1) thus becomes:
(2) ijtijtk
kijt
ktd
kijt
krtajtittijijt X)TDRTA()Yln()Yln()mln( ε+α+β+β+β+β+α+α= ∑32 .
Equations (1) and (2) estimate RTA trade effects by using the group of countries signing regional
agreements as the treatment group and using country pairs that do not have an RTA as the control group.
This estimation method assumes that RTA formation is uncorrelated with the error term. In the typical
gravity model without country pair fixed effects (equation 1), this assumption means that the level of
trade between two countries has no impact on whether they form a regional agreement. By including
country pair fixed effects, the error term in equation (2) measures differences between actual imports and
a predicted level of imports that controls for any historical, time-constant factors affecting the level of
7
trade between partner countries. Assuming that RTA formation is exogenous in the context of equation
(2), then, means that countries do not sign regional agreements in order to take advantage of a big
anticipated increase in trade, a much more plausible assumption than that the level of bilateral trade is
uncorrelated with the decision to sign a trade deal.
While the treatment of regional trade agreements in equations (1) and (2) is consistent in principle
with most previous studies of regionalism, they make an implicit assumption that is often not recognized:
that trade flows jump immediately to a new long-run equilibrium when a new regional agreement is
implemented and then remain unchanged after the first year the RTA is in place. This assumption rules
out the possibilities that anticipation of the agreement may influence trade flows and that the effects of the
agreement may materialize slowly over time. As Frankel (1997, 78) argues, however, “There is a
tendency for trade flows to be affected in advance of the date when the agreement goes into effect, as
businesses position themselves for future markets.” The fact that regional agreements often have a
gradual reduction in tariffs over time rather than eliminating trade barriers immediately also makes it
unrealistic to assume that the trade effects of RTAs are immediate.
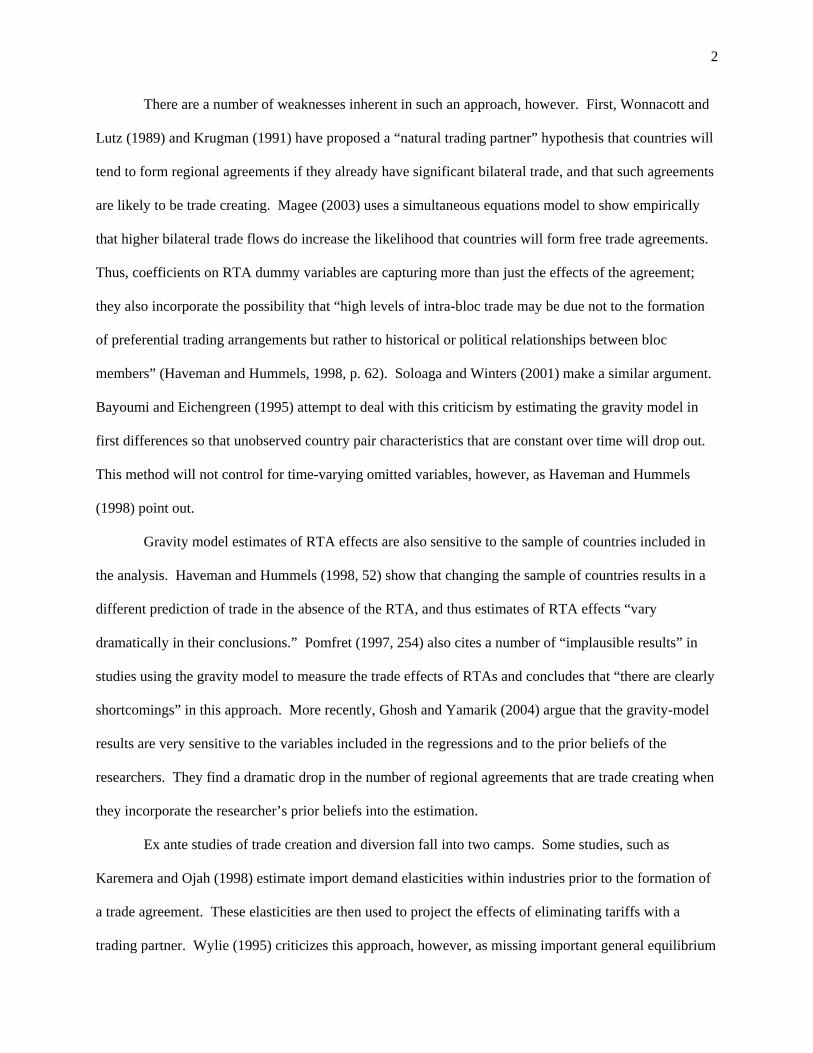
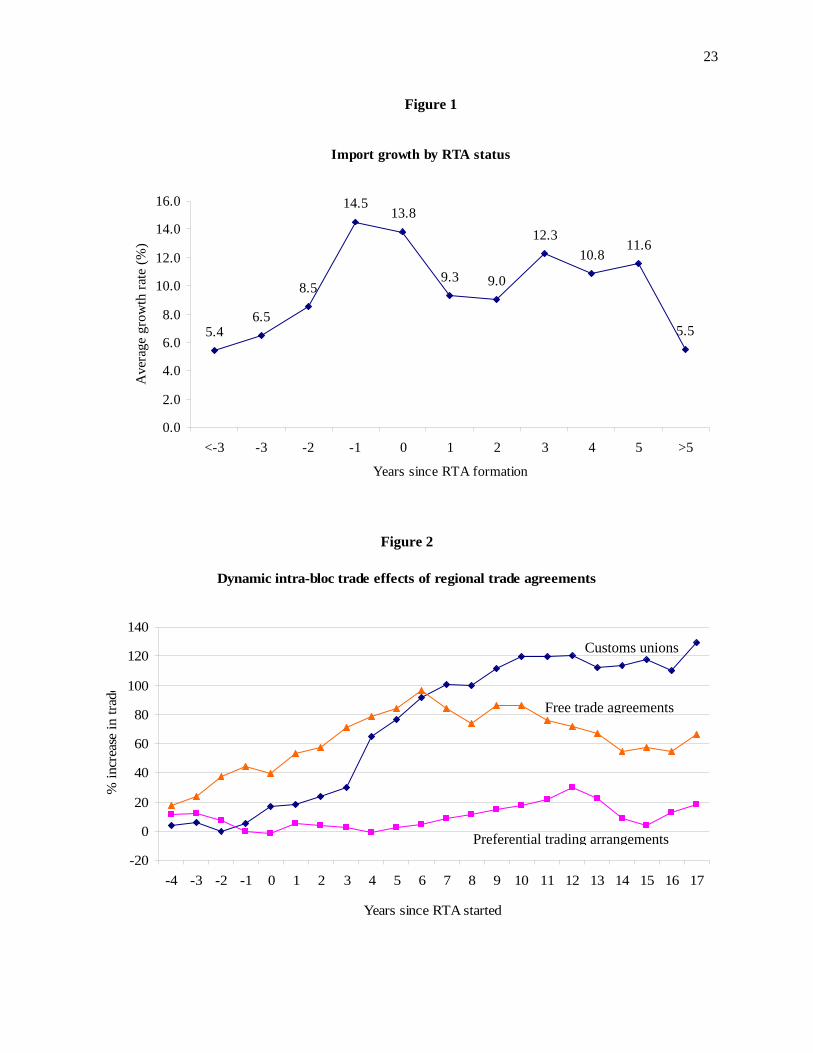
Figure 1 uses the sample average growth rates of trade in the data set to show how rapidly trade
was increasing during 1980 – 1998 for country pairs in various stages of regional trade agreement
formation. Time period 0 in the graph is the year the RTA came into effect, while period –1 is the year
prior to the RTA’s formation and period 1 indicates the year after RTA formation. The anticipation effect
of a regional agreement on trade flows is clearly visible. Trade growth rates within the new trading bloc
begin increasing sharply about two years before trade deals go into effect, with the growth during the two
years prior to the enactment of the deal being comparable to the growth rates after the agreement comes
into force.
The figure also shows that trade within regional trade blocs grew more rapidly than trade outside
of regional trading areas. Trade among countries that formed regional agreements grew at rates above 9.8
percent per year in each of the first six years after the trade bloc was formed. Trade within regional blocs
overall grew by 6.7 percent per year between 1980 and 1998 compared to 5.7 percent growth among
8
countries without regional agreements. The results in Figure 1 are consistent with those in Freund and
McLaren (1999), who find that trade patterns of countries joining the EU began to change about 3-4 years
prior to accession and continued for about eight or nine years after accession. The authors also found
anticipatory effects of the regional agreement on trade patterns for MERCOSUR countries.
Equation (2) can be modified to allow regional trade agreements’ effects to vary over time, both
before and after the trade deals begin. In order to focus on the dynamics of regional agreements, suppose
that each regional agreement generates the same percentage change in bilateral trade but that these
impacts can vary over time. The dynamic version of equation (2) then becomes:
(3) ijtijts
)st(ijs,td)st(ijs,rtajtittijijt X)TDRTA()Yln()Yln()mln( ε+α+β+β+β+β+α+α= ∑−=
−−
17
432 ,
where s,rtaβ and s,tdβ are the intra-RTA and extra-RTA effects in year s of the average trade deal.
Equation (3) thus measure the effects of a regional agreement on trade flows from four years prior to its
start up to the 18th year it is in existence ( 0=s is the first year of the RTA). The trade diversion variable
in equation (3), ∑ −− =k
k)st(ij)st(ij TDTD , equals the number of preferential trading partners (other than
each other) that countries i and j have in year t-s. Using this definition, the coefficient s,tdβ captures the
effect on bilateral trade between i and j if one of the countries signs a new regional agreement with a third
party.
Equation (3) treats importers and exporters symmetrically in that a new regional agreement with a
third country is assumed to have the same impact on trade flows from i to j whether the new RTA is
signed by the importing country j or the exporter i. Defining the trade diversion variable to include the
number of other preferential trading partners for both the importing and the exporting country allows the
coefficient s,tdβ to capture what Soloaga and Winters (2001) refer to as “export diversion.” They argue
that a regional agreement that reduces a country’s imports from outside the trading bloc will also reduce
9
its exports to those countries. These authors find evidence of export diversion in two (EU and EFTA) of
the nine regional trade agreements they examine.
Equations (1) – (3) suffer from the problem, common in gravity-model specifications, that time-
specific shocks to a country’s bilateral trade flows are not controlled for. As long as these shocks are
unrelated to the country’s decisions to form regional agreements, the coefficient estimates will not be
biased. Controlling for such shocks would, however, improve the accuracy of the estimates. A simple
way to deal with the many factors affecting trade flows that are specific to the importer or exporter in a
particular year is to include exporter-year ( itα ) and importer-year ( jtα ) fixed effects in the model of
bilateral trade.
(4) ijts
)st(ijs,rtaitjtijijt RTA)mln( ε+β+α+α+α= ∑−=
−
17
4.
Equation (4) can not include the trade diversion variables, and this represents a significant
drawback of including exporter-year and importer-year fixed effects. The fixed effect jtα captures the
change in country j’s overall imports in year t. Controlling for the country’s change in overall imports, it
is not possible to measure both the change in within-RTA imports and the change in extra-RTA imports
since the latter two add up to the change in total imports. Thus, one advantage of the gravity model
specification omitting exporter-year and importer-year fixed effects is that it allows the estimation of both
intra-RTA and extra-RTA effects of regional agreements. In other ways, however, equation (4) greatly
improves on the typical gravity model specification. The country pair fixed effect ( ijα ) controls for the
impact on trade of the distance between countries, a common language, pre-existing regional trade
agreements, colonial status or other historical ties between the countries, and any unobserved
characteristics of the country pair that are constant over time. The effects on trade of not only GDP and
population but also other variables that are more difficult to measure such as infrastructure, factor
endowments, multilateral trade liberalization or openness, and unobserved time-specific shocks are
captured by the importer-year and exporter-year fixed effects. Equation (4) thus controls for nearly every
10
variable included in gravity models, plus many unobserved factors, and it does so without forcing upon
researchers a difficult choice about which of the many possible variables they should include. This last
advantage is a considerable one since Ghosh and Yamarik (2004, 372) argue that model choice has led to
a consensus in the literature that “reflects not the information content of the data but rather the
unacknowledged prior beliefs of the researchers.”
Taking the first difference of equation (4) eliminates the over 18,000 country pair fixed effects.
(5) ijts
)st(ijs,rtaitjtijt RTAm εΔ+Δβ+α+α=Δ ∑−=
−
17
4
In equation (5), 1=Δ − )st(ijRTA if countries i and j sign a new regional agreement in year t-s and
0=Δ − )st(ijRTA in all other years. The coefficient s,rtaβ is thus a difference-in-differences estimator. It
is estimated by comparing the change in trade between countries signing an RTA and the change in trade
between countries that do not begin a new regional agreement with each other. Equation (5) is similar to
the econometric model in Bayoumi and Eichengreen (1995), who estimate a gravity model in first
differences. There are several important differences between this study and theirs, however. First, they
do not control for unobserved time-specific effects through exporter-year and importer-year fixed effects.
Second, Bayoumi and Eichengreen examine trade among only 21 industrial countries whereas this study
uses a much larger data set of 133 advanced and developing countries. They also do not investigate the
dynamic path of regional agreement trade effects as this paper does.
In order to examine how a regional agreement has affected the imports of a particular country, it
is possible to compare the actual level of trade with several counterfactual predicted levels of trade based
on the estimates in equation (2). Wooldridge (2006) discusses two different ways of getting consistent
predictions of imports when )mln( is the dependent variable. In the data set used here, one of these
methods underpredicts imports on average while the other overpredicts the level of trade. The predicted
level of imports used in this paper is a weighted average of these two consistent predictions, where the
weights are chosen so that the predicted global imports in the data set matches the actual imports on
11
average ( mm̂ = ). Setting 0=kijtRTA and 0=k
ijtTD in equation (2) then provides a prediction of the
imports a country could have received in the absence of the agreement, kijtm̂ . The effect of the regional
agreement on country j’s imports in year t is measured by the difference between the actual imports and
the predicted counterfactual imports in the absence of the agreement, ( kijtijt m̂m − ). Summing this
difference over all countries within a regional trade bloc provides a measure of how the agreement has
affected intra-bloc trade. This intra-bloc trade change is generally expected to be positive since trade
barriers are being removed, although it is possible in theory for the intra-bloc trade effect to be negative if
investment liberalization in the trade deal leads firms to set up local production in the target country
rather than exporting to it.
(6) ∑∈
−=−kRTAi
kijtijt
kjt )m̂m(changeblocIntra
Summing over all countries other than those in the new regional agreement provides a measure of how
extra-bloc imports are affected.
(7) ∑∉
−=−kRTAi
kijtijt
kjt )m̂m(changeblocExtra
The logic of trade diversion suggests that the change in extra-bloc trade measured in equation (7)
will be negative. This prediction may not always be true in the case of customs unions. Because customs
unions harmonize their external tariffs, a country joining a CU may lower its external tariffs and thus
cause an increase in imports from outside the trading region. Another possible reason extra-bloc trade
may not fall after a regional agreement is if the RTA raises national income sufficiently to increase
imports from all sources. The gravity model estimates will treat such a rise in national income as
unrelated to the RTA and capture its impact in the importer and exporter GDP or GDP per capita
variables, and thus some of the external trade effects of the RTA will be missed if the agreement raises
national or per-capita incomes by a large amount. These indirect effects of a trade agreement on imports
are likely to be minor, however, because computable general equilibrium models of trade agreements
12
typically find relatively small effects on income. Kehoe and Kehoe (1994), for instance, provide a survey
of CGE estimates of NAFTA, which found that the overall impact of the agreement would be to raise
Mexican GDP by 2-5 percent, raise U.S. GDP by 0.1 percent, and leave Canadian output unchanged.
Furthermore, these CGE estimates are long-run effects of the trade deal. Over the first few years of an
RTA’s existence, the income effects are likely to be considerably smaller.
The trade effects measured in equations (6) and (7) do not match a strict definition of trade
creation and trade diversion. Viner (1950, p. 43) discussed trade creation as being increased imports from
within a trading bloc that the country “formerly did not import at all.” Trade diversion, on the other hand,
means the goods “which one of the members of the customs union will now newly import from the other
whereas before the customs union it imported them from a third country.” The empirical literature often
describes any decline in trade with countries outside a regional trading area as trade diversion, but it is
clear from the quotation in Viner that a decline in extra-bloc trade measured by equation (7) must be
accompanied by a rise in intra-bloc imports to be accurately described as trade diversion.
A method of measuring trade creation and trade diversion that is tightly connected to their
definitions is to take any observed increases in intra-bloc trade and classify them as trade diversion or
trade creation depending on whether or not they are accompanied by declines in imports from outside the
trading region. Let ∑∈
=kRTAi
ijtkjt mm be country j’s total imports from other countries within preferential
trading area k and ∑∈
=kRTAi
kijt
kjt m̂m̂ be the predicted level of imports from its new preferential partners if
the trade deal had not been signed. Define kjtTE (for trade expansion) to be any increases in imports
within the regional bloc above the counterfactual predicted level, bounded below by zero:
(8) ⎪⎩
⎪⎨⎧
<
≥−= kjt
kjt
kjt
kjtk
jtkjtk
jt m̂mif
m̂mifm̂mTE0
.
Trade diversion is implied if the rise in intra-bloc imports is accompanied by a fall in extra-bloc imports:
13
(9)
⎪⎪⎩
⎪⎪⎨
⎧
≤−
>−>
≥−
−=∉∉
∉∉
∉∉
∉∉
0
00 k
jtk
jt
kjt
kjt
kjt
kjt
kjt
kjt
kjt
kjt
kjt
kjt
mm̂if
mm̂TEif
TEmm̂if
mm̂
TE
TD ,
where ∑∉
∉ =kRTAi
ijtk
jt mm and ∑∉
∉ =kRTAi
kijt
kjt m̂m̂ measure actual and predicted imports from countries
outside the trading area. If the increase in intra-bloc imports is not offset by a decline in extra-bloc
imports, then trade creation is occurring:
(10) kjt
kjt
kjt TDTETC −= .
Thus, no trade creation or trade diversion is indicated in equations (9) and (10) for countries that do not
see an increase in imports from their new preferential trading partners.
Nearly all studies examining the effects of regional agreements (including this one) use data on
import values rather than quantities. One concern in using import values is that import prices may change
after the creation of a regional bloc. Prior to a regional agreement, imports entering a country from all
sources are valued at the world price. When tariffs are eliminated with a preferential trading partner,
however, imports from the partner country may now enter at a price up to tpw + and still remain
competitive. If import prices were to increase, some of the expanded value of trade within the regional
trading bloc would be due to the rise in import prices rather than being due to increased quantities. There
does not appear to be any evidence that intra-bloc import prices rise following a regional agreement,
however. Trefler (2004) examines how the 1989 CUSFTA affected import prices in Canada, and he finds
that, if anything, the agreement reduced import prices by approximately 7 percent in the most impacted
industries. Thus, the existing evidence on import price changes in response to a trade agreement suggests
that prices are either unaffected or fall slightly. If import prices decline, then the impact of regional
agreements on intra-bloc trade in this paper is slightly understated.
3. Results
14
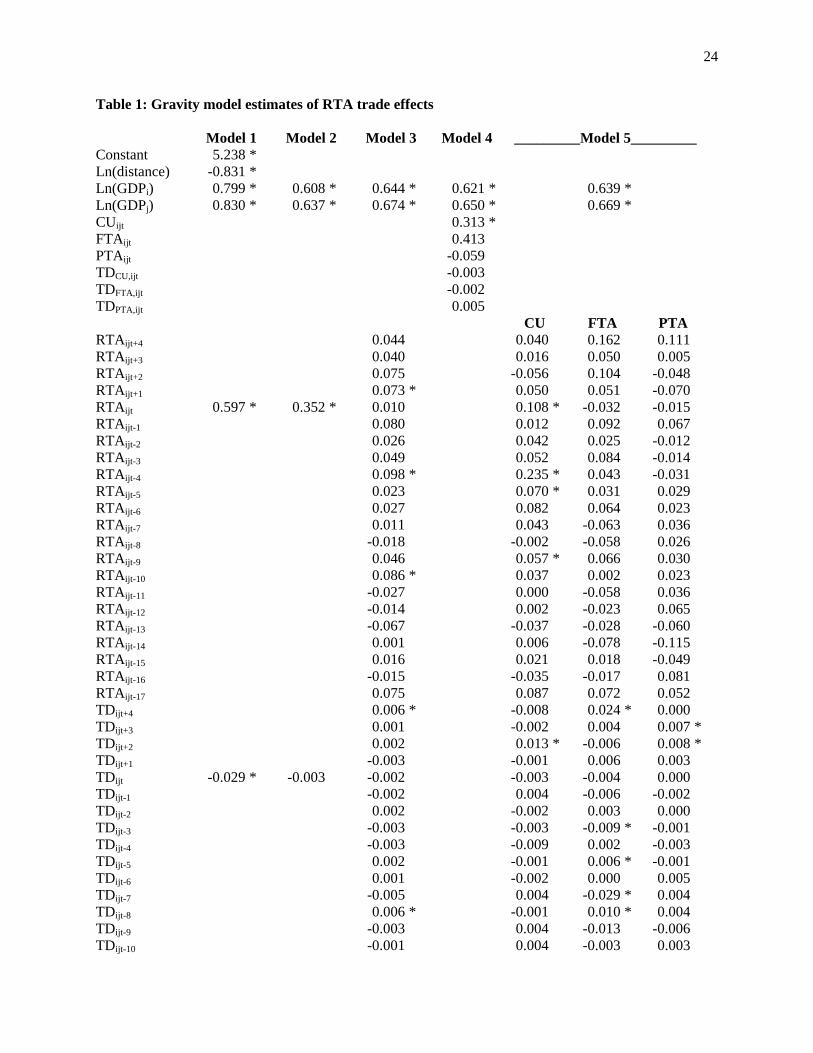
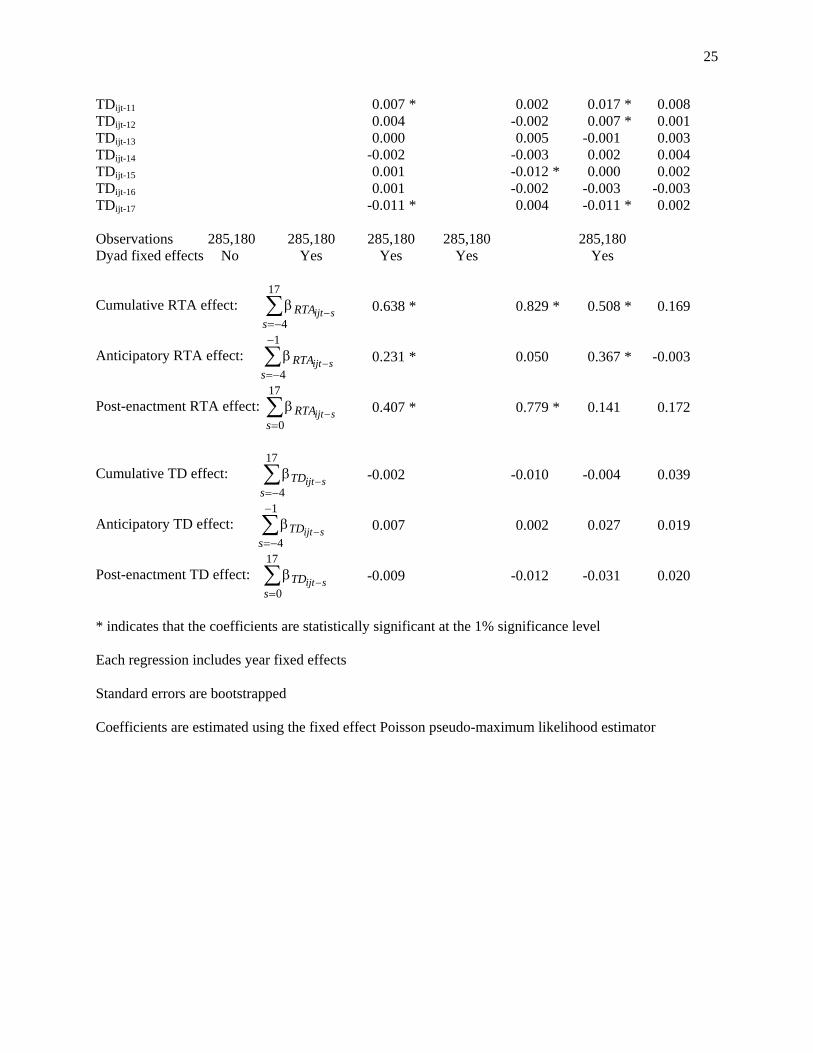
Table 1 presents estimates of the trade impact of regionalism based on the gravity model
described above. The coefficients are estimated using the poisson pseudo-maximum likelihood estimator
suggested by Santos Silva and Tenreyos (2006) and the standard errors are bootstrapped to deal with
heteroskedasticity.2 The results are presented first for the simplest form of the gravity model including
only the RTA variables and the logs of distance and GDP as explanatory variables. The impact of adding
extra control variables and incorporating fixed effects is then investigated.
Model 1 presents the results of the basic gravity model. The coefficient on the RTA variable of
0.597 means that bilateral trade flows are estimated to increase by 82 percent ( 8215970 .e . = ) if the pair of
countries has a regional agreement. The coefficient on the trade diversion variable indicates that a trade
deal reduces imports from outside the RTA by 2.9 percent. Both coefficients are significant at the 1
percent level, and the results thus fit the conventional wisdom that regional agreements increase trade
within the bloc and reduce trade from countries outside the preferential trading area on average.
Models 2 through 5 add fixed effects for each dyad into the analysis. Model 2 shows that when
country pair fixed effects are controlled for, the impact of an RTA on intra-bloc trade declines to only 42
percent, about half that in model 1. These results are consistent with the idea that regional agreements
tend to be signed between country pairs that have high levels of bilateral trade for historical reasons,
which means that gravity models without dyad fixed effects overestimate the impact of regional
agreements on trade. Imports from a country’s new preferential trading partners are $2.24 billion on
average in the year prior to the start of the RTA, so the 42 percent increase translates into $946 million
worth of expanded intra-bloc trade. The estimates in model 2 provide no statistically significant evidence
that regional agreements reduce imports from countries outside the trading bloc. The coefficient on the
trade diversion variable is not statistically significant, and the point estimate indicates that extra-bloc
imports decline by only 0.3 percent when a new regional agreement is signed. For the average country
signing a new regional agreement, imports from countries other than their new preferential partners are
2 Santos Silva and Tenreyos (2006) suggest using the robust covariance matrix estimator in STATA, but the robust estimator of the standard errors is not available for fixed-effect Poisson estimation.
15
nearly $40 billion, so a 0.3 percent decline means a fall of $120 million in external trade. These numbers
imply that trade creation ($826 million) is roughly seven times larger than trade diversion on average.
Model 3 estimates the dynamic effects of regional agreements. The RTA coefficients are jointly
significant as a group, but most of them are statistically insignificant individually due to the collinearity
between the RTA variables. Collinearity is not a major concern here, however, because the main object
of interest is the cumulative effect of regional agreements on trade flows, and collinearity can actually
improve inference about the sum of coefficients, as Goldberger (1991, p. 219) points out. The bottom
rows of the table show the cumulative RTA effects on trade: 638017
4.
sRTA sijt =β∑
−=−
. This estimate means
that the average RTA raises intra-bloc trade by 89 percent after being in place for 18 years. All of this
impact on trade occurs by year 11 of the regional agreement’s existence – there is no significant change in
the cumulative effect of the RTA after that point. Model 3 provides strong evidence that the anticipation
of regional agreements influences trade flows. The anticipatory effect of the RTA is to raise trade by 26
percent in the four years prior to the trade deal’s start. Trade then increases on average by another 50
percent over the first 18 years of the agreement. Each of these cumulative impacts on trade is statistically
significant at the 1 percent level. As in model 2, there is little evidence of trade diversion. Imports from
countries outside of a regional trading bloc increase slightly (by 0.7 percent) in the four years leading up
to the start of the RTA and then fall by 0.9 percent in the first 18 years of the agreement. Neither effect is
significantly different from zero at the one percent level.
Models 4 and 5 estimate separate RTA effects for customs unions, free trade areas, and
preferential trading arrangements. Customs unions are estimated in model 4 to raise intra-bloc trade by
37 percent, while free trade areas increase imports by 51 percent. Preferential trading arrangements, on
the other hand, have no significant impact on trade flows. There are no significant declines in extra-bloc
trade for any of the three types of regional agreements. Model 5 investigates the dynamic effects
separately for each type of regional agreement. The long-run cumulative effect of customs unions is to
increase intra-bloc trade by 129 percent while free trade areas are estimated to raise trade within the bloc
16
by 66 percent. Preferential trading arrangements are estimated to raise intra-bloc trade in the long run by
only 18 percent, and this effect is not statistically significantly different from zero. None of the three
types of agreements reveal statistically significant evidence of trade diversion at the one percent level,
although the point estimates show some small declines in extra-bloc trade among customs unions and free
trade areas during the 18 years after the trade deals begin.
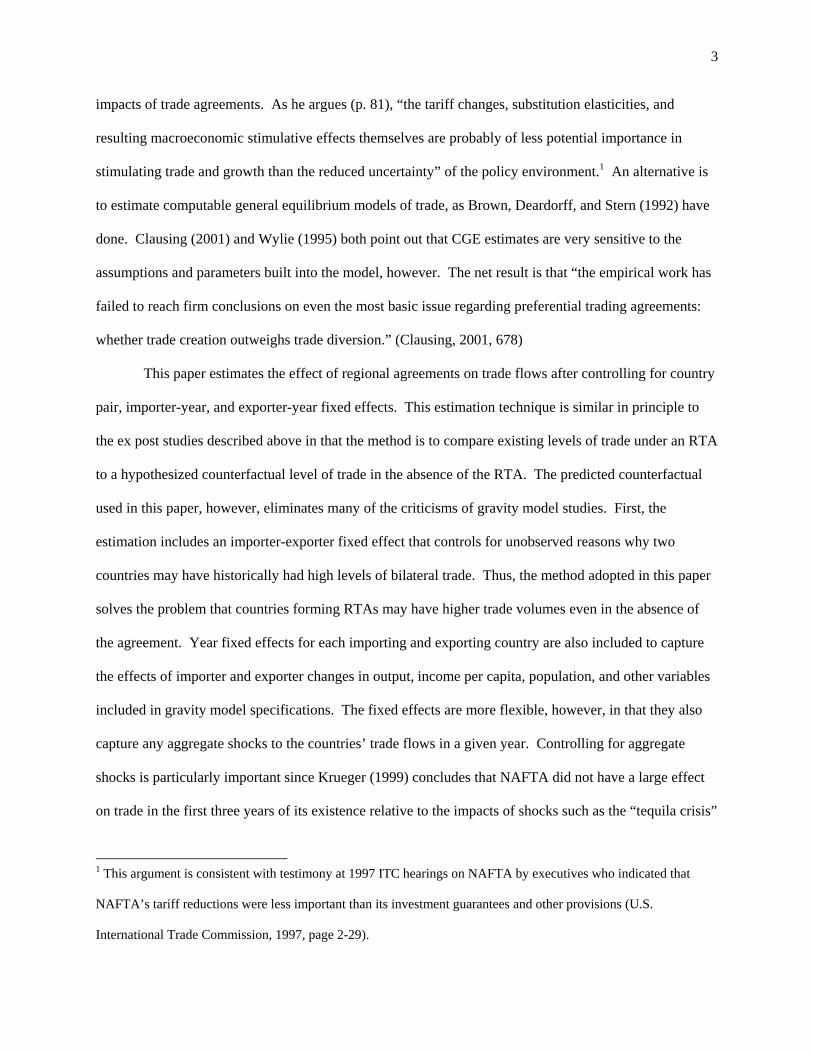
The dynamic time paths of the intra-bloc trade effects from model 5 for customs unions, free
trade areas, and preferential arrangements are illustrated in Figure 2. Customs unions lead to a steady
increase in trade from about one year prior to their start to 11 years after they have begun. By that point,
intra-bloc trade is estimated to be 120 percent higher due to the customs union. By year 18, trade within
the customs union has risen by 129 percent on average. For free trade areas, imports increase by more
than 40 percent in the four years prior to the start of the trade deal, and the cumulative effect peaks in the
seventh year after its start. The cumulative impacts on trade over the first seven years are very similar for
customs unions (a 92 percent average increase) and free trade areas (96 percent), so the larger long-run
effects caused by customs unions are due to the fact that intra-CU trade continues to rise for a longer
period of time while the impact of free trade areas declines somewhat after year seven. For the average
preferential trading arrangement, there is no estimated increase in trade until after it has been in force for
five years. The impact on imports then peaks at 30 percent in year 13 of its existence and declines to
below 20 percent by year 18.
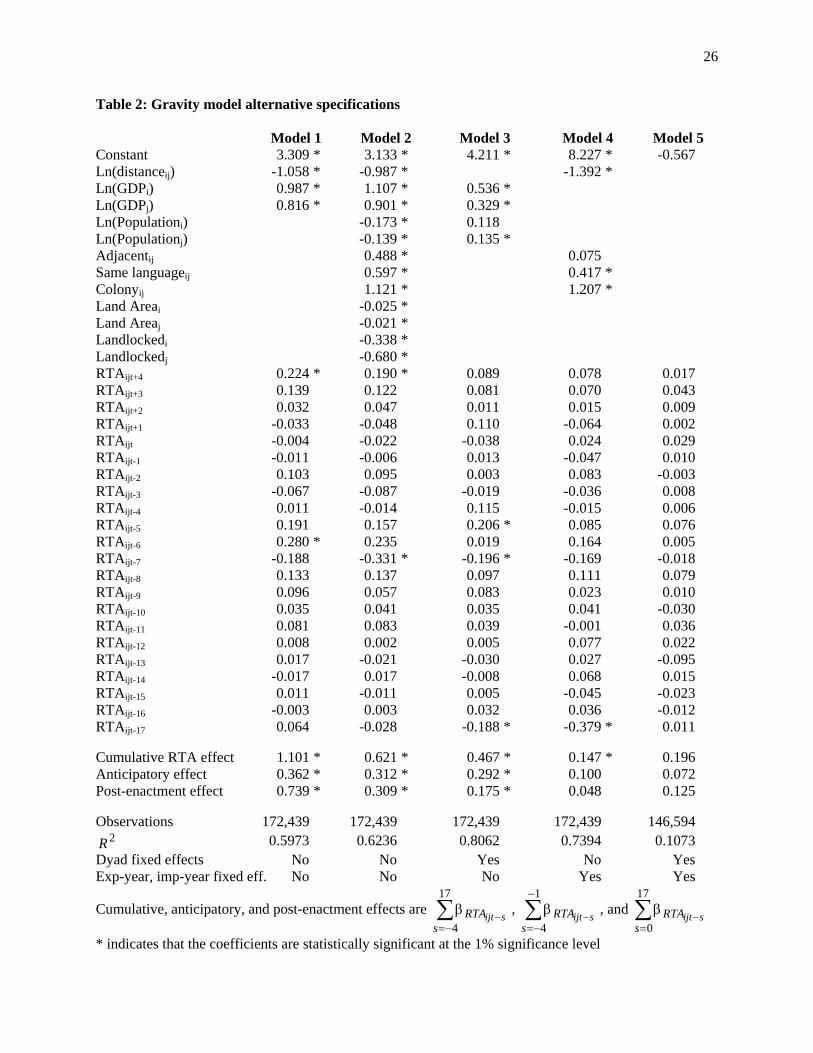
Table 2 investigates the RTA trade effects for alternative specifications of the gravity model.
Model 1 shows estimates using the simplest form of the gravity model while model 2 adds in variables
such as population, land area, and dummies for adjacency, same language use, colonial history, and
landlocked countries that are commonly used in the literature. Model 3 then replaces the variables
specific to each country pair with dyad fixed effects. Model 4 replaces the variables that are specific to
the importing and exporting countries in each year with exporter-year and importer-year fixed effects, and
model 5 includes exporter-year and importer-year fixed effects as well as fixed effects for each dyad.
17
Model 5 is estimated in first differences as shown in equation (5), which means that the 2R value is not
comparable to the first four columns. The trade diversion variables are omitted from the regressions since
they can not be included in models 4 and 5. The models are estimated by ordinary least squares because
nonlinear regression is difficult with the thousands of dummy variables for the exporter-year and
importer-year fixed effects. The OLS approach also allows a direct comparison of the results in Table 2
to most of the previous literature on the gravity model.
Table 2 reinforces several results from Table 1. First, adding fixed effects into the regressions
reduces the estimated impact of regional agreements on trade. This result can be seen most clearly in the
row at the bottom of the table showing the cumulative long-run effect of regional agreements. In model
1, the simplest form of the gravity model, the cumulative effect of a regional agreement is to raise trade
within the trading bloc by about 200 percent. Adding commonly used control variables in model 2 means
an RTA is estimated to raise trade by 86 percent. These large estimated effects of regional agreements on
trade flows in gravity models are often found in the literature: Frankel and Rose (2002), for example
estimate that regional agreements increase trade flows by over 2.9 times. Adding dyad fixed effects to the
model reduces the estimated long-run impact of regional agreements on trade from 86 percent in model 2
to 60 percent in model 3. Introducing exporter-year and importer-year fixed effects in model 4 means that
the average regional agreement is estimated to raise imports by only 15.8 percent after 18 years in
existence. While that is a statistically significant increase in trade, it is a far cry from the much larger
estimated trade effects in the typical formulation of the gravity model. In model 5, which controls for
both time-specific shocks to each country’s trade flows and dyad-specific variables, the estimated RTA
effects are similar to those in model 4. Trade flows are estimated to rise by 21.7 percent after a regional
agreement has been in place for 18 years, although this cumulative effect is not statistically significantly
different from zero.
A second result from Table 1 that also finds some support in Table 2 is that regional agreements
have anticipatory effects on trade. In both models 1 and 2, trade rises considerably (by between 37

18
percent and 44 percent) in the four years prior to the beginning of the trade deal and then continues to
increase following its enactment. In model 3, most of the estimated long-run increase in trade (34
percent) actually occurs in the 4 years leading up to the start of the agreement, with a smaller 19 percent
increase occurring in the 18 years after it begins. Models 4 and 5 estimate that trade increases by 10.5
and 7.5 percent, respectively, in the years immediately prior to the start of regional agreements, although
these impacts are not statistically significant.
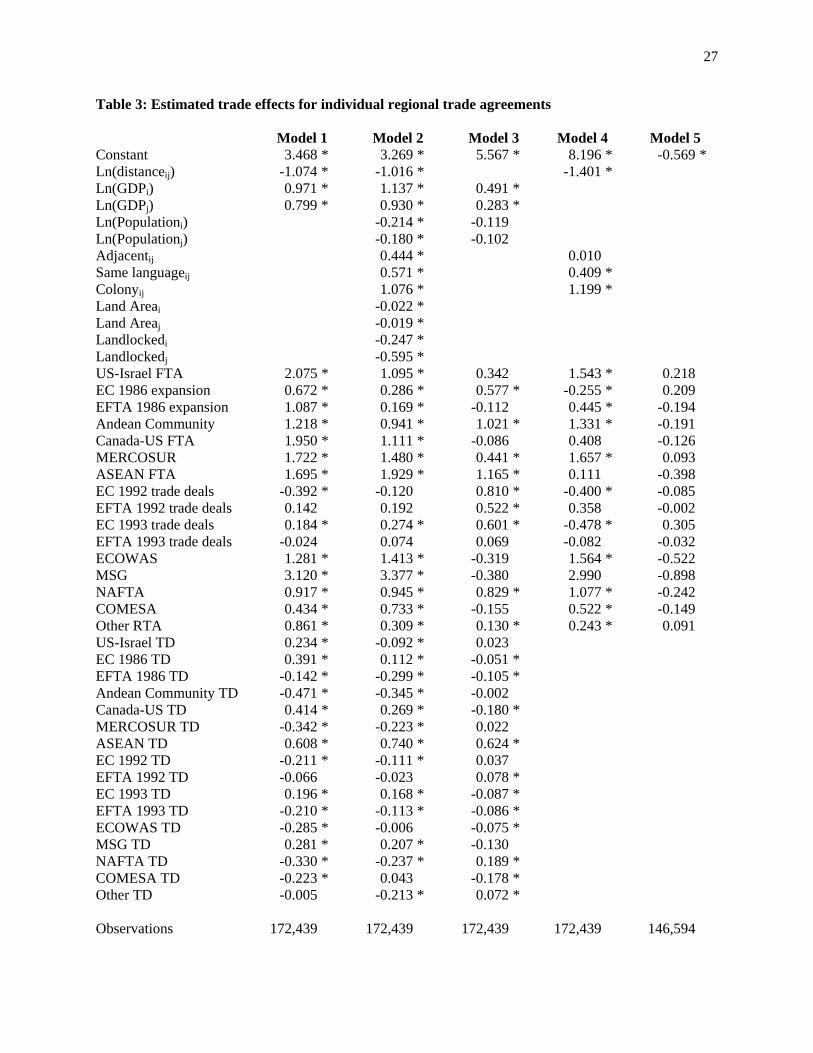
In order to investigate the dynamic effects of regional agreements on average, the estimates in
Tables 1 and 2 were based on the assumption that all RTAs had a similar impact on trade. Table 3
presents the more common method of allowing separate estimates of the trade effects for each regional
agreement. The models are comparable to those in Table 2: columns (1) and (2) present basic gravity
model estimates, column (3) includes dyad fixed effects, column (4) adds exporter-year and importer-year
fixed effects, and column (5) includes exporter-year and importer-year fixed effects and estimates the
equation in first differences to control for dyad fixed effects.
As in Tables 1 and 2, Table 3 reveals that controlling for unobserved factors affecting trade
between country pairs through dyad fixed effects generally reduces the estimated impacts of regional
trade agreements. The Canada-US Free Trade Agreement is estimated in the standard gravity model to
raise trade between Canada and the US by more than 200 percent in columns 1 and 2, but it has no
significant impact on trade once the dyad fixed effects are included in the regression in column 3. Large
reductions in the estimated impacts on trade are also found for the US-Israel free trade agreement, the
1986 expansion of the European Free Trade Area, the Southern Common Market (MERCOSUR), the
Common Market of Eastern and Southern Africa (COMESA), the Economic Community of West African
States (ECOWAS), and the Melanesian Spearhead Group (MSG). The last three regional agreements are
merely preferential trading arrangements, so the negligible impacts on trade in model 3 are more plausible
than the very large effects estimated by the standard gravity model. The median RTA is estimated to
raise intra-bloc trade by 172 and 131 percent in models 1 and 2, but by only 48 percent when the country
pair fixed effects are included in model 3. As in Table 2, controlling for exporter-year and importer-year
19
fixed effects in models 4 and 5 also tends to reduce the estimated impacts of regional agreements on
trade. The median regional bloc is estimated to raise intra-bloc trade by 53 percent in model 4 while
model 5 finds no significant trade effects for any of the regional agreements.
While Table 1 found no significant declines in imports from countries outside the average
preferential trading area, Table 3 finds that extra-bloc trade fell for some individual agreements. As with
intra-bloc trade, the estimated impact of the agreements on extra-bloc trade declines when dyad fixed
effects are included. The median agreement is estimated to reduce extra-bloc trade by 9.9 percent and 5.6
percent respectively in models 1 and 2, but by only 2.6 percent in model 3. Seven of the 16 coefficients
on the “trade diversion” variables are significantly negative in model 3. Notice, though, that only two of
the seven regional agreements with significant negative coefficients on the TD variables (the 1986 EC
expansion and the 1993 EC trade deals with Romania and Bulgaria) have significant positive coefficients
on the RTA variables. For those two agreements, the estimates provide evidence of trade diversion –
imports from countries outside the area have been replaced by trade within the region. For the other five
agreements, there is no significant rise in trade within the preferential trading area, so the lost extra-bloc
trade can not have been diverted into intra-bloc trade. For these agreements, it is much more likely that
region-specific shocks to trade caused a significant decline in extra-bloc imports (just as the four
agreements with significant positive coefficients on the trade diversion variables likely experienced
positive shocks to trade in the years following the trade deals).
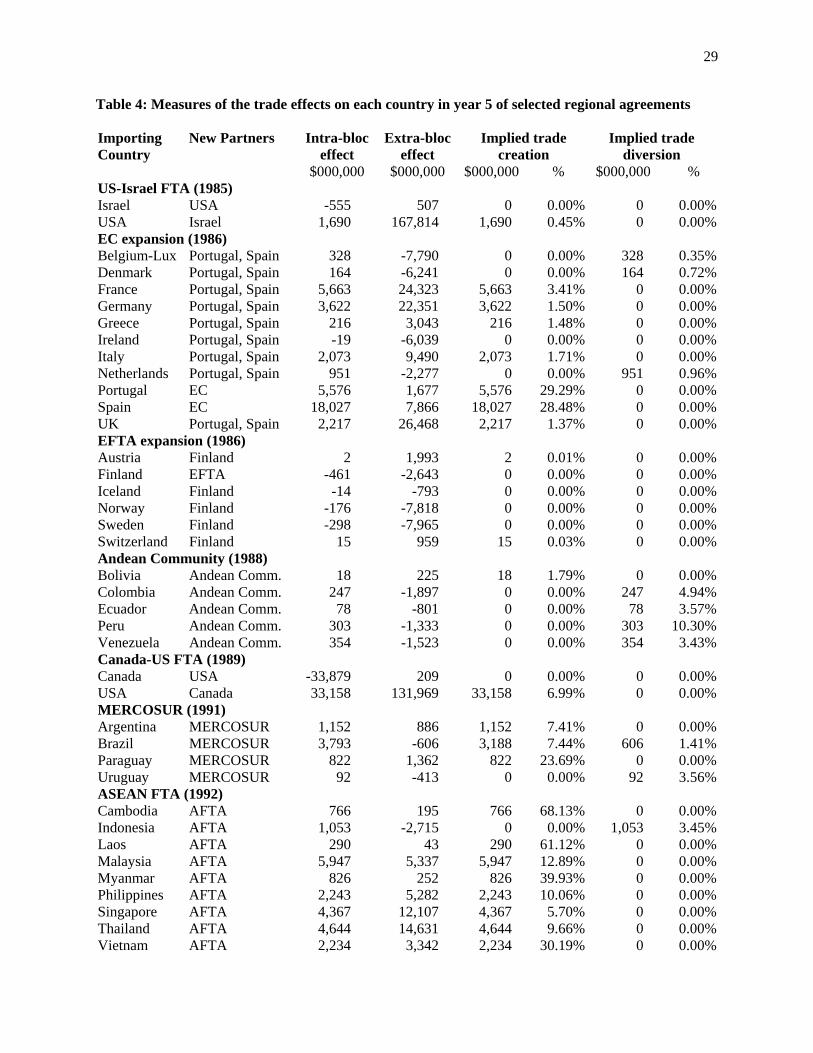
Table 4 presents estimates of the trade effects of regional agreements on individual countries.
These use the estimates from model 3 in Table 3 to predict trade flows in the absence of each agreement
and then measure the RTA effects based on equations (6) – (10). The first two columns show the intra-
bloc and extra-bloc trade effects, while the last four columns reveal the trade creation and trade diversion
that are implied by the trade effects.
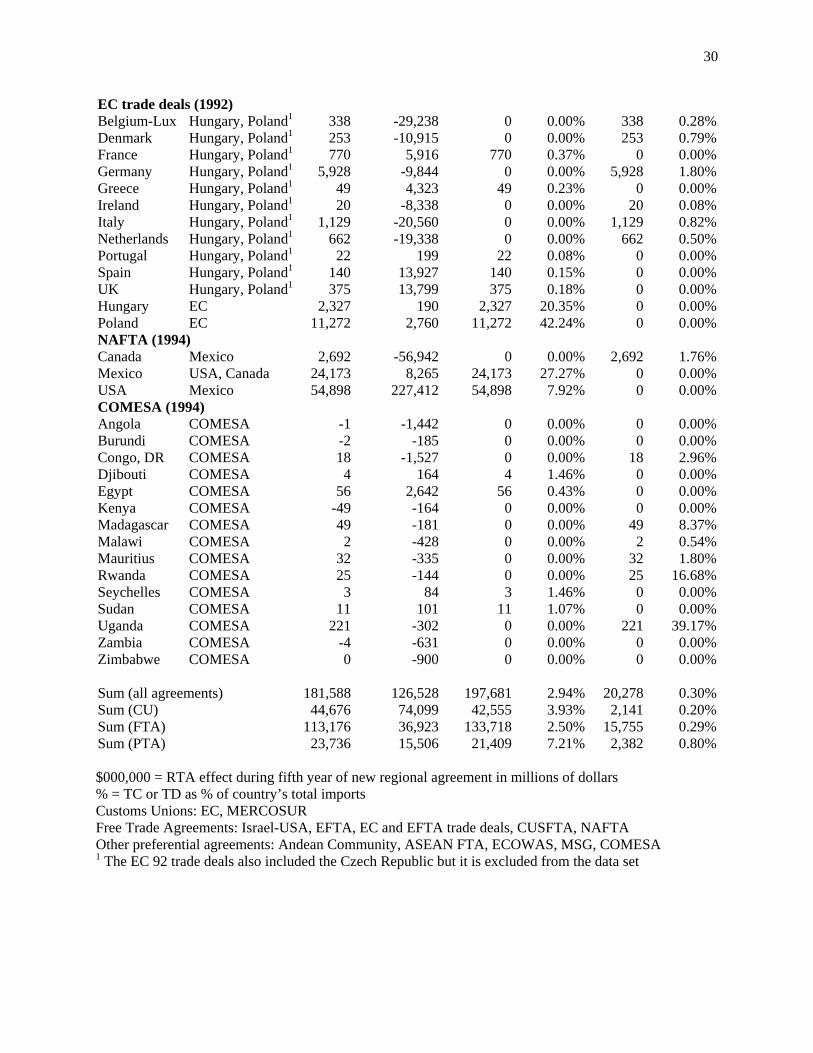
One result from Table 4 is that regional agreements are estimated to have very different impacts
on each of the countries within a trading bloc. The 1986 expansion of the European Community
generated large increases in imports by 1990 for the new entrants Spain and Portugal (nearly 30 percent
20
of their total imports) and for France, which borders Spain. Other countries in the EC such as Denmark,
Belgium, and Ireland saw little or no increase in imports from their new preferential trading partners. The
1992 free trade agreements the EC signed with Hungary and Poland also had varying impacts on the
countries involved. Imports into Poland and Hungary from the EC increased dramatically, but only
Germany (which borders Poland) experienced large increases in imports from Poland and Hungary. The
North American Free Trade Agreement generated much greater increases in imports for the United States
and for Mexico than for Canada. These results are not surprising, but they illustrate that constraining a
regional agreement to have the same effect on each country’s imports, as the RTA dummy variable
approach does, is often inappropriate. Countries with the largest gains from trade agreements (Spain and
Portugal joining the EC, Poland signing a free trade agreement with the EC, and Mexico joining the
United States and Canada in the NAFTA) are usually joining a trading bloc with an overall economy
many times larger than their own and whose countries are nearby and thus “natural trading partners.”
The aggregate effects of all regional agreements, customs unions, free trade agreements, and
preferential agreements signed during this time period are shown in the final rows of the table. In total,
the intra-bloc imports of the new agreements are estimated to have risen by $182 billion while imports
from countries other than the new preferential partners rose by $126 billion. The aggregate intra-bloc
RTA effect is relatively small – it amounts to 2.7 percent of the countries’ total imports.
Consistent with the estimates in Tables 1 and 3, aggregate trade creation is found to outweigh
trade diversion by a good margin. The implied trade creation in the table may, however, be overstated
relative to the implied trade diversion. Consider a country signing a regional agreement that has no
impact on trade. A positive shock to its aggregate imports will lead to higher trade with all countries and
will thus be counted as trade creation because the higher trade within the region is not offset by a decline
in imports from outside the bloc. A negative shock to the country’s imports, however, would lead to a
fall in both intra-bloc and extra-bloc trade, which is not counted as trade diversion. Positive and negative
shocks to trade (if they are unrelated to the formation of regional agreements) should roughly cancel each
other out in summing the intra-bloc and extra-bloc trade effects over all the regional agreements in the
21
first two columns. The positive aggregate intra-bloc and extra-bloc trade effects support the view that the
regional agreements signed in the 1980’s and early 1990’s were trade creating on average.
4. Conclusion
There are a number of complications in examining the trade effects of regional agreements that
have prevented any consensus from forming on the appropriate empirical methodology for measuring
trade creation and trade diversion. Aggregate shocks to a country’s imports can be large relative to the
effects of a regional trade agreement; it is difficult to establish a counterfactual level of trade that would
have occurred in the absence of the agreement; the impact of an agreement can vary considerably across
countries within a trade bloc; and the effects of the trade preferences can change over time. The estimates
in this paper improve on those in previous studies by using fixed effects to account for historical trade
patterns and for aggregate shocks to countries’ imports and exports, measuring the trade effects in a
dynamic framework, and by providing separate measures of agreements’ trade effects on each country.
The fixed effects for each dyad help solve for the problem that country pairs with greater than normal
bilateral trade are more likely to sign regional trade deals. Including dyad, exporter-year, and importer-
year fixed effects controls for all of the variables normally used in gravity models and many other
unobserved ones, and it removes the difficult choices about which of the hypothesized variables should be
included. The results presented in this paper consistently show that adding the fixed effects reduces the
estimated impacts of regional agreements on trade.
The estimates also reveal a number of other interesting results. First, there are clear anticipatory
effects of regional trade agreements, with trade estimated to increase by 26 percent on average in the four
years leading up to the start of a trade deal. Trade continues to rise significantly over the first 11 years a
regional agreement is in place, and the long-run impact of the average regional agreement is estimated to
be an 89 percent increase in trade flows. A second result is that there are plausible differences in the
effects of customs unions, free trade agreements, and preferential trading arrangements. Customs unions
generate the largest long-run increase in intra-bloc trade on average, with free trade agreements having
22
smaller long-run effects. The advantage of customs unions is that intra-CU trade continues to increase
over longer periods of time. While both customs unions and free trade areas have similar impacts on
trade after seven years in existence, by year 18 the customs union effect on trade is nearly double that of a
free trade area. Preferential trading arrangements, on the other hand, lead to much smaller (and
statistically insignificant) increases in trade flows, and trade does not begin to rise until after the
preferential arrangement has been in place for five years. The dynamic models estimated in the paper
suggest that the long-run impacts of regional agreements are more positive than the short-run impacts in
general.
The estimates for individual countries reveal that a trade deal can have very different impacts on
the countries involved. Countries signing regional agreements with partners who are both nearby and
large tend to experience sizable increases in trade while agreements between less natural trading partners
have much smaller effects. For the typical country signing a regional agreement, the trade effects are
small relative to the participating countries’ total imports, with intra-RTA imports estimated to rise by
about 2.7 percent of a country’s total imports in year five.
23
Figure 1
Figure 2
Import growth by RTA status
5.46.5
8.5
14.513.8
9.3 9.0
12.310.8
11.6
5.5
0.0
2.0
4.0
6.0
8.0
10.0
12.0
14.0
16.0
<-3 -3 -2 -1 0 1 2 3 4 5 >5
Years since RTA formation
Ave
rage
gro
wth
rate
(%)
Customs unions
Free trade agreements
Preferential trading arrangements
Dynamic intra-bloc trade effects of regional trade agreements
-20
0
20
40
60
80
100
120
140
-4 -3 -2 -1 0 1 2 3 4 5 6 7 8 9 10 11 12 13 14 15 16 17
Years since RTA started
% in
crea
se in
trad
e
24
Table 1: Gravity model estimates of RTA trade effects
Model 1 Model 2 Model 3 Model 4 _________Model 5_________ Constant 5.238 * Ln(distance) -0.831 * Ln(GDPi) 0.799 * 0.608 * 0.644 * 0.621 * 0.639 * Ln(GDPj) 0.830 * 0.637 * 0.674 * 0.650 * 0.669 * CUijt 0.313 * FTAijt 0.413 PTAijt -0.059 TDCU,ijt -0.003 TDFTA,ijt -0.002 TDPTA,ijt 0.005 CU FTA PTA RTAijt+4 0.044 0.040 0.162 0.111 RTAijt+3 0.040 0.016 0.050 0.005 RTAijt+2 0.075 -0.056 0.104 -0.048 RTAijt+1 0.073 * 0.050 0.051 -0.070 RTAijt 0.597 * 0.352 * 0.010 0.108 * -0.032 -0.015 RTAijt-1 0.080 0.012 0.092 0.067 RTAijt-2 0.026 0.042 0.025 -0.012 RTAijt-3 0.049 0.052 0.084 -0.014 RTAijt-4 0.098 * 0.235 * 0.043 -0.031 RTAijt-5 0.023 0.070 * 0.031 0.029 RTAijt-6 0.027 0.082 0.064 0.023 RTAijt-7 0.011 0.043 -0.063 0.036 RTAijt-8 -0.018 -0.002 -0.058 0.026 RTAijt-9 0.046 0.057 * 0.066 0.030 RTAijt-10 0.086 * 0.037 0.002 0.023 RTAijt-11 -0.027 0.000 -0.058 0.036 RTAijt-12 -0.014 0.002 -0.023 0.065 RTAijt-13 -0.067 -0.037 -0.028 -0.060 RTAijt-14 0.001 0.006 -0.078 -0.115 RTAijt-15 0.016 0.021 0.018 -0.049 RTAijt-16 -0.015 -0.035 -0.017 0.081 RTAijt-17 0.075 0.087 0.072 0.052 TDijt+4 0.006 * -0.008 0.024 * 0.000 TDijt+3 0.001 -0.002 0.004 0.007 *TDijt+2 0.002 0.013 * -0.006 0.008 *TDijt+1 -0.003 -0.001 0.006 0.003 TDijt -0.029 * -0.003 -0.002 -0.003 -0.004 0.000 TDijt-1 -0.002 0.004 -0.006 -0.002 TDijt-2 0.002 -0.002 0.003 0.000 TDijt-3 -0.003 -0.003 -0.009 * -0.001 TDijt-4 -0.003 -0.009 0.002 -0.003 TDijt-5 0.002 -0.001 0.006 * -0.001 TDijt-6 0.001 -0.002 0.000 0.005 TDijt-7 -0.005 0.004 -0.029 * 0.004 TDijt-8 0.006 * -0.001 0.010 * 0.004 TDijt-9 -0.003 0.004 -0.013 -0.006 TDijt-10 -0.001 0.004 -0.003 0.003
25
TDijt-11 0.007 * 0.002 0.017 * 0.008 TDijt-12 0.004 -0.002 0.007 * 0.001 TDijt-13 0.000 0.005 -0.001 0.003 TDijt-14 -0.002 -0.003 0.002 0.004 TDijt-15 0.001 -0.012 * 0.000 0.002 TDijt-16 0.001 -0.002 -0.003 -0.003 TDijt-17 -0.011 * 0.004 -0.011 * 0.002 Observations 285,180 285,180 285,180 285,180 285,180 Dyad fixed effects No Yes Yes Yes Yes
Cumulative RTA effect: ∑−=
−β
17
4sRTA sijt 0.638 * 0.829 * 0.508 * 0.169
Anticipatory RTA effect: ∑−
−=−
β1
4sRTA sijt 0.231 * 0.050 0.367 * -0.003
Post-enactment RTA effect: ∑=
−β
17
0sRTA sijt 0.407 * 0.779 * 0.141 0.172
Cumulative TD effect: ∑−=
−β
17
4sTD sijt -0.002 -0.010 -0.004 0.039
Anticipatory TD effect: ∑−
−=−
β1
4sTD sijt 0.007 0.002 0.027 0.019
Post-enactment TD effect: ∑=
−β
17
0sTD sijt -0.009 -0.012 -0.031 0.020
* indicates that the coefficients are statistically significant at the 1% significance level
Each regression includes year fixed effects
Standard errors are bootstrapped
Coefficients are estimated using the fixed effect Poisson pseudo-maximum likelihood estimator
26
Table 2: Gravity model alternative specifications
Model 1 Model 2 Model 3 Model 4 Model 5 Constant 3.309 * 3.133 * 4.211 * 8.227 * -0.567 Ln(distanceij) -1.058 * -0.987 * -1.392 * Ln(GDPi) 0.987 * 1.107 * 0.536 * Ln(GDPj) 0.816 * 0.901 * 0.329 * Ln(Populationi) -0.173 * 0.118 Ln(Populationj) -0.139 * 0.135 * Adjacentij 0.488 * 0.075 Same languageij 0.597 * 0.417 * Colonyij 1.121 * 1.207 * Land Areai -0.025 * Land Areaj -0.021 * Landlockedi -0.338 * Landlockedj -0.680 * RTAijt+4 0.224 * 0.190 * 0.089 0.078 0.017 RTAijt+3 0.139 0.122 0.081 0.070 0.043 RTAijt+2 0.032 0.047 0.011 0.015 0.009 RTAijt+1 -0.033 -0.048 0.110 -0.064 0.002 RTAijt -0.004 -0.022 -0.038 0.024 0.029 RTAijt-1 -0.011 -0.006 0.013 -0.047 0.010 RTAijt-2 0.103 0.095 0.003 0.083 -0.003 RTAijt-3 -0.067 -0.087 -0.019 -0.036 0.008 RTAijt-4 0.011 -0.014 0.115 -0.015 0.006 RTAijt-5 0.191 0.157 0.206 * 0.085 0.076 RTAijt-6 0.280 * 0.235 0.019 0.164 0.005 RTAijt-7 -0.188 -0.331 * -0.196 * -0.169 -0.018 RTAijt-8 0.133 0.137 0.097 0.111 0.079 RTAijt-9 0.096 0.057 0.083 0.023 0.010 RTAijt-10 0.035 0.041 0.035 0.041 -0.030 RTAijt-11 0.081 0.083 0.039 -0.001 0.036 RTAijt-12 0.008 0.002 0.005 0.077 0.022 RTAijt-13 0.017 -0.021 -0.030 0.027 -0.095 RTAijt-14 -0.017 0.017 -0.008 0.068 0.015 RTAijt-15 0.011 -0.011 0.005 -0.045 -0.023 RTAijt-16 -0.003 0.003 0.032 0.036 -0.012 RTAijt-17 0.064 -0.028 -0.188 * -0.379 * 0.011 Cumulative RTA effect 1.101 * 0.621 * 0.467 * 0.147 * 0.196 Anticipatory effect 0.362 * 0.312 * 0.292 * 0.100 0.072 Post-enactment effect 0.739 * 0.309 * 0.175 * 0.048 0.125 Observations 172,439 172,439 172,439 172,439 146,594
2R 0.5973 0.6236 0.8062 0.7394 0.1073 Dyad fixed effects No No Yes No Yes Exp-year, imp-year fixed eff. No No No Yes Yes
Cumulative, anticipatory, and post-enactment effects are ∑−=
−β
17
4sRTA sijt , ∑
−
−=−
β1
4sRTA sijt , and ∑
=−
β17
0sRTA sijt
* indicates that the coefficients are statistically significant at the 1% significance level
27
Table 3: Estimated trade effects for individual regional trade agreements
Model 1 Model 2 Model 3 Model 4 Model 5 Constant 3.468 * 3.269 * 5.567 * 8.196 * -0.569 * Ln(distanceij) -1.074 * -1.016 * -1.401 * Ln(GDPi) 0.971 * 1.137 * 0.491 * Ln(GDPj) 0.799 * 0.930 * 0.283 * Ln(Populationi) -0.214 * -0.119 Ln(Populationj) -0.180 * -0.102 Adjacentij 0.444 * 0.010 Same languageij 0.571 * 0.409 * Colonyij 1.076 * 1.199 * Land Areai -0.022 * Land Areaj -0.019 * Landlockedi -0.247 * Landlockedj -0.595 * US-Israel FTA 2.075 * 1.095 * 0.342 1.543 * 0.218 EC 1986 expansion 0.672 * 0.286 * 0.577 * -0.255 * 0.209 EFTA 1986 expansion 1.087 * 0.169 * -0.112 0.445 * -0.194 Andean Community 1.218 * 0.941 * 1.021 * 1.331 * -0.191 Canada-US FTA 1.950 * 1.111 * -0.086 0.408 -0.126 MERCOSUR 1.722 * 1.480 * 0.441 * 1.657 * 0.093 ASEAN FTA 1.695 * 1.929 * 1.165 * 0.111 -0.398 EC 1992 trade deals -0.392 * -0.120 0.810 * -0.400 * -0.085 EFTA 1992 trade deals 0.142 0.192 0.522 * 0.358 -0.002 EC 1993 trade deals 0.184 * 0.274 * 0.601 * -0.478 * 0.305 EFTA 1993 trade deals -0.024 0.074 0.069 -0.082 -0.032 ECOWAS 1.281 * 1.413 * -0.319 1.564 * -0.522 MSG 3.120 * 3.377 * -0.380 2.990 -0.898 NAFTA 0.917 * 0.945 * 0.829 * 1.077 * -0.242 COMESA 0.434 * 0.733 * -0.155 0.522 * -0.149 Other RTA 0.861 * 0.309 * 0.130 * 0.243 * 0.091 US-Israel TD 0.234 * -0.092 * 0.023 EC 1986 TD 0.391 * 0.112 * -0.051 * EFTA 1986 TD -0.142 * -0.299 * -0.105 * Andean Community TD -0.471 * -0.345 * -0.002 Canada-US TD 0.414 * 0.269 * -0.180 * MERCOSUR TD -0.342 * -0.223 * 0.022 ASEAN TD 0.608 * 0.740 * 0.624 * EC 1992 TD -0.211 * -0.111 * 0.037 EFTA 1992 TD -0.066 -0.023 0.078 * EC 1993 TD 0.196 * 0.168 * -0.087 * EFTA 1993 TD -0.210 * -0.113 * -0.086 * ECOWAS TD -0.285 * -0.006 -0.075 * MSG TD 0.281 * 0.207 * -0.130 NAFTA TD -0.330 * -0.237 * 0.189 * COMESA TD -0.223 * 0.043 -0.178 * Other TD -0.005 -0.213 * 0.072 * Observations 172,439 172,439 172,439 172,439 146,594

28
2R 0.6053 0.6300 0.8075 0.7398 0.1074 Dyad fixed effects No No Yes No Yes Exp-year, imp-year fixed eff. No No No Yes Yes * indicates that the coefficients are statistically significant at the 1% significance level Each regression includes year fixed effects
29
Table 4: Measures of the trade effects on each country in year 5 of selected regional agreements
Intra-bloc effect
Extra-bloc effect
Implied trade creation
Implied trade diversion
Importing Country
New Partners
$000,000 $000,000 $000,000 % $000,000 % US-Israel FTA (1985) Israel USA -555 507 0 0.00% 0 0.00%USA Israel 1,690 167,814 1,690 0.45% 0 0.00%EC expansion (1986) Belgium-Lux Portugal, Spain 328 -7,790 0 0.00% 328 0.35%Denmark Portugal, Spain 164 -6,241 0 0.00% 164 0.72%France Portugal, Spain 5,663 24,323 5,663 3.41% 0 0.00%Germany Portugal, Spain 3,622 22,351 3,622 1.50% 0 0.00%Greece Portugal, Spain 216 3,043 216 1.48% 0 0.00%Ireland Portugal, Spain -19 -6,039 0 0.00% 0 0.00%Italy Portugal, Spain 2,073 9,490 2,073 1.71% 0 0.00%Netherlands Portugal, Spain 951 -2,277 0 0.00% 951 0.96%Portugal EC 5,576 1,677 5,576 29.29% 0 0.00%Spain EC 18,027 7,866 18,027 28.48% 0 0.00%UK Portugal, Spain 2,217 26,468 2,217 1.37% 0 0.00%EFTA expansion (1986) Austria Finland 2 1,993 2 0.01% 0 0.00%Finland EFTA -461 -2,643 0 0.00% 0 0.00%Iceland Finland -14 -793 0 0.00% 0 0.00%Norway Finland -176 -7,818 0 0.00% 0 0.00%Sweden Finland -298 -7,965 0 0.00% 0 0.00%Switzerland Finland 15 959 15 0.03% 0 0.00%Andean Community (1988) Bolivia Andean Comm. 18 225 18 1.79% 0 0.00%Colombia Andean Comm. 247 -1,897 0 0.00% 247 4.94%Ecuador Andean Comm. 78 -801 0 0.00% 78 3.57%Peru Andean Comm. 303 -1,333 0 0.00% 303 10.30%Venezuela Andean Comm. 354 -1,523 0 0.00% 354 3.43%Canada-US FTA (1989) Canada USA -33,879 209 0 0.00% 0 0.00%USA Canada 33,158 131,969 33,158 6.99% 0 0.00%MERCOSUR (1991) Argentina MERCOSUR 1,152 886 1,152 7.41% 0 0.00%Brazil MERCOSUR 3,793 -606 3,188 7.44% 606 1.41%Paraguay MERCOSUR 822 1,362 822 23.69% 0 0.00%Uruguay MERCOSUR 92 -413 0 0.00% 92 3.56%ASEAN FTA (1992) Cambodia AFTA 766 195 766 68.13% 0 0.00%Indonesia AFTA 1,053 -2,715 0 0.00% 1,053 3.45%Laos AFTA 290 43 290 61.12% 0 0.00%Malaysia AFTA 5,947 5,337 5,947 12.89% 0 0.00%Myanmar AFTA 826 252 826 39.93% 0 0.00%Philippines AFTA 2,243 5,282 2,243 10.06% 0 0.00%Singapore AFTA 4,367 12,107 4,367 5.70% 0 0.00%Thailand AFTA 4,644 14,631 4,644 9.66% 0 0.00%Vietnam AFTA 2,234 3,342 2,234 30.19% 0 0.00%
30
EC trade deals (1992) Belgium-Lux Hungary, Poland1 338 -29,238 0 0.00% 338 0.28%Denmark Hungary, Poland1 253 -10,915 0 0.00% 253 0.79%France Hungary, Poland1 770 5,916 770 0.37% 0 0.00%Germany Hungary, Poland1 5,928 -9,844 0 0.00% 5,928 1.80%Greece Hungary, Poland1 49 4,323 49 0.23% 0 0.00%Ireland Hungary, Poland1 20 -8,338 0 0.00% 20 0.08%Italy Hungary, Poland1 1,129 -20,560 0 0.00% 1,129 0.82%Netherlands Hungary, Poland1 662 -19,338 0 0.00% 662 0.50%Portugal Hungary, Poland1 22 199 22 0.08% 0 0.00%Spain Hungary, Poland1 140 13,927 140 0.15% 0 0.00%UK Hungary, Poland1 375 13,799 375 0.18% 0 0.00%Hungary EC 2,327 190 2,327 20.35% 0 0.00%Poland EC 11,272 2,760 11,272 42.24% 0 0.00%NAFTA (1994) Canada Mexico 2,692 -56,942 0 0.00% 2,692 1.76%Mexico USA, Canada 24,173 8,265 24,173 27.27% 0 0.00%USA Mexico 54,898 227,412 54,898 7.92% 0 0.00%COMESA (1994) Angola COMESA -1 -1,442 0 0.00% 0 0.00%Burundi COMESA -2 -185 0 0.00% 0 0.00%Congo, DR COMESA 18 -1,527 0 0.00% 18 2.96%Djibouti COMESA 4 164 4 1.46% 0 0.00%Egypt COMESA 56 2,642 56 0.43% 0 0.00%Kenya COMESA -49 -164 0 0.00% 0 0.00%Madagascar COMESA 49 -181 0 0.00% 49 8.37%Malawi COMESA 2 -428 0 0.00% 2 0.54%Mauritius COMESA 32 -335 0 0.00% 32 1.80%Rwanda COMESA 25 -144 0 0.00% 25 16.68%Seychelles COMESA 3 84 3 1.46% 0 0.00%Sudan COMESA 11 101 11 1.07% 0 0.00%Uganda COMESA 221 -302 0 0.00% 221 39.17%Zambia COMESA -4 -631 0 0.00% 0 0.00%Zimbabwe COMESA 0 -900 0 0.00% 0 0.00% Sum (all agreements) 181,588 126,528 197,681 2.94% 20,278 0.30%Sum (CU) 44,676 74,099 42,555 3.93% 2,141 0.20%Sum (FTA) 113,176 36,923 133,718 2.50% 15,755 0.29%Sum (PTA) 23,736 15,506 21,409 7.21% 2,382 0.80% $000,000 = RTA effect during fifth year of new regional agreement in millions of dollars % = TC or TD as % of country’s total imports Customs Unions: EC, MERCOSUR Free Trade Agreements: Israel-USA, EFTA, EC and EFTA trade deals, CUSFTA, NAFTA Other preferential agreements: Andean Community, ASEAN FTA, ECOWAS, MSG, COMESA 1 The EC 92 trade deals also included the Czech Republic but it is excluded from the data set
31
References
Bayoumi, Tamim, and Barry Eichengreen, 1995, “Is Regionalism Simply a Diversion? Evidence from the
Evolution of the EC and EFTA,” NBER Working Paper 5283.
Brown, Drusilla, Alan Deardorff, and Robert Stern, 1992, “A North American Free Trade Agreement:
Analytical Issues and a Computational Assessment,” World Economy 15, 11-29.
Burfisher, Mary, Sherman Robinson, and Karen Thierfelder, 2001, “The Impact of NAFTA on the United
States,” Journal of Economic Perspectives 15(1), 125-144.
Clausing, Kimberly, 2001, “Trade Creation and Trade Diversion in the Canada – United States Free Trade
Agreement,” Canadian Journal of Economics 34 (3), 677-696.
Frankel, Jeffrey, 1997, Regional Trading Blocs in the World Economic System (Institute for International
Economics: Washington, D.C.).
Frankel, Jeffrey, and Andrew Rose, 2002, “An Estimate of the Effect of Common Currencies on Trade
and Income,” Quarterly Journal of Economics 117 (2), 437-466.
Freund, Caroline, and John McLaren, 1999, “On the Dynamics of Trade Diversion: Evidence from Four
Trade Blocs,” International Finance Discussion Papers 637.
Ghosh, Sucharita, and Steven Yamarik, 2004, “Are Regional Trading Arrangements Trade Creating? An
Application of Extreme Bounds Analysis,” Journal of International Economics 63 (2), 369-396.
Goldberger, Arthur, 1991, A Course in Econometrics (Harvard University Press: London).
Haveman, Jon and David Hummels, 1998, “Trade Creation and Trade Diversion: New Empirical
Results,” Journal of Transnational Management Development 3 (2), 47-72.
Karemera, David, and Kalu Ojah, 1998, “An Industrial Analysis of Trade Creation and Diversion Effects
of NAFTA,” Journal of Economic Integration 13 (3), 400-425.
Kehoe, Patrick, and Timothy Kehoe, 1994, “Capturing NAFTA’s Impact with Applied General
Equilibrium Models,” Federal Reserve Bank of Minneapolis’ Quarterly Review (Spring), 17-34.
Krueger, Anne, 1999, “Trade Creation and Trade Diversion under NAFTA,” NBER Working Paper
#7429 (National Bureau of Economic Research: Cambridge).
32
Krugman, Paul, 1991, “The Move toward Free Trade Zones,” in Policy Implications of Trade and
Currency Zones: A Symposium Sponsored by the Federal Reserve Bank of Kansas City (Kansas
City: Federal Reserve Bank of Kansas City) 5-25.
Magee, Christopher, 2003, “Endogenous Preferential Trade Agreements: An Empirical Analysis,”
Contributions to Economic Analysis & Policy 2 (1), article 15,
http://www.bepress.com/bejeap/contributions/vol2/iss1/art15.
Panagariya, Arvind, 2000, “Preferential Trade Liberalization: The Traditional Theory and New
Developments,” Journal of Economic Literature 38, 287-331.
Pomfret, Richard, 1997, The Economics of Regional Trading Arrangements (Clarendon Press: Oxford).
Santos Silva, J.M.C., and Silvana Tenreyo, 2006, “The Log of Gravity,” Review of Economics and
Statistics 88 (4), 641-658.
Soloaga, Isidro and Alan Winters, 2001, “Regionalism in the Nineties: What Effect on Trade?” North
American Journal of Economics and Finance 12, 1-29.
Tinbergen, Jan, 1962, Shaping the World Economy: Suggestions for an International Economic Policy
(The Twentieth Century Fund: New York).
Trefler, Daniel, 2004, “The Long and Short of the Canada-U.S. Free Trade Agreement,” American
Economic Review 94 (4), 870-895.
U.S. International Trade Commission, 1997, The Impact of the North American Free Trade Agreement on
the U.S. Economy and Industries: A Three-year Review (U.S. International Trade Commission:
Washington D.C.).
Viner, Jacob, 1950, The Customs Union Issue (Carnegie Endowment for International Peace: New York).
Wonnacott, Paul, and Mark Lutz, 1989, “Is There a Case for Free Trade Agreements?” in Schott, J., ed.,
Free Trade Areas and U.S. Trade Policy (Institute for International Economics: Washington
D.C.) 59-84.
Wooldridge, Jeffrey, 2006, Introductory Econometrics: A Modern Approach (Thomson South-western:
Mason, OH).

33
Wylie, Peter, 1995, “Partial Equilibrium Estimates of Manufacturing Trade Creation and Diversion due to
NAFTA,” North American Journal of Economics & Finance 6 (1), 65-84.