Embed Size (px)
Citation preview
1 8 April 2013 prepared by Mariana Campeanu
Final Workshop of the Food Balance Sheet components 10 – 12 April 2013
International trade statistics-main component of SUA/FBS compilation
2
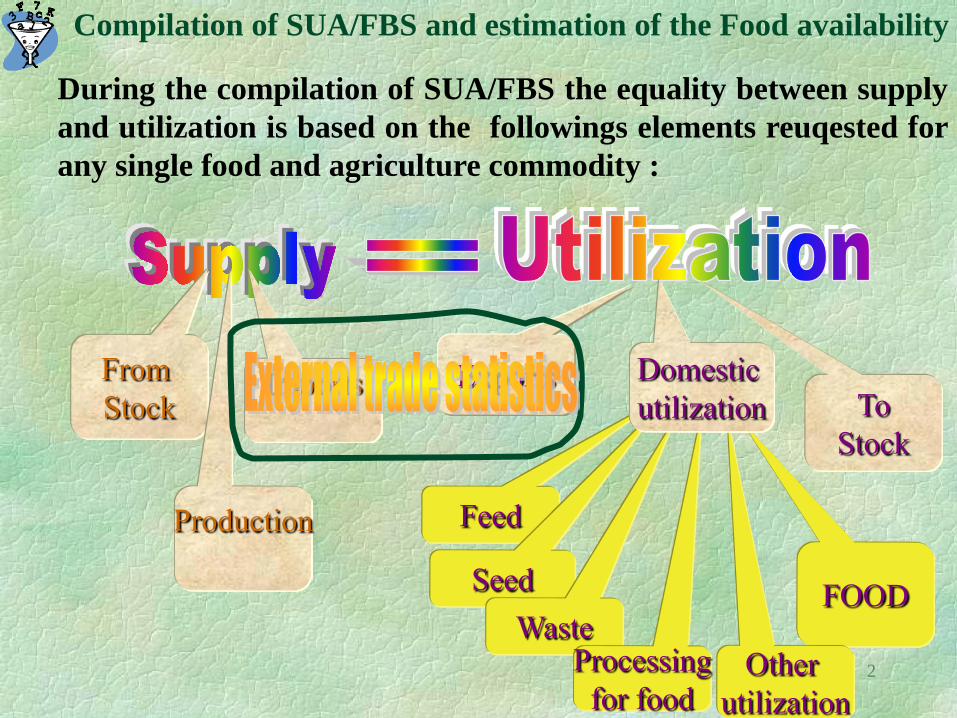
During the compilation of SUA/FBS the equality between supply and utilization is based on the followings elements reuqested for any single food and agriculture commodity :
Compilation of SUA/FBS and estimation of the Food availability
3
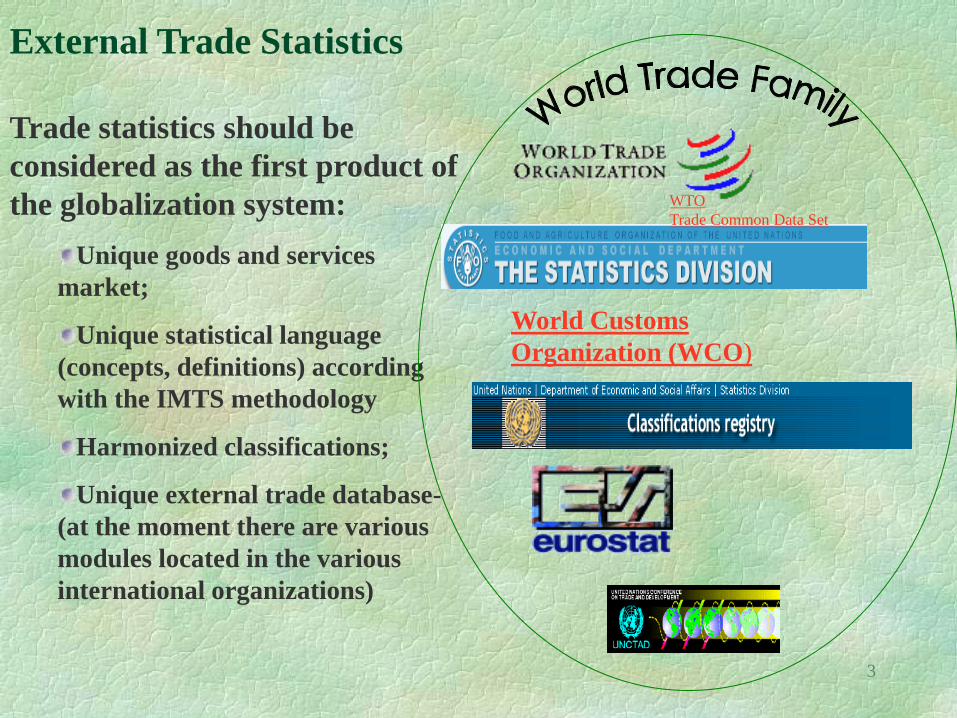
External Trade Statistics
Trade statistics should be considered as the first product of the globalization system:
Unique goods and services market;
Unique statistical language (concepts, definitions) according with the IMTS methodology
Harmonized classifications;
Unique external trade database-(at the moment there are various modules located in the various international organizations)
World Customs Organization (WCO)
WTO Trade Common Data Set
4
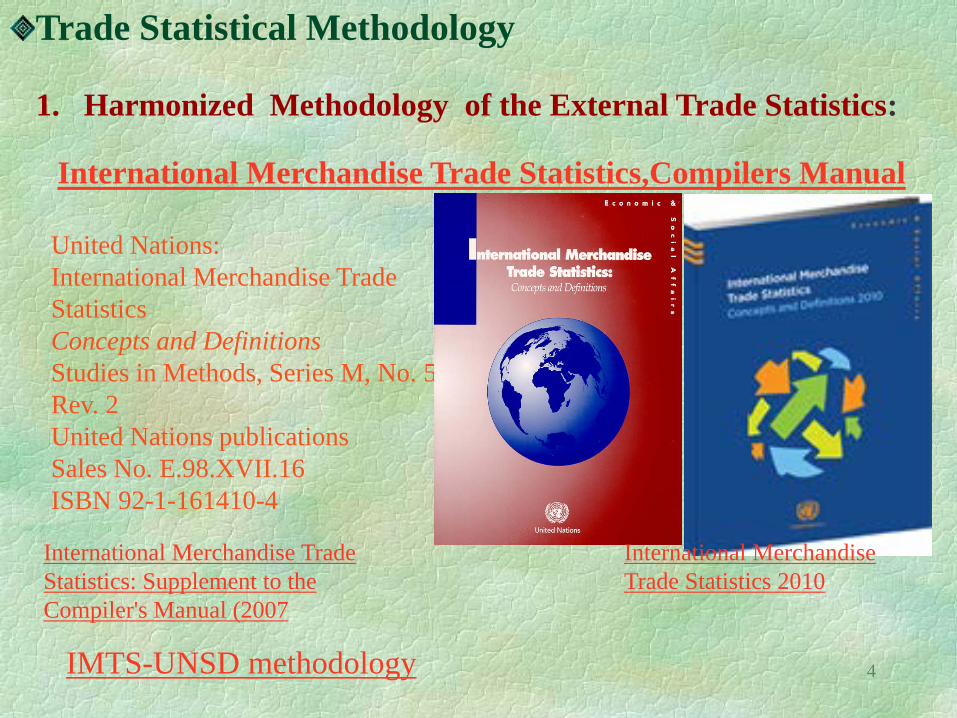
International Merchandise Trade Statistics,Compilers Manual
1. Harmonized Methodology of the External Trade Statistics:
United Nations: International Merchandise Trade Statistics Concepts and Definitions Studies in Methods, Series M, No. 52, Rev. 2 United Nations publications Sales No. E.98.XVII.16 ISBN 92-1-161410-4
Trade Statistical Methodology
IMTS-UNSD methodology
International Merchandise Trade Statistics: Supplement to the Compiler's Manual (2007
International Merchandise Trade Statistics 2010
5
2. Standard international classifications
Trade Statistics
• WCO-Harmonized Commodity Description and Coding system
HS 1992 HS1996 HS2002 HS2007 HS2012 editions
• UNSD: Standard International Trade Classification ( SITC):
SITC SITC Rev.2 SITC Rev.3 SITC Rev4.
6
import/export quantity and value of food and agriculture products by year and country. Sources: • Annual trade data-electronic files:
• data exchange between FAO and other international organizations (UNSD, EUROSTAT); joint letter FAO-UNSD
• country request including the specifications on the standard layout of the trade data file;
• joint letter: FAO-AOAD and FAO-SPC Fiji • Other sources:
• Traditional publications (trade yearbooks) • Virtual publications (web sites):Example: Custom Department of
Lebanon total merchandise trade-including agriculture and non-agriculture
products. Source: national publications, CDS-WTO, UNSD-Annual Total trade table(ATT), trade data files.
food aid - Source:WFP database annual exchange rate:Source: IMF-annual file, national publications
International Trade Statistics –data sources
7
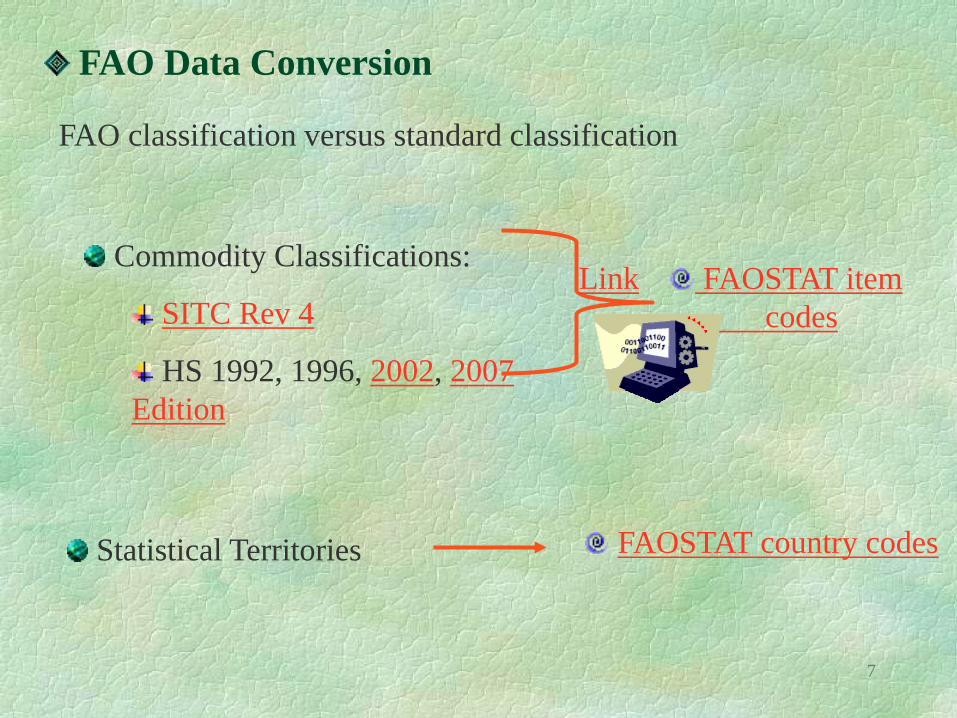
Commodity Classifications:
SITC Rev 4
HS 1992, 1996, 2002, 2007 Edition
Statistical Territories
Link FAOSTAT item codes
FAOSTAT country codes
FAO Data Conversion
FAO classification versus standard classification
8
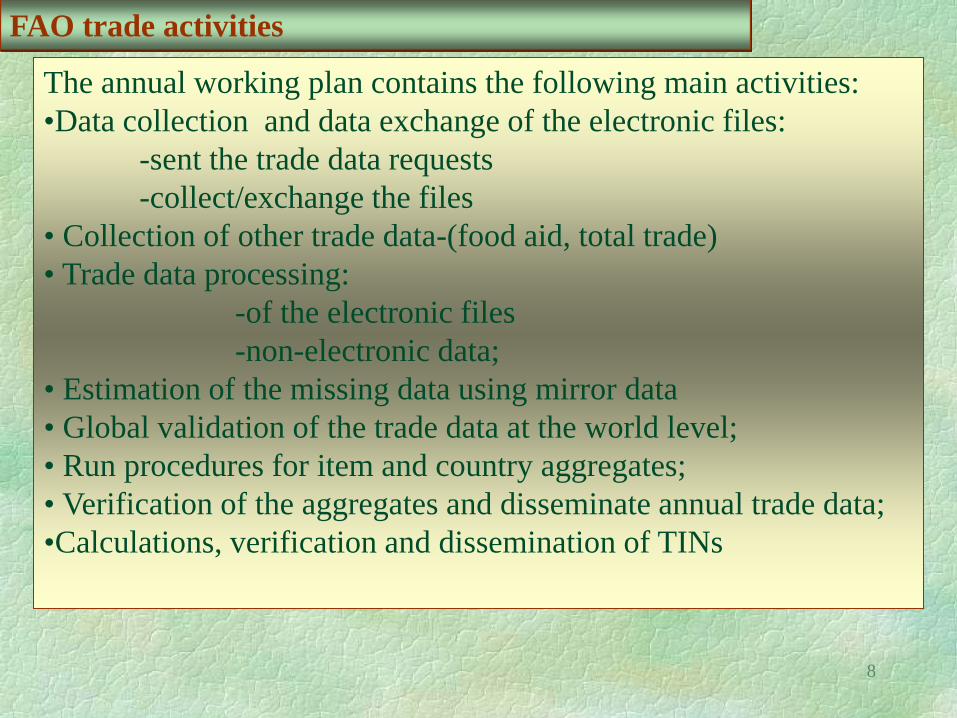
FAO trade activities
The annual working plan contains the following main activities: •Data collection and data exchange of the electronic files: -sent the trade data requests -collect/exchange the files • Collection of other trade data-(food aid, total trade) • Trade data processing:
-of the electronic files -non-electronic data;
• Estimation of the missing data using mirror data • Global validation of the trade data at the world level; • Run procedures for item and country aggregates; • Verification of the aggregates and disseminate annual trade data; •Calculations, verification and dissemination of TINs
9
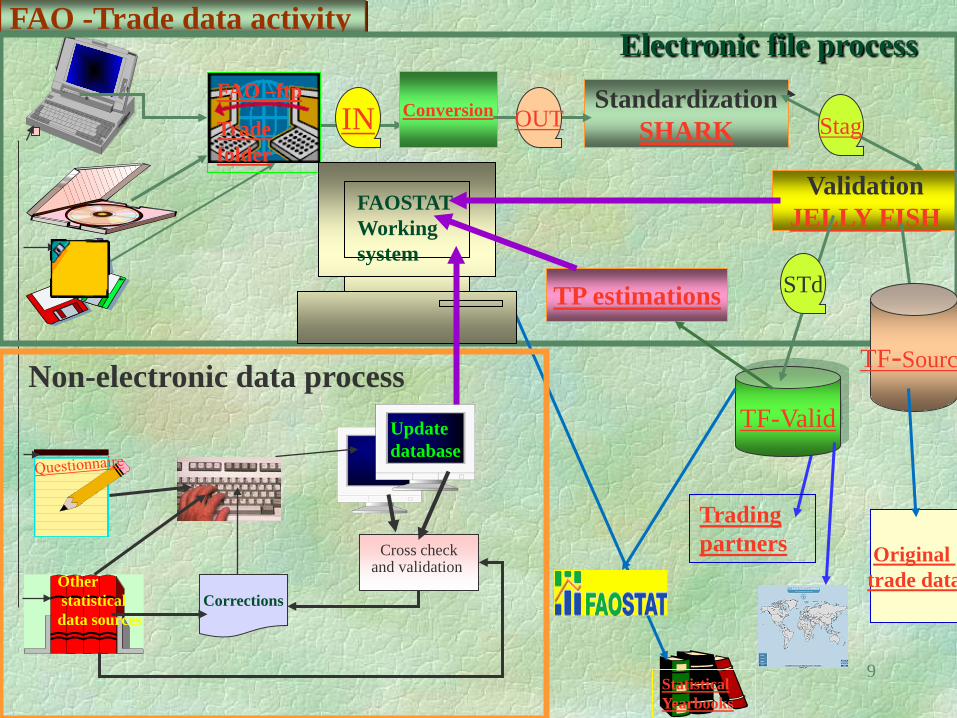
FAO -Trade data activity
Cross check and validation
Corrections Other statistical data sources
Update database
Statistical Yearbooks
FAO –ftp
Trade folder
Standardization SHARK
Conversion
Validation JELLY FISH
Electronic file process
Non-electronic data process TF-Sourc
TF-Valid
TP estimations
FAOSTAT Working system
Original trade data
Trading partners
IN OUT Stag
STd
10
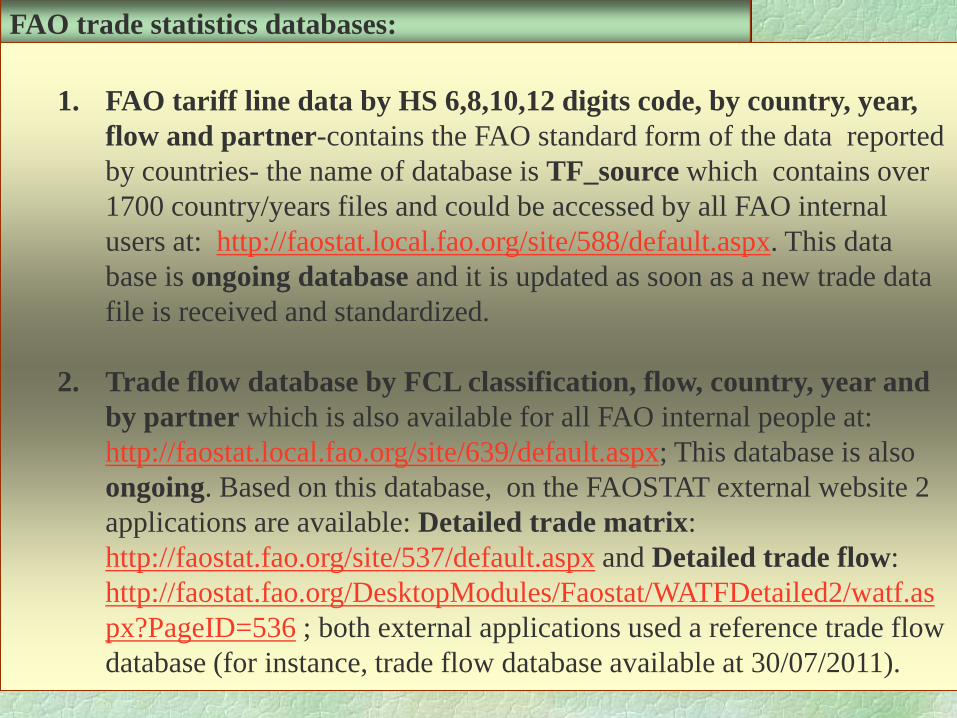
FAO trade statistics databases:
1. FAO tariff line data by HS 6,8,10,12 digits code, by country, year, flow and partner-contains the FAO standard form of the data reported by countries- the name of database is TF_source which contains over 1700 country/years files and could be accessed by all FAO internal users at: http://faostat.local.fao.org/site/588/default.aspx. This data base is ongoing database and it is updated as soon as a new trade data file is received and standardized.
2. Trade flow database by FCL classification, flow, country, year and
by partner which is also available for all FAO internal people at: http://faostat.local.fao.org/site/639/default.aspx; This database is also ongoing. Based on this database, on the FAOSTAT external website 2 applications are available: Detailed trade matrix: http://faostat.fao.org/site/537/default.aspx and Detailed trade flow: http://faostat.fao.org/DesktopModules/Faostat/WATFDetailed2/watf.aspx?PageID=536 ; both external applications used a reference trade flow database (for instance, trade flow database available at 30/07/2011).
11
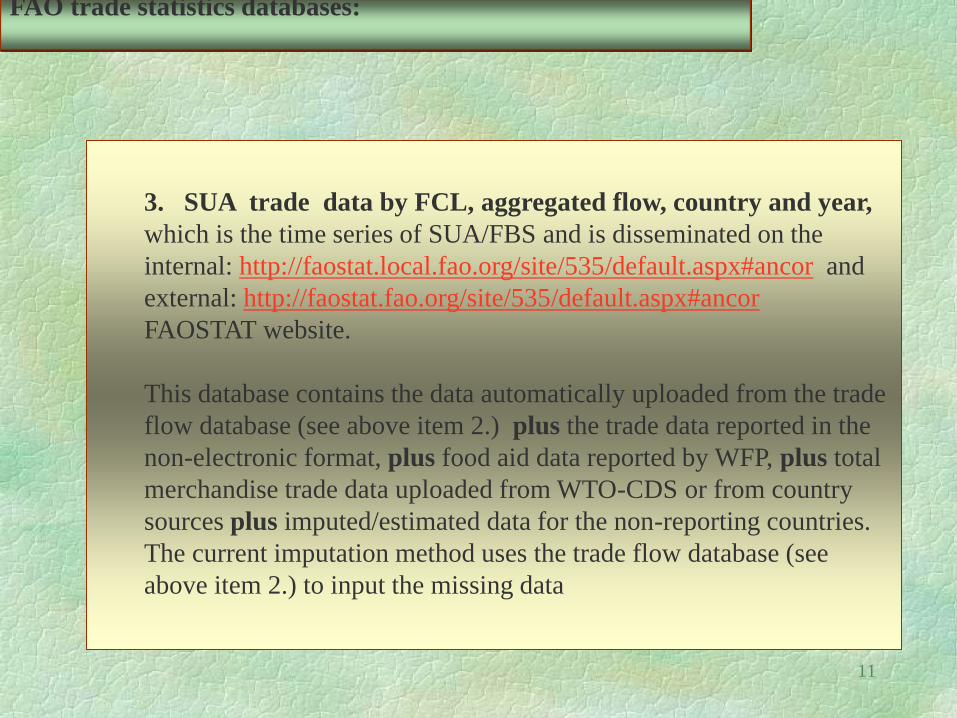
FAO trade statistics databases:
3. SUA trade data by FCL, aggregated flow, country and year, which is the time series of SUA/FBS and is disseminated on the internal: http://faostat.local.fao.org/site/535/default.aspx#ancor and external: http://faostat.fao.org/site/535/default.aspx#ancor FAOSTAT website.
This database contains the data automatically uploaded from the trade flow database (see above item 2.) plus the trade data reported in the non-electronic format, plus food aid data reported by WFP, plus total merchandise trade data uploaded from WTO-CDS or from country sources plus imputed/estimated data for the non-reporting countries. The current imputation method uses the trade flow database (see above item 2.) to input the missing data
12
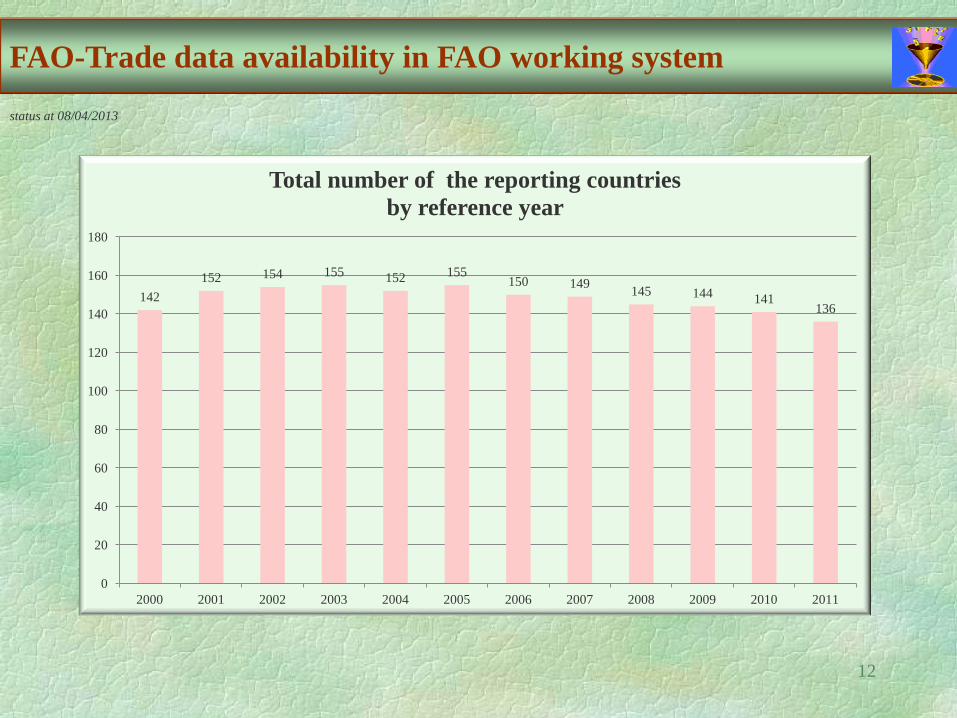
FAO-Trade data availability in FAO working system
142 152 154 155 152 155
150 149 145 144 141 136
0
20
40
60
80
100
120
140
160
180
2000 2001 2002 2003 2004 2005 2006 2007 2008 2009 2010 2011
Total number of the reporting countries by reference year
status at 08/04/2013
13
FAO-Trade data availability in FAO working system
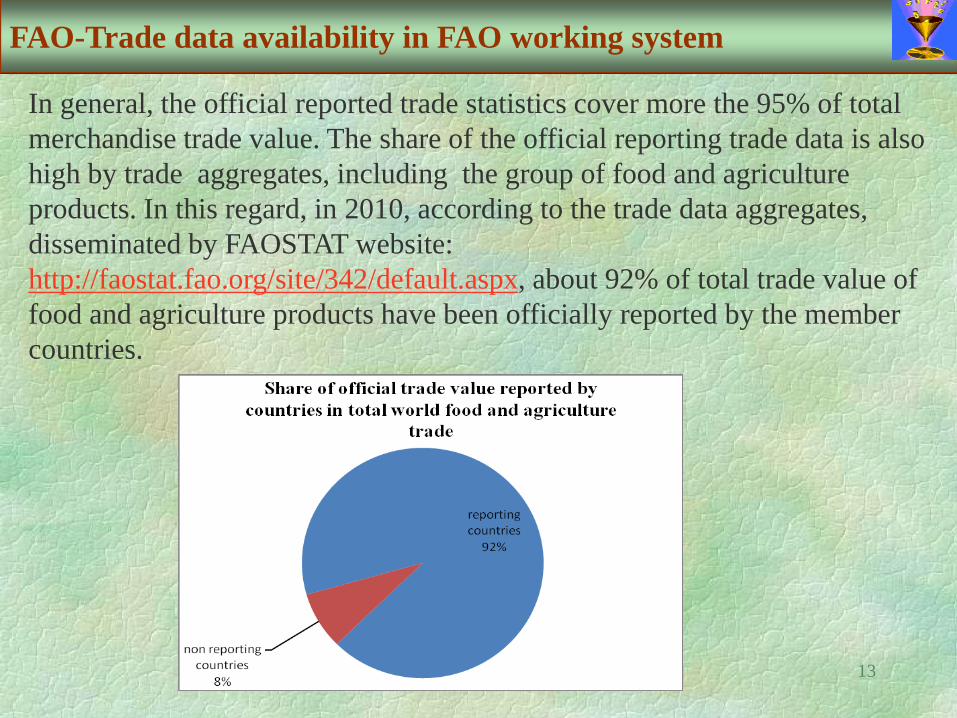
In general, the official reported trade statistics cover more the 95% of total merchandise trade value. The share of the official reporting trade data is also high by trade aggregates, including the group of food and agriculture products. In this regard, in 2010, according to the trade data aggregates, disseminated by FAOSTAT website: http://faostat.fao.org/site/342/default.aspx, about 92% of total trade value of food and agriculture products have been officially reported by the member countries.
14
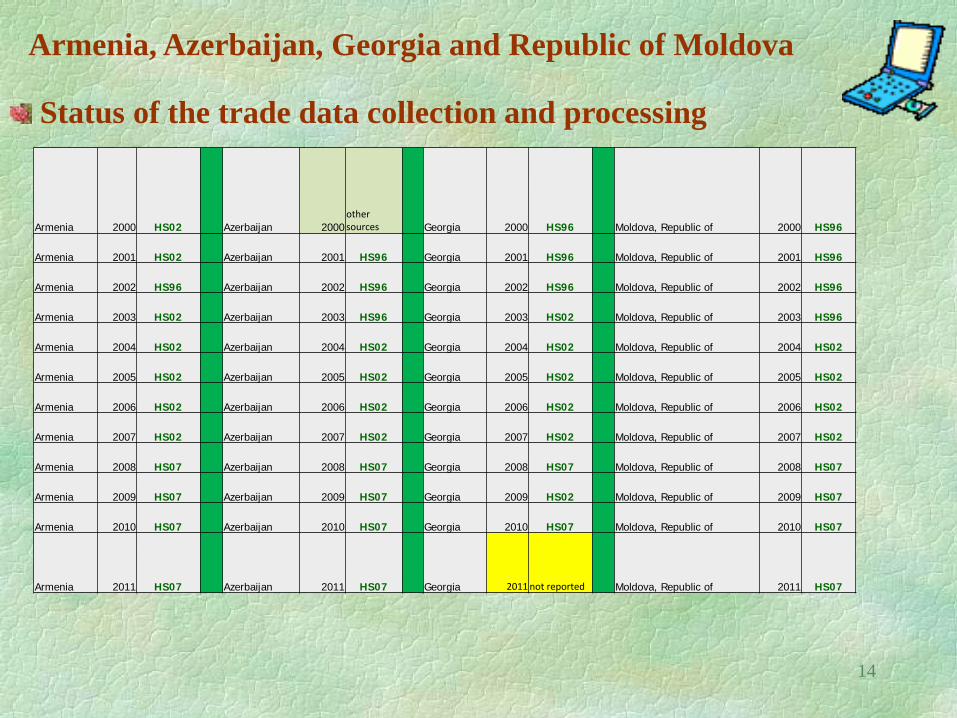
Status of the trade data collection and processing
Armenia 2000 HS02 Azerbaijan 2000 other sources Georgia 2000 HS96 Moldova, Republic of 2000 HS96
Armenia 2001 HS02 Azerbaijan 2001 HS96 Georgia 2001 HS96 Moldova, Republic of 2001 HS96
Armenia 2002 HS96 Azerbaijan 2002 HS96 Georgia 2002 HS96 Moldova, Republic of 2002 HS96
Armenia 2003 HS02 Azerbaijan 2003 HS96 Georgia 2003 HS02 Moldova, Republic of 2003 HS96
Armenia 2004 HS02 Azerbaijan 2004 HS02 Georgia 2004 HS02 Moldova, Republic of 2004 HS02
Armenia 2005 HS02 Azerbaijan 2005 HS02 Georgia 2005 HS02 Moldova, Republic of 2005 HS02
Armenia 2006 HS02 Azerbaijan 2006 HS02 Georgia 2006 HS02 Moldova, Republic of 2006 HS02
Armenia 2007 HS02 Azerbaijan 2007 HS02 Georgia 2007 HS02 Moldova, Republic of 2007 HS02
Armenia 2008 HS07 Azerbaijan 2008 HS07 Georgia 2008 HS07 Moldova, Republic of 2008 HS07
Armenia 2009 HS07 Azerbaijan 2009 HS07 Georgia 2009 HS02 Moldova, Republic of 2009 HS07
Armenia 2010 HS07 Azerbaijan 2010 HS07 Georgia 2010 HS07 Moldova, Republic of 2010 HS07
Armenia 2011 HS07 Azerbaijan 2011 HS07 Georgia 2011 not reported Moldova, Republic of 2011 HS07
Armenia, Azerbaijan, Georgia and Republic of Moldova
15
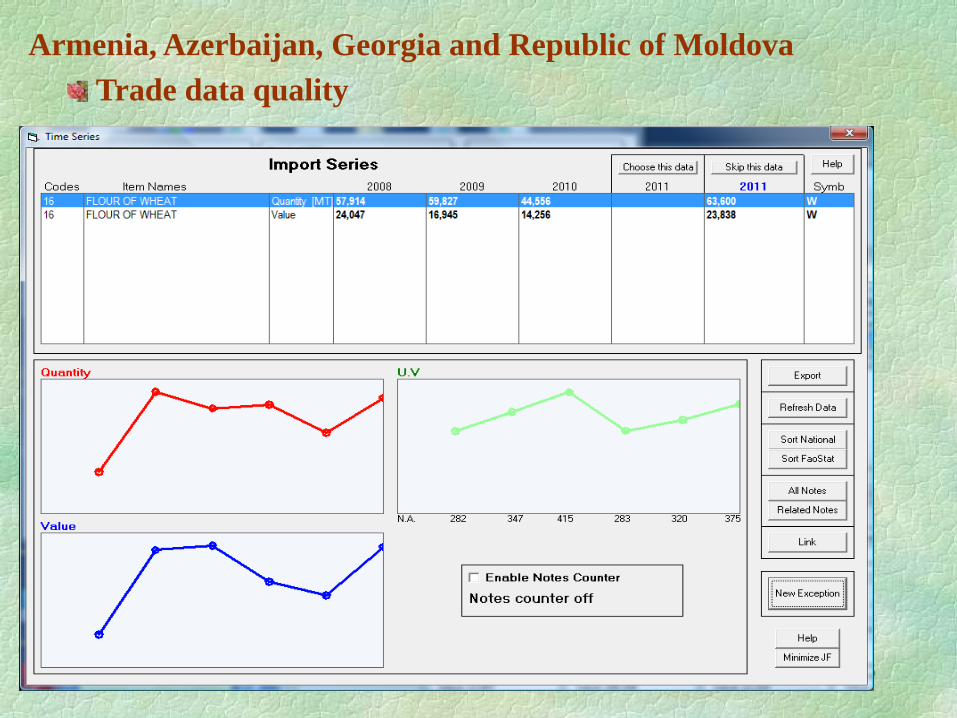
Trade data quality Armenia, Azerbaijan, Georgia and Republic of Moldova
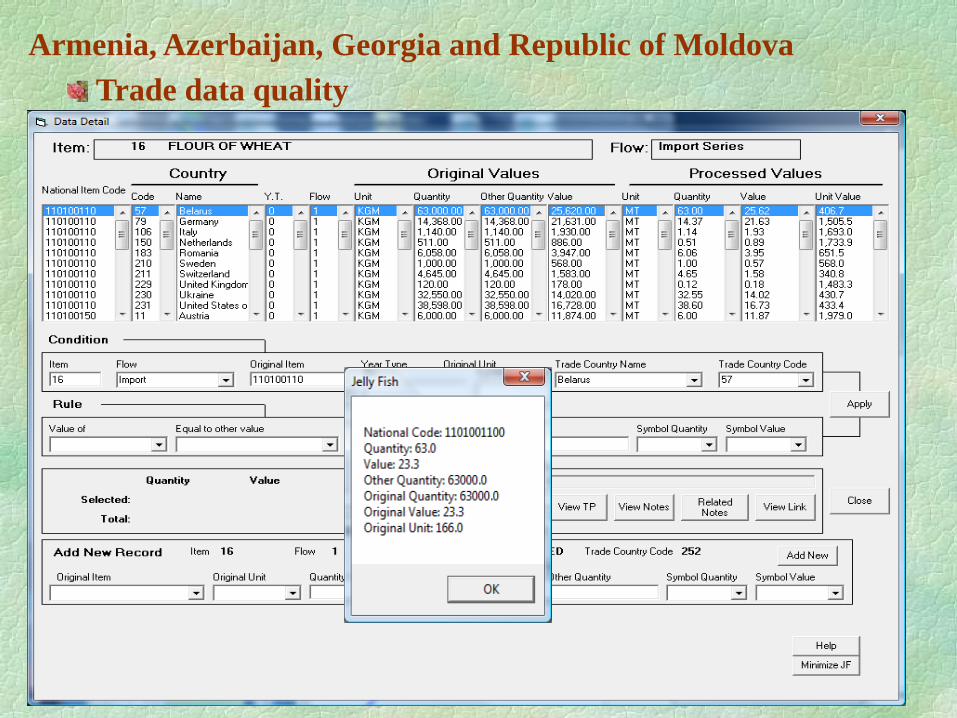
16
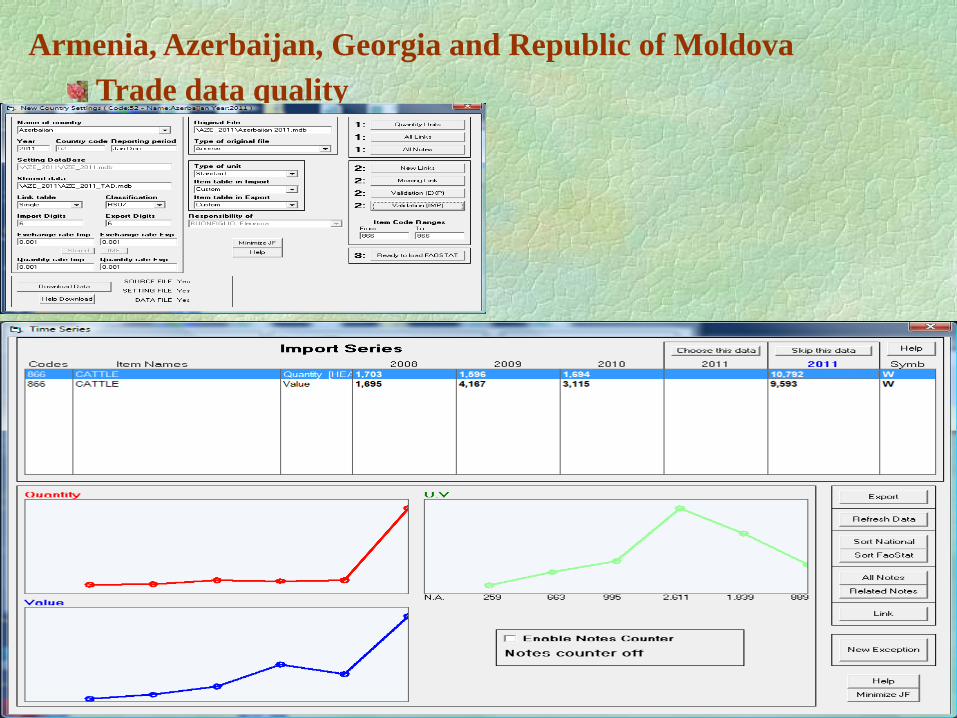
Trade data quality Armenia, Azerbaijan, Georgia and Republic of Moldova
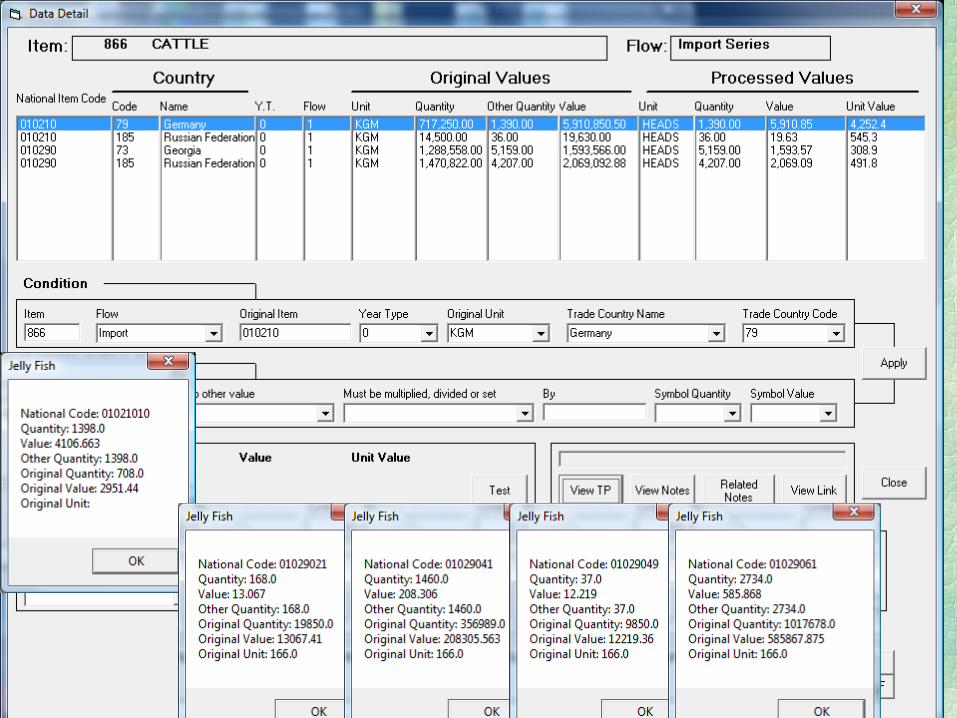
17
Trade data quality Armenia, Azerbaijan, Georgia and Republic of Moldova
18

19