Embed Size (px)
Citation preview

Trade flow patterns of maize in South Africa – Adjusting to structural changes
Prepared by
The Bureau for Food and Agricultural Policy
For
The Maize Trust
First Draft: May 2014
Final version: June 2014

Contents 1. Introduction .................................................................................................................................... 3
2. An overview of maize market fundamentals and trade flow patterns ........................................... 4
3. Destinations for maize exports en sources for maize imports ..................................................... 10
4. Shifting fundamentals in regional maize markets ........................................................................ 14
5. An outlook of Southern African maize production – surpluses vs shortfalls ................................ 20
5.1 Regional commodity balance sheets for maize .................................................................... 20
5.2 South African maize outlook and the implications for trade ................................................ 22
5.3 Potential trade flow scenarios for 2014/15 .......................................................................... 25
6. Conclusion ..................................................................................................................................... 27
7. References .................................................................................................................................... 28
Figure 1: South African maize feed demand ........................................................................................... 6
Figure 2: South African white maize price and trade space ................................................................... 7
Figure 3: South African yellow maize price and trade space .................................................................. 8
Figure 4: South African white maize price space .................................................................................... 8
Figure 5: South African yellow maize price space ................................................................................... 9
Figure 6: South African white maize exports per destination .............................................................. 11
Figure 7: South African yellow maize exports per destination ............................................................. 12
Figure 8: South African white maize imports per destination .............................................................. 13
Figure 9: South African yellow maize imports per destination ............................................................. 13
Figure 10: Leading Southern African exporting countries .................................................................... 14
Figure 11: Zambian maize production, exports and prices ................................................................... 16
Figure 12: Zambian maize area planted ................................................................................................ 17
Figure 13: Leading Southern African Importing countries .................................................................... 18
Figure 14: Rail map of Africa ................................................................................................................. 19
Figure 15: Base - White maize production, consumption and yield ..................................................... 23
Figure 16: White maize price and trade space ..................................................................................... 23
Figure 17: Yellow maize production, consumption and yield ............................................................... 24
Figure 18: Base Yellow maize price and trade space ............................................................................ 25
Figure 19: Recent trends in regional Maize production ....................................................................... 26
Figure 20: Potential maize trade flow map, 2014/15 ........................................................................... 27
Table 1: South African white maize balance sheet ................................................................................. 4
Table 2: South African yellow maize balance sheet ................................................................................ 5
Table 3 Union of African Railways 10-corridor master plan ................................................................. 19
Table 4: Maize balance sheets for South-East Africa ............................................................................ 20
Table 5: Macro-economic baseline assumptions .................................................................................. 22

1. Introduction Before the maize market was liberalized, trade in South Africa was relatively simple. Under
controlled marketing, maize prices were set by the Maize Board at levels that were in many
years significantly higher than export parity levels. Furthermore, maize prices were also far
less volatility than under a free market regime. As a consequence the area under maize
production expanded rapidly and in years of good rains, farmers produced a surplus of
maize, which was then exported by the Maize Board. Maize was often exported at a so
called ‘loss’ when the local prices that were offered to farmers where higher than export
parity. This loss was cross subsidized by higher prices on the local market. In short, the
Maize Board was applying the principles of a surplus removal scheme.
With the abolishment of the marketing boards a completely new environment of price
discovery was introduced with the opening of the futures markets and local supply and
demand dynamics driving the relative level of maize prices within an import-export parity
price band. If South Africa has a surplus of maize, prices tend to trade lower towards or at
export parity levels and if the markets happens to be in a shortfall of maize, prices will trade
at import parity levels. Within this free market environment, relative price levels provide the
trigger for trade to occur where the surplus has to get big enough and general market prices
drop low enough enabling private exporting companies to purchase maize and export the
maize at a profit. Before significant volumes are exported to affect the projected carry-out
levels, local prices are depressed, which could lead to lower production levels if sustained
for a longer period of time and only after all or most of the surplus has been removed prices
ease away from export parity levels and the cycle starts all over again.
Over the past five years structural shifts in regional maize markets have brought along a
new set of dynamics. Surplus production out of Zambia and Malawi has started feeding into
South Africa’s traditional white maize export markets. In the 2011/12 exporters managed to
export large surpluses of South African white maize to Mexico due to their severe drought,
which led to a shortfall in the Mexican white maize markets. However, Mexico will not
always be a major off-take market for South African white maize and together with new
regional dynamics in terms of surplus maize production, stakeholders in the South African
maize value chain are already adapting to this new marketing environment.

Against this background this study provides an overview of recent South African maize trade
flow patterns and sets out to put these trade flow patterns within the context of the outlook
for maize production and consumption trends in South Africa and the region. This study
presents maize commodity balance sheets for African countries in the region that are
published for the first time. These balance sheets were generated by the newly established
Regional Network of National Agricultural Policy Research Institutes (ReNAPRI)1 African
countries. The commodity balance sheets serve as basis to generate a visual representation
of potential trade flow patterns of maize in the region.
2. An overview of maize market fundamentals and trade flow
patterns
Behind any trade flow of a commodity, there lays a commodity balance sheet that portrays
the balance between total supply and total demand in the market. Tables 1 and 2 present
the historic commodity balance sheet for South African white and yellow maize.
Table 1: South African white maize balance sheet
2001 2002 2003 2004 2005 2006 2007 2008 2009 2010 2011 2012 2013
thousand hectares
Area harvested 1596 1843 2083 1842 1700 1033 1625 1737 1489 1720 1418 1636 1617
t/ha
Yield 2.9 3.0 3.1 3.2 3.8 4.1 2.7 4.3 4.6 4.6 4.3 4.2 3.4
thousand tons
Production 4636 5576 6366 5647 6108 4392 4309 7190 6737 7518 6105 6867 5545
Feed cons 446 105 641 733 543 787 1142 772 362 1658 1202 902 692
Human cons 3858 3643 3687 3580 3643 3598 3609 4260 4193 4213 4172 4105 4130
Domestic use 4585 3874 4925 4656 4365 4584 4936 5080 4660 6145 5535 5147 4962
Ending stocks 559 1718 2123 2402 2301 1630 618 762 1362 1609 518 785 570
Imports 47 274 33 0 0 1 46 0 0 0 133 11 90
Exports 812 817 1069 712 1844 480 431 1966 1477 1126 1794 1464 888
R/ton
SAFEX price 1304 1540 1004 823 854 1422 1799 1799 1504 1300 1638 2312 2263
Source: BFAP, March 2014
1 ReNAPRI is a network of policy institutes in seven countries that collaborate under a Memorandum of Understanding. BFAP was instrumental in the establishment of ReNAPRI and is represented on ReNAPRI’s Board of Directors and leads the technical committee.

Table 2: South African yellow maize balance sheet
2001 2002 2003 2004 2005 2006 2007 2008 2009 2010 2011 2012 2013
thousand hectares
Area harvested 1112 1174 1017 1001 1110 567 927 1062 939 1023 954 1063 1160
t/ha
Yield 3.0 3.1 3.1 3.4 3.6 4.1 2.8 4.4 5.2 4.4 4.4 4.7 5.3
thousand tons
Production 3300 3734 3026 3446 3947 2315 2573 4709 4892 4498 4235 5032 6142
Feed cons 3011 3373 3078 3012 3477 3260 3286 3695 4265 3109 3614 3936 4228
Human cons 247 249 245 262 258 290 257 326 346 356 393 397 359
Domestic use 3324 3665 3809 3300 3792 3556 3553 4045 4650 3472 3993 4353 4839
Ending stocks 643 992 501 746 868 440 431 819 769 727 476 679 893
Imports 348 651 408 219 360 930 1074 27 27 0 288 0 0
Exports 523 371 116 120 393 117 103 303 319 1068 781 476 1089
R/ton
SAFEX price 1168 1293 1047 863 794 1415 1852 1766 1403 1379 1682 2331 2351
Source: BFAP, March 2014
From the tables it is clear that in the majority of marketing seasons SA was a net exporter of
white and yellow maize with domestic production exceeding domestic consumption levels
by a significant margin. However, during the period 2001 to 2013 SA experienced one
significant drought in 2007, which affected all yields. Yet, despite of ending stocks
plummeting SA still exported more white maize in that season than what was imported. The
majority of white maize exports went into neighbouring countries Botswana, Lesotho,
Namibia, Mozambique and Zimbabwe and the white maize that was imported originated
from Zambia. In the case of yellow maize however, more than 1 million tons was imported
from Argentina, which represents the highest level of imports of yellow maize over the
period and only a small volume was exported to feed mills in Namibia and Swaziland.
Whereas yellow maize imports matched and exceeded the level of exports before 2007, the
level of exports rose significantly from 2008 onwards and only in 2011 a meaningful amount
of yellow maize was imported from Romania and Ukraine. In the case of white maize the
trade patterns have remained relatively stable, yet from 2011 onwards more consistent
volumes of white maize have been imported from Zambia.
The main drive behind higher export levels has been an increase in average yields, especially
in the case of yellow maize where national yields have increased above 5t/ha. Yields where
driven by the rapid adoption of improve hybrids and GMO technology. Furthermore, the
sharp rise in prices in 2008 boosted profit margins, which initiated a wave of investment in
irrigation infrastructure and the area under centre pivot irrigation increased rapidly. It is
mainly yellow maize that is produced under centre pivots with new varieties and good
management pushing yields comfortably above 16t/ha. Whereas the area under yellow

maize has remained relatively stable the area under white maize production has shrunk
over the past decade by approximately 300 000 ha, with the main loss in production
occurring in the marginal areas in the Western parts of the country.
The drastic decline in the area under production and the consequent drop in export levels in
2006 can be regarded as an anomaly. For three consecutive seasons (2003 to 2005) maize
prices had fallen and on the back of the desperate position of farmers and strong lobbying
by the producers organization, maize farmers reduced plantings by more than 40% resulting
in a shortfall of maize and prices increasing to import parity levels. In the consecutive
season maize hectares jumped back to more average levels but yields were low due to a
severe drought.
Apart from the production trends, the dynamics in the demand for white and yellow maize
are also playing a role in the trade flow patterns. Compare to a relatively sluggish increase of
only 8% in the demand for maize in the human market and therefore mainly white maize,
the demand in the feed market has expanded by 45% over the past 10 years and this trends
is set to continue. Another important observation within the feed market is that feed mills
seem to have a larger uptake of white maize in the feed market. This is evident in figure 1
that clearly illustrates higher volumes of white maize flowing into the feed market over the
long run.
Figure 1: South African maize feed demand Source: BFAP, April 2014
Since the SA maize industry operates in a free market environment, the main driver behind
the market fundamentals that are highlighted in the section above remain the maize prices
and how these local prices are trading in relationship to the import and export parity prices.
Figures 2 and 3 illustrate the price space for white and yellow maize and bring these relative
0
1000
2000
3000
4000
5000
6000
2001 2002 2003 2004 2005 2006 2007 2008 2009 2010 2011 2012 2013
Tho
usa
nd
to
ns
SA Maize feed demand
Yellow maize
White maize

price movements into comparison with the level of imports and exports. The first important
point to take note of is that these prices are expressed as annual averages. Furthermore, the
parity prices are derived from the US Gulf free on board price, which can be used as a proxy
for the world maize price, but within a season there can be significant differences across
various maize markets world worldwide, not even to mention the big differences occurring
in the regional maize markets. One observation that can, however be made is that the
relative movement of local prices within the import-export parity band seems to be
consistent with what one would expect from a free market where local prices trade closer to
export parity levels in years of bigger surpluses and trade closer to import parity levels in
years where stock levels are significantly lower. The structural shift in the yellow maize
market is evident from figure 3 with local prices trading closer to export parity level and
therefore boosting exports while imports are almost disappearing (except for 2011).
Figure 2: South African white maize price and trade space Source: BFAP, April 2014
0
500
1000
1500
2000
2500
0
1000
2000
3000
4000
5000
1997 1999 2001 2003 2005 2007 2009 2011 2013
Tho
usa
nd
to
ns
R/t
on
White maize
White maize imports White maize exports Import parity Randfontein
SAFEX Export parity africa

Figure 3: South African yellow maize price and trade space Source: BFAP, April 2014
Taking only the annual averages into consideration, one can raise the question of where the
incentives for large volumes of exports or imports come from if prices are not moving
outside of the band in order for traders to lock in some profits. Hence, analysing the
monthly price trends becomes far more interesting and illustrates how the local market has
the ability to move from export parity to import parity within one season or simultaneously
export out of the harbours and import across the border from countries like Zambia.
Figure 4: South African white maize price space Source: GrainSA, April 2014
0
300
600
900
1200
0
500
1000
1500
2000
2500
3000
3500
1997 1999 2001 2003 2005 2007 2009 2011 2013
Tho
usa
nd
to
ns
R/t
on
Yellow maize
Yellow maize imports Yellow maize exports Import parity Durban
SAFEX Export parity africa
1 400
1 900
2 400
2 900
3 400
3 900
4 400
1-M
ar-1
1
30
-Ap
r-1
1
29
-Ju
n-1
1
28
-Au
g-1
1
27
-Oct
-11
26
-De
c-1
1
24
-Fe
b-1
2
24
-Ap
r-1
2
23
-Ju
n-1
2
22
-Au
g-1
2
21
-Oct
-12
20
-De
c-1
2
18
-Fe
b-1
3
19
-Ap
r-1
3
18
-Ju
n-1
3
17
-Au
g-1
3
16
-Oct
-13
15
-De
c-1
3
13
-Fe
b-1
4
14
-Ap
r-1
4
R/t
on
White maize price space
USA Import Parity
Safex WM
USA Export Parity

Figure 5: South African yellow maize price space Source: GrainSA, April 2014
Figures 4 and 5 provide a clear impression of the level of volatility in the SA white and
yellow maize markets just over the past two marketing seasons. The first important
observation to make is that whereas the annual average prices do not present the
opportunities for arbitrage where traders can fix import or export contracts, the monthly
prices clearly present the periods where local prices are trading outside of the parity band.
Local prices that are trading below export parity levels provide the necessary incentives for
exporters to secure export contracts (for e.g. May 2011 and May 2013). These periods
where followed by large volumes of exports flowing out of the country and local prices
consequently breaking away from export parity levels as stock levels are reduced. Apart
from the movement in world prices and the exchange rate, local prices tend to be the
highest around planting time. Although there is a discount between the spot price and the
futures price at harvesting time in most of the seasons, a price premium is factored into the
futures prices, which provides an additional incentive for farmers to plant maize. This price
cycle remains an important driver for SA to maintain the position as surplus producer of
maize.
From the discussion above it is therefore evident, that trade flow under a free market
dispensation provides the required incentives for markets to maintain equilibrium between
demand and supply. Having said this, it is worth noting the drastic rise in prices over the
period January to March 2014. This represents a period where one can argue that exporters
might have overshot their target by securing too high volumes of export contracts and the
1 400
1 900
2 400
2 900
3 400
3 900
4 400
1-M
ar-1
1
30
-Ap
r-1
1
29
-Ju
n-1
1
28
-Au
g-1
1
27
-Oct
-11
26
-De
c-1
1
24
-Fe
b-1
2
24
-Ap
r-1
2
23
-Ju
n-1
2
22
-Au
g-1
2
21
-Oct
-12
20
-De
c-1
2
18
-Fe
b-1
3
19
-Ap
r-1
3
18
-Ju
n-1
3
17
-Au
g-1
3
16
-Oct
-13
15
-De
c-1
3
13
-Fe
b-1
4
14
-Ap
r-1
4
R/t
on
Yellow maize trade space
ARG Import Parity
USA Import parity
Safex YM
USA Export Parity

market not responding fast enough to the depletion of stock levels by raising prices
sufficiently to disincentives exports. The situation was exacerbated by three further events.
Although yellow maize could have been imported from Argentina to supplement local stock
levels, the specific GM events that are planted in Argentina are not registered in South
Africa and therefore a special certification for the imports had to be issued, which took a
long time to process within the governmental departments. Secondly, because the Western
Cape market is relative small, the local processors had to book a parcel of maize individually
for the uptake of a full shipment before it was worth the while for an importer to book such
shipment. Typically under free market circumstances this delayed the order time for the
shipment. Thirdly, at the time the alternative source of yellow maize imports was the
Ukraine, however political instability in this country caused major delays and the shipment
of yellow maize arrived a few weeks late, which added to the periodic panic in the local
market causing maize prices to rise sharply.
The fact that SA is in a position where future exports do not have to be declared by the
exporting companies as is the case in the US, implies that information regarding the future
position of export volumes is not transparent to all roleplayers on the market. Over the past
two years industry forums have discussed this challenge in detail, which led to the
establishment of the National Supply and Demand Estimates Committee that is chaired by
the National Agricultural Marketing Council (NAMC). The role of this committee is to
compile commodity balance sheet on a monthly basis that project all supply and demand
items for maize, wheat, sunflower and soybeans and based on these projections calculate
the carry-over stocks at the end of the season. The 2013/14 season was the first year of
operation of this committee and the projected ending stock levels that were published by
the committee seemed to be relatively on target. One has to assume that it will take some
adjustments and a period of validation of this information in the market place. However,
despite of transparent market information there will always be external events like the two
examples mentioned above that can lead to extreme market volatility over the short run
and sometimes resulting in market participants to be caught it tight positions in the market.
3. Destinations for maize exports en sources for maize imports This section of the study provides an overview of historic export destinations and sources of
imports. Figures 6 and 7 illustrate the volumes and destinations of maize trade since 2001.
Some of these facts have already been mentioned in the section above. From the graphical
presentation it is evident that although SA maize export levels are very volatility, the
country has managed to export more than 1 million tons of maize each year following the
drought in 2007 and reaching more than 2.5 million tons in 2011 and 2013. When having a
closer look at the exporting destinations for white maize, it becomes clear that SA has a
handful of “fixed customers” that are always in the market with relatively fixed volumes.
These customers are Swaziland, Mozambique, Botswana and Namibia. In most of the
seasons Zimbabwe is also importing but the volumes are varying from one season to the

next. In 2005 SA exported more than 1 million tons to Zimbabwe and in 2008 a further
500 000 tons. However, this is a typical example where region trade dynamics started
playing a role. Zimbabwe turned to non-GM white maize surpluses produced in Zambia in
2011 and 2012 season. Yet in 2013 the Zambian government introduced export restrictions
due to shrinking maize stocks and Zimbabwe turned back to South Africa to supplement
white maize stock levels in the country. This is evident from the end period in figure 6 where
Zimbabwe becomes the main exporting destination again. In 2009, South Africa exported
large volumes of white maize to Kenya despite of Kenya imposing restrictive policies on GM
maize. Apart from highlighting the volatile nature of trade within the region, these trends
also illustrate the fact that the trade policies with respect to GM maize are not consistently
applied in the region.
Figure 6: South African white maize exports per destination Source: SAGIS, April 2014
Since human consumption of white maize as staple food is not common, deep sea export
destinations are limited for South African white maize. In 2011/12 season Mexico
experienced a drought and SA exported large volumes of white maize for the human
consumption market. SA white maize was competitively priced due to large surpluses in the
local market.
Similar to white maize, yellow maize export levels are also very volatile and apart from a
handful of consistent and small clients engaging in cross-border trade, the major export
destinations are changing based on relative pricing of SA yellow maize in the world market.
Typical markets where SA yellow maize has in recent years competed include Korea, Japan
0
500
1000
1500
2000
20
03
/20
04
20
04
/20
05
20
05
/20
06
20
06
/20
07
20
07
/20
08
20
08
/20
09
20
09
/20
10
20
10
/20
11
20
11
/20
12
20
12
/20
13
20
13
/20
14
Vo
lum
e (
tho
usa
nd
to
n)
SA white maize exports
Zimbabwe
Botswana
Mexiko
Kenya
Lesotho
Mozambique
Namibia
Swaziland
Total

and Taiwan. As was previously mentioned, in most of the seasons where large yellow maize
export volumes were recorded, the amount of white maize used in the feed market
increased. This provides some illustration of the relative competitiveness between white
and yellow maize in the international markets. Depending on the season, it is sometimes
more profitable to use white maize in the feed market and engage in deep sea exports with
yellow maize. Under this scenario, white maize has to trade below the price of yellow maize
for it to be absorbed in the feed market.
Figure 7: South African yellow maize exports per destination
Source: SAGIS, April 2014
The sources of white maize for imports into South Africa are extremely limited. Over the
past decade it was only Zambia that was able to export competitively priced white maize
into the South African market. Whereas SA imported relatively consistent volumes of yellow
maize into the Cape Town harbour in the past, these imports have basically disappeared
beyond 2007 and SA has become a net exporter of yellow maize. There is a wide range of
competitive sources of yellow maize in the world market that can be imported to South
Africa if local prices increase to import parity levels. These sources include Argentina, Brazil
and in more recent years Ukraine has become a very competitive exporter of yellow maize.
It is important to note that apart from varying production levels, the switch between white
and yellow maize in the feed market is an important driver to balance ending stocks in the
market.
0
200
400
600
800
1000
1200
20
03
/20
04
20
04
/20
05
20
05
/20
06
20
06
/20
07
20
07
/20
08
20
08
/20
09
20
09
/20
10
20
10
/20
11
20
11
/20
12
20
12
/20
13
20
13
/20
14
Vo
lum
e (
tho
usa
nd
to
n)
SA yellow maize exports
Korea
Swaziland
Iran
Japan
Taiwan
Namibia
Botswana
Mozambique
Total

Figure 8: South African white maize imports per destination
Source: SAGIS, April 2014
Figure 9: South African yellow maize imports per destination
Source: SAGIS, April 2014
0
20
40
60
80
100
120
140
160
20
05
/20
06
20
06
/20
07
20
07
/20
08
20
08
/20
09
20
09
/20
10
20
10
/20
11
20
11
/20
12
20
12
/20
13
20
13
/20
14
Vo
lum
e (
tho
usa
nd
to
n)
SA white maize imports
Zambia
0
200
400
600
800
1000
1200
20
05
/20
06
20
06
/20
07
20
07
/20
08
20
08
/20
09
20
09
/20
10
20
10
/20
11
20
11
/20
12
20
12
/20
13
20
13
/20
14
Vo
lum
e (
tho
usa
nd
to
n)
SA yellow maize imports
Argentinië
Brazil
Romania
Ukraine
India

4. Shifting fundamentals in regional maize markets
For the purpose of this study, it is worthwhile to consider the structural changes that have
already occurred in regional maize markets or the shifts that might occur in these markets
under certain assumptions. Since 2008 a handful of countries in Southern and Eastern Africa
have started producing surpluses of maize and although poor infrastructure (roads and
storage) provides a major challenge for export large volumes of grain the flow of basic
grains across borders has picked up significantly. Figure 8 presents the volumes of maize
exported by the various countries excluding South Africa. Although South Africa is by far the
leading exporter, significant surpluses have emerged in Zambia, Malawi and Tanzania.
Although highly volatile, there has been an increasing trend in the level of surpluses
produced in the region, and these surpluses are starting to affect the potential exporting
destinations for SA white maize, especially because the white maize that is produced in
these countries is non-GM maize.
Figure 10: Leading Southern African exporting countries Source: ITC, April 2014
There are various factors influencing the sharp rise in production in countries like Zambia
and Malawi. In the case of Zambia the area of maize area harvested has increased by 64%
between 2008 and 2013. Much of this increase can be attributed to farm area expansion
resulting from the government’s Food Reserve Agency’s (FRA) buying activities, which offers
a maize price to small scale farmers that is significantly higher than market prices and an
expansion of the fertilizer and maize seed subsidy. Together these have provided sufficient
incentive for small scale growers to expand the area under maize production. Equally
-
100 000
200 000
300 000
400 000
500 000
600 000
700 000
800 000
20
01
20
02
20
03
20
04
20
05
20
06
20
07
20
08
20
09
20
10
20
11
20
12
20
13
Vo
lum
e (
Ton
))
Leading Southern African Exports (excluding SA): 2001-2013
Zambia
Uganda
United Republic of Tanzania
Mozambique
Kenya
Zimbabwe
Malawi
Madagascar

important, in terms of maize area harvested, has been the favourable weather conditions
that have prevailed in Zambia over this same period. However, the generally favourable
maize cropping conditions that have prevailed since 2008 did witness some deterioration
from 2012 to 2013. A widespread mid-season drought in February and March, which
affected the maize crop during its maturation phase, coupled with an early season army
worm attack in some major maize producing regions, contributed to an aggregate decline in
maize production of 10.8%. This decline is results from a 9.3% decline in maize yields,
compared to 2012, and a 1.5% decline in area harvested.
While Zambia has witnessed a general increase in maize production over the last decade,
the production of maize on commercial farms has declined significantly. From 2002/03 to
2012/13 maize production on commercial farms has declined by 64.6% from 412,000 tons
to 146,014 tons. This decline has been caused a several factors, including the price
unpredictability caused by FRA activities in the maize market, particularly since 2010.
Beginning in 2010 Zambia has experienced a series of bumper maize harvest. In total the
anticipated surplus maize produced in Zambia over that period exceeded 4 million metric
tons, of which the FRA bought over 80%. It then off-loaded this maize on to the market at
prices below the cost of procurement. Because Zambia’s commercial farm sector is
prohibited from selling to the FRA, and cannot effectively compete with the FRA’s subsidized
sales prices of $140-170 mt, many commercial farmers moved out of maize production. Due
to favourable domestic market conditions for soyabeans, which are cultivated during the
same season as maize, many farmers shifted to soyabeans. The exit of commercial farmers
from the maize sector may expose Zambia to greater maize supply risk resulting from
weather variability than was previously the case.
Due to the monopolization the surplus maize market in Zambia by the FRA since 2010,
private cross border trade in maize has declined substantially. Unable to compete with
FRA’s buy and sell prices cross border private trading relationships from Zambia to the
region have deteriorated. Much of the formal trade that has occurred from Zambia to the
region has been conducted as government to government trade, particularly in the case of
Zimbabwe, or through the FRA to private traders, and then to export markets. However, the
pace of this trade has been impeded by infrastructural bottlenecks, both at border crossings
and at FRA silos where maize is loaded. As seen in Figure 11, the market uncertainty caused
by FRA activities has limited the integration of the Zambian maize market with the SAFEX
and world maize markets. Especially in the past five years, prices have been extremely
volatile and there has been a complete disconnect with world markets due to FRA pricing
strategies as well as import and export parity bands.
Important developments are underway in Zambia regarding government involvement in
national maize markets. Due to the high costs and extensive borrowing associated with
FRA’s buying and selling practices since 2010, the Government of Zambia has announced

that it will cease to provide subsidized maize to the milling sector in Zambia. This decision
may have important implications on the performance of the maize market in 2013. In
particular, it is likely that with the removal of the price subsidy, maize processors will re-
enter the maize to procure grain from farmers. This may contribute to higher levels of
competition for maize, leading to higher prices. This decision may also encourage
commercial farmers to re-enter the maize market in 2013/14. Under these market
conditions total production is anticipated to top 3 million tons within the next three years
and local prices will trade more in line with the world and SAFEX maize prices. As was
previously mentioned in the South African outlook, the SAFEX price is anticipated to break
away from export parity as South African surpluses are dwindling towards the end of the
outlook period.
Figure 11: Zambian maize production, exports and prices
Due to significant government intervention in the maize market, there are a number of
plausible future scenarios that can evolve. Figure 12 presents three plausible future
outcomes where the area under maize production continues to expand rapidly to reach 2.3
million ha by 2022 under the assumption that the market is liberalised and private
investment takes place. Another plausible outcome is also presented where the area under
maize production declines and is very volatile as government funding is depleted due to the
excessively expensive current subsidy programme. Under this scenario, it is likely that some
form of government support will still be allocated every fifth year in order to coincide with
an election year.
0
50
100
150
200
250
300
350
0
500
1000
1500
2000
2500
3000
3500
4000
2001 2003 2005 2007 2009 2011 2013 2015 2017 2019 2021U
S $
/to
n
Tho
usa
nd
to
ns
Zambia
Maize production Maize exports Maize price, Lusaka
SAFEX white maize Maize, U.S. Gulf

Figure 12: Zambian maize area planted
Under the scenario that presents the middle road also referred to as the baseline scenario,
it is assumed that some form of government support will remain, but with more clear
direction and signals to the market at what level and timing these support measures might
kick in. As a result, the area under maize is anticipated to increase modestly over the period
of the outlook. Model simulations illustrate that under the baseline scenario, Zambia will
become a major source of exports into the Southern African region with almost 1.5 million
tons being exported per annum by 2022. This will only materialise under the assumption of
no further export limitations and a general upgrade of border post facilities and
infrastructure. Under this scenario, Zambian white maize will become a fierce competitor in
the regional white maize markets.
Zambia has vast tracts of land that can be unlocked for agricultural production. There are a
number of proposals regarding land reform policies. In each of the ten provinces the
government has identified farming blocks of between 100 000 ha to 150 000 ha.
Government’s vision for each of the farming blocks is to establish one nucleus commercial
farming operation of approximately 10 000 ha and then let smaller units develop around the
commercial farm. There has been very little private investment so far, but under a
favourable political environment, investment in these farming blocks is likely to accelerate.
This could bring another 1.5 million hectares under production over the long run.
0
500
1000
1500
2000
2500
2001 2003 2005 2007 2009 2011 2013 2015 2017 2019 2021
Tho
usa
nd
ha
Zambia
Maize area harvested Maize area - private investment
Maize area - dryout of state funding

Although there are a number of countries importing maize, Kenya and Zimbabwe can be
classified as the consistent maize importing countries. As previously discussed, Zambian
surpluses have been flowing into these markets and it can be expected that these trade
patterns will continue to increase if Zambia surpluses rise and infrastructure in the region is
improved.
Figure 13: Leading Southern African Importing countries Source: ITC, April 2014
Lastly, the impact of poor infrastructure on current and potential regional trade flow cannot be
overstressed. Recent trends suggest that a rise in investment infrastructure is occurring, which will
lower the transaction costs of shifting maize into the future. Figure 14 presents clearly illustrates the
major lack of railway lines in Africa to move large volumes of grain at lower prices. Currently most of
the grain is moved by trucks. Table 3 shows the Union of African Railways’s master plan for the
development and improvement of railway lines for 10 corridors in Africa.
0
200000
400000
600000
800000
1000000
1200000
1400000
1600000
20
01
20
02
20
03
20
04
20
05
20
06
20
07
20
08
20
09
20
10
20
11
20
12
20
13
Vo
lum
e (
Ton
)
Leading Southern African Importers: 2001-2013
Zimbabwe
Kenya
United Republic of Tanzania
Mauritius
Namibia
Botswana
Angola
Mozambique

Figure 14: Rail map of Africa Source: AICD database
Table 3 Union of African Railways 10-corridor master plan
Corridor Countries linked
1 North-Centre -South Libya-Niger-Chad-Central African republic (CAR) CAR-Republic of Congo –DRC-Angola-Namibia
2 West- Centre Senegal-Mali-Burkina Faso – Niger- Nigeria – Chad Cote d’Ivoire-Ghana-Togo-Benin-Nigeria-Cameroon
3 North-East Sudan-Ethiopia-Kenya-Tanzania-Uganda
4 North-East-West Sudan-Chad-Nigeria
5 East-South Tanzania-Rwanda-DRC-Uganda Dar es Salaam-Kigoma-Burundi
6 East-Centre Sudan-CAR-Cameron Kenya-Uganda-DRC
7 North Morocco-Algeria-Tunisia-Libya-Egypt-Mauritania
8 East-South Tanzania-Zambia-Zimbabwe-Mozambique-South Africa
9 Centre-South Cameroon-Gabon-Republic of Congo-DRC-Angola-Namibia
10 North-West Senegal-Mauritania-Morocco
Source: Union of African Railways, 2006

5. An outlook of Southern African maize production – surpluses vs
shortfalls
When considering the future trade flow patterns of maize and the potential structural
changes that might occur, one has to base this analysis on potential future outcomes of the
key supply and demand fundamentals in the Southern African maize industry. The following
section presents the commodity balance sheet for various Southern and Eastern African
countries and then provides a visual representation of a potential trade flow scenario for
maize taking the outlook for the SA maize industry into consideration.
5.1 Regional commodity balance sheets for maize
Over the past year, the Regional Network of Agricultural Policy Research Institutes
(ReNAPRI) has been compiling commodity balance sheets for maize for the countries within
the network. Although there are still a number of refinements to be undertaken, table 4
presents that first version of these balance sheets. Based on earlier discussions in this paper,
the potential future trade flow patterns will have a major impact on the South African maize
industry; not only from a production point of view, but also taking a value chain approach
into consideration.
Table 4: Maize balance sheets for South-East Africa
SOUTH AFRICA
Crop supply and utilization 2011 2012 2013 2014
Maize area harvested 2372.3 2699.2 2781.0 2729.1
Maize yield 5.4 4.6 4.3 5.1
Maize production 12759.0 12365.0 11900.0 13821.0
Maize imports 422.1 10.0 79.7 0.0
Maize exports 2301.5 919.1 2044.0 2435.0
Maize dom. consumption 10700.0 10800.0 10900.0 10978.9
Maize ending stocks 3676.0 3166.0 1991.0 1941.5
Maize feed dom. consumption 4950.0 5000.0 5100.0 5238.8
Maize food use 5750.0 5800.0 5800.0 5740.1
Zambia 2011 2012 2013 2014
Maize area harvested 1102.0 1075.0 1100.0 1133.6
Maize yield 2.7 2.7 2.4 2.4
Maize production 3020.0 2850.0 2600.0 2935.4
Maize imports 5.0 0.0 0.0 1.6
Maize exports 358.2 613.6 142.7 620.0
Maize dom. consumption 2500.0 2500.0 2400.0 2543.7
Maize ending stocks 825.0 675.0 475.0 491.2
Maize feed dom. consumption 500.0 500.0 500.0 526.9
Maize food use 2000.0 2000.0 1900.0 2016.8

Kenya 2011 2012 2013 2014
Maize area harvested 2132.0 2266.0 1800.0 2230.2
Maize yield 1.6 1.6 1.4 1.6
Maize production 3377.0 3603.0 2600.0 3587.4
Maize imports 400.0 250.0 900.0 529.5
Maize exports 14.0 7.0 5.0 0.0
Maize dom. consumption 3750.0 3800.0 3750.0 4021.0
Maize ending stocks 433.0 479.0 224.0 319.9
Maize feed dom. consumption 350.0 350.0 300.0 388.6
Maize food use 3400.0 3450.0 3450.0 3632.4
Tanzania 2011 2012 2013 2014
Maize area harvested 3288.0 3100.0 3100.0 3232.9
Maize yield 1.32 1.39 1.35 1.43
Maize production 4341.0 4300.0 4200.0 4635.1
Maize imports 0.2 61.9 48.9 45.1
Maize exports 2.1 110.6 39.1 125.0
Maize dom. consumption 4200.0 4400.0 4500.0 4601.0
Maize ending stocks 848.0 673.0 298.0 382.5
Maize feed dom. consumption 400.0 400.0 400.0 419.1
Maize food use 3800.0 4000.0 4100.0 4181.9
Mozambique 2011 2012 2013 2014
Maize area harvested 1813.0 1572.0 1400.0 1627.2
Maize yield 1.2 1.1 1.5 1.3
Maize production 2179.0 1746.0 2150.0 2097.0
Maize imports 100.0 100.0 100.0 210.6
Maize exports 5.0 5.0 5.0 4.9
Maize dom. consumption 2100.0 1900.0 2200.0 2287.6
Maize ending stocks 220.0 161.0 206.0 221.0
Maize feed dom. consumption 200.0 200.0 200.0 209.8
Maize food use 1900.0 1700.0 2000.0 2077.9
Malawi 2011 2012 2013 2014
Maize area harvested 1675.0 1680.0 1750.0 1715.2
Maize yield 2.2 2.2 2.1 2.2
Maize production 3699.0 3620.0 3680.0 3844.4
Maize imports 10.0 25.0 25.0 24.9
Maize exports 300.0 300.0 100.0 386.4
Maize dom. consumption 3500.0 3500.0 3600.0 3593.8
Maize ending stocks 452.0 297.0 302.0 391.1
Maize feed dom. consumption 500.0 750.0 600.0 632.3
Maize food use 3000.0 2750.0 3000.0 2961.5
Source: Regional Network of Agricultural Policy Research Institutes (ReNAPRI), Mei 2014
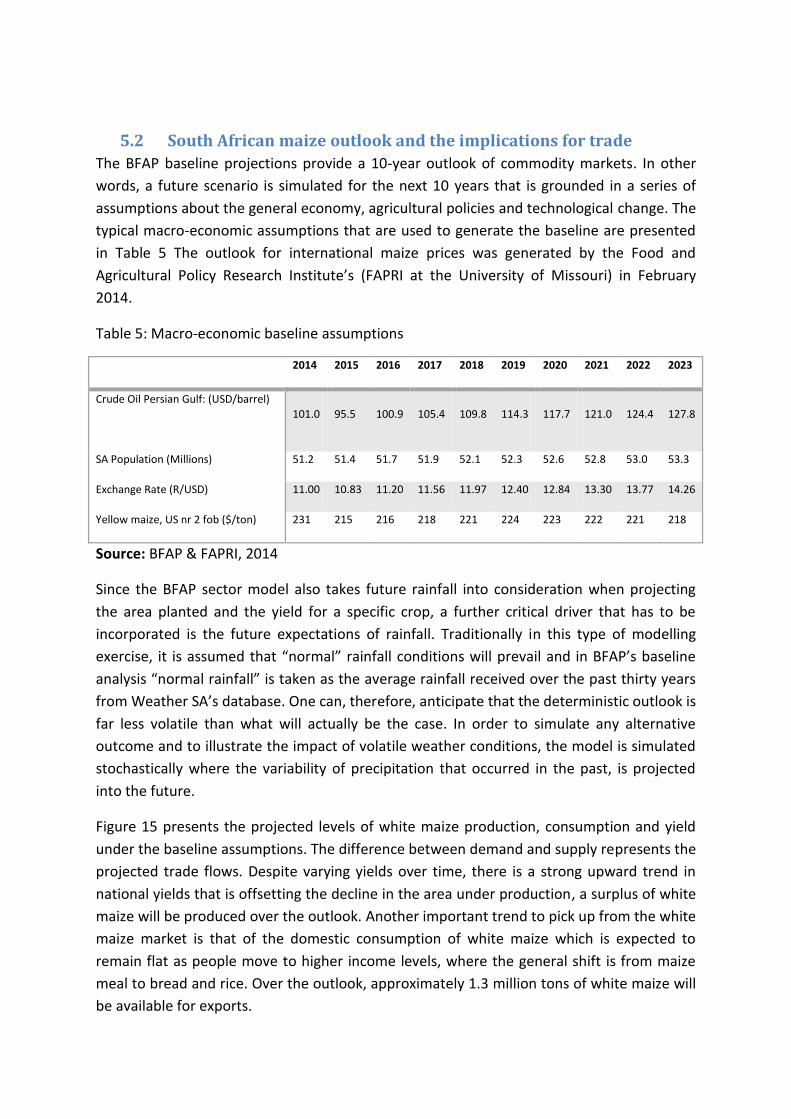
5.2 South African maize outlook and the implications for trade
The BFAP baseline projections provide a 10-year outlook of commodity markets. In other
words, a future scenario is simulated for the next 10 years that is grounded in a series of
assumptions about the general economy, agricultural policies and technological change. The
typical macro-economic assumptions that are used to generate the baseline are presented
in Table 5 The outlook for international maize prices was generated by the Food and
Agricultural Policy Research Institute’s (FAPRI at the University of Missouri) in February
2014.
Table 5: Macro-economic baseline assumptions
2014 2015 2016 2017 2018 2019 2020 2021 2022 2023
Crude Oil Persian Gulf: (USD/barrel)
101.0 95.5 100.9 105.4 109.8 114.3 117.7 121.0 124.4 127.8
SA Population (Millions) 51.2 51.4 51.7 51.9 52.1 52.3 52.6 52.8 53.0 53.3
Exchange Rate (R/USD) 11.00 10.83 11.20 11.56 11.97 12.40 12.84 13.30 13.77 14.26
Yellow maize, US nr 2 fob ($/ton) 231 215 216 218 221 224 223 222 221 218
Source: BFAP & FAPRI, 2014
Since the BFAP sector model also takes future rainfall into consideration when projecting
the area planted and the yield for a specific crop, a further critical driver that has to be
incorporated is the future expectations of rainfall. Traditionally in this type of modelling
exercise, it is assumed that “normal” rainfall conditions will prevail and in BFAP’s baseline
analysis “normal rainfall” is taken as the average rainfall received over the past thirty years
from Weather SA’s database. One can, therefore, anticipate that the deterministic outlook is
far less volatile than what will actually be the case. In order to simulate any alternative
outcome and to illustrate the impact of volatile weather conditions, the model is simulated
stochastically where the variability of precipitation that occurred in the past, is projected
into the future.
Figure 15 presents the projected levels of white maize production, consumption and yield
under the baseline assumptions. The difference between demand and supply represents the
projected trade flows. Despite varying yields over time, there is a strong upward trend in
national yields that is offsetting the decline in the area under production, a surplus of white
maize will be produced over the outlook. Another important trend to pick up from the white
maize market is that of the domestic consumption of white maize which is expected to
remain flat as people move to higher income levels, where the general shift is from maize
meal to bread and rice. Over the outlook, approximately 1.3 million tons of white maize will
be available for exports.

Figure 15: Base - White maize production, consumption and yield
The corresponding price and trade space for white maize is presented in Figure 16. Local
white maize prices are expected to gradually ease away from export parity levels as the area
under production shrinks and the stock levels are declining.
Figure 16: White maize price and trade space
In the case of yellow maize (Figure 17) the balance between demand and supply is
significantly tighter with the demand for yellow maize increasing rapidly in the feed market
on the back of larger livestock production, mainly poultry. Despite of a strong growth in
0
500
1000
1500
2000
2500
0
1000
2000
3000
4000
5000
6000
1997 1999 2001 2003 2005 2007 2009 2011 2013 2015 2017 2019 2021 2023
Thousand t
ons
R/ton
White maize
White maize imports White maize exports
Import parity Randfontein SAFEX
Export parity africa

yields, the supply of yellow maize is barely able to keep up with demand in most of the
years. The projected volume of yellow maize exports is expected to decline over time.
Figure 17: Yellow maize production, consumption and yield
Figure 18 presents the corresponding price and trade space for yellow maize. The rise in
demand is expected to outpace the rise in production (despite of the increasing trend in
yields) and therefore yellow maize exports and projected to decline over time. Naturally, in
the feed market yellow maize can be substituted with white maize with a slight price
premium and therefore the level of correlation between these two markets will remain
high. However, due to lower stock levels the model simulates a sharp increase in yellow
maize prices towards the end of the outlook period.

Figure 18: Base Yellow maize price and trade space
5.3 Potential trade flow scenarios for 2014/15
In this last section of the report, the focus shifts to the 2014/15 marketing seasons, which
provides an interesting case study for potential future scenarios that could unfold with
respect to maize trade in the region. Adding up the anticipated maize production figures in
2014, it is plausible that 2014 could be the year where the largest maize crop is produced in
the history of the region. This has vast implication for the potential maize trade flow
patterns for the 2014/15 marketing season. Figure 19 illustrates that maize production is
anticipated to increase from 2013 in all of the countries, except for Mozambique. The main
regional maize trade flow that is anticipated based on these production levels is presented
in figure 2020.
South Africa remains the largest producer of maize by a significant margin with production
reaching almost 14 million tons. The BFAP model projects that maize exports will exceed 2
million tons and the majority of these exports will have to have to find deep sea export
markets. It is anticipated that South Africa will service its long-standing clients with some
smaller volumes of white and yellow maize moving across the borders. In terms of
production, Tanzania lies second with an estimated maize crop of 4.6 million tons. Yet,
domestic consumption is expected to fall in the same range and therefore only relatively
small volumes of white maize will be exported, mainly in the form of unofficial cross-border
trade with Kenya where maize prices are significantly higher.
0
300
600
900
1200
1500
0
500
1000
1500
2000
2500
3000
3500
4000
4500
1997 1999 2001 2003 2005 2007 2009 2011 2013 2015 2017 2019 2021 2023
Thousand t
ons
R/ton
Yellow maize
Yellow maize imports Yellow maize exports Import parity Durban
SAFEX Export parity africa

Zambian will most likely harvest more than 3 million tons with approximately 700 000 tons
available for the export market. This is non-GM white maize and depending on government
policies, the majority of surpluses can be exported to Zimbabwe, where a shortfall of at
least 500 000 tons of maize has to be supplemented by imports.
Figure 19: Recent trends in regional Maize production
Although a much improved maize harvest is expected in Kenya compared to the crop in
2013, its domestic consumption levels are also increasing and this market will also be in a
shortfall of approximately 600 000 tons. Kenya also has trade policies in place related to the
importation of GM maize, which again makes Zambia and Malawi an attractive bidder for
the Kenyan demand for maize. For the past few years Malawi has consistently produced a
surplus of maize and has exported maize to various destinations including Northern
Mozambique, the DRC and the southern parts of Tanzania.
0.0
2.0
4.0
6.0
8.0
10.0
12.0
14.0
16.0
SA ZAM MOZ TAN MAL ZIM KEN
Mill
ion
to
ns
Regional maize production
2012
2013
2014

Nacala
Figure 20: Potential maize trade flow map, 2014/15
6. Conclusion The study has presented a strategic overview of current and potential future maize trade
flow patterns in South Africa and the region. From the empirical findings it is clear that SA
will remain the largest maize producer and exporter of maize grain in the foreseeable
future. However, the structural changes occurring in the Southern and Eastern African
countries will increasingly play a role. Alone the surpluses produced by countries like Zambia
will potentially displace South African maize exports into Kenya and Zimbabwe as these
countries still follow erratic border policies when it comes to genetically modified maize.
The most plausible outcome for South African maize trade is that future levels of maize
exports into the region will decline as the regional level of production gradually increases.
700 000ton
WMAZ
1.8 mil tons
WM &YM
deep sea
600 000 tons
WM imports
600 000 tons
WM &YM
cross-border
100 000
WMAZ

7. References
Bullock R (2009). “Off Track: Sub-Saharan African Railways”, African Infrastructure Country
Diagnostic, Background paper 17, World Bank, November 2009.
Jayne, T.S, N. Mason, R. Myers, J. Ferris, D. Mather, M. Beaver, N. Lenski, A. Chapoto, D. Boughton
(2010). “Patterns and Trends in Food Staples Markets in Eastern and Southern Africa: Toward the
identification of priority investments and strategies for developing markets and promoting
smallholder productivity growth”, Working paper No 104, Michigan State University, April 2010.
Meyer F.H, P. Westhoff, J. Binfield and J.F. Kirsten (2006). “Model closure and price formation under
switching grain market regimes in South Africa”, Agrekon, Vol 45, No 4, December 2006.