Embed Size (px)
Citation preview
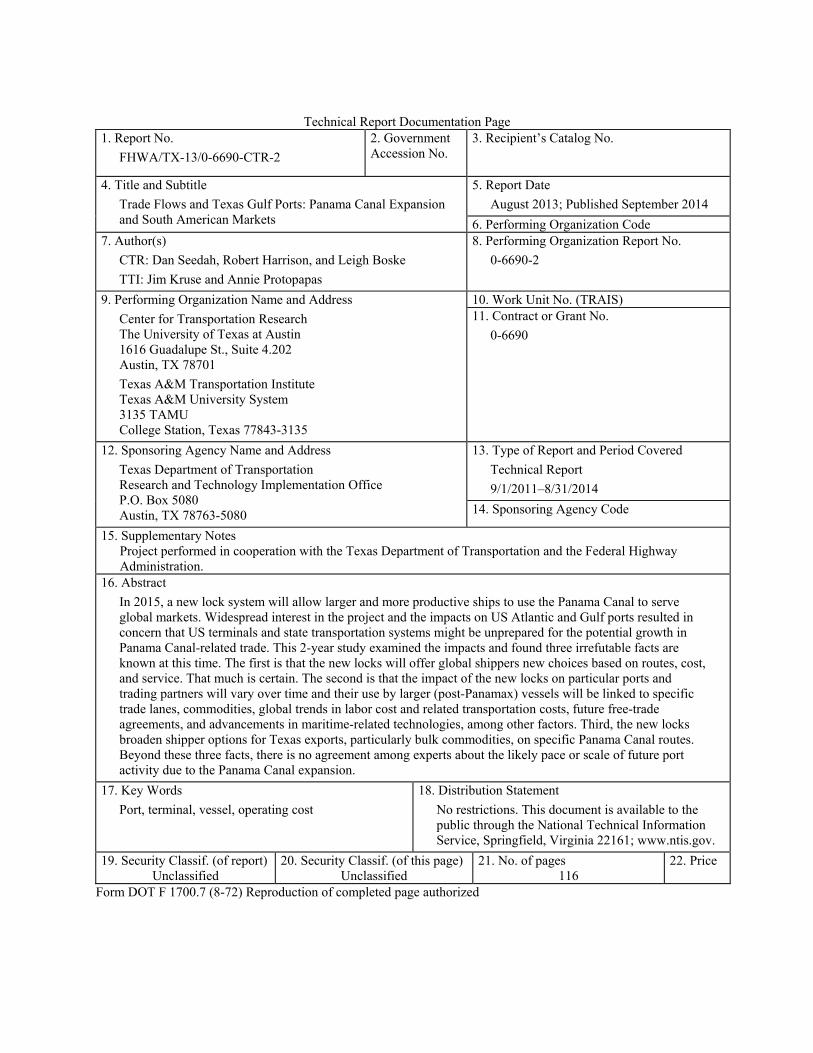
Technical Report Documentation Page
1. Report No.
FHWA/TX-13/0-6690-CTR-2
2. Government Accession No.
3. Recipient’s Catalog No.
4. Title and Subtitle
Trade Flows and Texas Gulf Ports: Panama Canal Expansion and South American Markets
5. Report Date
August 2013; Published September 2014
6. Performing Organization Code 7. Author(s)
CTR: Dan Seedah, Robert Harrison, and Leigh Boske
TTI: Jim Kruse and Annie Protopapas
8. Performing Organization Report No.
0-6690-2
9. Performing Organization Name and Address
Center for Transportation Research The University of Texas at Austin 1616 Guadalupe St., Suite 4.202 Austin, TX 78701
Texas A&M Transportation Institute Texas A&M University System 3135 TAMU College Station, Texas 77843-3135
10. Work Unit No. (TRAIS) 11. Contract or Grant No.
0-6690
12. Sponsoring Agency Name and Address
Texas Department of Transportation Research and Technology Implementation Office P.O. Box 5080 Austin, TX 78763-5080
13. Type of Report and Period Covered
Technical Report
9/1/2011–8/31/2014
14. Sponsoring Agency Code
15. Supplementary Notes Project performed in cooperation with the Texas Department of Transportation and the Federal Highway Administration.
16. Abstract
In 2015, a new lock system will allow larger and more productive ships to use the Panama Canal to serve global markets. Widespread interest in the project and the impacts on US Atlantic and Gulf ports resulted in concern that US terminals and state transportation systems might be unprepared for the potential growth in Panama Canal-related trade. This 2-year study examined the impacts and found three irrefutable facts are known at this time. The first is that the new locks will offer global shippers new choices based on routes, cost, and service. That much is certain. The second is that the impact of the new locks on particular ports and trading partners will vary over time and their use by larger (post-Panamax) vessels will be linked to specific trade lanes, commodities, global trends in labor cost and related transportation costs, future free-trade agreements, and advancements in maritime-related technologies, among other factors. Third, the new locks broaden shipper options for Texas exports, particularly bulk commodities, on specific Panama Canal routes. Beyond these three facts, there is no agreement among experts about the likely pace or scale of future port activity due to the Panama Canal expansion.
17. Key Words
Port, terminal, vessel, operating cost
18. Distribution Statement
No restrictions. This document is available to the public through the National Technical Information Service, Springfield, Virginia 22161; www.ntis.gov.
19. Security Classif. (of report) Unclassified
20. Security Classif. (of this page) Unclassified
21. No. of pages 116
22. Price
Form DOT F 1700.7 (8-72) Reproduction of completed page authorized

Trade Flows and Texas Gulf Ports: Panama Canal Expansion and South American Markets Center for Transportation Research, The University of Texas at Austin Dan Seedah Robert Harrison Leigh Boske Texas A&M Transportation Institute, Texas A&M University Jim Kruse Annie Protopapas CTR Technical Report: 0-6690-CTR-2 Report Date: August 2013 Project: 0-6690-CTR Project Title: Selected 2012–2014 Trade Flows and Texas Gulf Ports: Panama Canal and
South American Markets Sponsoring Agency: Texas Department of Transportation Performing Agency: Center for Transportation Research at The University of Texas at Austin Project performed in cooperation with the Texas Department of Transportation and the Federal Highway Administration.

Center for Transportation Research The University of Texas at Austin 1616 Guadalupe St, Suite 4.202 Austin, TX 78701 http://ctr.utexas.edu/
v
Disclaimers Author's Disclaimer: The contents of this report reflect the views of the authors, who
are responsible for the facts and the accuracy of the data presented herein. The contents do not necessarily reflect the official view or policies of the Federal Highway Administration or the Texas Department of Transportation (TxDOT). This report does not constitute a standard, specification, or regulation.
Patent Disclaimer: There was no invention or discovery conceived or first actually reduced to practice in the course of or under this contract, including any art, method, process, machine manufacture, design or composition of matter, or any new useful improvement thereof, or any variety of plant, which is or may be patentable under the patent laws of the United States of America or any foreign country.
Engineering Disclaimer NOT INTENDED FOR CONSTRUCTION, BIDDING, OR PERMIT PURPOSES.
Research Supervisor: Robert Harrison
vi
Acknowledgments This final report, reflecting a 2-year study period, could not have been completed without
the generous donation of time and information provided by many individuals and organizations. Their contributions are cited throughout this report. The following individuals, however, deserve special recognition for assisting members of our research team on key aspects of this study.
Texas Department of Transportation
• John Barton, P.E., Deputy Executive Director/Chief Engineer
• Duncan Stewart, Ph.D., P.E., Research Engineer, RTI (retired)
• Gus A. Khankarli, Ph.D., P.E., Project Director Texas Ports of Beaumont, Brownsville, Corpus Christi, and Houston
• Mr. Eduardo A. Campirano, Port Director and CEO, Port of Brownsville
• Mr. German Rico, Director of Business Development, Port of Brownsville
• John Roby, Director of Logistics and Public Affairs, Port of Beaumont
• John LaRue, Executive Director, Port of Corpus Christi Authority
• Frank C. Brogan, Deputy Port Director Engineering, Finance and Administration, Port of Corpus Christi
• Anthony Alejandro, Director of Operations, Port of Corpus Christi Authority
• Stan Swigart, Market Development Manager, Origination Division, Port of Houston
Panama Canal Authority
• Rodolfo Sabonge, Director of Market Research and Analysis, Panama Canal Authority
Consultants
• Theodore Prince, Principal, T. Prince & Associates None of the sponsoring units, including the Texas Department of Transportation and the
Lyndon B. Johnson School of Public Affairs, endorse any of the views or findings expressed in this report. Any omissions or errors are the sole responsibility of the authors.
Products Appendix A provides a copy of the P2, Container Terminal and Cargo-Handling Cost
Analysis Toolkit. This product is also available as a standalone document.
vii
Table of Contents
Chapter 1. Background .................................................................................................................1 1.1 Introduction ............................................................................................................................1 1.2 TxDOT Report 0-6690-1 .......................................................................................................2 1.3 TxDOT Report 0-6690-2 .......................................................................................................2
Chapter 2. Literature Review .......................................................................................................5 2.1 TxDOT Transportation Forum February 2012 ......................................................................5 2.2 TxDOT Panama Canal Stakeholder Working Group (PCSWG) ...........................................8
Chapter 3. Channel Improvement Projects ...............................................................................11 3.1 Introduction ..........................................................................................................................11 3.2 Is There a Need? ..................................................................................................................11 3.3 Port Channel Deepening Projects ........................................................................................14
Chapter 4. Landside Improvements ...........................................................................................23 4.1 Introduction ..........................................................................................................................23 4.2 Northeast and Mid-Atlantic Ports ........................................................................................24
4.2.1 New York/New Jersey ..................................................................................................24 4.2.2 Wilmington, DE ............................................................................................................25 4.2.3 Baltimore .......................................................................................................................25 4.2.4 Port of Virginia (Hampton Roads) ................................................................................25 4.2.5 Georgia Ports Authority ................................................................................................25 4.2.6 Charleston .....................................................................................................................26
4.3 Florida Ports .........................................................................................................................26 4.3.1 Miami ............................................................................................................................26 4.3.2 Tampa ...........................................................................................................................26 4.3.3 Canaveral ......................................................................................................................26
4.4 Central Gulf Ports ................................................................................................................27 4.4.1 New Orleans ..................................................................................................................27 4.4.2 Mobile ...........................................................................................................................27
4.5 Texas Ports ...........................................................................................................................27 4.5.1 Houston .........................................................................................................................27 4.5.2 Corpus Christi ...............................................................................................................27 4.5.3 Galveston ......................................................................................................................28 4.5.4 Freeport .........................................................................................................................28 4.5.5 Calhoun County Port Authority ....................................................................................29 4.5.6 Victoria .........................................................................................................................30 4.5.7 Brownsville ...................................................................................................................30 4.5.8 Harlingen .......................................................................................................................30
4.6 Caribbean Ports ....................................................................................................................32
Chapter 5. All-Water Services: Direct Shipment ......................................................................33 5.1 Background ..........................................................................................................................33 5.2 Determining factors .............................................................................................................35
5.2.1 Flexibility ......................................................................................................................36
viii
5.2.2 Landside Facilities ........................................................................................................36 5.2.3 Cost ...............................................................................................................................37 5.2.4 Time ..............................................................................................................................38 5.2.5 Suez Canal Competition ...............................................................................................40 5.2.6 Other Factors .................................................................................................................43
Southern California Market .............................................................................................. 43 Shift of Manufacturing Centroid ....................................................................................... 43 Foreign Port Limitations ................................................................................................... 43
Chapter 6. All-Water Services: Transshipment ........................................................................45 6.1 Introduction ..........................................................................................................................45 6.2 Scheduled Services via Panama Canal ................................................................................45
6.2.1 General ..........................................................................................................................45 6.2.2 Asia-US Services ..........................................................................................................45 6.2.3 Oceania-US ...................................................................................................................48 6.2.4 West Coast South America (WCSA)-US Services .......................................................49
Chapter 7. Rail Land Bridge Competition ................................................................................53 7.1 Introduction ..........................................................................................................................53 7.2 Investment ............................................................................................................................54
7.2.1 Burlington Northern Santa Fe (BNSF) .........................................................................54 7.2.2 Canadian National (CN)................................................................................................54 7.2.3 Canadian Pacific (CP) ...................................................................................................54 7.2.4 CSX ...............................................................................................................................55 7.2.5 Kansas City Southern (KCS) ........................................................................................55 7.2.6 Norfolk Southern (NS) ..................................................................................................55 7.2.7 Union Pacific (UP) ........................................................................................................55 7.2.8 Joint Service ..................................................................................................................56 7.2.9 Other .............................................................................................................................56
7.3 Competitiveness ...................................................................................................................56 7.4 Foreign Competition ............................................................................................................57
Chapter 8. Deep Draft Ship Operating Costs ............................................................................59 8.1 Introduction to Deep-Draft Vessel Operating Costs ............................................................59 8.2 Vessel Types and Sizes ........................................................................................................59 8.3 Description of Data Collected for the DDVOCs .................................................................59
8.3.1 Quasi Fixed/Variable Operating Costs .........................................................................61 8.3.2 Fixed Capital Cost .........................................................................................................63 8.3.3 Average Daily Costs .....................................................................................................63
8.4 Development of the CTR Vessel Cost Model .....................................................................65 8.4.1 Distance .........................................................................................................................65 8.4.2 Vessel Speed .................................................................................................................66 8.4.3 Number of Days at Sea .................................................................................................66 8.4.4 Number of Days at Port ................................................................................................66 8.4.5 Vessel Type and Size ....................................................................................................66 8.4.6 Fuel Price (Heavy Viscosity Oil and Marine Diesel Fuel) ...........................................67 8.4.7 Daily Capital and Operating Costs (Excluding Bunkerage) .........................................68 8.4.8 Average Daily Fuel Cost At-Sea ...................................................................................68
ix
8.4.9 Average Daily Fuel Cost In-Port ..................................................................................68 8.4.10 Port Charges ................................................................................................................69 8.4.11 Canal Charges .............................................................................................................69 8.4.12 Total Trip Cost and Cost per Ton Mile .......................................................................69
8.5 Scenario Analysis: Shanghai to Houston and Charleston ....................................................70 8.5.1 Scenario Analysis Results .............................................................................................71
8.6 Chapter Summary ................................................................................................................73
Chapter 9. Findings and Recommendations .............................................................................77 9.1 Dynamics of Maritime Trade and the Role of the Panama Canal .......................................77 9.2 Texas Port Challenges .........................................................................................................78 9.3 Texas Department of Transportation’s Role ........................................................................79
Appendix A: Container Terminal and Cargo-Handling Cost Analysis Toolkit ....................83 A.1 Types of Port Charges .........................................................................................................83
A.1.1 Navigation Service Group ............................................................................................84 A.1.1.1 Port Dues/Harbor Fee ........................................................................................... 84 A.1.1.2 Pilotage................................................................................................................. 84 A.1.1.3 Harbor Tug or Towing Services ........................................................................... 85
A.1.2 Berth Service Group .....................................................................................................85 A.1.2.1 Berth/Dockage Charges ....................................................................................... 86 A.1.2.2 Loading, Unloading and Wharfage Charges ........................................................ 89
A.1.3 Cargo Operations .........................................................................................................90 A.1.3.1 Storage ................................................................................................................. 90 A.1.3.2 Terminal Use Charge ........................................................................................... 92
A.1.4 Other Business .............................................................................................................93 A.1.4.1 Harbor Safety Fee ................................................................................................ 93
A.2 Terminal Operating Cost Model .........................................................................................94 A.2.1 Example Application of the Model ..............................................................................95
A.3 Chapter Summary ...............................................................................................................96
Appendix B: CTR Vessel Operating Cost Model......................................................................97
Appendix C: US Gulf Ports Containerized Ocean Trade with the West Coast of South America ..............................................................................................................................99

x
xi
List of Figures
Figure 3.1: West Coast Container Volume Trends 1990–2010 .................................................... 12 Figure 3.2: East Coast Container Volume Trends 1990–2010 ..................................................... 13 Figure 3.3: Current and Desired Depth of Channel Projects at Major Ports on East Coast ......... 17 Figure 3.4: Current and Desired Depth of Channel Projects at Major Ports on West Coast ........ 18 Figure 3.5: Current and Desired Depth of Channel Projects at Major Ports on Gulf Coast ......... 19 Figure 3.6: Completed Channel Projects on East, West, and Gulf Coasts 2012 .......................... 20 Figure 3.7: Channel Projects in Progress on East, West, and Gulf Coasts ................................... 21 Figure 4.1: Representative Port Improvement Projects—Non-Channel ....................................... 31 Figure 5.1: Comparison of Canal Waters Time With and Without Capacity Constraint ............. 39 Figure 6.1: Port of Houston All-Water Asia Container Services Volumes in Loaded TEUs ....... 46 Figure 8.1: General Vessel Specifications .................................................................................... 61 Figure 8.2: Average Daily Bunkerage Costs ................................................................................ 62 Figure 8.3: Fuel Types Cost C ...................................................................................................... 63 Figure 8.4: Hull Asset Capital Costs............................................................................................. 63 Figure 8.5: Average Daily Costs ................................................................................................... 64 Figure 8.6: Sea-Rates.com Transit Time/Distance Calculator ...................................................... 65 Figure 8.7: Port to Port Distance................................................................................................... 65 Figure 8.8: Vessel Speed............................................................................................................... 66 Figure 8.9: Number of Days at Sea ............................................................................................... 66 Figure 8.10: Number of Days in Port............................................................................................ 66 Figure 8.11: Vessel Type and Size ............................................................................................... 67 Figure 8.12: Vessel Type and Size ............................................................................................... 67 Figure 8.13: Fuel Prices ................................................................................................................ 67 Figure 8.14: Daily Capital and Operating Costs ........................................................................... 68 Figure 8.15: Average Daily Fuel Cost At-Sea .............................................................................. 68 Figure 8.16: Average Daily Fuel Cost In- Port ............................................................................. 69 Figure 8.17: Estimated Port Charges ............................................................................................ 69 Figure 8.18: Canal Charges........................................................................................................... 69 Figure 8.19: Daily Capital and Operating Costs ........................................................................... 70 Figure 8.20: Map showing Scenario Route Options 1, 2, and 3 ................................................... 71 Figure 8.21: Total Cost of Each Option Broken Down by Charges and Actual Trip Cost ......... 73 Figure 8.22: Cost per TEU of Each Option .................................................................................. 73

xii
xiii
List of Tables
Table 2.1: Preliminary Conclusions of TxDOT Project 0-6690-1 .................................................. 7 Table 2.2: Main Recommendations of the 2012 Panama Canal Stakeholders Group .................... 9 Table 3.1: Reserve Container Port Capacity by Coast—2010 ...................................................... 14 Table 3.2: Corps Deep Draft Harbor Studies in Progress ............................................................. 14 Table 3.3: Status of Channel Deepening Projects ......................................................................... 16 Table 4.1: North American Ports Leading in Capital Expenditure Spending ............................... 23 Table 4.2: North American Post-Panamax (P-PMX) Port Readiness Update .............................. 24 Table 5.1: Route Choices for Relevant Trade Flows .................................................................... 35 Table 5.2: Comparison between Panama Canal and Suez Canal .................................................. 40 Table 5.3: Containership Port Calls Using Suez Canal ................................................................ 41 Table 5.4: Containership First Ports of Call Using Suez Canal .................................................... 41 Table 5.5: General Cargo and Project Cargo Port Calls Using Suez Canal ................................. 42 Table 6.1: All-Water Transit Times Between Asian Ports and Houston (in days) ....................... 47 Table 6.2: US-Asia Containership Port Calls Using Panama Canal ............................................. 47 Table 6.3: US-Asia Containership First Ports of Call Using Panama Canal ................................ 47 Table 6.4: US-Asia General Cargo and Project Cargo Port Calls Using Panama Canal ............. 48 Table 6.5: US-Oceania Containership Port Calls Using Panama Canal ....................................... 48 Table 6.6: US-Oceania Containership First Ports of Call Using Panama Canal .......................... 49 Table 6.7: US-Oceania General Cargo and Project Cargo Port Calls Using Panama Canal ....... 49 Table 6.8: US-WCSA Containership Port Calls Using Panama Canal ........................................ 49 Table 6.9: US-WCSA Containership First Ports of Call Using Panama Canal ............................ 50 Table 6.10: US-WCSA General Cargo and Project Cargo Port Calls Using Panama Canal ....... 50 Table 8.1: Vessel Types and Sizes (in dwt) .................................................................................. 60 Table 8.2: Scenario Analysis Results............................................................................................ 72

1
Chapter 1. Background
1.1 Introduction
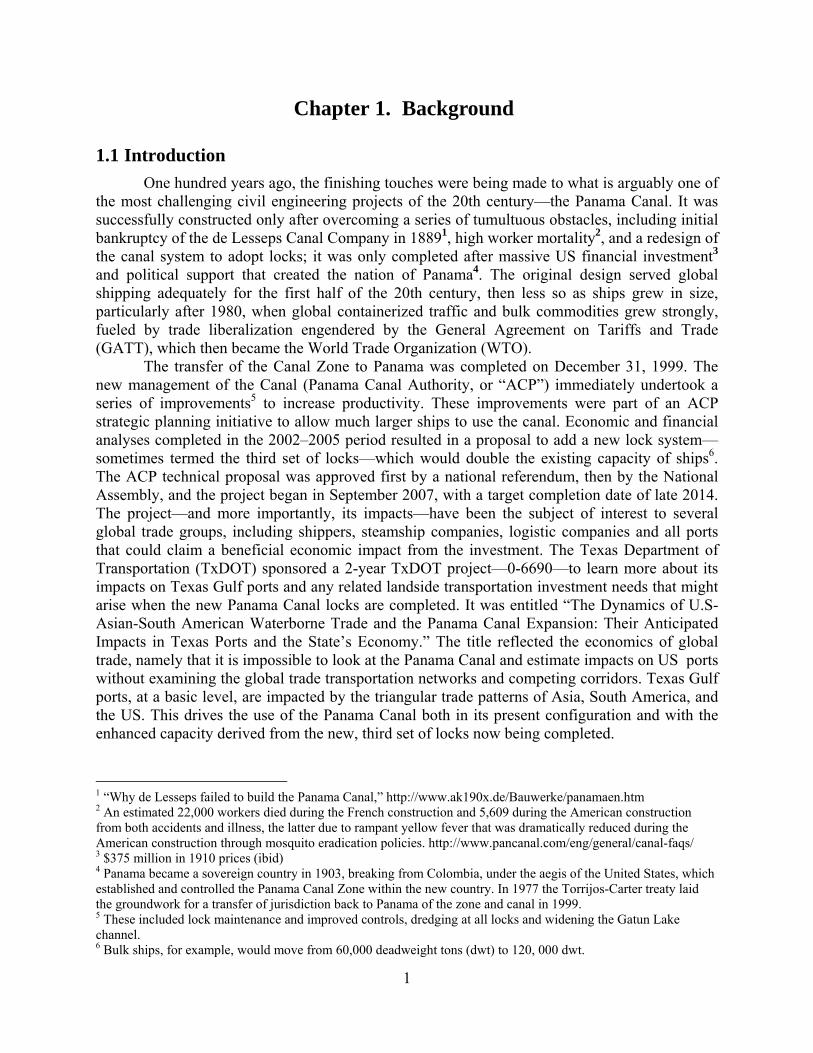
One hundred years ago, the finishing touches were being made to what is arguably one of the most challenging civil engineering projects of the 20th century—the Panama Canal. It was successfully constructed only after overcoming a series of tumultuous obstacles, including initial bankruptcy of the de Lesseps Canal Company in 18891, high worker mortality2, and a redesign of the canal system to adopt locks; it was only completed after massive US financial investment3 and political support that created the nation of Panama4. The original design served global shipping adequately for the first half of the 20th century, then less so as ships grew in size, particularly after 1980, when global containerized traffic and bulk commodities grew strongly, fueled by trade liberalization engendered by the General Agreement on Tariffs and Trade (GATT), which then became the World Trade Organization (WTO).
The transfer of the Canal Zone to Panama was completed on December 31, 1999. The new management of the Canal (Panama Canal Authority, or “ACP”) immediately undertook a series of improvements5 to increase productivity. These improvements were part of an ACP strategic planning initiative to allow much larger ships to use the canal. Economic and financial analyses completed in the 2002–2005 period resulted in a proposal to add a new lock system—sometimes termed the third set of locks—which would double the existing capacity of ships6. The ACP technical proposal was approved first by a national referendum, then by the National Assembly, and the project began in September 2007, with a target completion date of late 2014. The project—and more importantly, its impacts—have been the subject of interest to several global trade groups, including shippers, steamship companies, logistic companies and all ports that could claim a beneficial economic impact from the investment. The Texas Department of Transportation (TxDOT) sponsored a 2-year TxDOT project—0-6690—to learn more about its impacts on Texas Gulf ports and any related landside transportation investment needs that might arise when the new Panama Canal locks are completed. It was entitled “The Dynamics of U.S-Asian-South American Waterborne Trade and the Panama Canal Expansion: Their Anticipated Impacts in Texas Ports and the State’s Economy.” The title reflected the economics of global trade, namely that it is impossible to look at the Panama Canal and estimate impacts on US ports without examining the global trade transportation networks and competing corridors. Texas Gulf ports, at a basic level, are impacted by the triangular trade patterns of Asia, South America, and the US. This drives the use of the Panama Canal both in its present configuration and with the enhanced capacity derived from the new, third set of locks now being completed.
1 “Why de Lesseps failed to build the Panama Canal,” http://www.ak190x.de/Bauwerke/panamaen.htm 2 An estimated 22,000 workers died during the French construction and 5,609 during the American construction from both accidents and illness, the latter due to rampant yellow fever that was dramatically reduced during the American construction through mosquito eradication policies. http://www.pancanal.com/eng/general/canal-faqs/ 3 $375 million in 1910 prices (ibid) 4 Panama became a sovereign country in 1903, breaking from Colombia, under the aegis of the United States, which established and controlled the Panama Canal Zone within the new country. In 1977 the Torrijos-Carter treaty laid the groundwork for a transfer of jurisdiction back to Panama of the zone and canal in 1999. 5 These included lock maintenance and improved controls, dredging at all locks and widening the Gatun Lake channel. 6 Bulk ships, for example, would move from 60,000 deadweight tons (dwt) to 120, 000 dwt.
2
1.2 TxDOT Report 0-6690-1
The first report—0-6690-1—comprised five chapters and an extensive appendix. Chapter 2 focused on Asian and Latin American trade lanes. It provided illustrations of waterborne trade routes and trade flows to and from Texas and an overview of both regional and country-specific imports/exports by commodity. Chapter 3 described the roles of Caribbean ports as hub-and-spoke conduits for container ships involved in both north-south and east-west trade. It began with a discussion of the historical development of hub ports in the Caribbean as transshipment centers. Case studies of the ports of Colon (Panama), Kingston (Jamaica), and Caucedo (Dominican Republic) were offered. The chapter concluded that hub ports, in many cases, are evolving into logistics centers, based on the certainty of an expanded Panama Canal.
Chapter 4 addressed the Panama Canal. It consisted of two parts. The first part described the canal’s current operations. Information was offered on current tolls, number of vessel transits, traffic by market segment (container, tanker, break-bulk, etc.), and how the Canal works in practice. The second part described the expanded canal—expected to open in 2015—in terms of investments in physical facilities and possible economic impacts. Chapter 5 discussed the Texas port system in terms of key strengths and challenges to growth. The chapter also contained in-depth profiles of the ports of Beaumont, Brownsville, Corpus Christi, and Houston. Each profile summarized cargo and passenger facilities, access to infrastructure, shipping operations, types of imported/exported commodities, and forecasts of future port activities. Finally, the appendix contained country profiles of major trading partners: Brazil, Chile, Colombia, Peru, and Venezuela in Latin America; and China, India, Japan, South Korea, and the Association of Southeast Asian Nations (ASEAN) in Asia. The country profiles provided information on general macroeconomic trends, governmental structures and institutions, trends in trade, descriptions of transportation infrastructure, and looming challenges to growing trade.
1.3 TxDOT Report 0-6690-2
This report captures recent developments in global trade routes and competition between US ports for serving larger ships—including those that will use the new locks—focusing on Texas Gulf ports to provide broad planning guidelines for TxDOT. It also describes two products developed by the study team. These products allow planners to estimate key cost elements that influence steamship company decisions to use a specific port of call: vessel operating costs and port terminal costs. These tools are provided for use by staff in the TxDOT Maritime Division and in the freight planning sector to assist in examining demand forecasts and landside access needs associated with specific Texas port terminals.
This report recognizes the importance of Latin America in both Texas port strategic planning and US export growth, much of it non-containerized, and specifically avoids evaluating economic impacts solely in terms of containerized commodities. Inevitably, it consists of data, analysis, and opinions recorded during a period when much remained uncertain. The current situation is dynamic; for example, as Southeast Asian7 producers successfully compete for global business, the Suez Canal route grows in importance8 because ASEAN producers can serve the US markets using either the Suez Canal to East Coast ports or direct service to US West Coast
7 Association of Southeast Asian Nations (ASEAN), see http://www.ustr.gov/countries-regions/southeast-asia-pacific/association-southeast-asian-nations-asean 8 Drewry reported that container traffic through the Panama Canal for May 2013 compared with May 2012 fell 9 percent.
3
ports. The total number of ships passing through the Panama Canal fell 11 percent in June 2013, compared with a year earlier and 7.8 percent year to date through June9. Suez Canal total transits have also fallen but only by 4 percent year in the second quarter of 2013, possibly as a result of larger ships entering service. In any event, Texas Gulf ports will benefit from the expansion of the Panama Canal since it provides US exporters with an improved trade lane to central Asia, with lower ton-mile costs for bulk products where they play a critical role in total landed costs.
This report begins with a literature review, principally based on 2012 reports and presentations that show a wide range of interests, preliminary findings, and speculation on the part of ports, DOTs, and researchers. The Panama referendum that approved the project in 2007 triggered a market strategy by the ACP which has been extremely successful, stimulating many US East and Gulf Coast ports to seek a variety of channel improvements. Chapter 3 examines both main and terminal channel projects in the Atlantic and Gulf sectors, showing that many ports are seeking to deepen their approach channels even though the larger ships will call at fewer ports. The scale of the US port channel projects is significant and nominal cost estimates exceed that of the Panama Canal project. US West Coast ports have recently completed over $1 billion in port channel improvement projects, US Gulf port channel projects total $1.8 billion, and US East Coast ports have invested $3.9 billion. The most challenging issue related to channel improvement projects is the time the planning process takes to complete. Several discrete steps are required to advance such a project from conception to completion and include establishing a federal government legitimate interest, conducting an economic feasibility study and an environmental impact statement, arranging project funding, completing design, and finally actually constructing the project. These steps have spanned 20-plus years on multiple occasions—similar to TxDOT long-range planning schedules.
A topic of interest to TxDOT is the landside impact of increased port tonnage—especially if it enters or leaves port property on a truck. Ships have to be unloaded and cargo processed efficiently at port terminals and, after security checks, moved to a landside transportation system that is often multimodal. Three components—water, terminal, and landside corridors—must integrate efficiently to form a compelling case for a steamship company route call and a shipper’s decision to use the port. Chapter 4 identifies, by port, investments that are impacting landside operations. Access to good rail service forms many of the investment packages proposed by port authorities predicting strong growth, whether from new traffic using the larger Panama Canal locks or strategic growth with established global port partners and steamship companies. Texas ports are mentioned in some detail, with the hope the Maritime Division can update the data at a later stage and build a coherent strategic vision of integrating deep- and shallow-draft ports into overall state transportation planning.
All-water services are addressed in two chapters. Chapter 5 deals with direct service where cargo is loaded at an originating port and stays on the ship until it reaches the destination port. While this system typifies how most bulk products, autos, and break-bulk are transported, some container services operate under a different paradigm, as described in Chapter 6. Chapter 6 describes maritime transshipment where boxes are unloaded at a point on the route and transferred to another ship for final delivery. Transshipment hubs are growing in part as a result of larger ships that stop infrequently at load centers strategically located around the globe where containerized cargo is transferred between ships. As an example, Caribbean hubs—including those planned for Panama—can efficiently serve a range of Latin American countries with commodities and build a break-even volume for a much lower cost per container, offering 9 “Fewer Container ships Transit the Panama Canal in June,” Journal of Commerce, July 10, 2013
4
transshipment services to larger ships than what operators can accomplish with a fleet of smaller ships running direct services to each individual country. They might also be able to respond competitively to new opportunities such as near-shoring production in Mexico. Chapter 7 describes the strategic response of an existing competitor to a larger Panama Canal—namely, southern Californian ports linked to Class 1 railroad intermodal services to Texas. The annual investment made by the two western railroads—Union Pacific and Burlington Northern Santa Fe—is substantially greater than the cost of the new Panama Canal lock system. Railroads will protect market share by offering a variety of services and prices where these are necessary. Chapter 8 presents a model developed as a product of this research that will allow planners to estimate deep-draft ship operating costs. The dataset used to develop the vessel-operating cost model is made up of six different types of vessels and multiple sizes within each type. The types of vessels included are bulk carriers, fully cellular containerships, liquid natural gas carriers, general cargo carriers, oil tankers, and roll-on roll-off carriers. Case studies are presented to show examples of how the model can be used by planners. Finally, Chapter 9 summarizes key findings and recommendations from the 2-year study.
5
Chapter 2. Literature Review
Widespread interest in the ability of steamship companies to offer new Panama Canal services through the new locks that could lower costs for all waterborne traffic—not just containers—grew strongly in 2012 as it became clear that the enhanced facility would open in 2015. The literature ranged from numerous single articles in trade journals to several larger studies, including one from the US Maritime Administration (MARAD) that has yet to be published10. There is also a companion TxDOT study to 0-6690 undertaken by the University of North Texas for TxDOT, but the final report was unavailable at the time this report was drafted. The subject continues to remain one of interest, exemplified by the decision to feature the Panama Canal at the January 2014 Transportation Research Board (TRB) Annual Meeting and other maritime meetings during the coming year. There will be a special TRB session to honor the centennial of the Panama Canal, together with a number of papers on topics including bulk commodities, realigned modal networks, crane productivity, and trade diversion from West Coast ports—all attributed to the new Panama Canal locks—to be presented at sessions jointly sponsored by TRB water- and terminal-related committees.
This chapter reports the findings from three 2012 Panama Canal impact studies to provide a sense of the content—data, assumptions, opinions, and assertions—derived from work completed by that date. The first study reported initial findings from ongoing research11 at the TxDOT 2012 Transportation Forum, the second was a presentation made to TxDOT by the Lyndon B. Johnson School of Public Affairs team reporting on project 0-669012, and finally the findings of a TxDOT Panama Canal Stakeholders Working Group (PCSWG) were provided in their final report in November 201213. The focus of these studies varied in several respects, with some overlap. The LBJ School team, for example, looked at the role of Asian and South American trade and the role of Caribbean hub ports, while the PCSWG had a wide range of state and regional maritime freight members who, together with trade specialists, provided insight into key domestic sectors—ports, highways, and rail corridors—in the national and state economies.
2.1 TxDOT Transportation Forum February 2012
This subject was selected for the February 2012 TxDOT Forum agenda because of its topicality and relevance to Texas. It seemed at that time to the casual observer that almost every large East Coast and Gulf port believed that the new canal locks could significantly increase trade passing through their gateway if only channels could be deepened and landside facilities improved. It seemed that every week brought a new claim that new US investments were warranted if a specific port was to capture a portion of the predicted increase in trade through the canal.
10 The 2011 MARAD-sponsored “Panama Canal Expansion Study” has four phases and the final report was unpublished at the time this report was finalized. 11 “Southwest Region University Transportation Center, “Evaluating the Impacts of the Panama Canal Expansion on Texas Gulf Ports,” SWUTC/13/476660-00062-1, March 2013. 12 This was published as TxDOT Technical Report 0-6690-1 “The Dynamics of U.S.–Asian-South American Waterborne Trade and the Panama Canal Expansion: Their Anticipated Impacts of Texas Ports and the State’s Economy,” available at http://library.ctr.utexas.edu/ctr-publications/0-6690-1.pdf 13 Panama Canal Stakeholder Working Group, “Preparing Texas Land and Sea for the Panama Canal Expansion,” November 2012. See http://ftp.dot.state.tx.us/pub/txdot-info/panama/final_report.pdf
6
The presentation reported that Texas ports were, in the short term, ready for the opening of the new locks and could immediately benefit if steamship companies moved to larger ships. The argument lies in the definition of what constitutes a “larger ship.” The nominal limit for the Panamax14 containership was 5,500 TEU,15 but Houston, for example, had already serviced a 7,500 TEU containership. How was that accomplished? The answer lies in the draft of the 7,500 TEU ship and the contents of the boxes it carried. Most containers carrying consumer goods are lightly loaded and the ship displaces less water than if the boxes contained heavy cargo, so the 7,500 TEU ship was able to use the current 45-foot Houston ship channel. However, it would not be able to take 7,500 TEU loaded with typical Texas exports because they are heavier and the ship would need additional draft.
In the medium term, rail connectivity linked to terminals sited on 45-foot or deeper channels should be a TxDOT planning focus because it would lower the cost of the heavier state exports. The unfortunate tendency to focus on containerized imports when discussing international trade was discussed. In reality, several commodity categories constitute a Texas portfolio of cargoes that all contribute to the success of the state economy. This was particularly true for the state energy sector that was beginning to be positioned, in the minds of many, as a global player for both oil and gas.
In the long term, the new Panama Canal system would reach equilibrium within the variety of trade corridors serving Texas and play an important role by broadening shipper choice. In addition, if deepening Gulf port channels could not be funded, the possibility of using “hubs”16 at natural deep-water sites in Panama or the Caribbean would negate the need to dredge, dispose of material, and maintain long approach channels.17 The main point the findings conveyed at the Forum was simple: the new locks are going to be open and will be priced to be competitive with other routes, and though the impacts at first might be modest, the provision of an improved supply chain route—particularly for Texas exports—would be welcomed by shippers and the logistics sector.
TxDOT Project 0-6690 entitled “Selected 2012–2014 Trade Flows and Texas Gulf Ports: Panama Canal and South American Markets” was awarded to a joint CTR/LBJ and TTI team and was designed to address two major issues in terms of global impacts: Texas ports and the Panama Canal expansion. The first year focused on patterns of global demand that formed the customer base for Texas ports, while the second year examined likely changes in ship size, routes, and commodities once the larger locks were opened in early 2015. The LBJ School team presented their preliminary findings in April 2012 to the TxDOT advisors selected by the Research, Technology and Implementation (RTI) office. The presentation was entitled “Panama Canal Expansion: Its Role in U.S.-Asian-South American Trade and Its Potential Impact on the Texas Transportation System.”
The findings first examined the broad markets served by Texas ports (both imports and exports) and developed chapters on trade lanes and trends in trade for both Asia and Latin America. It was done both to give a sense of scale in trade volume and value and to reflect changes in the location of economic activity in each region. As an example, the pre-eminence of China in global trade with the US is being impacted by economic growth in the ASEAN group,
14 The term for a ship that is designed to operationally meet the maximum dimensions of the older locks. 15 About 2,600 40-ft. boxes 16 Transloading is defined as a container transfer to a smaller ship capable of servicing the final port of call. 17 Jim Kruse, Director of TTI’s Ports and Waterways Group, stated that some channels might require an additional 12 miles of dredging to maintain greater water depths.
7
which now competes effectively with China, principally on the basis of sound but cheap labor. Southeast Asia port locations, in certain circumstances, favor Suez Canal all-water services18. The same can be asserted for India, though many landside problems at Indian ports also exert a higher transportation cost on commodities traded with Texas.
The team first asked whether Texas ports could easily accommodate the trade volumes associated with the larger ships now entering service and repeated the conclusion reached by others that almost all current authorized depths in the Gulf limit ship size. Not only is dredging Gulf access channels expensive because of length, the volumes of key traffic—like containers—is limited to Houston and Freeport terminals where there is insufficient volume for the larger ships. Typically, analysts estimate the volume needed for a weekly liner service of a 10,000 TEU ship lies round 4–5 million TEU annually, which is about twice the amount moved through Houston in 201219. Finally, a number of Texas terminals have a chokepoint or lack rail access, which raises the cost of multimodal flows and unit train access. Although these challenges can be addressed through multi-year planning and funding, competition for certain activities—dredging, for example—requires comingling of funds from a variety of sources, which limits and lengthens the likelihood of implementation.
Economic forecasts for the Texas ports were viewed as positive, with Houston and Corpus Christi benefiting from the larger Panama Canal locks, while Beaumont and Brownsville will benefit from growth in Latin American trade. All ports will benefit from global trade growth and a subset, including shallow-draft ports, will benefit from the energy sector. The study findings were preliminary, but some pointers were offered on the role that TxDOT could play to assist the port community in supporting the growth of the state economy. The first was to focus on highway bottlenecks, particularly bridges and terminal links, which are generally being addressed by most ports through close collaboration with TxDOT District planning and programming staff. This would also include evaluating the benefits of overweight corridors at key ports, especially if it would reduce truck volumes and improve safety. The study recommended that TxDOT monitor and support rail investment, especially if it supported export flows. Finally, it suggested a more effective way of promoting port activities be developed before the 2013 statewide transportation plan is updated in 2013.
Table 2.1: Preliminary Conclusions of TxDOT Project 0-6690-1
1. Texas economic performance is forecasted to remain strong and benefit Texas ports.
2. Energy exploration and production will stimulate import and export demand and could impact Panama Canal flows.
3. TxDOT should defer large investments based on benefits from the new locks until there is more clarity in maritime markets.
4. TxDOT should monitor market developments as part of its statewide transportation planning.
18 This is particularly true as steamship companies have deployed very large ships on a variety of southern Eastern-European routes, including Maersk, which is now offering a Suez route to Northern Atlantic US ports. See http://shipandbunker.com/news/world/903669-maersk-line-switching-from-panama-to-suez-route 19 This volume typically recognizes the port as a “load center.”
8
The third conclusion about the relevance of the Panama Canal is based on a two-fold argument. First, the Canal plays a small part in global trade20 and Texas ports are reporting faster growth in trade with Latin American. Second, the maritime sector is dynamic and will maintain a presence in many all-water routes in its efforts to grow service and retain business. In April 2012, there was no agreement about the timing and magnitude of canal impacts. Moreover, as ship size grows, they call at fewer ports to maintain scale economies. With this in mind, since a number of Caribbean hub ports already service large ships, “hub and spoke” services could be offered to Texas container customers without the need to provide full draft for the ships. In terms of specific regions, manufacturing shifts from China to Southeast Asia and India may make the Suez route—for US East Coast ports—more attractive. Finally, railroads should be expected to take action, in pricing for example, to protect their market share on the California-Midwest transcontinental routes in the face of Panama Canal competition.
Interest in the Panama Canal impacts on Texas ports continued through 2012 to the point where it was decided to call a wide range of stakeholders to join a working group to advise the state, through TxDOT, to respond to the various opinions and produce a strategic report for TxDOT. This working group met in six different locations and took testimony and planning information from a wide variety of individuals and entities.
2.2 TxDOT Panama Canal Stakeholder Working Group (PCSWG)
The first-year 0-6690-1 study findings were presented mid-2012 to the PCSWG21. First, since ship size is critical in terms of cost per ton, improvements like the Panama Canal locks have the potential to reduce these costs for the range of commodities moving between market pairs. This may benefit Texas exports to Asian markets, both of bulk and agricultural products. The longer-term impacts are more important than the shorter-term, particularly since north-south trade remains critical for Texas ports. In terms of maritime planning, it was suggested that partnering with shippers, deep-water ports, railroads, and key Gulf Intracoastal Waterway (GIWW) users would allow TxDOT to strengthen its understanding of current and changing patterns of waterborne demand. As part of this activity, new services for dry bulk, liquid bulk, and containers would be monitored. This, in turn, would determine potential constraints that could be the focus of medium-term planning and fall into three groups— channels on the seaside, terminal (port) efficiencies, and landside connectivity for rail, highway and barge. These could be grouped into short-, medium- and long-term projects that could integrate with the TxDOT highway planning routines and processes.
The PCSWG report was published in November 201222 and its recommendations are summarized in Table 2.2.
20 Panama Canal throughput was less than 5% by world tonnage in 2011. 21 June 2012 22 http://ftp.dot.state.tx.us/pub/txdot-info/panama/final_report.pdf
9
Table 2.2: Main Recommendations of the 2012 Panama Canal Stakeholders Group23
1. TxDOT should remain focused on trade-related transportation improvements.
2. TxDOT should formalize freight into transportation planning.
3. Plans are needed to increase the use of the GIWW.
4. Texas ports should continue port and terminal improvement plans.
5. TxDOT should act as a resource to Texas ports.
6. TxDOT should support rail capacity improvements to accommodate growth in imports and exports.
7. TxDOT should develop a “Texas Global Gateway” marketing and information system.
The PCSWG provided TxDOT with a wide range of recommendations about maritime
activities and gateways, some unrelated to the expansion of the canal. Table 2.2 shows that few recommendations were directly related to the impacts of the new canal locks in Panama. Rather, they remind transportation planners that all freight, modes, and gateways need to be working efficiently and marketed to shippers to support a competitive system for both imports and exports.
TxDOT addressed several recommendations, either wholly or in part, by early 2013. The PCSWG team members were invited to stay on; they provided strategic responses to issues that might emerge during the 83rd Legislative Session24. Integrating freight into statewide planning had begun earlier and at least the first steps were made when preparing the request for proposals for the 2013 update of the statewide transportation plan. There is a long way to go before statewide planning can reflect patterns derived from logistical analysis, but there is a potential for experimenting with changes to the traditional statewide planning format that will eventually produce more accurate planning data. TxDOT recognizes the role of the GIWW and is attempting to determine alternative ways of supporting a program that would make a series of investments to raise system efficiency. Texas ports compete for business with both state and regional ports and each has a portfolio of potential funding mechanisms. However, there are always many more projects than the available funding can support, even at the largest ports. The 2008–2010 recession and slow recovery have driven shippers and the maritime industry to seek the lowest cost gateways and they are resistant to higher rates to support new investments, even when they result in higher productivity levels and lower costs below current levels.
In January 2013 TxDOT announced the appointment of its first Maritime Division Director tasked with working with all deep- and shallow-draft Texas ports to integrate their strategies into multimodal statewide planning. This provides a major opportunity to bring maritime planning into the mainstream of statewide planning, working through the Texas Ports Association and key water-related entities. The recommendations on rail are sensitive, since rail companies that can access or serve Texas port terminals want to grow business, but not at the expense of rail freight—particularly containerized freight—traveling across the trans-continental 23 http://tti.tamu.edu/group/stsc/files/2011/05/Turnbull-12-18-12.pdf 24 The team members were asked to provide a wide variety of stakeholder insights and the group was called the Texas Freight Advisory Committee (TxFAC).
10
systems in which they have invested billions of dollars over the past decade. A related point is that the current rail system has sufficient capacity for at least the coming decade and perhaps longer. Previous rail analysis suggests that inefficient bottlenecks constrain capacity and these may be site-specific and sometimes in other states.25 It would be helpful if regional system-wide bottlenecks, including those at Texas ports, could be derived from statewide rail planning analysis and recognized in state freight planning. Finally, the call to form a Texas Global Gateway marketing and information system is interesting but lies outside TxDOT and is better placed in other state agencies. If TxDOT planning activities can be integrated to reflect improvements to port and corridor efficiencies, the logistics industry will respond through their own highly-detailed, dynamic information systems.
This chapter reflects the wide variety of interest shown at both state and federal levels in the Panama Canal expansion and its related economic impacts, especially on US exports.26 Ports function in three areas to remain efficient: the seaside (channels), the terminals (port), and the landside (modal access). The first—deep-water channels—allows larger ships to access the port terminal and is an essential component of a true “load center” for containers as well as bulk cargoes sensitive to economies of scale and pricing. The second is typically addressed in the strategic planning of the port and funded through a variety of mechanisms, including partnering with users and terminal operating companies. The third—landside modal connectivity—though working reasonably well at present, should be considered as the key area where TxDOT has the highest impact. In a recent Texas waterborne trade study27, over 40 percent of projects identified as port improvements were highway projects. Moreover, many had been subject to transportation analysis and entered into the TxDOT transportation improvement process. The importance of efficient freight corridors serving the Texas Gulf port hinterland, including locations in other states, remains a critical TxDOT responsibility as it addresses one of its key goals—supporting the state economy. The new Maritime Division should examine the connectivity between intra- and interstate modal corridors and the various port terminals to ensure that Texas Gulf ports have the best opportunity to offer competitive service to both imports and exports.
The question of adequate channel depths and berths remains relatively critical at the time of this report and the subject of channel improvements planned for Atlantic and Gulf ports is addressed in the next chapter to provide an overview of the scale of the investments needed if all the port programs are aggregated.
25 See http://www.camsys.com/pubs/AAR_Nat_%20Rail_Cap_Study.pdf 26 There were at least two other research reports sponsored by MARAD and the DOT, and almost every transportation-related event dealing with trade had a session on the Canal in 2012. 27 Cambridge Systematics, 2011. See: http://ftp.dot.state.tx.us/pub/txdot-info/library/reports/gov/tpp/spr/waterborne/waterborne_phase2.pdf
11
Chapter 3. Channel Improvement Projects
3.1 Introduction
The maximum size of a ship using the Panama Canal today is 956 feet long by 106 feet wide with a draft not exceeding 39.5 feet. Naval architects devised a special class of ship, termed “Panamax” which would meet these limits and still remain competitive on key routes. The new lock dimensions have a maximum length of 1200 ft. and a width (beam) of 160 ft. with a draft of 49.9 feet. The new locks allow much larger ships, termed “post-Panamax,” to use the canal, although ultra-large container and bulk ships cannot be accommodated. The container capacity of ships will increase from 5,000 TEU to approximately 12,000 TEU28, recognizing that capacity is influenced by both the design of the vessel and the weight of the containerized cargo. Equally important for the US is the capacity of post-Panamax bulk ships, which will approximately double to around 120,000 tons. Products that are currently unable to use the canal but could use the new locks include liquefied natural gas (LNG) tankers—a future advantage to Gulf ports such as the Sabine-Neches Waterway, Freeport, and Corpus Christi, which already have an export LNG terminal or are planning to build one for Asian markets.
It appears that US port authorities have taken the position that the first port authority to prove it can meet new post-Panamax requirements will have a substantial advantage over its competitors. Interestingly enough, 9 of the top 15 container ports on the East and Gulf Coast have channels less than 45 ft. in depth, and only two—Baltimore and Hampton Roads29—currently have channels of 50 ft. depth, which is needed for ultra-large container ships. This adds a complication to assessing the impacts of the Panama Canal expansion because ports with a 50-ft. draft can already service the large container ships now using the Suez Canal for trade with Southeast Asia and India. As noted earlier, Maersk has announced its intention to employ its displaced, but still large, post-Panamax container ships on a Southeast Asia-North Atlantic service starting in 2013.
3.2 Is There a Need?
The literature and trade press emphasize a concern that many of the ports currently wishing to deepen their channels to service larger vessels will fail to attract the volume of service calls needed to justify the investments. They conclude that it does not make economic sense for Charleston, Savannah, and Miami all to have deeper harbors without more total demand from all routes and not just those using the Panama Canal. A high volume of vessel calls is required to justify the size of investment these ports are pursuing, and it is not certain that each port can generate that level of volume.
The unfortunate truth is that ports are not necessarily pursuing higher cargo volumes, but instead are seeking to attract bigger ships in hopes of preventing those ships from going to rival ports. Even the US Army Corps of Engineers (Corps), which conducts feasibility studies for such projects and manages the dredging, expects little change in total cargo volume at East Coast
28 “TEU” stands for twenty-foot equivalent unit. This is the standard unit of measure for container traffic. A container that is 20 feet long is 1 TEU; a 40-ft. container is 2 TEUs. 29 New York will soon join this elite group.
12
ports.30,31 Instead, it is expected that there will be fewer, more efficient vessel calls with greater payload per vessel.
The Corps’ economic impact study on the deepening of the Savannah River to 48 feet predicted “no additional cargo volume through Savannah harbor as a result of the proposed harbor deepening.”32 In other words, the benefits of the deepening would be realized through lower costs for shippers resulting from greater economies of scale achieved by the larger ships—not increased total volumes. The Corps predicts that there will not be significant cargo gains at the port unless there is a sizeable increase in world trade. Moreover, it concludes that the deepening will result in only 5,700 temporary full-time job equivalents (FTEs) during construction.33
It would appear that some port authorities believe they will prosper after the canal’s expansion by attracting high levels of business from their competitors. The data on containerized trade shows this is unlikely. Although volumes have grown over two decades, port rankings have formed two groups dominated by (1) Los Angeles, Long Beach, and New York-New Jersey (the true US “load centers”) and (2) the remaining ports—those that handle under 3 million TEUs. An examination of the West Coast port data shown in Figure 3.1 reveals that their volumes have tended to move in tandem over time, indicating that no particular subregion has been able to alter its share of total volumes in a significant way. In fact, the only case of volumes shifting from one port to another occurred with Seattle and Tacoma when NYK shipping lines moved from Seattle to Tacoma, but due to their extremely close proximity, one could make the case that the Puget Sound ports did not alter their standing vis-à-vis other ports.
Figure 3.1: West Coast Container Volume Trends 1990–2010 30 Curtis Tate, “As funds sought for deeper ports, will ships come in?”, McClatchy Newspapers, May 3, 2012. Available at http://www.thestate.com/2012/05/03/2260493/as-funds-sought-for-deeper-ports.html as of August 13, 2013. 31 “Evidence doesn’t support huge investment in deeper Ga. Port,” Valdosta Daily Times, April 5, 2012. 32 Peter Tirschwell, “Excess Capacity Trumps East Coast Port Battles for Investment,” Journal of Commerce, April 13, 2012. 33 Dan Chapman, Port Wars: Global Uncertainty, Atlanta Journal Constitution, April 1, 2012. Available at http://lsega.com/uploads/AJC_Article_on_Port.pdf as of June 5, 2013.
0
1
2
3
4
5
6
7
8
9
1990 1994 1998 2002 2006 2010
Mill
ion
TEU
Los Angeles
Long Beach
Seattle
Oakland
Tacoma
13
A closer examination of the East Coast port data shown in Figure 3.2 suggests that the findings are similar to the Seattle and Tacoma ports. In this case, it shows that Savannah clearly has profited at the expense of Charleston. However, this shift in trade was due more to Charleston’s lack of suitable land and to the community’s traditional “not-in-my-backyard” stance—and not because of channel dimensions or terminal capabilities. Additionally, the Georgia Ports Authority began marketing their services to shippers directly, rather than to the shipping lines that were the more traditional focus of business development efforts. This resulted in large distribution facilities being built near the port and creating an almost captive port customer base. However, as in the case of Seattle-Tacoma, these two ports are so close in proximity one could make the case that they function as a single port subregion with little change in the “balance of power” among the East Coast port subregions.
Figure 3.2: East Coast Container Volume Trends 1990–2010
On the Gulf Coast, the only port that figures among the top 10 container ports in the United States is Houston, which has captured about 70 percent of the overall Gulf Coast container market. There are no other ports in the region that directly compete with Houston at a significant level.
Lars Jensen, CEO of global maritime analysis specialist firm SeaIntel, does not believe the Panama Canal expansion is going to lead to a “huge revolution.”
It would allow for carriers with the big ships to go through the Panama rather than the Suez Canal. That would save them a few vessels but in itself would not change trade flows significantly. So far, what we have seen does not seem to suggest that you will have a massive shift in cargo from the West to the East Coast of the U.S. compared to the current distribution. However, I would expect the overall unit cost of moving containers from Asia to the U.S. East Coast to certainly decrease.34
34 “Mixed Reactions to Panama Canal Expansion,” Maritime Executive, July/August 2012.
-
1
2
3
4
5
6
1990 1994 1998 2002 2006 2010
Mill
ion
TEU Charleston
Hampton Roads
Savannah
NY/NJ
14
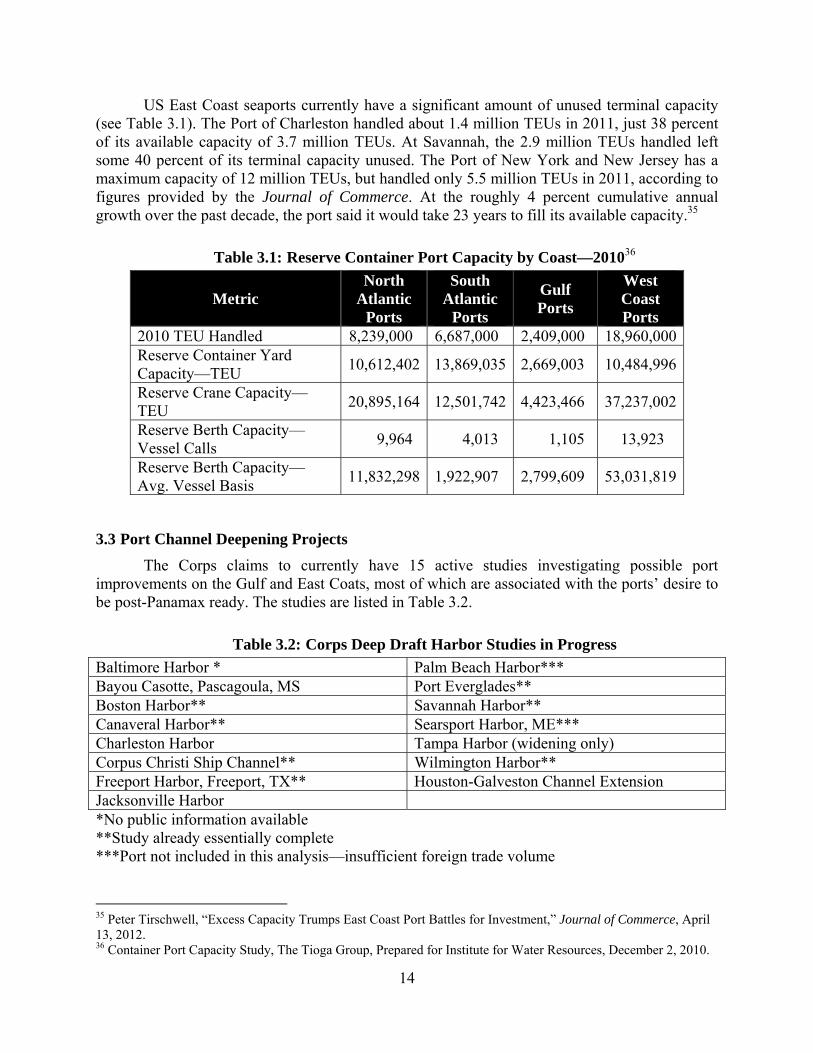
US East Coast seaports currently have a significant amount of unused terminal capacity (see Table 3.1). The Port of Charleston handled about 1.4 million TEUs in 2011, just 38 percent of its available capacity of 3.7 million TEUs. At Savannah, the 2.9 million TEUs handled left some 40 percent of its terminal capacity unused. The Port of New York and New Jersey has a maximum capacity of 12 million TEUs, but handled only 5.5 million TEUs in 2011, according to figures provided by the Journal of Commerce. At the roughly 4 percent cumulative annual growth over the past decade, the port said it would take 23 years to fill its available capacity.35
Table 3.1: Reserve Container Port Capacity by Coast—201036
Metric North
Atlantic Ports
South Atlantic
Ports
Gulf Ports
West Coast Ports
2010 TEU Handled 8,239,000 6,687,000 2,409,000 18,960,000Reserve Container Yard Capacity—TEU
10,612,402 13,869,035 2,669,003 10,484,996
Reserve Crane Capacity—TEU
20,895,164 12,501,742 4,423,466 37,237,002
Reserve Berth Capacity—Vessel Calls
9,964 4,013 1,105 13,923
Reserve Berth Capacity—Avg. Vessel Basis
11,832,298 1,922,907 2,799,609 53,031,819
3.3 Port Channel Deepening Projects
The Corps claims to currently have 15 active studies investigating possible port improvements on the Gulf and East Coats, most of which are associated with the ports’ desire to be post-Panamax ready. The studies are listed in Table 3.2.
Table 3.2: Corps Deep Draft Harbor Studies in Progress
Baltimore Harbor * Palm Beach Harbor*** Bayou Casotte, Pascagoula, MS Port Everglades** Boston Harbor** Savannah Harbor** Canaveral Harbor** Searsport Harbor, ME*** Charleston Harbor Tampa Harbor (widening only) Corpus Christi Ship Channel** Wilmington Harbor** Freeport Harbor, Freeport, TX** Houston-Galveston Channel Extension Jacksonville Harbor *No public information available **Study already essentially complete ***Port not included in this analysis—insufficient foreign trade volume
35 Peter Tirschwell, “Excess Capacity Trumps East Coast Port Battles for Investment,” Journal of Commerce, April 13, 2012. 36 Container Port Capacity Study, The Tioga Group, Prepared for Institute for Water Resources, December 2, 2010.
15
Additionally, Congressman Cedric Richmond (LA-02) has reintroduced the DREDGE Act–Dredging for Restoration and Economic Development for Global Exports Act. The bill would authorize the Corps to dredge the Mississippi River to 50 feet from Baton Rouge to the Southwest Pass sea buoy so that larger vessels transiting the expanded Panama Canal can access the river. In addition, the bill creates a pilot project to promote the rebuilding of wetlands using existing sediment dredged from the river.
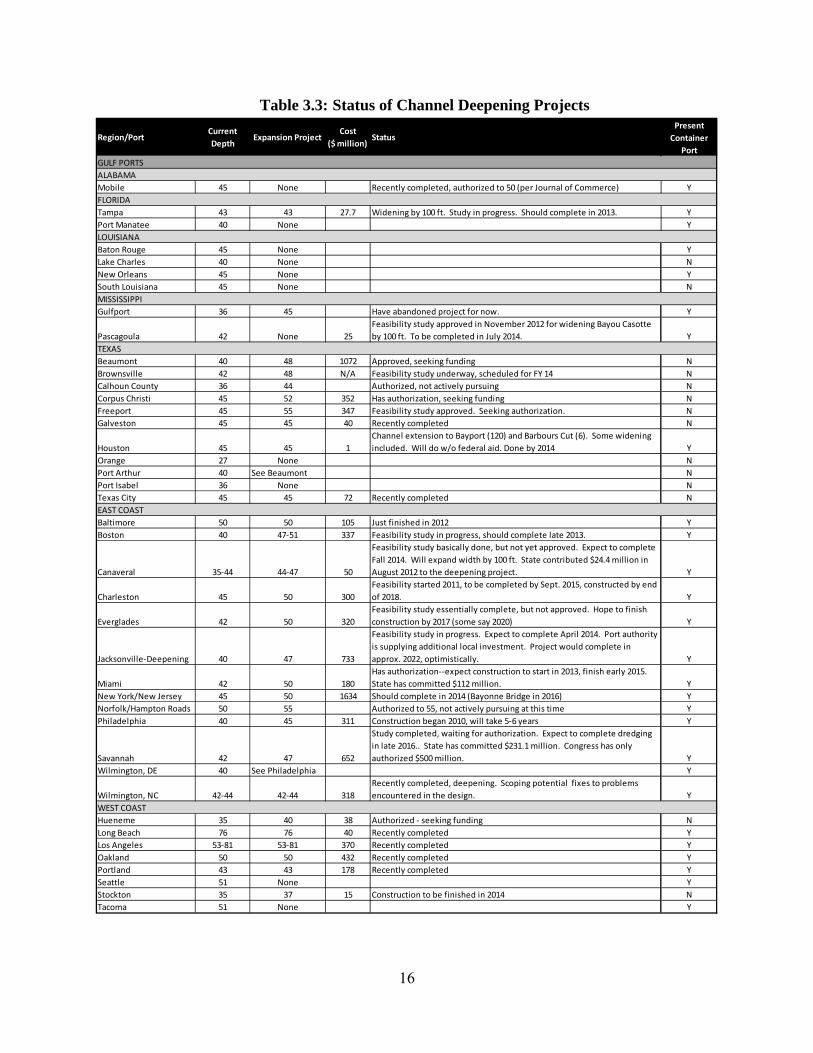
Table 3.3 lists the major ports in the US that (1) recently completed a channel improvement project, or (2) are in the process of conducting the necessary studies, or (3) have secured authorization and are seeking funding.
16
Table 3.3: Status of Channel Deepening Projects
Region/PortCurrent Depth
Expansion ProjectCost
($ million)Status
Present Container
PortGULF PORTSALABAMAMobile 45 None Recently completed, authorized to 50 (per Journal of Commerce) Y
Tampa 43 43 27.7 Widening by 100 ft. Study in progress. Should complete in 2013. YPort Manatee 40 None YLOUISIANABaton Rouge 45 None YLake Charles 40 None NNew Orleans 45 None YSouth Louisiana 45 None NMISSISSIPPIGulfport 36 45 Have abandoned project for now. Y
Pascagoula 42 None 25Feasibility study approved in November 2012 for widening Bayou Casotte by 100 ft. To be completed in July 2014. Y
TEXASBeaumont 40 48 1072 Approved, seeking funding NBrownsville 42 48 N/A Feasibility study underway, scheduled for FY 14 NCalhoun County 36 44 Authorized, not actively pursuing NCorpus Christi 45 52 352 Has authorization, seeking funding NFreeport 45 55 347 Feasibility study approved. Seeking authorization. NGalveston 45 45 40 Recently completed N
Houston 45 45 1Channel extension to Bayport (120) and Barbours Cut (6). Some widening included. Will do w/o federal aid. Done by 2014 Y
Orange 27 None NPort Arthur 40 See Beaumont NPort Isabel 36 None NTexas City 45 45 72 Recently completed NEAST COASTBaltimore 50 50 105 Just finished in 2012 YBoston 40 47-51 337 Feasibility study in progress, should complete late 2013. Y
Canaveral 35-44 44-47 50
Feasibility study basically done, but not yet approved. Expect to complete Fall 2014. Will expand width by 100 ft. State contributed $24.4 million in August 2012 to the deepening project. Y
Charleston 45 50 300Feasibility started 2011, to be completed by Sept. 2015, constructed by end of 2018. Y
Everglades 42 50 320Feasibility study essentially complete, but not approved. Hope to finish construction by 2017 (some say 2020) Y
Jacksonville-Deepening 40 47 733
Feasibility study in progress. Expect to complete April 2014. Port authority is supplying additional local investment. Project would complete in approx. 2022, optimistically. Y
Miami 42 50 180Has authorization--expect construction to start in 2013, finish early 2015. State has committed $112 million. Y
New York/New Jersey 45 50 1634 Should complete in 2014 (Bayonne Bridge in 2016) YNorfolk/Hampton Roads 50 55 Authorized to 55, not actively pursuing at this time YPhiladelphia 40 45 311 Construction began 2010, will take 5-6 years Y
Savannah 42 47 652
Study completed, waiting for authorization. Expect to complete dredging in late 2016.. State has committed $231.1 million. Congress has only authorized $500 million. Y
Wilmington, DE 40 See Philadelphia Y
Wilmington, NC 42-44 42-44 318Recently completed, deepening. Scoping potential fixes to problems encountered in the design. Y
WEST COASTHueneme 35 40 38 Authorized - seeking funding NLong Beach 76 76 40 Recently completed YLos Angeles 53-81 53-81 370 Recently completed YOakland 50 50 432 Recently completed YPortland 43 43 178 Recently completed YSeattle 51 None YStockton 35 37 15 Construction to be finished in 2014 NTacoma 51 None Y
FLORIDA
17
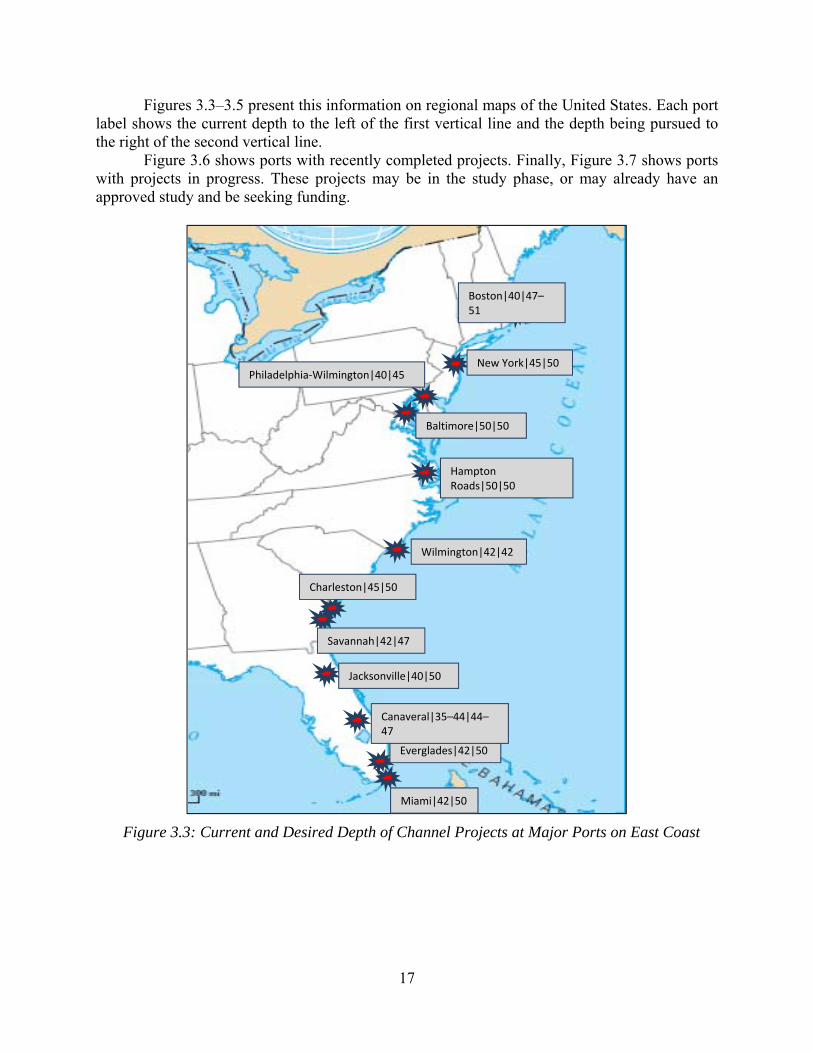
Figures 3.3–3.5 present this information on regional maps of the United States. Each port label shows the current depth to the left of the first vertical line and the depth being pursued to the right of the second vertical line.
Figure 3.6 shows ports with recently completed projects. Finally, Figure 3.7 shows ports with projects in progress. These projects may be in the study phase, or may already have an approved study and be seeking funding.
Figure 3.3: Current and Desired Depth of Channel Projects at Major Ports on East Coast
Miami|42|50
Everglades|42|50
Canaveral|35–44|44–47
Jacksonville|40|50
Savannah|42|47
Charleston|45|50
Wilmington|42|42
Hampton Roads|50|50
Baltimore|50|50
Philadelphia-Wilmington|40|45New York|45|50
Boston|40|47–51
18
Figure 3.4: Current and Desired Depth of Channel Projects at Major Ports on West Coast
Tacoma|51|51
Seattle|N/A|N/A
Portland|43|43
Stockton|35|37
Oakland|50|50
Port Hueneme|35|40
Los Angeles|53|53
Long Beach|76|76
Figure 3.5: Current and Desired Depth of Channel Projects at Major Ports on Gulf Coast
20
Figure 3.6: Completed Channel Projects on East, West, and Gulf Coasts 2012
21
Figure 3.7: Channel Projects in Progress on East, West, and Gulf Coasts
22
One of the most challenging issues related to channel improvement projects is the time to completion. Several discrete steps are required to advance such a project from conception to completion, including the following:
• Reconnaissance study to see if the federal government has a legitimate interest. • Feasibility study to determine if the project makes economic sense and to correctly
define the dimensions of the project to be constructed. In many cases this may require an Environmental Impact Statement.
• Project funding and design. • Construction.
These steps have spanned 20-plus years on multiple occasions. For example, in October
2011, the Corps completed the deepening of the Columbia River to Portland, Oregon—and the project took 20 years from start to finish. The Corps has spent more than 16 years studying the Savannah project and still does not have the official authorization to proceed.
In an effort to expedite the process, some port authorities are paying the federal share up front and seeking reimbursement later. The federally mandated cost-sharing structure for a project deeper than 45 feet requires the local sponsor (state or port authority) to pay for approximately 60 percent of the cost. In South Carolina, the legislature has taken an aggressive approach, committing $300 million to the Harbor Deepening Reserve Fund that will fund 100 percent of the construction cost of the proposed harbor project for the Port of Charleston (its estimated share under the normal cost-sharing arrangement is approximately $180 million).37 This allocation would cover the entire estimated construction cost to deepen the harbor to 50 feet, following the completion of the project's feasibility study and authorization by Congress. Expenditures from the fund would require approval by the Joint Bond Review Committee comprised of both House and Senate Members.
The State of Florida has also taken an aggressive posture on channel improvement projects. One example is Port Canaveral. The port will receive $24.4 million in funding from the State of Florida to complete its harbor widening and deepening project to accommodate larger cruise and cargo ships. The port is planning to deepen its channel to 47 feet from the current 44 foot depth and expand the width to 500 feet from the current 400 feet. Construction work is scheduled to begin mid-2013 and is expected to be completed in the fall of 2014. State funding will allow the project to be completed 4 years earlier than possible through the federal process.
Although the focus of these channel improvement projects has primarily been the depth of the channel, it is important to note that the Asian export/US import trade is considered to be “cube trade,” i.e., the container “cubes out” (fills up in terms of volume) before it “weighs out” (reaches the weight limit). For high volume trade routes, channel width and turning basin size may be of greater importance than additional channel depth at some ports, as the sailing draft of vessels loaded to their volume capacity is often significantly less than their design draft.
While U. S imports may cube out, US exports often weigh out, especially in the Gulf for chemical products (plastic pellets and resins), so ideally a port should have a seaside system that can offer both depth and maneuverability. A major contributor to the efficiency of a port is the landside infrastructure—terminals, gates, and modal corridors—and this aspect is examined in the next chapter. 37 “South Carolina Legislature Commits $300 Million to Charleston Harbor Deepening,” American Association of Port Authorities Advisory, July 2, 2012.
23
Chapter 4. Landside Improvements
4.1 Introduction
Economies of scale drive steamship company interest in moving waterborne freight in larger ships, supported by competitive bidding by global shipbuilders. The newest ships benefit from hull designs that reduce drag, new engine technologies that reduce fuel consumption, and electrical systems that can be connected to a land-based source when in port, eliminating main engine emissions. These comprise an important stimulus to purchase ships, but this addresses only the waterborne element of any supply chain. Ships have to be unloaded and cargo processed efficiently at port terminals and, after security checks, moved to a landside transportation system that is often multimodal. Three components—water, terminal and landside corridors—must integrate efficiently to form a compelling case for a steamship company route call and a shipper’s decision to use the port. For a channel improvement project to have any real economic impact, the waterfront and shoreside infrastructure must be capable of efficiently handling the increased levels of freight moving out of, and into, the terminal serving the ship. Succinctly, the three components must act as a system.
Competition for new cargo through the canal is fueling higher annual spending levels each year on US port landside infrastructure than the cost of the entire canal expansion project. In a 2012 American Association of Port Authorities infrastructure spending survey, US ports and their marine terminal partners indicated that, cumulatively, they plan to spend nearly $46 billion on improvements to their facilities over the next 5 years38. That is about $9 billion annually, while the total cost of the Panama Canal project is approximately $5.2 billion.
Several ports are investing large sums of money in landside infrastructure in addition to improving their channels. Four of the five US ports scheduled to spend at least $100 million on in capital improvements in 2013 are on the Gulf and East Coasts, as shown in Table 4.1.
Table 4.1: North American Ports Leading in Capital Expenditure Spending
(Top 5)39 Port Expenditure Amount 1 Los Angeles/Long
Beach $1.0 billion (30% LA/70% LB): Approximately ½ dedicated to port terminal and rail projects.
2 New York $345 million (allocation only to ports)
3 Houston $220 million 4 Charleston $157 million 5 Savannah $100 million
Norfolk, Seattle, and Miami have already spent in excess of $100 million in capital
expenditures from 2010–2012, or have appropriated project funding after 2013 that will likely
38 “Infrastructure Improvements,” American Association of Port Authorities website, as of May 21, 2013. http://www.aapa-ports.org/Industry/content.cfm?ItemNumber=1025&navItemNumber=1029 39 K.C. Conway, North American Port Analysis, Colliers International, April 2013.
24
place them in the top five in 2014. Colliers International has produced a table indicating the “Post Panamax-Ready” status of the major ports in North America, as shown in Table 4.2.
Table 4.2: North American Post-Panamax (P-PMX) Port Readiness Update40
Port Coast P-PMX Status P- PMX Update New York East In Process Bayonne Bridge being raised Philadelphia East Not before 2015 Dredging Delaware River to 45 feet Baltimore East P- PMX Ready Norfolk East P- PMX Ready First East Coast port to be P- PMX Ready Charleston East In Process Dredging and developing new inland port Savannah East Not before 2015 Study completed for 47-ft. channel Jacksonville East Not before
2015 Dredging and bridge height hurdles
Port Everglades
East Not before 2015 Dredging application in process
Miami East In Process New Super P- PMX cranes ordered Tampa Gulf Not before 2015 No plans to dredge or raise Skyway Bridge Mobile Gulf P-PMX Ready Deepest port on Gulf New Orleans Gulf Not before 2015 No plans or funding to upgrade further Houston Gulf In Process Dredging and upgrading cranes LA/Long Beach
West P-PMX Ready Despite P-PMX Ready, #1 in Capital Expend.
Oakland West P-PMX Ready Portland West Not before 2015 Labor issues Seattle West P-PMX Ready Increasing competition from Prince Rupert Prince Rupert West
(Canada) P-PMX Ready Fastest growing West Coast port
P-PMX Ready Ports 7 P-PMX Ready Ports by 2015 11
The most severe competition to Texas ports will be brought on by improvements made in Gulf and East Coast ports; therefore, it is important to pay attention to ports on these two coasts that are planning to upgrade their facilities. The following is not an exhaustive listing—it is a representative listing intended to illustrate the breadth and scope of improvements being planned by competing ports.
4.2 Northeast and Mid-Atlantic Ports
4.2.1 New York/New Jersey
The deepening project—targeted for completion in 2016—is part of a $2 billion investment program by the Port Authority in the last 10 years to provide an efficient, productive, and environmentally sustainable logistics platform. As part of this program, the Port of New
40 K.C. Conway, North American Port Analysis, Colliers International, April 2013.
25
York/New Jersey is planning to spend $743 million to raise the Bayonne Bridge41, which is currently too low for the biggest ships. In addition, the private container terminal operators in the Port have invested approximately $1 billion in their facilities during the same period. The Port Authority investments also include an on-port intermodal system that can handle over 1 million intermodal rail containers per annum.42
4.2.2 Wilmington, DE
Officials of Delaware’s Port of Wilmington recently announced plans for expansion to include a $500 million deepwater terminal on the Delaware River.
4.2.3 Baltimore
The Port of Baltimore channel improvement project is part of a greater infrastructure project totaling $1.3 billion in the Baltimore area.
4.2.4 Port of Virginia (Hampton Roads)
On July 1, 2013, the Port of Virginia was given the power to enter into public-private partnerships with external entities, as a result of new powers granted by the Virginia Legislature. The new industrial development capability will allow the port “to look outside of the fences” to help develop distribution centers.
The port is betting that improved rail service will improve its reach to markets along the East Coast and in the southeast. The port has benefited from Norfolk Southern Railway’s (NS) new double-stack service from its two container terminals that began in fall 2010. By expanding tunnels through its Heartland Corridor initiative, NS was able to cut the trip from the port to the Midwest by 250 miles, reducing transit time by a day. NS’s double-stack service between the port and Greensboro, North Carolina, has also helped the Port of Virginia gain market share in the southeast. NS has direct-dock access at APM Terminals and retains virtual sole access at Norfolk International Terminals.
CSX Transportation (CSX) has also gained better access to the port, increasing competition between the two Eastern Class 1 railroads. CSX gained on-dock service at the port’s APM Terminals in January 2012 after the railroad won the Maersk Line contract away from NS. The Jacksonville, Florida-based railroad previously had to dray its containers to a short-line railroad connecting to its mainline network. The railroad currently lacks double-stack access to and from the port until it expands a 100-year-old rail tunnel in Washington, D.C. CSX expects the Virginia Avenue tunnel project to be completed in 2 to 3 years.
4.2.5 Georgia Ports Authority
The State of Georgia plans to spend $1.4 billion in port improvements in addition to the channel deepening project. In December 2012, Georgia Ports Authority (GPA) unveiled its first
41 “Coast Guard Greenlights Bayonne Bridge Project,” Breakbulk, May 17, 2013, available at http://www.breakbulk.com/breakbulk-news/industry-sector/epcs-project-owners/coast-guard-greenlights-bayonne-bridge-project/ as of May 21, 2013. 42 Peter J. Zantal , “Mailbag: Readers Respond to Ernst Frankel's ‘Challenges for America's East Coast Shipping, Ports and Trade,” The Maritime Executive, March 31, 2011, available at http://www.maritime-executive.com/article/mailbag-readers-respond-to-ernst-frankel-s-challenges-for-america-s-east-coast-shipping-ports-and-trade/ as of May 21, 2013.
26
four electrified rubber-tire gantry (ERTG) cranes. They are part of a larger 20-crane purchase. The ERTG rollout makes Savannah the first port in North America to introduce this cleaner and more efficient method of operation. In November, the expanded Mason Intermodal Container Transfer Facility opened for business, cutting round-trip Norfolk Southern train movements to Atlanta by 6 hours. The $6.5 million project added 6,000 feet to existing trackage. July 2012 brought the opening of the Highway 307 overpass, a $22.5 million project accelerating traffic through GPA’s Garden City Terminal.
4.2.6 Charleston
Charleston has approved a 10-year, $1.3-billion capital plan that includes major investments in both new and existing facilities, equipment, and information systems. Additionally, the state of South Carolina is investing nearly $700 million in port-related infrastructure, including $300 million to fund Charleston’s harbor deepening project.
4.3 Florida Ports
In September, Florida TaxWatch, a respected nonpartisan budget watchdog group in Tallahassee, issued a report outlining how Florida ports are investing in infrastructure to improve their standing as hubs of international trade. Collectively, Florida ports are expected to make $2.7 billion in capital improvements between 2011 and 2016.43 In his annual State of the State address, Florida Governor Rick Scott emphasized the need for strategic infrastructure investments and announced his budget recommendation of $288 million in seaport improvements in 2012.
4.3.1 Miami
The Port of Miami is spending $2 billion in preparation for its improved channel. One major project that involves the private sector is the tunnel to link the island-based Port of Miami directly with the Interstate highway system on the mainland, as opposed to present routings over a bridge and through downtown business district streets, which add to shipping costs and pose safety hazards. The $607 million project is being made possible through state, county, and city funding and a private-sector concessionaire.
4.3.2 Tampa
In Tampa, $320 million in improvements are planned for the next 5 years. A new rail line and roadway connecting Interstate 4 and the Lee Roy Selmon Expressway will make it faster to move cargo out of the port. The Tampa Gateway Rail Terminal provides Florida its first on-dock unit train intermodal container capability.
4.3.3 Canaveral
Port Canaveral’s total capital investment in seaport infrastructure in 2013 is anticipated to be $65 million. Bluewater Terminals is finalizing development of a 13-acre bulk terminal and conveyor system. The investment totals $4 million and the terminal should be operational by mid-2013. North Cargo Berths 5 and 6 are deep-water berths designed to a depth of 43 feet and
43 William E. Thompson, “The Benefits of Investing in Freight Infrastructure,” AAPA Seaports Magazine, Spring 2013.
27
offer 1,872 feet of new berthing space. Berth 5 and Berth 6 should both be completed by September 2013.
4.4 Central Gulf Ports
4.4.1 New Orleans
The Port of New Orleans is investing $5 million to $8 million to build an on-dock intermodal rail terminal next to the Napoleon Avenue terminal, with the help of a $17 million TIGER grant received in December 2011. Once the $26 million project is complete, the port expects container volume through the terminal to soar from 25,000 TEUs to more than 120,000 TEUs.
4.4.2 Mobile
The Port of Mobile, whose container throughput grew 30 percent in 2011 to 169,000 TEUs, is in the middle of Phase 2 of the expansion of its 3-year-old APM Terminal Mobile. It is spending $30 million to expand its container yard by an additional 45 acres, which would increase its size to 135 acres.
The port started building a new ship-loader for coal in December, which will add another 5 million to 6 million tons of export capacity. The port authority is also considering investing another $70 million to retrofit its import coal terminals for the export trade. It may build a third export berth in addition to the two it will have in operation by the middle of 2013.
4.5 Texas Ports
4.5.1 Houston
The Port of Houston expects to spend $1 billion over the next decade to complete the Bayport Container Terminal, $700 million to upgrade the Barbours Cut Terminal, and $700 million on the Turning Basin and new wharves. In 2013, the Port Authority expects to seek Port Commission approval for $220 million in capital improvement projects. Approximately $142 million will be allocated to the container terminals, i.e., continuing development at Bayport and modernization at Barbours Cut. In addition, as local sponsor of the Houston Ship Channel, the Port of Houston Authority will reserve about $9 million for maintenance dredging and related improvements. The remaining 2013 capital budget will be used primarily for projects at the general cargo and bulk terminals in the Turning Basin area and port security.
Private manufacturers are investing an estimated $35 billion in new facilities in the Houston area. In a survey by the Greater Houston Port Bureau of the 132 energy companies located along the Houston ship channel, the 52 companies that responded said they plan to invest $28.8 billion over the next few years in their production facilities for the domestic and export markets.44
4.5.2 Corpus Christi
The port has undertaken efforts to extend and deepen its channel for more than a mile in developing the 1,100-acre La Quinta Trade Gateway Terminal; this project should be completed
44 Peter T. Leach, “Fired Up Over Fuel,” Journal of Commerce, May 13, 2013.
28
in 2013. The La Quinta project, a $74 million venture largely funded by the federal government, will feature a three-berth ship dock with nine ship-to-shore cranes, a 180-acre container storage yard, an intermodal rail yard, and more than 400 acres for distribution and warehouse centers.
The port also plans a $17 million expansion of its Nueces River Rail Yard to accommodate freight train traffic that has doubled since 2007. TPCO Americas is opening a new $1.3 billion seamless pipe mill across US 181 from the Port of Corpus Christi La Quinta site in San Patricio County in 2013. All phases of the facility are expected to be operational in late 2014.
Corpus Christi Liquefaction, LLC (Corpus Christi Liquefaction), a subsidiary of Cheniere Energy, is developing an LNG export terminal at one of Cheniere’s existing sites that was previously permitted for a regasification terminal. The site includes approximately 1,000 acres owned and/or controlled by the company. It is located on the La Quinta Channel on the northeast side of Corpus Christi Bay in San Patricio County, Texas, and is approximately 15 nautical miles from the coast. The Corpus Christi Liquefaction Project is expected to be constructed in phases, with each LNG train commencing operations approximately 6 to 9 months after the previous train. The project is underpinned by the significant resources under development in the Eagle Ford Shale play. Construction should be completed by 2019.
LyondellBasell, a global plastics, chemical, and refining company, is investing $400 million to build a petrochemical plant at the port that will produce polyethylene terephthalate (PET) and PET plastics from Eagle Ford gas for the US and export markets.
Italian resin manufacturer M&G Group plans to build a $1 billion plant at the port by 2016 to manufacture PET for shipment to US and overseas plants that use it to make plastic bottles. The project is expected to bring 40 rail carloads in and out of the plant every day. With the help of a $10 million federal TIGER grant, the port, the state, and railroads are investing $46 million in a new railyard to serve the M&G plant. The Port has signed a long-term lease agreement with Voestalpine Texas Holding, LLC, for 376 acres of the Plains Cotton Cooperative Association’s La Quinta Trade Gateway. Voestalpine will construct a plant to produce direct-reduced iron using Eagle Ford gas, and shipping through a high-performance dock on the site.
4.5.3 Galveston
The Port of Galveston has contracted with consultants to investigate the economic and operational feasibility of developing a rail-served roll-on/roll-off and container facility. In late 2012, the port signed an agreement with the Texas-Mexico & Pacific Railroad and Lexington Coal Co. to develop a coal export terminal on Pelican Island and build a railroad bridge and tracks. Additionally, the Port has initiated the design phase of capital improvements to Slips 12 and 14.
4.5.4 Freeport
Port Freeport will complete the Berth 7 construction project in fiscal year 2013, which is a key element in the development of the Port’s Velasco Terminal. At full build-out, including three berths and 90 acres of backlands, the Velasco Terminal will generate 3,000 direct jobs plus an equal number of induced and indirect jobs, according to preeminent industry economist Dr. John Martin.45 The first phase of the new Velasco Terminal Project is underway with the site
45 Port Freeport Comprehensive Annual Financial Report, Fiscal Year Ended September 30, 2012. Available at http://www.portfreeport.com/annual_files/2012Report.pdf as of May 21, 2013.
29
civil work completed and dock construction expected to be complete in the third quarter of 2013. This project includes a new 800-foot berth and 20 acres for cargo marshaling that is expected to cost $60 million.
To alleviate increased rail and truck traffic congestion and to improve safety at the port, Port Freeport entered into an agreement with Brazoria County to seek funding from TxDOT to construct a grade separation at the intersection of FM 1495 and State Highway 36. On October 29, 2012, the Executive Director of TxDOT issued an order authorizing the project, subject to the negotiation and execution of a pass-through toll agreement with Brazoria County. The estimated $27.2 million project will be cost shared between TxDOT, Brazoria County, and Port Freeport. Port Freeport’s estimated share of this project is $9.4 million, which includes port-provided right-of-way at a current estimated value of $2.7 million. The current project timeline provides for preliminary design completion in 2012 and project construction completion in 2015.
The port is developing a plan for its multimodal facilities that could include up to three new rail lines, each approximately 5,000 feet long, providing service enhancements related to both Parcel 25 and the new Velasco Terminal. These investments will significantly improve capacity for port clients and service by Union Pacific, and are necessary to accommodate the increase in rail shipments.
The port is planning a $31 million rail facility at Parcel 14 to provide an area for loading and offloading of project cargo and containers to and from the port.
Brazoria County industries have more than $9 billion of investments planned for the immediate future. Freeport LNG Development LP is investing some $4 billion in expanding its LNG facility. The firm has signed new 20-year contracts to export LNG from the facility. Dow Chemical is investing more than $4 billion in four new projects—a joint venture chlor-alkali plant, a propylene production facility, an ethylene cracker, and a Dow AgroSciences plant. Finally, Phillips 66 Company is undertaking a joint venture with Chevron Corporation for a $1.1 billion terminal expansion, and BASF is making a $100 million investment in plant expansion.
4.5.5 Calhoun County Port Authority
Excelerate Energy L.P., based in The Woodlands, is seeking federal authority to build an LNG export terminal at the Port of Port Lavaca-Point Comfort. Excelerate operates a fleet of LNG regasification vessels worldwide and the project on Lavaca Bay would be the company’s first deployment of floating LNG liquefaction, storage, and offloading technology. The Calhoun Port Authority has signed a lease option agreement with Excelerate covering approximately 85 acres of Port Authority uplands and submerged property fronting on the Matagorda Ship Channel south of the Point Comfort Turning Basin. The project will require authorization from the Federal Energy Regulatory Commission and be subject to a full public environmental review and analysis under the National Environmental Policy Act. Company officials have estimated that approval, construction, and installation could be completed by 2017. In August 2012 the US Department of Energy granted Excelerate a long-term, multi-contract authorization to export LNG to free-trade-agreement nations from the Lavaca Bay project. Excelerate is looking at potential ship channel modifications that could be beneficial to operation of the planned LNG export terminal.
Formosa Plastics Corp. has begun work on a $1.7 billion expansion of its chemical complex, which is served by the Port of Port Lavaca-Point Comfort. The expansion is expected to be in operation in 2016. One part of the expansion—the new olefins unit—will take advantage of plentiful South Texas natural gas supplies that are being developed in the Eagle Ford Shale.
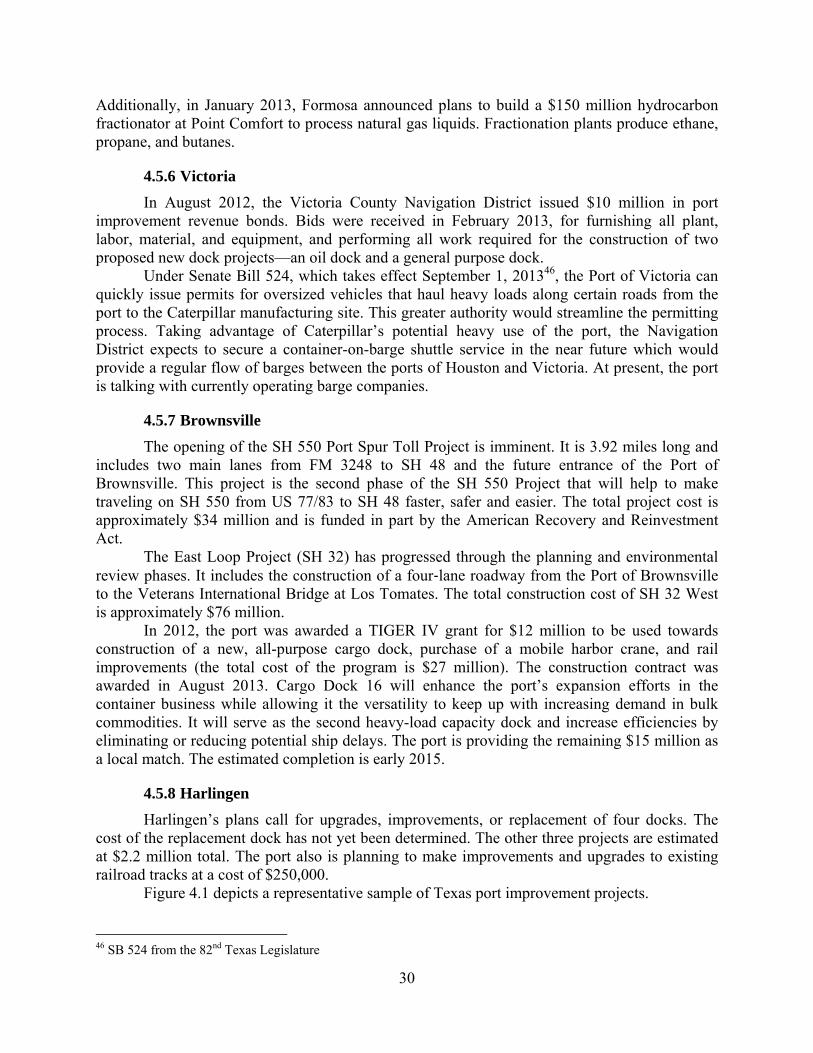
30
Additionally, in January 2013, Formosa announced plans to build a $150 million hydrocarbon fractionator at Point Comfort to process natural gas liquids. Fractionation plants produce ethane, propane, and butanes.
4.5.6 Victoria
In August 2012, the Victoria County Navigation District issued $10 million in port improvement revenue bonds. Bids were received in February 2013, for furnishing all plant, labor, material, and equipment, and performing all work required for the construction of two proposed new dock projects—an oil dock and a general purpose dock.
Under Senate Bill 524, which takes effect September 1, 201346, the Port of Victoria can quickly issue permits for oversized vehicles that haul heavy loads along certain roads from the port to the Caterpillar manufacturing site. This greater authority would streamline the permitting process. Taking advantage of Caterpillar’s potential heavy use of the port, the Navigation District expects to secure a container-on-barge shuttle service in the near future which would provide a regular flow of barges between the ports of Houston and Victoria. At present, the port is talking with currently operating barge companies.
4.5.7 Brownsville
The opening of the SH 550 Port Spur Toll Project is imminent. It is 3.92 miles long and includes two main lanes from FM 3248 to SH 48 and the future entrance of the Port of Brownsville. This project is the second phase of the SH 550 Project that will help to make traveling on SH 550 from US 77/83 to SH 48 faster, safer and easier. The total project cost is approximately $34 million and is funded in part by the American Recovery and Reinvestment Act.
The East Loop Project (SH 32) has progressed through the planning and environmental review phases. It includes the construction of a four‐lane roadway from the Port of Brownsville to the Veterans International Bridge at Los Tomates. The total construction cost of SH 32 West is approximately $76 million.
In 2012, the port was awarded a TIGER IV grant for $12 million to be used towards construction of a new, all-purpose cargo dock, purchase of a mobile harbor crane, and rail improvements (the total cost of the program is $27 million). The construction contract was awarded in August 2013. Cargo Dock 16 will enhance the port’s expansion efforts in the container business while allowing it the versatility to keep up with increasing demand in bulk commodities. It will serve as the second heavy-load capacity dock and increase efficiencies by eliminating or reducing potential ship delays. The port is providing the remaining $15 million as a local match. The estimated completion is early 2015.
4.5.8 Harlingen
Harlingen’s plans call for upgrades, improvements, or replacement of four docks. The cost of the replacement dock has not yet been determined. The other three projects are estimated at $2.2 million total. The port also is planning to make improvements and upgrades to existing railroad tracks at a cost of $250,000. Figure 4.1 depicts a representative sample of Texas port improvement projects.
46 SB 524 from the 82nd Texas Legislature
Figure 4.1: Representative Port Improvement Projects—Non-Channel
32
4.6 Caribbean Ports
Port investments of all types are also increasing in the Caribbean. For example, the port authority of Jamaica is spending about US$130 million on dredging and related work to prepare the Kingston Container Terminal to be ready for the 2015 completion of the Panama Canal expansion. This will be accomplished through loan financing and internally generated funds. At the same time, France-based CMA CGM Group, the world’s third largest container shipping firm, is looking to invest some US$120 million on Jamaican port expansion.
The Kingston project will result in the terminal (already by far the authority’s main revenue earner) being capable of accommodating the largest of containerships that will transit the expanded canal—drafting up to 15.2 meters (nearly 50 feet) and carrying up to 12,000 TEUs. The Freeport Container Port can already accommodate post-Panamax ships and serves many ship calls on the north-south Atlantic routes. Transloading already takes place for a number of containerized freight and facilitates transfers to Jones-Act-compliant US flagged ships that can make US multi-port calls.
Although much activity is occurring in the area of channel improvements and landside
infrastructure projects, other equally important factors determine whether the volumes carried by all-water services through the Panama Canal to the Gulf and East Coasts will actually increase. These factors and the current state of all-water services are explored in the next chapter.
33
Chapter 5. All-Water Services: Direct Shipment
5.1 Background
The term “all-water service” used in the context of this study covers two alternative services. The first comprises a direct service from the port where the freight is loaded through to the port selected by the shipper as the destination port. An example would be freight loaded at Hong Kong on a Panamax ship and routed to Houston using the Panama Canal. The ship may call at other ports en route, but the Houston freight remains on the ship. The second service requires the freight to be moved from one ship to another prior to its arrival at the destination port selected by the shipper. These definitions are dominated by container movements because boxes can be easily lifted and switched at an intermediary port. Bulk products and most other freight—like autos—are therefore rarely transshipped. An example of this service would be Houston containers loaded at Hong Kong on a service routed through the Panama Canal with a final call at a US East Coast port. The routing includes a stop at a Caribbean hub port where the Houston containers are unloaded and then transferred to another, generally smaller, ship that makes the call at Houston. The post-Panamax ships likely to use the new Panama Canal locks will have to transship their Texas containers if there is insufficient channel depth at the destination port47. Failure to maintain channel depths to 45 feet at US ports may force inbound vessels to offload cargo at Caribbean feeder ports, adding costs and delays not incurred by direct origin-port-to-destination-port shipments.
The US alternative to an all-water service is a “land bridge” service. These services offload the cargo at a port other than the port that is closest to the final destination and then move the cargo to its final destination by rail and truck. The most common practice for commodities that are containerized and moving from China is to offload at a West Coast port and then move the cargo eastward by rail, using two services48. The first involves directly loading the marine container on an intermodal rail car either on dock or after draying the box to a rail terminal. The loaded train then leaves the West Coast for an intermodal terminal where it can either interline with another Class 1 railroad or simply dray the container to its final destination. The second service involves draying the container to a transloading point where the containerized freight is transferred to a larger US domestic container49. This is then loaded on a US domestic intermodal railcar and taken to the final customer by rail and truck. Clearly, the most important competitor to the Panama Canal is the US intermodal system. Most commodities moving through the intermodal system tend to be higher value, time-sensitive, containerized traffic. Lower-value, less time-sensitive, bulk, or breakbulk traffic continues to move via all-water service through the Panama or Suez Canals. The choice between the intermodal system and all-water service continues to be customer-specific and/or shipment-specific.
The trade flows that compete with the US intermodal system, Northeast (NE) Asia-US East Coast and Europe-US West Coast, account for over 60 percent of total current Panama
47 Steamship companies will also not schedule a service if the container demand is insufficient, irrespective of adequate channel depth. 48 Mexico is also interested is this traffic. KCS de Mexico is touting its Lazero-Cardenas-to-Houston intermodal service as a competitor to the Panama Canal service and it offers a shorter schedule and less expensive service to Texas Triangle destinations. 49 The domestic container mimics the ubiquitous 53 ft. trailer seen in interstate routes—53 ft. long, 8.6 wide, with a 110-inch set of doors for on dock fork lift operations.
34
Canal traffic and are expected to grow to over 65 percent by 202550. These market segments (particularly the NE Asia–US East Coast trade flows) are the most intensely competitive and the actions taken by the Panama Canal Authority (ACP, using its Spanish language acronym) to improve its price-service offering will be important in determining the share of the market it captures and the revenues it generates. Consequently, special attention should be focused on these market segments.
The majority of US trade that passes through the Panama Canal travels between the US East Coast and Asia, US East Coast and West Coast South America, and US West Coast and Europe51. By far the largest recipients of US exports passing through the Panama Canal are the North Pacific Asian nations, primarily China, Japan, and South Korea.
A 2003 study concluded that the containerized cargo moving through the Panama Canal does so primarily along 12 trade routes, with flows between NE Asia and the United States being by far the largest. For the largest single segment, NE Asia-US, the canal captured about 30 percent of trade to the eastern US region, only 3 percent of trade to the Gulf region, and none of trade to the western region. Other trade flows, such as US East Coast–Oceania, can be considered captive, with the canal being the only route used. Asia-US cargo comprises approximately 40 percent of the total canal volume.52
A quarter of the vessels engaged in the trans-Pacific trade to the West Coast hold 8,000 TEUs or more, and that number will grow to 40 percent by 2013, according to a 2011 study by Germany’s DVB Bank.53 It is important to emphasize that all-water services are important to non-containerized shipments as well. However, in the last decade, containerized cargo has displaced dry bulk cargo as the canal’s main income generator. Vehicle carriers have become the third income generator, replacing liquid bulk cargo. Nevertheless, even with all of the bulk, breakbulk, and container services that transit the canal, the all-water container services from Asia to the US East Coast still comprise the largest and most important segment of the Panama Canal’s business.
The forecast for US agricultural exports predicts that China will move ahead of Canada as the most important destination for US agricultural products, and much of this trade will move through the Panama Canal. Bob Sappio, managing director of Alvarez & Marsal and a former executive vice president of APL, says, “When you look back over the last decade or so, much of that shift [to the East Coast] has already taken place. In 2000, the Asia-to-US import cargo split was about 83 percent West Coast and 17 percent East Coast. Today the cargo split is closer to 70 percent West Coast and 30 percent East Coast.”54 Interviews with steamship lines indicate that the proportion of Asia-East Coast-destined cargo moving all-water is now 20–25 percent. “We are confident much of the trans-Pacific shift has already taken place,” said Aaron Hunt of Union Pacific, one of the country’s main rail systems operating primarily west of the Mississippi. “We feel our intermodal rail network gives the West Coast ports the advantage in shipping time-sensitive products all the way to the Ohio Valley and points south of the Ohio Valley”55.
50 The Panama Canal Impact on the Liner Container Shipping Industry, Louis Berger Group, Inc., for the Panama Canal Authority, October 2003. 51 See TxDOT Report 0-6690-1 for more trade details, routes and country profiles. 52 The Panama Canal Impact on the Liner Container Shipping Industry, Louis Berger Group, Inc., for the Panama Canal Authority, October 2003. 53 “Battle of the Big Ships,” Journal of Commerce, April 23, 2012. 54 Peter T. Leach, “Advantage, West Coast,” Journal of Commerce, March 19, 2012. 55 Jessica Meyers, “Panama Canal expansion turns into ‘money grab’,” Politico, May 13, 2012.
35
Giant distribution centers occupied by the world’s largest retailers are found around the big import hubs of New York-New Jersey, Savannah, and Charleston. IKEA, Wal-Mart, Target, Home Depot, Hyundai, etc., all have significant investments on the East Coast with good rail and road connections to their major markets.
Table 5.1 provides a simplified decision matrix that shows the relevant routing choices for certain trade lanes.
Table 5.1: Route Choices for Relevant Trade Flows56
Trade US Region Relevant to Canal
Route Choices Divertible, Captive,
or Not Relevant
NE Asia – US Gulf Coast Yes AW/IM57/Suez Divertible West Coast No Not Relevant
SE Asia – US East Coast Yes AW/IM/Suez Divertible Gulf Coast Yes AW/IM/Suez Divertible West Coast No Not Relevant
US – Oceania East Coast Yes Canal Only Captive West Coast Yes Direct/Trans-shipment Divertible
US – North Coast/East Coast of South America
West Coast Yes AW/IM Divertible East Coast No Not Relevant
West Coast – South America
East Coast Yes Canal Only Captive West Coast Yes Direct/Trans-shipment Divertible
Europe – US West Coast Yes Divertible East Coast No Not Relevant
One of the markets showing rapid growth for Texas importers and exporters is the west
coast of South America. A more efficient transit through the Panama Canal will enable Texas businesses to be more competitive in that region. The tables found in Appendix C provide statistics on containerized trade between US Gulf ports and the west coast of South America. What stands out in these tables is the strong growth in cargo volumes in this trade lane over the last 4 years. Export volumes are up 26 percent from 2008; import volumes are up 15 percent. A strong imbalance has developed in the direction of trade with a ratio of 3:1 for US exports versus US imports.
5.2 Determining Factors
Shifting gateways is a complex process. A number of variables determine whether a shipment will follow an all-water route or a land bridge route:
• Transit time
• Reliability or sensitivity to transit time variability
• Cost differential between alternative routes
56 The Panama Canal Impact on the Liner Container Shipping Industry, Louis Berger Group, Inc., for the Panama Canal Authority, October 2003. 57 AW = All-Water, IM = Intermodal (Land Bridge)
36
o Transportation cost (base rates, fuel surcharges, etc.) o Inventory carrying cost o Insurance o Fees (including canal fees, port fees, etc.) o Other logistics costs
• Rail service and rates at West Coast ports
• State of the US economy (e.g., housing market)
• State of the Chinese or Southeast Asian economies (for US exports)
• Instability in other world regions (especially the Indian Ocean)
• Capital costs of new vessels
• Environmental regulations and considerations
• Efficiency of port operations
• Availability of warehouse space Collectively, these factors will determine which ports offer shippers the best value for
their money. As a result, ports with clear advantages will experience higher traffic volumes, and rapid growth in traffic volumes and market share. Ports that lag behind will experience lower traffic volumes, and slower growth in traffic volumes and lower market share.
Many shippers within the same industries make different route choice decisions based on factors such as the location of their distribution centers, the value of merchandise, manufacturing practices, and other decision-making idiosyncrasies. Even though transport time and cost are the factors most often mentioned, each shipper’s perspective of the relative importance of each of these factors and their potential effect on different products can be significantly different.
The ability of East and Gulf Coast ports to capture market share away from West Coast ports may be determined less by capacity than by pricing and efficiency. However, the proprietary nature of much of the cost data underlying routing decisions reduces the accuracy of analyses.
The following sections expand on the factors most often mentioned in literature as being important in a shipper’s routing choices.
5.2.1 Flexibility
Several of the large retailers make maximum use of the all-water route, whereas manufacturers generally prefer the intermodal (land bridge) route. This can be explained in part by the retailer’s control of the supply chain from port of loading to retail outlet, whereas the manufacturer generally controls the supply chain only up to its distribution warehouse. Also, retailers have better information on where and when the merchandise is to be delivered.
5.2.2 Landside Facilities
Having a larger Panama Canal does not guarantee that larger ships will transit the canal on their way to Gulf or East Coast ports. Adequate port facilities and cargo volumes must be in place to justify a call at any of these ports.
37
West Coast ports have established advantages, such as warehousing space for containers and highly developed rail connections to the Midwest and Southeast.
5.2.3 Cost
The following factors have the greatest effect on direct transportation cost:
• Shipping rates
• Port handling fees
• Alternative route tolls (Panama versus Suez)
• Rail rates and surcharges
Different studies have produced findings that range from significant cost savings for all-water services to hardly any cost savings at all. One recent study found that the difference in cost per TEU would be less than $125.58 The ongoing campaigns to remove sulfur and CO2 from bunkers will certainly result in costlier marine fuel, eroding some of maritime transport’s cost advantages.
The main challenge West Coast ports face is productivity. To handle the giant ships, terminal operators must put five cranes against each ship, and each crane must average at least 30 moves an hour. Average crane productivity at West Coast ports today is only in the mid-20s. In an attempt to address this issue, the Port of Long Beach is constructing one of the nation’s most automated terminals at Pier S—pending the completion of the environmental review process.
In an attempt to reduce fuel consumption and lower operating costs, several carriers have instituted the practice of “slow steaming”—sailing at less than standard operating speeds. Higher freight inventory expenses, particularly those associated with the longer all-water route, would reduce the advantages of the (longer) all-water service relative to land bridge intermodal service, possibly ensuring that only shipments of lower value freight would follow the all-water route. However, pricing comes into play since fuel consumption is significantly reduced. Wartsila, a marine engine maker, reports that on an Asia-EU-Asia route, dropping from 27 to 22 knots brings about a 45 percent reduction in fuel consumption, while dropping further to 18 knots reduces the consumption by 59 percent59. Shippers, when faced with price reductions offered by steamship companies based on such savings, might be willing to make changes in their logistics networks and inventory handling to compensate for longer deliveries.
Slow steaming, however, significantly increases the already-existing time penalty for all-water service from Asia to the US East or Gulf Coast. While lower-value goods may be able to bear this penalty in return for lower transport costs, it is unclear if shippers of higher-value and/or time-sensitive products would be willing to trade off shipping cost for perhaps several additional days in transit on a route that already takes as much as a week longer than West Coast land bridge intermodal options. This will be particularly true if rail land bridge service becomes faster—western railroads are implementing some express services that can save more than a day compared to traditional services to inland locations.
58 Randolph R. Resor and Eric Gabler, “Divergent Opinions on the Impact of the Panama Canal Expansion,” Inland Port Magazine, 2012 Issue 1, p. 5. 59 See Wartsila “Slow steaming a viable long term option? 2012
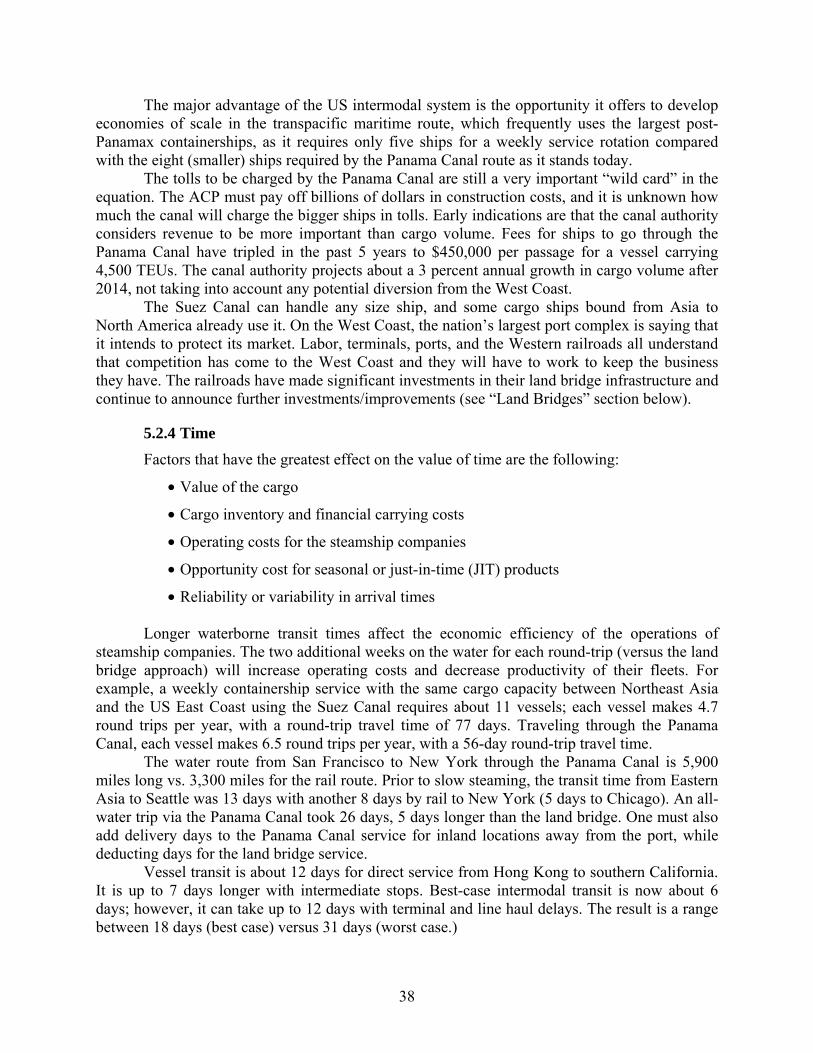
38
The major advantage of the US intermodal system is the opportunity it offers to develop economies of scale in the transpacific maritime route, which frequently uses the largest post-Panamax containerships, as it requires only five ships for a weekly service rotation compared with the eight (smaller) ships required by the Panama Canal route as it stands today.
The tolls to be charged by the Panama Canal are still a very important “wild card” in the equation. The ACP must pay off billions of dollars in construction costs, and it is unknown how much the canal will charge the bigger ships in tolls. Early indications are that the canal authority considers revenue to be more important than cargo volume. Fees for ships to go through the Panama Canal have tripled in the past 5 years to $450,000 per passage for a vessel carrying 4,500 TEUs. The canal authority projects about a 3 percent annual growth in cargo volume after 2014, not taking into account any potential diversion from the West Coast.
The Suez Canal can handle any size ship, and some cargo ships bound from Asia to North America already use it. On the West Coast, the nation’s largest port complex is saying that it intends to protect its market. Labor, terminals, ports, and the Western railroads all understand that competition has come to the West Coast and they will have to work to keep the business they have. The railroads have made significant investments in their land bridge infrastructure and continue to announce further investments/improvements (see “Land Bridges” section below).
5.2.4 Time
Factors that have the greatest effect on the value of time are the following:
• Value of the cargo
• Cargo inventory and financial carrying costs
• Operating costs for the steamship companies
• Opportunity cost for seasonal or just-in-time (JIT) products
• Reliability or variability in arrival times Longer waterborne transit times affect the economic efficiency of the operations of
steamship companies. The two additional weeks on the water for each round-trip (versus the land bridge approach) will increase operating costs and decrease productivity of their fleets. For example, a weekly containership service with the same cargo capacity between Northeast Asia and the US East Coast using the Suez Canal requires about 11 vessels; each vessel makes 4.7 round trips per year, with a round-trip travel time of 77 days. Traveling through the Panama Canal, each vessel makes 6.5 round trips per year, with a 56-day round-trip travel time.
The water route from San Francisco to New York through the Panama Canal is 5,900 miles long vs. 3,300 miles for the rail route. Prior to slow steaming, the transit time from Eastern Asia to Seattle was 13 days with another 8 days by rail to New York (5 days to Chicago). An all-water trip via the Panama Canal took 26 days, 5 days longer than the land bridge. One must also add delivery days to the Panama Canal service for inland locations away from the port, while deducting days for the land bridge service.
Vessel transit is about 12 days for direct service from Hong Kong to southern California. It is up to 7 days longer with intermediate stops. Best-case intermodal transit is now about 6 days; however, it can take up to 12 days with terminal and line haul delays. The result is a range between 18 days (best case) versus 31 days (worst case.)
39
Vessel transit is about 22 days for direct service from Hong Kong to New York. It is up to 5 days longer with intermediate stops. Since the vessel size is smaller, discharge time is shorter. A container might be among the first to discharge (0 days) or spend 2 days in discharging, assuming a 4,000 TEU vessel. There is no intermodal transit. The result is a range between 22 days (best case) versus 29 days (worst case.)
In 2006, for containership import services between Asia and the US West Coast, the maritime transpacific route was the preferred route, accounting for 75 percent of Asian imports with an average navigation time of 12.3 days, plus 6 days from the West to the East Coast, totaling about 18.3 days. The second most-preferred route was the Asia−Panama Canal−US East Coast route with 19 percent of Asian imports and an average navigation time of 21.6 days, followed by the Asia−Suez Canal−US East Coast route at 6 percent of Asian imports with an average navigation time of 21.1 days.60
For some shippers, the ability to move quickly through the Panama Canal will be more important than using larger ships. An expanded Panama Canal would cut the voyage time from Peru’s Camsea LNG project to the Gulf of Mexico by 15 days. Once the locks are open, the Canal Waters Time (time actually spent in transiting the canal) should decline dramatically. This time savings makes transit through the canal feasible for many ships that had been using the bypass routes.
Figure 5.1: Comparison of Canal Waters Time With and Without Capacity Constraint61
60 Impact of Panama Canal Expansion on the U.S. Intermodal System, U.S. Department of Agriculture, Agricultural Marketing Service, January 2010. 61 Panama Canal Traffic and Transit Model, MergeGlobal, Inc., September 2000.
40
5.2.5 Suez Canal Competition
The distance from China, which is the manufacturing hub for companies such as Apple Inc., to the US East Coast via the Suez Canal is about 4 percent to 5 percent greater on average than the distance via the Panama Canal. For example, the distance from Hong Kong to Charleston is about 12,000 miles via Suez and 11,000 miles via Panama. From Singapore, it’s actually shorter via Suez than through Panama. What tends to make the Suez Canal attractive today is its capacity to handle the larger vessels. As the centroid for Asian manufacturing continues to move south and west, the Suez Canal will provide a shorter route than the Panama Canal. Manufacturing growth in Southeast Asia, particularly in Vietnam, has already induced a shift in trade routes.
Examples of this shift are evident at several East Coast ports. The Virginia Port Authority (VPA) has announced a new all-water service between the Far East and the US East Coast via the Suez Canal. MOL and Evergreen will jointly operate the new SVS (South China/Vietnam-US Southeast Coast) service. The service started June 2, 2013, with the sailing of the MOL Partner from Hong Kong. Virginia already handles the 8,000-plus-TEU ships that Mediterranean Shipping Co. (MSC) deploys on its Golden Gate Service from Asia via the Suez Canal. MSC has notified the VPA that it will deploy 9,200-TEU ships on that service, which will start calling at the port this summer.
In April, Virginia gained a last-out port call when the CKYH alliance upgraded its AWE-2 service between the Far East and the US East Coast via the Panama Canal. In February, MSC made Virginia the last port of call on the company’s Golden Gate Service, which links the US East Coast and the Far East via the Suez Canal.
The Baltimore Seagirt terminal is handling ships of 8,400 TEUs on MSC’s Golden Gate service from Asia through the Suez Canal.
The literature provides several interesting comparisons between the Panama Canal and the Suez Canal.
Table 5.2: Comparison between Panama Canal and Suez Canal62
Operating Data Panama Canal Suez Canal Transit time 8 to 10 hours 12 to 16 hours
Average round trip slot costs 4800-TEU ship: $1,250 per TEU
8000-TEU ship: $850 per TEU
Tolls on a 4800-TEU containership
$450,000 $489,600
Non-stop transit time @ 18 kn—Hong Kong to NY/NJ
26 days 27 days
Distance from Hong Kong to NY/NJ
11,205 nautical miles 11,589 nautical miles
A weekly service of 11 Post-Panamax vessels (8,000 TEU capacity) has an annual
productivity of 38,000 TEUs per vessel and a total annual service of 410,000 TEUs through the Suez Canal. However, the same service using Panamax vessels (4,800 TEUs) through the Panama Canal results in an annual productivity of almost 31,000 TEUs per vessel and a total
62 “Suez vs. Panama: A Canal Comparison,” Journal of Commerce, May 3, 2013.
41
service capacity of 248,000 TEUs. This represents an 18-percent decrease in each vessel’s annual productivity and a nearly 40-percent drop in total service capacity.63
Using Journal of Commerce Sailings data, Table 5.3 shows the number of unique container services transiting the Suez Canal that were identified as making a stop at each port (not necessarily the first port of call).
Table 5.3: Containership Port Calls Using Suez Canal
Port Number of
Services New York 20
Norfolk 23 Wilmington,
NC 1
Charleston 12 Savannah 19
Jacksonville 4 Miami 2
Houston 2 Table 5.4 shows the number of Suez Canal container services that make a first port of call at a given US port.
Table 5.4: Containership First Ports of Call Using Suez Canal
Port Number of
Services New York 11
Norfolk 4 Charleston 1 Savannah 2 Houston 1
Additionally, quite a few general cargo and project cargo services have scheduled
services through the Suez Canal to US Gulf and East Coasts. Using Journal of Commerce Sailings data, Table 5.5 shows the number of Suez Canal general and project cargo services that were identified as making a scheduled stop at each port (not necessarily the first port of call).
63 Impact of Panama Canal Expansion on the U.S. Intermodal System, U.S. Department of Agriculture, Agricultural Marketing Service, January 2010.
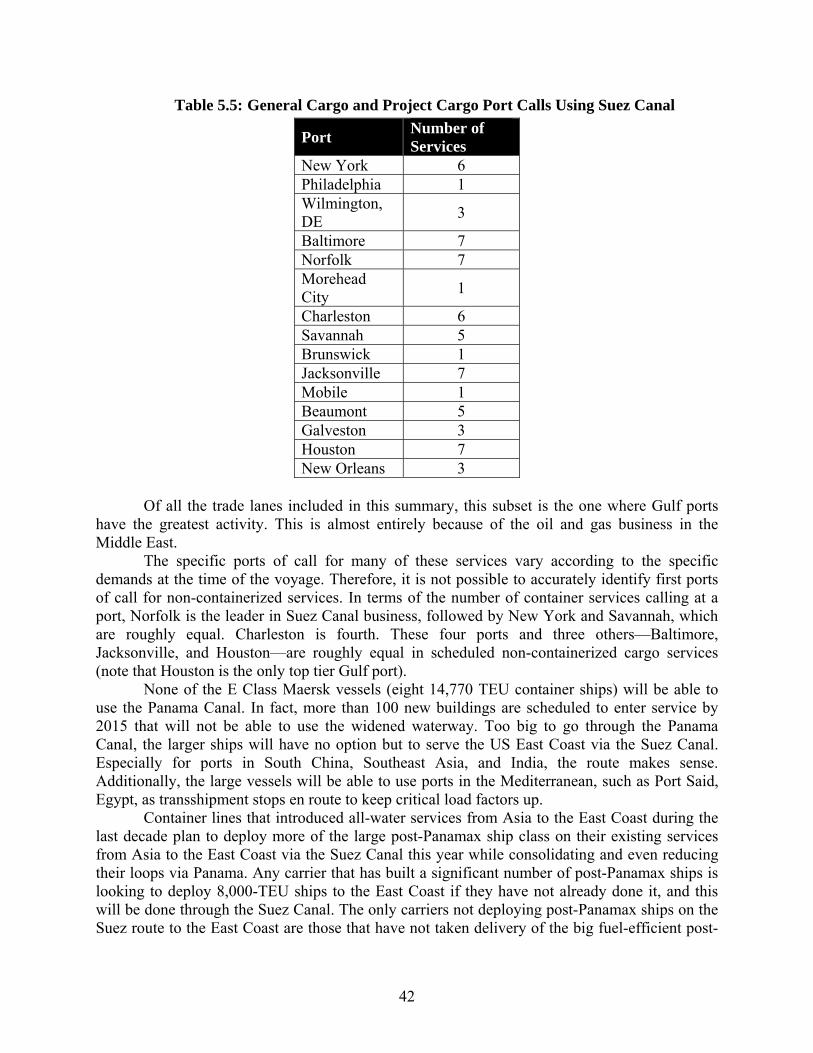
42
Table 5.5: General Cargo and Project Cargo Port Calls Using Suez Canal
Port Number of Services
New York 6 Philadelphia 1 Wilmington, DE
3
Baltimore 7 Norfolk 7 Morehead City
1
Charleston 6 Savannah 5 Brunswick 1 Jacksonville 7 Mobile 1 Beaumont 5 Galveston 3 Houston 7 New Orleans 3
Of all the trade lanes included in this summary, this subset is the one where Gulf ports
have the greatest activity. This is almost entirely because of the oil and gas business in the Middle East.
The specific ports of call for many of these services vary according to the specific demands at the time of the voyage. Therefore, it is not possible to accurately identify first ports of call for non-containerized services. In terms of the number of container services calling at a port, Norfolk is the leader in Suez Canal business, followed by New York and Savannah, which are roughly equal. Charleston is fourth. These four ports and three others—Baltimore, Jacksonville, and Houston—are roughly equal in scheduled non-containerized cargo services (note that Houston is the only top tier Gulf port).
None of the E Class Maersk vessels (eight 14,770 TEU container ships) will be able to use the Panama Canal. In fact, more than 100 new buildings are scheduled to enter service by 2015 that will not be able to use the widened waterway. Too big to go through the Panama Canal, the larger ships will have no option but to serve the US East Coast via the Suez Canal. Especially for ports in South China, Southeast Asia, and India, the route makes sense. Additionally, the large vessels will be able to use ports in the Mediterranean, such as Port Said, Egypt, as transshipment stops en route to keep critical load factors up.
Container lines that introduced all-water services from Asia to the East Coast during the last decade plan to deploy more of the large post-Panamax ship class on their existing services from Asia to the East Coast via the Suez Canal this year while consolidating and even reducing their loops via Panama. Any carrier that has built a significant number of post-Panamax ships is looking to deploy 8,000-TEU ships to the East Coast if they have not already done it, and this will be done through the Suez Canal. The only carriers not deploying post-Panamax ships on the Suez route to the East Coast are those that have not taken delivery of the big fuel-efficient post-
43
Panamax ships, such as Cosco, Yang Ming, and Hanjin, three of the four carriers in the CKYH Alliance.
5.2.6 Other Factors
Southern California Market
Another important factor is consumer demand in the southern California market. For the large container ships (8,000 TEU or more), it often makes more sense to offload at a port where there is significant local demand and good intermodal connections. This allows the carrier to serve several markets with just one vessel call. Because of the size and cost of operation of these larger vessels, operators want to keep them moving as much as possible; hence, they look for opportunities to limit port calls and time in port.
Shift of Manufacturing Centroid
Another factor that may affect vessel routing is the predicted shift in the locus of Asian manufacturing from China to Southeast Asia and India. Distance-wise, the “break point” for shipping to the Eastern United States via the Suez Canal instead of the Panama Canal has traditionally been Singapore, but it is now Hong Kong. Goods originating west of the break point and bound for the Eastern United States will typically move westward via the Suez Canal; while those originating east of it will usually go eastward via the Panama Canal or West Coast land bridge.
The ongoing shift of the manufacturing centroid from Northeastern Asia to Southeast and South Asia will push more of global manufacturing product shipping to Suez routings. An emerging consensus seems to indicate that manufacturing in Southeast Asia and the Indian subcontinent will grow, creating demand for service through the Suez Canal—and cause the East Coast ports’ share of Asian trade to grow. (Four out of seven lines interviewed in a 2005 study expected that Suez Canal volume would grow faster than overall Asian trade64.) All East Coast ports are expected to benefit from this change.
Foreign Port Limitations
The potential effect of the Panama Canal expansion must be evaluated in light of the foreign port involved in the cargo flow. Ports in Northeast Asia receiving grain are currently maintained at depths comparable with current Panama Canal depths and nearly all US ports depths. Though capital investments are planned at some of these ports, at the present time their limitations are every bit as important as those of US ports. Where an imbalance occurs in channel and handling characteristics at either the originating or destination ports, a solution is to transship at an efficient location on the supply chain. For the Panama Canal, this means either in Panama or in the Caribbean and it is the subject of the next chapter.
64 “Assessment of the Impact of Changes in Canal Transit Costs on the Economies of Ecuador, Chile, Peru, China, US, and Japan.” Mercer Consulting, April 12, 2005.

44
45
Chapter 6. All-Water Services: Transshipment
6.1 Introduction
Shipping lines currently use the container terminals in transshipment ports such as Freeport, Bahamas; Kingston, Jamaica; Caucedo, Dominican Republic; and Colon, Panama, to transfer containers from post-Panamax ships coming from Asia via the Panama Canal to smaller feeder ships that carry shipments to destinations throughout the Caribbean, South and Central America, and to the US East and Gulf coasts. Most notably, MSC uses the Freeport Container Terminal to transship a significant amount of cargo bound to and coming from the US, and CMA CGM and Zim Integrated Shipping Services use the Kingston Container Terminal for the transshipment of cargoes to and from US Gulf ports.
With the scheduled 2015 opening of the Panama Canal’s new locks, terminals in the Caribbean hubs are planning to expand or have projects under way to be able to handle calls by ships able to carry up to 13,000 TEUs that may start calling at their hubs after 2015.
Miami is hoping to undercut Freeport and regain some of the transshipment business that it lost after the September 11, 2001, terrorist attacks on the United States, when new security regulations drastically reduced business. The port believes that the Panama Canal expansion and Miami’s recent designation as a foreign trade zone will make it more competitive with Freeport.
While the possibility of building more transshipment hubs is being explored, their use may add time and cost to vessel operations that exceed the benefits derived from using larger vessels. The majority opinion in the literature is that growth in Caribbean transloading to/from other East Coast points is unlikely. Steamship lines have indicated that although they are impressed with the operational discipline of MSC’s rather complex transshipment hub in Freeport, most wish to avoid it. One executive pointed out that “Intermediate handling is too expensive and it is unpopular with the shippers.”65 The feeling is that direct service to certain East Coast ports can still be provided with 4,000 TEU vessels and alliances.
Although Cuba is renovating its Mariel Port, analysts say the US economic and trade embargo is likely to keep it from fulfilling its potential as a transshipment hub. Under US law, any ship that calls on a Cuban port is prohibited from entering a US port for 180 days with limited exceptions for foodstuffs and humanitarian goods.
6.2 Scheduled Services via Panama Canal
6.2.1 General
Six out of eight major East Coast ports serve as first ports of call. Although Savannah has the most import calls, New York has a significantly higher priority.
6.2.2 Asia-US Services
In terms of the number of services calling at the port, New York and Savannah are the clear leaders, followed by Charleston in third place. Three additional ports—Jacksonville, Miami, and Houston—are roughly equal, but significantly lower than the top three and it is noteworthy that Houston is the only US Gulf port in the top tier. When it comes to non-
65 Cost Analysis of The US Intermodal System, Ted Prince, for the Panama Canal Authority, February 28, 2005
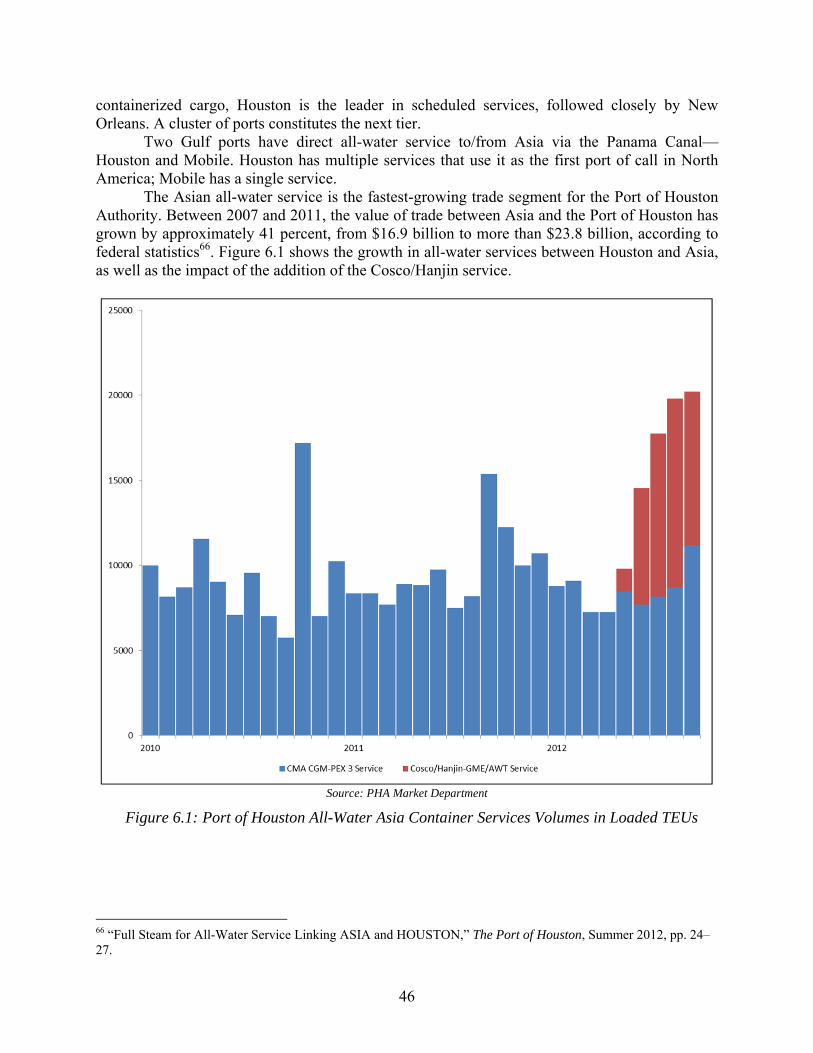
46
containerized cargo, Houston is the leader in scheduled services, followed closely by New Orleans. A cluster of ports constitutes the next tier.
Two Gulf ports have direct all-water service to/from Asia via the Panama Canal—Houston and Mobile. Houston has multiple services that use it as the first port of call in North America; Mobile has a single service.
The Asian all-water service is the fastest-growing trade segment for the Port of Houston Authority. Between 2007 and 2011, the value of trade between Asia and the Port of Houston has grown by approximately 41 percent, from $16.9 billion to more than $23.8 billion, according to federal statistics66. Figure 6.1 shows the growth in all-water services between Houston and Asia, as well as the impact of the addition of the Cosco/Hanjin service.
Source: PHA Market Department
Figure 6.1: Port of Houston All-Water Asia Container Services Volumes in Loaded TEUs
66 “Full Steam for All-Water Service Linking ASIA and HOUSTON,” The Port of Houston, Summer 2012, pp. 24–27.
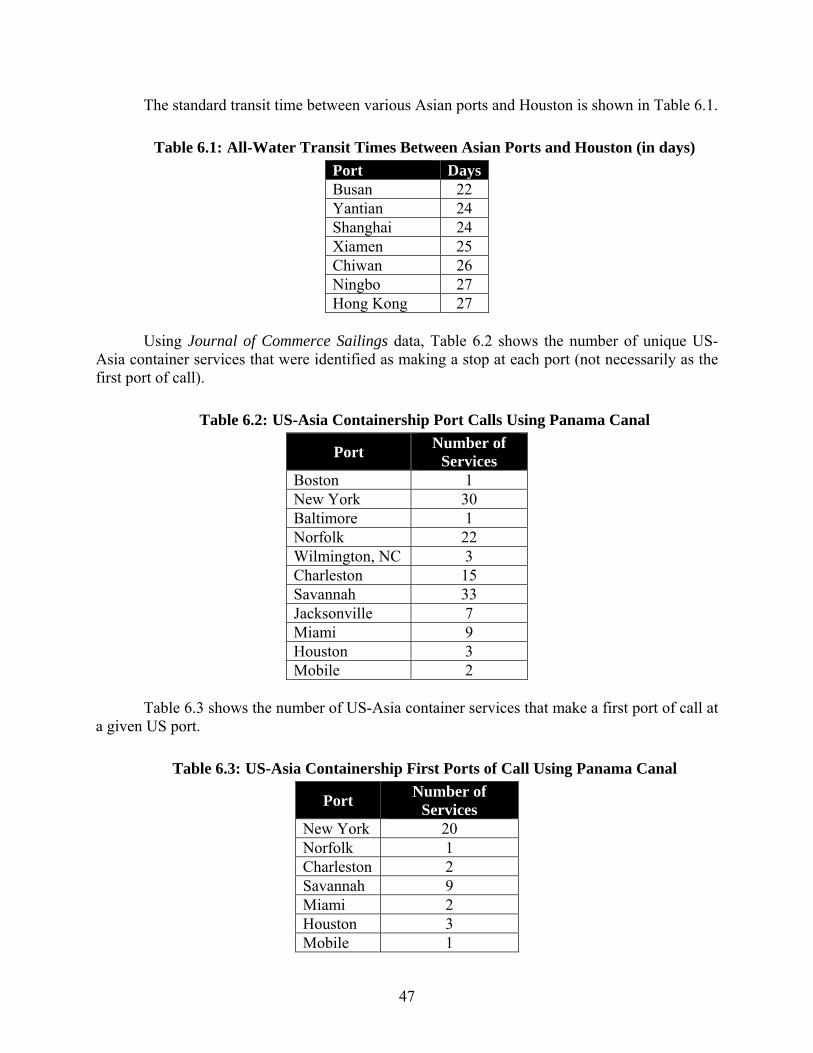
47
The standard transit time between various Asian ports and Houston is shown in Table 6.1.
Table 6.1: All-Water Transit Times Between Asian Ports and Houston (in days)
Port DaysBusan 22 Yantian 24 Shanghai 24 Xiamen 25 Chiwan 26 Ningbo 27 Hong Kong 27
Using Journal of Commerce Sailings data, Table 6.2 shows the number of unique US-
Asia container services that were identified as making a stop at each port (not necessarily as the first port of call).
Table 6.2: US-Asia Containership Port Calls Using Panama Canal
Port Number of
Services Boston 1 New York 30 Baltimore 1 Norfolk 22 Wilmington, NC 3 Charleston 15 Savannah 33 Jacksonville 7 Miami 9 Houston 3 Mobile 2
Table 6.3 shows the number of US-Asia container services that make a first port of call at
a given US port.
Table 6.3: US-Asia Containership First Ports of Call Using Panama Canal
Port Number of
Services New York 20 Norfolk 1 Charleston 2 Savannah 9 Miami 2 Houston 3 Mobile 1
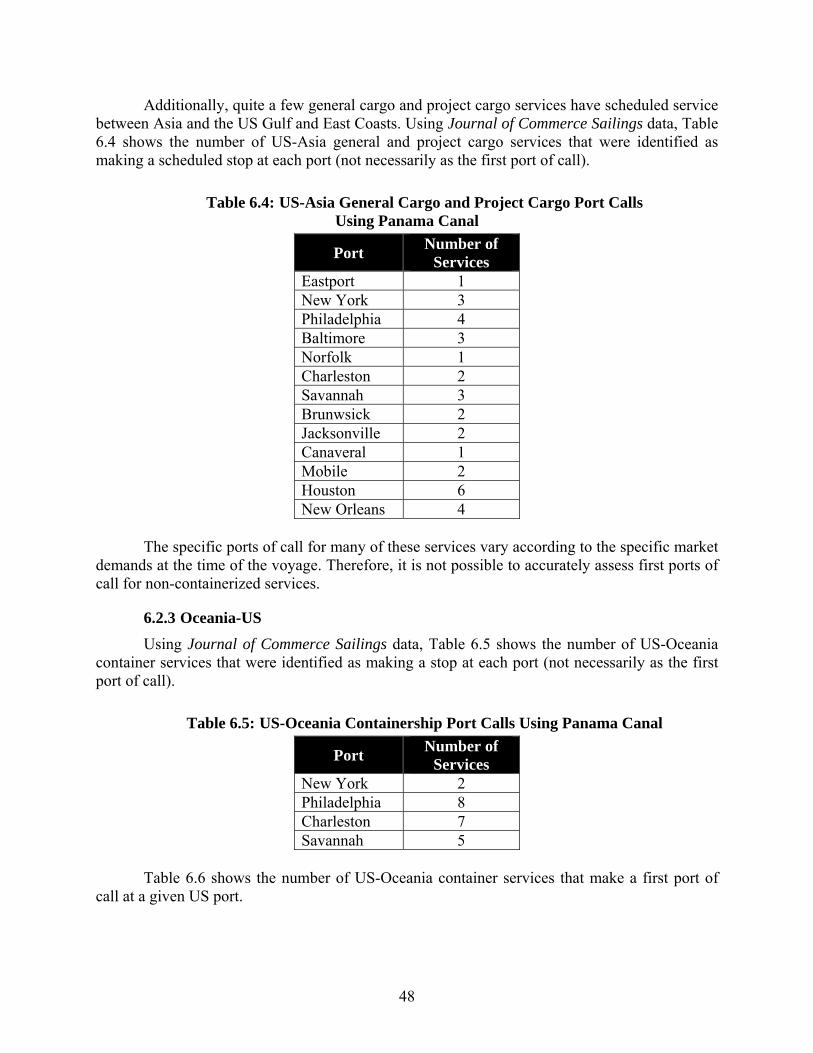
48
Additionally, quite a few general cargo and project cargo services have scheduled service between Asia and the US Gulf and East Coasts. Using Journal of Commerce Sailings data, Table 6.4 shows the number of US-Asia general and project cargo services that were identified as making a scheduled stop at each port (not necessarily as the first port of call).
Table 6.4: US-Asia General Cargo and Project Cargo Port Calls Using Panama Canal
Port Number of
Services Eastport 1 New York 3 Philadelphia 4 Baltimore 3 Norfolk 1 Charleston 2 Savannah 3 Brunwsick 2 Jacksonville 2 Canaveral 1 Mobile 2 Houston 6 New Orleans 4
The specific ports of call for many of these services vary according to the specific market
demands at the time of the voyage. Therefore, it is not possible to accurately assess first ports of call for non-containerized services.
6.2.3 Oceania-US
Using Journal of Commerce Sailings data, Table 6.5 shows the number of US-Oceania container services that were identified as making a stop at each port (not necessarily as the first port of call).
Table 6.5: US-Oceania Containership Port Calls Using Panama Canal
Port Number of
Services New York 2 Philadelphia 8 Charleston 7 Savannah 5
Table 6.6 shows the number of US-Oceania container services that make a first port of
call at a given US port.
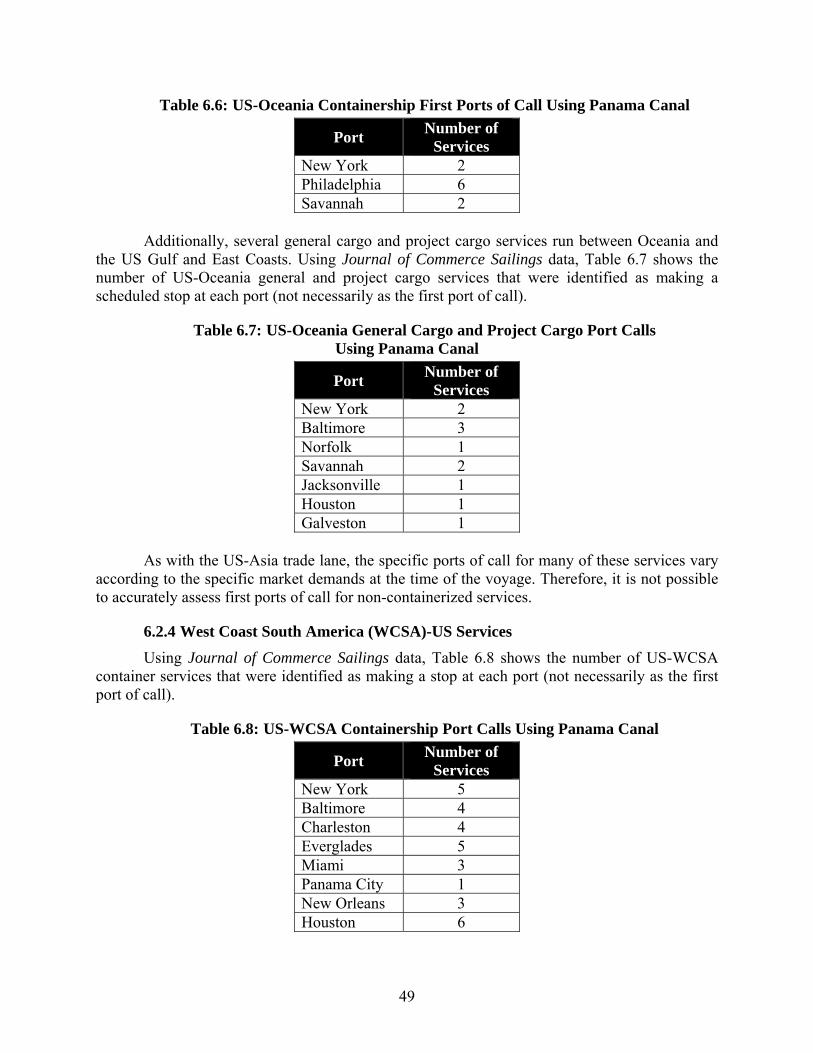
49
Table 6.6: US-Oceania Containership First Ports of Call Using Panama Canal
Port Number of
Services New York 2 Philadelphia 6 Savannah 2
Additionally, several general cargo and project cargo services run between Oceania and
the US Gulf and East Coasts. Using Journal of Commerce Sailings data, Table 6.7 shows the number of US-Oceania general and project cargo services that were identified as making a scheduled stop at each port (not necessarily as the first port of call).
Table 6.7: US-Oceania General Cargo and Project Cargo Port Calls Using Panama Canal
Port Number of
Services New York 2 Baltimore 3 Norfolk 1 Savannah 2 Jacksonville 1 Houston 1 Galveston 1
As with the US-Asia trade lane, the specific ports of call for many of these services vary
according to the specific market demands at the time of the voyage. Therefore, it is not possible to accurately assess first ports of call for non-containerized services.
6.2.4 West Coast South America (WCSA)-US Services
Using Journal of Commerce Sailings data, Table 6.8 shows the number of US-WCSA container services that were identified as making a stop at each port (not necessarily as the first port of call).
Table 6.8: US-WCSA Containership Port Calls Using Panama Canal
Port Number of
Services New York 5 Baltimore 4 Charleston 4 Everglades 5 Miami 3 Panama City 1 New Orleans 3 Houston 6
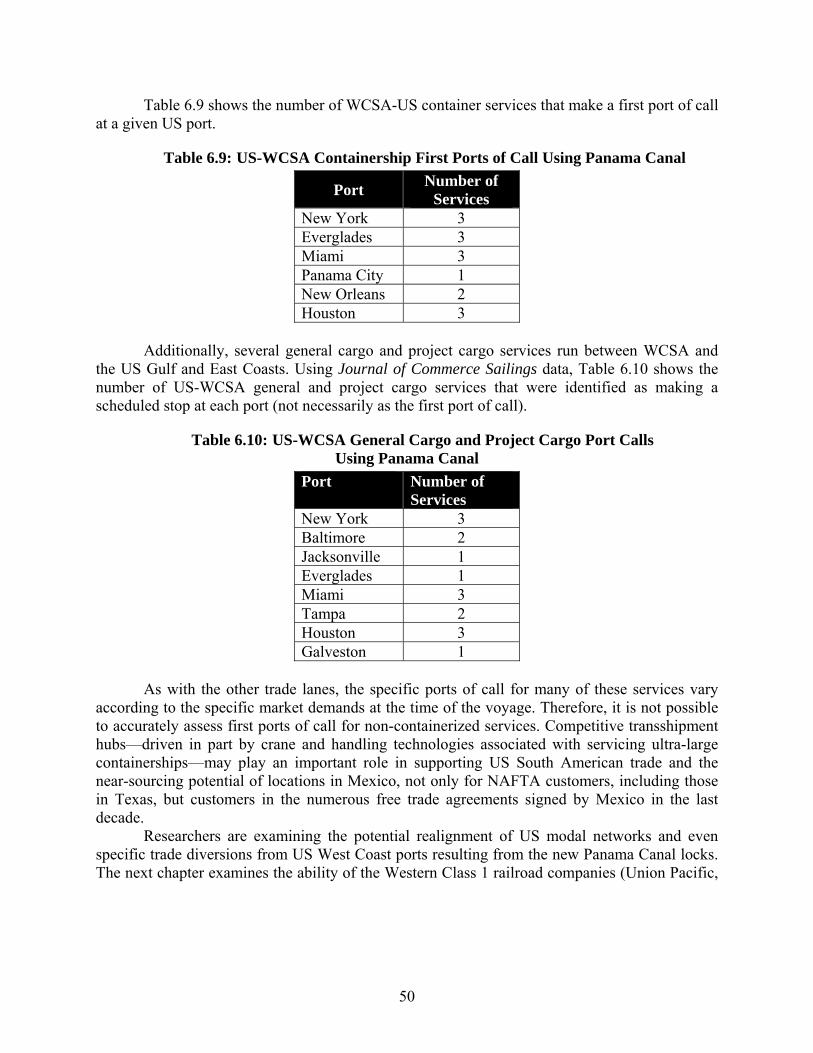
50
Table 6.9 shows the number of WCSA-US container services that make a first port of call at a given US port.
Table 6.9: US-WCSA Containership First Ports of Call Using Panama Canal
Port Number of
Services New York 3 Everglades 3 Miami 3 Panama City 1 New Orleans 2 Houston 3
Additionally, several general cargo and project cargo services run between WCSA and
the US Gulf and East Coasts. Using Journal of Commerce Sailings data, Table 6.10 shows the number of US-WCSA general and project cargo services that were identified as making a scheduled stop at each port (not necessarily as the first port of call).
Table 6.10: US-WCSA General Cargo and Project Cargo Port Calls Using Panama Canal
Port Number of Services
New York 3 Baltimore 2 Jacksonville 1 Everglades 1 Miami 3 Tampa 2 Houston 3 Galveston 1
As with the other trade lanes, the specific ports of call for many of these services vary
according to the specific market demands at the time of the voyage. Therefore, it is not possible to accurately assess first ports of call for non-containerized services. Competitive transshipment hubs—driven in part by crane and handling technologies associated with servicing ultra-large containerships—may play an important role in supporting US South American trade and the near-sourcing potential of locations in Mexico, not only for NAFTA customers, including those in Texas, but customers in the numerous free trade agreements signed by Mexico in the last decade.
Researchers are examining the potential realignment of US modal networks and even specific trade diversions from US West Coast ports resulting from the new Panama Canal locks. The next chapter examines the ability of the Western Class 1 railroad companies (Union Pacific,
51
Burlington Northern Santa Fe, and Kansas City Southern67) to successfully defend their market share when the new locks open in 2015.
67 Kansas City Southern holds a majority stake in KCS de Mexico, which is also competing for containerized non-Panama Canal trade using Lazaro Cardenas and the direct KCSM 1500-km line to Laredo, Texas, where it can interline with Union Pacific or deliver to Houston on its own network.

52
53
Chapter 7. Rail Land Bridge Competition
7.1 Introduction
Over the last decade, international intermodal service has grown from a stand-alone service from west to east to a blended service that includes domestic containers mostly from north to south on operating routes that exceed 700 miles; these containers are transferred, where necessary, at large intermodal terminals, such as Alliance at Fort Worth68. Eastbound intermodal movements remain mostly an extension of ocean service linking West Coast ports with inland markets.
The Southern California consumer market plays a significant role in the success of land bridge services. The size of the state population and its economy makes its ports obvious gateways for intermodal cargo that is typically discharged at the vessel’s first port of call. Thirty-eight percent of the containerized imports unloaded at Los Angeles-Long Beach terminals move intact via rail to destinations in the eastern half of the country. Another 26 percent of the marine containers are transloaded locally into domestic 53-foot containers and then move by rail. Seattle and Tacoma are even more rail dependent, with more than 70 percent of the containerized imports moving inland on intermodal trains69.
About 60 percent of container imports destined for Florida now arrive via intermodal rail from the West Coast and other East Coast ports. With a population of nearly 20 million that is expanding again after the 2008–2009 recession halted growth, Florida is expected to surpass New York as the third-most populous state by the end of 201370.
UP controls about 60 percent of the domestic container fleet, after adding 14,000 containers in June 2010 to container pooling arrangements it has with CSX and NS. As of now, UP has access to 63,000 containers71.
The railroad-port relationship has changed. Thirty years ago, railroads and ports encountered success and failure together. That is no longer the case because eastern railroads now serve all East Coast ports and are basically indifferent to customer traffic shifts between ports. It is also harder for ports to compete individually because so many entities contribute to port costs—port authorities, local governments, marine terminal operators, stevedores, and pilots.
The traffic balance has remained unchanged in recent years—eastbound is primarily international and westbound is primarily domestic or exports. What is new are the various north-south domestic routes supported by arrangements made between railroads and large trucking companies such as J.B. Hunt and Schneider Intermodal. Whereas railroads carry about 80 percent of inland traffic from West Coast ports, that figure is only about 35 percent from East Coast ports, although this may change quickly as new Suez routes carry Southeastern Asian exports and call at North Atlantic ports like New York-New Jersey and Hampton Roads.
68 In the 1990s, some services were transcontinental with containers unloaded at Los Angeles or Long Beach and then interlined with an East Coast Class 1 at, say, Memphis or Chicago. These services are now in decline as East Coast ports and eastern Class 1 railroad companies serve the northeastern population centers. 69 “Battle of the Big Ships,” Journal of Commerce, April 23, 2012. 70 Florida Makes Its Move,” Journal of Commerce, June 25, 2012. 71 “Western rails get ready to redraw intermodal map,” Dcvelocity.com, June 8, 2011.
54
7.2 Investment
In 2012, the seven Class 1 railroads operating in the United States committed to $13 billion in capital investments. In fact, the railroad industry has been investing $6–8 billion annually over the last decade to modernize railways and equipment. Since 2004–2005, railroads have been investing annually the same amount that the Panama Canal Authority will spend on the entire construction of the third set of locks.
Western railroads and West Coast ports have been making significant improvements to rail service in recent years. The western railroad companies, which like their brethren in the east, have been criticized in the past for overstating the reliability of their intermodal service, now claim to have brought their infrastructure, rolling stock, and terminal capacity up to levels where they can compete with trucks in most traffic lanes and at lengths-of-haul as short as 700 miles, well under their traditional 1500- to 2,000-mile movements.
7.2.1 Burlington Northern Santa Fe (BNSF)
Since 2000, BNSF has invested $41.9 billion in the railroad. Later this year (2013), and as part of its planned $4.1 billion capital program for 2013, BNSF is scheduled to open its new $250 million intermodal facility, Logistics Park Kansas City. This 443-acre logistics park will be able to initially handle more than 500,000 units each year and 1.5 million units when it is fully built out. BNSF is also moving forward on its $500 million Southern California International Gateway project (SCIG) near the Ports of Los Angeles and Long Beach. SCIG will allow containers to be loaded onto rail just 4 miles from the docks, rather than travelling 24 miles on local roads and the 710 freeway to downtown rail facilities. SCIG will allow 1.5 million more containers to move by more efficient and environmentally preferred rail through the Alameda Corridor each year. It will greatly improve the efficiency of cargo transfer from ports to customers and will eliminate millions of truck miles annually from local freeways in Southern California, all while utilizing state-of-the-art and environmentally preferred technology, including wide-span all-electric cranes, ultra-low emissions switching locomotives, and low-emission yard equipment.
BNSF is also near completion of double-tracking its transcontinental route to Chicago.
7.2.2 Canadian National (CN)
CN, which operates more than 6,000 miles of railroad in the United States, plans to spend approximately $1.9 billion in capital expenditures in 2013 across its North American network. Projects include construction of a new intermodal terminal in Joliet, Illinois; the acquisition of new locomotives and intermodal equipment; advanced information technology that will improve service and operating efficiency throughout the railroad’s network; and transloading operations and distribution centers to transfer freight efficiently between rail and truck.
7.2.3 Canadian Pacific (CP)
CP also operates more than 6,000 miles of railroad in the United States. Its US operations include four intermodal terminals, and it also serves the ports of New York and Philadelphia through operating agreements. The railroad is projecting capital expenditures of around $1.1 billion in 2013, with significant amounts directed toward delivering seamless service at ports and the railroad’s network of intermodal terminals.
55
7.2.4 CSX
CSX’s National Gateway is an $850 million public-private partnership launched in 2008 to alleviate freight bottlenecks in the Midwest by creating a double-stack cleared corridor for intermodal rail shipments between the Midwest and mid-Atlantic ports72. Phase One of the project, scheduled to be completed in 2013, creates double-stack rail access between CSX’s new intermodal terminal in northwest Ohio and its terminal in Chambersburg, Pennsylvania. The entire project is scheduled to be completed in 2015, about the time the Panama Canal expansion is expected to be complete.
7.2.5 Kansas City Southern (KCS)
KCS’s Meridian Speedway rail corridor connecting Dallas, Texas, and Meridian, Mississippi, continues to grow in significance. It allows KCS to partner with other railroads to offer efficient, cost-effective intermodal service between the southeast and the southwest. KCS’s international intermodal corridor connects central Mexico with the central, south central, and southeastern regions of the United States. KCS expects to invest approximately 18 percent of revenue in 2013 on capital expenditures, including intermodal terminal expansion.
7.2.6 Norfolk Southern (NS)
In 2012, NS opened new intermodal facilities in Memphis and Birmingham, both part of the company’s Crescent Corridor project. The Crescent Corridor is a 2,500-mile rail network serving more than 30 new intermodal lanes in the Northeast, Southeast, Texas, and Mexico.73 NS recently announced plans to spend $2 billion on capital improvements in 2013, including the expansion of its Bellevue, Ohio, rail yards, construction of a new intermodal terminal in Charlotte, North Carolina (also part of the Crescent Corridor), and the completion of a new locomotive service facility in Conway, Pennsylvania.
NS has also recently upgraded its Heartland Corridor to be able to move double-stack containers on flatbed cars between the East Coast and the Midwest.
7.2.7 Union Pacific (UP)
UP has invested over $1.1 billion in recent years on intermodal terminals. Among these investments is the new Joliet Intermodal Terminal, opened in August of 2010. Joliet Intermodal Terminal is a state-of-the-art intermodal terminal that provides significant capacity in the important Chicago market with service to and from the major West Coast and Gulf Coast ports. UP is currently building a $400 million intermodal and multi-purpose rail facility in Santa Teresa, New Mexico, on UP’s 760-mile Sunset Route between Los Angeles and El Paso. Once it is completed in 2014, the facility will include 200 miles of track and 26 buildings for yard operations. The state-of-the-art facility will include fueling facilities, crew change buildings, an intermodal yard and an intermodal ramp with an annual lift capacity of up to 250,000 intermodal containers. It will also reduce idling at the current fueling station located in downtown El Paso. Construction of this facility is part of UP’s commitment to invest approximately $3.6 billion in 2013 in capital investments across its 32,000-mile network. As of 2012, UP had double-tracked
72 It is interesting to note that the federal government contributed $98 million to this project as part of the TIGER I grant program, and $20.5 million as part of the American Recovery and Reinvestment Act of 2009. 73 The federal government contributed $105 million dollars through the TIGER I grant program.
56
70 percent of its Sunset corridor to El Paso, Texas. All of UP’s 10 primary corridors are at service levels where they can regularly compete with trucks.
7.2.8 Joint Service
Intermodal rail from the West Coast got another boost on March 5, 2012, when BNSF Railway and Maersk Line bundled their joint flagship service that offers day-definite delivery of Asian imports to Chicago, Memphis, Dallas, Houston, and CSX’s northwest Ohio rail hub. The double-stack trains move non-stop to the five inland destinations with total transit times from Asia ranging from 18 to 22 days.
7.2.9 Other
It is not just Class 1 railroads that are heavily involved in intermodal transportation and preparing for future growth. For example, the Florida East Coast Railway, a regional railroad operating over more than 350 miles in Florida, recently announced a partnership with the ports of Miami and Port Everglades to build on-dock rail yards that will help to increase South Florida’s intermodal traffic to about 20 percent of port volume, up from about 10 percent today. In conjunction with deepening of the ports, the partnership is aimed at positioning South Florida as a gateway for post-Panamax ships.
7.3 Competitiveness
The rate reductions for West Coast originating intermodal service that would be needed to neutralize the cost advantage of all-water service to the East Coast, after allowing for faster delivery premiums, would not be large. A rate response by the eastern railroads to counter a western railroad rate reduction is possible but not likely. A $50 reduction by the western railroads to retain cargo in the face of a $70 effective drop in container rates due to larger vessels via the Panama Canal would be proportionately much smaller than would a $50 reduction by the eastern railroads. This would imply that the ability to distribute Far East containers from East and Gulf Coast ports to and from inland locations will not change radically from current practices after the Panama Canal expansion.
The great majority of container freight moved to and from East and Gulf Coast ports is associated with locations within 500 miles of the ports. Over the shorter distances within this radius, trucks will still carry most of the cargo arriving at the ports. This could impede the ability of eastern railroads to reach volume and frequency efficiencies comparable to western railroad services. Interestingly, both NS and CSX have adopted strategies of “less is more.” In other words, if you cannot manage the business you have, shrink the volume until you reach a level that you can manage. Short haul corridors—such as those served at East Coast ports—have continued to be “de-marketed,” although UP is experimenting with a short intermodal twice weekly service from Dallas to Houston in an effort to test the market in the Texas Triangle74.
Another issue that could affect intermodal rates is the availability of the containers in which most domestic intermodal traffic moves. Faced with a global shortage of ocean containers, steamship lines arriving at a US port of entry may want to transload inbound freight into domestic containers at the port rather than have the international boxes moved intact to inland points. That could put additional pressure on an already-tight domestic container market.
74 http://www.joc.com/rail-intermodal/class-i-railroads/union-pacific-railroad/union-pacific-launches-houston-dallas-intermodal-service_20130410.html
57
Efficient intermodal rail is one of the greatest advantages that West Coast ports have in competition for market share. Containerized imports from Asia that move through West Coast ports can reach many destinations east of the Mississippi River by rail 7 to 10 days quicker than if the cargo is routed via all-water services to the East Coast. That is why West Coast ports dominate important inland markets such as Chicago, Kansas City, and Dallas, and why they have a significant share of markets to the east in the Ohio River Valley and down to Atlanta.
At present, demand for northbound intermodal to the Midwest from Gulf ports is weak and considered too expensive, although UP runs a domestic intermodal Houston-Chicago service. It is the land bridge option that is least likely to see any growth.
7.4 Foreign Competition
Canadian and Mexican ports also are striving to grab a bigger piece of the Trans-Pacific trade. Prince Rupert, located 500 miles north of Vancouver, British Columbia, has had a noticeable impact on US West Coast ports since it began operations in late 2007. Prince Rupert is about 1,000 nautical miles closer to Asian ports (2 days’ shipment time) than Southern California ports. Sea journeys between Shanghai and North America are 68 hours faster through Prince Rupert than through Los Angeles and 32 hours faster through Vancouver than through Los Angeles. CN’s rates from Prince Rupert to Chicago are approximately $300 per container lower than BNSF and UP intermodal rates to Chicago from Los Angeles. In 2011, containerized imports at US West Coast ports declined 2 percent, while imports through Prince Rupert increased 21 percent from the year before (admittedly from a much smaller base).
Service through Lázaro Cárdenas may offer a direct intermodal service into the US Gulf. This may offer a competitive service to points in Texas—and as far away as Kansas City and Atlanta. The port of Lázaro Cárdenas handles 17 percent of the US-Mexico trade. The port’s access channel is 18 meters (59 ft) deep and is located 532 miles closer to Houston by rail than Long Beach. To ship a container from China takes approximately 13 days to the Port of Lázaro Cardenas and thereafter 90 hours from the port to Houston, Texas.
The Union Pacific and Hutchison Port Holdings are reportedly considering building a new terminal about 125 miles south of Los Angeles. If this project is implemented, it will need to reconstruct 150–200 miles of railroad to connect to the UP mainline in Yuma, Arizona. This could cost almost $1 billion by itself.
Intermodal traffic constitutes a critical area of Class 1 railroad company business planning and it is unlikely that a significant realignment in current intermodal flows will take place as a result of the new Panama Canal locks. In fact, the growth of the Suez Canal’s Asia trade services to North Atlantic ports will stimulate rail intermodal routes to northeastern population centers as far west as Chicago75. The importance of rail-based export commodities will be strengthened by the locks since large, and more competitive, ships can be used to move a range of non-containerized products from Gulf ports to overseas markets, some routed through the new locks. The role that price plays in all-water shipper and route choice needs to be estimated by TxDOT planners when they examine investment proposals from port authorities. TxDOT-sponsored research has already provided models that estimate trucks operating costs and comparative railroad-truck corridor operating costs. This study has built a vessel operating cost model to allow planners to estimate costs and this is the subject of the next chapter.
75 The Heartland Corridor allows the Norfolk Southern Railway to provide a double-stacked service from Norfolk to Chicago, cutting 24 hours off the old schedule.

58
59
Chapter 8. Deep Draft Ship Operating Costs
8.1 Introduction to Deep-Draft Vessel Operating Costs
The Deep-Draft Vessel Operating Costs (DDVOCs) dataset is the central source used for estimating waterborne transportation costs for the most-commonly used trade vessels in deep-draft ports in the United States and is considered “the ‘nuts and bolts’ of costs and characteristics for the primary classes of cargo vessels that call at U.S. ports”76. The dataset gives general operating costs for various vessels, but does not include every type of vessel received by US ports. The three main categories of data included are vessel characteristics, vessel (hull) capital costs, and vessel operating costs. The costs are published as datasheets by Maritime Strategies International Limited77.
The main source of information for the following sections is Appendix H: Guide to Deep-Draft Vessel Operating Costs from the National Economic Development Deep Draft Navigation Manual, published by the Institute for Water Resources of US Army Corps of Engineers. The available vessel types and sizes are discussed in Section 8.2, followed by a discussion of the types of data collected in the DDVOCs dataset in Section 8.3. The development of the CTR Vessel Cost Model is then described in Section 8.4, and Section 8.5 provides an example application of model to vessel movements from Shanghai to Houston and Charleston.
8.2 Vessel Types and Sizes
The DDVOCs dataset used in developing the vessel-operating cost model is made up of six different types of vessels and multiple sizes within each type as illustrated in Table 8.1. The types of vessels included are bulk carriers, fully cellular containerships (FCC), liquid natural gas carriers, general cargo carriers, oil tankers, and roll-on roll-off carriers. As shown in Table 8.1, the largest vessel by weight is the 320,000 deadweight ton (dwt) oil tanker. The most variety of vessel sizes is within fully cellular containerships, with 17 different sizes ranging from 9,500 dwt to 113,000 dwt. There are 12 different sizes of bulk carriers, the heaviest at 200,000 dwt, and 2 different sizes of liquid natural gas carriers, the heaviest being 114,875 dwt. General cargo carriers have five different sizes and are generally lighter than the other vessels, with a range between 11,000–30,000 dwt. Oil tankers have 10 different sizes from 60,000 dwt to 320,000 dwt. Roll-on roll-off vessels have two different sizes and are light, weighing either 8,000 dwt or 28,000 dwt.
8.3 Description of Data Collected for the DDVOCs
For each vessel characteristic, regression analysis is used to create representative vessel information since similar vessels types and sizes may still have subtle differences. For each vessel type, examples of information available include volumetric capacity (grain cubic, bale cubic, or liquid cubic), average vessel age in years, average functional services life in years, overall length in feet, length between perpendiculars in feet, extreme breadth or beam in feet,
76 Knight, Kevin and Mathis, Ian, “Appendix H: Guide to Deep-Draft Vessel Operating Costs,” U.S. Army Corps of Engineers, IWR Report 10-R-4, April 2010. 77 Maritime Strategies International Limited, 2 Baden Place, Crosby Row, London, SE1 1YW, Website: http://www.msiltd.com/
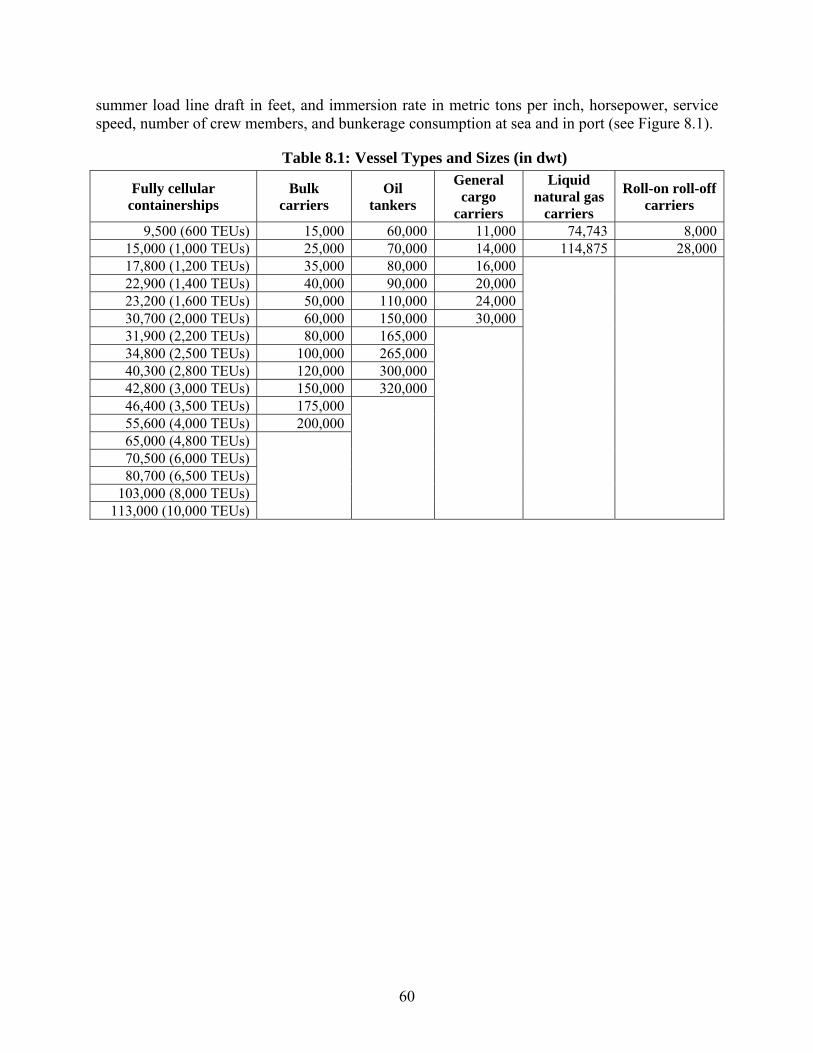
60
summer load line draft in feet, and immersion rate in metric tons per inch, horsepower, service speed, number of crew members, and bunkerage consumption at sea and in port (see Figure 8.1).
Table 8.1: Vessel Types and Sizes (in dwt)
Fully cellular containerships
Bulk carriers
Oil tankers
General cargo
carriers
Liquid natural gas
carriers
Roll-on roll-off carriers
9,500 (600 TEUs) 15,000 60,000 11,000 74,743 8,00015,000 (1,000 TEUs) 25,000 70,000 14,000 114,875 28,00017,800 (1,200 TEUs) 35,000 80,000 16,000 22,900 (1,400 TEUs) 40,000 90,000 20,00023,200 (1,600 TEUs) 50,000 110,000 24,00030,700 (2,000 TEUs) 60,000 150,000 30,00031,900 (2,200 TEUs) 80,000 165,00034,800 (2,500 TEUs) 100,000 265,00040,300 (2,800 TEUs) 120,000 300,00042,800 (3,000 TEUs) 150,000 320,00046,400 (3,500 TEUs) 175,00055,600 (4,000 TEUs) 200,00065,000 (4,800 TEUs) 70,500 (6,000 TEUs) 80,700 (6,500 TEUs)
103,000 (8,000 TEUs) 113,000 (10,000 TEUs)
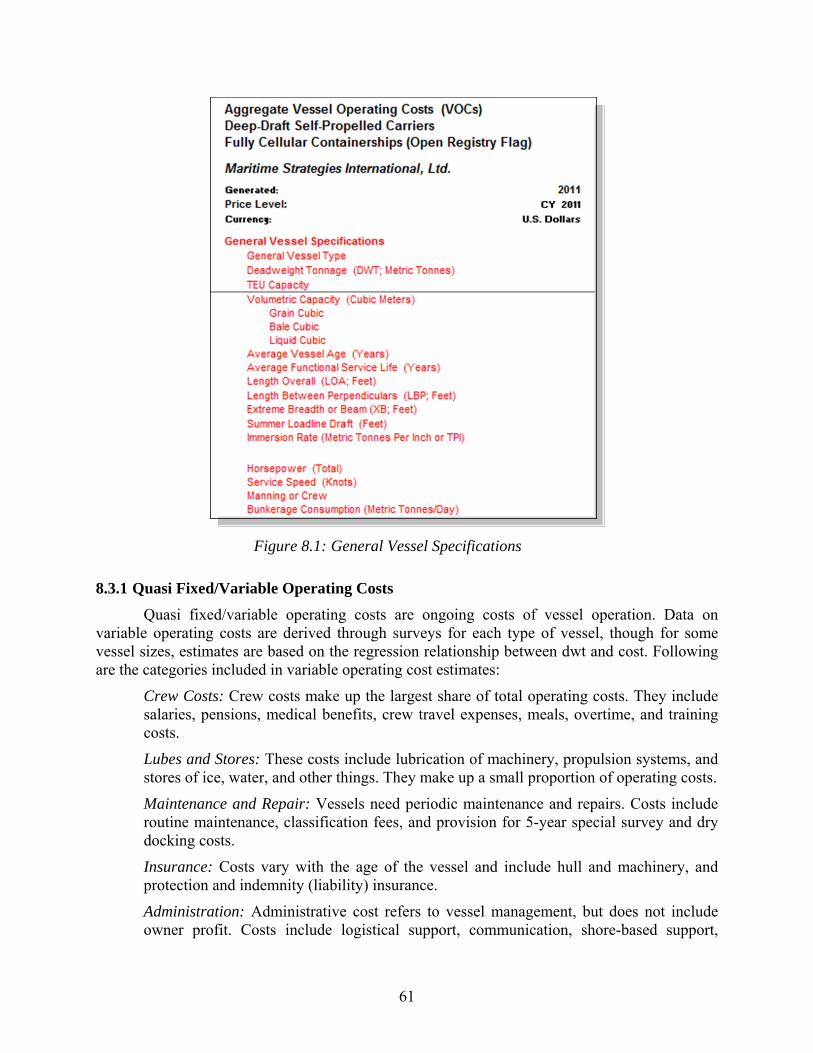
61
Figure 8.1: General Vessel Specifications
8.3.1 Quasi Fixed/Variable Operating Costs
Quasi fixed/variable operating costs are ongoing costs of vessel operation. Data on variable operating costs are derived through surveys for each type of vessel, though for some vessel sizes, estimates are based on the regression relationship between dwt and cost. Following are the categories included in variable operating cost estimates:
Crew Costs: Crew costs make up the largest share of total operating costs. They include salaries, pensions, medical benefits, crew travel expenses, meals, overtime, and training costs.
Lubes and Stores: These costs include lubrication of machinery, propulsion systems, and stores of ice, water, and other things. They make up a small proportion of operating costs.
Maintenance and Repair: Vessels need periodic maintenance and repairs. Costs include routine maintenance, classification fees, and provision for 5-year special survey and dry docking costs.
Insurance: Costs vary with the age of the vessel and include hull and machinery, and protection and indemnity (liability) insurance.
Administration: Administrative cost refers to vessel management, but does not include owner profit. Costs include logistical support, communication, shore-based support,
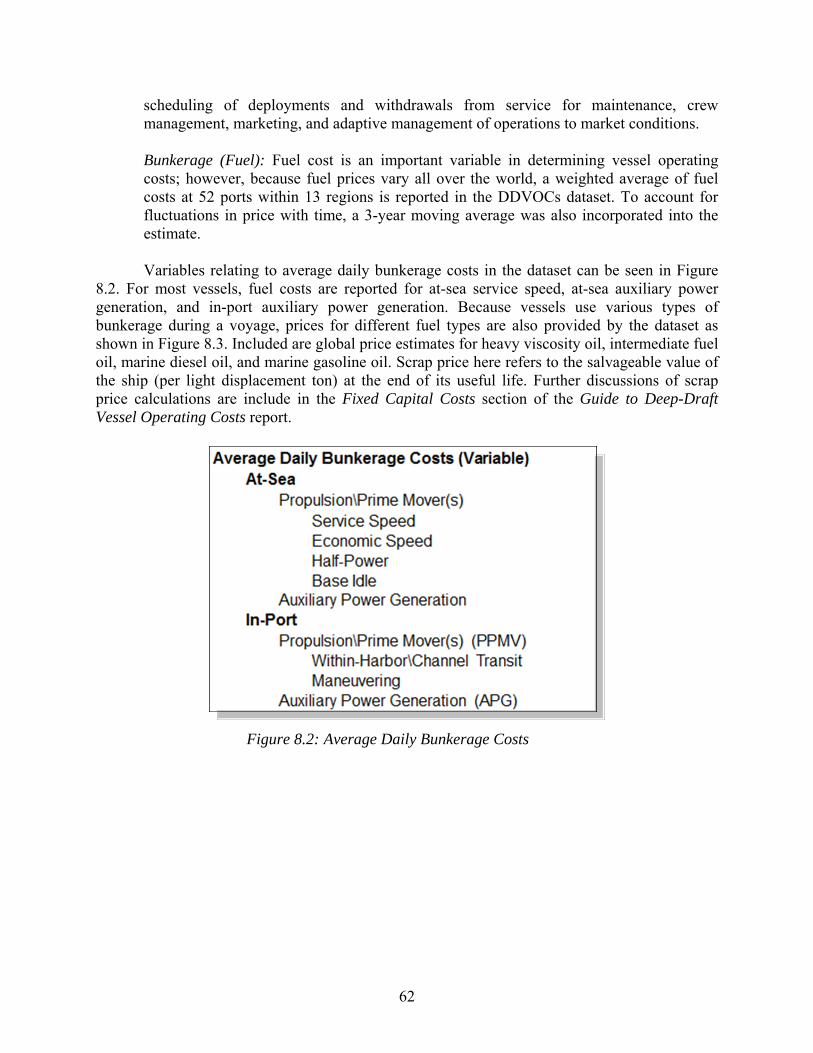
62
scheduling of deployments and withdrawals from service for maintenance, crew management, marketing, and adaptive management of operations to market conditions.
Bunkerage (Fuel): Fuel cost is an important variable in determining vessel operating costs; however, because fuel prices vary all over the world, a weighted average of fuel costs at 52 ports within 13 regions is reported in the DDVOCs dataset. To account for fluctuations in price with time, a 3-year moving average was also incorporated into the estimate. Variables relating to average daily bunkerage costs in the dataset can be seen in Figure
8.2. For most vessels, fuel costs are reported for at-sea service speed, at-sea auxiliary power generation, and in-port auxiliary power generation. Because vessels use various types of bunkerage during a voyage, prices for different fuel types are also provided by the dataset as shown in Figure 8.3. Included are global price estimates for heavy viscosity oil, intermediate fuel oil, marine diesel oil, and marine gasoline oil. Scrap price here refers to the salvageable value of the ship (per light displacement ton) at the end of its useful life. Further discussions of scrap price calculations are include in the Fixed Capital Costs section of the Guide to Deep-Draft Vessel Operating Costs report.
Figure 8.2: Average Daily Bunkerage Costs
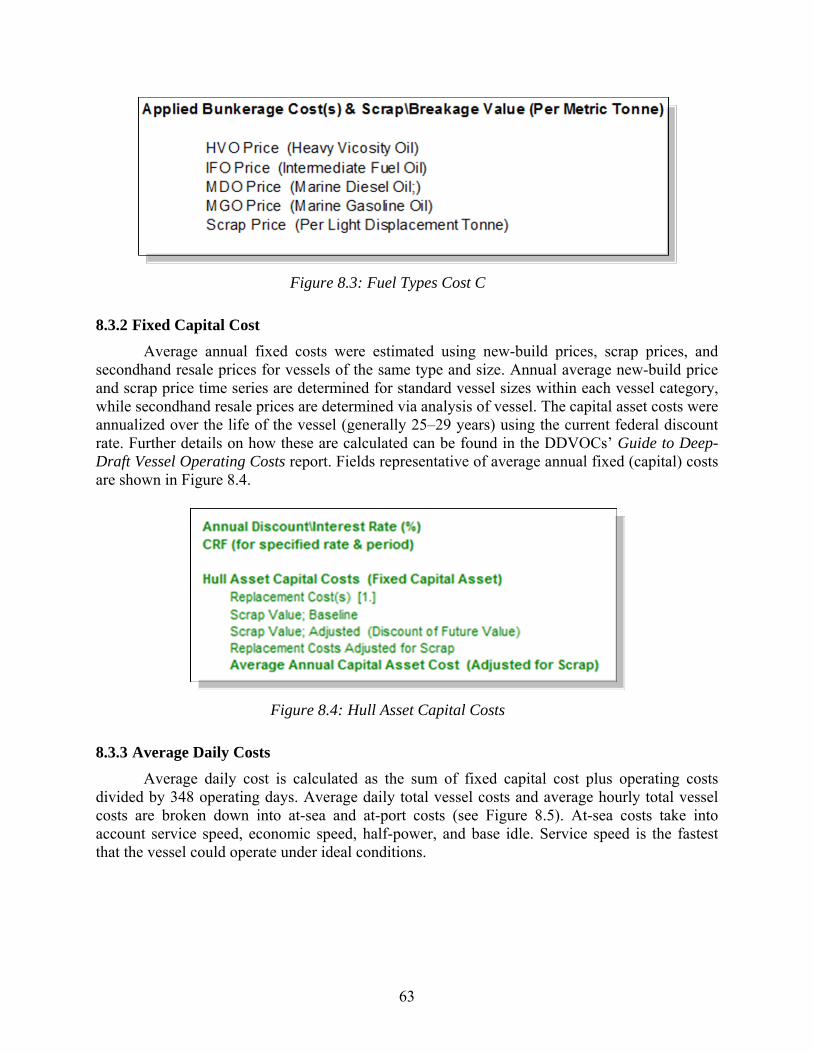
63
Figure 8.3: Fuel Types Cost C
8.3.2 Fixed Capital Cost
Average annual fixed costs were estimated using new-build prices, scrap prices, and secondhand resale prices for vessels of the same type and size. Annual average new-build price and scrap price time series are determined for standard vessel sizes within each vessel category, while secondhand resale prices are determined via analysis of vessel. The capital asset costs were annualized over the life of the vessel (generally 25–29 years) using the current federal discount rate. Further details on how these are calculated can be found in the DDVOCs’ Guide to Deep-Draft Vessel Operating Costs report. Fields representative of average annual fixed (capital) costs are shown in Figure 8.4.
Figure 8.4: Hull Asset Capital Costs
8.3.3 Average Daily Costs
Average daily cost is calculated as the sum of fixed capital cost plus operating costs divided by 348 operating days. Average daily total vessel costs and average hourly total vessel costs are broken down into at-sea and at-port costs (see Figure 8.5). At-sea costs take into account service speed, economic speed, half-power, and base idle. Service speed is the fastest that the vessel could operate under ideal conditions.
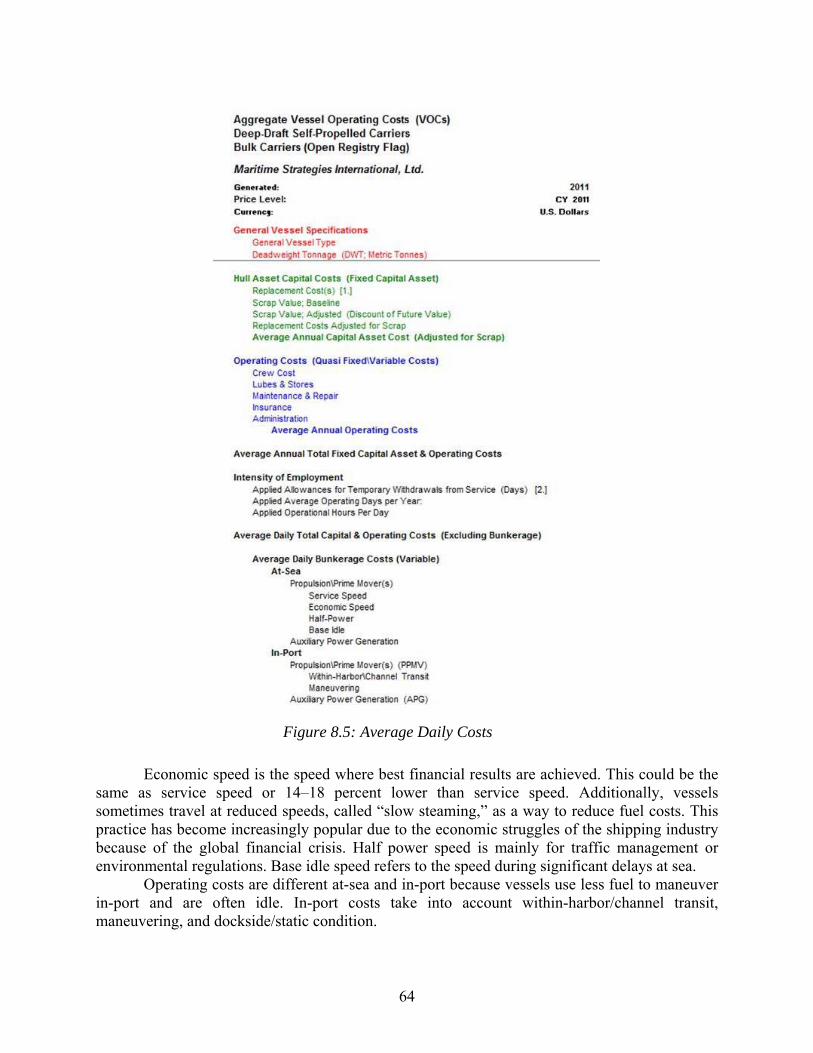
64
Figure 8.5: Average Daily Costs
Economic speed is the speed where best financial results are achieved. This could be the same as service speed or 14–18 percent lower than service speed. Additionally, vessels sometimes travel at reduced speeds, called “slow steaming,” as a way to reduce fuel costs. This practice has become increasingly popular due to the economic struggles of the shipping industry because of the global financial crisis. Half power speed is mainly for traffic management or environmental regulations. Base idle speed refers to the speed during significant delays at sea.
Operating costs are different at-sea and in-port because vessels use less fuel to maneuver in-port and are often idle. In-port costs take into account within-harbor/channel transit, maneuvering, and dockside/static condition.
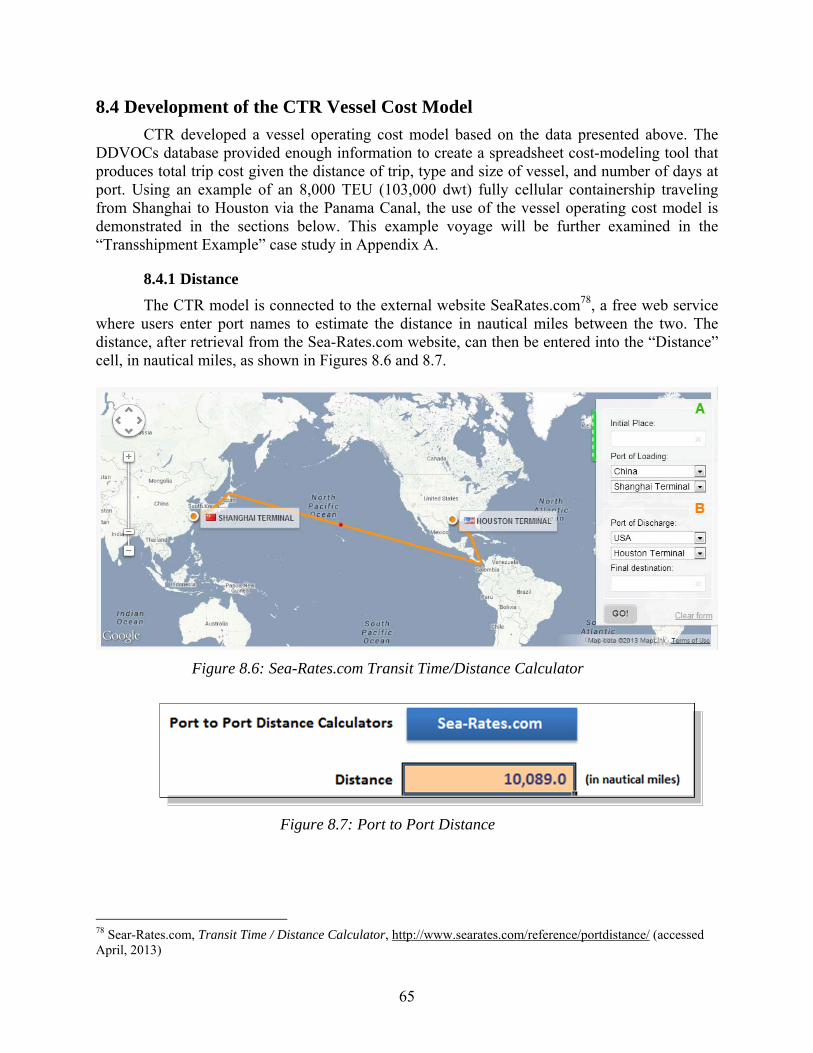
65
8.4 Development of the CTR Vessel Cost Model
CTR developed a vessel operating cost model based on the data presented above. The DDVOCs database provided enough information to create a spreadsheet cost-modeling tool that produces total trip cost given the distance of trip, type and size of vessel, and number of days at port. Using an example of an 8,000 TEU (103,000 dwt) fully cellular containership traveling from Shanghai to Houston via the Panama Canal, the use of the vessel operating cost model is demonstrated in the sections below. This example voyage will be further examined in the “Transshipment Example” case study in Appendix A.
8.4.1 Distance
The CTR model is connected to the external website SeaRates.com78, a free web service where users enter port names to estimate the distance in nautical miles between the two. The distance, after retrieval from the Sea-Rates.com website, can then be entered into the “Distance” cell, in nautical miles, as shown in Figures 8.6 and 8.7.
Figure 8.6: Sea-Rates.com Transit Time/Distance Calculator
Figure 8.7: Port to Port Distance
78 Sear-Rates.com, Transit Time / Distance Calculator, http://www.searates.com/reference/portdistance/ (accessed April, 2013)
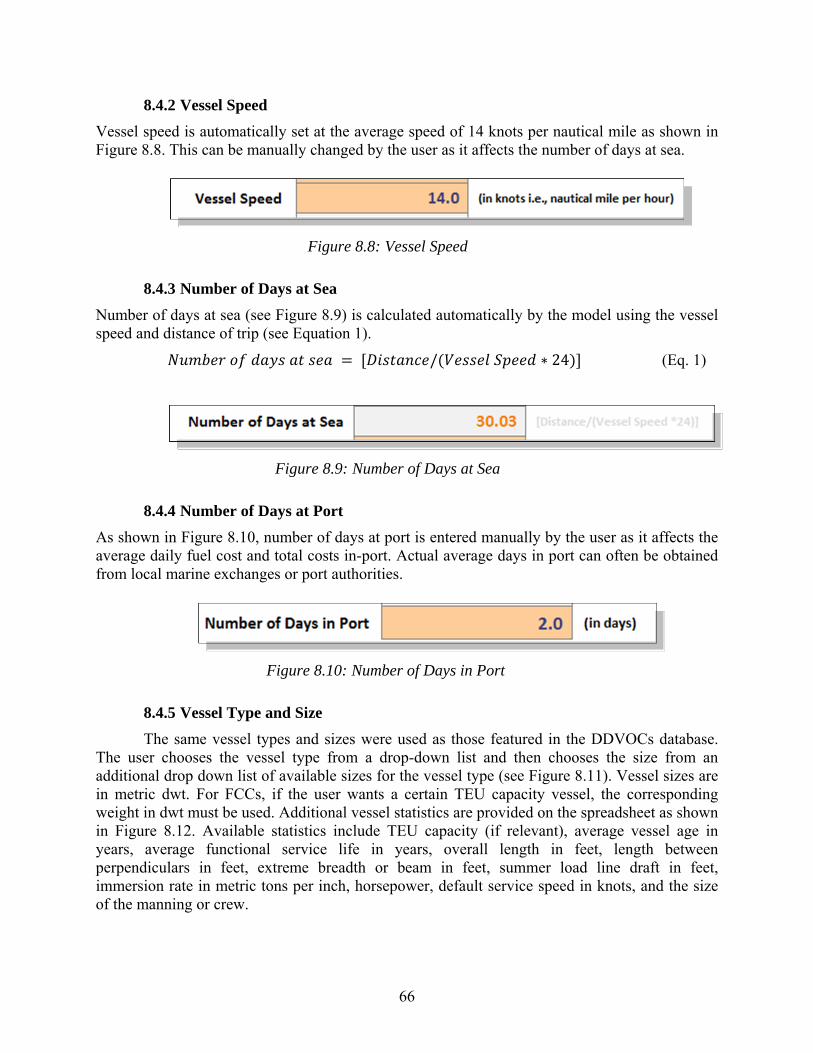
66
8.4.2 Vessel Speed
Vessel speed is automatically set at the average speed of 14 knots per nautical mile as shown in Figure 8.8. This can be manually changed by the user as it affects the number of days at sea.
Figure 8.8: Vessel Speed
8.4.3 Number of Days at Sea
Number of days at sea (see Figure 8.9) is calculated automatically by the model using the vessel speed and distance of trip (see Equation 1). = /( ∗ 24) (Eq. 1)
Figure 8.9: Number of Days at Sea
8.4.4 Number of Days at Port
As shown in Figure 8.10, number of days at port is entered manually by the user as it affects the average daily fuel cost and total costs in-port. Actual average days in port can often be obtained from local marine exchanges or port authorities.
Figure 8.10: Number of Days in Port
8.4.5 Vessel Type and Size
The same vessel types and sizes were used as those featured in the DDVOCs database. The user chooses the vessel type from a drop-down list and then chooses the size from an additional drop down list of available sizes for the vessel type (see Figure 8.11). Vessel sizes are in metric dwt. For FCCs, if the user wants a certain TEU capacity vessel, the corresponding weight in dwt must be used. Additional vessel statistics are provided on the spreadsheet as shown in Figure 8.12. Available statistics include TEU capacity (if relevant), average vessel age in years, average functional service life in years, overall length in feet, length between perpendiculars in feet, extreme breadth or beam in feet, summer load line draft in feet, immersion rate in metric tons per inch, horsepower, default service speed in knots, and the size of the manning or crew.
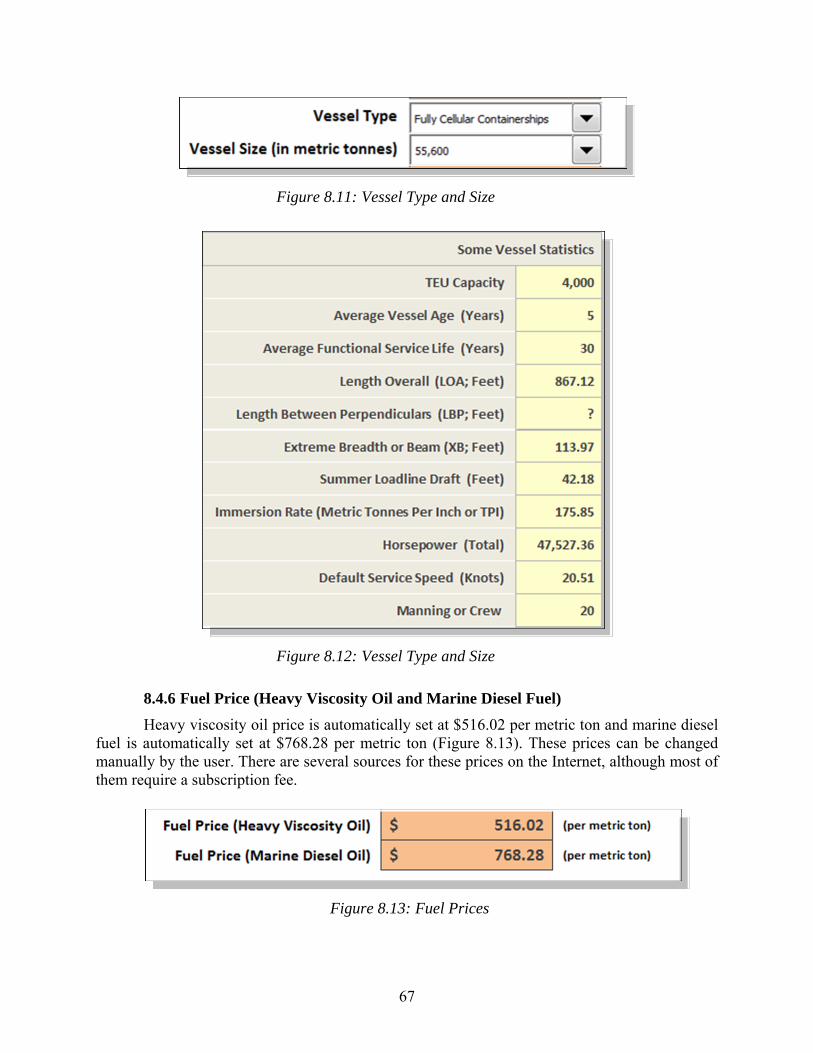
67
Figure 8.11: Vessel Type and Size
Figure 8.12: Vessel Type and Size
8.4.6 Fuel Price (Heavy Viscosity Oil and Marine Diesel Fuel)
Heavy viscosity oil price is automatically set at $516.02 per metric ton and marine diesel fuel is automatically set at $768.28 per metric ton (Figure 8.13). These prices can be changed manually by the user. There are several sources for these prices on the Internet, although most of them require a subscription fee.
Figure 8.13: Fuel Prices
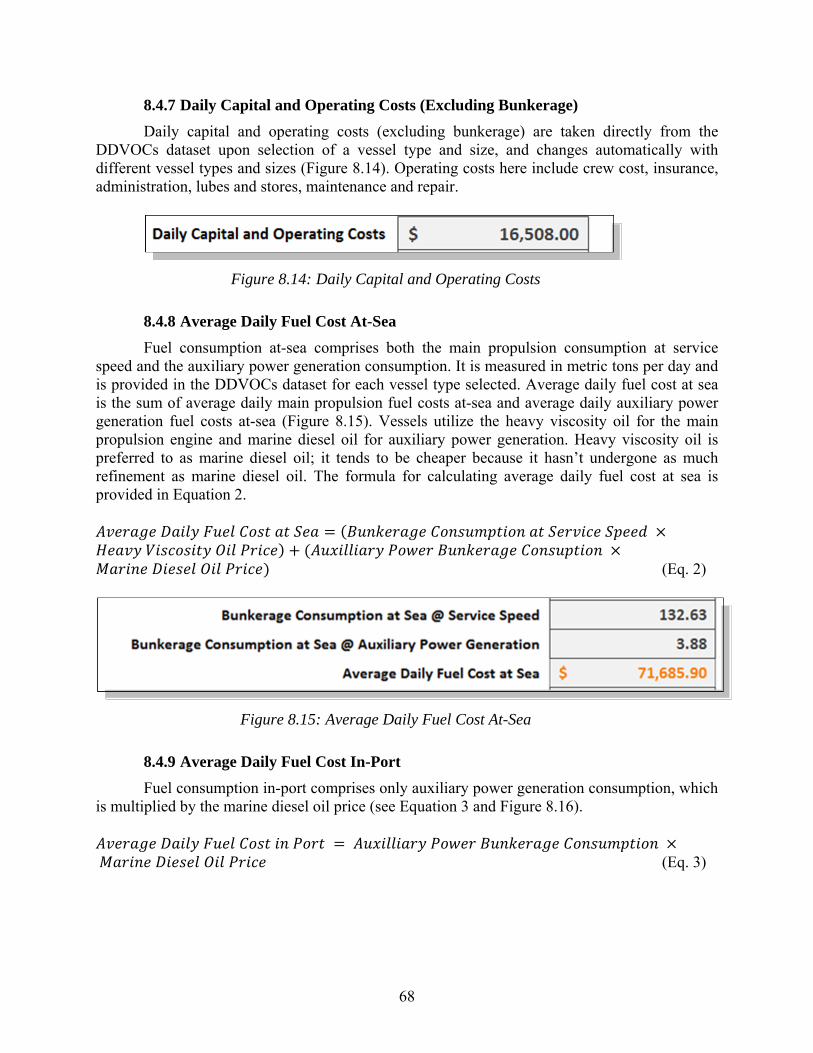
68
8.4.7 Daily Capital and Operating Costs (Excluding Bunkerage)
Daily capital and operating costs (excluding bunkerage) are taken directly from the DDVOCs dataset upon selection of a vessel type and size, and changes automatically with different vessel types and sizes (Figure 8.14). Operating costs here include crew cost, insurance, administration, lubes and stores, maintenance and repair.
Figure 8.14: Daily Capital and Operating Costs
8.4.8 Average Daily Fuel Cost At-Sea
Fuel consumption at-sea comprises both the main propulsion consumption at service speed and the auxiliary power generation consumption. It is measured in metric tons per day and is provided in the DDVOCs dataset for each vessel type selected. Average daily fuel cost at sea is the sum of average daily main propulsion fuel costs at-sea and average daily auxiliary power generation fuel costs at-sea (Figure 8.15). Vessels utilize the heavy viscosity oil for the main propulsion engine and marine diesel oil for auxiliary power generation. Heavy viscosity oil is preferred to as marine diesel oil; it tends to be cheaper because it hasn’t undergone as much refinement as marine diesel oil. The formula for calculating average daily fuel cost at sea is provided in Equation 2.
= ( × ) + ( × ) (Eq. 2)
Figure 8.15: Average Daily Fuel Cost At-Sea
8.4.9 Average Daily Fuel Cost In-Port
Fuel consumption in-port comprises only auxiliary power generation consumption, which is multiplied by the marine diesel oil price (see Equation 3 and Figure 8.16). = × (Eq. 3)
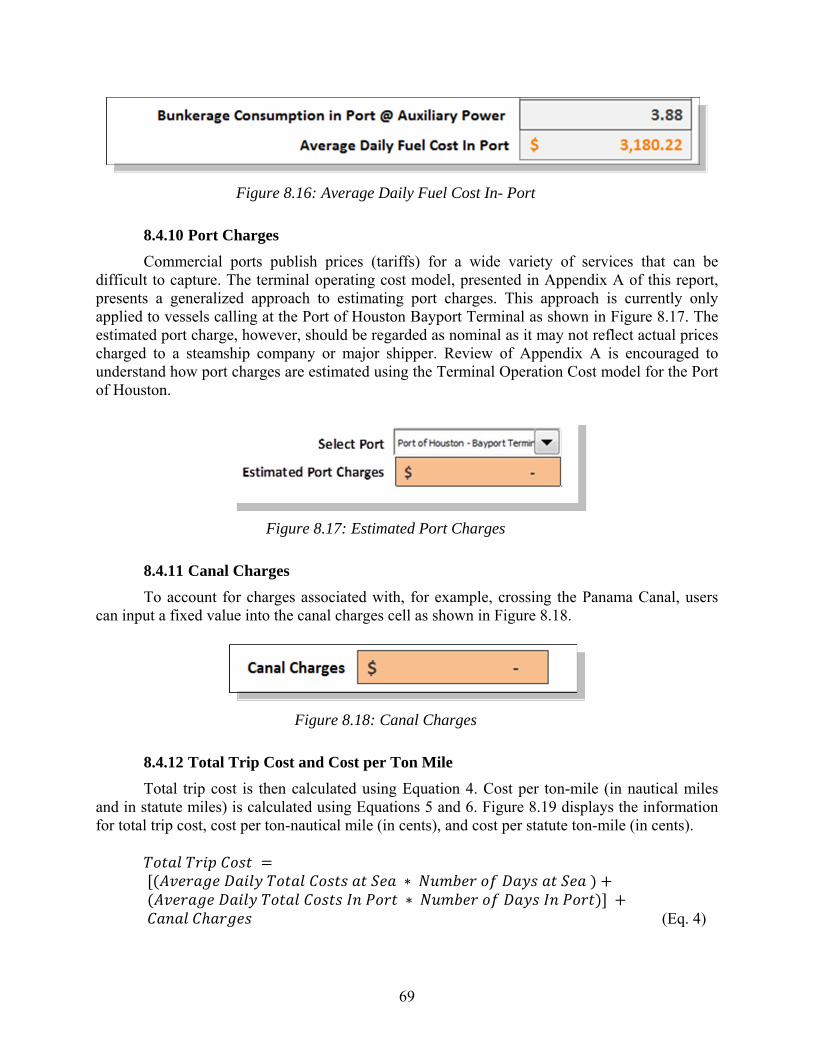
69
Figure 8.16: Average Daily Fuel Cost In- Port
8.4.10 Port Charges
Commercial ports publish prices (tariffs) for a wide variety of services that can be difficult to capture. The terminal operating cost model, presented in Appendix A of this report, presents a generalized approach to estimating port charges. This approach is currently only applied to vessels calling at the Port of Houston Bayport Terminal as shown in Figure 8.17. The estimated port charge, however, should be regarded as nominal as it may not reflect actual prices charged to a steamship company or major shipper. Review of Appendix A is encouraged to understand how port charges are estimated using the Terminal Operation Cost model for the Port of Houston.
Figure 8.17: Estimated Port Charges
8.4.11 Canal Charges
To account for charges associated with, for example, crossing the Panama Canal, users can input a fixed value into the canal charges cell as shown in Figure 8.18.
Figure 8.18: Canal Charges
8.4.12 Total Trip Cost and Cost per Ton Mile
Total trip cost is then calculated using Equation 4. Cost per ton-mile (in nautical miles and in statute miles) is calculated using Equations 5 and 6. Figure 8.19 displays the information for total trip cost, cost per ton-nautical mile (in cents), and cost per statute ton-mile (in cents). = ( ∗ ) +( ∗ ) + ℎ (Eq. 4)
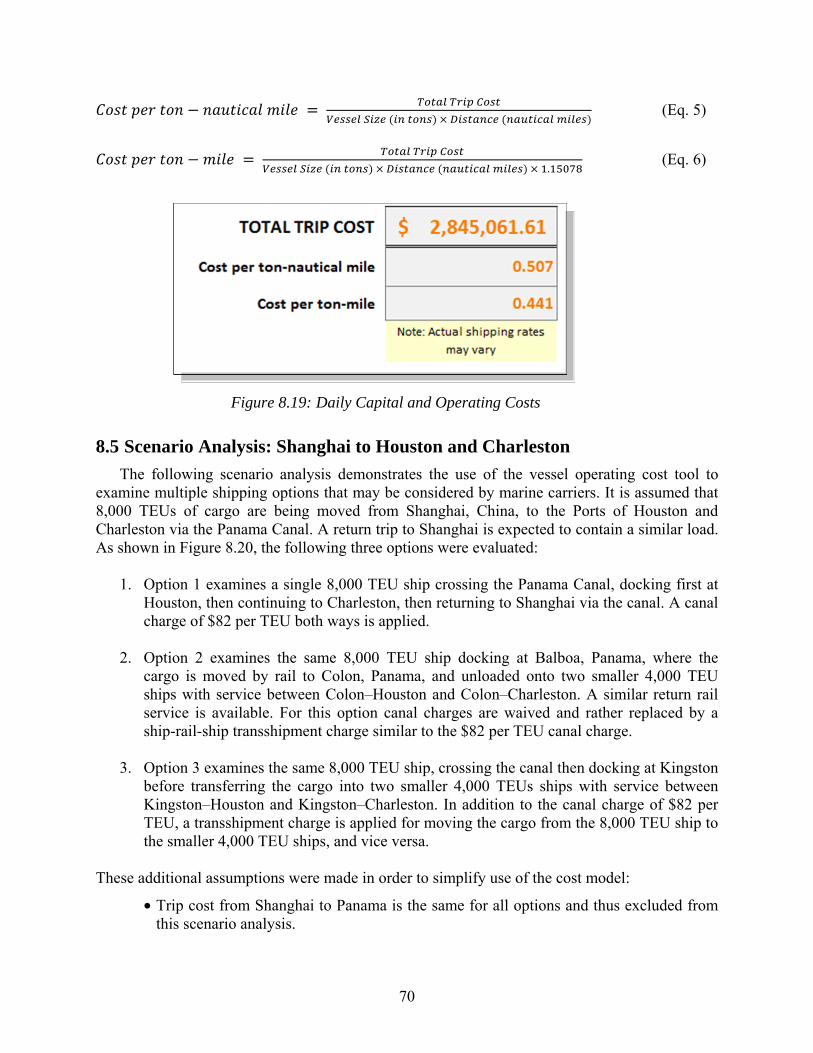
70
= ( )× ( ) (Eq. 5)
= ( )× ( )× . (Eq. 6)
Figure 8.19: Daily Capital and Operating Costs
8.5 Scenario Analysis: Shanghai to Houston and Charleston
The following scenario analysis demonstrates the use of the vessel operating cost tool to examine multiple shipping options that may be considered by marine carriers. It is assumed that 8,000 TEUs of cargo are being moved from Shanghai, China, to the Ports of Houston and Charleston via the Panama Canal. A return trip to Shanghai is expected to contain a similar load. As shown in Figure 8.20, the following three options were evaluated:
1. Option 1 examines a single 8,000 TEU ship crossing the Panama Canal, docking first at Houston, then continuing to Charleston, then returning to Shanghai via the canal. A canal charge of $82 per TEU both ways is applied.
2. Option 2 examines the same 8,000 TEU ship docking at Balboa, Panama, where the cargo is moved by rail to Colon, Panama, and unloaded onto two smaller 4,000 TEU ships with service between Colon–Houston and Colon–Charleston. A similar return rail service is available. For this option canal charges are waived and rather replaced by a ship-rail-ship transshipment charge similar to the $82 per TEU canal charge.
3. Option 3 examines the same 8,000 TEU ship, crossing the canal then docking at Kingston before transferring the cargo into two smaller 4,000 TEUs ships with service between Kingston–Houston and Kingston–Charleston. In addition to the canal charge of $82 per TEU, a transshipment charge is applied for moving the cargo from the 8,000 TEU ship to the smaller 4,000 TEU ships, and vice versa.
These additional assumptions were made in order to simplify use of the cost model:
• Trip cost from Shanghai to Panama is the same for all options and thus excluded from this scenario analysis.
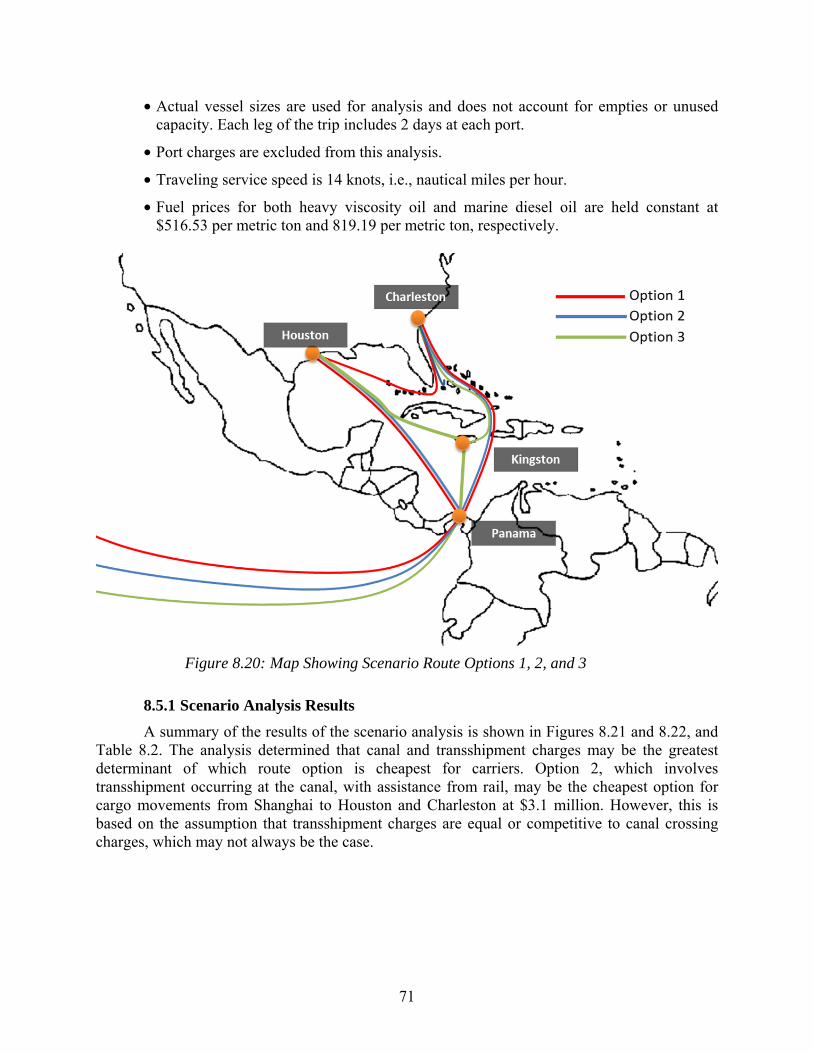
71
• Actual vessel sizes are used for analysis and does not account for empties or unused capacity. Each leg of the trip includes 2 days at each port.
• Port charges are excluded from this analysis.
• Traveling service speed is 14 knots, i.e., nautical miles per hour.
• Fuel prices for both heavy viscosity oil and marine diesel oil are held constant at $516.53 per metric ton and 819.19 per metric ton, respectively.
Figure 8.20: Map Showing Scenario Route Options 1, 2, and 3
8.5.1 Scenario Analysis Results
A summary of the results of the scenario analysis is shown in Figures 8.21 and 8.22, and Table 8.2. The analysis determined that canal and transshipment charges may be the greatest determinant of which route option is cheapest for carriers. Option 2, which involves transshipment occurring at the canal, with assistance from rail, may be the cheapest option for cargo movements from Shanghai to Houston and Charleston at $3.1 million. However, this is based on the assumption that transshipment charges are equal or competitive to canal crossing charges, which may not always be the case.
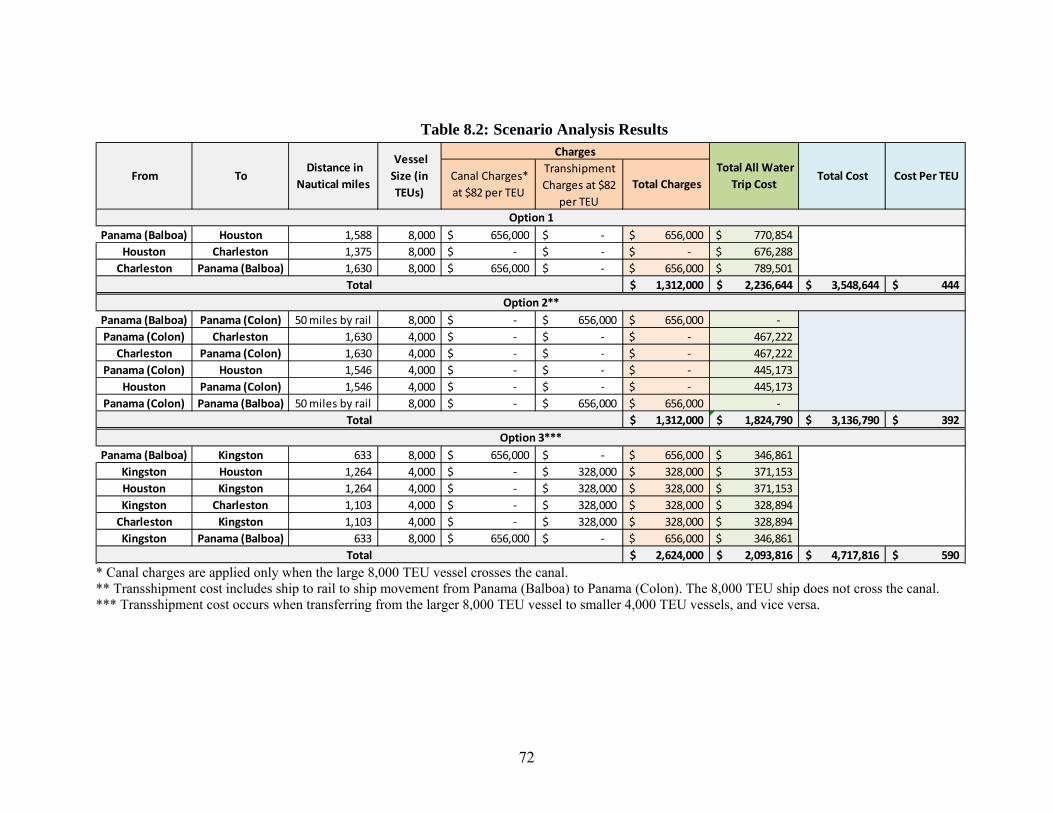
72
Table 8.2: Scenario Analysis Results
* Canal charges are applied only when the large 8,000 TEU vessel crosses the canal. ** Transshipment cost includes ship to rail to ship movement from Panama (Balboa) to Panama (Colon). The 8,000 TEU ship does not cross the canal. *** Transshipment cost occurs when transferring from the larger 8,000 TEU vessel to smaller 4,000 TEU vessels, and vice versa.
Panama (Balboa) Houston 1,588 8,000 656,000$ -$ 656,000$ 770,854$ Houston Charleston 1,375 8,000 -$ -$ -$ 676,288$
Charleston Panama (Balboa) 1,630 8,000 656,000$ -$ 656,000$ 789,501$ 1,312,000$ 2,236,644$ 3,548,644$ 444$
Panama (Balboa) Panama (Colon) 50 miles by rail 8,000 -$ 656,000$ 656,000$ - Panama (Colon) Charleston 1,630 4,000 -$ -$ -$ 467,222
Charleston Panama (Colon) 1,630 4,000 -$ -$ -$ 467,222 Panama (Colon) Houston 1,546 4,000 -$ -$ -$ 445,173
Houston Panama (Colon) 1,546 4,000 -$ -$ -$ 445,173 Panama (Colon) Panama (Balboa) 50 miles by rail 8,000 -$ 656,000$ 656,000$ -
1,312,000$ 1,824,790$ 3,136,790$ 392$
Panama (Balboa) Kingston 633 8,000 656,000$ -$ 656,000$ 346,861$ Kingston Houston 1,264 4,000 -$ 328,000$ 328,000$ 371,153$ Houston Kingston 1,264 4,000 -$ 328,000$ 328,000$ 371,153$ Kingston Charleston 1,103 4,000 -$ 328,000$ 328,000$ 328,894$
Charleston Kingston 1,103 4,000 -$ 328,000$ 328,000$ 328,894$ Kingston Panama (Balboa) 633 8,000 656,000$ -$ 656,000$ 346,861$
2,624,000$ 2,093,816$ 4,717,816$ 590$
Total
Charges Total All Water
Trip Cost Total Cost Cost Per TEU
Distance in Nautical miles
Vessel Size (in TEUs)
To From Canal Charges* at $82 per TEU
Transhipment Charges at $82
per TEU Total Charges
Option 3***
Option 2**
Option 1
Total
Total
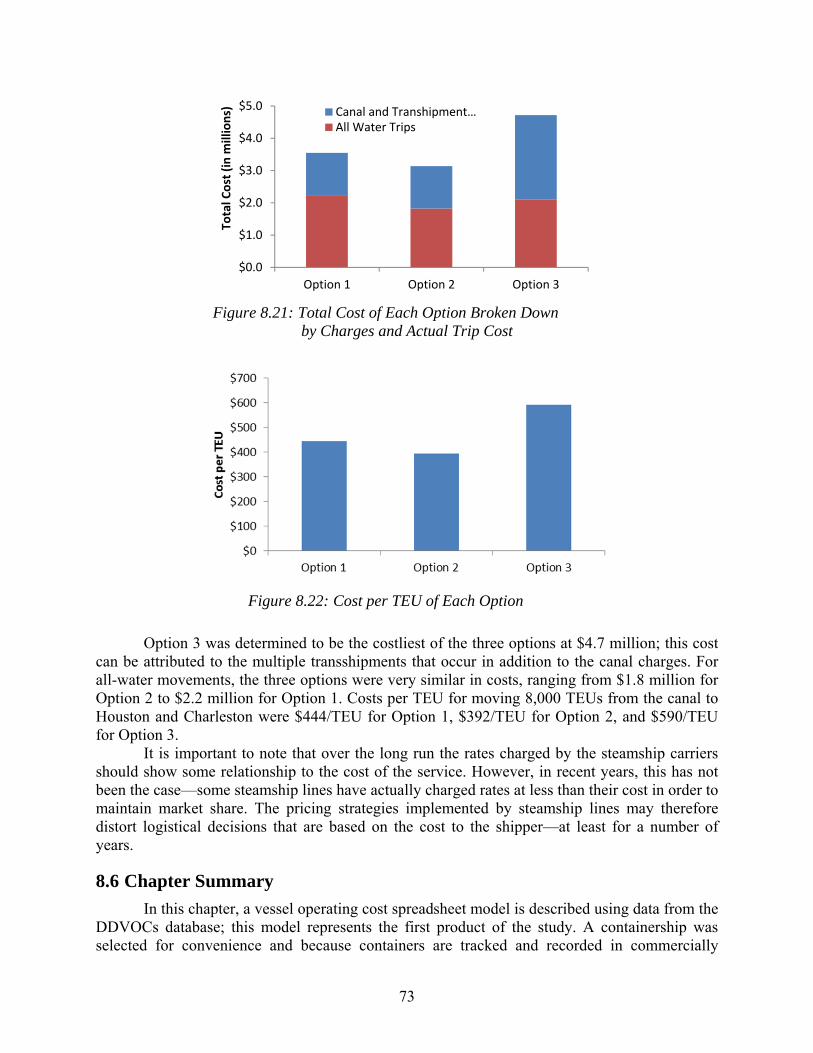
73
Figure 8.21: Total Cost of Each Option Broken Down by Charges and Actual Trip Cost
Figure 8.22: Cost per TEU of Each Option
Option 3 was determined to be the costliest of the three options at $4.7 million; this cost can be attributed to the multiple transshipments that occur in addition to the canal charges. For all-water movements, the three options were very similar in costs, ranging from $1.8 million for Option 2 to $2.2 million for Option 1. Costs per TEU for moving 8,000 TEUs from the canal to Houston and Charleston were $444/TEU for Option 1, $392/TEU for Option 2, and $590/TEU for Option 3.
It is important to note that over the long run the rates charged by the steamship carriers should show some relationship to the cost of the service. However, in recent years, this has not been the case—some steamship lines have actually charged rates at less than their cost in order to maintain market share. The pricing strategies implemented by steamship lines may therefore distort logistical decisions that are based on the cost to the shipper—at least for a number of years.
8.6 Chapter Summary
In this chapter, a vessel operating cost spreadsheet model is described using data from the DDVOCs database; this model represents the first product of the study. A containership was selected for convenience and because containers are tracked and recorded in commercially
$0.0
$1.0
$2.0
$3.0
$4.0
$5.0
Option 1 Option 2 Option 3
Tota
l Cos
t (in
mill
ions
) Canal and Transhipment…All Water Trips
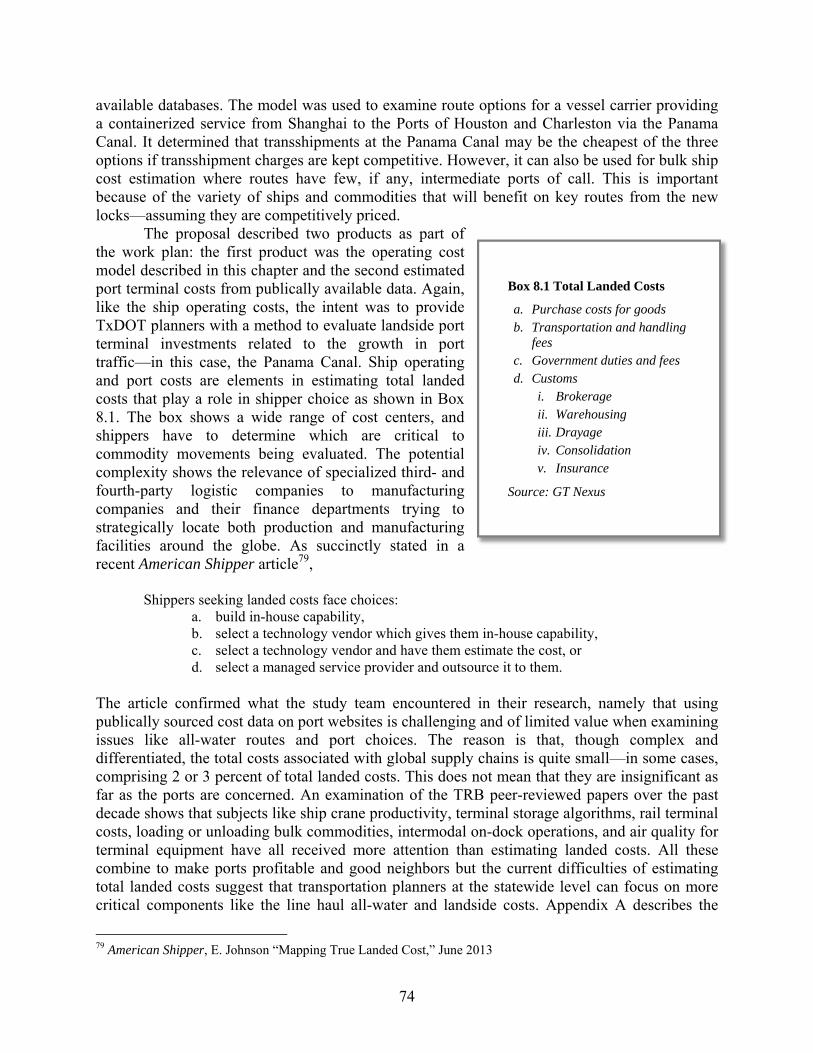
74
available databases. The model was used to examine route options for a vessel carrier providing a containerized service from Shanghai to the Ports of Houston and Charleston via the Panama Canal. It determined that transshipments at the Panama Canal may be the cheapest of the three options if transshipment charges are kept competitive. However, it can also be used for bulk ship cost estimation where routes have few, if any, intermediate ports of call. This is important because of the variety of ships and commodities that will benefit on key routes from the new locks—assuming they are competitively priced.
The proposal described two products as part of the work plan: the first product was the operating cost model described in this chapter and the second estimated port terminal costs from publically available data. Again, like the ship operating costs, the intent was to provide TxDOT planners with a method to evaluate landside port terminal investments related to the growth in port traffic—in this case, the Panama Canal. Ship operating and port costs are elements in estimating total landed costs that play a role in shipper choice as shown in Box 8.1. The box shows a wide range of cost centers, and shippers have to determine which are critical to commodity movements being evaluated. The potential complexity shows the relevance of specialized third- and fourth-party logistic companies to manufacturing companies and their finance departments trying to strategically locate both production and manufacturing facilities around the globe. As succinctly stated in a recent American Shipper article79,
Shippers seeking landed costs face choices:
a. build in-house capability, b. select a technology vendor which gives them in-house capability, c. select a technology vendor and have them estimate the cost, or d. select a managed service provider and outsource it to them.
The article confirmed what the study team encountered in their research, namely that using publically sourced cost data on port websites is challenging and of limited value when examining issues like all-water routes and port choices. The reason is that, though complex and differentiated, the total costs associated with global supply chains is quite small—in some cases, comprising 2 or 3 percent of total landed costs. This does not mean that they are insignificant as far as the ports are concerned. An examination of the TRB peer-reviewed papers over the past decade shows that subjects like ship crane productivity, terminal storage algorithms, rail terminal costs, loading or unloading bulk commodities, intermodal on-dock operations, and air quality for terminal equipment have all received more attention than estimating landed costs. All these combine to make ports profitable and good neighbors but the current difficulties of estimating total landed costs suggest that transportation planners at the statewide level can focus on more critical components like the line haul all-water and landside costs. Appendix A describes the
79 American Shipper, E. Johnson “Mapping True Landed Cost,” June 2013
Box 8.1 Total Landed Costs
a. Purchase costs for goods b. Transportation and handling
fees c. Government duties and fees d. Customs
i. Brokerage ii. Warehousing iii. Drayage iv. Consolidation v. Insurance
Source: GT Nexus
75
research team’s method of using nominal reported costs to calculate total port costs that constitute the second product of this study.

76
77
Chapter 9. Findings and Recommendations
All Texas deep-water ports stand to benefit from growing global trade. Anticipated growth in US-Latin American and US-Asian trade will more than compensate for any short-term—and even long-term—decline in US-European trade. Moreover, Texas ports have room to grow. Each port profiled in the first 6690-1 report—Beaumont, Brownsville, Corpus Christi, and Houston—has identified specific opportunities for growth and is undertaking initiatives to develop, build, or otherwise implement a variety of improvements to capitalize on those opportunities. This seems to be the trend at all Texas deep-water ports. The size of the Texas consumer market is the single-most important locational advantage for Texas ports in competing for global trade. In 2013, the state demographer estimates the population at 26.9 million, rising to 33.3 million by 2030 and 45.4 million in 204080. The Dallas/Ft. Worth metropolitan area ranks fourth nationally in terms of population, while Houston ranks fifth. If the San Antonio and Austin metropolitan areas are included, nearly 15 million residents are easily served by Texas ports, compared to 12 million residents within the region between Philadelphia and Washington, D.C., and 8 million in the greater Miami area. Economic activity will be changed and strengthened by industrial sectors using new energy sources—particularly natural gas—as well as near-sourcing global production to Mexico, the largest trading partner with Texas. Shippers serving this growth in both population and economic activity will use a range of modal corridors to move freight, and an enhanced Panama Canal will strengthen service options for steamship companies.
9.1 Dynamics of Maritime Trade and the Role of the Panama Canal
Three irrefutable facts are known at this time. The first is that the new locks will offer global shippers new choices based on routes, cost, and service. That much is certain. The second is that the impact of the new locks on particular ports and trading partners will vary over time and their use by larger (post-Panamax) vessels will be linked to specific trade lanes, commodities, global trends in labor cost and related transportation costs, future free-trade agreements, and advancements in maritime-related technologies, among other factors. Third, the new locks broaden shipper options for Texas exports, particularly bulk commodities, on specific Panama Canal routes. Beyond these three facts, there is no agreement among experts about the likely pace or scale of future port activity due to the Panama Canal expansion. Disagreements even exist among officials within the same organizations and ports. Why?
• To the extent that increasingly larger (post-Panamax) containerized and non-containerized vessels will sail directly to and from US ports, there will be fewer ports of call and services may be further consolidated through vessel sharing agreements among steamship lines. To maximize revenue and maintain schedule integrity, ships must spend as little time as possible in port. With few exceptions, the likely winning ports are still open to speculation at the end of this study.
• To keep their larger vessels at sea for as long as possible, steamship lines may well increasingly use terminals in transshipment ports (such as Freeport, Bahamas; Kingston, Jamaica; Caucedo, Dominican Republic; and Colon, Panama) to transfer containers to smaller feeder ships that carry shipments throughout the Caribbean,
80 http://www.hhsc.state.tx.us/research/dssi/PopStats/ProjectionsTX_GenderRace.html
78
South and Central America, and the US Gulf and East Coasts. The growth in near-sourced manufacturing will further boost these feeder services. Moreover, logistics centers are being planned around Caribbean and Panama transshipment hubs. These logistics centers offer steamship lines the possibility of filling their vessels with Caribbean goods bound for Asia on their backhauls.
• Western railroads will act to protect their market share in the face of future Panama Canal competition. Over the past 5 years, the Burlington Northern Santa Fe and Union Pacific rail lines have invested $12 billion in both facilities and mainlines to serve Southern California alone. This sum is more than double the $5.2-billion cost of expanding the Panama Canal. US West Coast ports and railroads have the advantage of being able to engage in differential pricing by market segment and could lower prices for services with slower transit times if they feel pressure from all-water services through the Panama Canal. Railroads also have the ability to price shipments on a door-to-door basis.
• Another major consideration is the extent to which future manufacturing will migrate from China to Southeast Asia and the Indian subcontinent, including Bangladesh and Pakistan. The closer that US trading partners are located to the west and south of Singapore, the more the Suez Canal becomes the preferred route to the US East Coast. As previously mentioned, two-way trade between the US and Southeast Asian countries has tripled over the last 20 years.
• Finally, the lack of adequate port and surface transport infrastructure in foreign countries may well pose a significant obstacle to future trade. With the exception of Chile and Panama, growth in trade has far outpaced infrastructure development throughout Latin America. This is particularly true for Brazil, which only recently began taking steps to rectify problems. With the exception of Singapore and Malaysia, the same applies to the remainder of Southeast Asia and the Indian subcontinent.
9.2 Texas Port Challenges
Texas ports face three distinct challenges, each linked to different issues and funding sources. These challenges comprise seaside access (principally channels), port and terminal operations (capacity), and landside connections with surface modes of transport. Each can place limits on Texas port capacity and competition.
• Both East Coast and Gulf Coast ports have devoted considerable attention in their investment strategies to enhance port access that will enable them to service post-Panamax vessels after the 2015 opening of the new Panama Canal locks. An operating depth of 50 feet is generally considered the standard for those (like Florida’s ports) promoting their respective locations, even though such a depth is unlikely (and possibly unnecessary) for most Gulf Coast locations, based on simple cost-benefit analysis estimates. The reach of a deeper, wider 50-foot-deep channel would exceed 12 miles in some cases, requiring unsustainable levels of dredging and disposal. New terminals located nearer deeper water may help, but the most immediate need is to offer an access system that provides a consistent depth. In Houston, for example, this means linking the main 45-foot-deep channel with the
79
40-foot-deep Barbours Cut and Bayport terminal channels. Shallow-draft ports would benefit from dredging the Gulf Intracoastal Waterway to the authorized 12-foot depth and 125-foot width, since barge operators are currently traversing an operating depth of 9.5 feet, which adversely impacts barge productivity. Providing the necessary finances to fund or match federal contributions for conducting channel dredging on this scale is virtually impossible for most Texas deep-water ports; these funds are unlikely to be provided solely by the federal government given present and forecasted budget shortfalls.
• Texas ports handle a wide variety of both imported and exported commodities. Container traffic is concentrated at Houston and Freeport. These terminals have sufficient capacity, when expressed in terms of current and approved construction, to handle double the current twenty-foot-equivalent (TEU) container volumes. In general, ports handle their operations effectively and rely upon a variety of financial mechanisms to support strategic planning on their own properties. They have been successful in transmitting their concerns to TxDOT and other agencies. A recent Texas waterborne trade study identified port project needs and all highway projects that would benefit port operations to TxDOT District planners for consideration.
• Landside issues include terminal rail and highway chokepoints. Highway bottlenecks are being addressed in a systematic fashion, reflecting the wide variety of competing projects and limited budgets. Bayport terminal dray trucks, for example, will benefit from a recently completed freeway ramp. The Texas economy is dominated by the Dallas/Ft. Worth-Houston-San Antonio triangle. Both import and export customers who rely on Texas deep-water ports in that region will use trucks for most of their landside movements. Rail intermodal container traffic will gain importance if Texas ports become true load centers. Yet only Houston, with inadequate rail access, possesses the attributes to become a true Texas container load center. Access to the port has to be examined in the broader context of the Houston rail and terminal network. A much-needed improvement would be the construction of an ex-urban terminal yard receiving both domestic and international traffic.
As of 2012, deep-water port needs are ranked as follows: channels, landside rail
connectivity, and port operations.
9.3 Texas Department of Transportation’s Role
• TxDOT’s 2012 strategic plan specifically includes a provision to “prioritize new projects that will increase state GDP and enhance access to goods and services throughout the state” as well as directly contribute to promoting the state’s economic competitiveness. As part of this strategy, TxDOT already has implemented several initiatives that will strengthen marine gateways and multimodal transport routes using Texas ports. These routes and ports include both those serving the current Panama Canal users and the likely beneficiaries of the enlarged set of locks, once opened for operations in 2015. The most significant change is the creation of a Marine Division responsible for representing both deep- and shallow-draft port interests in statewide planning activities. This division
80
enables TxDOT to monitor maritime developments of all types, including channels, port operations, and new commodity flows (e.g., Texas-based oil and natural gas production and distribution) and to identify needed improvements to landside rail and highway connectivity.
• The second important change in TxDOT planning is the creation of the position of a dedicated freight planning coordinator, responsible for ensuring that freight plays a major role in transportation planning. Four additional initiatives are now in place:
1. TxDOT has created a Freight Advisory Committee (FAC), comprising members representing major transport modes, industrial sectors, and logistics companies. The FAC will meet regularly and provide advice and support to TxDOT planning activities.
2. TxDOT has developed a Freight Plan managed by the new freight coordinator, with help from the FAC, which will be regularly updated and will provide support for other planning initiatives.
3. TxDOT has recently awarded a contract to update the statewide transportation plan, which will incorporate freight data—including that pertaining to ports and waterways—derived from the Freight Plan.
4. In addition, another contract has been awarded for a statewide corridor study to evaluate the use and performance of key Texas corridors, including those critical for freight movements through Texas ports and NAFTA gateways along the Texas-Mexico border.
• The timing of these activities coincides with the most recently enacted federal transportation funding authorization bill in 2012, the Moving Ahead for Progress in the 21st Century Act (or MAP-21). MAP-21 offers a streamlined and performance-based surface transportation program that specifically incorporates freight and other modes, notwithstanding its administration by the Federal Highway Administration. In other words, TxDOT is positioned to benefit by acquiring a comprehensive understanding of freight flows at a time when freight has gained regional and national significance.
1. Updates to be considered:
a. The World Trade Organization reports that manufacturing is on the move from China and the beneficiaries are Vietnam, Indonesia, India, and Mexico. None of these countries need to use the Panama Canal to trade with the U.S, especially to trade with Texas.
b. Drewry Shipping Consultants identify more than 11 existing Asian services to the US East Coast ports (including Hampton Roads, Savannah, and Charlotte) using the Suez Canal; their total volumes are equal to the Panama Canal. The introduction of larger vessels (cascading down from the introduction of ultra-large ships) will favor the Suez over Panama.
c. Even when the new locks open, it will be difficult to catch up. Why? Even larger ships will be used on the Asia-EU-US routes, especially if the EU recovers as predicted. There is no restriction on size for Suez Canal transits, even Triple Es.
81
In fact, Drewry points out that even if the Suez Canal closes, the large ships can use the Horn of Africa route and move at a higher speed. This would eliminate the option of slow steaming, but even then the numbers show it can work.
d. Transshipment hubs are growing as a result of their location on both the Panama Canal and South American routes. For example, rather than move containers from Brazil directly to Houston, many steamship companies are transloading in the Caribbean. Why? They can leave Brazil with boxes for East Coast ports, Gulf ports, and Asia, and return with empty and full containers from these markets.
2. What should TxDOT do?
a. Texas Gulf ports are going to go through a positive business cycle—both imports (population and industries) and exports (agriculture, goods, chemicals, and energy) are growing. Irrespective of the Panama Canal, trade with Latin America will grow and near-sourcing—particularly the shift of manufacturing from Asia to Mexico—will have a powerful impact on regional trade flows. Any attempt to forecast precise trade patterns at this time will be fruitless and likely to overestimate true impacts. Concentrate on the connectors to those terminals serving as gateways for the increased trade patters—talk to ports and Port Authority Advisory Committee.

82
83
Appendix A: Container Terminal and Cargo-Handling Cost Analysis Toolkit
For this task, the study team sought to determine the costs associated with container terminal operations and their influence on overall container shipping cost. Commercial ports publish prices (tariffs) for a wide variety of services and the study proposal included the development of a spreadsheet that would allow freight planners to build policy-based strategies to capture the impacts of current and new maritime services on Texas Gulf ports. This approach allows a technical dialog to be developed between TxDOT/metropolitan planning organization staff and the port/shipping sectors. Published port terminal activity costs (tariffs) should, however, be regarded as nominal—they may not reflect actual prices charged to a steamship company or major shipper. Negotiated prices reflect a range of factors (such as customer size) that are confidential. Fortunately, nominal prices do work for strategic planning because they show the cost differentials between ports that drive port selection on supply chains. Accordingly, the study team developed a basic model or toolkit that could be evaluated by TxDOT planners. The Container Terminal and Cargo-Handling Cost Analysis model was developed using tariffs from select Texas ports and the results are now presented.
A.1 Types of Port Charges
In 2002, the United Nations Economic and Social Commission for Asia and the Pacific81 (ESCAP/UNDP) developed a Model Tariff Structure consisting of four service groups. These service groups include the navigation service, berth service, cargo operations, and other business services. Each service group comprises multiple services associated with various port operations. The navigation service comprises services relating to port dues, pilotage, and tug services, tug-berth system, channel width and draft restrictions, etc.82. Berth services include berth hire, wharfage, and other support services that serve as the “true interface between marine transport and inland transport”82. Factors such as number, length, and types of berths and gantries, gantry capacity and efficiency, berth storage transfer capabilities and capacities, storage-inland transport transfer capabilities, and gate processing rates influence the performance of the total port system82. Cargo operations charges include wharfage charges, cargo transfer charge, special cargo handling, storage, packing/unpacking, and equipment/service/facility hire. Technological improvements in the areas of logistics, inventory controls, “just-in-time” service deliveries, and container tracking systems coupled with innovative storage pricing schemes have greatly improved the efficiency of port cargo handling and storage operations82. Other business services such as port security, management services, and provision of utilities are necessary for the overall management and operations of the port.
The following subsections describe in detail each of these service groups and their associated services and charges from a sample of three Texas Ports: the Port of Houston83, the Port of Brownsville84, and the Port of Corpus Christi85. 81 United Nations Economic and Social Commission for Asia and the Pacific, Comparative Analysis of Port Tariffs In The ESCAP Region, United Nations, New York, 2002. 82 Pappu, Madhav, “A Systems Approach to Modern Port Planning and Management,” Conference Proceedings of the Institute of Marine Engineers (India) Millennium Seminar, p: 107–116, 2001. 83 Port of Houston Authority, Tariff Numbers 8 and 15, http://www.portofhouston.com/general-terminals/tariffs/ 84 Port of Brownsville, Tariff Number 6 - Sections 2 and 3, http://www.portofbrownsville.com/tariffs/
84
A.1.1 Navigation Service Group
The navigation service group comprises all services and facilities required for a vessel to move from the open sea (or from one location in a port) to its stationary or secure area, including reverse direction movements and activities. Services charges categorized in this group include port dues, pilotage, and tug services.
A.1.1.1 Port Dues/Harbor Fee
Port of Houston: The Port of Houston assesses additional harbor fees for vessels leaving and reentering the jurisdictional limits of the Port Authority, but provides an exemption for 1) government vessels not engaged in carrying cargo, troops, or supplies; 2) private, non-commercial pleasure craft; and 3) tugboats excluding integrated tug/barges (Port of Houston Tariff No. 8 Subrule No. 105).
Port of Brownsville: The Port of Brownsville charges the harbor fee “to assist in
defraying the expense for the maintenance and regulating of the turning basin and ship channel” (Port of Brownsville Tariff No. 6, Item 340). Charges assessed by the Port of Brownsville are as follows:
1. All commercial vessels, self-propelled or not self-propelled, except river barges, not otherwise provided for, per call: $150.00
2. All commercial vessels, self-propelled or not, except river barges, calling at the bulk cargo dock, per call: $200.00
3. River barges, per call (shifting to a fleeting area ends a call): $100.00 4. Mexican fishing vessels: $65.00 5. A harbor fee for LASH and SEABEE barges shall be charged as follows:
a. Vessel under 75 feet in length, per call: $40.00 b. Vessel 75 feet and under 100 feet in length, per call: $50.00
The Port of Brownsville exempts 1) fishing vessels, 2) vessels entering the Port of
Brownsville Ship Channel that are bound to or from the Port of Port Isabel, 3) tugs calling at the Port of Brownsville for the sole purpose of towing vessels or barges in or out of the Port of Brownsville, and 4) river barges that are considered to be “tag-along” barges and are in the Port of Brownsville as a part of a tow and that do not load or unload cargo in the Port (Port of Brownsville Tariff No. 6, Item 340).
Port of Corpus Christi: The Port of Corpus Christi does not charge port dues or harbor
fees.
A.1.1.2 Pilotage
According to the ESCAP/UNDP report, pilotage involves the use of a fixed visual reference on the ground or sea by means of sight or radar to guide vessels from the seaway to the river estuary and finally to the berthing area. Pilotage charges can be based on a vessel’s gross
85 Port of Corpus Christi, Tariff 100-A and Bulk Terminal Tariff 1–4, http://www.portofcorpuschristi.com/index.php/business-development-212/port-tariff
85
registered tonnage (GRT)86 or the vessel’s dimensions, or be assessed on a per call basis. It can also be differentiated by the location where the pilotage starts and ends. The Port of Brownsville assesses a pilotage charge from the sea or Port Isabel to the Port of Brownsville or vice versa (Port of Brownsville Tariff No. 6, Item 325). Sample 2010 pilotage charges for normal self-propelled vessels are shown in Table A1.1. Information on Port of Houston pilotage rates on the Houston Ship Channel to or from Sea or Bolivar Roads can be found on the Houston Pilots website87; Port of Corpus Christi information is available on the Aransas-Corpus Christi Pilots website88.
Table A.1 Port of Brownsville 2010 Pilotage Charges for Normal Self-Propelled vessels
1 Draft charge of $20.64 per foot of draft. Minimum draft charge of 20 feet: $412.78.
2 Tonnage charge: summer deadweight or international gross tonnage, whichever is more; a charge of $0.0344 per metric tons.
3 Transportation/fuel surcharge of $32.76 per pilot boat movement (as long as the price of crude oil remains below $100 a barrel—if price of crude rises above $100 a barrel then $50.00 per movement).
4 Port safety/radio charge of $21.84 per pilot, per movement.
5 Minimum charge per movement $819.00 for a normal cargo vessel; $546.00 minimum for oceangoing tugs/supply vessels.
A.1.1.3 Harbor Tug or Towing Services
Harbor tug charges are assessed based on either the characteristics of the ship or the tugs performing the operation. When based on the tug, the charges are commonly assessed based on the size of the tugboat in addition to an hourly usage charge. However, in some cases it is charged as a fixed rate irrespective of the time taken for the operation and differentiated by the vessel’s type and size81. At the Port of Brownsville, tugboat services are provided by private operators and charges are quoted upon request (Port of Brownsville Tariff No. 6, Item 330). In Houston, the harbor tug service tariffs are available online from the respective service providers (Bay-Houston Towing Company, Signet Maritime Corporation, and Suderman & Young Towing Company). The same is true in Corpus Christi (Bay-Houston Towing Company, G&H Towing, Signet Maritime Corporation, and Suderman & Young Towing Company).
A.1.2 Berth Service Group
The berth service group comprises all services and facilities, including berth hire, wharfage, and other support services available to a vessel owing to its location at that berth (or anchorage)81.
All three ports assess a berth hire and wharfage/dockage charge.
86 Although the word “tonnage” is used, this is actually a measurement of the space available to hold cargo. It is widely used throughout the world for assessment of charges. 87 Houston Pilots, Houston Pilots, http://www.houston-pilots.com/tariffs.aspx 88 Aransas- Corpus Christi Pilots, Pilot Tariff, http://www.aransascorpuschristipilots.com/tariffs.html
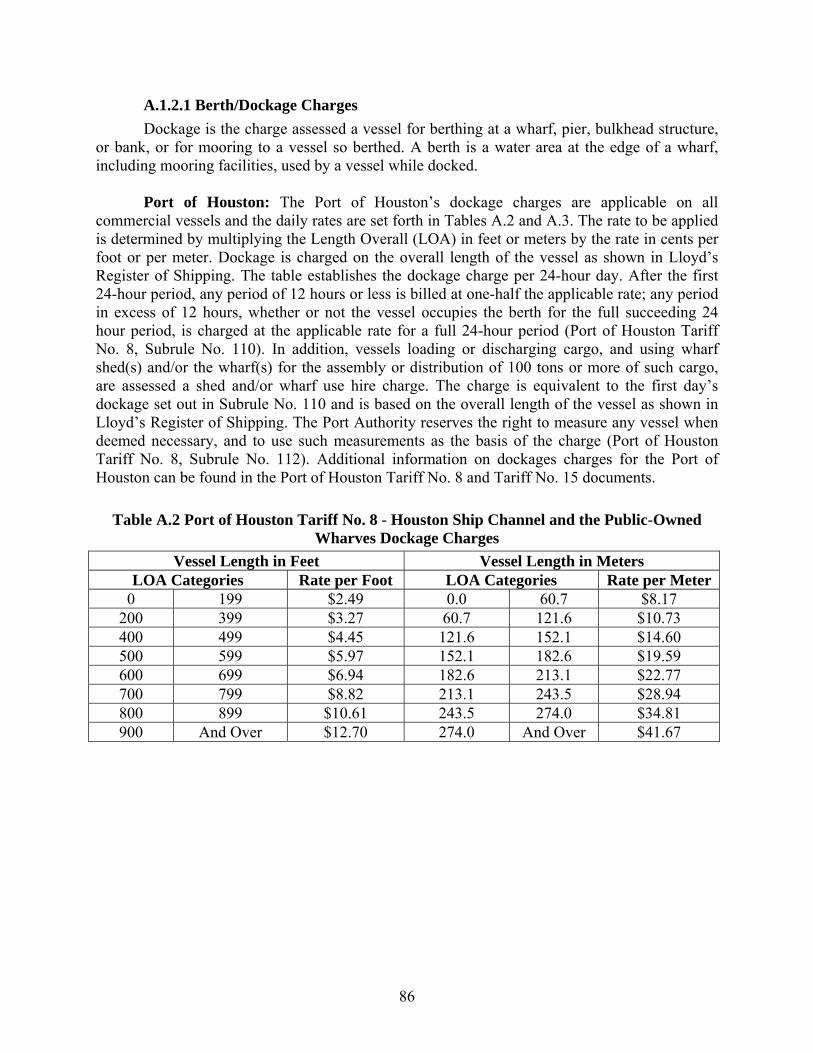
86
A.1.2.1 Berth/Dockage Charges
Dockage is the charge assessed a vessel for berthing at a wharf, pier, bulkhead structure, or bank, or for mooring to a vessel so berthed. A berth is a water area at the edge of a wharf, including mooring facilities, used by a vessel while docked.
Port of Houston: The Port of Houston’s dockage charges are applicable on all
commercial vessels and the daily rates are set forth in Tables A.2 and A.3. The rate to be applied is determined by multiplying the Length Overall (LOA) in feet or meters by the rate in cents per foot or per meter. Dockage is charged on the overall length of the vessel as shown in Lloyd’s Register of Shipping. The table establishes the dockage charge per 24-hour day. After the first 24-hour period, any period of 12 hours or less is billed at one-half the applicable rate; any period in excess of 12 hours, whether or not the vessel occupies the berth for the full succeeding 24 hour period, is charged at the applicable rate for a full 24-hour period (Port of Houston Tariff No. 8, Subrule No. 110). In addition, vessels loading or discharging cargo, and using wharf shed(s) and/or the wharf(s) for the assembly or distribution of 100 tons or more of such cargo, are assessed a shed and/or wharf use hire charge. The charge is equivalent to the first day’s dockage set out in Subrule No. 110 and is based on the overall length of the vessel as shown in Lloyd’s Register of Shipping. The Port Authority reserves the right to measure any vessel when deemed necessary, and to use such measurements as the basis of the charge (Port of Houston Tariff No. 8, Subrule No. 112). Additional information on dockages charges for the Port of Houston can be found in the Port of Houston Tariff No. 8 and Tariff No. 15 documents.
Table A.2 Port of Houston Tariff No. 8 - Houston Ship Channel and the Public-Owned Wharves Dockage Charges
Vessel Length in Feet Vessel Length in Meters LOA Categories Rate per Foot LOA Categories Rate per Meter
0 199 $2.49 0.0 60.7 $8.17 200 399 $3.27 60.7 121.6 $10.73 400 499 $4.45 121.6 152.1 $14.60 500 599 $5.97 152.1 182.6 $19.59 600 699 $6.94 182.6 213.1 $22.77 700 799 $8.82 213.1 243.5 $28.94 800 899 $10.61 243.5 274.0 $34.81 900 And Over $12.70 274.0 And Over $41.67
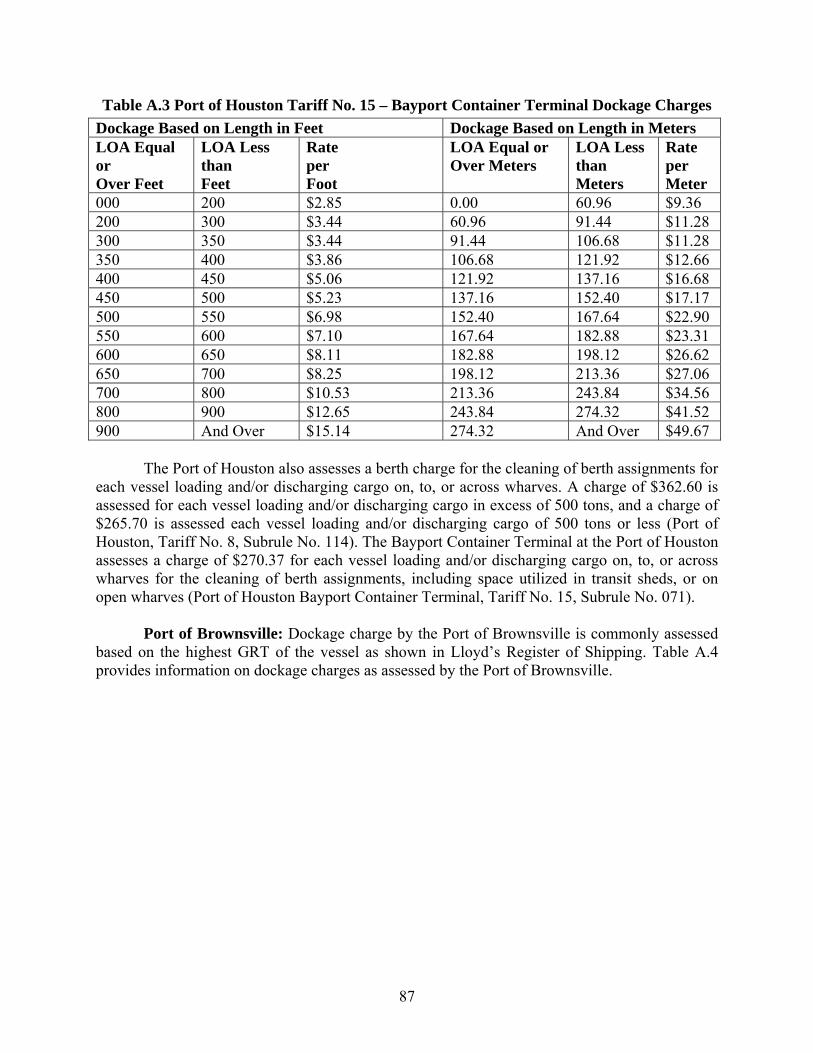
87
Table A.3 Port of Houston Tariff No. 15 – Bayport Container Terminal Dockage Charges
Dockage Based on Length in Feet Dockage Based on Length in Meters LOA Equal or Over Feet
LOA Less than Feet
Rate per Foot
LOA Equal or Over Meters
LOA Less than Meters
Rate per Meter
000 200 $2.85 0.00 60.96 $9.36 200 300 $3.44 60.96 91.44 $11.28 300 350 $3.44 91.44 106.68 $11.28 350 400 $3.86 106.68 121.92 $12.66 400 450 $5.06 121.92 137.16 $16.68 450 500 $5.23 137.16 152.40 $17.17 500 550 $6.98 152.40 167.64 $22.90 550 600 $7.10 167.64 182.88 $23.31 600 650 $8.11 182.88 198.12 $26.62 650 700 $8.25 198.12 213.36 $27.06 700 800 $10.53 213.36 243.84 $34.56 800 900 $12.65 243.84 274.32 $41.52 900 And Over $15.14 274.32 And Over $49.67
The Port of Houston also assesses a berth charge for the cleaning of berth assignments for each vessel loading and/or discharging cargo on, to, or across wharves. A charge of $362.60 is assessed for each vessel loading and/or discharging cargo in excess of 500 tons, and a charge of $265.70 is assessed each vessel loading and/or discharging cargo of 500 tons or less (Port of Houston, Tariff No. 8, Subrule No. 114). The Bayport Container Terminal at the Port of Houston assesses a charge of $270.37 for each vessel loading and/or discharging cargo on, to, or across wharves for the cleaning of berth assignments, including space utilized in transit sheds, or on open wharves (Port of Houston Bayport Container Terminal, Tariff No. 15, Subrule No. 071).
Port of Brownsville: Dockage charge by the Port of Brownsville is commonly assessed
based on the highest GRT of the vessel as shown in Lloyd’s Register of Shipping. Table A.4 provides information on dockage charges as assessed by the Port of Brownsville.
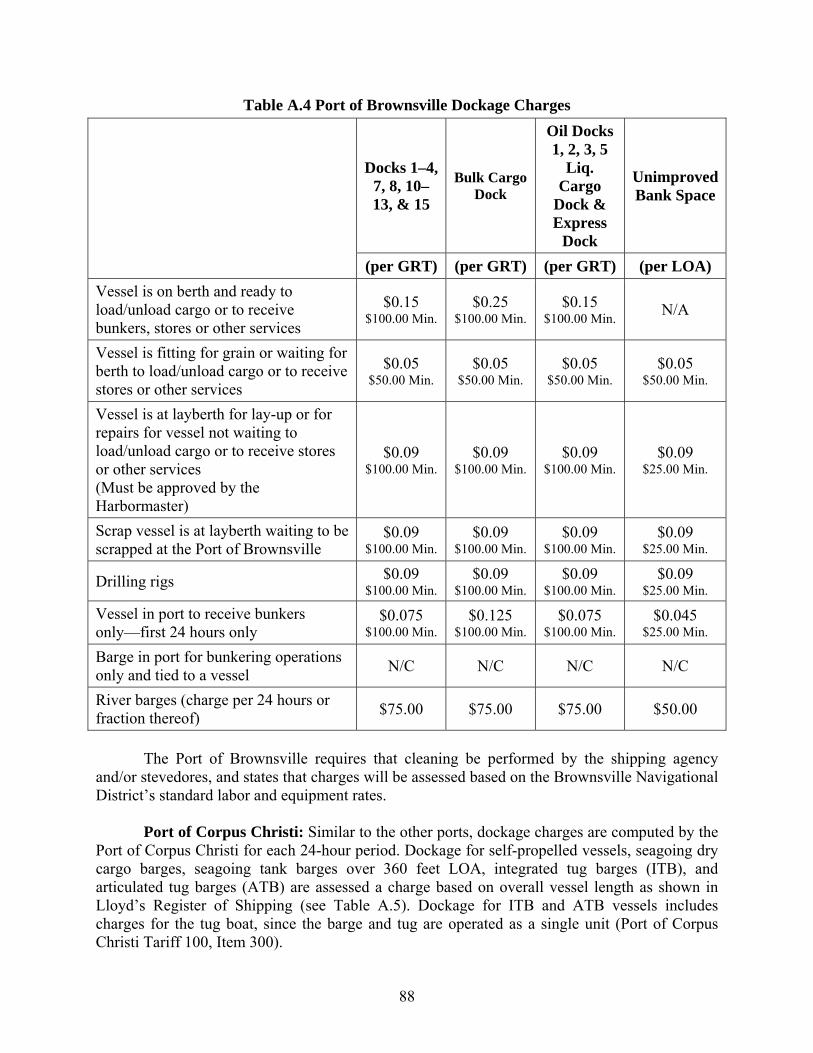
88
Table A.4 Port of Brownsville Dockage Charges
Docks 1–4,7, 8, 10– 13, & 15
Bulk Cargo Dock
Oil Docks 1, 2, 3, 5
Liq. Cargo
Dock & Express
Dock
Unimproved Bank Space
(per GRT) (per GRT) (per GRT) (per LOA)
Vessel is on berth and ready to load/unload cargo or to receive bunkers, stores or other services
$0.15 $100.00 Min.
$0.25 $100.00 Min.
$0.15 $100.00 Min. N/A
Vessel is fitting for grain or waiting for berth to load/unload cargo or to receive stores or other services
$0.05 $50.00 Min.
$0.05 $50.00 Min.
$0.05 $50.00 Min.
$0.05 $50.00 Min.
Vessel is at layberth for lay-up or for repairs for vessel not waiting to load/unload cargo or to receive stores or other services (Must be approved by the Harbormaster)
$0.09 $100.00 Min.
$0.09 $100.00 Min.
$0.09 $100.00 Min.
$0.09 $25.00 Min.
Scrap vessel is at layberth waiting to be scrapped at the Port of Brownsville
$0.09 $100.00 Min.
$0.09 $100.00 Min.
$0.09 $100.00 Min.
$0.09 $25.00 Min.
Drilling rigs $0.09 $100.00 Min.
$0.09 $100.00 Min.
$0.09 $100.00 Min.
$0.09 $25.00 Min.
Vessel in port to receive bunkers only—first 24 hours only
$0.075 $100.00 Min.
$0.125 $100.00 Min.
$0.075 $100.00 Min.
$0.045 $25.00 Min.
Barge in port for bunkering operations only and tied to a vessel
N/C N/C N/C N/C
River barges (charge per 24 hours or fraction thereof)
$75.00 $75.00 $75.00 $50.00
The Port of Brownsville requires that cleaning be performed by the shipping agency
and/or stevedores, and states that charges will be assessed based on the Brownsville Navigational District’s standard labor and equipment rates.
Port of Corpus Christi: Similar to the other ports, dockage charges are computed by the
Port of Corpus Christi for each 24-hour period. Dockage for self-propelled vessels, seagoing dry cargo barges, seagoing tank barges over 360 feet LOA, integrated tug barges (ITB), and articulated tug barges (ATB) are assessed a charge based on overall vessel length as shown in Lloyd’s Register of Shipping (see Table A.5). Dockage for ITB and ATB vessels includes charges for the tug boat, since the barge and tug are operated as a single unit (Port of Corpus Christi Tariff 100, Item 300).
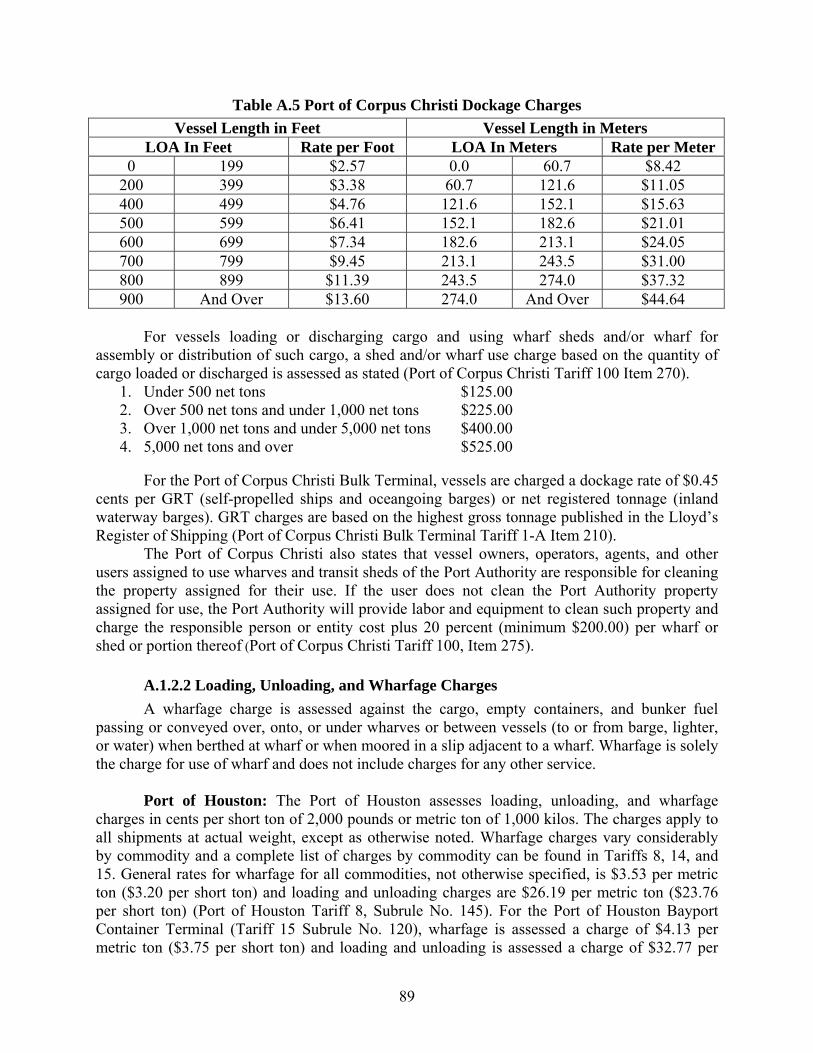
89
Table A.5 Port of Corpus Christi Dockage Charges
Vessel Length in Feet Vessel Length in Meters LOA In Feet Rate per Foot LOA In Meters Rate per Meter
0 199 $2.57 0.0 60.7 $8.42 200 399 $3.38 60.7 121.6 $11.05 400 499 $4.76 121.6 152.1 $15.63 500 599 $6.41 152.1 182.6 $21.01 600 699 $7.34 182.6 213.1 $24.05 700 799 $9.45 213.1 243.5 $31.00 800 899 $11.39 243.5 274.0 $37.32 900 And Over $13.60 274.0 And Over $44.64
For vessels loading or discharging cargo and using wharf sheds and/or wharf for
assembly or distribution of such cargo, a shed and/or wharf use charge based on the quantity of cargo loaded or discharged is assessed as stated (Port of Corpus Christi Tariff 100 Item 270).
1. Under 500 net tons $125.00 2. Over 500 net tons and under 1,000 net tons $225.00 3. Over 1,000 net tons and under 5,000 net tons $400.00 4. 5,000 net tons and over $525.00
For the Port of Corpus Christi Bulk Terminal, vessels are charged a dockage rate of $0.45
cents per GRT (self-propelled ships and oceangoing barges) or net registered tonnage (inland waterway barges). GRT charges are based on the highest gross tonnage published in the Lloyd’s Register of Shipping (Port of Corpus Christi Bulk Terminal Tariff 1-A Item 210).
The Port of Corpus Christi also states that vessel owners, operators, agents, and other users assigned to use wharves and transit sheds of the Port Authority are responsible for cleaning the property assigned for their use. If the user does not clean the Port Authority property assigned for use, the Port Authority will provide labor and equipment to clean such property and charge the responsible person or entity cost plus 20 percent (minimum $200.00) per wharf or shed or portion thereof (Port of Corpus Christi Tariff 100, Item 275).
A.1.2.2 Loading, Unloading, and Wharfage Charges
A wharfage charge is assessed against the cargo, empty containers, and bunker fuel passing or conveyed over, onto, or under wharves or between vessels (to or from barge, lighter, or water) when berthed at wharf or when moored in a slip adjacent to a wharf. Wharfage is solely the charge for use of wharf and does not include charges for any other service.
Port of Houston: The Port of Houston assesses loading, unloading, and wharfage
charges in cents per short ton of 2,000 pounds or metric ton of 1,000 kilos. The charges apply to all shipments at actual weight, except as otherwise noted. Wharfage charges vary considerably by commodity and a complete list of charges by commodity can be found in Tariffs 8, 14, and 15. General rates for wharfage for all commodities, not otherwise specified, is $3.53 per metric ton ($3.20 per short ton) and loading and unloading charges are $26.19 per metric ton ($23.76 per short ton) (Port of Houston Tariff 8, Subrule No. 145). For the Port of Houston Bayport Container Terminal (Tariff 15 Subrule No. 120), wharfage is assessed a charge of $4.13 per metric ton ($3.75 per short ton) and loading and unloading is assessed a charge of $32.77 per
90
metric ton (29.73 per short ton). The Port of Houston charges only once for cargo discharged by a vessel to a wharf for transshipment to another vessel if (a) the cargo is transshipped within 30 days; (b) the same shipper and consignee appear on the bill of lading of the vessel to which the cargo is transshipped as appeared on the bill of lading covering the shipment prior to discharge to the wharf; and (c) the cargo has not been removed from the wharf while awaiting transshipment (Port of Houston Tariff 8, Subrule No. 143).
Port of Brownsville: The Port of Brownsville also assesses a wharfage charge based on a
metric short ton system (2,204.6 lbs.) that varies considerably by commodity. The general wharfage charge for all commodities, not otherwise specified, is $1.37 per metric ton (Port of Brownsville Tariff No. 6, Item 275). Wharfage charges for loading and unloading containers are as follows (Port of Brownsville Tariff 6 – Cargo Item 279):
1. All Loaded Containers: 20 ft. and 40 ft. Containers $25.00 per container 2. All Empty Containers: 20 ft. and 40 ft. Containers $2.00 per container
For cargo discharged from vessels and remaining on the wharf for transshipment by
vessel, the Port of Brownsville assesses a wharfage charge only on the inward movement if it is reshipped in 30 days under the same ownership. If cargo remains on the wharves more than 30 days, inward and outward wharfage will be assessed.
Port of Corpus Christi: For the Port of Corpus Christi, wharfage rates for all
commodities not otherwise specified is $3.10 per net ton (2,000 lbs.) or $2.74 per cubic meter (Port of Corpus Christi Tariff 100, Item 500). Loading and unloading of rail cars and trucks is performed by licensed firms authorized to work at the Port of Corpus Christi and charges are quoted upon request. For Corpus Christi’s bulk cargo terminal, wharfage on dry bulk commodities handled at the terminal are assessed a wharfage charge of $1.28 per net ton ($1.41 per metric ton) on all commodities (Port of Corpus Christi Bulk Terminal Tariff 1-A, Item 200). The Port of Corpus Christi offers free wharfage for cargo discharged from vessels for transshipment to another vessel over the Port Authority’s General Cargo Docks if inward wharfage has already been paid and if reloaded within 30 days (Port of Corpus Christi Tariff 100, Item 265).
A.1.3 Cargo Operations
Cargo operations encompass activities and services utilized in the handling of cargo though the port including cargo transfer, storage, and terminal use. Cargo transfer services are usually provided by authorized stevedoring companies and charges are quoted by the stevedoring companies upon request.
A.1.3.1 Storage
Port of Houston: The Port of Houston provides a free time period for wharf demurrage after which charges are calculated for the period that the property remains on the wharves and premises of the Port Authority (Port of Houston Tariff 8, Subrule No. 137).
Free time periods are provided as follows:
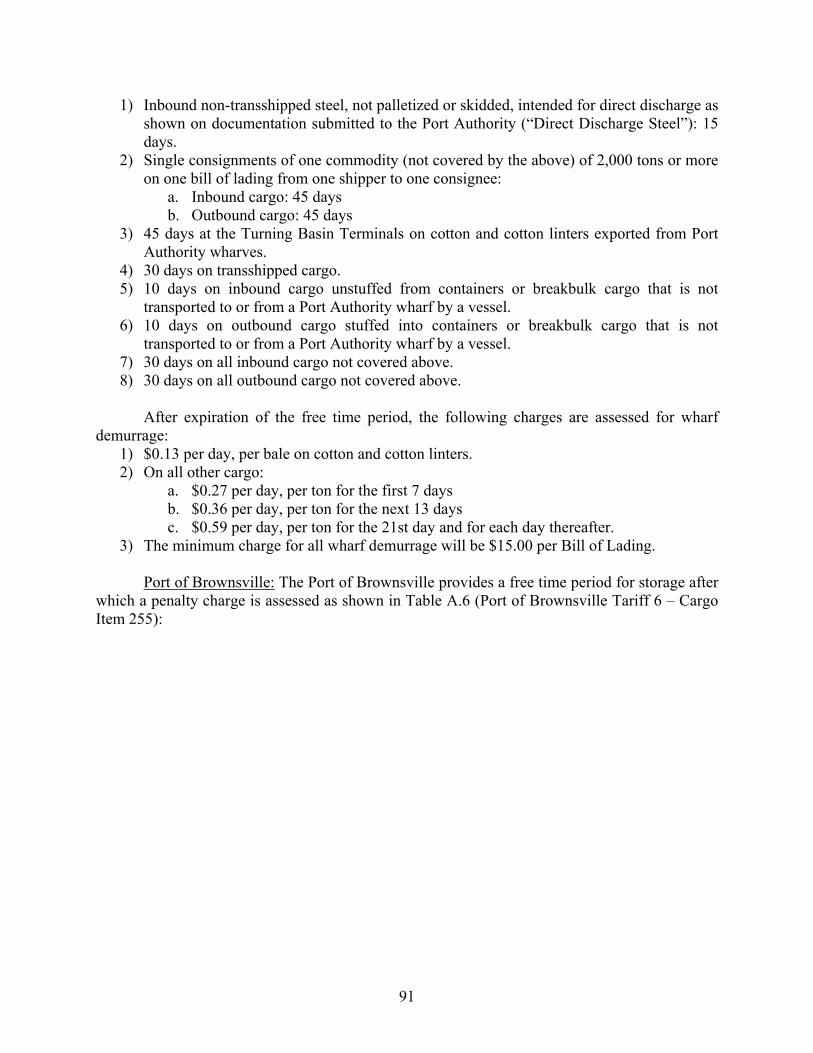
91
1) Inbound non-transshipped steel, not palletized or skidded, intended for direct discharge as shown on documentation submitted to the Port Authority (“Direct Discharge Steel”): 15 days.
2) Single consignments of one commodity (not covered by the above) of 2,000 tons or more on one bill of lading from one shipper to one consignee:
a. Inbound cargo: 45 days b. Outbound cargo: 45 days
3) 45 days at the Turning Basin Terminals on cotton and cotton linters exported from Port Authority wharves.
4) 30 days on transshipped cargo. 5) 10 days on inbound cargo unstuffed from containers or breakbulk cargo that is not
transported to or from a Port Authority wharf by a vessel. 6) 10 days on outbound cargo stuffed into containers or breakbulk cargo that is not
transported to or from a Port Authority wharf by a vessel. 7) 30 days on all inbound cargo not covered above. 8) 30 days on all outbound cargo not covered above.
After expiration of the free time period, the following charges are assessed for wharf
demurrage: 1) $0.13 per day, per bale on cotton and cotton linters. 2) On all other cargo:
a. $0.27 per day, per ton for the first 7 days b. $0.36 per day, per ton for the next 13 days c. $0.59 per day, per ton for the 21st day and for each day thereafter.
3) The minimum charge for all wharf demurrage will be $15.00 per Bill of Lading.
Port of Brownsville: The Port of Brownsville provides a free time period for storage after which a penalty charge is assessed as shown in Table A.6 (Port of Brownsville Tariff 6 – Cargo Item 255):
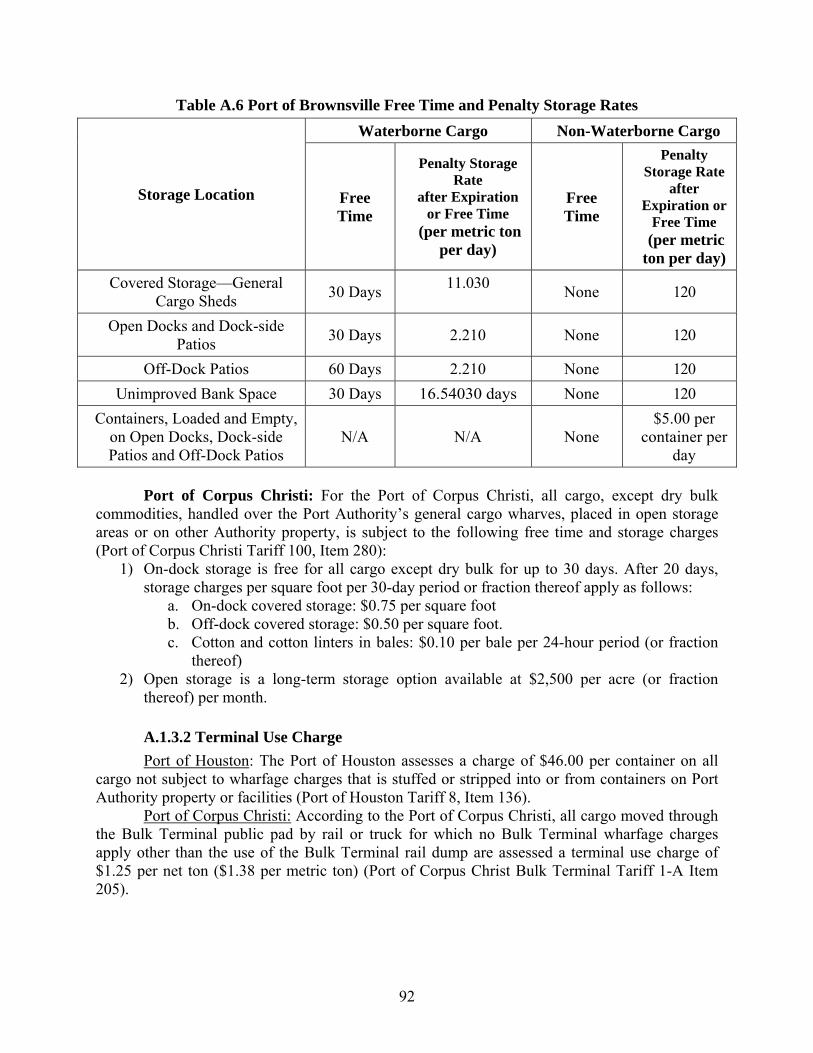
92
Table A.6 Port of Brownsville Free Time and Penalty Storage Rates
Storage Location
Waterborne Cargo Non-Waterborne Cargo
Free Time
Penalty Storage Rate
after Expiration or Free Time
(per metric ton per day)
Free Time
Penalty Storage Rate
after Expiration or
Free Time (per metric ton per day)
Covered Storage—General Cargo Sheds
30 Days 11.030
None 120
Open Docks and Dock-side Patios
30 Days 2.210 None 120
Off-Dock Patios 60 Days 2.210 None 120
Unimproved Bank Space 30 Days 16.54030 days None 120
Containers, Loaded and Empty, on Open Docks, Dock-side Patios and Off-Dock Patios
N/A N/A None $5.00 per
container per day
Port of Corpus Christi: For the Port of Corpus Christi, all cargo, except dry bulk
commodities, handled over the Port Authority’s general cargo wharves, placed in open storage areas or on other Authority property, is subject to the following free time and storage charges (Port of Corpus Christi Tariff 100, Item 280):
1) On-dock storage is free for all cargo except dry bulk for up to 30 days. After 20 days, storage charges per square foot per 30-day period or fraction thereof apply as follows:
a. On-dock covered storage: $0.75 per square foot b. Off-dock covered storage: $0.50 per square foot. c. Cotton and cotton linters in bales: $0.10 per bale per 24-hour period (or fraction
thereof) 2) Open storage is a long-term storage option available at $2,500 per acre (or fraction
thereof) per month.
A.1.3.2 Terminal Use Charge
Port of Houston: The Port of Houston assesses a charge of $46.00 per container on all cargo not subject to wharfage charges that is stuffed or stripped into or from containers on Port Authority property or facilities (Port of Houston Tariff 8, Item 136).
Port of Corpus Christi: According to the Port of Corpus Christi, all cargo moved through the Bulk Terminal public pad by rail or truck for which no Bulk Terminal wharfage charges apply other than the use of the Bulk Terminal rail dump are assessed a terminal use charge of $1.25 per net ton ($1.38 per metric ton) (Port of Corpus Christ Bulk Terminal Tariff 1-A Item 205).
93
A.1.4 Other Business
Other businesses refer to the provision of utilities such as water, bunkers, fuel oil, and electricity. There are also charges for services and provisions not captured in the sections above, such as fumigation, failure to vacate berth, pallet use charges, checking, receiving and stacking cargo, standby dockage, facility use fees, trimming of cargo, standby labor, and harbor security fees, handling of fire or water damaged cargo, fuel surcharge, property damage etc. These charges are relatively minor in comparison with the charges described above.
A.1.4.1 Harbor Safety Fee
Port of Houston: The Port of Houston assesses a Port Security Fee for commercial vessels and cargo movements at the following rate (Port of Houston Tariff 8, Subrule No. 051):
1) Vessels (including, without limitation, barges): 8 percent of total dockage assessed per port call
2) Cargo (applicable only to cargo loaded or discharged at Port Authority berths or wharves):
a. Break-bulk: $0.47 per ton (2000 lbs.) b. Bulk cargo (dry or liquid): $0.0375 per ton c. Containers: $3.50 per loaded container d. Vehicles: $1.00 per unit
Port of Brownsville: The Port of Brownsville assesses a security surcharge fee against
cargo on a per unit basis (Port of Brownsville Tariff 6 – Cargo Item 277). The security surcharge is in addition to all other fees and is as follows:
1. Vessels and barges: 6 percent of total dockage assessed per port call 2. Security Surcharge—Cargo
a. Break-bulk $0.0275 per metric ton b. Bulk $0.0275 per metric ton c. Liquid Bulk $0.0275 per metric ton d. Containers $2.600 per box e. Vehicles $5.000 per vehicle f. Heavy Lift/Project Cargo $0.130 per metric ton
Port of Corpus Christi: The Port of Corpus charges a Harbor Safety Fee (HSF) “to
assist in defraying the administration, maintenance and operation expenses of a fire response vessel and marine patrol vessels, including personnel and equipment.”
For commercial ships and barges entering the Authority’s Waterways, the HSF is as follows:
1. Ships………$2,032.00 2. Barges…….$230.00
In addition, the Port of Corpus Christi states that “for commercial cargo barges that are in
the Authority’s Waterways for a period of thirty (30) consecutive days or more without leaving the Authority’s Waterways, an HSF of $920.00 will be assessed [monthly] for each continuous 30-day period” (Port of Corpus Christi Tariff 100 Item 301).
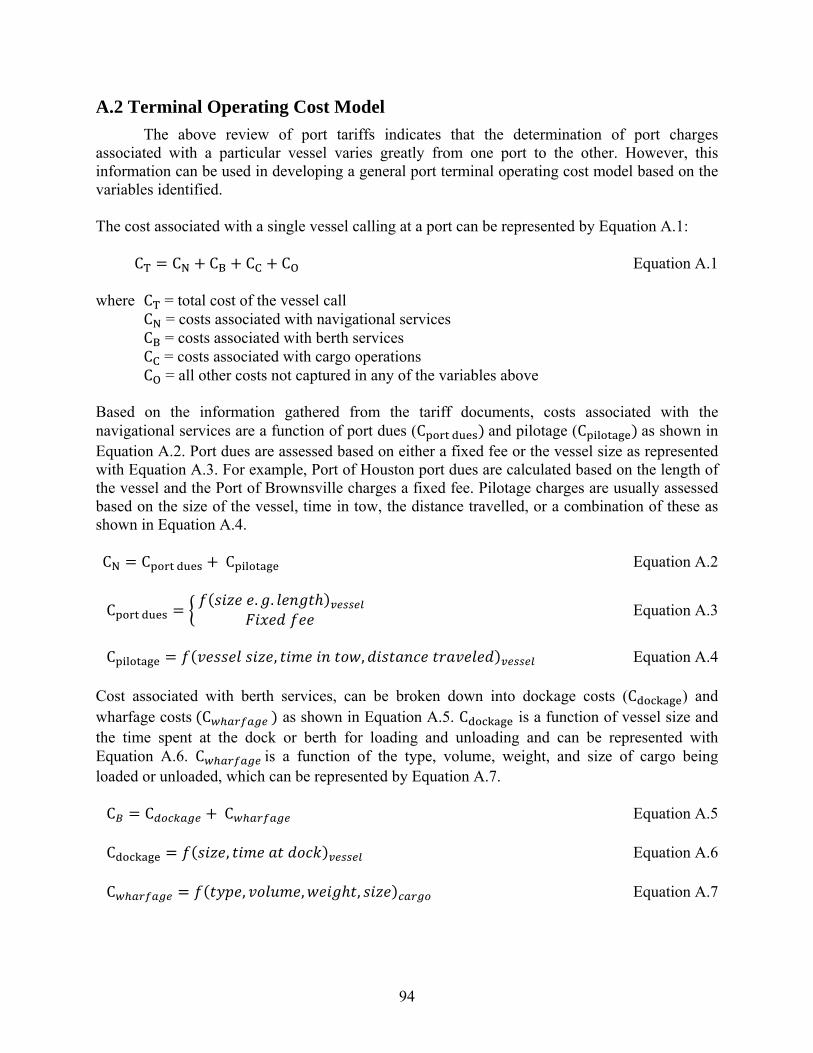
94
A.2 Terminal Operating Cost Model
The above review of port tariffs indicates that the determination of port charges associated with a particular vessel varies greatly from one port to the other. However, this information can be used in developing a general port terminal operating cost model based on the variables identified. The cost associated with a single vessel calling at a port can be represented by Equation A.1: C = C + C + C + C Equation A.1 where C = total cost of the vessel call C = costs associated with navigational services C = costs associated with berth services C = costs associated with cargo operations C = all other costs not captured in any of the variables above Based on the information gathered from the tariff documents, costs associated with the navigational services are a function of port dues (C )and pilotage (C )as shown in Equation A.2. Port dues are assessed based on either a fixed fee or the vessel size as represented with Equation A.3. For example, Port of Houston port dues are calculated based on the length of the vessel and the Port of Brownsville charges a fixed fee. Pilotage charges are usually assessed based on the size of the vessel, time in tow, the distance travelled, or a combination of these as shown in Equation A.4. C = C +C Equation A.2
C = ( . . ℎ) Equation A.3
C = ( , , ) Equation A.4 Cost associated with berth services, can be broken down into dockage costs (C ) and wharfage costs(C ) as shown in Equation A.5. C is a function of vessel size and the time spent at the dock or berth for loading and unloading and can be represented with Equation A.6. C is a function of the type, volume, weight, and size of cargo being loaded or unloaded, which can be represented by Equation A.7. C = C +C Equation A.5
C = ( , ) Equation A.6 C = ( , , ℎ , ) Equation A.7
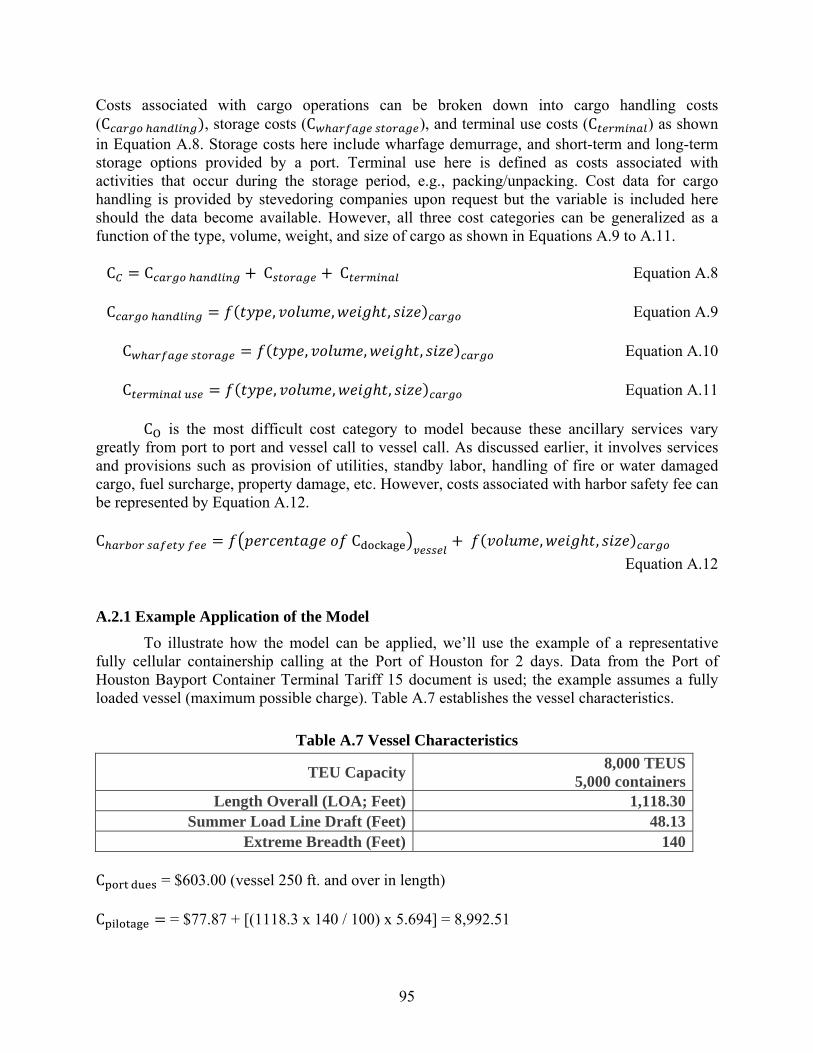
95
Costs associated with cargo operations can be broken down into cargo handling costs (C ), storage costs (C ), and terminal use costs (C ) as shown in Equation A.8. Storage costs here include wharfage demurrage, and short-term and long-term storage options provided by a port. Terminal use here is defined as costs associated with activities that occur during the storage period, e.g., packing/unpacking. Cost data for cargo handling is provided by stevedoring companies upon request but the variable is included here should the data become available. However, all three cost categories can be generalized as a function of the type, volume, weight, and size of cargo as shown in Equations A.9 to A.11. C = C +C +C Equation A.8
C = ( , , ℎ , ) Equation A.9 C = ( , , ℎ , ) Equation A.10 C = ( , , ℎ , ) Equation A.11
C is the most difficult cost category to model because these ancillary services vary greatly from port to port and vessel call to vessel call. As discussed earlier, it involves services and provisions such as provision of utilities, standby labor, handling of fire or water damaged cargo, fuel surcharge, property damage, etc. However, costs associated with harbor safety fee can be represented by Equation A.12. C = C + ( , ℎ , )
Equation A.12
A.2.1 Example Application of the Model
To illustrate how the model can be applied, we’ll use the example of a representative fully cellular containership calling at the Port of Houston for 2 days. Data from the Port of Houston Bayport Container Terminal Tariff 15 document is used; the example assumes a fully loaded vessel (maximum possible charge). Table A.7 establishes the vessel characteristics.
Table A.7 Vessel Characteristics
TEU Capacity 8,000 TEUS5,000 containers
Length Overall (LOA; Feet) 1,118.30 Summer Load Line Draft (Feet) 48.13
Extreme Breadth (Feet) 140 C = $603.00 (vessel 250 ft. and over in length) C = = $77.87 + [(1118.3 x 140 / 100) x 5.694] = 8,992.51
96
C = $ ../ × 1,118.30 .× 2 = $33,862.12
C = $61.23 x 5,000 = 306,150.00 C = throughput charge of ($100 x 5,000) = $500,000 C = free if the container remains in storage area 7 days or less. C = excluded C = (0.08 ∗ $33,862) + ($3.50 × 5000) =$20,208.96 = $603.00 + 8,992.51 + $33,862.12 + $306,150.00 + $500,000.00 + 20,208.96 = $869,816.59
Total charges exclude items such as charges for extra cargo handling, terminal use, and other services and provisions.
A.3 Summary
As stated earlier, determining port charges associated with a particular vessel varies greatly from one port to the other. The complexity stems from the sheer number of port operations associated with a single vessel calling at a port. This first attempt at a vessel terminal operating cost model seeks to generalize costs associated with a ship calling at a port. Further review and validation of the generalized models is required in order to accurately report on identified charges. Nonetheless, the model seeks to provide an opportunity for transportation stakeholders to compare costs associated with container terminal operations and factors that influence shipping costs.
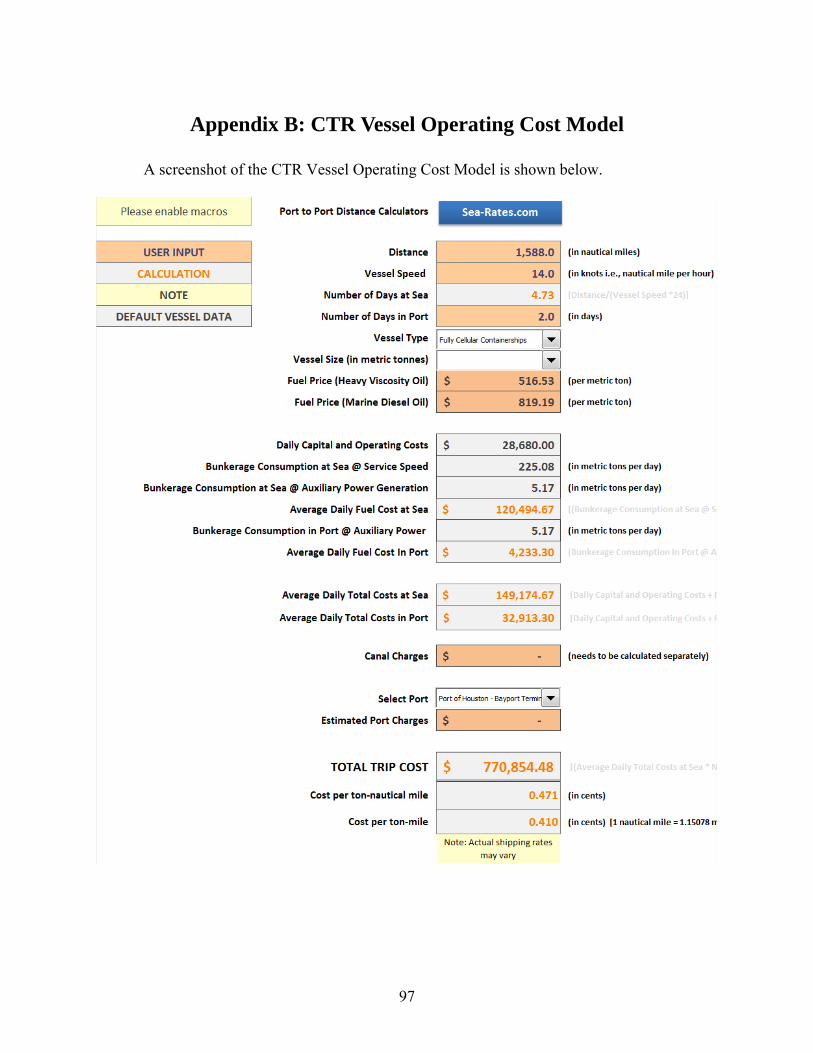
97
Appendix B: CTR Vessel Operating Cost Model
A screenshot of the CTR Vessel Operating Cost Model is shown below.
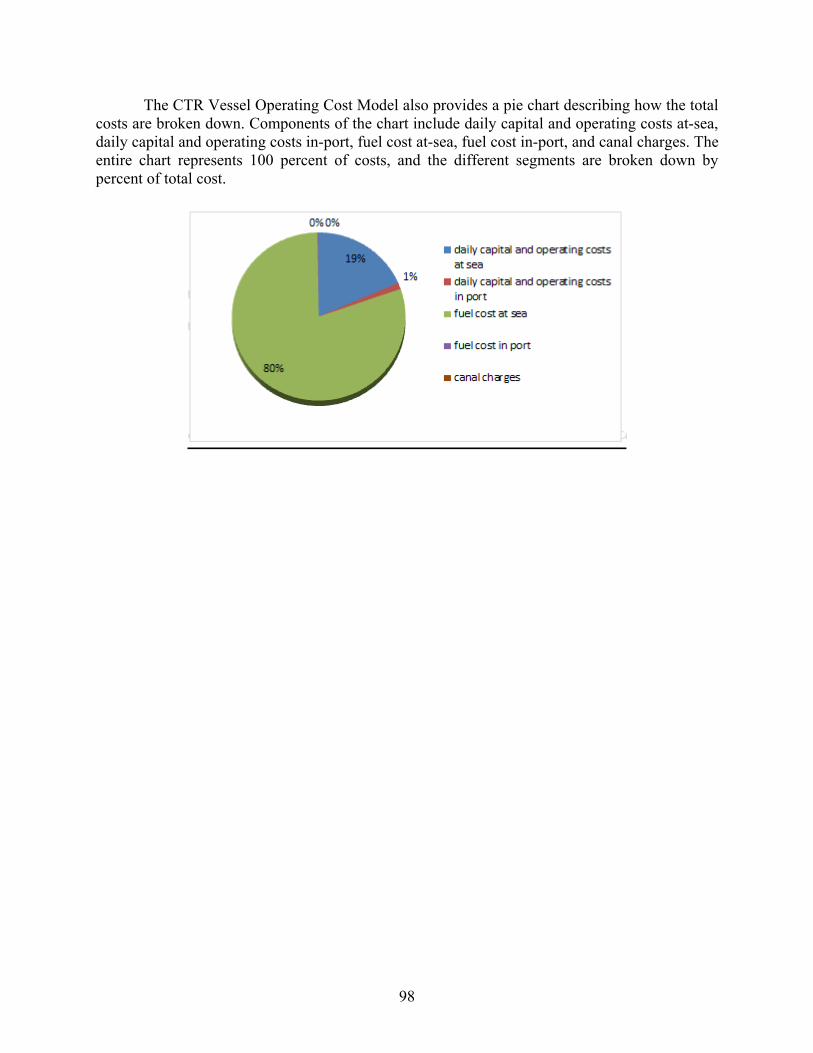
98
The CTR Vessel Operating Cost Model also provides a pie chart describing how the total costs are broken down. Components of the chart include daily capital and operating costs at-sea, daily capital and operating costs in-port, fuel cost at-sea, fuel cost in-port, and canal charges. The entire chart represents 100 percent of costs, and the different segments are broken down by percent of total cost.

99
Appendix C: US Gulf Ports Containerized Ocean Trade with the West Coast of South America
Table C.1: U.S. Gulf Ports Containerized Ocean Trade with the West Coast of South America—Exports89
2011 vs. 2008, 2009, and 2010, in laden TEUs
U.S. GULF EXPORTS
2011 MARKET
SHARE
JANUARY–DECEMBER TEU VOLUME % VOLUME
CHANGE
2008 2009 2010 2011 FROM
2008 FROM
2010
TOTAL TO WEST COAST OF SOUTH AMERICA 100.0%
103,452 105,129 123,000 130,270 25.9% 5.9%
1 COLOMBIA 30.8% 32,839 46,572 47,084 40,138 22.2% -14.8% 2 CHILE 27.8% 27,003 21,067 28,670 36,165 33.9% 26.1% 3 PERU 26.1% 29,369 23,817 31,767 34,015 15.8% 7.1% 4 ECUADOR 14.8% 14,065 13,563 15,156 19,292 37.2% 27.3% 5 BOLIVIA 0.5% 176 109 322 660
FROM U.S. GULF PORTS
1 HOUSTON 76.5% 83,931 82,809 93,029 99,718 18.8% 7.2% 2 NEW ORLEANS 19.3% 18,668 20,118 25,064 25,137 34.7% 0.3% 3 MOBILE 2.9% 554 1,419 3,274 3,796 585.2% 15.9% 4 FREEPORT, TX 1.2% 64 182 1,543 1,535 2298.4% -0.5% 5 GALVESTON 0.0% 3 4 29 6 LAKE CHARLES,
LA 0.0% 21
7 GULFPORT 0.0% 19 18 8 TAMPA 0.0% 17 96 7 14 9 PANAMA CITY 0.0% 186 500 10 2 10 PASCAGOULA 0.0% 31 46 TOTAL TOP 10 U.S. GULF PORTS 100.0% 103,451 105,127 122,996 130,270 25.9% 5.9%
89 “Growth Compass Points North-South,” Journal of Commerce, June 18, 2012. TEU count includes all international containerized oceanborne cargo loading and discharging at U.S. Gulf ports in trade with the west coast of South America. Data compares volumes from 2008 to 2011 to capture trends before, during, and after the recession. Compiled by Marsha Salisbury, JOC research editor, [email protected] or 973-776-7828. Source: PIERS, www.piers.com, a sister company of The Journal of Commerce and a division of UBM Global Trade.
100
FIRST OVERSEAS DISCHARGE PORT
1 CARTAGENA, COLOMBIA 31.6% 24,136 37,241 37,386 41,171 70.6% 10.1%
2 CALLAO, PERU 17.5% 19,318 19,756 24,047 22,748 17.8% -5.4% 3 VALPARAISO,
CHILE 11.1% 9,062 9,721 15,148 14,427 59.2% -4.8% 4 GUAYAQUIL,
ECUADOR 10.4% 8,541 10,930 11,770 13,510 58.2% 14.8% 5 MANZANILLO,
PANAMA 8.5% 6,318 5,411 8,331 11,067 75.2% 32.8% 6 BARRANQUILLA,
COLOMBIA 3.3% 2,497 2,791 3,336 4,363 74.7% 30.8% 7 ARICA, CHILE 2.4% 2,365 1,416 2,510 3,082 30.3% 22.8% 8 BUENAVENTURA,
COLOMBIA 1.7% 2,258 2,635 2,259 2,250 -0.4% -0.4% 9 CORONEL, CHILE 1.6% 149 355 2,059 480.0% 10 SAN ANTONIO,
CHILE 1.5% 2,951 2,719 1,209 1,916 -35.1% 58.5% TOTAL TOP 10 FIRST DISCHARGE PORTS 89.6% 77,446 92,769 106,352 116,592 50.5% 9.6%
OCEAN CARRIER
1 MSC 30.2% 42,135 31,622 40,493 39,374 -6.6% -2.8% 2 SEABOARD
MARINE 19.4% 20,560 19,176 25,729 25,292 23.0% -1.7% 3 CSAV 12.1% 6,604 16,040 11,672 15,786 139.0% 35.2% 4 HAMBURG SUD 12.0% 11,096 15,856 14,507 15,635 40.9% 7.8% 5 MAERSK LINE 9.3% 9,784 10,407 10,488 12,166 24.3% 16.0% 6 CMA CGM
GROUP 5.5% 74 2,637 6,655 7,104 6.7% 7 CCNI 3.2% 3,505 3,220 4,228 4,160 18.7% -1.6% 8 HAPAG-LLOYD 3.1% 4,673 2,066 3,114 3,994 -14.5% 28.3% 9 INTERMARINE 2.7% 3,245 2,130 3,134 3,523 8.6% 12.4% 10 ISABELLA
SHIPPING 1.2% 112 745 1,504 101.9% TOTAL TOP 10 CARRIERS 98.7% 101,676 103,266 120,765 128,538 26.4% 6.4%
101
Table C.2: U.S. Gulf Ports Containerized Ocean Trade with the West Coast of South America—Imports90
2011 vs. 2008, 2009, and 2010, in laden TEUs.
U.S. GULF IMPORTS
2011 MARKET
SHARE
JANUARY–DECEMBER TEU VOLUME
% VOLUME CHANGE
2008 2009 2010 2011 FROM
2008 FROM
2010
TOTAL FROM WEST COAST OF SOUTH AMERICA 100.0% 36,148 37,799 40,760 41,580 15.0% 2.0% 1 CHILE 37.4% 17,699 15,117 15,302 15,557 -12.1% 1.7% 2 COLOMBIA 36.6% 11,476 15,480 16,289 15,234 32.7% -6.5% 3 ECUADOR 15.0% 2,279 2,984 5,177 6,251 174.3% 20.8% 4 PERU 10.2% 4,296 3,915 3,800 4,247 -1.1% 11.8% 5 BOLIVIA 0.7% 398 303 192 291
TO U.S. GULF PORTS
2011 MARKET SHARE 2008 2009 2010 2011
FROM 2008
FROM 2010
1 HOUSTON 71.1% 23,744 26,340 29,321 29,558 24.5% 0.8% 2 NEW ORLEANS 16.5% 11,933 9,713 7,273 6,851 -42.6% -5.8% 3 GULFPORT 7.9% 239 534 2,787 3,286 1274.9% 17.9% 4 GALVESTON 1.5% 60 71 24 624 5 FREEPORT, TX 1.1% 79 256 521 468 6 MOBILE 0.9% 70 721 295 389 7 LAKE
CHARLES, LA 0.4% 154
8 TAMPA 0.3% 24 12 205 134 9 PORT
MANATEE, FL 0.3% 58 21 116
10 PANAMA CITY, FL
0.0% 94 314
TOTAL TOP 10 U.S. GULF PORTS 100.0% 36,149 37,799 40,761 41,580 15.0% 2.0%
LAST OVERSEAS LOAD PORT
2011 MARKET SHARE 2008 2009 2010 2011
FROM 2008
FROM 2010
1 CARTAGENA, COLOMBIA 36.9% 12,101 15,206 15,233 15,326 26.6% 0.6%
2 CRISTOBAL, PANAMA 18.5% 220 7,235 9,512 7,712 3407.1% -18.9%
3 MANZANILLO, PANAMA 10.9% 2,440 2,830 2,855 4,538 86.0% 58.9%
90 See Footnote 20.
102
LAST OVERSEAS LOAD PORT
2011 MARKET SHARE 2008 2009 2010 2011
FROM 2008
FROM 2010
4 PTO BARRIOS, GUATEMALA 8.9% 102 402 3,275 3,686 3514.1% 12.6%
5 FREEPORT, BAHAMAS 5.4% 13,582 3,951 2,072 2,261 -83.4% 9.1%
6 BARRANQUILLA, COLOMBIA 3.9% 503 840 1,235 1,633 225.0% 32.2%
7 SANTA MARTA, COLOMBIA 2.3% 142 137 557 955
8 PUERTO BOLIVAR, ECUADOR 1.6% 58 24 676
9 KINGSTON, JAMAICA 1.6% 48 871 1,487 657
10 CAUCEDO, DOM. REP. 1.6% 1,905 1,843 1,287 654
TOTAL TOP 10 LAST LOAD PORTS 91.6% 31,043 33,373 37,537 38,098 22.7% 1.5%
OCEAN CARRIER
2011 MARKET SHARE 2008 2009 2010 2011
FROM 2008
FROM 2010
1 MSC 25.7% 15,929 11,651 11,575 10,672 -33.0% -7.8%2 HAMBURG
SUD 14.7% 4,496 9,560 9,518 6,131 36.4% -35.6%3 SEABOARD
MARINE 13.6% 2,793 2,575 4,187 5,644 102.1% 34.8%4 MAERSK LINE 11.1% 3,460 4,105 3,332 4,600 32.9% 38.1%5 GREAT WHITE
FLEET 8.9% 74 402 3,279 3,686 12.4%6 CCNI 5.8% 1,127 1,290 1,685 2,423 115.0% 43.8%7 INTERMARINE 4.5% 964 841 1,194 1,884 95.4 % 57.8%8 CSAV 4.2% 3,132 2,114 1,292 1,760 -43.8% 36.2%9 HAPAG-LLOYD 3.8% 3,469 3,517 2,719 1,578 -54.5% -42.0%10 CMA CGM
GROUP 3.2% 787 1,198 1,314 9.7%TOTAL TOP 10 CARRIERS 95.5% 35,444 36,842 39,979 36,692 12.0% -0.7%