Embed Size (px)
Citation preview
Working Paper No. 102
TRADE IN ENVIRONMENTAL SERVICES: OPPORTUNITIES ANDCONSTRAINTS
Aparna SawhneyRupa Chanda
May 2003
INDIAN COUNCIL FOR RESEARCH ON INTERNATIONAL ECONOMIC RELATIONSCore-6A, 4th Floor, India Habitat Centre, Lodi Road, New Delhi-110 003
website: www.icrier.org
Contents
Foreword................................................................................................................................ i
1. Introduction # ............................................................................................................ 11.1 Definition of Environmental Services.....................................................................21.2 Characteristics of Environmental Services..............................................................41.3 GATS Classification and Coverage of Environmental Services................................51.4 Objective and Outline of the Study.......................................................................10
2. Overview of the Global Environmental Services Sector..................................... 10
2.1 Trade Orientation of the Industry .........................................................................122.2 Privatization and Liberalization of Environmental Services .....................................132.3 Structure of the Environment Services Industry.....................................................17
3. Overview of the Indian Environmental Services Sector..................................... 18
3.1 Size and Nature of the Indian Environment Industry..............................................183.2 Potential Growth Factors in Environmental Services...............................................203.3 Status and Deficiencies in Environmental Services by GATS Subsectors................233.4 Private Participation in Infrastructure Environmental Services.................................263.5 Foreign Investment in the Indian Environment Sector ...........................................293.6 A Case of Liberalization in Municipal Environmental Service ...............................303.7 India’s Trade and Investment Prospects in Environmental Services........................33
4. Domestic and External Constraints ...................................................................... 35
4.1 Domestic Constraints ..........................................................................................364.2 External Constrain ts............................................................................................36
5. Commitments and GATS 2000 Discussions on Environmental Services.......... 38
5.1 Analysis of GATS Commitments in Environmental Services.................................385.2 GATS 2000 Discussions on Environmental Services.............................................415.3 Country Requests to India in Environmental Services............................................42
6. Strategy for the Current Negotiations .................................................................. 43
6.1 Issues to Consider in Liberalizing Environmental Services ....................................446.2 Specific Commitment Strategy.............................................................................45
7. Domestic Reforms and Measures ......................................................................... 48
7.1 Economic Instruments in Pollution Management...................................................497.2 Encouraging Private Investment in Infrastructure Environmental Services................507.3 Ensuring Equity with Efficiency ..........................................................................507.4 Monitoring Firm Behaviour ...................................................................................51
8. Conclusion............................................................................................................... 51
References........................................................................................................................... 53
i
List of Tables
Table 1. The GATS Classification List of Environmental Services..................................6
Table 2. OECD, CPC ver. 1 & GATS Classification of Environmental Services ............7
Table 3. Market Potential in Indian Environment Sector, 1994......................................19
Box 1. Liberalization of Municipal Solid Waste Management in Chennai.................32
Table A1. Salient Indian Environmental Legislation, Rules, and Notifications ................55
Table A2. Annual Environmental Expenditure by Ministry of Environment....................56
Table A3. Approved FDI and FTCs in Environment Sector in India, 1993- 2002............56
Table A4. Environmental Exports (Goods and Services) by Country, 1995 and 1999......57
Table A5. Asian Environmental Imports (Goods and Services), 1995 and 1999 ..............57
Table A6. Imports in Indian Environment Market 2000-02 ..............................................58
Table A7. Foreign Affiliation in the Indian Environment Industry...................................58
i
Foreword
The environmental services sector has been growing rapidly during the last twodecades. Moreover, privatization and increasing outward-orientation of environmentalservices during the 1990s has made this sector an important service sector for negotiationsunder the new round of GATS.
This study explores the nature and structure of the environmental services sector,both globally and in India, with particular focus on recent trends such as privatization andforeign investment in this sector. It also discusses issues of classification and definitionwhich have occupied centre stage in the multilateral negotiations in this sector. The studyassesses the implications of liberalizing environmental services in India, taking intoaccount the country’s strengths, weaknesses, and interests in this sector. Based on thisassessment, it suggests a negotiating strategy for India in environmental services in theongoing GATS 2000 negotiations. Given the special features of this sector, the study alsosuggests domestic reforms and regulations to ensure equity and sustainability along witheconomic efficiency in the provision of environmental services in India.
Dr. Arvind VirmaniDirector & Chief Executive
ICRIER
May 2003
1
1. Introduction#
The environment industry has witnessed rapid growth over the last two decades.Industry surveys in the mid-1990s had estimated that the environment industry wouldincrease from US$469 billion in 1997 to US$600 billion by 2010, representing an averageannual rate of growth of 5%.1 In 2000, the global environment industry was estimated tohave revenue of US$522 billion, of which the environmental services market was valued atabout US$280 billion.
The global environment industry is dominated by developed countries, with the USaccounting for the largest share of this industry at about 50% of the world market,followed by the EU and Japan. During the 1980s, the environment industry (equipment andservices) experienced rapid growth in the developed countries, due to increasedenforcement of environmental regulations (command and control as well as economicinstruments). More recently, however, the industry has shown signs of maturity andstagnation in these countries with growth rates dropping sharply during the 1990s.2 Incontrast, during the 1990s, the market for environmental goods and services in developingcountries has been growing rapidly, with double-digit annual growth.
The major factors responsible for the expansion of the global environment industryinclude the growing awareness of environmental problems and greater enforcement ofenvironmental regulations, besides rapid population growth and urbanization that have putincreased pressure on natural resources. Moreover, technological changes have also madepossible new and innovative ways of dealing with environmental challenges, and increasedglobal competition in this sector.
# We have gained useful insights from discussions with several people. In particular, we would like to
thank Professor Hoda and Dr Arvind Virmani (ICRIER), Professor B.K. Guha (IIT Delhi), Dr. Veena Jha(UNCTAD India), Dr D.K. Biswas (CPCB), Mr. T.K. Bhowmick and Ms. Seema Arora (CII), Mr. AjayMehrotra (BHEL), Mr. Sumanta Chaudhuri and Mr. P.K. Srivastava (Ministry of Commerce). We aregrateful to Mr. I. Srinivas and Mr. Dave of the Foreign Investment Promotion Bureau for providing theforeign investment data. We would also like to thank the participants at the seminar in ICRIER (April2003) for helpful suggestions. Finally, we would like to thank Ms. Sukanya Ghosh and Mr AbhijitSengupta who provided competent research assistance at ICRIER.
1 WTO (1998b).2 For instance, in the US the annual growth rate of the industry that ranged from 10-15% during 1985-
1990, dropped to 2-5% during 1991-1995 and further to a low of 1.2% in 1996.
2
1.1 Definition of Environmental Services
The environment industry consists of two main segments, namely, the servicesegment and equipment segment.3 This also reflects the legal frameworks of the industry’sglobal trade, in that the GATT covers all environmental goods and the GATS coversenvironmental services. The focus of this study is the environmental services segment.
The distinction between environmental services and goods, though clean on theoutset, may not always be so. There are significant overlaps in activities and often the twosegments are provided on an integrated basis. For instance, technology, designing andengineering of waste treatment system fall under environmental services, but the provisionof these environmental services is often integrated with the provision of the associatedequipment.4 Firms providing environmental goods also provide environmental services asvaried as project design and management, engineering, construction, equipment operation,and maintenance of utility facilities. Moreover, the provision of environmental services canbe embodied in another product, such as computer programme for environment-relatedactivities contained in a computer diskette or a video film containing instructions regardingenvironmental safety. Thus, it is difficult to neatly distinguish between the equipment andservices segments in this sector.
Considering the OECD/Eurostat definition, environmental services consist of thoseactivities, which measure, prevent, limit, and correct environmental damage to air, water,soil, and problems relating to waste, noise, and ecosystems. Alternatively, the USenvironment industry defines environmental services as all revenue generating serviceactivities, which are related to compliance with environmental regulations, environmentalassessment, analysis, and protection, pollution control, waste management, remediation,provision and delivery of environmental resources like water, recovered materials, andenergy, and activities for improving energy and resource efficiency, increasingproductivity, and enabling sustainable economic growth. Thus, broadly speaking,environmental services can be defined as those service activities, which reduceenvironmental risk, minimize pollution, and enable efficient resource use.
The OECD definition of environmental services describes the coverage ofenvironmental services in terms of groups of activities and in terms of core and non-core
3 The Environmental Business International Inc. (San Diego, CA) distinguishes three sectors in the
environment market: services, equipment and resources, based on the US Standard IndustryClassification system. This is worth noting, since the sizes of the environment market and components asestimated by this agency is widely quoted in the literature. The services revenue pertain to fees paid forservices like waste treatment, waste management, remedial services, consulting, engineering, testing andanalytical services. Equipment revenues are sales of hardware, and resources are sales of material, wateror energy. The OECD/ Eurostat classification, discussed later in this paper, includes “resources” underthe services sector.
4 Of course there are environmental services that do not involve any complementary use of any otherproduct, like advice on environmental standards/ environmental law, or environmental information anddata analysis.
3
areas of activity within each of these groups. The three broad groups of activities in thissector are as follows5:
The first is the pollution management group which consists of activities such as airpollution control, waste water management, solid waste management, remediation, cleanupof soil and water, noise and vibration abatement, environmental monitoring, analysis,assessment, environmental research and development, and environmental construction andengineering. For instance, waste management services include core activities such ascollection, transport and landfill operations, waste to energy conversion services, recycling,industrial resource recovery, and waste reduction services. In addition, there are non-coreactivities such as ecological consulting, legal, land use advisory and analytical services,which are also relevant to this group.
The second set of activities falls under the cleaner technology group. Theseactivities are aimed at eliminating or reducing the impact of technologies, processes, andproducts. These include activities such as design of new processes and products,environmental research and development, and environmental monitoring and impactassessment. Again, non-core areas such as consulting, engineering, technical analysis andtesting are relevant to this group of activities.
The third set of activities falls under the resource management group. This groupincludes activities that enable efficient and sustainable use of resources, for instance, solidwaste recycling and resource recovery relating to disposal, management and recyclingservices.
The importance of the cleaner technology and resource management group ofactivities is on the rise, due to the recent shift in focus from end-of-pipe solutions towardsprevention and control of environmental pollution. This paradigm shift has contributed tothe increasing importance of the environmental services sector. The growing significanceof the environmental services industry can also be traced to the privatization of certaintraditional environmental services like water, wastewater treatment and municipal solidwaste management services.
There is also a growing role of service activities beyond the traditional coreenvironmental services. Although traditional activities such as waste management, watertreatment, refuse disposal, and pollution abatement activities dominate the sector, othernon-core services have also gained importance. These new services include those relatingto compliance with environmental legislation and remediation, support services likeenvironmental lab testing, monitoring, legal, consulting, auditing, research anddevelopment, strategic environmental management services, and consulting andengineering support services for building of environmental infrastructure. The inclusion ofthese non-traditional or non-core environmental services has led to an expansion of theenvironmental services sector.
5 Based on Note by Secretariat WT/CTE/W/67/Add.1 (WTO 1998b).
4
1.2 Characteristics of Environmental Services
The environmental services sector has three important characteristics. The firstimportant characteristic is that it overlaps with activities in just about all other sectors ofthe economy. For instance, the sector overlaps with activities in sectors as diverse asarchitecture services, construction and related engineering services, technical analysisservices, auditing and risk assessment, research and development, and consulting services.As a result, the range of establishments and occupations that are relevant to theenvironmental services sector is quite large and diverse. The range of occupations includes,for instance, environmental impact assessors, environmental consultants, ecologicaladvisors, landscape consultants and urban planners, environmental managementconsultants, environmental law counsellors, and ecological marketing advisers. Thisoverlap is due to the fact that activities within the environmental services sector, unlikethose in other sectors, are meant to internalize the environmental costs of economicactivities into the economic system.
A second important characteristic of this sector is that the consumption of severalenvironmental services has properties of public goods, and this makes pricing based onconsumer use difficult.6 Hence, considerations of equity, universal provision, andaffordable access are very important in this sector.
The third important characteristic is that the provision of several environmentalservices typically requires large investment to ensure that collection and distributionnetworks reach the entire population (e.g. sewerage system network). This featuresupports the emergence of natural monopoly for efficiency in the provision ofenvironmental services requiring large capital investment (i.e. to minimize the cost of perunit provision of the service).
The public good nature of environmental services, coupled with its characteristic ofnatural monopoly means that the public sector is the primary provider of these services.Thus several environmental services including, sewage and refuse disposal, collection ofgarbage, cleaning of roads, parks and lakes, provision of (tapped) drinking water, havebeen traditionally provided by local government bodies. These are all services which areessential for ensuring a basic quality of life to the public.
Given the public monopoly characteristic of many environmental services,opportunities for trade and foreign investment in this sector have traditionally been limited.However, in the last decade, the sector has undergone significant changes, with
6 It may be noted, however, that environmental services are not pure public goods. The classical definition
of pure public goods is based on certain properties as opposed to those of private goods. These include,non-rivalry in consumption (consumption by one individual does not affect the consumption of others),non-excludability (once provided, it is hard to exclude others from consuming the good), and non-divisibility (the good can be provided to an additional person at no extra cost). Excludability in theprovision of environmental services however could be introduced (e.g. disconnecting water supply to anindividual household for non-payment), and rivalry in consumption also exists (due to congestion in use).
5
deregulation and privatization of many activities and a growing role for private sectorparticipation. Increasingly, across developed and developing countries, regulated privateownership is being preferred to public monopoly in many environmental service activities.For instance, there is a trend towards the privatization of environmental infrastructuresegments such as solid waste management, water treatment, and water utilities. The modeof operations and delivery is also undergoing change, as firms are increasingly providingintegrated packages, which include elements such as designing, building, managing, andeven ownership of the infrastructure.7 As a result, there is growing scope for competition,and foreign provision via commercial presence and via movement of persons is likely tobecome increasingly important in future.
The increased outward orientation of the environmental services industry in the1990s is indicated by the fact that export revenues of the environment industry as a wholeconstitute about 15-20% of the total output produced in Japan and Western Europe andabout 10% for the US industry. In the US, export revenue growth represented more than50% of the growth of the U.S. environment industry during 1996-97.8
The market for environmental services in developing countries like India has beengrowing due to increased environmental regulations, urbanization, and industrialization. In2001, about 28% of the billion plus Indian population (about 285 million) were living incities and the proportion of urban population is expected to further increase to 40% by2021. Moreover, enhancement in the set of domestic environmental regulations,liberalization and increased private participation in municipal activities during the lastdecade have increased opportunities for trade in environmental services.
Overall, given the growing trade orientation of the global environment industry(especially in the last decade), and the cross-cutting nature of the sector, environmentservices are set to become one of the fastest growing service sectors in the near future.9
Developing countries are emerging as important markets for environmental services. Firmsin OECD countries are increasingly exporting environmental services to developingcountries as their domestic environment markets reach saturation.
1.3 GATS Classification and Coverage of Environmental Services
Environmental services are one of 12 classified service sectors under the GATSframework. Classification and definitional issues are important in this area given theoverlapping nature of environmental activities. The scope and coverage of environmentalservices in the original GATS classification (contained in WTO 1991) was limited and it isnow pertinent to adopt a broader definition of the sector.
7 For instance, this is happening in the case of water treatment around the world, including in developing
countries like Brazil, Malaysia, and Taiwan.8 Environmental Business International.9 During the last two decades, the growth in trade of commercial services outstripped that of merchandise
trade. In 2001, the export value of commercial services stood at US$1460 billion. For details see WTOInternational Trade Statistics 2002.
6
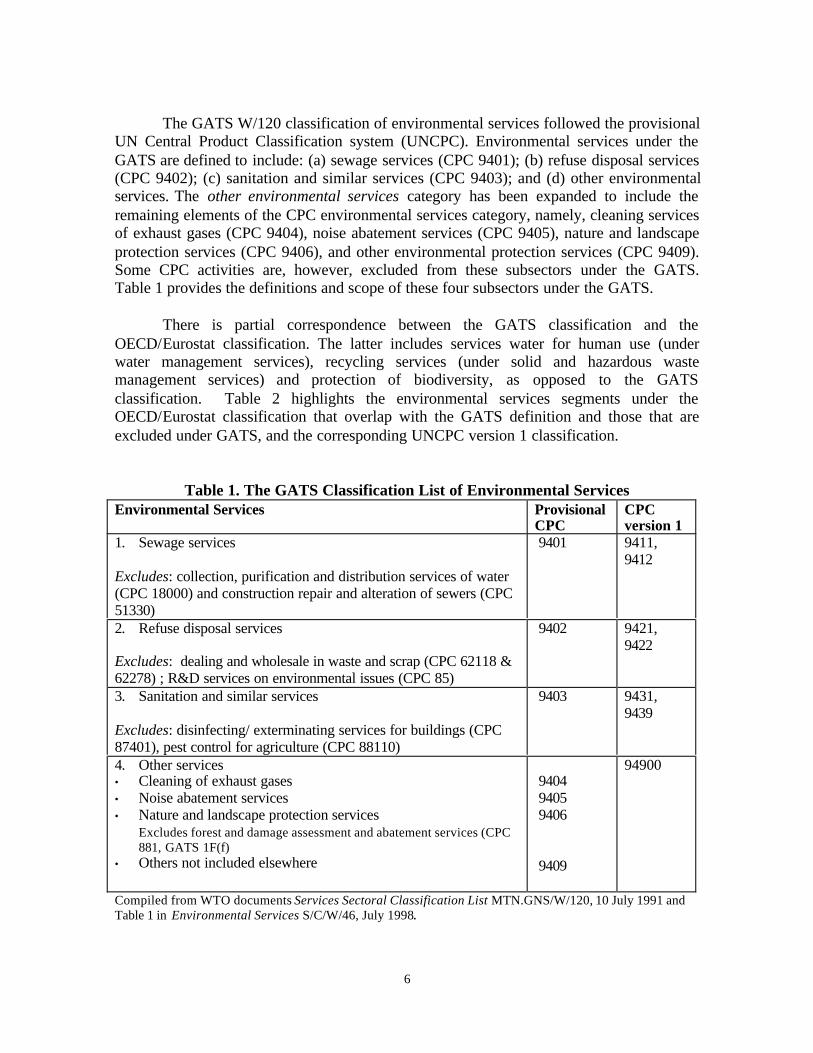
The GATS W/120 classification of environmental services followed the provisionalUN Central Product Classification system (UNCPC). Environmental services under theGATS are defined to include: (a) sewage services (CPC 9401); (b) refuse disposal services(CPC 9402); (c) sanitation and similar services (CPC 9403); and (d) other environmentalservices. The other environmental services category has been expanded to include theremaining elements of the CPC environmental services category, namely, cleaning servicesof exhaust gases (CPC 9404), noise abatement services (CPC 9405), nature and landscapeprotection services (CPC 9406), and other environmental protection services (CPC 9409).Some CPC activities are, however, excluded from these subsectors under the GATS.Table 1 provides the definitions and scope of these four subsectors under the GATS.
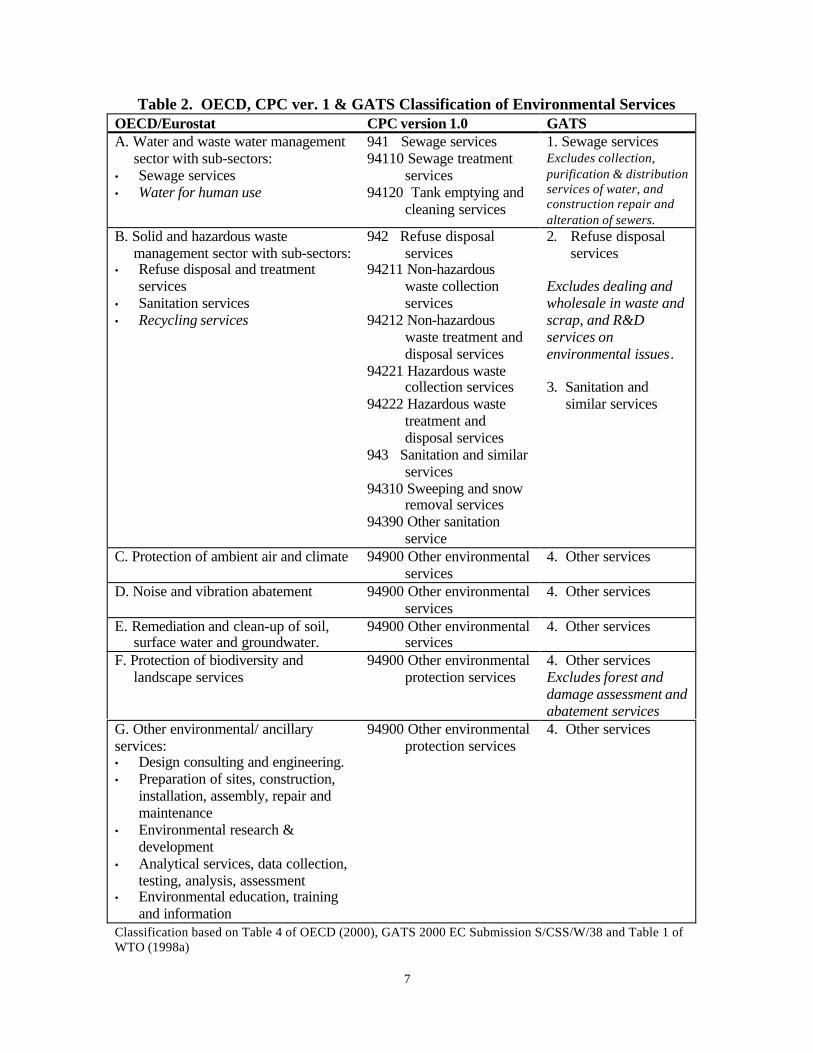
There is partial correspondence between the GATS classification and theOECD/Eurostat classification. The latter includes services water for human use (underwater management services), recycling services (under solid and hazardous wastemanagement services) and protection of biodiversity, as opposed to the GATSclassification. Table 2 highlights the environmental services segments under theOECD/Eurostat classification that overlap with the GATS definition and those that areexcluded under GATS, and the corresponding UNCPC version 1 classification.
Table 1. The GATS Classification List of Environmental ServicesEnvironmental Services Provisional
CPCCPCversion 1
1. Sewage services
Excludes: collection, purification and distribution services of water(CPC 18000) and construction repair and alteration of sewers (CPC51330)
9401 9411,9412
2. Refuse disposal services
Excludes: dealing and wholesale in waste and scrap (CPC 62118 &62278) ; R&D services on environmental issues (CPC 85)
9402 9421,9422
3. Sanitation and similar services
Excludes: disinfecting/ exterminating services for buildings (CPC87401), pest control for agriculture (CPC 88110)
9403 9431,9439
4. Other services• Cleaning of exhaust gases• Noise abatement services• Nature and landscape protection services
Excludes forest and damage assessment and abatement services (CPC881, GATS 1F(f)
• Others not included elsewhere
9404 9405 9406
9409
94900
Compiled from WTO documents Services Sectoral Classification List MTN.GNS/W/120, 10 July 1991 andTable 1 in Environmental Services S/C/W/46, July 1998.
7
Table 2. OECD, CPC ver. 1 & GATS Classification of Environmental ServicesOECD/Eurostat CPC version 1.0 GATSA. Water and waste water management
sector with sub-sectors:• Sewage services• Water for human use
941 Sewage services94110 Sewage treatment
services94120 Tank emptying and
cleaning services
1. Sewage servicesExcludes collection,purification & distributionservices of water, andconstruction repair andalteration of sewers.
B. Solid and hazardous wastemanagement sector with sub-sectors:
• Refuse disposal and treatmentservices
• Sanitation services• Recycling services
942 Refuse disposalservices
94211 Non-hazardouswaste collectionservices
94212 Non-hazardouswaste treatment anddisposal services
94221 Hazardous wastecollection services
94222 Hazardous wastetreatment anddisposal services
943 Sanitation and similarservices
94310 Sweeping and snowremoval services
94390 Other sanitationservice
2. Refuse disposalservices
Excludes dealing andwholesale in waste andscrap, and R&Dservices onenvironmental issues.
3. Sanitation andsimilar services
C. Protection of ambient air and climate 94900 Other environmentalservices
4. Other services
D. Noise and vibration abatement 94900 Other environmentalservices
4. Other services
E. Remediation and clean-up of soil,surface water and groundwater.
94900 Other environmentalservices
4. Other services
F. Protection of biodiversity andlandscape services
94900 Other environmentalprotection services
4. Other servicesExcludes forest anddamage assessment andabatement services
G. Other environmental/ ancillaryservices:• Design consulting and engineering.• Preparation of sites, construction,
installation, assembly, repair andmaintenance
• Environmental research &development
• Analytical services, data collection,testing, analysis, assessment
• Environmental education, trainingand information
94900 Other environmentalprotection services
4. Other services
Classification based on Table 4 of OECD (2000), GATS 2000 EC Submission S/CSS/W/38 and Table 1 ofWTO (1998a)
8
At the time of the initial GATS negotiations during the Uruguay Round, dueattention was not paid to the classification of Environmental Services, as compared toother segments like Financial Services that had elaborate classification of the industrysegments. The scope and coverage of environmental services under the GATS and itsrelationship with the OECD/Eurostat classification system, as outlined in Table 1 and 2above, warrants some discussion:
Firstly, the GATS classification has a focus on traditional end of pipe approachesand not on prevention, thereby failing to reflect the emerging trend in this sector which isfor instance, reflected in the OECD/Eurostat classification. The latter includes servicesrelating to pollution management (including construction and installation of facilities),services relating to cleaner technologies and products, and products reducingenvironmental risk and minimizing pollution, and services for improving resource use. Incontrast, the GATS W/120 classification mainly focuses on pollution control and wastemanagement activities. The last category of “other services”, however, allows for anexpansion in the definition to some extent, for example it can encompass services toprotect the ambient air and climate, and nature protection under the OECD definition.
Secondly, the GATS environmental services classification is somewhat narrow.Under environmental services, the segments cover services that are uniquelyenvironmental and does not include services such as design, construction, architecture,engineering, investigation and survey, research and development, technical testing andanalysis, consulting, and distribution, which could have an environmental component orapplication but which have dual uses. As noted earlier, environmental services encompasscomponents of several other sectors, (which explains the call for a cluster negotiationapproach). These related services are present in other parts of the W/120 list so as to keepthe self-contained and mutually exclusive nature of sectoral classification under the GATS.
A third shortcoming of the GATS classification is in terms of its organization.Although it covers all environmental media, including air, water, soil, etc., it does notorganize the activities by the provision of services for specific environmental media.
In contrast, the OECD classification not only gives the overall boundaries of thissector but also the boundaries relating to specific environmental media. The GATSclassification also does not differentiate between resource management versus pollutionmanagement services. Thus, the existing WTO classification system for environmentalservices does not reflect the evolving and integrated nature of environmental services andthe wide scope of this sector.
It may be noted here that the two segments excluded under the GATSenvironmental services (WTO Secretariat Note 1998) also happen to be services that aresensitive in nature, including social equity issues and environmental risk, respectively. Forinstance, the GATS classification of environmental services categorically excludes theprovision of water for human use, while this segment is included in the OECDclassification. Privatization and liberalization of the water sector (treatment andpurification) is partial across the globe, since it is a basic need for life and only in certain
9
West European countries, is the water sector privatized completely. While privatizationand liberalization may be able to provide drinking water in an efficient manner, publicintervention is bound to remain significant to ensure that provision of essential serviceslike drinking water are socially equitable and environmentally sustainable as well (e.g. theprivate firm does not indulge in unsustainable withdrawal of underground water inproviding the service).
Similarly, recycling services of solid wastes are excluded under GATS but areincluded under the OECD definition (under solid and hazardous waste management). Theinternational trade in hazardous waste is currently regulated under the Basel Convention onthe Control of Tranboundary Movements of Hazardous Wastes and their Disposal (adoptedin 1989, entered into force in 1992). The guiding principle of the Basel Convention is tominimize the threat to human health and environment by encouraging the treatment anddisposal of hazardous wastes close to where they are produced. The Basel Conventionaims to control the transboundary movement of hazardous wastes, monitor and preventillegal traffic, provide assistance for the environmentally sound management of hazardouswastes, promote cooperation between Parties in this field, and develop TechnicalGuidelines for the management of hazardous wastes. There is an export ban from OECD tonon-OECD countries of hazardous wastes intended for final disposal, effective 1994. Anamendment to the Basel Convention in 1997 also prohibits export of hazardous wastesintended for recovery and recycling from Annex VII countries (including EU, OECD,Liechtenstein) to non-Annex VII countries (all other parties to the Convention).10 Notablythe US, one of the largest exporters of scraps, has not yet ratified the 1989 BaselConvention nor the amendment to the Basel Convention on the ban of hazardous wastesfor recycling services.
For a developing country like India, where the focus so far has been on the end-of-pipe pollution management, it would be beneficial to embrace a wider definition ofenvironmental services if only to emphasize the importance of efficient and optimalresource utilization. 11
Thus, India should adopt the broad classification of environmental services with 7sub-sectors (contained in WTO 1998 Secretariat Note, as opposed to the 1991 GATSclassification in W/120). The sensitive segments of water for human use (under A. Wasterand waste water management) and recycling services (under B. Solid and hazardous wastemanagement) should be excluded or not liberalized.12
10 The Amendment to the Basel Convention has not yet entered into force since it needs ratification by two-
thirds of the parties to become effective.11 The intent of optimal resource utilization is reflected in some of the domestic environmental policies,
although instruments to ensure efficiency are still lacking. The domestic environmental legislation arelisted in the annex, and discussed briefly under section 4.1.
12 The United States in its initial offer on GATS services, while accepting the broader classification ofenvironmental services, has excluded “water from human use” in the sector specific commitments. The“recycling services” have also not been explicitly tabled under solid/ hazardous waste management.(TN/S/O/USA dated April 9, 2003)
10
1.4 Objective and Outline of the Study
This study discusses what India’s negotiating strategy should be in environmentalservices in the ongoing GATS negotiations, keeping in mind the country’s interests andstrengths in this sector. There are eight sections to this study.
Section 2 provides an overview of the global environmental services sector. Section3 provides an overview of the Indian environmental services sector, in terms of market sizeand potential, the status environmental services by 7 sub-sectors, the extent of privatizationand foreign participation in the provision of domestic environmental services, and India’strade and investment prospects in this area. Section 4 outlines the main domestic andexternal barriers impeding trade and investment in environmental services in India. Againstthis background discussion, Section 5 examines the state of negotiations and liberalizationin environmental services under the GATS framework. It analyses the commitments thathave been made thus far in this sector, the country proposals under GATS 2000, and therequests received by India in this sector. Section 6 outlines what India’s negotiatingposition should be in this sector at a broad level and for specific sub segments withinenvironmental services and in specific modes of interest. Section 7 discusses the domesticreforms and measures, which would be required to support India’s negotiating strategy inthe GATS. The discussion touches on issues such as regulation, legislation, privatization,and foreign direct investment, and suggests areas where the Indian government would needto introduce reforms or modify existing regulations and practices, to further its interestsand support its negotiating strategy at the GATS. Section 8 concludes with a discussion ofissues concerning liberalization of environmental services.
It is important to note at the outset that the discussion in this paper follows thebroader classification including the 7 categories of environmental services (as outlined inAppendix II of WTO 1998b). The discussion, however, often clubs the subsectors onsewage, refuse disposal and sanitation services as environmental infrastructure services.These three infrastructure environmental services are largely in the realm of the publicsector, as distinct from other environmental support services that include air pollution/noise abatement, environmental analysis/ consulting services, where private players arecommon. While adopting the basic resource management approach of the OECD/Eurostatdefinition, the analysis here excludes the segments on water services for human use, andtrade in scrap since these are sensitive areas and not advisable for liberalization. It mustalso be noted that while the focus of this study is on the environmental services sector, forthe sake of completeness, the study also refers to the aggregate environment marketinvolving environmental equipment.
2. Overview of the Global Environmental Services Sector
The environmental services sector constitutes about half the total environmentindustry, since the activities of firms operating in the environment industry are equallydistributed between the manufacturing and services sectors. In 2000, the value of the
11
environmental services sector was approximately US$280 billion. 13 In 1996, theenvironmental services segment was valued at about US$229 billion. 14
The industrialized countries, namely the US, Western European countries andJapan, dominate the global environment industry (including sales of equipment, servicesand natural resources). These countries together accounted for about 85 percent of theglobal market. The environment markets in these industrialized countries exhibited robustgrowth in the 1980s. However, more recently, the aggregate market in these countriesseems to be stagnating, with a growth rate of only 2 to 3 percent per annum. In particular,the growth of the environment market in the US, which commands the largest share of theglobal market, dipped in the 1990s. The American environment market registered agrowth of 28 percent during the 1990s, which was almost half of the growth during 1970sand 1980s. 15 The median profit margins of US environmental firms exceeded 10 percentin the late 1980s, but dipped between 2 to 3 percent in the 1990s in the service segments.16
The environment market in the developed countries is considered to be mature, andwith the saturation of the environment market, the growth rates have declined.17 A studyof the US environment industry noted that maturity of the sector was heavily dependent onthe demand by regulations, and thus in the 1990s the industry suffered from “waningregulation-induced market growth”.18
On the other hand, the environment market in developing countries of Africa, Asiaand Latin America is expected to grow at a rate of 10 to 15 percent per annum. Thesecountries together account for less than 10 percent of the worldwide market (in 1996 theyaccounted for 7 percent of the market), but are expected to register double-digit annualgrowth. Among the factors supporting this trend are increasing stringency of domesticenvironmental regulations in these countries, enforcement of international environmentalstandards, and pressure from consumers/ communities.
In terms of sub sectors within the environmental services industry, water andwaste-water management is the largest segment followed by waste management and airpollution control in the OECD countries (WTO 1998a: 5). These segments however arenot equally significant across the different OECD countries. Water treatment is by far themost capital-intensive segment, and firms in France and UK have a lead in water andwastewater treatment, following privatization in the water segment more than a decadeago. In the US, solid waste management is the most significant environmental services 13 One estimate of the global environment industry in 2000 suggests a value of US$ 522 billion
(Butkeviciene et al 2002).14 WTO (1998a: 4).15 Ferrier (2000).16 Berg and Ferrier (1998).17 Maturity in an industry is characterized by decelerating growth, heightened competition, reduced
profitability, growing customer sophistication, pricing pressure, emphasis on marketing (by firms),consolidation of market share by larger players, and heightened merger and acquisition activities.
18 Ferrier (2000).
12
segment followed by wastewater treatment works. In Japan, on the other hand, airpollution control is the most important segment in environmental services.
In terms of competitiveness, firms from different countries have emerged as leadersin the different segments of environmental services during the 1990s. The US firms werethe most competitive in the air pollution control services, largely due to the fact that thefirst comprehensive air quality legislation, the Clean Air Act, was passed in 1970.Subsequently, Western Europe and Japan emerged as leaders following the introduction ofmore stringent air quality regulations in these countries (UNCTAD 1998). The US firmsalso had an edge in remediation environmental services due to the strict legislation andenforcement under the 1986 Superfund Amendments and Reauthorization Act.
2.1 Trade Orientation of the Industry
The expected growth of environment market in developing countries, coupled withthe saturation of environment markets in the developed countries prompted matureenvironmental firms (of the latter) towards seeking export opportunities in the developingcountries. The developing countries are net importers of environmental services (as alsoequipment). In particular, privatization and deregulation of utilities adopted in developingcountries is expected to increase the opportunities for foreign participation. Thus the shareof trade in environmental services though small in worldwide services trade today, is set toincrease significantly in the future.
In 1999, worldwide environmental exports were approximately US$122 billion. 19
The leading country exporters included the US with 26% share of the global environmentalexports (export value of $32billion), followed by Germany with a share of 19%, and Japanwith 15% share. These three countries also enjoy the largest trade surplus in this sector.20
In contrast, European nations like Italy, U.K. and France had smaller shares of 8 percent, 7percent, and 6 percent, respectively, of total global environmental exports. Notably, whileFinland and Norway are extremely export-oriented with almost half their production beingexported, they do not have a large share of the global market. Table A4 in the annex givesthe details of global environmental exports by country, for the years 1995 and 1999.
In the Asian environment market, Japan is the leading exporter. In 1999, Japan hada share of about 40 percent of the total environmental imports of 11 Asian countries,followed by the US with a share of 29 percent, Germany with a share close to 8 percent,and Taiwan with a share of 5.5 percent.21 It should be noted here that even thoughTaiwan’s annual environmental exports have been close to US$3 billion during 1995-99, itremains a net importer in the environment sector.
19 The sectors covered include air pollution control equipment, heat/energy management and renewable
energy plants, monitoring and analysis equipment, solid/hazardous waste, other recycling systems andremediation and cleanup, and wastewater management equipment. The estimate was based on OECDtrade statistics (actual sales by HS codes). (US-AEP 2001:10).
20 WTO (1998a).21 US-AEP (2001), p. 13.
13
In particular, the US environment industry’s export revenues doubled between1993 and 1997, amounting to about 10 percent of industry revenues.22 The annual growthof US environmental exports however has slowed down. Until 1997, the annual growthrate was between 10 to 28 percent, but dropped to single digits in 1998 and 1999. In 1997the growth rate of US environmental exports was 4 percent, compared to the compoundannual average growth of 18 percent during the previous four years.23 Within theenvironment industry in the US, the highest growth in 1998 was experienced inenvironmental energy sources (predominantly in solar and wind system that constitutemore than half the market)
Several Asian countries, including India, have been the focus of the USenvironment industry under the United States-Asia Environmental Partnership (US-AEP),given the growth prospects of the environment sectors in these industrializing countries.The imports of environmental goods and services of the 11 US-AEP countries, however,fell from US$24.16 billion in 1995 to US$22.41 billion in 1999, with a sharp declineexperienced in 1997 due to the Asian crisis. The total imports during 1995-99 by theseAsian countries were US$116.74 billion. Korea had the largest share of the total imports(22.8 percent), followed by Taiwan (19.5 percent), Hong Kong (14 percent), Singapore(11.9 percent), Malaysia (8.2 percent), Thailand (7.6 percent), Philippines (5.3 percent),Indonesia (4.7 percent), India (4.7 percent), Vietnam (1.1 percent), and Sri Lanka (0.3percent).24 Table A5 gives details of the imports by US-AEP countries for 1995 and 1999.It is important to note that imports declined sharply in Korea during 1995-98, while strongoverall growth was evident in Philippines and Taiwan during 1995-99.
In terms of environmental segments significant for Asian country imports, solid/hazardous waste and other recycling systems/ remediation constituted the largest shareduring 1995-99, followed by monitoring and analysis equipment, and potable watertreatment/wastewater management.
2.2 Privatization and Liberalization of Environmental Services
Privatization in environmental services has great significance for international tradeopportunities, since basic infrastructure services that constitute the largest segments of theenvironmental services sector have traditionally been in the public sector. Localgovernment bodies have typically provided environmental services like water andsanitation, sewage and refuse disposal, cleaning of roads, parks, and lakes. However,private participation in the provision of these basic services has been increasing globally,driven by the need for cost reduction and private sector capital.
22 Ferrier (2000). Note that environmental exports reported in the previous paragraph and in the annex are
taken from US-AEP study, and do not match the estimates of the Environmental Business International(EBI) quoted elsewhere in the paper. For instance, the export value reported for 1997 of the USenvironment industry is only US$18.8 billion from EBI (Ferrier 2000), but US$29.7 billion by US-AEP(2001).
23 Berg and Ferrier (1998).24 For details see US-AEP (2001).
14
The trend in privatization of public utilities has included most significantly that ofwater supply and wastewater management. This is because, among the publicinfrastructure services, water purification and wastewater treatment systems require thelargest investment, and more than a third of the public sector capital expenditures indeveloped and developing countries is spent on the latter.25 Wastewater treatment iscompletely privatized in United Kingdom, and in France more than two-thirds of themarket is in the private sector.26 Privatization has also been extensive in the US, thoughnot uniform across all environmental service sub-sectors.
Developing countries have also encouraged private participation in environmentalservice provision, including water, sewage, and sanitation services. It is estimated thatbetween 1990-97 the cumulative private sector capital expenditure on water and sanitationprojects in developing countries was about $25 billion (compared to $297 million during1984-90).27 Among the Asian developing countries, in particular Malaysia, Indonesia,Thailand, Philippines have encouraged private participation in these infrastructureenvironmental services. In Philippines, contracts for water and sewerage services for thecity of Manila were awarded to two private consortia, and in Indonesia a 25-year build andoperate contract for drinking water treatment plant in the city of Medan, Sumatra, wasawarded to a French company. 28
Private participation in environmental infrastructure services has taken variousforms across the world. The major types of contracts are briefly discussed below:29
(i) Management service contracts
Under management service contracts, the government remains the primary providerof the service and the private operator is hired to carry out designated tasks (e.g. operationof water/ wastewater treatment plant, or distribution, or meter reading/ billing/ collection,or maintenance operations) for a certain period of time, typically 5 to 7 years. This is alow risk option of service contracts, but does not optimize the efficiency of the entireservice system. Such contracts are appropriate when only operation efficiency is requiredwithout significant new investment. In Mexico City, the government awarded four 10-yearwater service contracts to different companies for four zones of the city in 1993. Since theexisting drinking water network reached 98 percent of the city population and sewagenetwork covered 94 percent of the population, privatization was initiated to improve thedrinking water distribution (that had major leakage), make the billing system moreeffective, and install water meters.
25 WTO (1998b).26 WTO (1998a), p.5.27 Johnstone et al (1999): 2.28 UNCTAD (1998), p. 17.29 Based on Lovei and Gentry (2002): 73-77.
15
(ii) Build operate transfer (BOT) and build operate own (BOO)
Under BOT, private investment is invited in construction and operation of newfacilities for a certain period of time, typically 10 to 20 years to allow for the privatecompany to recover cost and earn profit. Government retains ownership of theinfrastructure facility, and takes the role of both a customer and a regulator. The city ofChengdu in the Chinese province of Sichuan, awarded a 18-year contract to ChengduGenerale des Eaux Marubeni Waterworks Co. Ltd., a company owned by a consortium ofVivendi (France) and Marubeni (Japan). The contract included building and operating amodern water supply plant, water intake works and transmission line to improve watersupply.
A BOO (or BOOT) is a long-term concession contract, usually for a period morethan 25 years, the government gives the full responsibility of the delivery of services in anarea to the private party, including construction, operation, maintenance, collection andmanagement activities. The infrastructure assets entrusted to the private party, remainsgovernment property, and the government remains the regulator. In 1995, TucumanProvince of Argentina awarded a 30-year concession to Vivendi in 1995 for the province’swater and sewerage system. Eventually, however, a new provincial government accusedthe company of inadequate service and failure to fulfill guarantees, meet quality standardsand cut tariffs on schedule and in 1998 Vivendi was allowed to withdraw.
(iii) Joint ventures
Under joint venture, the private and public sectors together assume co-ownership ofassets and co-responsibility for the delivery of services, by forming a new company orshare ownership of an existing company. Joint ventures involve the creation of a newentity for implementing the environmental service, under a contract, BOT or otherwise. InMalaysia, two such joint ventures failed: In 1995, a joint venture Kelantan Water, betweenKelantan state agency of Malaysia and UK firm Thames water, failed to do theinfrastructure work as the latter had serious debt problems. Eventually Thames Wateragreed to sell its entire 70 percent equity to the state government. In 1993, anotherMalaysian joint venture, Indah Water Konsortium, failed to provide the sewage services(under a concession contract) due to financial hardships. In Thailand, however, publicstock offerings by East Water, a subsidiary of the Provincial Waterworks Authority, in1997 achieved 51 percent private ownership and helped finance water treatment and supplyprojects.
(iv) Full Privatization
Under full privatization, the government grants the responsibility of providing theservice and ownership of the underlying infrastructure assets to the private party. Thegovernment only functions as the regulator of quality and price of the environmentalservice provided by the firm. Full privatization has been tried in England and Wales,France and the United States. In 1989, England and Wales privatized the water andsewage sector through the new Water Act. Ten regional water and sewage companies and
16
26 water supply firms were allowed to run geographic monopolies. While privatization issaid to have improved drinking water supply and wastewater treatment, concerns remainabout the increases in user fees and the companies’ use of the revenues.
Privatization of infrastructure environmental segments like water utilities doesseem to increase efficiency, and provides the capital for building network to extendservices to millions of new customers, (considering government agencies can bebureaucratic, inefficient, corrupt and also strapped for finances). Yet there are seriousconcerns with private entities operating in public services sector, since profit-seekingbehaviour in the market may not take care of the public interest, especially as some of theenvironmental services support the emergence of monopolies.30 This raises the argumentfor public intervention to restrict monopolistic practices in the market, while thedesirability of private participation remains on grounds of efficiency gains.
The major concerns in full privatization of environmental infrastructure servicesarise from the disparity in information between the government and private firms,opportunities for regulatory capture or corruption and inadequacy of regulatory capacity.It is important to remember to note that full privatization has been experienced only inselect environmental service segments in a handful of industrialized countries, which havethe most mature institutional and regulatory structures. Developing countries so far haveencouraged more of service and concessional contracts, and also joint ventures in thissector.
While privatization in environmental infrastructure services has been witnessed invarious forms across the world, on the whole the public sector continues to play animportant role as the provider of these environmental services. The public sector capitalexpenditures are increasing on pollution control and water and waste management in bothdeveloped and developing countries. Government procurement and government provisionsof environmental services continue to play a large role despite large-scale privatization inutilities.
In the United States, where privatization of utilities has been the most extensive inthe overall environment services sector, the extent of privatization is different across thesegments. For instance, in 1994 the wastewater treatment segment was virtually controlledby the government with 95 percent ownership.31 In other words, even in a country like theUS, “generally regarded as a country which has gone furthest in terms of privatization ofutilities, most of the revenue in waste water is generated by the public sector”.32
Privatization, however, is still progressing in this sector. In other segments, including solid
30 A World Bank survey of water projects indicates that the water supply is subsidized and the price charged
for in developing countries is only a fraction of the cost of providing the utility. Optimal resourceutilization and conservation of water would require raising this price, which is likely to take place withprivatization. On the other hand, a hike in water price would adversely affect basic cleaning habits of thepoor, leading to increased risk of diseases. UNCTAD (1998), p. 17.
31 Based on data reported in Table 4, WTO (1998a).32 WTO (1998a) p. 5.
17
waste management, hazardous waste management and environmental testing/ analyticalservices, the US government has a more limited role with an ownership of 33 percent, 10percent, and 8 percent, respectively. Full privatization exists in the two segments ofremediation/industrial environmental services and environmental consulting/engineering.33
2.3 Structure of the Environmental Services Industry
The environmental services industry consists of both public sector environmentalutilities/ infrastructure, as well as private sector environmental support services. Even withprivatization in the infrastructure services, the public sector plays a large role (as bothproducer and consumer) of the most significant environmental services (by value),including sewage treatment, refuse disposal, sanitation and drinking water.
The structure of the industry that has emerged is not uniform across its sub-sectors.The environmental services that require large scale investment for economies of scale (andsupport the emergence of natural monopoly) have a few large firms. For instance, sewageservices need collection and distribution network investment that would be economicalonly for a single large operator. Considering the scale benefits due to large capitalinvestments and technological development, there has been a tendency towards increasingconcentration in the environmental industry. Moreover municipalities have been seen touse few large environmental service suppliers due to the ease in monitoring and tracingliability.34 In the US, the number of mergers and acquisitions in the environment industryincreased during 1987 through 1991 to reach 223 transactions in 1991. Ten companieswere estimated to control about half the private market.
On the other hand, specialized environmental services including analytical servicesand consulting, support the emergence of several small/medium scale operators. Thusthese services are provided widely by both medium-sized and small firms, who are oftensub-contractors for large projects.
This industry structure is reflected in the global market with the emergence of largemultinational corporations dominating a few market segments in water and wastewatertreatment. The larger multinationals provide integrated products and services required forenvironmental systems management. The large integrated multinationals account for about50 percent of the total environment market, and the other half is accounted by the smallerfirms.35
In 1995, the top 50 environment companies represented 20 percent of the market,with American and French firms being in the lead. Among the two largest corporations inthe environment industry worldwide are The Waste Management of the US, and Vivendi of
33 Considering the entire environment market, however, the stake of the public sector in the US has reduced
over the years, and constituted only 34% of the industry revenues at the end of the 1990s (Ferrier 2000).34 WTO (1998a): p.5.35 UNCTAD (1998), p. 8.
18
France (renamed in 1998, formerly La Generale des EAUX CGE, meaning Company ofWater). The big players are becoming bigger through transnational acquisitions, and theindustry is getting to be more complex. For instance, after Vivendi acquired US Filter in1999, the Environmental Business International noted that the US water industry wasgetting more complicated and more global with each passing year due to enhanced globalpartnership, acquisition and direct sales activities of the big players.
The country tags of large multinational corporations in environmental services arethus losing significance. Large MNCs also offer a gamut of services (that fit into theargument of liberalization of a cluster of services). In particular, Vivendi, which isconsidered to be leading in environmental services worldwide, has four business divisions:water, waste, energy services and transportation. Vivendi Environment operates in morethan 100 countries and provides multi-service global offers.
3. Overview of the Indian Environmental Services Sector
The Indian environment industry has grown rapidly in recent years. The followingdiscussion highlights the size and market potential of the Indian environment sector,including the services segment, the factors contributing to the growth of this sector, thestatus of environmental services in the country, and the domestic industry’s strengths andweaknesses.
3.1 Size and Nature of the Indian Environment Industry
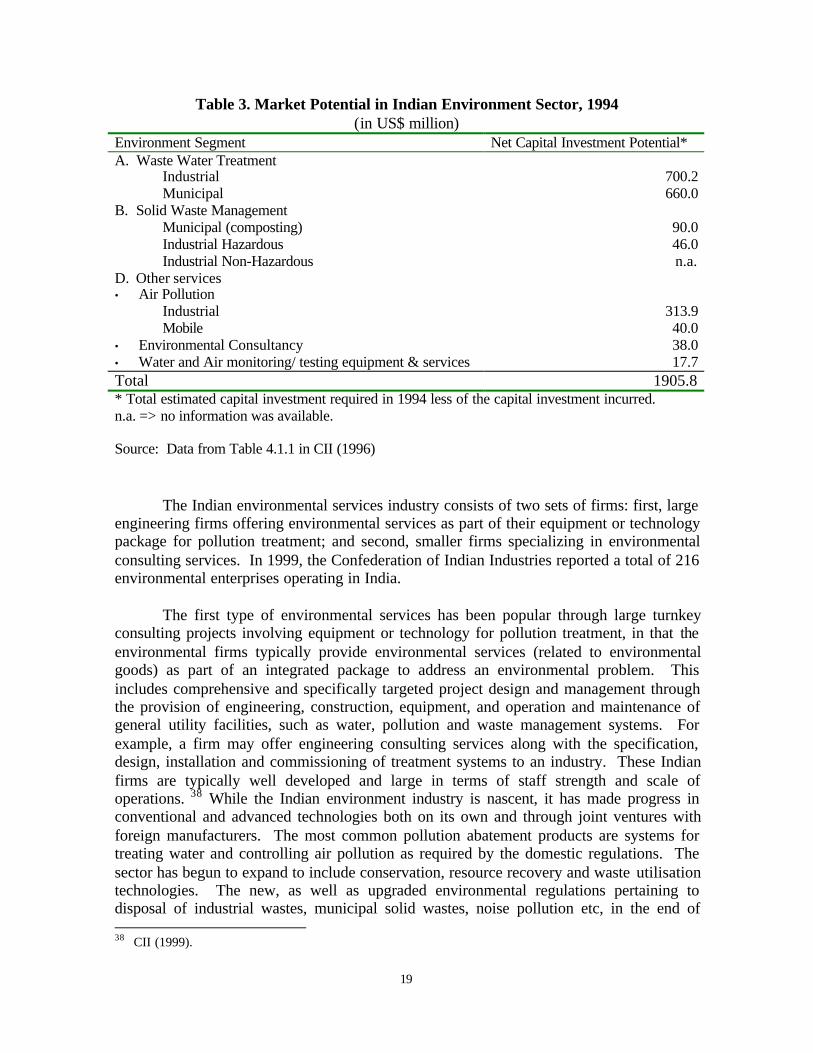
The environmental infrastructure services segment is in the realm of urban localbodies (ULBs) while environmental support services have traditionally been part ofintegrated engineering consulting services. The first comprehensive estimate of the Indianenvironment market including equipment and services was made for the year 1994 andvalued at US$1.9 billion.36 The summary estimates are given in Table 3 below.
A more recent estimate, in 2002 valued the Indian environment market at US $4.36billion, with an annual growth rate of 15 percent. In 2000, the market was estimated at US$3.29 billion and in 2001 at US $ 3.79 billion. The market estimate includedenvironmental management technology, equipment and services, including clean andrenewable energy. 37
36 CII (1996). Note however that the estimate was conservative since it did not cover segments like
industrial non-hazardous solid waste treatment or sanitation. The estimates were based on secondary datacollected from government agencies, industry suppliers and multilateral and bilateral assistance agencies.
37 US Country Commercial Guide for India 2002, 2003.
19
Table 3. Market Potential in Indian Environment Sector, 1994(in US$ million)
Environment Segment Net Capital Investment Potential*A. Waste Water Treatment
IndustrialMunicipal
700.2660.0
B. Solid Waste ManagementMunicipal (composting)Industrial HazardousIndustrial Non-Hazardous
90.046.0n.a.
D. Other services• Air Pollution
IndustrialMobile
• Environmental Consultancy• Water and Air monitoring/ testing equipment & services
313.940.038.017.7
Total 1905.8* Total estimated capital investment required in 1994 less of the capital investment incurred.n.a. => no information was available.
Source: Data from Table 4.1.1 in CII (1996)
The Indian environmental services industry consists of two sets of firms: first, largeengineering firms offering environmental services as part of their equipment or technologypackage for pollution treatment; and second, smaller firms specializing in environmentalconsulting services. In 1999, the Confederation of Indian Industries reported a total of 216environmental enterprises operating in India.
The first type of environmental services has been popular through large turnkeyconsulting projects involving equipment or technology for pollution treatment, in that theenvironmental firms typically provide environmental services (related to environmentalgoods) as part of an integrated package to address an environmental problem. Thisincludes comprehensive and specifically targeted project design and management throughthe provision of engineering, construction, equipment, and operation and maintenance ofgeneral utility facilities, such as water, pollution and waste management systems. Forexample, a firm may offer engineering consulting services along with the specification,design, installation and commissioning of treatment systems to an industry. These Indianfirms are typically well developed and large in terms of staff strength and scale ofoperations. 38 While the Indian environment industry is nascent, it has made progress inconventional and advanced technologies both on its own and through joint ventures withforeign manufacturers. The most common pollution abatement products are systems fortreating water and controlling air pollution as required by the domestic regulations. Thesector has begun to expand to include conservation, resource recovery and waste utilisationtechnologies. The new, as well as upgraded environmental regulations pertaining todisposal of industrial wastes, municipal solid wastes, noise pollution etc, in the end of 38 CII (1999).
20
1990s, is likely to help in the growth of this sector. For instance, some domestic firmshave emerged in refuse treatment and disposal service, especially in composting ofmunicipal solid wastes, like Excel Industries.
The second type of firms is limited in number. They provide environmental study-type services in terms of audit reports, environmental impact assessment (EIA),environmental management system (EMS), auditing, training, etc. Environmentalconsulting firms from Australia, Denmark, Canada, U. K., U.S., France and Japan haveperformed EIA studies or pollution prevention studies sponsored by the donor agency oftheir respective countries.
3.2 Potential Growth Factors in Environmental Services
The environmental services sector in India is small, but the emergence of severalfactors can support rapid growth in this sector. These include notably, rapid populationgrowth and urbanization, industrialization, enhanced domestic environmental regulation,and increasing demand for environmental attributes in merchandise exports to OECDcountries. According to estimates reported in Table 3, the environmental segmentsrequiring the largest investment include wastewater treatment, followed by industrial airpollution. There is also an urgent need for remediation and clean-up services ofcontaminated surface and ground water that have been polluted through indiscriminatedumping of untreated municipal wastes and wastewater, as well as industrial effluents overthe years. Each of these demand factors is discussed briefly here.
Among the most significant government policy approach that potentially affects thegrowth of the environment market in India was the 1992 Policy Statement for Abatementof Pollution. The government formally recognized the merits of using economic/ market-based instruments in controlling pollution and identified four critical issues including,heavily polluted areas and river stretches, pollution prevention at source, recognition of thepolluter pay principle, and development of the best available technical solutions forenvironmental management.
3.2.1 Increasing Population and Urbanization
As noted earlier, environmental services in sewage, refuse disposal, and sanitationcomprise the most significant (by value) segments of the sector, and in India there aresevere deficiencies in the provision of basic environmental services to the growingpopulation. In 2001, of the 1 billion odd population, more than 28 percent was classified asurban (Census 2001). The infrastructure environmental services in the cities have beenunable to keep up with the rapid increase in population. This is particularly critical sincethe urban population is growing faster than the total population. During 1991-2001, the
21
urban population increased by 32.26 percent while the total country population increasedby 21.34 percent during the same period.39
The demand for some of the essential environmental services from the domesticsector is evident from the increase in defensive expenditure of Indians, and the growth ofmarkets for bottled water, household water purification kits and air purification equipmentduring the last decade. This clearly indicates that communities in urban India (except forthe urban poor) are willing and do pay for improvement in environmental quality of thebasic consumption goods and services. Thus, while the majority of Indians can ill-affordthe cost of full market price of basic resources like water and sanitation, a certain sectionof the Indian population, notably in the urban areas, can pay more for enhancing theseservices that follow from privatization and liberalization.
Government initiatives in this segment include the Accelerated Urban WaterSupply Programme, which supplements the state governments’ Basic Minimum ServicesProgramme of 1996 to provide safe drinking water to the entire urban population in Indiaby 2000. In the 10th Plan, the government released a revised draft Water Policy aimed atproviding safe drinking water to all. In 2000, the Municipal Solid Wastes (Managementand Handling) Rules issued the guidelines and made local bodies the nodal agencies insolid waste collection, transportation and disposal. This legislation set deadlines for citiesto establish suitable waste processing, disposal facilities and sanitary landfill sites. The setof environmental regulations is listed in Table A1 in the annex.
3.2.2 Industrial Demand for Environmental Services
A second significant potential source of demand for environmental services is theindustrial sector, particularly for industrial wastewater treatment and disposal, hazardouswaste management, environmental analysis, consulting, testing and certification. Theincrease in the demand for environmental services in the industrial sector in India duringthe 1990s stems from three major factors, namely, enhanced domestic environmentalregulations and government initiatives, increasing demand for environmental attributes inproducts and processes by importers (e.g. ISO 14001 certification), and civil societypressure as well as environmental legal activism:
(i) Upgradation in domestic environmental legislation and other initiatives
There has been an expansion of domestic environmental regulations in recent yearsto incorporate environmental management guidelines. The nature of environmentalregulations in India while mainly focused on installation of end-of-pipe pollution controlequipment has changed somewhat towards a more holistic environmental managementapproach. For instance, mandatory EIA (for 30 categories of activities) and environmentalsafety audit have encouraged the growth of environmental services. Similarly, the Bio-
39 Based on Census 1991 and 2001 figures, the total population increased from 846 million in 1991 to 1,027
million in 2001, while the urban population increased from 215.7million to 285.3 million during the sameperiod. The urban population has been increasing due to natural population increase, reclassification ofnew towns, and rural-urban migration.
22
medical Waste Rules (1998), and Hazardous Waste (Management and Handling) Rules(amended 2000) has helped to attract more equipment manufacturers with consultingservices in the Indian environment sector.
The upgradation of certain domestic environmental legislation has followed fromthe implementation of commitments under Multilateral Environmental Agreements(MEAs), where India is a signatory. For instance, the Ozone Depleting Substances(Regulation) Rules (2000) followed the Montreal Protocol, the New Biodiversity Act(2002) followed the Biodiversity Convention.
(ii) Increased demand for environmental attributes of products and processes byOECD importers
There has been an increase in demand for environmental attributes of products aswell as production processes (justified under the environmental provisions of theAgreements on Technical Barriers to Trade and Application of Sanitary and PhytosanitaryMeasures) from importers in the OECD countries. Indian exporters have facedconsignment rejections in OECD markets, and there has been a move towards upgradingenvironmental management systems (like the voluntary ISO 14001) or processing (likeHACCP in food processing plants), as well as obtaining environmental certification andlabels. The government too has set up environmental testing and certification laboratories,and helped in environmental training.
(iii) Community pressure and legal environmental activism
Civil society (individuals and environmental NGOs) in India have been active inbringing polluters to court with environmental public interest litigation given that a goodenvironment is a constitutional right of the Indian citizen (under the Right to Life, Article21 of the Indian Constitution). Notably, the Supreme Court of India rulings have become asignificant factor behind the change in firm behaviour. Some of the rulings from theenvironmental public interest litigation have also resulted in major regulatory initiatives.
3.2.3 Degraded State of the Environment
The third potential source of demand for environmental services (for remedialservices) stems from the need to clean up the present degraded state of the environment inthe country. The indiscriminate disposal of untreated wastes and effluents into waterwaysand land has led to severe surface and ground water pollution. During the last five years inparticular, the Ministry of Environment and Forests has more than doubled its expenditureon environment to US$180 million in 2001-02, the largest outlay of $58 million being forcleaning up the rivers.40 Under the 1995 National River Conservation Directorate, remedialand pollution control works were undertaken for 18 major rivers in India.
40 See Table A2 in annex for details.
23
3.3 Status and Deficiencies in Environmental Services by GATS Subsectors
The Indian environmental services sector has been growing, and given the acuteshortfall in the provision of infrastructure environmental services and potential demandinduced by new/ enhanced environmental regulations, the growth prospects of theenvironmental service sector are good. This section gives a quick review of the status andcurrent deficiencies in environmental services by the 7 sub-sectors (as per the broaderGATS classification) to indicate the need and scope of growth in these services in India.
3.3.A Wastewater and sewage services (excluding water from human use)41
Water pollution is considered to be India's worst environmental problem. Thissegment is estimated to account for almost half of the country’s environmental market,with an expected growth rate of 10-12 percent per annum. A number of publicly ownedwater/wastewater treatment utilities and urban authorities have begun to privatize suchinfrastructure and raise funds from the capital market to meet their financial needs. Theforeign investors expect “the real boom in the municipal water and wastewater treatmentover the medium term (3 to 6 years) when the Central and State governments take adequatemeasures towards privatization.”42 The industrial water and wastewater treatment market isexpected to continue to grow, especially in the highly water polluting sectors such aschemicals, petrochemicals, metal processing, ferrous and non-ferrous metals processingand food processing sectors.
The domestic sector, however, is the largest generator of wastewater (by volume) inIndian cities. The Ministry of Environment and Forest noted that municipal wastewateraccounts for about three-fourths of the total wastewater generation by volume, and almosthalf the total pollution load. In Class I cities, in particular, about 97.65 percent of the totalwastewater generated by volume comes from the domestic sector, and the rest from theindustrial sector. Thus the deficiency in treatment of municipal wastewater is the singlelargest source of surface and ground water pollution in India.
A large section of the India urban population is not even provided with seweragefacility. In Class I cities, about 70 percent of the municipal population is provided withsewerage facility, whereas in Class II cities about 66 percent of the municipal population iscovered by sewerage facility. The sewerage facility includes open, closed and pipedsystems. Of the total wastewater generated about 72 percent is collected in the Class Icities and 66 percent in the Class II cities. Among the Class I cities, metropolitan cities(with population above 1 million) contribute to the bulk of the wastewater generated, themaximum being by Delhi. The collection rate of wastewater in Delhi city was lower thanthe average across all Class I cities at only 59 percent of the wastewater generated.
41 Discussion in this section is based on the data published CPCB (1999) and (1999c). It may be noted here
that 78 percent of the urban population have access to safe drinking water, while in the villages barely 35percent have access to water supply. In Class I cities, the provision of water supply is above the urbanaverage, with 88 percent of the municipal population been covered by organized water supply. (CPCB1999)
42 US DOC (2003).
24
The deficiency in provision and collection of wastewater is accompanied by grossunder-capacity to treat wastewater generated in the cities. In Class I cities, the totalavailable treatment capacity was only 24 percent of the total volume of wastewatergenerated. The situation in Class II cities is still worse, with barely 4 percent of the totalwastewater generated being treated, and the rest being disposed off untreated.
3.3.B Solid Waste Management (excluding recycling services) 43
• Refuse disposal services
The disposal of industrial (hazardous and non-hazardous), municipal solid wastesand bio-medical wastes has become a serious concern due to the land pollution and groundwater pollution caused by leaching from the land disposal sites. Municipal solid wasteincludes residential, commercial, institutional and industrial (but not hazardous wastes)wastes. The majority of the municipal solid waste is generated in the metro cities withmore than 62 percent of the waste from Class I cities. In the industrial sector, thermalpower stations are a major source of solid waste, especially coal ash, while hazardouswastes are generated mostly from petrochemical, pharmaceutical, chemical, pesticides,fertiliser, metal finishing industries.
Among the most severe infrastructure deficiencies in municipal waste disposalservices are the absence of any transfer stations and legally notified landfill sites fordumping solid wastes. This is significant since virtually all cities simply dump the wastescollected without treatment: about 94 percent of the total waste collected being dumped inClass I cities. On an average, only about 6 percent of the total municipal solid wastegenerated in the Class I cities is treated. Some cities in states like Gujarat, Kerala,Maharashtra, Rajasthan, Delhi, however, do encourage composting but the nationalaverage for Class I cities show 94 percent of the municipal solid waste is disposed offthrough dumping, and only 5 percent is composted. Under Schedule I of the MunicipalSolid Waste Management and Handling Rules 2000 this is set to change, landfill sites asper specifications were to be ready for operation by December 2002, and waste processingand disposal facilities are to be established by December 2003. This implies a largepotential demand for waste processing, disposal, as well as construction of sanitarylandfills across cities in India.
Following the 1998 legislation on mandatory treatment of bio-medical wastes, themarket for biomedical waste treatment is estimated at US $200 million, and expected todouble over the next 3 years prompted by the domestic regulation. 44 Domestic legislationhas made the treatment of bio-medical waste mandatory and hospitals with 500 beds arerequired to install adequate treatment and disposal facilities. By the end of 1999, only afew facilities had abided by the rules. Technology needs in this sub-sector includemicrowave, autoclave, and hydroclave and advanced incineration systems.
43 Data in this section is taken on CPCB 1999b.44 US DOC (2003)
25
• Sanitation services
Outdoor sweeping and cleaning of streets is in the purview of ULBs. In urbanIndia, about 38 percent of the population have access to sanitation services, while in ruralareas barely 12 percent have access to sanitation services.45 Although the urban populationhas greater access to sanitation services compared to the rural population, the deficiency isacute in the slums of urban India, where the population may not have adequate purchasingpower to pay for private services.
3.3.C Protection of Ambient Air and Climate services
Air pollution is perhaps the most serious environmental concern in urban India.The largest source of air pollution is the transport sector, followed by the industrial sector(including coal based thermal power stations). The air pollution equipment and servicesmarket is expected to have a growth rate of 15 percent per annum.46 In 2001, the value ofimports was about US $80 million, with the U.S. being the single largest import source (40percent of the import market). Growth in the sector is led by the transportation sector (dueto enforcement of stringent vehicular emission standards), followed by planned capacityadditions in the thermal/liquid fuel/gas-based power sector, and retrofitting opportunities inthe existing polluting industries like steel and petroleum refinery.
The key needs within this sub-sector include: pollution control equipment likefilters and precipitators; energy efficient boilers and furnaces; ambient air and stack airquality monitoring equipment; process control and instrumentation for industries;industrial hygiene and safety monitoring equipment; vehicular emission control productslike catalytic converters, CNG kits, and consulting services.
3.3.D Remediation Services and clean up of soils and water
As mentioned in the previous section, the degraded state of the environment in thecountry, especially in terms of water and land need remediation services. Surface waterquality, especially of the major Indian rivers (e.g. Ganga, Yamuna) is poor due to thedumping of municipal wastes and industrial effluents, as well as chemical run-off from theagricultural fields. While efforts have been devoted to target river cleaning (e.g. underNational River Conservation Directorate), remediation services need to be enhanced.
3.3.E Noise abatement services
Noise abatement regulations are fairly recent in India (dated 2000, and amended2002), which specify standards on ambient noise by area (residential, commercial,industrial and silent zones) differentiated by time of day and night. There are also specificstandards for noise limits from vehicles. The market in this segment seems equipment
45 CPCB (1999).46 US DOC (2003).
26
oriented especially with noise suppression devises equipment with import needs inengineering and design services.
3.3.F Nature and Landscape protection Services
In the conservation of total biological diversity (including forests), the 1988National Forest Policy observed that the network of national parks, sanctuaries, biospherereserves and other protected areas should be strengthened and extended adequately. Thestrategy goal includes achieving forest area cover a minimum of one-third of the total landarea of the country. The participation of local communities is important in natural resourcemanagement (as initiated under the Joint Forest Management), since these resourcesprovide sustenance to a large Indian rural population. The forest management services tothat extent seem largely informal.
3.3.G Other environmental and ancillary services: Data collection, analysis/ assessment,environmental R&D, education, training and information
The Indian industry has responded with a robust growth in environmentalconsulting firms (though the quality of services from these firms varies). Air pollutionmonitoring services have also been growing in the country, especially since air pollution ismonitored across various cities. While training in environmental management systems likeISO 14001 seems to have become a forte of the industry, environmental R&D is virtuallyabsent. Thus, technological know-how seems to be the main deficiency in the Indianenvironment industry. The CII notes that the Indian environment industry really needsaffordable cutting edge technology in pollution prevention and abatement.
3.4 Private Participation in Infrastructure Environmental Services
The inadequacies in the provision of basic environmental amenities in urban India,as discussed above, are often due to paucity of funds, (and also due to the growth ofunplanned/ illegal urban colonies). While infrastructure for environmental services is quiteadequate in the developed countries, in a developing country like India, capital investmentto enhance the infrastructure for providing the environmental services is important. Thisimplies that among the various options of privatization available (as listed in section 2.2above), BOT and BOO have greater significance for India than just management servicecontracts.
The most significant reform affecting the provision of urban environmentalservices in India is the 74th Amendment Act of the Indian Constitution in 1992. Thisamendment recognized the principle of local self-governance and empowered the urbanlocal bodies (ULBs) including municipal corporations, municipal councils and nagarpanchayats. The schedule XII of the Constitution lists the functions of ULBs, whichinclude environmental services like:
• water supply for domestic, industrial and commercial purposes• public health, sanitation, conservancy and solid waste management
27
• urban forestry, protection of the environment and promotion of ecological aspects• provision of urban amenities and facilities such as parks, gardens, playgrounds.
In other words, among the functions of ULBs listed in schedule XII, several aslisted above coincide with the environmental services listed under the GATS. Waste watercollection and treatment corresponds to sewage services (under A. Wastewatermanagement); municipal solid waste collection, and disposal corresponds to refusedisposal services; sanitation including sweeping of streets corresponds to sanitation andsimilar services (under B. Solid waste management), and urban forestry, protection ofenvironment, promotion of ecological aspects, parks, and gardens corresponds to natureand landscape services (classification F).
Since financial constraints of ULBs have been a major problem towards theadequate provision of services, the new legislation provided the framework fordecentralisation of governance and local participation, and for URLs to tap financialresources through Central Finance Commission as well as the State Finance Commissions.In 1996, the Central Government also sent guidelines to all state governments oninnovative approaches for resource mobilization and suggesting urban development plans/projects be placed on commercial format by designing commercially viable urbaninfrastructure services and area development projects. A state is supposed to assign ULBswith specific taxes, duties, tolls and levies, and authorizes them to impose collect andappropriate the same.
All state governments of India have either enacted new municipal laws or amendedthe existing laws to conform to the changes under the 74th Amendment. This is consideredto be the first generation reforms in the urban sector. Second generation reforms wouldinclude policies to protect consumers with privatization of financing and delivery ofmunicipal environmental services including water and sanitation.
In 1999, the state of Gujarat passed a law (Gujarat Act No. 11 of 1999) thatprovides a clear framework for private participation in financing, construction,maintenance and operation of infrastructure projects. In particular, the Schedule I on typesof projects covered under this Act, included water storage, water supply, sewerage system,solid waste management, as well as tourism projects. The scope for private participation inlocal government functions in the Gujarat Act was the first of its kind in India. Schedule IIof the Act elaborated on the nature of concession agreements that can be offered to privateparties, including BOOT, BOT, build and transfer, build lease and transfer, leasemanagement, rehabilitate operate and transfer, service contract or joint venture.
In June 2001, the state of Maharashtra also issued guidelines for private sectorparticipation to increase performance and investments for water supply and sewerage 47
This was adopted to help cities improve the provision of these services by tapping externalfunds and increasing efficiency in operations. Besides maintenance and repair, otheroperations requiring improvements included metering, billing, and collection of charges.The guidelines recommended urban local bodies to invite competitive bids during the 47 FIRE(D) (2002).
28
selection of private firms, and the state guidelines detailed the procedure for suchcompetitive bids.
Privatization of infrastructure services has also been witnessed in the Indiantransport sector, where similar issues were involved. The sector is analogous to theenvironmental sector in terms of existence of externalities, large investment requirementsand long gestation period in investment returns. Here too, BOT and BOOT type ofconcessions have been used in India. For example, the Bangalore-Mysore InfrastructureCorridor Project is the largest BOOT highway project in India. The project, estimated tocost Rs. 836 crores, was awarded to the Nandi Infrastructure Corridor Enterprises Ltd.(part of Kalyani Group of Industries) in 1995. The contract includes the grant ofgovernment land for the highway construction as well as adjacent land to the entrepreneurfor a lease period of 40 years (10 years for construction and 30 years after construction).Private lands falling in the area are to be purchased by the entrepreneur. The entrepreneuris expected to recoup the investment through sale of the land to be developed (for 5proposed townships) and the highway is to be maintained through the tolls charged fromusers.
3.4.1 Experience with privatization in India
Apart from financial constraints, the management of environmental services ofurban local bodies has also been poor. For instance, in 1999 the report on solid wastemanagement in Class I cities from the Supreme Court constituted Committee noted that,inefficient management and indiscipline among the work force has led to the unsatisfactorymunicipal services (besides the paucity of funds due to inadequate taxation).
During the 1990s, municipalities, especially in Class I cities, have encouragedprivate participation in infrastructure environmental services that fall under their purview.These have taken the form of service contracts in refuse collection and disposal, cleaningof streets, composting etc. Long-term concession contracts under BOO (and BOOT) havealso been awarded in the refuse disposal segment. These cover composting projectsnotably in the states of Maharashtra, Tamil Nadu, Andhra Pradesh and Kerala. The privatefirms recoup their investment by selling compost derived from waste processing. Thequality of compost, however, needs close monitoring, since without proper wastesegregation at source, compost may be contaminated. The capital investment in thesefacilities (with capacity 100 to 700 tons per day, tpd) has ranged between RS. 30 to 70million, and has been driven primarily by promoter equity. 48 For example, in the city ofDelhi, two waste-to-compost plants of 600 tpd and 300 tpd have been set up under BOOwith domestic private firms from Khurana Group and Excel Industries.
Private capital has also been used in landscape services in India, notably in the cityof Ahmedabad. The Ahmedabad Municipal Corporation (AMC) initiated “greenpartnership” where private firms share the cost of urban environmental management effortsin parks, gardens and roadside. In parks and gardens, private companies pay for the
48 FIRE-D (2001) pp. 2-3.
29
saplings and tree guards, while AMC undertakes actual plantation and maintenance: undersuch partnership 200,000 saplings have been planted. In roadside tree plantation, privatecompanies pay the expenses for tree plantation on specific stretches in exchange can put adiscreet logo on the tree guard. According to the AMC, in 1995-96, 17 private companiescame forward to sponsor a total of 7,150 tree guards at the cost of Rs. 7.15 million. 49
The above anecdote illustrates how the Indian private sector capital can besuccessfully tapped in municipal environmental services, to overcome financial constraintsof the ULBs and improve the quality of life for the citizens at the same time. As for thefirms, the participation in urban environmental services offered economic benefits throughthe opportunity to advertise and help build a green socially responsible corporate image.
3.5 Foreign Investment in the Indian Environment Sector
For the year 2003, the US Department of Commerce ranked the Indian environmentsector as the second most attractive sector after computer software services for Americanexporters and investors.50 The estimates for the Indian environment market, domesticproduction and imports are reproduced in Table A6 in the annex.
Liberalization through the 1990s has witnessed the significant opening up ofsectors for foreign investment, especially through the automatic route of the Reserve Bankof India.51 The foreign direct investment in environment equipment and services (i.e.manufacture of pollution control equipment, sewage, refuse, and consultancy services) areallowed under the automatic route with upto 100 percent foreign equity holding. However,foreign investment has been largely routed through the Foreign Investment PromotionBureau (FIPB) in India, since it comes with a written approval of the Government of India.Thus while the automatic route is open for foreign investment in environmental services,the FIPB has been approving several of these projects.
During 1993 through 2002, the total foreign direct investment in the environmentsector approved by the FIPB amounted to US$32.7 million (details given in Table A3 inthe annex). The largest share of this foreign investment came from the US (31.86 percent),followed by Netherlands (23.33 percent), Singapore (18.65 percent), UK (8.65 percent)and Germany (6.45 percent). In 1991-92 there was no FDI or foreign technology cases(FTC) in the environment sector approved by the FIPB in India.
49 Ahmedabad Municipal Corporation website: www.ahmedabadcity.org50 The prospects in this sector seem to have been improving becasue for the year 2002, the Environment
sector had been ranked sixth after sectors like Computer software and services, Telecommunicationservices, Telecommunication equipment, Computers and peripherals, Education.
51 Only certain sectors require separate approval: The list of economic activities not available for theautomatic route includes “investing companies in infrastructure and service sector”, which can route theirinvestment in India through the Foreign Investment Promotion Bureau (Annexure A of RBI ExchangeControl Department Notification No. FEMA 20/2000-RB, dated 3rd May 2000). These infrastructureservices typically include that of telecommunications, power, etc, not the environmental infrastructureservices referred to in this paper.
30
Countries like the US consider the prospects for investment to be good givenincreasing privatization in environmental services and enhancement of domesticregulations. Since local capacity in India will not be able to meet demand, imports willregister higher growth. Private sector implementation of projects on a Build Own Operateand Transfer (BOOT) and Build Own Operate (BOO) basis (some facilitated throughfinancial participation of multilateral and bilateral agencies in large urban environmentalinfrastructure projects) has encouraged foreign investment in the sector. Among the Indianenvironmental segments with significant foreign investment are: water/ wastewatertreatment; recycling and sanitation; industrial and vehicular air pollution control;hazardous waste management, treatment and disposal; biomedical waste management;municipal solid waste management; pollution testing and monitoring equipment/services;clean and renewable energy equipment; and environmental consulting/engineeringservices.
Joint ventures have also been prominent in the Indian environment industry, andover 100 companies have associations with international companies in the form of jointventures and technology transfer agreements for various types of pollution controlequipment (instances given in table in the annex). While there are many joint venture andcollaborative arrangements in the environmental goods sector (between 100 to 150) thereare fewer such arrangements in the environmental consultancy services sector.
Some of the Indian environmental services firms have established long termstrategic partnerships with foreign firms to enhance their skills in selected niche areas: forexample, in 1997, Technofab Engg. (India) formed Tetra Tech India Ltd. under a jointventure with Tetra Tech EMI (US) to offer consultancy and engineering services inenvironment, energy and infrastructure.52 Similarly, Tata Risk Management Services is ajoint venture (50-50) between Tata Sons Ltd. and American International Group Inc. (US)that provides safety audits, risk assessment, as well as environment related services in EIA,environmental audit, environmental due diligence, bio-medical waste management,environmental training, etc.
3.6 A Case of Liberalization in Municipal Environmental Service
During the last few years, liberalization in the environmental service sector hasbeen witnessed in several Indian cities. The city municipalities in Chennai, Hyderabad,Navi Mumbai, Rajkot and Surat have experimented with partial privatization andliberalization in solid waste management to increase efficiency. Other city municipalitieshave imported engineering and design consulting services (e.g. in Greater Bombay), oreven to construct and operate water systems (e.g. in New Delhi).
In 1995, the Municipal Corporation of Greater Bombay awarded 32-monthfeasibility study to R.V.Anderson and Mott MacDonald under a joint venture team with 52 In 2001, however, Tetra Tech sought to increase its foreign equity from 50 percent to 100 percent. In
February 2002, Tetra Tech India became a wholly owned American subsidiary after the FIPB approval.It should be noted here that all cases involving transfer of shares need the FIPB approval, even though thesector per se allows FDI under the automatic route.
31
Indian firms PHE Consultants Ltd. and Mahindra Acres Consulting Engineers Ltd. Thecontract was worth $3 million and was meant to upgrade the sewerage operation system ofBombay’s Water Supply and Sewerage System. In 2000, in New Delhi a contract todesign, build and operate drinking water provision in Sonia Vihar, was given to Suez-Degremont. The project is expected to cover 3 million citizens at a cost of Euro 50million.
In 2000, Municipal Corporation of Chennai partially privatized the collection ofsolid waste to Chennai Environmental Services Onyx (CES Onyx), subsidiary of theFrench company, Onyx, through its Asian operations setup in Singapore. Onyx operates in11 Asian countries including Hong Kong, Guanzhou in Mainland China and Taiwan, andis a leader in the Asian market for waste management. In Chennai, Onyx is responsible forcollecting and disposing household and commercial wastes in 3 zones of the municipalarea.
CES Onyx was expected to make an investment of RS. 40 crores, which CGEAwas to bring in as foreign funds. The existing Corporation workers were to be redeployedto other departments such that no worker lost his/her job. Under the contract (signedNovember 1999, effective March 2000) CES Onyx is responsible for sweeping, collecting,storing and transporting municipal solid waste. The company is committed to use morethan 1800 workers, 31 compactor trucks, 30-35 hook lift trucks, 180 auto rickshaws, 800modified bicycles, etc. The quantity of waste to be removed is about 1000 metric tons/dayfor 7 years. The Municipal Corporation agreed to pay RS. 648/ metric ton in the first year,and a 5% annually escalated rate in subsequent years (i.e. about RS. 1,200/ ton in the 7th
year). The Corporation estimated that this would save RS. 10-12 crores per year(comparing with the cost of providing the same service in-house at RS. 1,050 to Rs1,365/metric ton) for disposal of garbage.
In 2002, the activities of CES Onyx came under attack, when the Tamil NaduPollution Control Board issued a notice to Onyx for indiscriminate dumping of wastes inPerungudi/ Pallikaranai wetlands. Onyx maintained that its services were as per thecontract, including choice of dumping grounds in the sensitive wetland area. The boxbelow gives an account of this recent partial liberalization of municipal operations.
32
Box 1. Liberalization of Municipal Solid Waste Management in Chennai
The Municipal Corporation in Chennai is the oldest Corporation of India and was formed in 1688. In the year2000, the Municipal Corporation privatized solid waste collection and transportation in 3 out of the 10 cityzones, namely Ice House, Mylapore and Kodam-bakkam, in an effort to modernize municipal services. Theprivate services cover about 35% of the corporation area. The Corporation is estimated to generate about 2,500metric tons of solid waste per day. The Corporation is also planning to privatize waste treatment, and invitebids to set up a compost plant to treat municipal solid waste under a long-term build-operate-transfer contract.
The Chennai Municipal Corporation, together with Tamil Nadu Industrial Development Corporation, awarded a7-year service contract to CGEA Asia Holdings. The arrangement required CGEA to operate through asubsidiary under the name of Chennai Environmental Services Onyx (CES Onyx). Onyx is an affiliate of theFrench multinational Vivendi Environment, and is a market leader in waste management in Europe withdiversified operations in all sectors of waste management: including waste collection, sorting, treatment andlandfill.
Two years into the operation, CES Onyx came under attack. While the residents of Chennai seem satisfied withclean streets, the disposal of the waste after collection remains medieval rather than state-of-the-art, accordingto CorpWatch India. After collecting the wastes from the 3 zones, the company dumps the waste in a low-lyingwetland area of Perungudi everyday. The dumping ground has no landfill or liner, and is adjacent toPallikaranai, which is rainwater harvesting area recharging groundwater as well as lakes in south of Chennai.
The haphazard disposal of wastes in and around the wetlands has generated leachates that threaten to pollute theground water and indeed the entire ecosystem supported by the adjacent wetlands. In 2000, the Tamil NaduPollution Board issued a notice to Onyx for “dumping indiscriminately on wetlands”. The Board took exceptionto fact that the company had failed to demarcate the area allotted for dumping, and threatening the wetlands.Onyx has maintained that the dumping area is as per the contract with the Municipal Corporation.
The fact remains that the Municipal Corporation Chennai earlier used the wetlands of Perugundi andPallikaranai for dumping wastes, and Onyx continues the practice. Even Chennai Metro Water Supply andSewerage Board, which manages the city’s sewage (and has appointed Vivendi as consultant in its water supplymanagement), discharges “treated” sewage water directly into the wetlands.
Source: Business Line 27th November 1999, CorpWatch India article by Jayaraman (2002), and websites of theMinistry of Urban Development, Government of India and Vivendi Universal.
The crux of the problem seems to be the lack of an integrated approach to wastemanagement. The Chennai Municipal Corporation privatized the waste collection anddisposal while the treatment of the collected waste was excluded. While privatization ofwaste treatment also seems to be in the Municipal Corporation’s planning agenda, such apiecemeal approach (or perhaps cautious phased privatization) has proved to be inefficientand costly. Chennai now has additional service requirements of soil and water remedialfor the wetlands.
There are other instances of liberalization in environmental services that aredirectly related to projects under multilateral and bilateral agencies. For example, in year2000, a five-year pilot project for Bangalore Water Supply and Sewerage Board, was givenjointly to Vivendi Water and Northumbrian Water Group, each covering 1 million people
33
(under the AUS-AID assistance programme from the Australian government to privatizewater supply on BOO and BOOT basis).53
3.7 India’s Trade and Investment Prospects in Environmental Services
The privatization and liberalization of environmental markets promise the standardfree trade benefits to countries based on individual comparative and competitive advantageof providing environmental services: Expansion and export of services that can beproduced more efficiently at home and importing services that cannot be provided asefficiently. The industrialized countries have a comparative advantage in the export ofresource saving and clean technologies, and technical expertise in the design andengineering of treatment and purification facilities, given that the environment industry ismature in these countries. On the other hand, developing countries like India have thescope of specializing in labour-intensive environmental services, including skilledsegments like environmental consulting, auditing, analysis and training.
3.7.1 India’s Export Potential
The Indian environmental service providers have emerged most significantly in twoareas: first, environmental services in turnkey projects (e.g. integrated engineering servicesin energy equipment); and second, environmental support services like consulting,environmental impact assessment, auditing and training (including ISO 14001). There arealso a few companies, which have been specializing in composting of solid waste andwaste to energy services.
(i) Export of integrated environmental equipment and services:
Large Indian environmental equipment firms offering accompanying environmentalservices have been exporting equipment in Asian, Middle Eastern and African markets.They have also begun to explore niche markets in the environment sector withinindustrialized countries, to boost exports as also to nurture future partnership and alliancesfor technology solutions. For instance, Thermax Ltd., a multinational energy equipment,chemicals and services company opened its second overseas subsidiary, Thermax Inc., inDetroit, US in 2001 (the first one being ME Engineering based in the UK). The overseassubsidiary offers resins for water treatment and specialty applications, process cooling,cogeneration solutions, bio-mass fired boilers for niche markets, heat recovery units andengineering/ consultancy services. The new export strategy being to target major globalplayers by offering quality solutions in energy and environment projects worldwide: in itsfirst year of operation, Thermax’s UK subsidiary ME Engineering obtained orders worth $7.5 million.
Similarly, Reva Enviro Systems (P) Ltd., providing both environmental equipmentand services in industrial effluent treatment, sewage treatment for municipal and industrialtownship, water supply schemes, operation and maintenance of treatment plants, has also
53 “Water Supply to go private in Bangalore” by B. Ramakrishna, Times of India, 11th April 2001.
34
won projects abroad. This has ben mainly in South Asian countries like Indonesia(biomethanization plant) and Vietnam (effluent treatment plant for sugar distillery).
(ii) Export of environmental consulting, training services:
The environmental support services segment constitutes a relatively small share inthe global environmental services industry, and is declining in developed countries. In thedeveloping countries, however, the demand for these services is on the rise as witnessedwithin India. Since the environment markets in the OECD countries are quite mature andsaturated, India’s export potential in this sector is primarily in the developing countries,where the demand for environmental services is growing. The Indian environmentalservice providers could specialize in services in regions where there are similarities inecological and economic conditions. Thus India has opportunities in this segment in somedeveloping countries in the South Asia, Africa and Middle East, where environmentalsupport services are increasingly in demand. For example, in Sri Lanka environmentalsupport services in analysis and consulting are growing (EIAs being compulsory for newand expanding projects) and under the Indo-Sri Lanka Free Trade Agreement effectiveMarch 2000, trade opportunities have been enhanced. The Central EnvironmentalAuthority of Sri Lanka and the industry associations encourage the use of betterenvironmental management systems including ISO 14000. Indeed, India has exportedenvironmental consulting services, including training in ISO 14000 and auditing, tocountries, including Nepal, Sri Lanka, Nigeria, Egypt and Qatar.54
However, much like India, most developing countries (where the environmentalservice sector is expected to grow rapidly) require establishment of infrastructure facilitiesincluding sewage treatment facilities, water purification and distribution, waste treatmentfacilities which are technology driven and where countries like the US, France, UK,Germany, Japan etc have been exporting. In the OECD countries, India has no opportunityin the upper-end technology trade that takes place in the environment sector.
3.7.2 India’s Import Needs
As noted earlier, the Indian firms offering environmental services do so as part ofthe equipment supply, especially for air pollution management solutions in power plantsand vehicular pollution abatement. However, the Indian environment industry needs thetechnology (not equipment per se) and state of the art design for pollution managementequipment, since the industry is capable of manufacturing the hardware domestically. 55
Environmental services in R&D, design and technology, which are an integral partof the environment equipment sector, are relatively poor in India. For instance, companieslike BHEL have focus mostly on product-application research rather than basic research,and thus basic technology for equipment manufacture like gasifier and fuel cell need to be
54 Seema Arora, Environment Management Division, Confederation of Indian Industries.55 Seema Arora, CII.
35
imported.56 Technological foreign collaborations are already evident in this sector; forexample, BHEL has had technological collaborators in manufacturing steam/ gas turbinesand boilers with GE (US), Siemens and Babcock Borsig Power (Germany). Thus opennessin this segment has encouraged the flow of state of the art techniques and design forpollution management.
The analysis of the deficiencies in India’s environmental infrastructure servicesclearly indicates that capital is a major constraint in the provision of these services in India,followed by poor management systems (problem of attitude noted by Supreme CourtCommittee on Municipal Waste Management in India). Thus foreign investment could beattracted (along with domestic private capital) in this sector to ensure the provision of theinfrastructure, and efficient collection and management. In particular, the building ofseptic disposal sites, and waste treatment plants needs capital investment, which the ULBsfind hard to finance with the funds available. To ensure efficiency in environmentalservices, the contracts should be for waste management, not merely for collection ordumping that fails to correct the basic pollution problem (as evident from the CES Onyxcase).
As in any capital-intensive project, the payoff would come typically after a longgestation period. Thus, to recoup investment private firms would require ownership andoperations control for that period. Liberalization (and privatization) in environmentalservices sector would then imply that India allows long-term contracts of the form BOTand BOO, to enhance infrastructure investment.
It is important to note, however, that environmental problems are region-specific.Thus, when importing technological solutions local conditions need to be kept in mind.Domestic firms may have an edge over firms from developed countries in addressingenvironmental problems specific to India. For instance, incineration plant under a waste toenergy technology project set up in Timarpur, Delhi in 1987 using Danish technology,failed to operate properly because the waste fed into the plant did not have sufficientcalorific value. Similarly pelletization facilities under waste to energy projects inVijaywada, Baroda, Bangalore, Mumbai and Kalyan did not work out due to poor pelletquality. 57
4. Domestic and External Constraints
Some of the most significant barriers to trade in environmental services pertain torestrictions in the establishment of commercial presence and movement or employment ofnationals of the operating company (GATS supply Mode 3 and 4 respectively). Theprovision of environmental services like sewage services, sanitation, and refuse disposalare capital intensive, thus conditions on commercial presence and foreign investment arecrucial in these cases. Thus, among the different modes of supply of services, conditionsand restrictions on commercial presence (Mode 3) can become significant barriers to trade
56 Mr Ajay Mehrotra, BHEL.57 FIRE(D) (2001).
36
in this sector. Restrictions under mode 3 can take various forms: limits on foreignownership of specific assets (e.g. landfill, sewage system), the number and location offoreign companies, type of legal entity (e.g. requirement to incorporate locally),application of economic needs test. Trade in environmental services is also affected bymarket access barriers in other sectors, including environmental equipment, and servicessectors like engineering, consulting, and analytical services.
Restrictions on movement of natural persons (Mode 4) are also important barriersto environmental services trade services. Professionals including environmental engineers,consultants and auditors may face barriers to cross border movement and temporarypresence resulting from different qualifications or licensing requirements. Althoughcommitments under Mode 3 for commercial presence are important, the commitments inMode 4 have by far the greatest significance for India, since environmental consultingservices has been the most robust segment in India.
The cross-border mode of supply (Mode 1) can also be used for the someenvironmental support services that can be delivered as IT-enabled services. The scope,however, is limited, since the significant segments of sewage treatment, waste managementand sanitation services require physical presence of the service providers.
4.1 Domestic Constraints
There are certain financial regulations that can affect the import of environmentalservices in India, if remittances involved are large. In September 2002, prior approval ofthe RBI was made mandatory for remittance exceeding USD 100,000 per project for anyconsultancy services procured from outside India (even if such remittance are made out ofthe funds held in Exchange Earners’ Foreign Currency accounts.58
In the export of environmental services, Indian corporations are free to open, holdand maintain offices/branches abroad and hold a foreign currency account with a bankoutside India. Remittances for the purpose of normal business operations abroad aresubject to conditions (e.g. overseas office should not create any financial liabilitiescontingent or otherwise for Head Office in India).59
4.2 External Constraints
The external barriers that exist in countries, experiencing rapid growth in theenvironmental service sector, cover a gamut of domestic regulations on businessoperations by foreign companies, or employment of nationals. Since a large part of the
58 A.P. DIR Series Circular No.20, September 12, 2002.59 RBI notification, A.P. (DIR Series) Circular No.54, June 2002.
37
environmental service sector is still in the realm of the public sector, public procurementpolicies affect market access for environmental services in these countries.60
Among the Asian developing countries, Sri Lanka seems to have fairly non-discriminatory treatment towards foreign investors, and private entities are free toestablish, acquire and dispose of interests in business enterprises, without much limitationsin access to markets, credit or licenses.
While China has a rapidly growing environmental services market, there is aneffort to encourage the growth of the domestic Chinese enterprises. Traditionally China'sservice sector has been one of the most heavily regulated parts of the national economy -and one of the most protected, where foreign service providers are largely restricted withlicensed operations that have limits on entry, and restrictions on the geographic scope ofactivities.61 Similarly Korea and Thailand, who have good growth prospects in theenvironment sector, have not committed to full liberalization since they want to encouragedomestic entrepreneurs.
Hong Kong too has good growth prospects in the environmental services sector,especially in consulting and training in environmental management systems like ISO14001, and environmental impact assessments (a 1998 Ordinance made EIAs mandatoryfor all major infrastructure projects). However, large environmental companies may offersome of these environmental support services as part of an integrated project ininfrastructure building. Similarly, Egypt gives priority to solid waste disposal, garbagecollection and recycling (tenders on BOT basis had been issued during 2000 and 2001),although environmental support services are also growing.
Thus, there are several promising markets for Indian environmental serviceproviders, particularly in consulting and support services. These markets are mostly inSouth Asia, the Asia Pacific region, Middle East, and Africa. There is little export potentialin the OECD markets. The main barriers are in the form of investment restrictions,restrictions on cross border mobility of labour, and government procurement and approvalrelated policies.
60 In this regard, the GATS multilateral negotiations on government procurement in services will have an
impact on market access of environmental services. First there is the plurilateral Agreement onGovernment Procurement, GPA, (involving 26 WTO Members) that includes commitments bygovernment departments, public entities and state-owned enterprises in each Party to the GPA to procuregoods and services in accordance with the disciplines established in the GPA. Second, a mandate of theWorking Group on Transparency in Government Procurement established at the 1996 MinisterialConference (involving all WTO Members) to study the transparency in government procurementpractices taking into account national policies, and to develop elements for inclusion in an eventualagreement. Third, Article XIII of the GATS provides for multilateral negotiations on governmentprocurement in services (conducted within the Working Party on GATS Rules). The purpose of thesenegotiations is to explore the possibility of applying multilateral disciplines to government procurementcovering all sectors of services. (WTO 1998b)
61 US Country Commercial Guide FY 2003: China.
38
5. Commitments and GATS 2000 Discussions on Environmental Services
This section analyses the commitments that have been made in environmentalservices and outlines developments in this area, in the context of country requests anddiscussions on environmental services, since the Uruguay Round.
5.1 Analysis of GATS Commitments in Environmental Services
This sector has received relatively few commitments under the Uruguay Round.Only one third of countries have made commitments in this sector, although this includesall the major players, including the US, EU, Canada, Australia, and other importantdeveloped countries. The commitments are mostly by the developed countries and by theEastern European countries. There are only two commitments by Asian countries, 2 byLatin American countries, and the rest are by African countries. Many developingcountries, including India, have not filed commitments in this sector.
Although there are significant differences in the extent of binding andrestrictiveness of the scheduled commitments in this sector, there are several commonfeatures across the subsectors and across the four modes. An analysis of the commitmentsshows that they are quite uniform across subsectors. There are 38 WTO member countries,which have made a commitment in at least one sub sector of environmental services. Thenumber of commitments in individual sub sectors is roughly equal, with 29 commitmentson sewage services, 30 in refuse disposal services and in sanitation services, and 28 inother environmental services. Slightly fewer commitments have been made in individualsegments of other environmental services.
The commitments are also quite uniform across the modes, within each of thesesubsectors. For instance, there are few full commitments across modes 1,3, and 4, mode 2being the exception. More than 60 percent of the entries under mode 1 are unbound, whileabout 30-35 percent are partial commitments and only about 5 percent are fullcommitments. In mode 2, although more than 60 percent of the commitments are fullcommitments and about 30 percent are partial commitments. On the rest there are nocommitments. The exception in this mode is the subsector of sewage services where only28 percent are full commitments and the remaining 72 percent of the commitments arelimited/partial. The restricted nature of commitments in sewage services probably reflectsthe government monopoly nature of this subsector. In mode 3, there are very few fullcommitments and over 90 percent of the commitments are restricted. There are virtually nosectoral commitments in mode 4 and reference is made to the horizontal commitments inthis mode, as is the case in other GATS sectors as well.
As concerns the nature of these limitations, they are mostly sector-specific in thecase of modes 1 and 2 while they are mostly horizontal in the case of modes 3 and 4.Between 30 to 70 percent of the limitations in mode 3 are horizontal in nature and mostlyon market access rather than on national treatment. There are only horizontal limitationsfor mode 4. Overall, taking into account the nature of commitments across the modes,
39
sectoral coverage is limited for modes 1 to 3, at around 30-35 percent while almost all thesectoral entries under mode 4 are unbound.
The sector-specific and horizontal limitations are similar across the differentsubsectors for each of the modes. There are no commitments in mode 1 for reasons oftechnical infeasibility. There are few restrictions on mode 2. The main sector-specificrestrictions on mode 3 pertain to exclusions from sectoral coverage for public servicefunctions, for services that are owned, operated, and contracted out at any governmentlevel, and for services provided in the exercise of government authority. 62 In addition,sector-specific restrictions on mode 3 also include limits on the number of foreigncompanies allowed and on the value of their services, foreign equity restrictions, andjurisdictional limitations, among others. Most of the limitations in mode 3 are, however,horizontal. The key ones include limits on foreign equity participation, approval andauthorization requirements, quotas on the number of operating licenses, conditions relatingto government monopoly, economic needs tests, limitation on purchase or rental of realestate, restrictions on the form of legal entity, residency requirements for directors, anddifferential treatment of foreign service providers in the case of taxes and subsidies.
Mode 4 is mainly affected by horizontal restrictions. The key horizontal limitationsin this mode include quotas on entry by foreign service providers, limitations on theduration of their stay, limited coverage of service provider categories (restricted to onlybusiness visitors, certain categories of intracompany transferees, managers, executives, andspecialists), quality and licensing requirements for professional environmental serviceproviders, domicile requirements in some subsectors like refuse collection, andrequirement of a local representative body (or commercial presence) to allow entry byforeign service providers. There are no commitments on lower level staff under mode 4. Inaddition to the aforementioned limitations, conditions relating to government procurementand environmental regulations and standards affect all modes of supply.
Given the significant overlap of this sector with other services, liberalizationcommitments and limitations inscribed in the commitment schedules for related areas, arealso relevant to the environmental services sector. For instance, in the case of mode 1market access in environmental services is affected by conditions such as limited internetand network access, restrictions on capital transfer and payment, and requirement ofcommercial presence for mode 1 based delivery which are often present in the commitmentschedules for related services. In the case of mode 3, market access and conditions ofcompetition in environmental services are affected by authorization and ownershiprestrictions, monopoly conditions, reservation of activities, restrictions on the form of legalentity, and nationality and residency conditions in related service sector schedules.Similarly in the case of mode 4, limitations in the form of licensing and authorizationrequirements, nationality and residency conditions, and other barriers to labour mobility inrelated professional services such as consulting, engineering, legal, accounting, auditing, 62 For example, in the EU schedule, public utilities include environmental services at a national or local
level, and are subject to public monopoly and exclusive rights given to private operators. In some of theschedules, provision of public utility services is restricted to public monopolies, which are closed toprivate investment.
40
and bookkeeping services are relevant for the environmental services sector. Thus, oneneeds to examine the commitment schedules for environmental services along with thosein related service sectors to assess the true extent and nature of liberalization that has beenrealized under the GATS.
A description of the commitments made by some of the main developed anddeveloping countries that have scheduled environmental services supports the abovecharacterization of the commitments in this area. Most of the major developed countries,including Australia, the EC, US, and Canada have made full commitments in modes 2 and3 and have either given a full commitment in mode 1 or left the latter mode unbound. Afew developed countries such as Norway, Sweden, and Switzerland have made partialcommitments in mode 3 with limitations such as retaining government monopoly in certainareas within the sector or carving out of the commitments, all public works functionsowned and operated by municipalities, state or federal governments, or contracted out bythese governments. . Some developed countries like Japan have subjected their mode 3commitment to any applicable horizontal limitations. The mode 4 entries are unbound asusual, except as stated in the horizontal commitments. In addition, Switzerland hasimposed a sector-specific limitation by linking mode 4 to the requirement of commercialpresence.
Among the few developing countries that have scheduled environmental services,the approach varies between being relatively liberal to being quite conservative. Forinstance, South Africa has made full commitments in modes 1 to 3 and Turkey has madefull commitments in modes 2,3, and even 4, while leaving mode 1 unbound. However,important markets such as Korea and Thailand have been much more cautious in theircommitments, especially with regard to commercial presence. They have includedrestrictions on foreign equity participation, requirements of economic needs test forestablishing commercial presence, and restrictions on the number of service suppliers,under mode 3 and have also referred to their horizontal limitations in the case of modes 3and 4.
Overall, given the fact that developing countries are the main markets for exportingenvironmental services and that most have either not scheduled this sector or have maderestrictive commitments in mode 3, the mode most relevant for market access in theircountries, the extent of liberalization has been quite limited. Horizontal limitations furtherlimit the significance of whatever sector specific commitments have been made in mode 3.Developing country export interests in terms of environmental support and consultingservices have also not been addressed due to the limited and horizontal nature ofcommitments in mode 4. Liberalization in mode 1 is also quite limited due to largelyunbound commitments and thus there is little opening up of trade in supporting servicesvia internet-based delivery and other traditional means of delivery. The relatively liberalcommitments in mode 2 are not so significant given that mode 2 is not an important modeof delivery for environmental services or in the supporting service sectors of interest.
41
5.2 GATS 2000 Discussions on Environmental Services
Under the GATS 2000 discussions, which commenced in early 2001, somecommon issues have been raised by a number of countries in the environmental servicesnegotiations. The central issue under debate in this sector is that of classification anddefinition as most countries feel that the existing classification does not really reflect howbusiness operates in this sector and because it deals with end of pipe cleaning solutionsrather than services for pollution prevention. Several OECD countries have pointed out theaforementioned limitations of the existing GATS W/120 classification in their proposalsand have called for broadening the coverage and definition of environmental services. Thereclassification requested is in terms of core activities such as air and water pollution andsolid waste management, distinct from related services such as technical testing andanalysis, consulting, and engineering and construction services, which are important fordelivering environmental services. Different approaches have been suggested, including acluster approach, and a core cum cluster approach (which focuses on core environmentalservices separately from auxiliary services and keeps the mutually exclusive nature of theGATS W/120 classification). There are also requests for adding more activities within thesector.
Some of the communications received from key countries are discussed here toprovide an idea of the kinds of issues that have taken centre stage in the ongoing GATSnegotiations in environmental services. These proposals also indicate the overlappinginterests with a variety of business services, the numerous cross-cutting issues that need tobe addressed in future negotiations, and therefore the likely difficulties in obtainingliberalization commitments in this sector.
In its communication proposal, Canada has stressed the need for transparency inregulations, practices. It has also pointed to the importance of related services elsewhere inGATS W/120 which are important for delivering environmental services. It has asked forliberalization in core and in related services and has pushed for broader commitments inrelated services so as to enable meaningful market access in environmental services.
Australia has likewise asked for a broader definition, going beyond pollutioncontrol and cleanup activities into a broad range of pollution management, cleanertechnology, and resource management activities, and a separation between core andauxiliary services. It has also asked for scheduling commitments with respect to the revisedclassification, while retaining the mutually exclusive nature of W/120. Some of therestrictions raised by Australia include limitations on the type of legal entity,nontransparency in licensing and other procedures, restrictive business practices,discretionary use of environmental laws and regulations, and differential treatment intaxes, and limits on foreign equity participation and on ownership of specific assets byforeign service establishments.
The EU communication on environmental services proposes to schedulecommitments according to a revised classification which keeps the mutually exclusivenature of GATS W/120 while addressing some of its recognized problems. The proposed
42
classification consists of “core” environmental services, classified along the lines ofenvironmental media like air, water, and soil and one which is more diversified and reflectscurrent realities in this sector. The communication also proposes an amendedclassification, including “water collection, purification, and distribution services throughmains” and clarifying the contents of other subsectors like recycling services and ancillaryenvironmental services.
The US proposal calls for a core cum cluster approach to the negotiations onenvironmental services whereby, the focus would be on liberalization in coreenvironmental services, but attention would also be paid to liberalization commitments inrelated auxiliary services in the current GATS W/120 classification. The proposal alsonotes the need to focus specifically on modes 3 and 4, including barriers to professionaland business services relevant to the provision of environmental services, and the need fortransparency guidelines in this sector.
Thus, the bulk of proposals deal with the classification problem in this sector underthe present GATS W/120 list. Transparency issues and removal of limitations oncommercial presence are also highlighted in several proposals.
5.3 Country Requests to India in Environmental Services
The requests that India has received in environmental services are quite extensive.All the major OECD countries, including the US, EU, Australia, Japan, and Canada, whichare important players in this sector, have made requests to India.
The requests are similar across countries. All the developed countries, barringCanada, have requested commitments on the basis of a new classification of environmentalservices (notwithstanding ongoing negotiations on classification). According to thisclassification, the categories and subsectors within this sector include:
(1) Water for human use and wastewater management which consists of watercollection, purification, and distribution services through mains, except steamand hot water, and also waste water services (9401)
(2) Solid/hazardous waste management which consists of refuse disposal services(CPC 94020) and sanitation and similar services (CPC 94030)
(3) Protection of ambient air and climate which consists of services to reduceexhaust gases and other emissions and improve air quality (CPC 94040)
(4) Remediation and cleanup of soil and water which consists of treatment,remediation of contaminated/polluted soil and water (CPC 94060)
(5) Noise and vibration abatement services (CPC 94050)
(6) Protection of biodiversity and landscape which consists of nature andlandscape protection services (CPC 94060)
(7) Other environmental and ancillary services not classified elsewhere (CPC94090)
43
Thus the number of categories and subsectors is more disaggregated and diversethan in the original GATS classification of this sector.
All the requests ask India to firstly schedule this sector, and secondly to commitfully in modes 2 and 3, and also in mode 1 if technically feasible. The requests call forunbound commitments in mode 4 except as indicated in the horizontal commitments. Inaddition, there are requests in related business support and other service sectors, inparticular, construction services (with reference to subsectors of installation and civilengineering works), integrated engineering services, urban planning and architecture, andconsulting services. Again, in these related services, the requests largely call for fullmarket access commitments in modes 1, 2, and 3 and unbound commitments in mode 4except as indicated in the horizontal schedule. Thus, the overall thrust is on entering theIndian market through commercial presence (modes 1 and 2 being far less important forthis sector) and for removal of limitations such as foreign equity ceilings and form of legalentity that are present in India’s mode 3 commitments in scheduled sectors.
6. Strategy for the Current Negotiations
It is apparent from the background discussion in this paper that India needs capital,technology, and expertise in this sector. There are deficiencies in all these respects,particularly, in infrastructure environment services. The sector has been completely openand foreign players have been entering this budding sector in recent years.63 On the exportside, India’s interests are rather limited to labour-intensive activities and to developingcountries in selected regions such as South Asia, Africa, and the Middle East.
Hence, in terms of negotiating strategy, the focus has to be on India’s owncommitments in this sector, stemming from its import requirements in this sector and thepotential benefits from liberalization. However, at the same time, the negotiating strategymust take into account domestic political economy constraints to committing under theGATS. On the export side, while the issue of obtaining market access for Indian servicepersonnel providing environmental support services is relevant, it is part of the broadernegotiations on mode 4 as a cross-cutting issue and not directly a part of India’snegotiating strategy in this particular sector.
The following discussion starts by outlining the issues that need to be kept in mindwhen committing environmental services under the GATS. It highlights the potential gainsfrom opening up the environmental services sector and the objectives that should be servedwhen committing this sector along with the political economy type concerns that need tobe kept in mind in framing the commitments. This is followed by a discussion of thespecific negotiating strategy India should adopt in this sector, in terms of specificsubsectors and activities where could take commitments, the nature of these commitments,and areas which should be excluded from the commitment process.
63 Overall the sector remains largely in the realm of the public sector (local and municipal bodies).
44
6.1 Issues to Consider in Liberalizing Environmental Services
The potential direct and indirect gains from liberalization of the environmentalservices sector are considerable. Liberalization can provide much needed capital andtechnological expertise in environmental management, since the domestic sector has poorinvestment in clean R&D. For a labour-abundant country like India the growth of theenvironmental service sector would also mean increased employment generation. Theexpansion in the environmental services sector can provide employment opportunities tounskilled as well as skilled labour in the country, as some of the environmental segmentsare labour intensive like waste management, sanitation, consulting, training, etc.Moreover, given that environmental services are typically provided in conjunction withother products or services, expansion of the environmental services sector would generatedemand in other sectors including, engineering and design, construction, research anddevelopment, training, and consulting. There would also be additional external benefits interms of improvement in environmental quality, more cost effective and environmentally-sound approaches to resource use in a whole gamut of industrial activities that canconceivably reduce costs and prices in associated commodity markets, and greater resourceefficiency for the economy at large. There could also be positive spillover effects inexport-oriented sectors like tourism. Liberalization can also promote competition andimprove managerial operations in sectors that have been traditional public in nature. Asmentioned earlier, autonomously, India has opened up this sector to 100% foreign equityparticipation on automatic basis. Hence, the FDI policy is already in line with the importneeds in this sector.
While the potential benefits from liberalizing environmental services and theautonomous liberalization already undertaken in this sector would argue for unrestrictedopening up of the sector under the GATS, such an approach may not be feasible from anegotiating strategy and domestic political economy perspective. A selective approach maybe more acceptable in terms of the subsectors that are committed under the GATS and interms of the limitations and exclusions that are maintained in this sector. This approach isjustified on several grounds. Firstly, given that the sector had not even been scheduled inthe Uruguay Round, it may be difficult to undertake complete opening up under the GATSin this round. A more gradual opening up may thus be more palatable as a negotiatingstrategy. Secondly, given the nascent domestic environmental services sector which mayrequire time to develop expertise, consolidate, and be prepared to face foreign competition,a gradual approach to multilateral liberalization of this sector may be in the interest ofdomestic industry and would be less likely to encounter opposition. Thirdly, therelationship between trade and the environment is not yet well understood and is still underdiscussion at the WTO. As thinking is still evolving on the subject of environment andtrade, to ensure harmony in the country’s overall position on this matter, a gradualapproach to environmental services is justified. And finally, since there is limitedexperience with private participation in the environmental services sector, the state ofknowledge about the likely impact of opening up and the cost-benefit tradeoff is poor, agradual approach under the GATS is justified.
45
6.2 Specific Commitment Strategy
India needs to first take a position on whether it will schedule environmentalservices in this round of negotiations. In view of the likely gains from FDI and associatedtechnology and expertise in this sector, and the fact that this sector appears in the requestlist of all the major developed countries, it is in India’s interests to schedule the sector froman economic and negotiating perspective. But, for the reasons outlined above,commitments need to be judiciously taken, in select areas within the sector, with necessaryrestrictions, and with necessary exclusions.
It is proposed that all environmental services that are under government monopolyshould be excluded from the commitments. However, government services which havebeen contracted out or privatized, (as is the case with some municipal services likecleaning and refuse disposal in India), can be included in the commitments. This approachmirrors that taken by developed countries like the US and Sweden. For instance, theSwedish commitment on environmental services states that public works functions,whether owned and operated by municipalities, local bodies, state, or federal governments,would not be covered. Likewise, the recent US offer covers activities like waste watermanagement services and solid/hazardous waste management services that have beencontracted out to private industry and excludes services provided under governmentmonopoly. In addition to the latter exclusion, services relating to potable water supplyshould also be excluded from India's commitments. The latter is in view of equity concernsthat liberalization of water supply could result in higher prices of drinking water and affectthe poor sections adversely.
It is further proposed that sectoral commitments only be considered for activitieswhere there has been at least a few years of experience with private participation, includingforeign participation. This approach is again suggested not so much from the point of viewof the likely gains but from the point of view of what is acceptable domestically toundertake under the GATS and what is practically feasible to commit. As mentionedearlier, foreign participation has taken place in recycling, industrial and vehicularpollution, industrial waste management, biomedical waste management, pollution testingand monitoring, and consulting and engineering services. Among these activities,commitments could be taken as per the new classification that has been proposed for thissector, in the following areas:
(1) Industrial waste water services
(2) Industrial solid waste management services, including collection, segregation,and recycling of solid waste
(3) Services to control air pollution and improve air quality
(4) Services to control noise pollution and related testing and monitoring services
(5) Remediation services
(6) Environmental consulting, design, and engineering services
46
In areas (1) to (5) above, commitments in mode 1 can be full if technically feasibleor no commitment may be taken (unbound entry inscribed) if mode 1 based supply is notfeasible. Commitments in mode 2 can be full as this is not an important mode for trade inthis sector and there are no major issues or concerns that arise in this mode for this sector.
Commitments in mode 3 could be partial. The limitations could take the form offoreign equity ceilings with majority participation allowed, so as to afford some protectionto the domestic players in these segments while also creating some competition to improvestandards and efficiency, and promote consolidation in market structure. Joint venturescould also be required under mode 3 in those segments in particular where transfer oftechnology and foreign managerial and technical expertise is desired. It would not beadvisable to impose national treatment limitations such as economic needs tests or localstaffing requirements if the aim is to attract foreign capital and technology. Suchlimitations are likely to discourage FDI. If required, conditions such as reinvestment ofproportion of profits in infrastructure or capacity building and regulations to ensureappropriateness of technology for local conditions, could be imposed on foreignenvironmental service firms. To the extent that regulations such as jurisdictionalrestrictions and local government approval are applicable to both domestic and foreignfirms, they would not constitute national treatment limitations and would not need to beinscribed, unless there is some discriminatory element in their application.
No sectoral commitments need be taken in mode 4 except as indicated in India’shorizontal commitments, with the proviso that required managerial and consultingexpertise in this sector are appropriately covered in the horizontal schedule.
Where it is difficult to commit multilaterally at present but where the intentions forliberalization are clear and the benefits well recognized, a more gradual approach could betaken by pre-committing to open up five years from now (as was done in thetelecommunications sector for ILD services). This would allow time to undertakenecessary steps to strengthen such segments domestically, to introduce necessary domesticregulations, and to build on recent privatization trends and learn from the experience.
In the case of environmental consulting, design, and engineering services (item 6above), a full commitment can be taken on mode 1 if technically feasible. Otherwise, thismode can be left unbound if it is not technically feasible to provide such services cross-border. Full commitments can be taken in mode 2 as there is little concern in liberalizingthis mode. A full commitment can be allowed under mode 3 for this segment, with 100%foreign equity participation allowed, or a partial commitment can be made by putting aforeign equity ceiling but allowing majority participation. In addition, there could berestrictions in terms of licensing requirements to ensure the quality of the service providerand measures to ensure that the technology is suitable to Indian conditions. Mode 4 canremain unbound except as specified in the horizontal schedule, with possible limitations inthe form of licensing and /or economic needs test requirements, and with the proviso thatthe required skills and occupational categories are appropriately covered in the horizontalschedule.
47
Thus, broadly speaking, some of the subsectors in the proposed new classificationcan be committed by India. Modes 1 and 2 can be liberally committed. Commercialpresence should be committed, but subject to conditions that protect consumer interestsand which prevent wiping out of the nascent domestic industry in many of these areas.Alternatively, a pre-commitment strategy could also be considered if a more gradualapproach is desired, with privatization being encouraged in the interim period. For now,services that are exclusively in the government domain, whether at the central, state,municipal, and local levels, should not be committed. Privatization and contracting out ofsuch services to private parties should be encouraged before these are committedmultilaterally.
It is worthwhile to note here that important markets like Korea have opened onlythe industrial sewage and industrial solid waste (refuse) disposal services, i.e., thecommitment does not infringe upon public sector operations. Korea has also imposed aneconomic needs test under Mode 3 for market access, and refuse collection and transportservices are to operate within the jurisdiction and with approval of the RegionalEnvironment Office. Such a strategy is aimed at giving impetus to the domesticenvironment industry, while opening the sector for foreign technology imports, capital andmanagement skills. Similarly, Thailand has committed to restricted market access underMode 3 with a 49 percent equity limitation. Even countries such as Sweden have excludedpublic sector operations from their commitments. There is thus merit to studying thecommitments made by other developing countries and even some of the developedcountries in this sector, to identify what the scope of India’s commitments should be andthe kinds of limitations that may be warranted. Overall, the commitments need to beselective in terms of choice of subsectors, activities within these subsector, and modes, andin terms of the choice of regulatory measures for safeguarding public interests, ensuringequity with efficiency, and providing a supportive environment to domestic privateplayers.
It is also important to note that India’s commitments in several related sectors arerelevant to its liberalization strategy in environmental services. Hence, there is need toensure that commitments in those areas are consistent with the approach outlined above forthis sector. For instance, commitments for construction of facilities and civil works,integrated engineering services, architecture and design services, and business services likeconsulting and auditing need to be consistent with the commitments in this sector,particularly under modes 3 and 4 and to some extent in mode 1, where technically feasible.Therefore, if a commitment is made to allow commercial presence for environmentalconsulting and support service firms, the schedule for consulting services should explicitlymention this commitment under mode 3, with the corresponding limitations. The sameholds for the accountancy services sector, where the commitments under audit services forinstance, should reflect the commitments made for environmental audit services. Anycarve outs must be similarly reflected in the related service sector schedules. Analternative approach would be to explicitly exclude environment related aspects from therelated service sector schedules and to deal with these activities only in the environmentalservice schedule, thus keeping the mutual exclusivity of the commitments in differentsectors. Overall, the commitment strategies for these related areas, as outlined in the
48
specific sectoral reports, must be kept in mind to ensure that all interests are taken intoaccount when scheduling environmental services, and that commitments in one area do notundermine commitments in the other.
7. Domestic Reforms and Measures
The public good nature of this sector gives rise to certain considerations andchallenges, which need to be factored into the process of liberalization. Privatization andliberalization in environmental services needs to ensure a balance between three broadobjectives, namely economic efficiency, social equity and environmental sustainability.For instance, equity issues are important in segments like provision of drinking water andsanitation, especially since the majority of the Indian population does not have theeconomic means of purchasing these essential services at market price. Regulations onpricing and business practices are required to ensure affordability, access, and quality ofservices. The GATS provisions pertinent to prevention of anticompetitive businesspractices or to ensure quality and equitable distribution of services are important fordealing with such challenges posed in liberalizing this sector. Some degree of governmentmonopoly in provision of environmental services such as water supply and distribution,may thus be warranted on equity grounds.
While embracing the encouraging the efficient development of the environmentalservices sector through privatization and liberalization, India needs to ensure that there areno potential conflicts in environmental sustainability either. The presence ofenvironmental externalities in trade in certain cases may have adverse environmentaleffects. For instance, the cost of recycling and disposal of hazardous wastes is relativelycheaper in India, typically since all of the environmental and health safety costs inprocessing and disposal are not internalized. Thus liberalization in recycling services(under hazardous waste management services) may lead to an increase in imports ofuntreated hazardous wastes as this segment expands (unless prohibited under TheHazardous Waste Management Rules of 1989 or the Basel Convention).64 In other words,the scale effect of free trade in this segment (and trade in the related good) can lead to anincrease in risk of contamination from hazardous pollutants in the developing countries.Since the pollution from hazardous pollutants can lead to irreparable damages to both theecosystem and human health, such an expansion may not be efficient nor desirable. I.e. theincreased risk involved would make the optimal level of services (here processing toxic/hazardous waste) much lower than that dictated by usual comparative advantagearguments.
Similarly with liberalization in nature protection and landscaping service, localecosystem characteristics have to be factored in while expertise from abroad is imported.Also if tourist flow increase due to better environmental infrastructure services and natureprotection services, caution may need to be exercised in nature tourism to protect certain 64 While India ratified the Basel Convention in 1992, the amendment on scrap trade for recycling and reuse
has not been ratified. Illegal import of hazardous wastes have also been reported at the Indian ports, eventhough the Supreme Court has banned the import and auction of hazardous wastes in ports and containerdepots.
49
fragile ecosystems (where increased flow of people can disturb the delicate balance of theecosystem). So accompanying regulations may be necessary to minimize damage to theenvironment.
Economic efficiency in this sector would require not only private participation inthe provision of services, but changes in domestic environmental regulations as well.These reforms are important to boost the demand for environmental services from themanufacturing sector and also to ensure the development of domestic enterprises.
It is important to observe that the nascent Indian environment industry has beenresponding fairly well to end-of-pipe pollution control legislation, and to support servicesof environmental consulting. Thus to stimulate the growth of the Indian environmentalservices industry, change towards a more holistic resource and pollution managementregime is required. Privatization and liberalization is important to instill the growth of acompetitive environmental services industry and to enhance the resource productivity. Aholistic approach to environmental management in India would help ensure environmentalsustainability with privatization and liberalization in the sector. To ensure social equity thegovernment needs give guidelines for contracts in this sector and also closely monitorbusiness activities in infrastructure environmental services.
7.1 Economic Instruments in Pollution Management
The development of the environment industry (equipment and services) inindustrialized countries was induced by stringent environmental policies and regulationsand their enforcement, as well as increasing public environmental awareness, corporateliability and recognition of the financial and quality gains from environment-relatedinvestments. The environmental regulation regimes included command and controlinstruments like pollution standards, as well as economic instruments (like pollution taxes,fees and liability) to prevent pollution and increase resource productivity. In India, whilethe environmental legislation is comprehensive enough, it lacks built-in economicincentives to prevent and reduce pollution.
The set of environmental regulations is quite extensive, but the focus is still on theinitial compliance of installing pollution abatement equipment, and environmentalclearance (and EIAs for some projects). As is evident this has supported the growth of theenvironment equipment segment, and the requirement of environmental impact assessmenthas encouraged the growth of environmental consulting services. The dynamic efficiencyto reduce pollution and support growth of the environment industry, however, iscompletely missing. Thus a change in the regulatory approach is needed to encourageinnovation in pollution and waste prevention strategies over conventional end-of-pipepollution and waste control, by introducing pollution taxes. This will immediately boostthe demand for environmental services from the manufacturing industry, especially forwastewater treatment, and for air pollution abatement.
50
7.2 Encouraging Private Investment in Infrastructure Environmental Services
Private sector participation in the infrastructure environmental services has beenpartial and limited in India. Of course, the full implementation of the 74th Amendments areexpected to take some time and municipal bodies probably will encourage more privateparticipation then. Privatization is important with liberalization in the environmentalservices, since it will give an impetus to domestic entrepreneurs to develop.
Full privatization in environmental services, however may not be desirable,considering distribution issues of basic services to the poor. Public-private partnershipsmay be more appropriate, since a government (whether national or local) agreement with aprivate sector operator is expected to safeguard the interest of the poor: including provisionof potable water or sewage services for the poorer population 65
7.3 Ensuring Equity with Efficiency
Liberalization and privatization in provision of environmental services is certainlya good viable option to enhance productivity and efficiency, but it needs regulation andmonitoring to ensure that monopolistic pricing is not practiced. The government needs toreinforce equity with efficiency in the environmental services sector, since some of themost significant environmental services are part of the basic public services to support ahealthy human existence.
The measures to ensure equity could include qualifications for private serviceproviders in terms of maximum prices for consumers, percentage of profits that should bereinvested in the infrastructure, etc. The equity issue is important in the light of presentpricing and business structure of some of the leading global environmental: with variousaffiliated divisions, where cross subsidization across markets may be practiced. Considerthe case of Vivendi Environment66, which is a part of Vivendi Universal in France:Vivendi France is a broad-based company with two seemingly different unconnecteddivisions, one in environmental services (namely Vivendi Environment), and the other incommunications, audio-visual and entertainment (including Universal Studios, UniversalMusic and USA Networks). The corporate profile of the company suggests that VivendiEnvironment, and especially Vivendi Water is often called Vivendi Universal’s “cash cow”as water utilities privatization contracts are the key source of funds for Vivendi’s extremelyexpensive foray into the communications field! During 2002, Vivendi Universal ran intoserious financial difficulties, and had to write off bad debts, as many believed that thecompany had over-stretched itself.
In our process of liberalizing of environmental services, the contracting details haveto be carefully drafted and monitored so as to eliminate the risk of Indian operations beingpart of the “cash cow” water utilities department for such large multinational corporations.
65 DFID (2002), p.28.66 Vivendi Environment is ranked “Number 1 worldwide in environmental services” has four arms: Vivendi
Water, Dalkia (in energy), Onyx (in waste management) and Connex (in transportation business).
51
To ensure equity in the provision of basic environmental services in developing countrieslike India, the government needs to have an appropriate framework while promotingefficiency.
7.4 Monitoring Firm Behaviour
The global environmental services industry consists of several large corporations,since the most significant environmental services support the emergence of naturalmonopoly. On efficiency grounds such large corporations need to exist, their operationsneed to be monitored closely. While liberalization in the Indian environmental sectorwould bring in state of the art technology with mature multinational environmental serviceproviders from the OECD countries, some of these firms do not have a provenenvironmental track record. For example, some of UK multinational water corporationshave been hauled up by UK’s Environment Agency as the country’s most pollutingcompanies as evident from the number of appearances in court and prosecutions during2000.
Moreover, mature environmental firms with deep pockets (or with cross-subsidization across affiliated markets) could indulge in anti-competitive practices.67 Thisis important for the Indian environmental services industry, which is still to develop into afull-fledged industry. It is important that the Indian environmental service providers areexposed to global competition in order to become efficient, but it is equally important toensure that restrictive business practices of large incumbent firms do not stifle theirgrowth. 68
8. Conclusion
The privatization and liberalization of environmental services promises gains forIndia in terms of access to capital, technology and competition from global firms thatemphasize resource efficiency. Moreover, given the deficiencies in the Indianenvironmental infrastructure services and basic amenities, including sewage, refuse andsanitation services, it is essential to bring about radical changes in these services. Theprocess started in 1992 with the 74th Amendment of the Constitution, and several Indiancities are encouraging liberalization in these services to increase productivity andefficiency. Moreover, the domestic environmental legislation affecting infrastructureenvironmental services like refuse disposal is fairly new (e.g. the Municipal Solid WasteManagement & Handling Rules of 2000), such that the municipalities across the country
67 This would imply the reverse of the point made earlier on equity issues, where the fear is that of over
charging. Here the reference is being made to short-term lowering of prices to out-bid newer firms incompetitive environmental projects, where the lower price quote is not based on cost efficiency butpredatory pricing strategy.
68 In this regard, GATS Articles VIII and IX on Monopoly Practices and Other Restrictive BusinessPractices, respectively, provide a framework for gaining information on foreign environmental servicefirms, and ensuring that large firms do not engage in any anti-competitive practices or abuse their marketpositions, as discussed earlier in Section 5.

52
and the domestic environment industry have only just begun to respond to the legalrequirements.
The emerging domestic environment industry needs to be given the opportunity torespond to environmental regulations, and more of such demand boosting environmentalreforms need to be in place before mature global environment service providers startoperating in the Indian market. It is also important to take a holistic view of environmentalmanagement, rather than a piece-meal approach, so, BOT and BOOT options may be moreappropriate rather than just management contracts. This would also help bring in state ofthe art technology besides much needed capital in the waste management andenvironmental remedial services.
Moreover, the privatization and liberalization in environmental services require astrong institutional and regulatory structure to monitor the activities of large environmentalservice providers to prevent anti-competitive and restrictive practices (especiallyconsidering equity issues in certain basic environmental services like drinking water andsanitation). Thus the privatization and commitment to liberalization needs to be supportedby a strong institutional framework.
At present the environment services sector is open autonomously, with upto 100%foreign equity participation. Hence, the FDI policy is already in line with the import needsin this sector. Yet the authors feel that unrestricted opening up of the sector under theGATS, is neither advisable from a negotiating strategy nor from the domestic politicaleconomy perspective. A selective commitment approach in terms of the subsectors hasbeen suggested along with limitations and exclusions. India should exclude allenvironmental services under government monopoly from the commitments (evenindustrialized member countries including the US and Sweden have done so in their initialoffers). However, government services which have been contracted out or privatized, (as isthe case with some municipal services like cleaning and refuse disposal in India), can beincluded in the commitments.
This cautious approach is justified on several grounds. First, given that the sectorhad not even been scheduled in the Uruguay Round, a more gradual opening up may bemore attractive as a negotiating strategy. Second, given the nascent domesticenvironmental services sector requires time to develop expertise, consolidate, and beprepared to face foreign competition, a gradual approach to multilateral liberalization ofthis sector may be in the interest of domestic industry. Also, since there is limitedexperience with private participation in the environmental services sector, the state ofknowledge about the likely impact of full commitment and the cost-benefit tradeoff ispoor, thus a gradual approach under the GATS is preferable.
53
References
Berg, David R. and Ferrier, Grant (1998) Meeting the Challenge: The US EnvironmentIndustry Faces the 21st Century, Office of Technology Policy, US Departmentof Commerce.
Butkevicience, Jolita, David Diaz Benavides, Manuela Tortora (2002) “ServicesPerformance in Developing Countries: Elements of the Assessment”, WTOSymposium on Assessment of Trade in Services, WTO Secretariat, March 14.
Butkevicience, Jolita (2002) “GATS Negotiations and Issues for Consideration in the Areaof Environmental Services from a Development Perspective”, Workshop onPost Doha Negotiating Issues on Trade and Environment in Paragraph 31,UNEP-UNCTAD, Singapore, May.
CII (1999) Directory of Environmental Enterprises in India, Confederation of IndianIndustry, New Delhi.
CII (1996) Environmental Business Opportunities in India, Confederation of IndianIndustry, New Delhi.
CPCB (1999) Status of Water Supply, and Wastewater Generation, Collection, Treatmentand Disposal in Class I Cities, CUPS/44/1999-2000, Central Pollution ControlBoard New Delhi.
CPCB (1999a) Status of Solid Waste Generation, Collection, Treatment and Disposal inMetrocities, CUPS/46/1999-2000, Central Pollution Control Board New Delhi.
CPCB (1999b) Status of Municipal Solid Waste Generation, Collection, Treatment andDisposal in Class I Cities, CUPS/48/1999-2000.
CPCB (1999c) Status of Water Supply, and Wastewater Generation, Collection, Treatmentand Disposal in Class II Cities, CUPS/49/1999-2000, Central Pollution ControlBoard New Delhi.
DFID/World Bank (2002) Linking Poverty Reduction and Environmental Management:Policy Challenge and Opportunities, DFID-UNDP-World Bank, January Draft.
Ferrier, Grant (2000) Environmental Industry Evolution Sets Up the Next IndustrialRevolution: Resource Productivity is the Key to Future Market Development ,January. http://www.environews.com
FIRE(D) (2002) “State Incentives to Increase Efficiencies in Urban Water Supply inMaharashtra”, Project No. 28, March, Indo-US Financial Institutions Reformand Expansion Project- Debt Market Component.
FIRE(D) (2001) “Emerging Private Sector Participation Arrangements for Solid WasteManagement in India”, Project Note No. 26, May, Indo-US FinancialInstitutions Reform and Expansion Project- Debt Market Component.
India State of the Environment Report 2001.
Jayaraman, Nityanand (2002) “Trashing Water is Good Business for Water Companies”,CorpWatch India, March 25.
54
Johnstone, Nick, Libby Wood and Robert Hearne (1999) The Regulation of Private SectorParticipation in Urban Water Supply and Sanitation: Realising Social andEnvironmental Objectives in Developing Countries”, Discussion Paper DP 99-01, International Institute of Environment and Development, U.K
Lovei, Magda and Bradford S. Gentry (2002) “The Environmental Implications ofPrivatization: Lessons for Developing Countries”, World Bank DiscussionPaper No. 426, World Bank, Washington D.C.
Ministry of Environment and Forest (2002) Annual Report 2001-02.
OECD (2000) “Environmental Goods and Services: An Assessment of the Environmental,Economic and Development Benefits of Further Global Trade Liberalization”,COM/TD/ENV(2000)86/FINAL, Trade Directorate and EnvironmentDirectorate, October.
UNCTAD (1998) Strengthening Capacities in Developing Countries to Develop TheirEnvironmental Services Sector, TD/B/COM.1/EM.7/2.
UNCTAD (1996) Services and the Environment, Report prepared by Paolo Bifani,UNCTAD/SDD/SER/6, March.
US DOC (2002) US Country Commercial Guide: India for Financial Year 2003 and 2002,US Commercial Service, Department of Commerce.
WTO (1998a) Environmental Services, Background Note by the Secretariat, S/C/W/46,July.
WTO (1998b) Environmental Benefits of Removing Trade Restrictions and Distortions,Note by Secretariat (Addendum), WT/CTE/W/67/Add.1, March.
WTO (1998c) “UNCTAD Expert Meeting on Strengthening Capacities in DevelopingCountries to Develop their Environmental Services Sector”, Communicationfrom UNCTAD, WT/CTE/W/96, August.
WTO (1995) Environment and Services, WT/CTE/W/9, June.
WTO (1991) Services Sectoral Classification List, MTN.GNS/W/120, July.
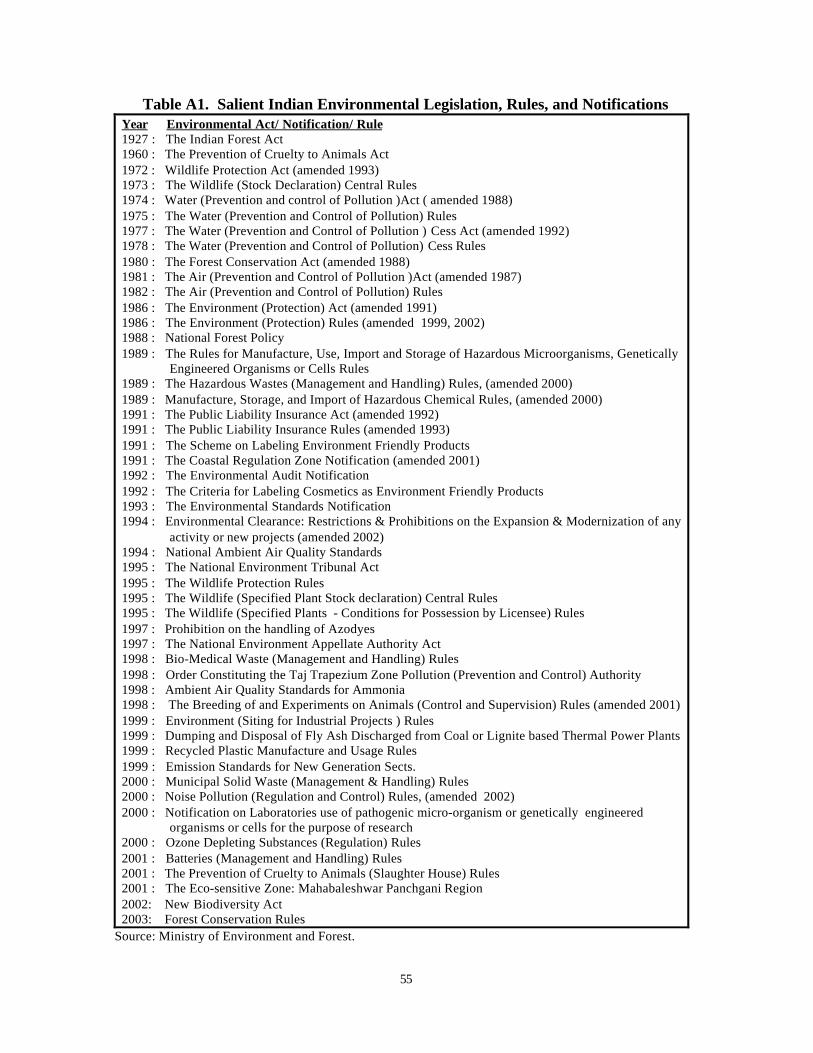
55
Table A1. Salient Indian Environmental Legislation, Rules, and NotificationsYear Environmental Act/ Notification/ Rule1927 : The Indian Forest Act1960 : The Prevention of Cruelty to Animals Act1972 : Wildlife Protection Act (amended 1993)1973 : The Wildlife (Stock Declaration) Central Rules1974 : Water (Prevention and control of Pollution )Act ( amended 1988)1975 : The Water (Prevention and Control of Pollution) Rules1977 : The Water (Prevention and Control of Pollution ) Cess Act (amended 1992)1978 : The Water (Prevention and Control of Pollution) Cess Rules1980 : The Forest Conservation Act (amended 1988)1981 : The Air (Prevention and Control of Pollution )Act (amended 1987)1982 : The Air (Prevention and Control of Pollution) Rules1986 : The Environment (Protection) Act (amended 1991)1986 : The Environment (Protection) Rules (amended 1999, 2002)1988 : National Forest Policy1989 : The Rules for Manufacture, Use, Import and Storage of Hazardous Microorganisms, Genetically
Engineered Organisms or Cells Rules1989 : The Hazardous Wastes (Management and Handling) Rules, (amended 2000)1989 : Manufacture, Storage, and Import of Hazardous Chemical Rules, (amended 2000)1991 : The Public Liability Insurance Act (amended 1992)1991 : The Public Liability Insurance Rules (amended 1993)1991 : The Scheme on Labeling Environment Friendly Products1991 : The Coastal Regulation Zone Notification (amended 2001)1992 : The Environmental Audit Notification1992 : The Criteria for Labeling Cosmetics as Environment Friendly Products1993 : The Environmental Standards Notification1994 : Environmental Clearance: Restrictions & Prohibitions on the Expansion & Modernization of any
activity or new projects (amended 2002)1994 : National Ambient Air Quality Standards1995 : The National Environment Tribunal Act1995 : The Wildlife Protection Rules1995 : The Wildlife (Specified Plant Stock declaration) Central Rules1995 : The Wildlife (Specified Plants - Conditions for Possession by Licensee) Rules1997 : Prohibition on the handling of Azodyes1997 : The National Environment Appellate Authority Act1998 : Bio-Medical Waste (Management and Handling) Rules1998 : Order Constituting the Taj Trapezium Zone Pollution (Prevention and Control) Authority1998 : Ambient Air Quality Standards for Ammonia1998 : The Breeding of and Experiments on Animals (Control and Supervision) Rules (amended 2001)1999 : Environment (Siting for Industrial Projects ) Rules1999 : Dumping and Disposal of Fly Ash Discharged from Coal or Lignite based Thermal Power Plants1999 : Recycled Plastic Manufacture and Usage Rules1999 : Emission Standards for New Generation Sects.2000 : Municipal Solid Waste (Management & Handling) Rules2000 : Noise Pollution (Regulation and Control) Rules, (amended 2002)2000 : Notification on Laboratories use of pathogenic micro-organism or genetically engineered
organisms or cells for the purpose of research2000 : Ozone Depleting Substances (Regulation) Rules2001 : Batteries (Management and Handling) Rules2001 : The Prevention of Cruelty to Animals (Slaughter House) Rules2001 : The Eco-sensitive Zone: Mahabaleshwar Panchgani Region2002: New Biodiversity Act2003: Forest Conservation Rules
Source: Ministry of Environment and Forest.
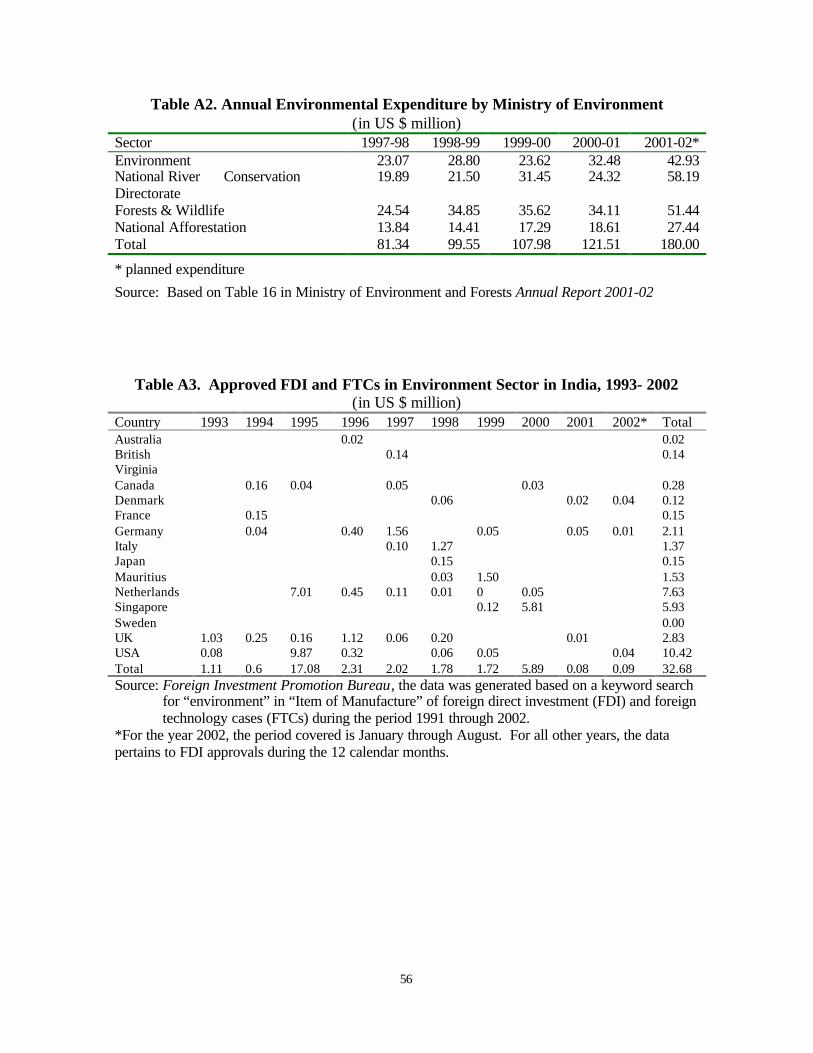
56
Table A2. Annual Environmental Expenditure by Ministry of Environment(in US $ million)
Sector 1997-98 1998-99 1999-00 2000-01 2001-02*Environment 23.07 28.80 23.62 32.48 42.93National River ConservationDirectorate
19.89 21.50 31.45 24.32 58.19
Forests & Wildlife 24.54 34.85 35.62 34.11 51.44National Afforestation 13.84 14.41 17.29 18.61 27.44Total 81.34 99.55 107.98 121.51 180.00
* planned expenditure
Source: Based on Table 16 in Ministry of Environment and Forests Annual Report 2001-02
Table A3. Approved FDI and FTCs in Environment Sector in India, 1993- 2002(in US $ million)
Country 1993 1994 1995 1996 1997 1998 1999 2000 2001 2002* TotalAustralia 0.02 0.02BritishVirginia
0.14 0.14
Canada 0.16 0.04 0.05 0.03 0.28Denmark 0.06 0.02 0.04 0.12France 0.15 0.15Germany 0.04 0.40 1.56 0.05 0.05 0.01 2.11Italy 0.10 1.27 1.37Japan 0.15 0.15Mauritius 0.03 1.50 1.53Netherlands 7.01 0.45 0.11 0.01 0 0.05 7.63Singapore 0.12 5.81 5.93Sweden 0.00UK 1.03 0.25 0.16 1.12 0.06 0.20 0.01 2.83USA 0.08 9.87 0.32 0.06 0.05 0.04 10.42Total 1.11 0.6 17.08 2.31 2.02 1.78 1.72 5.89 0.08 0.09 32.68Source: Foreign Investment Promotion Bureau, the data was generated based on a keyword search
for “environment” in “Item of Manufacture” of foreign direct investment (FDI) and foreigntechnology cases (FTCs) during the period 1991 through 2002.
*For the year 2002, the period covered is January through August. For all other years, the datapertains to FDI approvals during the 12 calendar months.
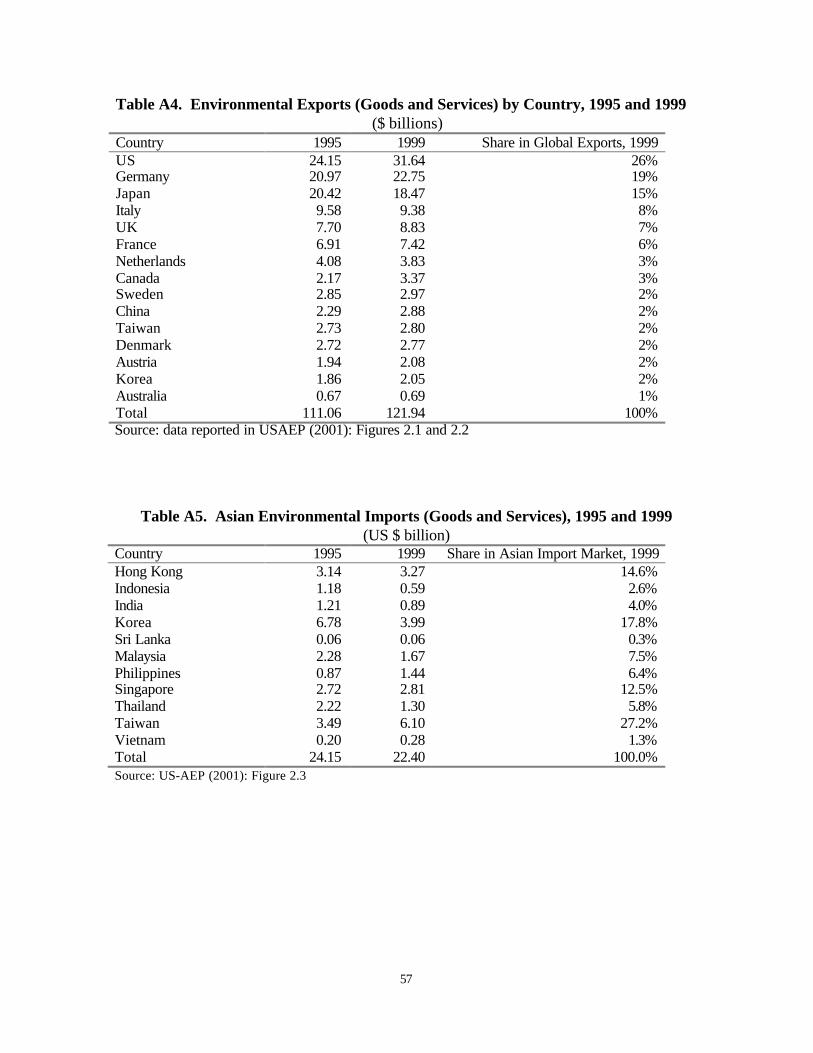
57
Table A4. Environmental Exports (Goods and Services) by Country, 1995 and 1999($ billions)
Country 1995 1999 Share in Global Exports, 1999US 24.15 31.64 26%Germany 20.97 22.75 19%Japan 20.42 18.47 15%Italy 9.58 9.38 8%UK 7.70 8.83 7%France 6.91 7.42 6%Netherlands 4.08 3.83 3%Canada 2.17 3.37 3%Sweden 2.85 2.97 2%China 2.29 2.88 2%Taiwan 2.73 2.80 2%Denmark 2.72 2.77 2%Austria 1.94 2.08 2%Korea 1.86 2.05 2%Australia 0.67 0.69 1%Total 111.06 121.94 100%Source: data reported in USAEP (2001): Figures 2.1 and 2.2
Table A5. Asian Environmental Imports (Goods and Services), 1995 and 1999(US $ billion)
Country 1995 1999 Share in Asian Import Market, 1999Hong Kong 3.14 3.27 14.6%Indonesia 1.18 0.59 2.6%India 1.21 0.89 4.0%Korea 6.78 3.99 17.8%Sri Lanka 0.06 0.06 0.3%Malaysia 2.28 1.67 7.5%Philippines 0.87 1.44 6.4%Singapore 2.72 2.81 12.5%Thailand 2.22 1.30 5.8%Taiwan 3.49 6.10 27.2%Vietnam 0.20 0.28 1.3%Total 24.15 22.40 100.0%Source: US-AEP (2001): Figure 2.3
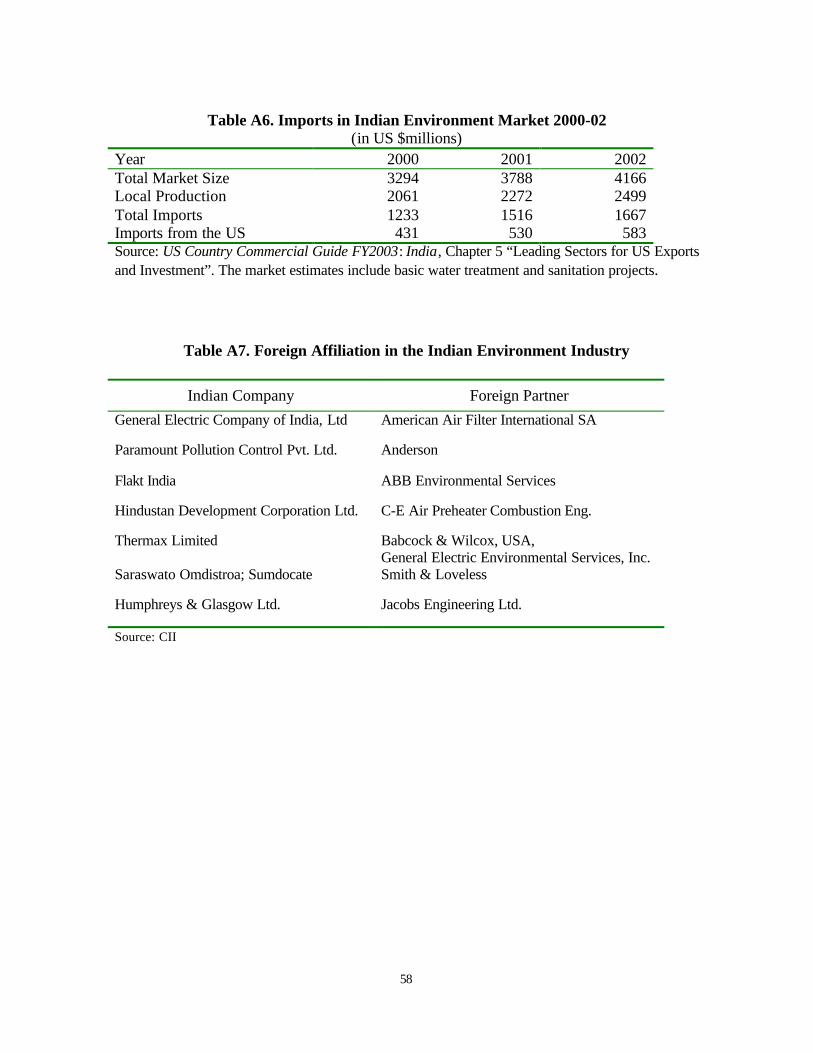
58
Table A6. Imports in Indian Environment Market 2000-02(in US $millions)
Year 2000 2001 2002Total Market Size 3294 3788 4166Local Production 2061 2272 2499Total Imports 1233 1516 1667Imports from the US 431 530 583Source: US Country Commercial Guide FY2003: India, Chapter 5 “Leading Sectors for US Exportsand Investment”. The market estimates include basic water treatment and sanitation projects.
Table A7. Foreign Affiliation in the Indian Environment Industry
Indian Company Foreign Partner
General Electric Company of India, Ltd American Air Filter International SA
Paramount Pollution Control Pvt. Ltd. Anderson
Flakt India ABB Environmental Services
Hindustan Development Corporation Ltd. C-E Air Preheater Combustion Eng.
Thermax Limited Babcock & Wilcox, USA,General Electric Environmental Services, Inc.
Saraswato Omdistroa; Sumdocate Smith & Loveless
Humphreys & Glasgow Ltd. Jacobs Engineering Ltd.
Source: CII