Embed Size (px)
Citation preview
No 2005 – 07May
Trade Liberalisation, Growth and Poverty in Senegal:A Dynamic Microsimulation CGE Model Analysis
_____________
Nabil Annabi, Fatou Cissé, John Cockburn& Bernard Decaluwé
Trade Liberalisation, Growth and Poverty in Senegal:A Dynamic Microsimulation CGE Model Analysis
_____________
Nabil Annabi, Fatou Cissé, John Cockburn& Bernard Decaluwé
No 2005 – 07May
Trade Liberalisation, Growth and Poverty in Senegal
3
TABLE OF CONTENTS
SUMMARY ..............................................................................................................................4
ABSTRACT..............................................................................................................................4
RÉSUMÉ .................................................................................................................................5
RÉSUMÉ COURT .....................................................................................................................5
1. INTRODUCTION ................................................................................................................6
2. Overview of trade policy reforms in Senegal ..........................................................7
3. METHODOLOGY...............................................................................................................8
3.1. Model Features ........................................................................................................8Static module..........................................................................................................8Dynamic module ....................................................................................................9
3.2. Data preparation ....................................................................................................11The Social accounting matrix ...............................................................................11The household survey of 1995 (ESAM I).............................................................12
4. SIMULATION AND RESULTS............................................................................................13
4.1. Poverty and Inequality in the BaU scenario ..........................................................134.2. Unilateral trade liberalisation effects.....................................................................17
Macro effects........................................................................................................18Sectoral effects .....................................................................................................19Welfare effects .....................................................................................................20Poverty and distributional effects .........................................................................20
5. CONCLUSION..................................................................................................................21
REFERENCES........................................................................................................................24
ANNEX..................................................................................................................................27
LIST OF WORKING PAPERS RELEASED BY CEPII ...............................................................36
CEPII, Working Paper No 2005-07
4
TRADE LIBERALISATION, GROWTH AND POVERTY IN SENEGAL:A DYNAMIC MICROSIMULATION CGE MODEL ANALYSIS
SUMMARY
Much current debate focuses on the role of growth in alleviating poverty. However, themajority of computable general equilibrium (CGE) models used in poverty and inequalityanalysis are static in nature. The inability of this kind of model to account for growth(accumulation) effects makes them inadequate for long run analysis of the poverty andinequality impacts of economic policies. They exclude accumulation effects and do notallow the study of the transition path of the economy where short run policy impacts arelikely to be different from those of the long run. To overcome this limitation we use asequential dynamic CGE microsimulation model that takes into account accumulationeffects and makes it possible to study poverty and inequality through time. Changes inpoverty are then decomposed into growth and distribution components in order to examinewhether de-protection and factor accumulation are pro-poor or not.
The model is applied to Senegalese data using a 1996 social accounting matrix and a 1995survey of 3278 households. The main findings of this study are that trade liberalisationinduces small increases in poverty and inequality in the short run as well as contractions inthe initially protected agriculture and industrial sectors. In the long run, it enhances capitalaccumulation, particularly in the service and industrial sectors, and brings substantialdecreases in poverty. However, a decomposition of poverty changes shows that incomedistribution worsens, with greater gains among urban dwellers and the non-poor.
ABSTRACT
An integrated sequential dynamic computable general equilibrium model is used to studythe potential poverty and inequality effects of a complete tariff removal in Senegal. Themodel is calibrated with a 1996 social accounting matrix and a 1995 survey of 3278households. The outcomes indicate small short run negative impacts in terms of welfare andpoverty. In the long run, growth effects captured by the model bring an expansion of theindustrial and services sectors and substantial poverty decreases. However, thedecomposition of the results shows that the contribution of the redistribution component topoverty alleviation is negative.
Keywords: Dynamic CGE model, trade liberalisation, poverty, inequality,Senegal.
JEL: D33, D58, E27, F17, I32, O15, O55.
Trade Liberalisation, Growth and Poverty in Senegal
5
LIBÉRALISATION COMMERCIALE, CROISANCE ET PAUVRETÉ AU SÉNÉGAL :UNE ANALYSE PAR MICROSIMULATION EN ÉQUILIBRE GÉNÉRAL DYNAMIQUE
RÉSUMÉ
Un grand débat actuel se concentre sur le rôle de la croissance dans l’allégement de lapauvreté. Cependant, la majeure partie des modèles d’équilibre général calculables(MEGC) utilisés dans l’analyse de pauvreté et d’inégalité est de nature statique. Ce type demodèle est inadapté à l’analyse de long terme des impacts des politiques économiques surla pauvreté et l’inégalité du fait qu’il ne prend pas en compte les effets de croissance(accumulation). De plus, ces modèles statiques ne permettent pas l’étude de la dynamiquetransitoire où les effets de court terme peuvent être différents de ceux du long terme. Afinde dépasser cette limite, nous proposons d’utiliser un MEGC microsimulé séquentiel pourétudier les effets dynamiques de pauvreté et d’inégalité. Les changements dans les taux depauvreté peuvent alors être décomposés en effets de croissance et en effets distributifs pourvérifier si la libéralisation commerciale et l’accumulation de facteurs sont pro pauvre ounon.
Le modèle est appliqué au cas sénégalais à l’aide d’une matrice de comptabilité sociale de1996 et de l’enquête auprès de 3278 ménages de 1995. Les principaux résultats de cetteétude montrent que la libéralisation des échanges induit des faibles augmentations de lapauvreté et de l’inégalité à court terme ainsi qu’une contraction des secteurs agricole etindustriel initialement protégés. En revanche, dans le long terme la baisse des tarifsdouaniers stimule les investissements, en particulier dans les secteurs de l’industrie et desservices et entraînement une importante diminution de la pauvreté. Toutefois, ladécomposition des changements dans les taux de pauvreté révèle une détérioration de ladistribution des revenus avec des gains supérieurs parmi les ménages urbains et les nonpauvres.
RÉSUMÉ COURT
Un modèle d’équilibre général microsimulé dynamique est utilisé pour étudier les effetspotentiels de l’élimination complète des tarifs douaniers sur la pauvreté et l’inégalité auSénégal. Le modèle est calibré à l’aide d’une matrice de comptabilité sociale de 1996 et del’enquête auprès de 3278 ménages de 1995. Les résultats indiquent une baisse du bien êtreet une augmentation de la pauvreté à court terme. A long terme, les effets de croissancecaptés par le modèle entraînent une expansion des secteurs de l’industrie et des services, etune diminution importante de la pauvreté. Toutefois, la décomposition des résultats montreque la contribution de la redistribution à l’allégement de la pauvreté est négative.
Keywords: Dynamic CGE model, trade liberalisation, poverty, inequality,Senegal.
JEL: D33, D58, E27, F17, I32, O15, O55.
CEPII, Working Paper No 2005-07
6
TRADE LIBERALISATION, GROWTH AND POVERTY IN SENEGAL:A DYNAMIC MICROSIMULATION CGE MODEL ANALYSIS
Nabil Annabi, Fatou Cissé, John Cockburn and Bernard Decaluwé1
1. INTRODUCTION
Most empirical studies find relatively small welfare and poverty impacts of tradeliberalisation. This result is not very surprising as a static framework is generally used inwhich welfare gains and poverty impacts result solely from a short term reallocation ofresources. We contribute to this literature by integrating the growth effects of tradeliberalisation and the resulting long-run impacts on welfare and poverty. To do so, we arguethat an integrated dynamic microsimulation model is the appropriate instrument.
We apply our framework to the Senegalese economy and we examine the poverty andincome distribution effects of a complete trade liberalisation policy. Following Datt andRavallion (1992) and Kakwani (1997), changes in poverty are decomposed into growth anddistribution components in order to examine whether trade liberalisation and factoraccumulation are pro-poor or not. The main findings are that trade liberalisation inducessmall increases in poverty and inequality in the short run as well as contractions in theinitially protected agriculture and industrial sectors. In the long run, it enhances capitalaccumulation, particularly in the service and industrial sectors, and brings substantialdecreases in poverty. However, a decomposition of poverty changes shows that incomedistribution worsens, with greater gains among urban dwellers and the non-poor.
The remainder of this paper is as follows. Sections two presents a brief overview of tradepolicy in Senegal. Section three describes the data and the model used in this paper. Insection four we analyse the potential implications for production, poverty and incomedistribution of complete trade liberalisation in Senegal. Finally, section five concludes.
1 N. Annabi, J. Cockburn and B. Decaluwé : CIRPEE and PEP, Université Laval, Quebec, Canada.
F. Cissé : CRES, Université Cheikh Anta Diop, Dakar, Senegal.Corresponding author: Nabil Annabi, Pavillon J.A. DeSève, Office 2146, Quebec, Canada G1K 7P4 .Quebec, Canada G1K 7P4Pavillon J.A. DeSève, Office 2146; [email protected]
Notes: We are grateful to the participants at the 3rd Poverty and Economic Policy (PEP) GeneralMeeting in Dakar, the International Conference on Policy Modeling in Paris, the IV workshop onInternational Economics in Malaga (2004), to L. Alan Winters and Sébastien Jean for their valuablecomments. We also thank Abdelkrim Araar and Jean-Yves Duclos for releasing the new DADsoftware module used in this paper. All errors are our own responsibility.
Trade Liberalisation, Growth and Poverty in Senegal
7
2. Overview of trade policy reforms in Senegal
Trade policy in Senegal had been marked by two main periods. The post-independenceimport-substitution policy (1960-1980) was based on high tariff rates, export subsidies andthe creation of an offshore zone in Dakar in 1974. Although, these measures providedprotection to a large number of domestic firms, they had a negative impact on exportperformance without generating substantial tariff income for the government. Thesepolicies were liberalized from 1980 onwards in the context of various structural adjustmentprograms in the hope of encouraging more efficient resource allocation.
The 100 percent devaluation of the CFA franc in 1994 was an important step in this reformprocess. Senegal also joined the WTO in 1995 and, following the Uruguay round,consolidated its tariff rates around 30 percent. Quotas have been progressively eliminatedand replaced by a temporary surtax on basic goods. In addition, Senegal reduced the levelof domestic support to agricultural products. At the regional level, Senegal is a foundingmember of the Economic Community of Western African States (known as CEDEAO),which has the objective of freer trade at the regional level and the creation of a CommonExternal Tariff (CET). Since 1994 commercial sector liberalisation has been reinforced byWestern African Economic and Monetary Union (known as UEMOA) reforms. Theobjectives of the latter are: the convergence of economic policies and performances of itsmembers; the creation of a customs union; the coordination of sectoral policies regardingthe simplification of tariff structures that were enhanced by the approval of the CET in2000. In 2003, CEDEAO and UEMOA began negotiating a free trade agreement with theEuropean Union. Furthermore, Senegal is negotiating with Tunisia, Morocco and Egypt fornew trade agreements in the context of UEMOA.
In spite of the fact that Senegal as a less developed country (LDC) has benefited fromaccess to the European and North American markets for products such as textiles, and itsincreasing participation in different trade agreements, its exports are not expandingsignificantly.
2 This appears to be due to high production costs and low product quality that
makes Senegalese exports less competitive on the world market. Moreover, the domesticsupport and subsidies for European farmers and strict European quality norms representserious restrictions to access.
2 Senegal benefits from preferential access under the European “Everything But Arms” (EBA) proposal and
of the American “African Growth Opportunity Act” (AGOA), which offer duty-free access for all productsof the generalised system of preferences (GSP) including textile and clothing. In addition, since 2003Senegal has benefited from the Canadian initiative of eliminating duties and quotas on most imports fromLDCs.
CEPII, Working Paper No 2005-07
8
3. METHODOLOGY
To assess the potential effects of trade liberalisation on production, poverty and inequalityin Senegal, we develop a sequential dynamic microsimulation CGE model. In combiningthe growth aspects of a dynamic CGE model with the detailed information provided bymicrosimulation techniques, we are in a position to adequately measure the poverty impactsof trade liberalisation. We follow the integrated microsimulation approach developedrecently by Decaluwé et al. (1999), Cockburn (2001) and Cogneau and Robillard (2001)
3
The dynamic CGE model is calibrated using a social accounting matrix for the year 1996and the 1995 Senegalese Household Expenditure Survey (ESAM I). In using the integratedmicrosimulation approach we are able to take into account household heterogeneity interms of income sources (notably factor endowments) and consumption patterns. In thefollowing sections we briefly describe the model and the data used.
3.1. Model Features
Dynamic general equilibrium models can be classified as intertemporal or sequential(recursive). Intertemporal dynamic models are based on optimal growth theory where thebehaviour of economic agents is characterized by perfect foresight. In a number ofcircumstances, and particularly in a developing country, it is hard to assume that agentshave perfect foresight. For this reason we believe that it is much more appropriate todevelop a sequential dynamic CGE model. In this kind of dynamics the agents have myopicbehaviour. A sequential dynamic model is basically a series of static CGE models that arelinked between periods by behavioural equations for endogeneous variables and byupdating procedures for exogenous variables. Capital stock is updated endogenously with acapital accumulation equation, whereas population (and total labour supply) is updatedexogenously between periods. It is also possible to add updating mechanisms for othervariables such as public expenditure, transfers, technological change or debt accumulation.Below we present a brief description of the static and dynamic aspects of the model. Acomplete list of equations and variables is presented in the annex.
Static module
Activities. On the production side we assume that in each sector there is a representativefirm that generates value added by combining labour and capital. We adopt a nestedstructure for production. Sectoral output is a Leontief function of value added and totalintermediate consumption. Value added is in turn represented by a CES function of labourand capital in the non-agricultural sectors (industry and services), and a CES function ofland and a composite factor in agriculture. The latter is also represented by a CES functionof primary factors: agricultural capital and labour. Value added in the public sector isgenerated by labour alone. Labour is assumed to be fully mobile in the model.
3 For a review on microsimulation techniques see Davies (2003).
Trade Liberalisation, Growth and Poverty in Senegal
9
Households. They earn their income from production factors: labour, land and capital. Theyalso receive dividends, intra-household transfers, government transfers and remittances.They pay direct income tax to the government. Household savings are a fixed proportion oftotal disposable income. Household demand is derived from a C-D utility function. Themodel includes 3278 households from the household survey.
Firms. There is one representative firm which earns capital income, pays dividends tohouseholds and foreigners and pays direct income taxes to the government.
Foreign Trade. We assume that foreign and domestic goods are imperfect substitutes. Thisgeographical differentiation is introduced by the standard Armington assumption with aconstant elasticity of substitution function (CES) between imports and domestic goods. Onthe supply side, producers make an optimal distribution of their production between exportsand domestic sales according to a constant elasticity of transformation (CET) function.Furthermore, we assume a finite elasticity export demand function
4. Even if we assume that
international terms of trade are given we reject the small country assumption for Senegaland assume that foreign demand for Senegalese exports is less than infinite. In order toincrease their exports, local producers must decrease their free on board (FOB) prices.
Government. The government receives direct tax revenue from households and firms andindirect tax revenue on domestic and imported goods. Its expenditure is allocated betweenthe consumption of goods and services (including public wages) and transfers. The modelaccounts for indirect or direct tax compensation in the case of a tariff cut.
Equilibrium. General equilibrium is defined by the equality (in each period) between supplyand demand of goods and factors, and the investment-saving identity.
Dynamic module
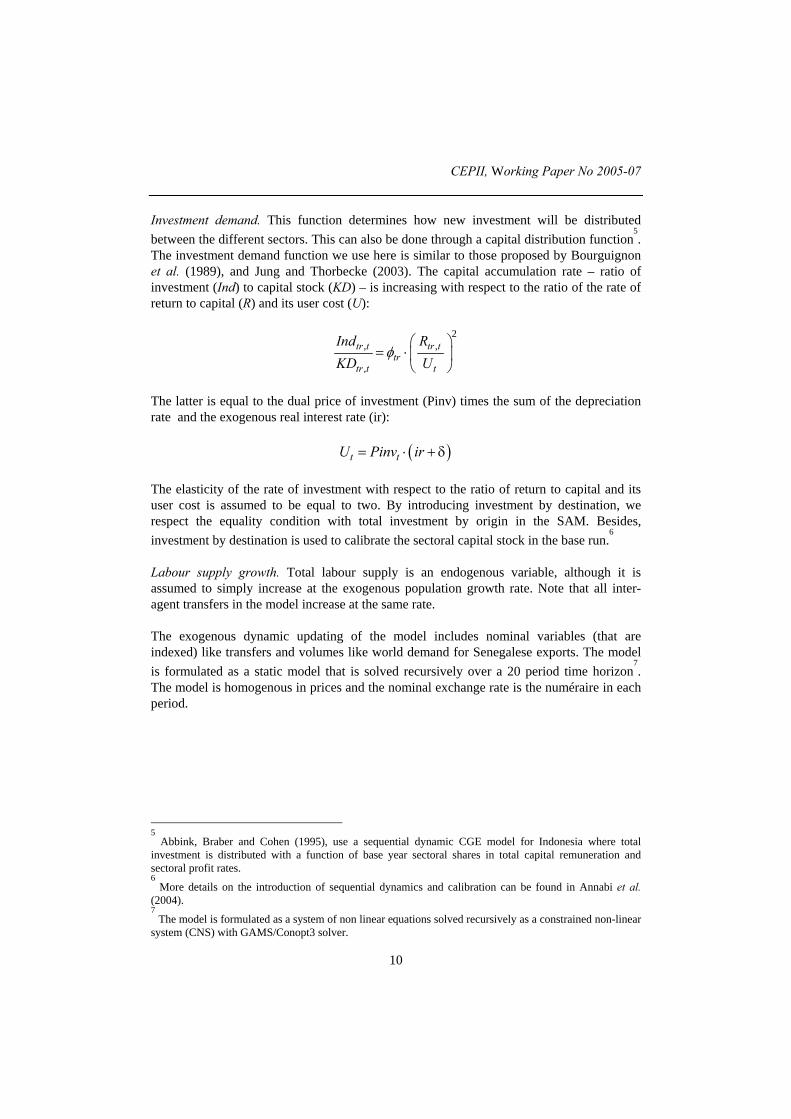
Capital accumulation. In every period the capital stock (KD) is updated with a capitalaccumulation equation involving the rate of depreciation (δ) and investment (Ind):
( ), 1 , ,1+ = − +tr t tr t tr tKD KD Indδ
This equation describes the law of motion for the sectoral capital stock. It assumes thatstocks are measured at the beginning of the period and that the flows are measured at theend of the period.
4 The long run export demand elasticity is assumed equal to ten.
CEPII, Working Paper No 2005-07
10
Investment demand. This function determines how new investment will be distributedbetween the different sectors. This can also be done through a capital distribution function
5.
The investment demand function we use here is similar to those proposed by Bourguignonet al. (1989), and Jung and Thorbecke (2003). The capital accumulation rate – ratio ofinvestment (Ind) to capital stock (KD) – is increasing with respect to the ratio of the rate ofreturn to capital (R) and its user cost (U):
2, ,
,φ
⎛ ⎞= ⋅ ⎜ ⎟
⎝ ⎠
tr t tr ttr
tr t t
Ind RKD U
The latter is equal to the dual price of investment (Pinv) times the sum of the depreciationrate and the exogenous real interest rate (ir):
( )= ⋅ + δt tU Pinv ir
The elasticity of the rate of investment with respect to the ratio of return to capital and itsuser cost is assumed to be equal to two. By introducing investment by destination, werespect the equality condition with total investment by origin in the SAM. Besides,investment by destination is used to calibrate the sectoral capital stock in the base run.
6
Labour supply growth. Total labour supply is an endogenous variable, although it isassumed to simply increase at the exogenous population growth rate. Note that all inter-agent transfers in the model increase at the same rate.
The exogenous dynamic updating of the model includes nominal variables (that areindexed) like transfers and volumes like world demand for Senegalese exports. The modelis formulated as a static model that is solved recursively over a 20 period time horizon
7.
The model is homogenous in prices and the nominal exchange rate is the numéraire in eachperiod.
5 Abbink, Braber and Cohen (1995), use a sequential dynamic CGE model for Indonesia where total
investment is distributed with a function of base year sectoral shares in total capital remuneration andsectoral profit rates.6 More details on the introduction of sequential dynamics and calibration can be found in Annabi et al.
(2004).7 The model is formulated as a system of non linear equations solved recursively as a constrained non-linear
system (CNS) with GAMS/Conopt3 solver.
Trade Liberalisation, Growth and Poverty in Senegal
11
3.2. Data preparation
The Social accounting matrix
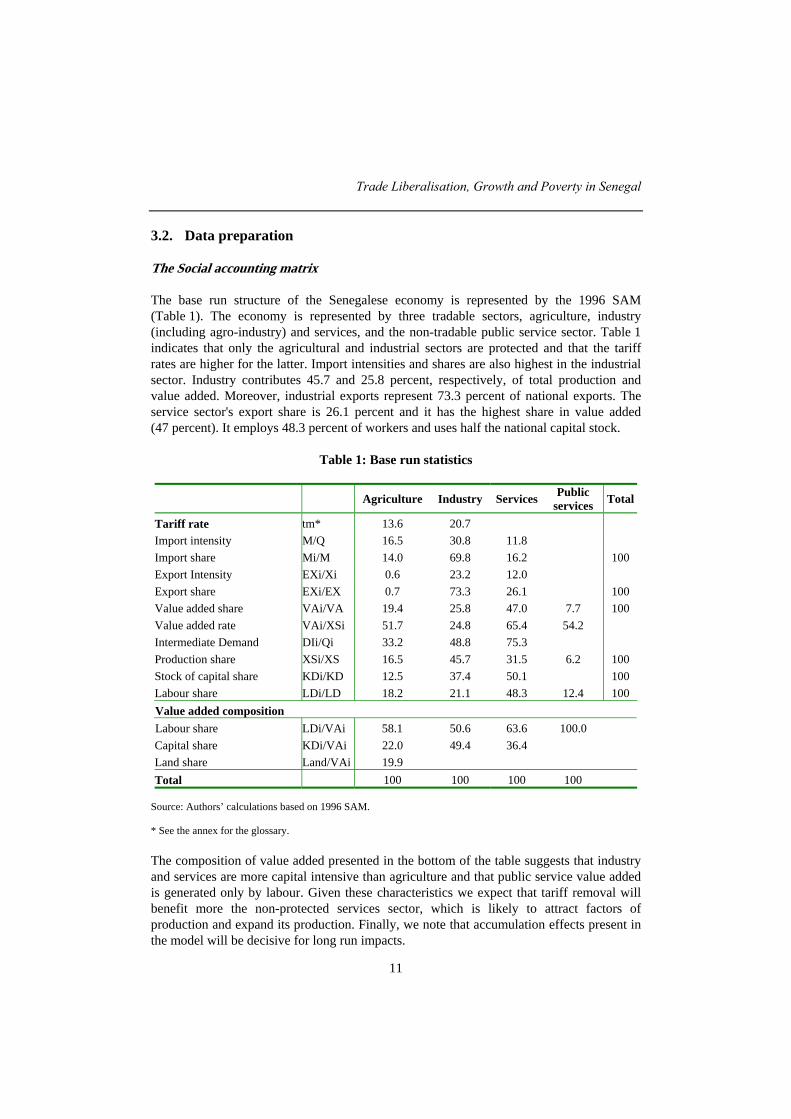
The base run structure of the Senegalese economy is represented by the 1996 SAM(Table 1). The economy is represented by three tradable sectors, agriculture, industry(including agro-industry) and services, and the non-tradable public service sector. Table 1indicates that only the agricultural and industrial sectors are protected and that the tariffrates are higher for the latter. Import intensities and shares are also highest in the industrialsector. Industry contributes 45.7 and 25.8 percent, respectively, of total production andvalue added. Moreover, industrial exports represent 73.3 percent of national exports. Theservice sector's export share is 26.1 percent and it has the highest share in value added(47 percent). It employs 48.3 percent of workers and uses half the national capital stock.
Table 1: Base run statistics
Agriculture Industry Services Publicservices Total
Tariff rate tm* 13.6 20.7Import intensity M/Q 16.5 30.8 11.8Import share Mi/M 14.0 69.8 16.2 100Export Intensity EXi/Xi 0.6 23.2 12.0Export share EXi/EX 0.7 73.3 26.1 100Value added share VAi/VA 19.4 25.8 47.0 7.7 100Value added rate VAi/XSi 51.7 24.8 65.4 54.2Intermediate Demand DIi/Qi 33.2 48.8 75.3Production share XSi/XS 16.5 45.7 31.5 6.2 100Stock of capital share KDi/KD 12.5 37.4 50.1 100Labour share LDi/LD 18.2 21.1 48.3 12.4 100Value added compositionLabour share LDi/VAi 58.1 50.6 63.6 100.0Capital share KDi/VAi 22.0 49.4 36.4Land share Land/VAi 19.9Total 100 100 100 100
Source: Authors’ calculations based on 1996 SAM.
* See the annex for the glossary.
The composition of value added presented in the bottom of the table suggests that industryand services are more capital intensive than agriculture and that public service value addedis generated only by labour. Given these characteristics we expect that tariff removal willbenefit more the non-protected services sector, which is likely to attract factors ofproduction and expand its production. Finally, we note that accumulation effects present inthe model will be decisive for long run impacts.
CEPII, Working Paper No 2005-07
12
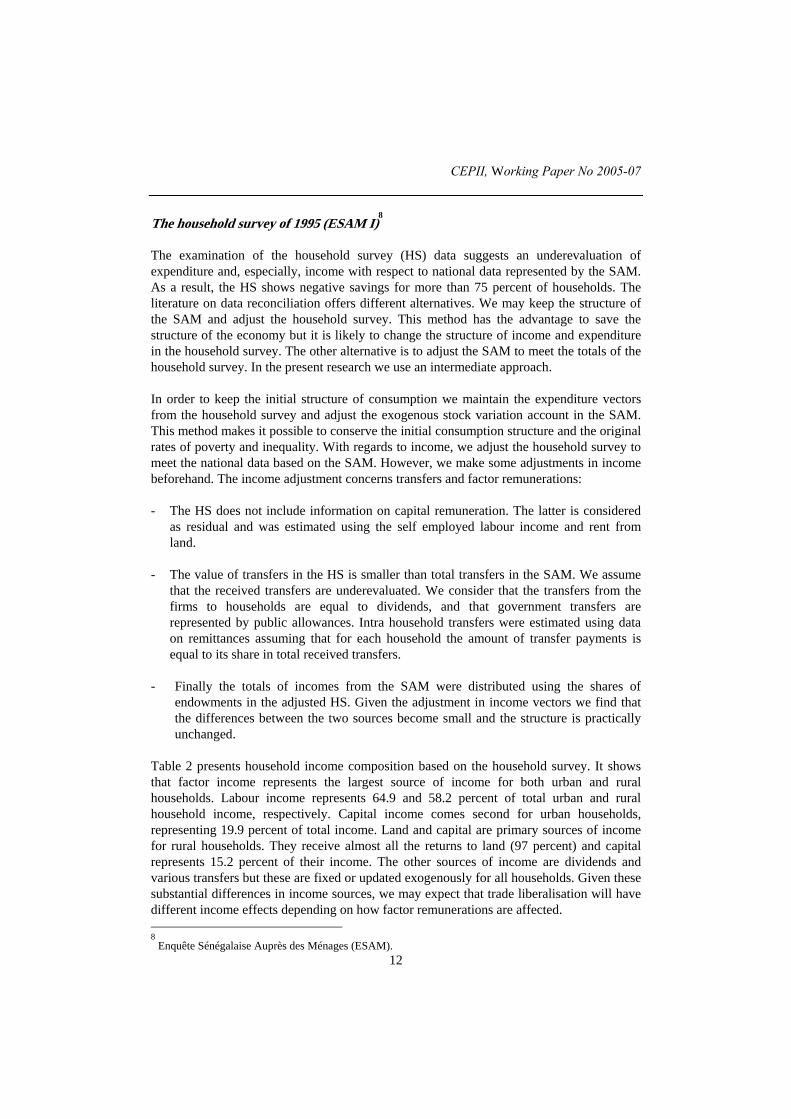
The household survey of 1995 (ESAM I)8
The examination of the household survey (HS) data suggests an underevaluation ofexpenditure and, especially, income with respect to national data represented by the SAM.As a result, the HS shows negative savings for more than 75 percent of households. Theliterature on data reconciliation offers different alternatives. We may keep the structure ofthe SAM and adjust the household survey. This method has the advantage to save thestructure of the economy but it is likely to change the structure of income and expenditurein the household survey. The other alternative is to adjust the SAM to meet the totals of thehousehold survey. In the present research we use an intermediate approach.
In order to keep the initial structure of consumption we maintain the expenditure vectorsfrom the household survey and adjust the exogenous stock variation account in the SAM.This method makes it possible to conserve the initial consumption structure and the originalrates of poverty and inequality. With regards to income, we adjust the household survey tomeet the national data based on the SAM. However, we make some adjustments in incomebeforehand. The income adjustment concerns transfers and factor remunerations:
- The HS does not include information on capital remuneration. The latter is consideredas residual and was estimated using the self employed labour income and rent fromland.
- The value of transfers in the HS is smaller than total transfers in the SAM. We assumethat the received transfers are underevaluated. We consider that the transfers from thefirms to households are equal to dividends, and that government transfers arerepresented by public allowances. Intra household transfers were estimated using dataon remittances assuming that for each household the amount of transfer payments isequal to its share in total received transfers.
- Finally the totals of incomes from the SAM were distributed using the shares ofendowments in the adjusted HS. Given the adjustment in income vectors we find thatthe differences between the two sources become small and the structure is practicallyunchanged.
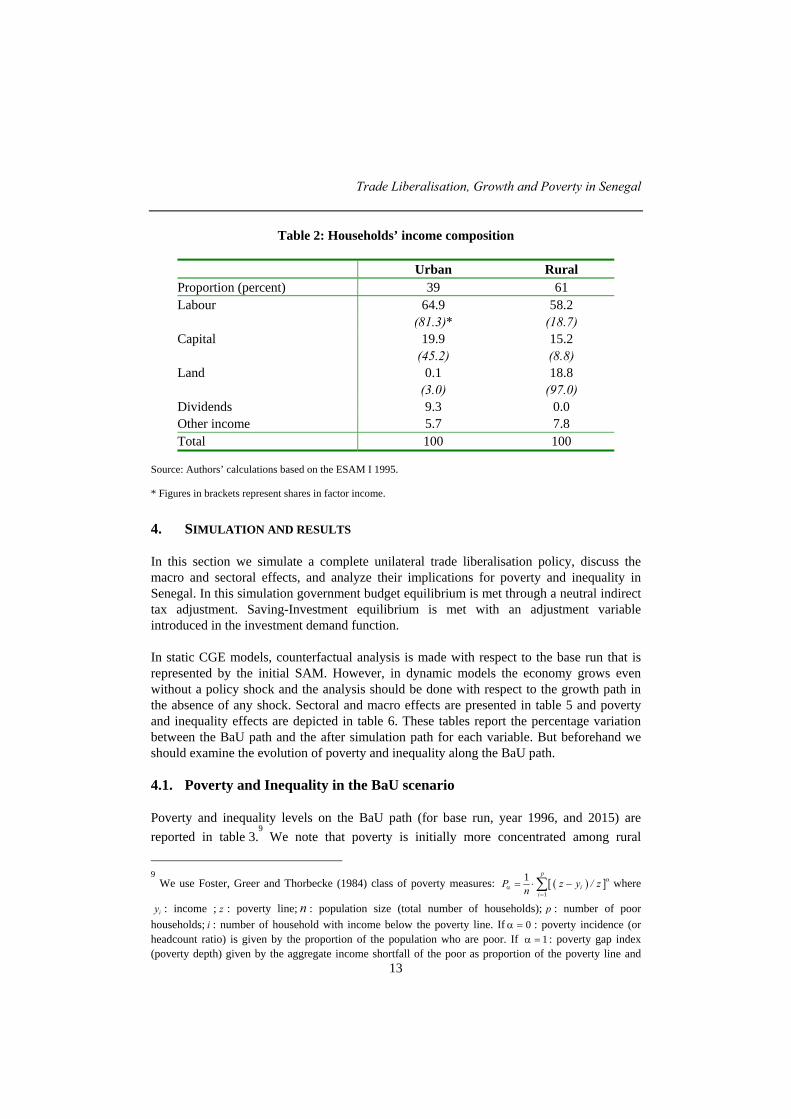
Table 2 presents household income composition based on the household survey. It showsthat factor income represents the largest source of income for both urban and ruralhouseholds. Labour income represents 64.9 and 58.2 percent of total urban and ruralhousehold income, respectively. Capital income comes second for urban households,representing 19.9 percent of total income. Land and capital are primary sources of incomefor rural households. They receive almost all the returns to land (97 percent) and capitalrepresents 15.2 percent of their income. The other sources of income are dividends andvarious transfers but these are fixed or updated exogenously for all households. Given thesesubstantial differences in income sources, we may expect that trade liberalisation will havedifferent income effects depending on how factor remunerations are affected. 8 Enquête Sénégalaise Auprès des Ménages (ESAM).
Trade Liberalisation, Growth and Poverty in Senegal
13
Table 2: Households’ income composition
Urban RuralProportion (percent) 39 61Labour 64.9 58.2
(81.3)* (18.7)Capital 19.9 15.2
(45.2) (8.8)Land 0.1 18.8
(3.0) (97.0)Dividends 9.3 0.0Other income 5.7 7.8Total 100 100
Source: Authors’ calculations based on the ESAM I 1995.
* Figures in brackets represent shares in factor income.
4. SIMULATION AND RESULTS
In this section we simulate a complete unilateral trade liberalisation policy, discuss themacro and sectoral effects, and analyze their implications for poverty and inequality inSenegal. In this simulation government budget equilibrium is met through a neutral indirecttax adjustment. Saving-Investment equilibrium is met with an adjustment variableintroduced in the investment demand function.
In static CGE models, counterfactual analysis is made with respect to the base run that isrepresented by the initial SAM. However, in dynamic models the economy grows evenwithout a policy shock and the analysis should be done with respect to the growth path inthe absence of any shock. Sectoral and macro effects are presented in table 5 and povertyand inequality effects are depicted in table 6. These tables report the percentage variationbetween the BaU path and the after simulation path for each variable. But beforehand weshould examine the evolution of poverty and inequality along the BaU path.
4.1. Poverty and Inequality in the BaU scenario
Poverty and inequality levels on the BaU path (for base run, year 1996, and 2015) arereported in table 3.
9 We note that poverty is initially more concentrated among rural
9 We use Foster, Greer and Thorbecke (1984) class of poverty measures: ( )[ ]
1
1 αα
=
= ⋅ −∑p
ii
P z y / zn
where
iy : income ; z : poverty line; n : population size (total number of households); p : number of poorhouseholds; i : number of household with income below the poverty line. If 0α = : poverty incidence (orheadcount ratio) is given by the proportion of the population who are poor. If 1α = : poverty gap index(poverty depth) given by the aggregate income shortfall of the poor as proportion of the poverty line and
CEPII, Working Paper No 2005-07
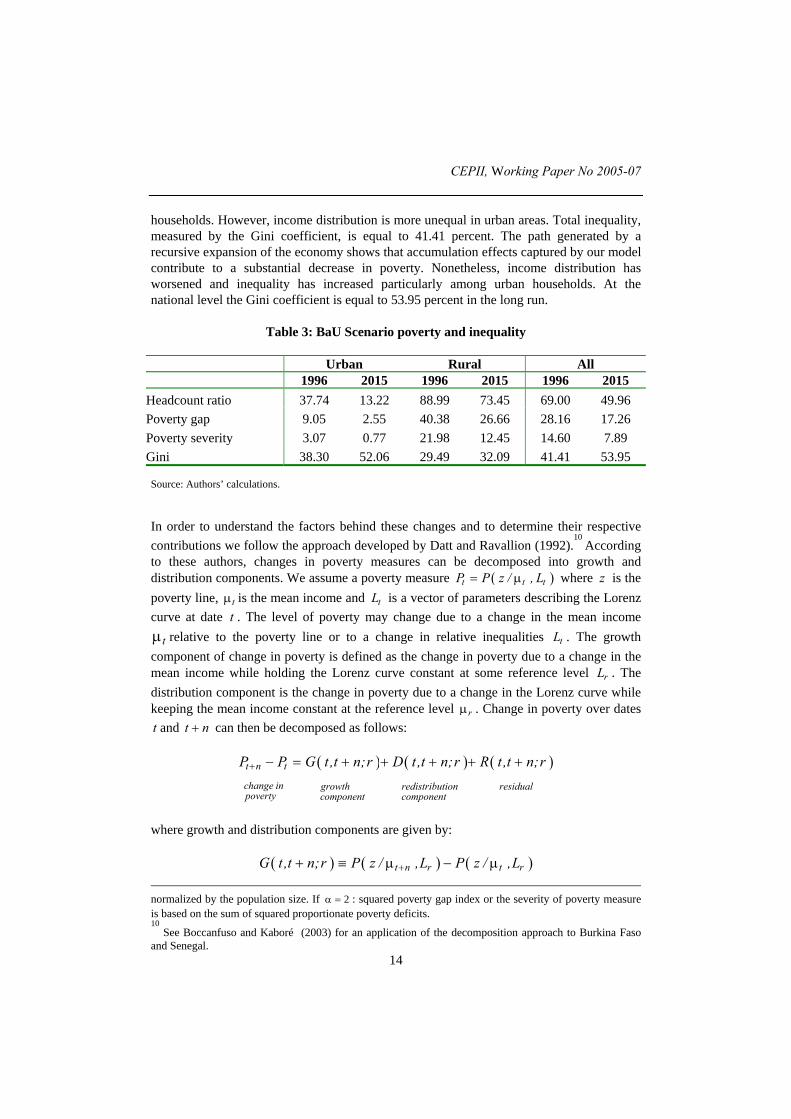
14
households. However, income distribution is more unequal in urban areas. Total inequality,measured by the Gini coefficient, is equal to 41.41 percent. The path generated by arecursive expansion of the economy shows that accumulation effects captured by our modelcontribute to a substantial decrease in poverty. Nonetheless, income distribution hasworsened and inequality has increased particularly among urban households. At thenational level the Gini coefficient is equal to 53.95 percent in the long run.
Table 3: BaU Scenario poverty and inequality
Urban Rural All1996 2015 1996 2015 1996 2015
Headcount ratio 37.74 13.22 88.99 73.45 69.00 49.96Poverty gap 9.05 2.55 40.38 26.66 28.16 17.26Poverty severity 3.07 0.77 21.98 12.45 14.60 7.89Gini 38.30 52.06 29.49 32.09 41.41 53.95
Source: Authors’ calculations.
In order to understand the factors behind these changes and to determine their respectivecontributions we follow the approach developed by Datt and Ravallion (1992).
10 According
to these authors, changes in poverty measures can be decomposed into growth anddistribution components. We assume a poverty measure ( )= µt t tP P z / , L where z is thepoverty line, µt is the mean income and tL is a vector of parameters describing the Lorenzcurve at date t . The level of poverty may change due to a change in the mean income
tµ relative to the poverty line or to a change in relative inequalities tL . The growthcomponent of change in poverty is defined as the change in poverty due to a change in themean income while holding the Lorenz curve constant at some reference level rL . Thedistribution component is the change in poverty due to a change in the Lorenz curve whilekeeping the mean income constant at the reference level µr . Change in poverty over datest and +t n can then be decomposed as follows:
( ) ( ) ( )+ − = + + + + +t n t
change in growth redistribution residualpoverty component component
P P G t,t n;r D t,t n;r R t ,t n;r
where growth and distribution components are given by:
( ) ( ) ( )++ ≡ µ − µt n r t rG t ,t n;r P z / ,L P z / ,L normalized by the population size. If 2α = : squared poverty gap index or the severity of poverty measureis based on the sum of squared proportionate poverty deficits.10
See Boccanfuso and Kaboré (2003) for an application of the decomposition approach to Burkina Fasoand Senegal.
Trade Liberalisation, Growth and Poverty in Senegal
15
( ) ( ) ( )++ ≡ µ − µr t n r tD t ,t n;r P z / ,L P z / ,L
for =r t , the residual can be written:
( ) ( ) ( )
( ) ( )
+ = + + − +
= + + − +
R t,t n;t G t,t n;t n G t,t n;t
D t ,t n;t n D t,t n;t
This residual is the difference between the growth (distribution) components evaluated atthe terminal and initial Lorenz curves (mean incomes) respectively. The residual disappearsif µt or tL remains constant or if we estimate the average of the components obtainedusing the initial and final years as the reference. Kakwani (1997) uses this latter approachand defines the average growth and inequality effects as:
( ) ( ) ( ) ( ) ( )[ ]12 + + + ++ = µ − µ + µ − µt n t t t t n t n t t nG t ,t n P z, ,L P z, ,L P z, ,L P z, ,L
( ) ( ) ( ) ( ) ( )[ ]12 + + + ++ = µ − µ + µ − µt t n t t t n t n t n tD t ,t n P z, ,L P z, ,L P z, ,L P z, ,L
Changes in poverty can then be decomposed as:
( ) ( )+ − = + + +t n t
change in growth redistributionpoverty component component
ˆ ˆP P G t,t n D t,t n
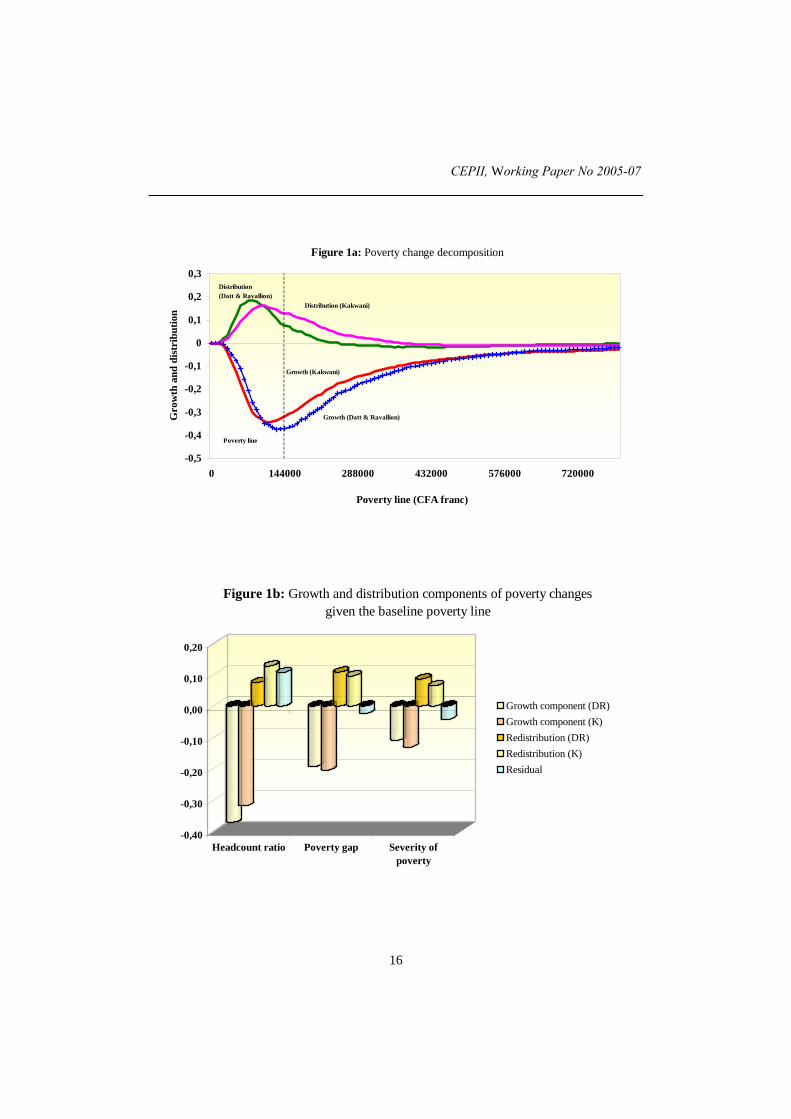
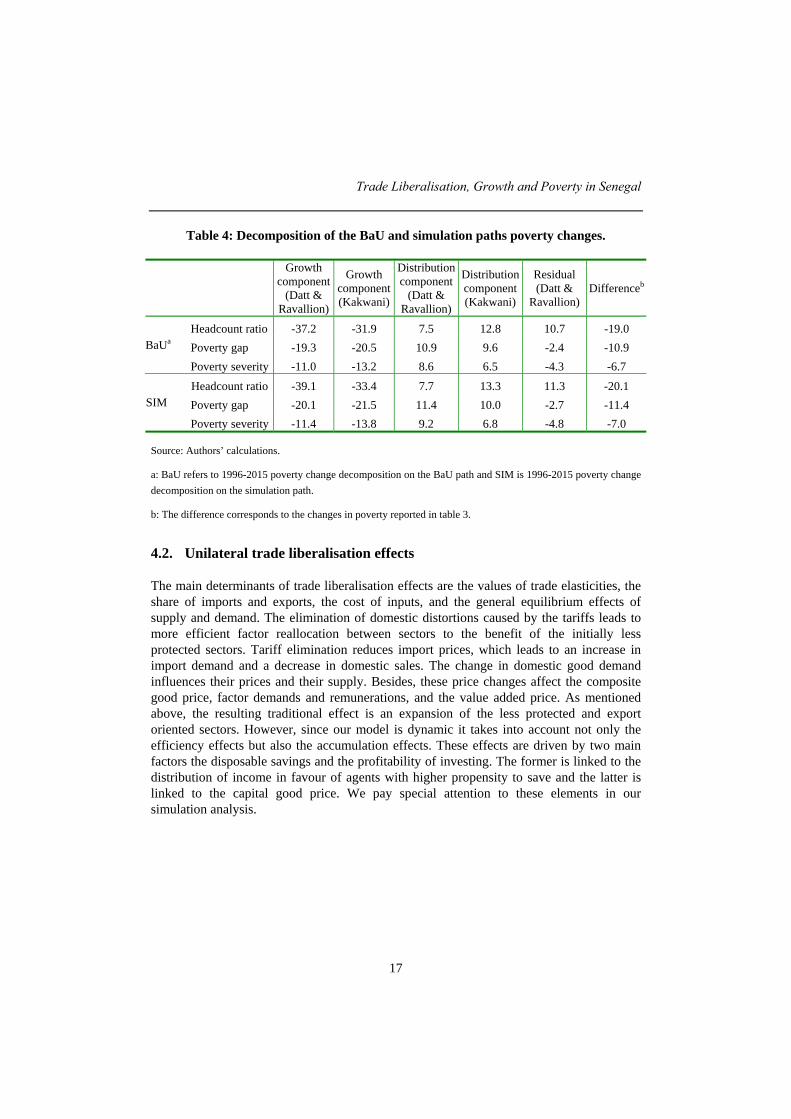
Decomposition results are presented in figures 1a and 1b, and table 4. They suggest thatgrowth component played a major role in poverty reduction and that distribution had anegative impact on the poor. Figure 1a depicts the decomposition for a wide range ofpoverty lines. It shows that growth reduces poverty and that its contribution is the highestamong households clustered about the base run poverty line. However, distributioncomponent is negative for low levels of poverty line and positive for high levels of povertyline. This may be explained by the fact that when we move to the right assuming highlevels of poverty line we take into account non poor households which benefited more fromfactor accumulation. Table 4 presents the decomposition results assuming the base runpoverty line.
11 The figures confirm that growth component, for both Datt and Ravallion and
Kakwani decomposition approaches, played the main role in reducing poverty along theBaU path.
11
The second set of lines in this table will be discussed in the next section.
CEPII, Working Paper No 2005-07
16
Figure 1a: Poverty change decomposition
-0,5
-0,4
-0,3
-0,2
-0,1
0
0,1
0,2
0,3
0 144000 288000 432000 576000 720000
Poverty line (CFA franc)
Gro
wth
and
dis
trib
utio
n
Poverty line
Growth (Datt & Ravallion)
Distribution (Datt & Ravallion)
Distribution (Kakwani)
Growth (Kakwani)
-0,40
-0,30
-0,20
-0,10
0,00
0,10
0,20
Headcount ratio Poverty gap Severity ofpoverty
Figure 1b: Growth and distribution components of poverty changes given the baseline poverty line
Growth component (DR)Growth component (K)Redistribution (DR)Redistribution (K)Residual
Trade Liberalisation, Growth and Poverty in Senegal
17
Table 4: Decomposition of the BaU and simulation paths poverty changes.
Growthcomponent
(Datt &Ravallion)
Growthcomponent(Kakwani)
Distributioncomponent
(Datt &Ravallion)
Distributioncomponent(Kakwani)
Residual(Datt &
Ravallion)Differenceb
Headcount ratio -37.2 -31.9 7.5 12.8 10.7 -19.0Poverty gap -19.3 -20.5 10.9 9.6 -2.4 -10.9BaUa
Poverty severity -11.0 -13.2 8.6 6.5 -4.3 -6.7
Headcount ratio -39.1 -33.4 7.7 13.3 11.3 -20.1Poverty gap -20.1 -21.5 11.4 10.0 -2.7 -11.4SIM
Poverty severity -11.4 -13.8 9.2 6.8 -4.8 -7.0
Source: Authors’ calculations.
a: BaU refers to 1996-2015 poverty change decomposition on the BaU path and SIM is 1996-2015 poverty changedecomposition on the simulation path.
b: The difference corresponds to the changes in poverty reported in table 3.
4.2. Unilateral trade liberalisation effects
The main determinants of trade liberalisation effects are the values of trade elasticities, theshare of imports and exports, the cost of inputs, and the general equilibrium effects ofsupply and demand. The elimination of domestic distortions caused by the tariffs leads tomore efficient factor reallocation between sectors to the benefit of the initially lessprotected sectors. Tariff elimination reduces import prices, which leads to an increase inimport demand and a decrease in domestic sales. The change in domestic good demandinfluences their prices and their supply. Besides, these price changes affect the compositegood price, factor demands and remunerations, and the value added price. As mentionedabove, the resulting traditional effect is an expansion of the less protected and exportoriented sectors. However, since our model is dynamic it takes into account not only theefficiency effects but also the accumulation effects. These effects are driven by two mainfactors the disposable savings and the profitability of investing. The former is linked to thedistribution of income in favour of agents with higher propensity to save and the latter islinked to the capital good price. We pay special attention to these elements in oursimulation analysis.
CEPII, Working Paper No 2005-07
18
Table 5: Macro and sectoral effects (percent change from BaU path)
Agriculture Industry Services Public servicesSectoral results 1996 2015 1996 2015 1996 2015 1996 2015Import price -11.93 -11.93 -17.17 -17.17 0.00 0.00Domestic price -6.17 -4.46 -8.02 -8.14 -5.74 -6.66Composite price -4.29 -2.92 -8.25 -8.42 -2.16 -3.11FOB export price -0.75 -0.63 -1.00 -1.32 -1.04 -1.39Producer price -6.14 -4.44 -6.30 -6.39 -5.15 -5.94 -5.70 -4.13Value added price -9.08 -5.45 -7.73 -7.26 -5.28 -6.21 -6.60 -2.82Rate of return to capital -13.55 -10.78 -8.89 -11.27 -2.93 -11.46Imports 6.03 11.23 11.58 15.47 -7.84 -7.05Domestic good -3.59 -1.55 -4.62 -1.12 0.70 3.07Composite good -2.04 0.42 0.19 3.80 -0.33 1.85Exports 7.86 6.51 10.52 14.13 11.00 15.03Production -3.52 -1.49 -1.00 2.69 1.96 4.66 0.00 0.00Investment (destination) -5.17 14.05 5.25 16.57 19.41 19.57 0.00 0.00Capital stock (SR=1997) -0.39 3.03 0.39 6.39 1.46 9.58Labour demand -5.97 -3.82 -1.97 -1.09 3.11 1.71 0.00 0.00Investment (origin) -4.39 -1.64 -0.27 4.27 -6.48 -1.44Intermediate demand -1.30 1.88 -0.46 2.84 -0.86 1.94Private consumption -2.24 0.18 2.35 6.90 -3.89 1.17Macro results 1996 2015Real GDP -0.02 2.62Welfare (EV)* -0.26 1.69Poverty level 0.17 -2.04Wage rate -6.59 -2.80Rate of return to land -11.23 -6.39CPI -5.60 -5.50Capital good price -9.70 -8.88
Source: Authors’ calculations.
*: Equivalent variation in percentage of base income.
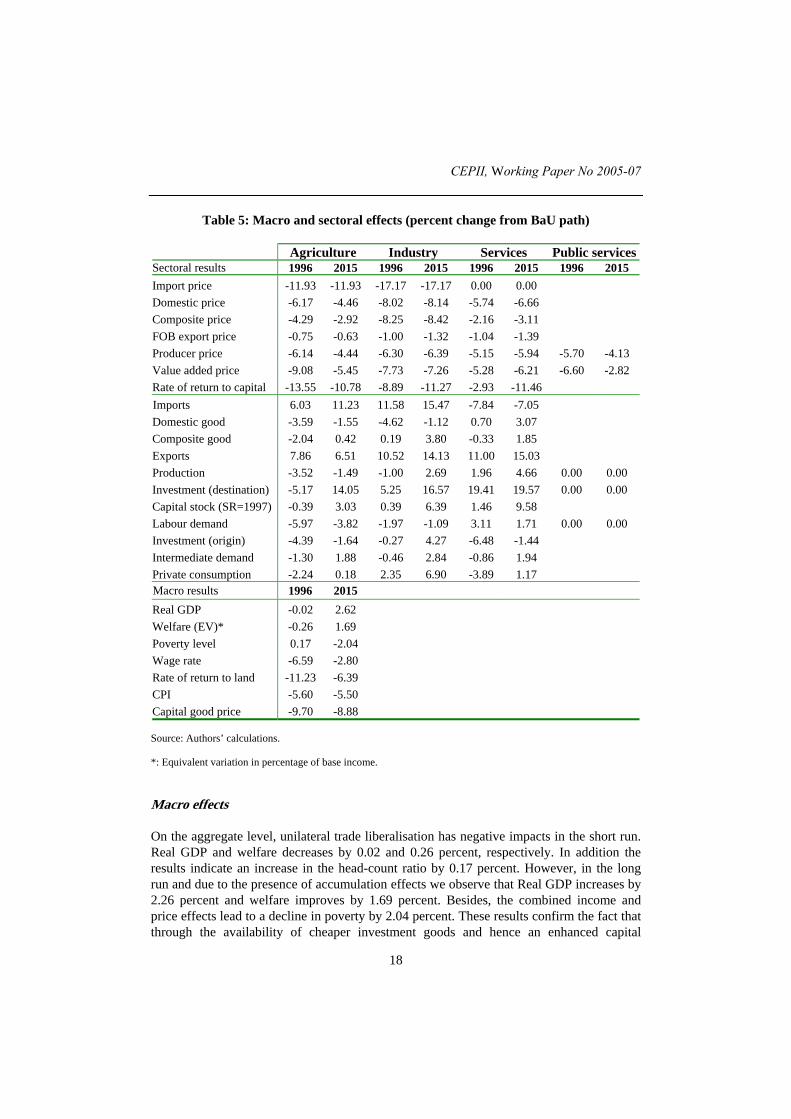
Macro effects
On the aggregate level, unilateral trade liberalisation has negative impacts in the short run.Real GDP and welfare decreases by 0.02 and 0.26 percent, respectively. In addition theresults indicate an increase in the head-count ratio by 0.17 percent. However, in the longrun and due to the presence of accumulation effects we observe that Real GDP increases by2.26 percent and welfare improves by 1.69 percent. Besides, the combined income andprice effects lead to a decline in poverty by 2.04 percent. These results confirm the fact thatthrough the availability of cheaper investment goods and hence an enhanced capital
Trade Liberalisation, Growth and Poverty in Senegal
19
accumulation, trade liberalisation effects are adequately captured in a dynamic framework.Furthermore, the short run negative impacts are resulting from the fact that capital is sectorspecific during the first period and adjusts only in the subsequent periods. These negativeimpacts disappear when factors are reallocated to the most expanding sectors. In order tounderstand the mechanisms through which tariff removal has led to the above-mentionedshort run and long run changes we examine in what follows the sectoral results.
Sectoral effects
The shock of tariff elimination leads first to a decrease in the domestic price of imports. Wefind that the greatest reduction is in the industrial sector, which had high initial tariff rates(see table 1). The fall in domestic prices and initial import penetration ratios will influencethe sectoral import demand changes. The effect on the latter is consistent with ourexpectations. The service sector registers negative import growth in both the short and thelong runs due to unchanged import prices (this sector is initially unprotected) and thedecrease in domestic prices that make local purchases more attractive. Furthermore, wenote a decline in domestic good demand in agriculture and industry in the short run. In thelong run, though less pronounced, this trend is maintained and the service sector attainshigher positive growth in domestic demand. The service sector expands and the import-competing and (previously) protected sectors contract in the short run. In the long run, theagricultural sector continues declining and the service and industrial sectors expand.
We recall the assumption that the current account balance is fixed. Because of this closurerule, the increase in imports should be compensated by an increase in exports. With anegative sloping demand curve for exports the FOB export price should decrease to attainthat objective. As a result we observe that the FOB export prices decrease in all sectors andparticularly in the service sector. This suggests that this sector becomes more competitivein the long run due to trade liberalisation. The expansion of exports is explained by theincrease in relative price of exports.
As we mentioned above, the efficiency (reallocation) and accumulation effects willdetermine the impact on production. Both effects are driven, in large extent, by value addedprice, factor remunerations and the cost of inputs represented by the composite price. Thelatter decreases in all the sectors in both the short and the long runs. The reallocation effectsamong the sectors are determined by the change in value-added price. The results indicatethat resources will move towards the service sector in the short run. Variations in valueadded prices influence the capital rental rate and labour wage rates.
It is important to recall that labour is mobile across sectors in both the short and the longruns, whereas capital is mobile only after the first year and through new investments. In theshort run, labour moves to the expanding service sector. In the long run the pattern ofchanges is almost the same and the service sector absorbs most of the labour force. Alongwith the decrease in value added prices and wage rates, capital rental rates decrease inalmost all the sectors. However, they decrease relatively less than capital user costs in bothindustry and services, which attract more investment in both the short and the long runs.
CEPII, Working Paper No 2005-07
20
These changes in investment demand influence sectoral capital accumulation. In the longrun, the capital stock increases more for the service sector followed by the industry and theagricultural sectors. Finally, the general effect suggests that the highly protected andimport-competing sectors contract. However, in the long run the industrial sector succeedsin attracting more investment and therefore in increasing its output.
Welfare effects
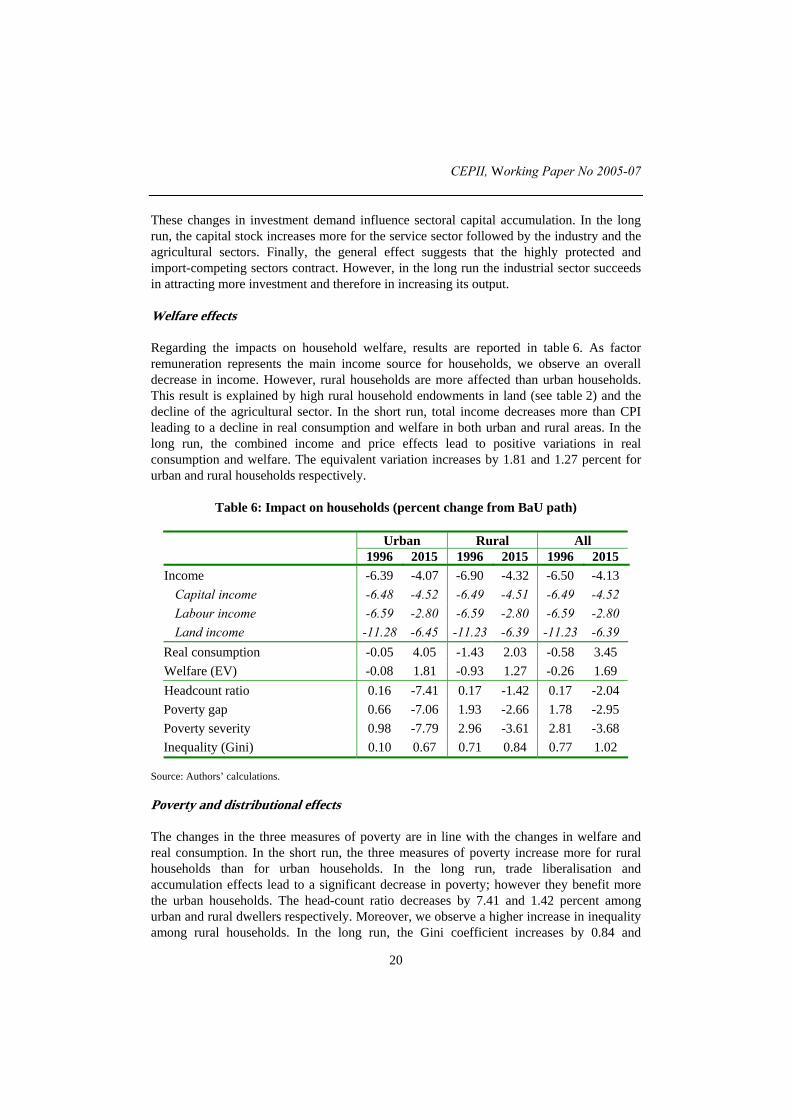
Regarding the impacts on household welfare, results are reported in table 6. As factorremuneration represents the main income source for households, we observe an overalldecrease in income. However, rural households are more affected than urban households.This result is explained by high rural household endowments in land (see table 2) and thedecline of the agricultural sector. In the short run, total income decreases more than CPIleading to a decline in real consumption and welfare in both urban and rural areas. In thelong run, the combined income and price effects lead to positive variations in realconsumption and welfare. The equivalent variation increases by 1.81 and 1.27 percent forurban and rural households respectively.
Table 6: Impact on households (percent change from BaU path)
Urban Rural All1996 2015 1996 2015 1996 2015
Income -6.39 -4.07 -6.90 -4.32 -6.50 -4.13Capital income -6.48 -4.52 -6.49 -4.51 -6.49 -4.52Labour income -6.59 -2.80 -6.59 -2.80 -6.59 -2.80Land income -11.28 -6.45 -11.23 -6.39 -11.23 -6.39
Real consumption -0.05 4.05 -1.43 2.03 -0.58 3.45Welfare (EV) -0.08 1.81 -0.93 1.27 -0.26 1.69Headcount ratio 0.16 -7.41 0.17 -1.42 0.17 -2.04Poverty gap 0.66 -7.06 1.93 -2.66 1.78 -2.95Poverty severity 0.98 -7.79 2.96 -3.61 2.81 -3.68Inequality (Gini) 0.10 0.67 0.71 0.84 0.77 1.02
Source: Authors’ calculations.
Poverty and distributional effects
The changes in the three measures of poverty are in line with the changes in welfare andreal consumption. In the short run, the three measures of poverty increase more for ruralhouseholds than for urban households. In the long run, trade liberalisation andaccumulation effects lead to a significant decrease in poverty; however they benefit morethe urban households. The head-count ratio decreases by 7.41 and 1.42 percent amongurban and rural dwellers respectively. Moreover, we observe a higher increase in inequalityamong rural households. In the long run, the Gini coefficient increases by 0.84 and
Trade Liberalisation, Growth and Poverty in Senegal
21
0.67 percent for rural and urban areas, respectively. However, these changes are lessimportant among rural households because of the lower initial level of inequality(32.09 percent in rural area against 52.06 percent in urban area).
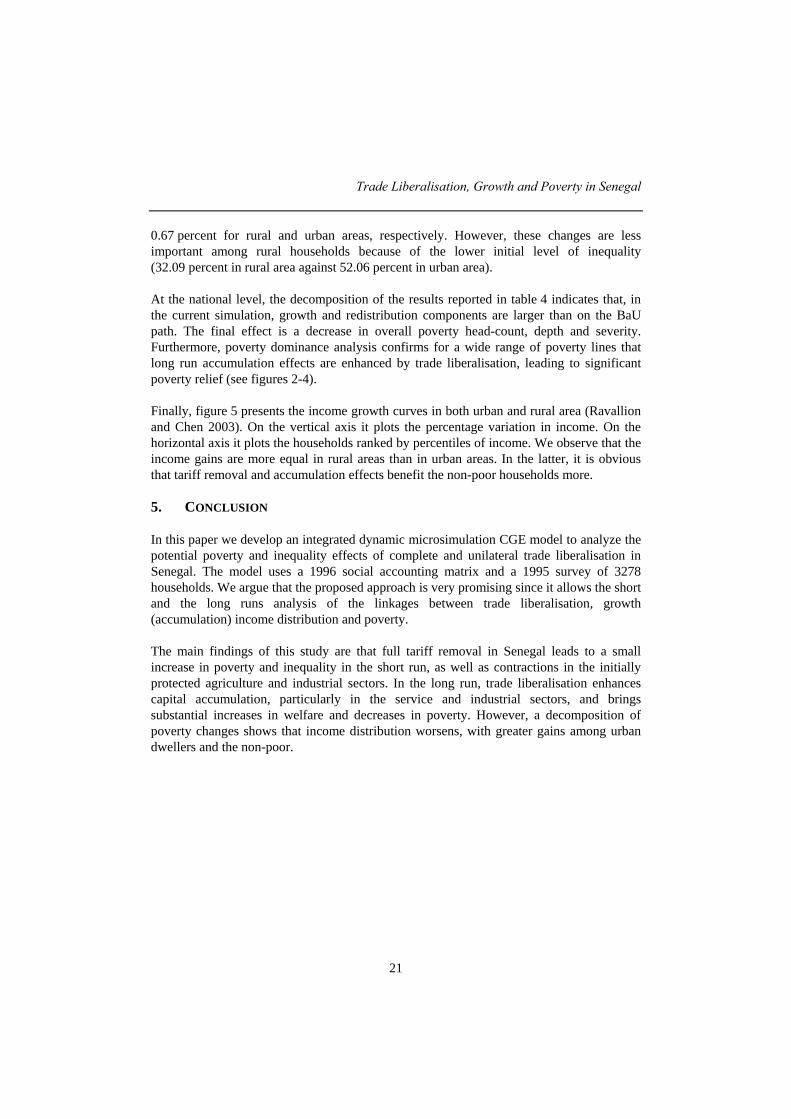
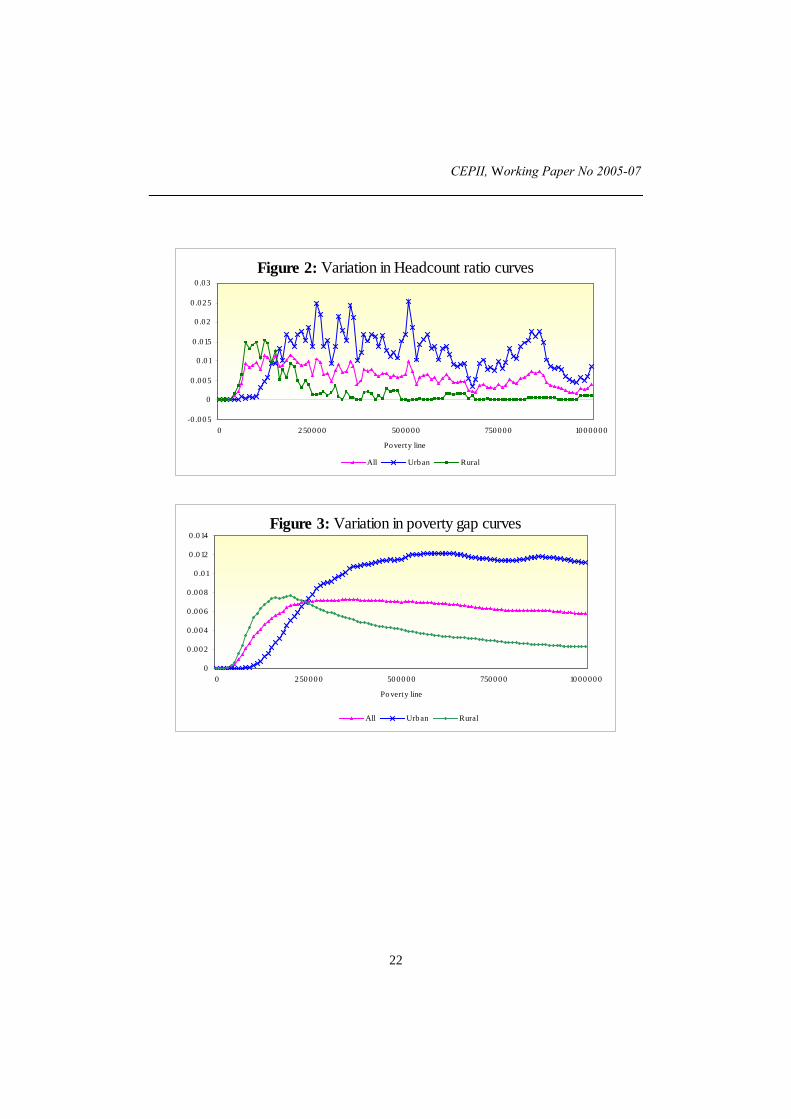
At the national level, the decomposition of the results reported in table 4 indicates that, inthe current simulation, growth and redistribution components are larger than on the BaUpath. The final effect is a decrease in overall poverty head-count, depth and severity.Furthermore, poverty dominance analysis confirms for a wide range of poverty lines thatlong run accumulation effects are enhanced by trade liberalisation, leading to significantpoverty relief (see figures 2-4).
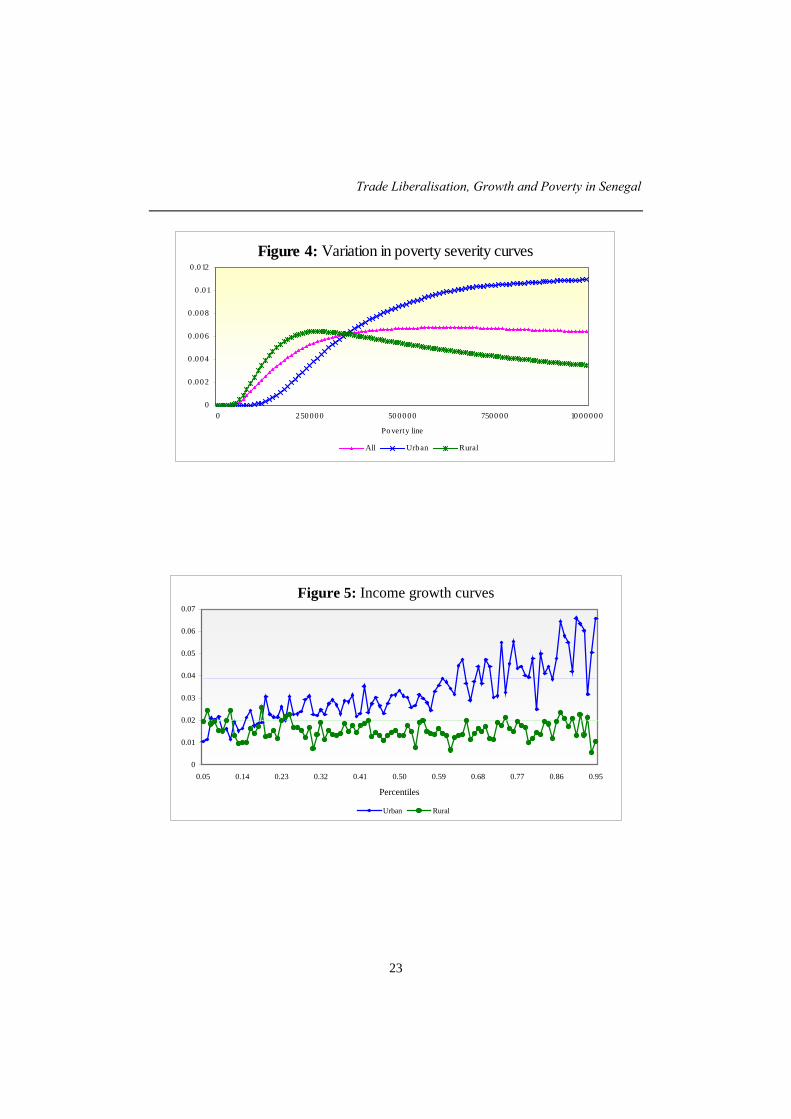
Finally, figure 5 presents the income growth curves in both urban and rural area (Ravallionand Chen 2003). On the vertical axis it plots the percentage variation in income. On thehorizontal axis it plots the households ranked by percentiles of income. We observe that theincome gains are more equal in rural areas than in urban areas. In the latter, it is obviousthat tariff removal and accumulation effects benefit the non-poor households more.
5. CONCLUSION
In this paper we develop an integrated dynamic microsimulation CGE model to analyze thepotential poverty and inequality effects of complete and unilateral trade liberalisation inSenegal. The model uses a 1996 social accounting matrix and a 1995 survey of 3278households. We argue that the proposed approach is very promising since it allows the shortand the long runs analysis of the linkages between trade liberalisation, growth(accumulation) income distribution and poverty.
The main findings of this study are that full tariff removal in Senegal leads to a smallincrease in poverty and inequality in the short run, as well as contractions in the initiallyprotected agriculture and industrial sectors. In the long run, trade liberalisation enhancescapital accumulation, particularly in the service and industrial sectors, and bringssubstantial increases in welfare and decreases in poverty. However, a decomposition ofpoverty changes shows that income distribution worsens, with greater gains among urbandwellers and the non-poor.
CEPII, Working Paper No 2005-07
22
Figure 2: Variation in Headcount ratio curves
-0 .00 5
0
0 .00 5
0 .01
0 .015
0 .02
0 .02 5
0 .03
0 2 500 00 50 00 00 7500 00 100 00 00
Poverty line
All Urban Rural
Figure 3: Variation in poverty gap curves
0
0.0 02
0 .0 04
0 .0 06
0 .0 08
0 .01
0 .0 12
0 .0 14
0 250 00 0 50 00 00 7500 00 10 00 00 0
Po verty line
All Urb an Rural
Trade Liberalisation, Growth and Poverty in Senegal
23
Figure 4: Variation in poverty severity curves
0
0.0 02
0 .0 04
0 .0 06
0 .0 08
0 .01
0 .0 12
0 250 00 0 50 00 00 7500 00 10 00 00 0
Po verty line
All Urban Rural
Figure 5: Income growth curves
0
0.01
0.02
0.03
0.04
0.05
0.06
0.07
0.05 0.14 0.23 0.32 0.41 0.50 0.59 0.68 0.77 0.86 0.95
Percentiles
Urban Rural
CEPII, Working Paper No 2005-07
24
REFERENCES
Abbink G. A., Braber, M. C., and Cohen, S. I. (1995), A SAM-CGE demonstration modelfor Indonesia: A Static and Dynamic specifications and experiments. InternationalEconomic Journal, 9 (3): 15-33.
Annabi, N. Khondker, B. Raihan, S. Cockburn, J And Decaluwé B. (2005), Implications ofWTO Agreements and Domestic Trade Policy Reforms for Poverty in Bangladesh:Short vs. Long Run Impacts. Chapter 15 in Putting Development Back into the DohaAgenda: Poverty Impacts of a WTO Agreement, Thomas W. Hertel and L. AlanWinters (eds.) forthcoming from the World Bank, Washington, DC.
Annabi, N., Cockburn, J. and Decaluwé, B. (2004), A Sequential Dynamic CGE Model forPoverty Analysis, mimeo, CIRPEE-PEP, Université Laval.
Bhagwati, J. and Srinivasan, T. N. (2002), Trade and Poverty in the Poor Countries. TheAmerican Economic Review, 92 (2): 180-183.
Boccanfuso, D. and Kaboré S. (2003), Croissance, inégalité et pauvreté dans les années1990 au Burkina Faso et au Sénégal. Paper presented at Journées scientifiques duRéseau "Analyse économique et développement" Marrakech, Maroc.
Bourguignon, F., Branson, W. H. and J. de Melo. 1989. Macroeconomic Adjustment andIncome Distribution: A Macro-Micro Simulation Model. OECD, Technical PaperNo.1.
Bourguignon, F., and Pereira da Silva, L. A. (2003), The Impact of Economic Policies onPoverty and Income Distribution: Evaluation Techniques and Tools. Washington,D.C.: The World Bank and Oxford University Press.
Cockburn, J. (2001), Trade Liberalisation and Poverty in Nepal: A Computable GeneralEquilibrium Microsimulation Analysis. Cahier de recherche 01-18, CREFA,Université Laval, Quebec.
Cogneau, D. Robillard, A. S. (2000), Growth, Income Distribution and Poverty in Madagascar : Learning from a Microsimulation Model in a General EquilibriumFramework. Trade and Macroeconomic Division, International Food Policy Research(IFPRI), TMD Discussion papers no 61.
Datt, G. and Ravallion, M. (1992), Growth and Redistribution Components of Changes inPoverty Measures: A Decomposition with Applications to Brazil and India in 1980s.Journal of Development Economics, 38: 275-295.
Trade Liberalisation, Growth and Poverty in Senegal
25
Davies, J. (2003), Microsimulation, CGE and Macro Modelling for Transition andDeveloping Economies. mimeo, University of Western Ontario.
Decaluwé B., Patry, A. Savard, L. and E. Thorbecke. (1999), Poverty Analysis within aGeneral Equilibrium Framework. Cahier de recherche 99-09, CREFA, UniversitéLaval, Quebec.
Decaluwé, B., Dumont, J-C. and Savard, L. (1999), Measuring Poverty and Inequality inComputable General Equilibrium Model, Cahier de recherche 99-26, CREFA,Université Laval, Quebec.
Duclos, J-Y, Araar, A. and Fortin, C. (2004), DAD: A Software for Distributive Analysis/Analyse Distributive. CIRPEE, Université Laval and PEP Network.http://www.pep-net.org
Duclos, J-Y and Araar, A. (2004), Poverty and Equity Measurement, Policy and Estimationwith DAD. CIRPEE, Université Laval, Quebec.
Foster, J.E., Greer, J. and Thorbecke, E. (1984), A Class of Decomposable PovertyMeasures. Econometrica, 52: 761-776.
Hertel, T. W. and Reimer, J. J. (2004), Predicting the Poverty Impacts of TradeLiberalization: A Survey. World Bank Policy Research Working Paper 3444.
Jung, H.S. and Thorbecke, E. (2003), The Impact of Public Education Expenditure onHuman Capital, Growth, and Poverty in Tanzania and Zambia: A GeneralEquilibrium Approach. Journal of Policy Modeling. 25: 701–725.
Kakwani, N. (1997), On Measuring Growth and Inequality Components of Changes inPoverty with Application to Thailand. Discussion paper 97/16, The University of NewSouth Wales.
Kakwani, N. and Pernia, E. M. (2000), What is Pro-poor Growth? Asian DevelopmentReview, 18: 1-16.
Ravallion, M., Chen, S. (2003), Measuring pro-poor growth, Economics Letters, 78, 93:99.
Robilliard AS. and Robinson S. (2003), Reconciling Household Surveys and NationalAccounts Data Using a Cross Entropy Estimation Method. Review of Income andWealth. 49, No 3: 395-406.
Shorrocks, A. F. (1999), Decomposition Procedures for Distributional Analysis: A UnifiedFramework Based on the Shapley Value. Department of Economics, University ofEssex.
CEPII, Working Paper No 2005-07
26
Van der Mensbrugghe, D. (2003), LINKAGE. Technical Reference Document: The WorldBank: Washington DC.
Winters, A. L., Mcculloch, N. and Mckay, A. (2004), Trade Liberalization and Poverty:The Evidence So Far. Journal of Economic Literature, vol. XLII: 72-115.
Trade Liberalisation, Growth and Poverty in Senegal
27
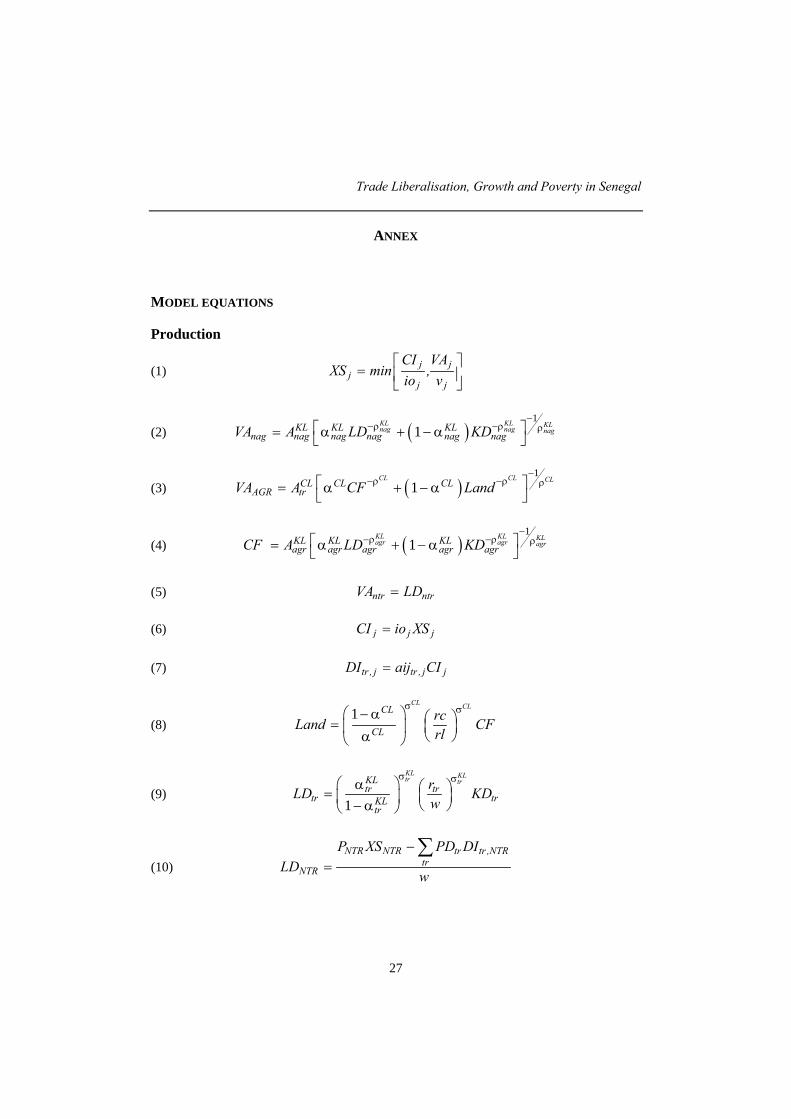
ANNEX
MODEL EQUATIONS
Production
(1) j jj
j j
CI VAXS min ,
io v⎡ ⎤
= ⎢ ⎥⎣ ⎦
(2) ( )1
1KL KL KLnag nag nagKL KL KL
nag nag nag nag nag nagVA A LD KD−
−ρ −ρ ρ⎡ ⎤= α + − α⎣ ⎦
(3) ( )1
1−
−ρ −ρ ρ⎡ ⎤= α + − α⎣ ⎦
CL CL CLCL CL CLAGR trVA A CF Land
(4) ( )1
1KL KL KLagr agr agrKL KL KL
agr agr agr agr agrCF A LD KD−
−ρ −ρ ρ⎡ ⎤= α + − α⎣ ⎦
(5) ntr ntrVA LD=
(6) j j jCI io XS=
(7) tr , j tr , j jDI aij CI=
(8)1 σ σ⎛ ⎞− α ⎛ ⎞= ⎜ ⎟ ⎜ ⎟α ⎝ ⎠⎝ ⎠
CL CLCL
CLrcLand CFrl
(9)1
KL KLtr trKLtr tr
tr trKLtr
rLD KDw
σ σ⎛ ⎞α ⎛ ⎞= ⎜ ⎟⎜ ⎟− α ⎝ ⎠⎝ ⎠
(10)NTR NTR tr tr ,NTR
trNTR
P XS PD DILD
w
−=
∑
CEPII, Working Paper No 2005-07
28
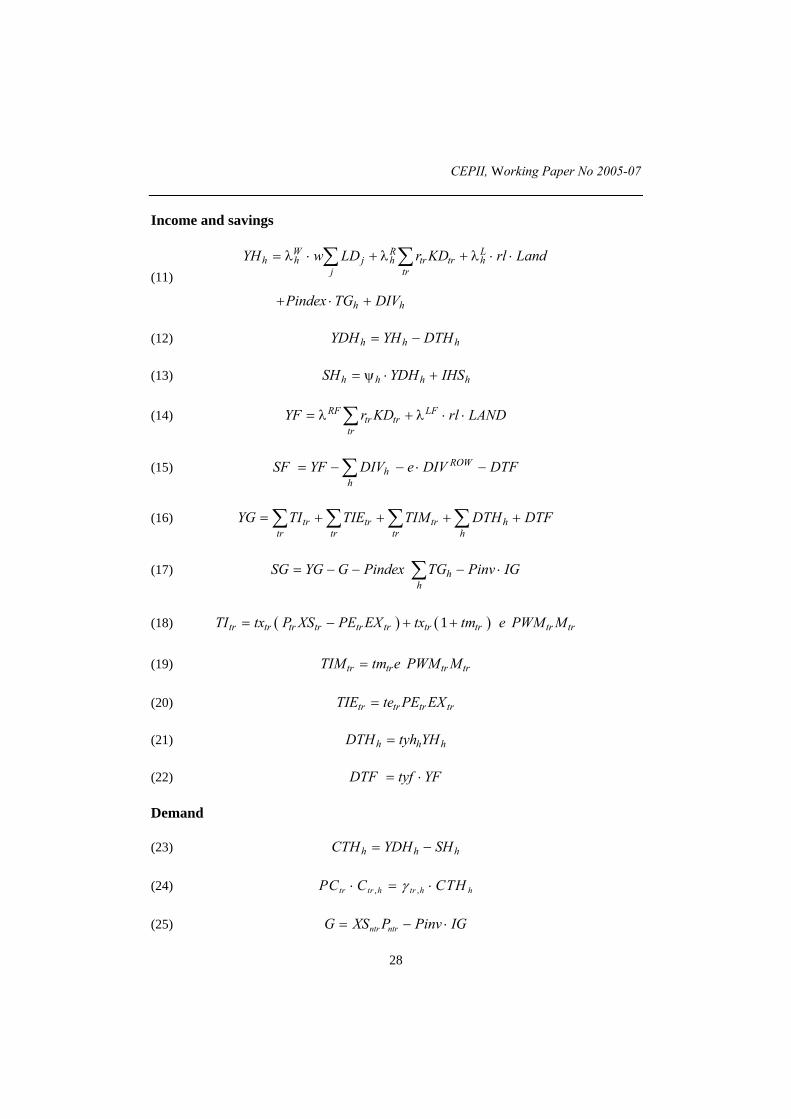
Income and savings
(11)= λ ⋅ + λ + λ ⋅ ⋅
+ ⋅ +
∑ ∑W R Lh h j h tr tr h
j tr
h h
YH w LD r KD rl Land
Pindex TG DIV
(12) h h hYDH YH DTH= −
(13) = ψ ⋅ +h h h hSH YDH IHS
(14) RF LFtr tr
trYF r KD rl LAND= λ + λ ⋅ ⋅∑
(15) ROWh
hSF YF DIV e DIV DTF= − − ⋅ −∑
(16) tr tr tr htr tr tr h
YG TI TIE TIM DTH DTF= + + + +∑ ∑ ∑ ∑
(17) = − − − ⋅∑ hh
SG YG G Pindex TG Pinv IG
(18) ( ) ( )1tr tr tr tr tr tr tr tr tr trTI tx P XS PE EX tx tm e PWM M= − + +
(19) tr tr tr trTIM tm e PWM M=
(20) tr tr tr trTIE te PE EX=
(21) h h hDTH tyh YH=
(22) DTF tyf YF= ⋅
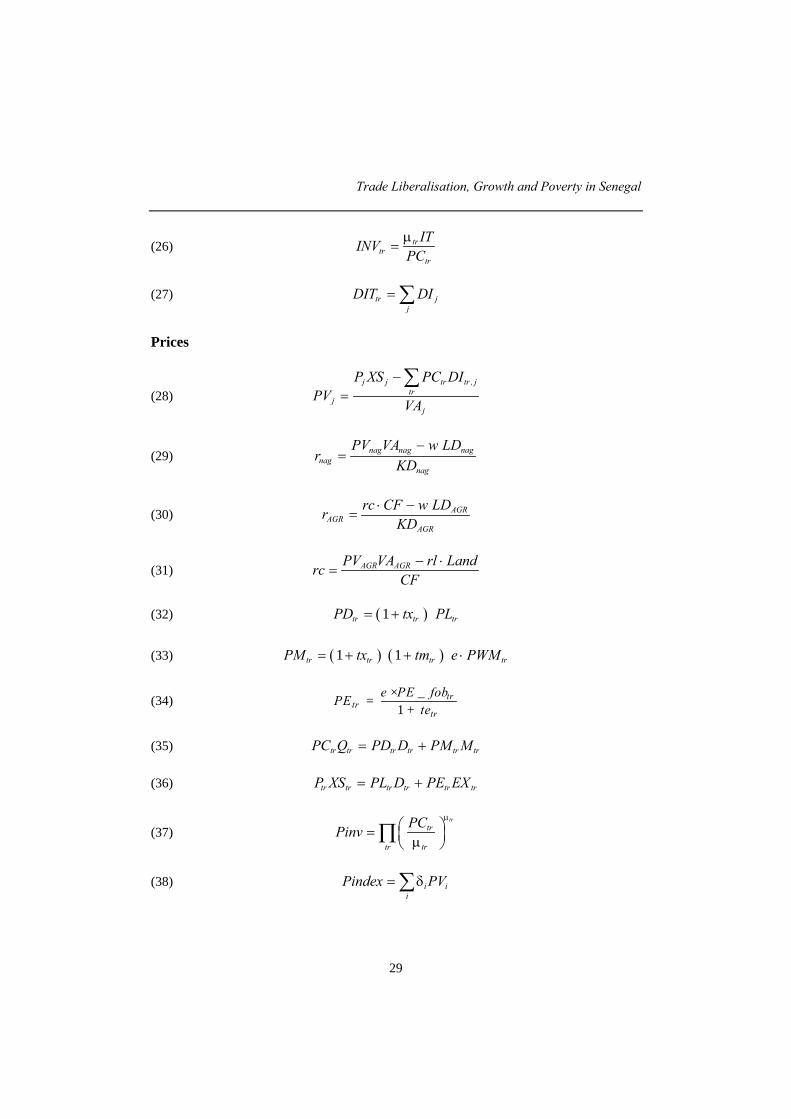
Demand
(23) h h hCTH YDH SH= −
(24) , ,⋅ = ⋅tr tr h tr h hPC C CTHγ
(25) = − ⋅ntr ntrG XS P Pinv IG
Trade Liberalisation, Growth and Poverty in Senegal
29
(26) trtr
tr
ITINVPCµ
=
(27) tr jj
DIT DI= ∑
Prices
(28)j j tr tr , j
trj
j
P XS PC DIPV
VA
−=
∑
(29) nag nag nagnag
nag
PV VA w LDr
KD−
=
(30) AGRAGR
AGR
rc CF w LDrKD
⋅ −=
(31)− ⋅
= AGR AGRPV VA rl LandrcCF
(32) ( )1tr tr trPD tx PL= +
(33) ( ) ( )1 1tr tr tr trPM tx tm e PWM= + + ⋅
(34) _1
trtr
tr
e PE fobPEte
×=+
(35) tr tr tr tr tr trPC Q PD D PM M= +
(36) tr tr tr tr tr trP XS PL D PE EX= +
(37)tr
tr
trtr
PCPinvµ
⎛ ⎞= ⎜ ⎟µ⎝ ⎠∏
(38) = δ∑ i ii
Pindex PV
CEPII, Working Paper No 2005-07
30
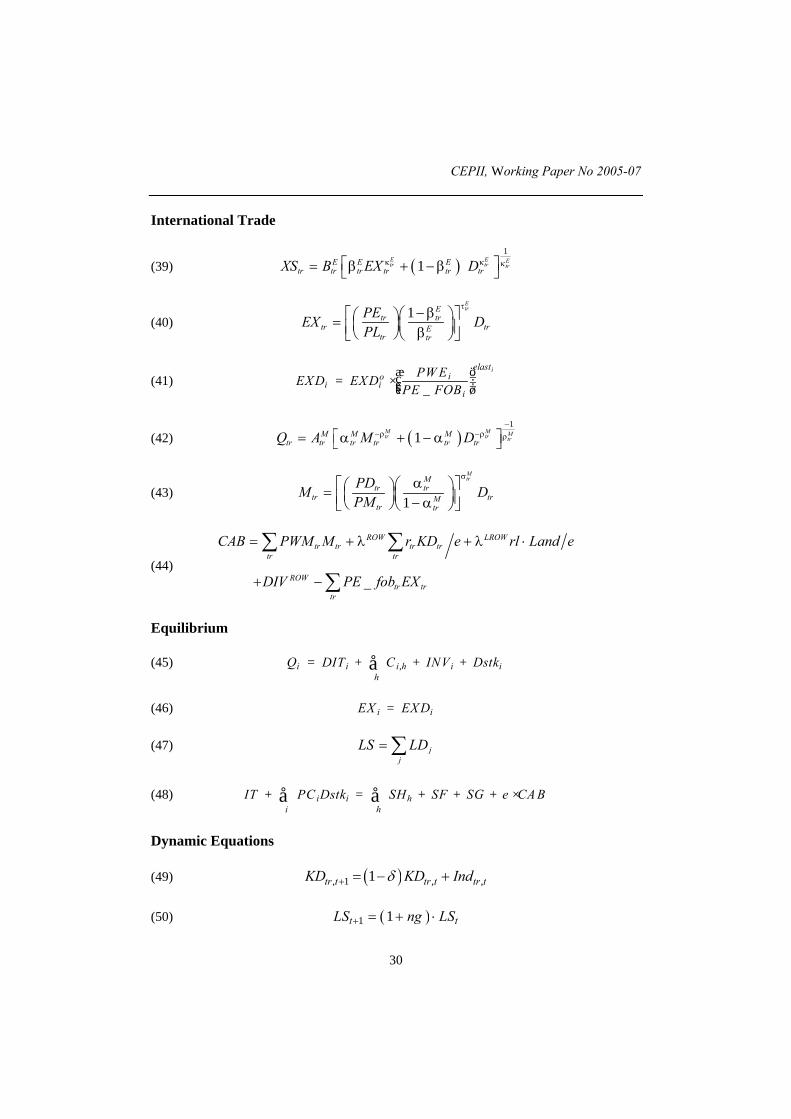
International Trade
(39) ( )1
1E E Etr tr trE E Etr tr tr tr tr trXS B EX Dκ κ κ⎡ ⎤= β + − β⎣ ⎦
(40)1
EtrE
tr trtr trE
tr tr
PEEX DPL
τ− β⎡ ⎛ ⎞ ⎤⎛ ⎞= ⎜ ⎟⎜ ⎟⎢ ⎥β⎝ ⎠⎣ ⎝ ⎠ ⎦
(41)_
ielastio
i ii
PW EEX D EX DPE FOB
æ ö÷ç= × ÷ç ÷çè ø
(42) ( )1
1M M Mtr tr trM M M
tr tr tr tr tr trQ A M D−
−ρ −ρ ρ⎡ ⎤= α + − α⎣ ⎦
(43)1
MtrM
tr trtr trM
tr tr
PDM DPM
σα⎡ ⎛ ⎞ ⎤⎛ ⎞= ⎜ ⎟⎜ ⎟⎢ ⎥− α⎝ ⎠⎣ ⎝ ⎠ ⎦
(44)
= + λ + λ ⋅
+ −
∑ ∑
∑
ROW LROWtr tr tr tr
tr tr
ROWtr tr
tr
CAB PWM M r KD e rl Land e
DIV PE _ fob EX
Equilibrium
(45) ,i i i h i ih
Q DIT C INV Dstk= + + +å
(46) i iEX EX D=
(47) jj
LS LD= ∑
(48) i i hi h
IT PC Dstk SH SF SG e CA B+ = + + + ×å å
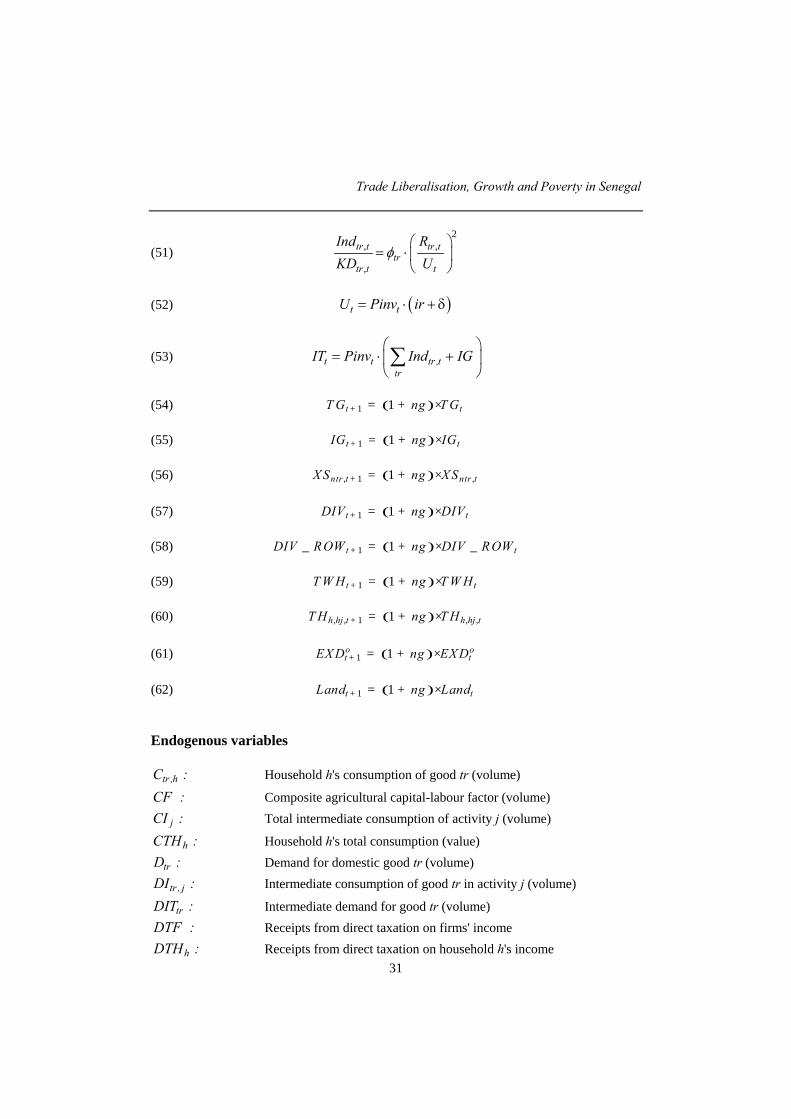
Dynamic Equations
(49) ( ), 1 , ,1+ = − +tr t tr t tr tKD KD Indδ
(50) ( )1 1+ = + ⋅t tLS ng LS
Trade Liberalisation, Growth and Poverty in Senegal
31
(51)2
, ,
,φ
⎛ ⎞= ⋅ ⎜ ⎟
⎝ ⎠
tr t tr ttr
tr t t
Ind RKD U
(52) ( )= ⋅ + δt tU Pinv ir
(53)⎛ ⎞
= ⋅ +⎜ ⎟⎝ ⎠∑t t tr ,ttr
IT Pinv Ind IG
(54) ( )1 1t tT G ng T G+ = + ×
(55) ( )1 1t tIG ng IG+ = + ×
(56) ( ), 1 ,1ntr t ntr tX S ng X S+ = + ×
(57) ( )1 1t tDIV ng DIV+ = + ×
(58) ( )1_ 1 _t tDIV ROW ng DIV R OW+ = + ×
(59) ( )1 1t tT W H ng T W H+ = + ×
(60) ( ), , 1 , ,1h hj t h hj tT H ng T H+ = + ×
(61) ( )1 1o ot tEX D ng EX D+ = + ×
(62) ( )1 1t tLand ng Land+ = + ×
Endogenous variables
tr ,hC : Household h's consumption of good tr (volume)
CF : Composite agricultural capital-labour factor (volume)
jCI : Total intermediate consumption of activity j (volume)
hCTH : Household h's total consumption (value)
trD : Demand for domestic good tr (volume)
tr , jDI : Intermediate consumption of good tr in activity j (volume)
trDIT : Intermediate demand for good tr (volume)DTF : Receipts from direct taxation on firms' income
hDTH : Receipts from direct taxation on household h's income
CEPII, Working Paper No 2005-07
32
e : Nominal exchange rate
trEX : Exports in good tr (volume)G : Public expenditures
trINV : Investment demand for good tr (volume)IT : Total investment
jLD : Activity j demand for labour (volume)
trM : Imports in good tr (volume)
iP : Producer price of good i
trPC : Consumer price of composite good tr
trPD : Domestic price of good tr including taxes
trPE : Domestic price of exported good trPindex : GDP deflatorPinv : Price index of investment
trPL : Domestic price of good tr (excluding taxes)
trPM : Domestic price of imported good tr
jPV : Value added price for activity j
trQ : Demand for composite good tr (volume)
trr : Rate of return to capital in activity trrl : Rate of return to agricultural landrc : Rate of return to composite factorSF : Firms' savingsSG : Government's savings
hSH : Household h's savings
trTI : Receipts from indirect tax on tr
trTIE : Receipts from tax on export tr
trTIM : Receipts from import duties tr
jVA : Value added for activity j (volume)
w : Wage rate
trXS : Output of activity tr (volume)
hYDH : Household h's disposable incomeYF : Firms' incomeYG : Government's income
hYH : Household h's incomeLS : Total labour supply (volume)
Trade Liberalisation, Growth and Poverty in Senegal
33
trKD : Demand for capital in activity tr (volume)CAB : Current account balance
, :tr tInd Demand for capital in activity tr (volume)
:tU Capital user cost
Exogenous variables
hDIV : Dividends paid to household hROWDIV : Dividends paid to the rest of the World
Land : Land supply (volume)
trPWE : World price of export tr
trPWM : World price of import tr
hTG : Public transfers to household h
NTRXS : Output of activity NTR (volume)
Parameters
Production functions
jA : Scale coefficient (Cobb-Douglas production function)
tr , jaij : Input-output coefficient
j :α Elasticity (Cobb-Douglas production function)
jio : Technical coefficient (Leontief production function)
jv : Technical coefficient (Leontief production function)
CES function between capital and labour
KLtrA : Scale coefficientKLtr :α Share parameterKLtr :ρ Substitution parameterKLtr :σ Substitution elasticity
CEPII, Working Paper No 2005-07
34
CES function between composite factor and land
CLtrA : Scale coefficientCLtr :α Share parameterCLtr :ρ Substitution parameterCLtr :σ Substitution elasticity
CES function between imports and domestic production
MtrA : Scale coefficientMtr :α Share parameterMtr :ρ Substitution parameterMtr :σ Substitution elasticity
CET function between domestic production and exports
EtrB : Scale coefficientEtr :β Share parameterEtr :κ Transformation parameterEtr :τ Transformation elasticity
C-D consumption function
tr ,h :γ Marginal share of good tr
Tax rates
trte : Tax on exports tr
trtm : Import duties on good tr
trtx : Tax rate on good tr
htyh : Direct tax rate on household h's incometyf : Direct tax rate on firms' income
Other parameters
j :δ Share of activity j in total value addedLh :λ Share of land income received by household h
Trade Liberalisation, Growth and Poverty in Senegal
35
LF :λ Share of land income received by firmsLROW :λ Share of land income received by foreignersRh :λ Share of capital income received by household hRF :λ Share of capital income received by firmsROW :λ Share of capital income received by foreignersWh :λ Share of labour income received by household h
h :ψ Propensity to save
tr :µ Share of the value of good tr in total investment:ng Population growth rate
:δ Capital depreciation rate:φtr Scale parameter in the investment demand function
:ir Real interest rate
Sets
{ }i, j I AGR,IND,SER,NTR∈ = All activities and goods (AGR: agriculture, IND:industry, SER: services, NTR: non-tradableservices)
{ }tr TR AGR,IND,SER∈ = Tradable activities and goods{ }nag NAG IND,SER∈ = Non-agricultural Tradable activities and goods
{ }1 3278∈ =h H h ,...,h Households{ }, 1996, ,2015∈ = Lt t T Time horizon
CEPII, Working Paper No 2005-07
36
LIST OF WORKING PAPERS RELEASED BY CEPII12
No Title Authors
2005-06 Migration, Trade and Wages A. Hijzen & P. Wright
2005-05 Institutional Determinants of Foreign Investment A. Bénassy-Quéré,M. Coupet & T. Mayer
2005-04 L’économie indienne : changements structurels etperspectives à long terme
S. Chauvin &F. Lemoine
2005-03 Programme de travail du CEPII pour 2005
2005-02 Market Access in Global and Regional Trade T. Mayer& S. Zignago
2005-01 Real Equilibrium Exchange Rate in China V. Coudert &C. Couharde
2004-22 A Consistent, ad-valorem Equivalent Measure ofApplied Protection Across the World: The MacMap-HS6 Database
A. Bouët, Y. Decreux,L. Fontagné, S. Jean
& D. Laborde
2004-21 IMF in Theory: Sovereign Debts, Judicialisation andMultilateralism
J. Sgard
2004-20 The Impact of Multilateral Liberalisation on EuropeanRegions: a CGE Assessment
S. Jean & D. Laborde
2004-19 La compétitivité de l'agriculture et des industriesagroalimentaires dans le Mercosur et l'Unioneuropéenne dans une perspective de libéralisationcommerciale
N. Mulder, A. Vialou,B. David,
M. Rodriguez &M. Castilho
2004-18 Multilateral Agricultural Trade Liberalization: TheContrasting Fortunes of Developinc Countries in theDoha Round
A. Bouët, J.C. Bureau,Y. Decreux & S. Jean
2004-17 UK in or UK out? A Common Cycle Analysisbetween the UK and the Euro Zone
J. Garnier
12
Working papers are circulated free of charge as far as stocks are available; thank you to send your requestto CEPII, Sylvie Hurion, 9, rue Georges-Pitard, 75015 Paris, or by fax : (33) 01 53 68 55 04 or by [email protected]. Also available on: \\www.cepii.fr. Working papers with * are out of print. They cannevertheless be consulted and downloaded from this website.12
Les documents de travail sont diffusés gratuitement sur demande dans la mesure des stocks disponibles.Merci d’adresser votre demande au CEPII, Sylvie Hurion, 9, rue Georges-Pitard, 75015 Paris, ou parfax : (33) 01 53 68 55 04 ou par e-mail [email protected]. Egalement disponibles sur : \\www.cepii.fr.Les documents de travail comportant * sont épuisés. Ils sont toutefois consultable sur le web CEPII.
Trade Liberalisation, Growth and Poverty in Senegal
37
2004-16 Regionalism and the Regionalisation of InternationalTrade
G. Gaulier, S. Jean &D. Ünal-Kesenci
2004-15 The Stock-Flow Approach to the Real Exchange Rateof CEE Transition Economies
B. Egert,A. Lahrècche-Révil &
K. Lommatzsch
2004-14 Vieillissement démographique, épargne et retraite :une analyse à l’aide d’un modèle d’équilibre général àagents hétérogènes
C. Bac & J. Chateau
2004-13 Burden Sharing and Exchange-Rate Misalignmentswithin the Group of Twenty
A. Bénassy-Quéré,P. Duran-Vigneron,
A. Lahrèche-Révil &V. Mignon
2004-12 Regulation and Wage Premia S. Jean & G. Nicoletti
2004-11 The Efficiency of Fiscal Policies: a Survey of theLiterature
S. Capet
2004-10 La réforme du marché du travail en Allemagne : lesenseignements d’une maquette
S. Capet
2004-09 Typologie et équivalence des systèmes de retraites P. Villa
2004-08 South – South Trade: Geography Matters S. Coulibaly &L. Fontagné
2004-07 Current Accounts Dynamics in New EU Members:Sustainability and Policy Issues
P. Zanghieri
2004-06 Incertitude radicale et choix du modèle P. Villa
2004-05 Does Exchange Rate Regime Explain Differences inEconomic Results for Asian Countries?
V. Coudert &M. Dubert
2004-04 Trade in the Triad: How Easy is the Access to LargeMarkets?
L. Fontagné, T. Mayer& S. Zignago
2004-03 Programme de travail du CEPII pour 2004
2004-02 Technology Differences, Institutions and EconomicGrowth: a Conditional Conditional Convergence
H. Boulhol
2004-01 Croissance et régimes d’investissement P. Villa
2003-22 A New Look at the Feldstein-Horioka Puzzle using aIntegrated Panel
A. Banerjee &P. Zanghieri
2003-21 Trade Linkages and Exchange Rates in Asia:The Roleof China
A. Bénassy-Quéré &A. Lahrèche-Révil
CEPII, Working Paper No 2005-07
38
2003-20 Economic Implications of Trade LiberalizationUnder the Doha Round
J. Francois,H. van Meijl &
F. van Tongeren
2003-19 Methodological Tools for SIA - Report of the CEPIIWorshop held on 7-8 November 2002 in Brussels
2003-18 Order Flows, Delta Hedging and Exchange RateDynamics
B. Rzepkowski
2003-17 Tax Competition and Foreign Direct Investment A. Bénassy-Quéré,L. Fontagné &
A. Lahrèche-Révil
2003-16 Commerce et transfert de technologies : les cascomparés de la Turquie, de l’Inde et de la Chine
F. Lemoine &D. Ünal-Kesenci
2003-15 The Empirics of Agglomeration and Trade K. Head & T. Mayer
2003-14 Notional Defined Contribution: A Comparison of theFrench and German Point Systems
F. Legros
2003-13 How Different is Eastern Europe? Structure andDeterminants of Location Choices by French Firms inEastern and Western Europe
A.C. Disdier &T. Mayer
2003-12 Market Access Liberalisation in the Doha Round:Scenarios and Assessment
L. Fontagné,J.L. Guérin & S. Jean
2003-11 On the Adequacy of Monetary Arrangements in Sub-Saharian Africa
A. Bénassy-Quéré &M. Coupet
2003-10 The Impact of EU Enlargement on Member States:a CGE Approach
H. Bchir, L. Fontagné& P. Zanghieri
2003-09 India in the World Economy: TraditionalSpecialisations and Technology Niches
S. Chauvin &F. Lemoine
2003-08 Imitation Amongst Exchange-Rate Forecasters:Evidence from Survey Data
M. Beine,A. Bénassy-Quéré &
H. Colas
2003-07 Le Currency Board à travers l’expérience del’Argentine
S. Chauvin & P. Villa
2003-06 Trade and Convergence: Revisiting Ben-Davil G. Gaulier
2003-05 Estimating the Fundamental Equilibrium ExchangeRate of Central and Eastern European Countries theEMU Enlargement Perspective
B. Egert &A. Lahrèche-Révil
CEPIIDOCUMENTS DE TRAVAIL / WORKING PAPERS
Si vous souhaitez recevoir des Documents de travail,merci de remplir le coupon-réponse ci-joint et de le retourner à :
Should you wish to receive copies of the CEPII’s Working papers,just fill the reply card and return it to:
Sylvie HURION – PublicationsCEPII – 9, rue Georges-Pitard – 75740 Paris – Fax : (33) 1.53.68.55.04
M./Mme / Mr./Mrs ..................................................................................................................
Nom-Prénom / Name-First name .............................................................................................
Titre / Title ...............................................................................................................................
Service / Department................................................................................................................
Organisme / Organisation ........................................................................................................
Adresse / Address.....................................................................................................................
Ville & CP / City & post code..................................................................................................Pays / Country.............................................................. Tél......................................................
Désire recevoir les Document de travail du CEPII n° :
Wish to receive the CEPII’s Working Papers No:..................................................................
..................................................................................................................................................
..................................................................................................................................................
..................................................................................................................................................
..................................................................................................................................................
..................................................................................................................................................
..................................................................................................................................................
..................................................................................................................................................
..................................................................................................................................................
Souhaite être placé sur la liste de diffusion permanente (pour les bibliothèques)Wish to be placed on the standing mailing list (for Libraries).