Embed Size (px)
Citation preview
Food Miles, Carbon Footprinting and their potential impact on trade1
Caroline Saunders, Andrew Barber and Lars-Christian Sorenson Abstract To obtain market access for NZ food exports to high value developed country markets exporters are having to comply and consider environmental factors such as carbon footprinting. This growth in demand for environmental attributes is shown in the rise of the food miles debate or concept. Food miles is a concept which has gained traction with the popular press arguing that the further food travels the more energy is used and therefore carbons emissions are greater. This paper assesses, using the same methodology, whether this is the case by comparing NZ production shipped to the UK with a UK source. The study found that due to the different production systems even when shipping was accounted for NZ dairy products used half the energy of their UK counterpart and in the case of lamb a quarter of the energy. In the case of apples the NZ source was 10 per cent more energy efficient. In case of onions whilst NZ used slightly more energy in production the energy cost of shipping was less than the cost of storage in the UK making NZ onions more energy efficient overall. The paper then explores other developments in market access to developed markets especially the rise in demand for products to be carbon footprinted and the introduction of carbon labelling. A review of latest methodology in carbon footprinting the PAS from the UK is reviewed and implications for trade assessed. Caroline Saunders and Lars-Christian Sorenson AERU, Lincoln University, Andrew Barber Agri Link.
1 This is paper presented at AARES 53rd annual conference at Cairns 10th to 13th Febuary 2009
1
Food Miles, Carbon Footprinting and their potential impact on trade
Caroline Saunders, Andrew Barber and Lars-Christian Sorenson
Introduction Historically trade policy has been one of the major factors affecting NZ exports. This is still
important with NZ restricted by quotas especially for access into high value markets.
Moreover, other potential markets for NZ have been affected by the competition from
subsidised exports. The EU (European Union) has recently announced it is going to, even
without the completion of current Doha round of the WTO (World Trade Organisation),
remove export subsidies. This has huge potential for our products.
However, a great threat to our access especially into the high value markets is the growing
concern about the environment. In particular the issue of climate change has grown in
importance as seen through the application of the Kyoto Protocol and issues such as “food
miles”. This paper outlines some of these threats. Whilst this concentrates upon the UK and
EU markets there is growing evidence that this is not just an issue for those markets. Other
markets are also showing increasing concern about these factors.
‘Food miles’ is a relatively recent issue which has arisen in the United Kingdom, Germany
and other countries over food transportation. The argument is that the longer the transport
distance (food miles), the more energy is consumed and carbon emitted.
New Zealand has attracted a lot of attention in the food miles debate, for three main reasons.
Firstly, due to its geographical location relative to the UK; secondly the UK is an important
high value markets for NZ exports; and thirdly, the similar climates of NZ and the UK means
in theory imports can be substituted with home-grown produce.
In this study the energy and carbon emissions from key New Zealand products are calculated
and compared to the next best alternative source for the UK market. The calculation of total
energy use and CO2 emissions uses life cycle assessment methodology from farm production
to UK wholesaler, excluding packing and processing.
2
This report first reviews the literature, followed by the methodology used and then presents
the results for the dairy, apple, onion and lamb sectors. There are two major groups of
literature relating to food miles: firstly, literature concerned solely with food miles itself
(although academic literature on this is minimal), and secondly a group of literature relating
to energy use/life cycle assessment.
Literature on Food miles include a joint international report (OECD/IEA, 2001) which notes
the possibility of more local and regional sourcing of goods to reduce energy use however
they do not consider the production part of the life cycle of a product.
Garnett (2003) in her report focuses on food transport within the UK and the efficiency of
various distribution networks including imported food. This study did not include energy use
and emissions in the production phase of the product, just energy use in the packaging,
marketing and delivery phase. This is recognised by Garnett who quotes a US study on the
environmental costs of food transportation (Pirog et al., 2001) in which the contribution of
transport to total food chain energy costs is about 11 per cent.
In a study evaluating the externality of transport Pretty et al (2005), calculated that in the case
of imports this was only 0.005p per person per week compared to 75.7p per person, per week
for domestic supply.
Smith et al., (2005) assessed whether a valid indicator of sustainability based on food miles
could be developed. They concluded that one single indicator could not be developed, but
multiple ones were needed to model the complexity of the issue. While the report focussed
on the transport component of the life cycle of food, the authors recognise that the issue is
also not as simple as just minimising food transport. They acknowledge the importance of the
production phase of food and that if this is efficient, one product can be more sustainable
environmentally than another which travels shorter distances.
An assessment of the environmental effects a product or service has during its lifetime, from
cradle to grave, is known as life cycle assessment (LCA). Tan and Culaba (2002) report that
early forms of LCAs were used in the late 1960s in the United States, but it was not until the
1990s that they emerged in their current form when international standards were imposed,
first by the Society for Environmental Toxicology and Chemistry in 1991 and later by the
3
International Organization for Standardization (ISO) in the late 1990s and beyond. Currently
it is part of the IS0 14040 series, which covers the principles, the analysis, interpretation and
the reporting of the results.
LCA studies were originally developed for industrial products but are now being conducted
on the primary sector, and also for manufactured foods and beverages. Cederberg and Flysjö
in their LCA assessed the environmental impact of Swedish milk production, in terms of
resource use and emissions. They surveyed 23 dairy farms in south-western Sweden, over
three types: conventional high output farms, conventional medium output farms, and organic
farms. They found that the total energy use of organic farms per unit of production was
significantly less than each of the two conventional types of farms, while no significant
difference was found between these conventional types. A similar picture emerged for CO2
emissions.
Brentrup et al. (2004a) constructed a LCA approach for arable crop production which is
applied to a theoretical system of winter wheat production, in a companion paper (Brentrup et
al., 2004b). They showed that at low production intensities (low levels of nitrogen fertiliser),
the overall environmental effects were moderate, but the land use impact contributed more
than one-half of the total effect and aquatic eutrophication only a small amount. However, at
high production intensities (high levels of nitrogen fertiliser) this situation was reversed, and
the overall environmental impact was high.
In New Zealand, a number of energy use studies into agricultural production were carried out
between 1974 and 1984, following the first ‘oil shock’ in 1973 (Wells, 2001). But from that
time until the mid-1990s, very little energy use research into this sector was conducted. From
the mid-1990s onwards the research programme resumed. Wells (2001) surveys the New
Zealand dairy industry in terms of the production of milk solids and arrives at the average
energy use and CO2 emissions per kg of milk solids. In this study 150 dairy farms were
surveyed across the major dairying regions in New Zealand, and which included both
irrigated and non-irrigated farms. The quantities of the various inputs on each farm were
converted and aggregated into primary energy and CO2 emissions. Barber 2004 calculated the
total energy and carbon indicators for arable and vegetable crops. Bassest-Mens et at (2005)
undertook a LCA of NZ dairy farming and compared this with Swedish and German farms.
In the case of energy use they concluded that NZ had approximately half the energy use and
4
around 60 per cent lower global warming potential than conventional farms in Sweden or
Germany.
Methodology This study focuses on New Zealand’s exports to the United Kingdom and the comparable UK
product. It uses the on-farm methodology developed by Wells, plus the inclusion of energy
and emissions associated with transporting produce from NZ to the UK and storage.
Wells separated energy inputs into three major components: direct, indirect, and capital. Each
of these resource inputs must be quantified and then the respective coefficients applied to
obtain the total primary energy use and CO2 emissions. Farm inputs in this analysis include
factors such as energy used to power tractors, the energy embodied in capital items such as
the tractors themselves, as well as the use of fertilisers, pesticides and supplementary animal
feed.
The UK is an important export market for NZ products, taking 66 per cent of sheep meat, 57
per cent of apples; 33 per cent of onions; 21 per cent of butter and 10 per cent of cheese
exports.
Moreover, NZ is a significant supplier to the UK providing 58 per cent of apples; 18 per cent
of sheep meat; 14 per cent of butter. Imports of NZ sheep meat made up nearly 18 per cent of
the UK’s total supply of sheep meat in 2002, while NZ butter contributed 14 per cent (GTI:
World Trade Atlas (2005), Statistics NZ (2005), MDC Datum (2004), Defra (2005a)).
Therefore the four products chosen for this study are dairy, apples, onions and lamb.
Energy component of key inputs into agricultural production
In agricultural production there are a number of inputs which are common across the systems.
This section therefore calculates the energy component and CO2 emissions associated with
these common inputs and the values are then applied in later sections when estimating the
energy and CO2 emissions associated with agricultural output.
Direct energy is that energy used directly by the operation, for example, diesel, petrol and
electricity. The definition of direct energy includes the energy contained in the fuel/electricity
(consumer energy), plus the energy for extracting, processing, refining and supplying (e.g.
5
transportation for diesel) the fuel, and losses which occur through the process. The values of
these are illustrated in Table 1. The primary energy content, which includes an allowance for
the fuels production and delivery, adds an extra 23 per cent for all these types in NZ (Wells,
2001) and 16 per cent in the UK.
The carbon emission for NZ and UK fuel is very similar. The carbon emissions for electricity
are higher in the UK due to the greater proportion of fossil fuel used whereas NZ generates 64
per cent from renewable sources.
Some of the UK farm budgets used to derive energy inputs had expenditure on contractors for
such operations as mowing and cultivation. For the purposes of this study the fuel was
assumed to be 12 per cent of the cost and this was then converted into litres of diesel.
Indirect energy inputs
Indirect energy inputs used in agricultural production include fertilisers, agrichemicals and
supplementary animal feed. Table 1 illustrates the energy and associated emissions for the
main inputs into agricultural systems. Fertiliser is the most significant indirect energy input.
The energy component in fertiliser comes mainly from its manufacture and transport.
The energy component and the CO2 emissions from fertilisers use the data presented by Wells
(2001). It is assumed here that these are the same for the UK and NZ.
6
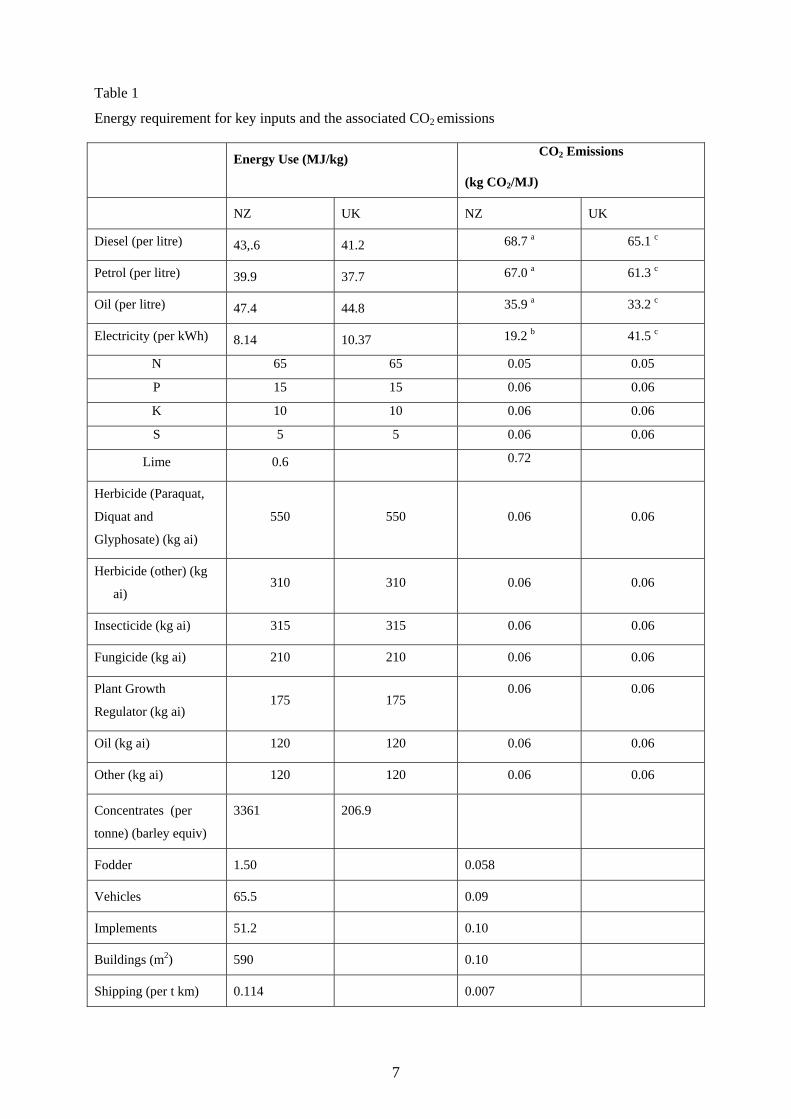
Table 1
Energy requirement for key inputs and the associated CO2 emissions
Energy Use (MJ/kg) CO2 Emissions
(kg CO2/MJ)
NZ UK NZ UK
Diesel (per litre) 43,.6 41.2 68.7 a 65.1 c
Petrol (per litre) 39.9 37.7 67.0 a 61.3 c
Oil (per litre) 47.4 44.8 35.9 a 33.2 c
Electricity (per kWh) 8.14 10.37 19.2 b 41.5 c
N 65 65 0.05 0.05
P 15 15 0.06 0.06
K 10 10 0.06 0.06
S 5 5 0.06 0.06
Lime 0.6 0.72
Herbicide (Paraquat,
Diquat and
Glyphosate) (kg ai)
550 550 0.06 0.06
Herbicide (other) (kg
ai) 310 310 0.06 0.06
Insecticide (kg ai) 315 315 0.06 0.06
Fungicide (kg ai) 210 210 0.06 0.06
Plant Growth
Regulator (kg ai) 175 175
0.06 0.06
Oil (kg ai) 120 120 0.06 0.06
Other (kg ai) 120 120 0.06 0.06
Concentrates (per
tonne) (barley equiv)
3361 206.9
Fodder 1.50 0.058
Vehicles 65.5 0.09
Implements 51.2 0.10
Buildings (m2) 590 0.10
Shipping (per t km) 0.114 0.007
7
As in the case of fertilisers the energy component of agrichemicals is mainly from their
manufacture and transport. The energy component and carbon dioxide emissions were
adapted from a detailed study of the energy in chemical manufacture and use, Pimentel (1980)
and data on carbon dioxide emissions is from Wells (2001) and Barber (2004b). The energy
requirement to manufacture agrichemicals ranges considerably as shown in Table1.
An important input into livestock systems in the UK is concentrate feed especially when
compared to NZ. For the purposes of this study it is assumed that concentrates have the same
energy profile as barley. This is likely to be an underestimate of the energy in the concentrate.
A simple analysis of the energy and CO2 emissions in producing barley feed was therefore
undertaken and reported in detail in Saunders et al (2006). This gave a lower bound on the
embodied energy in barley concentrate of 3,361 MJ per tonne of barley. The associated
emissions are 207 kg of CO2 per tonne of barley.
The energy emissions and carbon dioxide emissions for fodder were taken from Wells (2001)
and this was 1.50 MJ/kg dry mater (DM) for grass silage and hay with an emission rate of
0.058 kg CO2/MJ.
The energy and carbon dioxide emissions associated with machinery include the embodied
energy of the raw materials, construction energy, an allowance for repairs and maintenance,
and international freight (Wells, 2001). As Table 1 shows, the embodied energy of vehicles
and implements used in this report is 65.5 MJ/kg and 51.2 MJ/kg respectively (Barber and
Lucock, 2006). This is based on a simplification of the approach used by Audsley et al.
(1997) and incorporates New Zealand data for steel and rubber. This is lower than the figure
reported in Wells (2001) but more akin to that used by Doering (1980) who estimated a value
of around 70 MJ/kg.
Table 1 also gives the energy coefficients and CO2 emission rates for farm vehicles and
implements. For both New Zealand and the UK a dairy shed model constructed by Wells
(2001) was used. The capital energy of the dairy shed is related to a single parameter, the
number of sets of milking cups.
8
Transport
As described in the methodology section due to the lack of data, the only transport distances
for which analysis in this report will be done are on distances between countries, the export of
the products. For all of the New Zealand commodities this involves sea freight to the United
Kingdom, a distance of 17,840 km according to the Department for Transport (2003).
A review of the literature on the energy and emission coefficients for refrigerated sea
transport did show general consistency with one or two exceptions and the figure chosen here
is the 0.114 MJ per tonne km. This has been calculated from shipping having carbon dioxide
emissions of 0.007 kgCO2/t-km (Department for Transport, 2003), and the carbon content of
diesel being 2.68 kgCO2/L.1 Dividing the shipping emissions by the carbon content per litre
of diesel equals 0.0026 L/t-km. Multiplying this figure by the primary energy content of NZ
diesel (43.6 MJ/L), given that the ships refill in NZ, gives a rate of 0.114 MJ/t-km.
Energy and carbon dioxide emissions associated with production in NZ and the UK
This section calculates the energy and carbon dioxide emissions associated with the
production of NZ and UK dairy, apples, lamb and onions. This requires information on the
outputs of the production system so that the energy and carbon dioxide emissions can be
expressed per unit of output enabling comparisons to be made between the two countries. In
general information on NZ production systems, including inputs, was available in more detail
enabling a more thorough calculation of the energy embodied and emissions associated with
production. However, this has led to the results underestimating the energy associated with
production in the UK compared to that in NZ. Finally the shipping costs were calculated and
added to the NZ production system.
Dairy This section presents results for dairy; the unit for the dairy sector was tonnes of milk solids
(tMS).
The NZ dairy information presented here is based upon the study conducted by Colin Wells in
his 2001 study of the Dairy Industry (Wells 2001). This involved the comprehensive survey
of 150 dairy farms in NZ.
9
No single source of information on dairy production systems in the UK was available giving
the detailed information required to compare energy use in this sector with that in NZ.
Therefore a number of sources have been used to obtain and verify the information used. The
key sources were the report on the Economics of Milk Production, Colman et al. (2004), and
this was supplemented with Nix’s Farm Management Pocket Book (2004) and other sources
as cited below.
The energy and carbon dioxide emissions associated with dairy production in NZ and the UK
are summarised in Table 2.
10
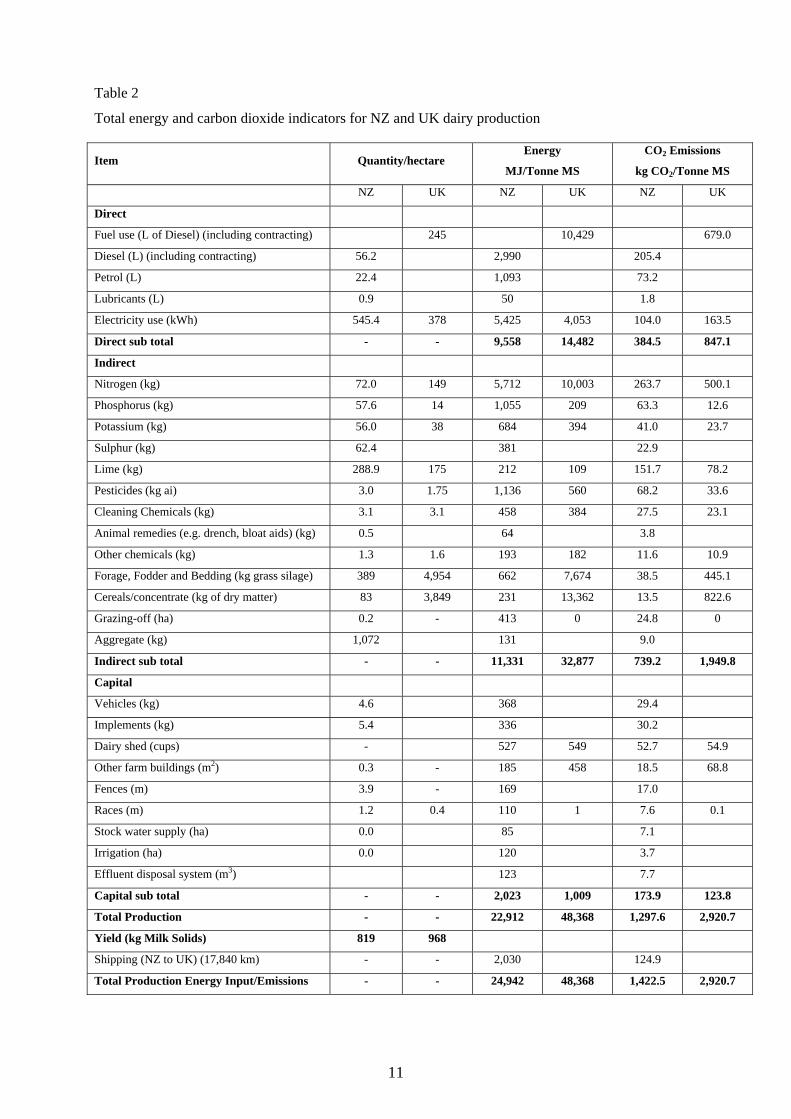
Table 2
Total energy and carbon dioxide indicators for NZ and UK dairy production
Item Quantity/hectare Energy
MJ/Tonne MS
CO2 Emissions
kg CO2/Tonne MS
NZ UK NZ UK NZ UK
Direct
Fuel use (L of Diesel) (including contracting) 245 10,429 679.0
Diesel (L) (including contracting) 56.2 2,990 205.4
Petrol (L) 22.4 1,093 73.2
Lubricants (L) 0.9 50 1.8
Electricity use (kWh) 545.4 378 5,425 4,053 104.0 163.5
Direct sub total - - 9,558 14,482 384.5 847.1
Indirect
Nitrogen (kg) 72.0 149 5,712 10,003 263.7 500.1
Phosphorus (kg) 57.6 14 1,055 209 63.3 12.6
Potassium (kg) 56.0 38 684 394 41.0 23.7
Sulphur (kg) 62.4 381 22.9
Lime (kg) 288.9 175 212 109 151.7 78.2
Pesticides (kg ai) 3.0 1.75 1,136 560 68.2 33.6
Cleaning Chemicals (kg) 3.1 3.1 458 384 27.5 23.1
Animal remedies (e.g. drench, bloat aids) (kg) 0.5 64 3.8
Other chemicals (kg) 1.3 1.6 193 182 11.6 10.9
Forage, Fodder and Bedding (kg grass silage) 389 4,954 662 7,674 38.5 445.1
Cereals/concentrate (kg of dry matter) 83 3,849 231 13,362 13.5 822.6
Grazing-off (ha) 0.2 - 413 0 24.8 0
Aggregate (kg) 1,072 131 9.0
Indirect sub total - - 11,331 32,877 739.2 1,949.8
Capital
Vehicles (kg) 4.6 368 29.4
Implements (kg) 5.4 336 30.2
Dairy shed (cups) - 527 549 52.7 54.9
Other farm buildings (m2) 0.3 - 185 458 18.5 68.8
Fences (m) 3.9 - 169 17.0
Races (m) 1.2 0.4 110 1 7.6 0.1
Stock water supply (ha) 0.0 85 7.1
Irrigation (ha) 0.0 120 3.7
Effluent disposal system (m3) 123 7.7
Capital sub total - - 2,023 1,009 173.9 123.8
Total Production - - 22,912 48,368 1,297.6 2,920.7
Yield (kg Milk Solids) 819 968
Shipping (NZ to UK) (17,840 km) - - 2,030 124.9
Total Production Energy Input/Emissions - - 24,942 48,368 1,422.5 2,920.7
11
Table 2 highlights the different production systems in the two countries with the first two
columns of data identifying the quantity of input per hectare. The total energy use is
presented in the third and fourth columns and shows that the UK uses considerably more
energy per tonne of milk solids. In particular the UK uses 50 per cent more fuel per tonne of
milk solids than NZ does although less electricity is used in the UK than in NZ. The major
difference in energy input however is in the use of concentrates and forage feed which in the
UK is significantly higher than that used in NZ, reflecting the different production systems.
In the UK a total of 48,368 MJ of energy is used per tonne of milk solid compared to 22,912
in NZ, over twice as much. Including shipping at 2,030 MJ per tonne milk solids still makes
NZ production much more energy efficient at 24,942 at just over half that in the UK.
When the carbon dioxide emissions associated with dairy production in the UK are compared
to that in NZ, even when transport is included from NZ to the UK, the UK emits over twice
that of NZ. Thus, the UK emits 2,921 kilograms of carbon dioxide per tonne of milk solids
compared to just 1,423 in NZ (including transport to the UK).
Apples The data used to determine NZ’s total energy and carbon dioxide emissions was prepared
with the assistance of horticultural consultant Greg Dryden (Fruition Horticulture), MAF
Policy (2005a), and the CAE Guide (1996).
In the case of the UK a number of sources of data were used to calculate the production
system. As in case of sheep meat (see below) the main source of data was Nix (2004) but this
was supplemented by Tanton and Williams (2004), Chalmers et al. (2001) and the UK
pesticide survey, Garthwaite et al. (2001).
To be able to meet the same market window as NZ apples, British apples are assumed to be
stored for six months. For these storage periods the apples are chilled to around 2°C, in a
refrigerated environment. No energy or emission coefficients were found for the UK, thus to
estimate the energy associate with this storage the Wells and Scarrow (1997) cold storage of
12
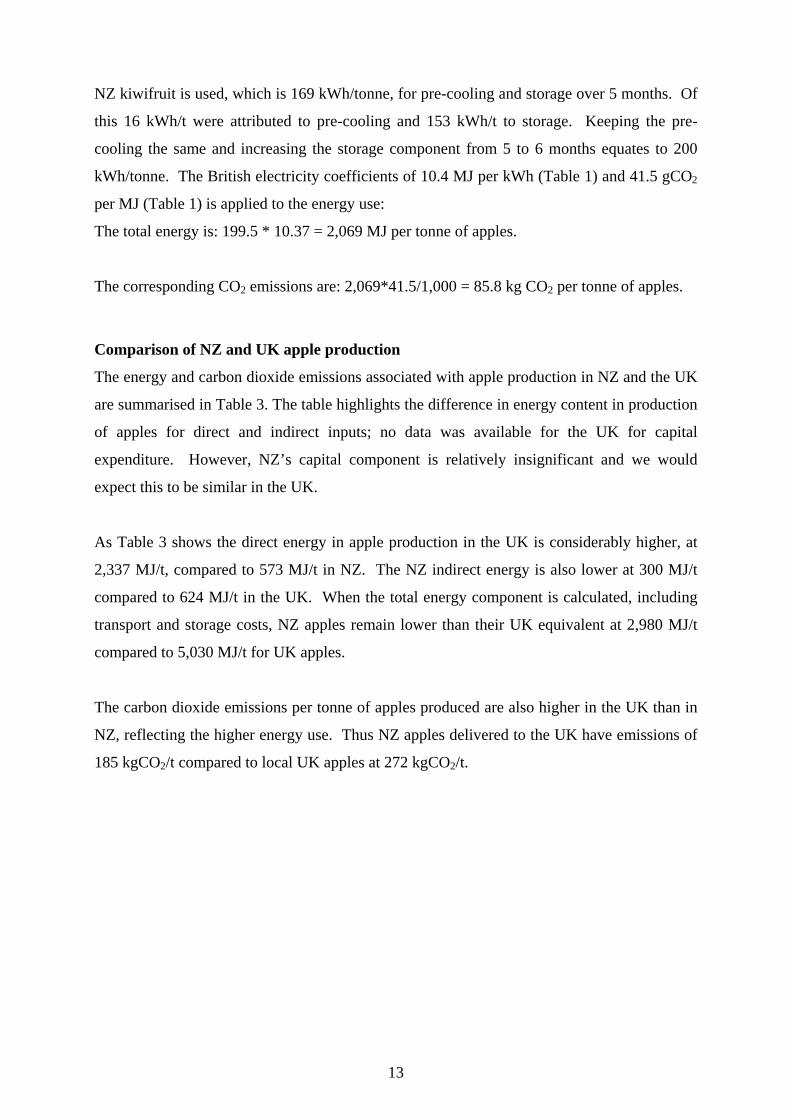
NZ kiwifruit is used, which is 169 kWh/tonne, for pre-cooling and storage over 5 months. Of
this 16 kWh/t were attributed to pre-cooling and 153 kWh/t to storage. Keeping the pre-
cooling the same and increasing the storage component from 5 to 6 months equates to 200
kWh/tonne. The British electricity coefficients of 10.4 MJ per kWh (Table 1) and 41.5 gCO2
per MJ (Table 1) is applied to the energy use:
The total energy is: 199.5 * 10.37 = 2,069 MJ per tonne of apples.
The corresponding CO2 emissions are: 2,069*41.5/1,000 = 85.8 kg CO2 per tonne of apples.
Comparison of NZ and UK apple production
The energy and carbon dioxide emissions associated with apple production in NZ and the UK
are summarised in Table 3. The table highlights the difference in energy content in production
of apples for direct and indirect inputs; no data was available for the UK for capital
expenditure. However, NZ’s capital component is relatively insignificant and we would
expect this to be similar in the UK.
As Table 3 shows the direct energy in apple production in the UK is considerably higher, at
2,337 MJ/t, compared to 573 MJ/t in NZ. The NZ indirect energy is also lower at 300 MJ/t
compared to 624 MJ/t in the UK. When the total energy component is calculated, including
transport and storage costs, NZ apples remain lower than their UK equivalent at 2,980 MJ/t
compared to 5,030 MJ/t for UK apples.
The carbon dioxide emissions per tonne of apples produced are also higher in the UK than in
NZ, reflecting the higher energy use. Thus NZ apples delivered to the UK have emissions of
185 kgCO2/t compared to local UK apples at 272 kgCO2/t.
13
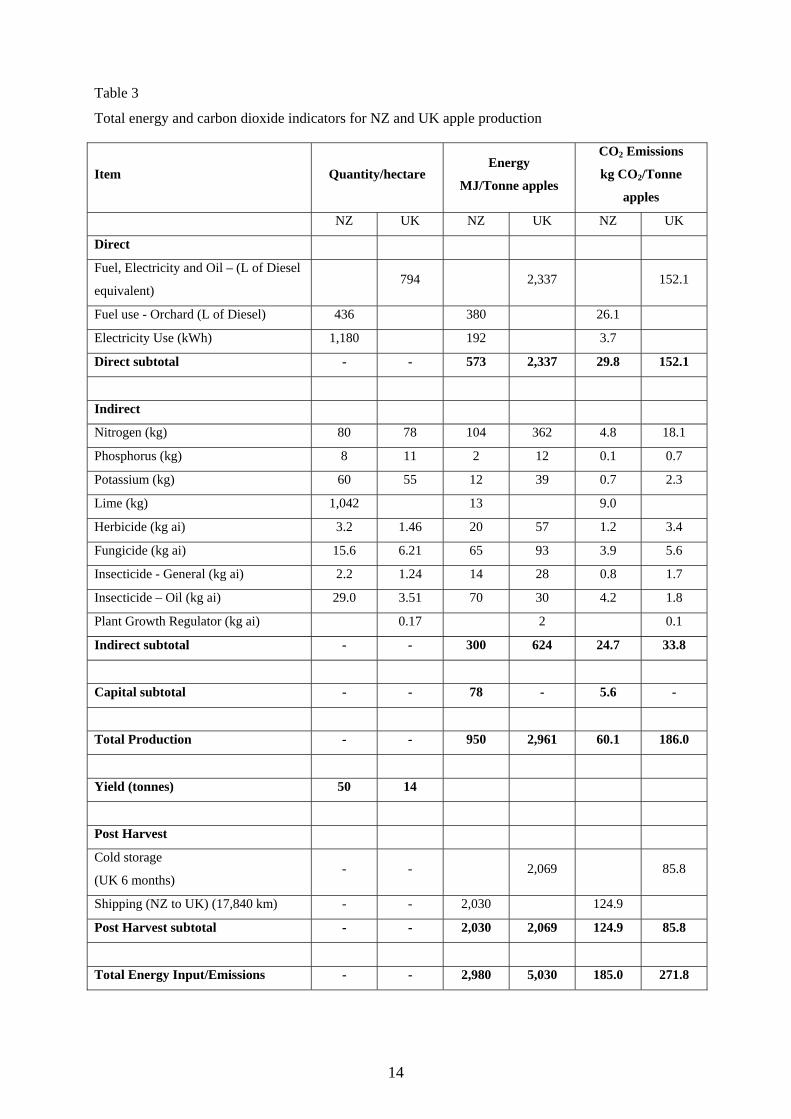
Table 3
Total energy and carbon dioxide indicators for NZ and UK apple production
Item Quantity/hectare Energy
MJ/Tonne apples
CO2 Emissions
kg CO2/Tonne
apples
NZ UK NZ UK NZ UK
Direct
Fuel, Electricity and Oil – (L of Diesel
equivalent) 794 2,337 152.1
Fuel use - Orchard (L of Diesel) 436 380 26.1
Electricity Use (kWh) 1,180 192 3.7
Direct subtotal - - 573 2,337 29.8 152.1
Indirect
Nitrogen (kg) 80 78 104 362 4.8 18.1
Phosphorus (kg) 8 11 2 12 0.1 0.7
Potassium (kg) 60 55 12 39 0.7 2.3
Lime (kg) 1,042 13 9.0
Herbicide (kg ai) 3.2 1.46 20 57 1.2 3.4
Fungicide (kg ai) 15.6 6.21 65 93 3.9 5.6
Insecticide - General (kg ai) 2.2 1.24 14 28 0.8 1.7
Insecticide – Oil (kg ai) 29.0 3.51 70 30 4.2 1.8
Plant Growth Regulator (kg ai) 0.17 2 0.1
Indirect subtotal - - 300 624 24.7 33.8
Capital subtotal - - 78 - 5.6 -
Total Production - - 950 2,961 60.1 186.0
Yield (tonnes) 50 14
Post Harvest
Cold storage
(UK 6 months) - - 2,069 85.8
Shipping (NZ to UK) (17,840 km) - - 2,030 124.9
Post Harvest subtotal - - 2,030 2,069 124.9 85.8
Total Energy Input/Emissions - - 2,980 5,030 185.0 271.8
14
Onions
There are some serious questions about the feasibility of the UK being able to supply the
market during its winter, due to technical issues around storage. Therefore whilst this has
been assumed possible here, as mentioned below, whether it is feasible to replace imports is
questionable.
The New Zealand and UK onion crop has been compared based on supplying a crop into the
same window of time, June to August, during the UK winter. The only way the UK onion
crop can achieve this is by using cold and controlled atmosphere (CA) storage.
The key NZ source of information was the NZ onion industry report (Barber, 2004a).
The key source of information on the production system for UK onions was Nix (2004) as
well as Chalmers et al. (2001) for fertiliser use.
Post production
Cold and controlled atmosphere storage
British onions are assumed to be stored for a minimum of nine months using a mixture of cold
and controlled atmosphere environment. The onions used for storage are harvested in August
and stored through to July.
The best data that was available for evaluating the energy cost of storage was the study
conducted by Wells and Scarrow (1997) on the storage of kiwifruit. This is likely to
underestimate the energy cost as the kiwifruit stores an ever decreasing volume of kiwifruit,
hence decreasing energy load, over the 5 months that the stores are typically operated for. By
contrast the volume of stored UK onions will remain the same over the 9 months required to
get them into the same customer window in July.
Wells and Scarrow (1997) found that it took 0.614 kWh/tray, or 169 kWh/tonne, for pre-
cooling and storage over 5 months. Of this 16 kWh/t were attributed to pre-cooling and 153
15
kWh/t to storage. Keeping the pre-cooling the same and increasing the storage component
from 5 to 9 months equates to 291 kWh/tonne.
Based on the energy and carbon dioxide emission coefficients in Table 1 total energy use was
3,020 MJ/tonne onions. Carbon dioxide emissions were 125 kg CO2/tonne.
Comparison of NZ and UK onion production
The energy and carbon dioxide emission associated with onion production in NZ and the UK
are summarised in Table 4. The table highlights the difference in energy content in production
of onions for direct and indirect inputs, as yet no data is available for the UK for capital
expenditure. Likewise no energy data was found on UK onion curing in drying sheds. As a
result the UK onion’s energy input and associated CO2 emissions are likely to be
underestimated.
As Table 4 shows NZ onions, compared to the UK equivalent, have a higher direct energy
input at 342 MJ/t compared to 245 MJ/t, although the UK figure does not include heating the
onion drying sheds. The indirect energy inputs are also higher in NZ at 427 MJ/t compared to
367 MJ/t in the UK. Thus the energy associated with onion production in NZ is higher at 821
MJ/t compared with 678 MJ/t in the UK. When shipping costs are included, the NZ total rises
to 2,889 MJ per tonne. However, when storage is included for the UK, so they can supply the
same window in market as NZ, the UK energy costs rise to 3,760MJ per tonne, 30 per cent
higher than those in NZ.
UK CO2 emissions are lower compared to NZ, at 170 kg/t compared to 185 kg/t. The
apparent anomaly of NZ having lower energy but higher CO2 emissions is due to the different
mix of energy sources.
16
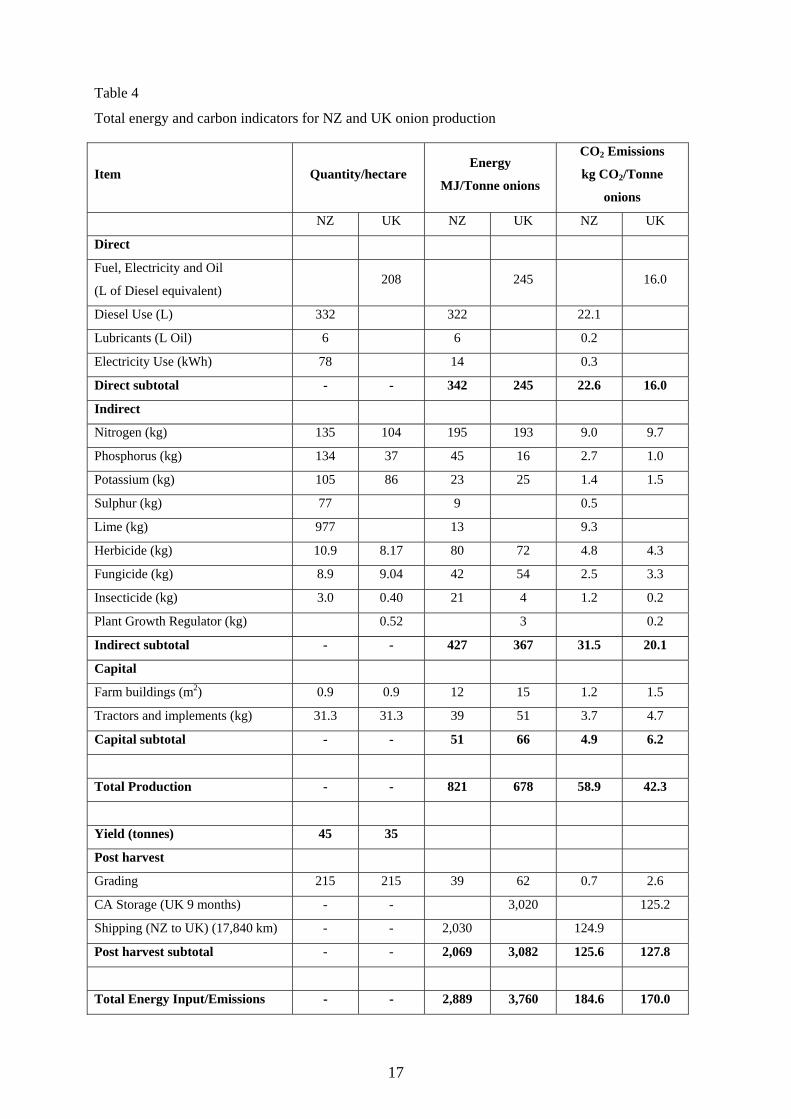
Table 4
Total energy and carbon indicators for NZ and UK onion production
Item Quantity/hectare Energy
MJ/Tonne onions
CO2 Emissions
kg CO2/Tonne
onions
NZ UK NZ UK NZ UK
Direct
Fuel, Electricity and Oil
(L of Diesel equivalent) 208 245 16.0
Diesel Use (L) 332 322 22.1
Lubricants (L Oil) 6 6 0.2
Electricity Use (kWh) 78 14 0.3
Direct subtotal - - 342 245 22.6 16.0
Indirect
Nitrogen (kg) 135 104 195 193 9.0 9.7
Phosphorus (kg) 134 37 45 16 2.7 1.0
Potassium (kg) 105 86 23 25 1.4 1.5
Sulphur (kg) 77 9 0.5
Lime (kg) 977 13 9.3
Herbicide (kg) 10.9 8.17 80 72 4.8 4.3
Fungicide (kg) 8.9 9.04 42 54 2.5 3.3
Insecticide (kg) 3.0 0.40 21 4 1.2 0.2
Plant Growth Regulator (kg) 0.52 3 0.2
Indirect subtotal - - 427 367 31.5 20.1
Capital
Farm buildings (m2) 0.9 0.9 12 15 1.2 1.5
Tractors and implements (kg) 31.3 31.3 39 51 3.7 4.7
Capital subtotal - - 51 66 4.9 6.2
Total Production - - 821 678 58.9 42.3
Yield (tonnes) 45 35
Post harvest
Grading 215 215 39 62 0.7 2.6
CA Storage (UK 9 months) - - 3,020 125.2
Shipping (NZ to UK) (17,840 km) - - 2,030 124.9
Post harvest subtotal - - 2,069 3,082 125.6 127.8
Total Energy Input/Emissions - - 2,889 3,760 184.6 170.0
17
Lamb
In the case of NZ most of the lamb information was gathered from a database developed by
Andrew Barber as part of the ARGOS Project (www.argos.org.nz) during 2004/05. In mixed
output farms (sheep and beef meat, wool and crops), a way of allocating energy use and
carbon dioxide emissions is needed. Two common methods are to either allocate as a
proportion of output weight or on the share of revenue. In this study sheep production has
been allocated according to its contribution to revenue, which was 47 per cent.
All outputs are either per hectare or tonne of carcass weight. In order to estimate the carcass
weight it was assumed that each lamb and ewe sold weighted 55 kg and that the dressing-out
percentage, the percentage of carcass weight to live weight, was 42 per cent (Burtt 2004).
In the case of sheepmeat production finding sources of data on farm production systems was
difficult given the fact there are few specialist sheep farms in the UK which do not have other
stock or crops. Therefore the production system data for sheepmeat relied on Nix Farm
Management Pocketbook data (Nix, 2004). There are also a number of sheepmeat production
systems in the UK ranging from hill and upland to lowland farms. However, as typically it is
the lowland farms where sheep are finished for meat, this is used as the system in the current
report. This also closely matched the farming type modelled in NZ which were also the
lowland farms.
As for dairy, to assess the energy and emission levels per unit of output, in this case tonnes of
meat carcass, the level of output has to be obtained and then the inputs. The average stocking
rate and output from a lowland spring lambing operation, is 11 ewes per forage hectare with
1.45 lambs are reared per ewe, Nix (2004). The average lamb carcass in the UK weighed
19.3kg in 2004, Defra (2005c). Therefore, the output of meat per ewe is the number of lambs
produced at 1.45 multiplied by the average weight of lamb carcass produced, at 19.3 kg,
giving 28 kg of meat per ewe, (1.45*19.3 = 28.0 kg). This is equivalent (assuming a stocking
rate of 11 ewes per hectare) to 308 kg of meat per hectare.
The next section calculates the energy and emissions associated with sheepmeat production.
However, when calculating energy and emissions from sheepmeat, the rates calculated need
to be discounted further to allow for the fact that not just meat is being produced but also co-
18
products in the system (e.g. wool), Keedwell et al. (2002). These authors allocated the
products from sheep production according to their contribution to revenue. Therefore in this
study the energy consumed by the various elements will also be attributed according to
revenue (as will CO2 emissions). The level of revenue per ewe is £55.10 for lamb sales,
£1.80 for wool and £5.80 for culling of ewes and rams, which comes to a total of £62.70, Nix
(2004). Lamb sales are therefore 87.9 per cent of revenue and therefore it will be assumed
that 87.9 per cent of energy and emissions will be attributed to meat production. This will
henceforth be referred to as the “co-product discount rate”, and will be used to adjust all the
calculations below.
19
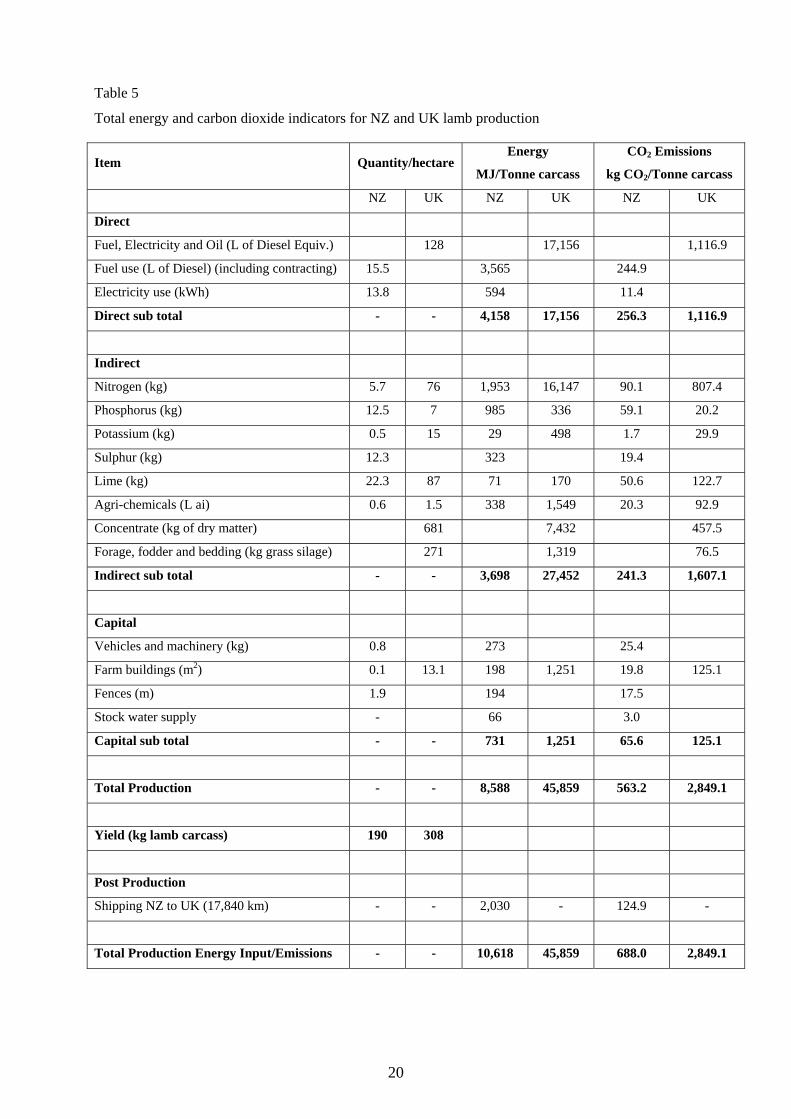
Table 5
Total energy and carbon dioxide indicators for NZ and UK lamb production
Item Quantity/hectare Energy
MJ/Tonne carcass
CO2 Emissions
kg CO2/Tonne carcass
NZ UK NZ UK NZ UK
Direct
Fuel, Electricity and Oil (L of Diesel Equiv.) 128 17,156 1,116.9
Fuel use (L of Diesel) (including contracting) 15.5 3,565 244.9
Electricity use (kWh) 13.8 594 11.4
Direct sub total - - 4,158 17,156 256.3 1,116.9
Indirect
Nitrogen (kg) 5.7 76 1,953 16,147 90.1 807.4
Phosphorus (kg) 12.5 7 985 336 59.1 20.2
Potassium (kg) 0.5 15 29 498 1.7 29.9
Sulphur (kg) 12.3 323 19.4
Lime (kg) 22.3 87 71 170 50.6 122.7
Agri-chemicals (L ai) 0.6 1.5 338 1,549 20.3 92.9
Concentrate (kg of dry matter) 681 7,432 457.5
Forage, fodder and bedding (kg grass silage) 271 1,319 76.5
Indirect sub total - - 3,698 27,452 241.3 1,607.1
Capital
Vehicles and machinery (kg) 0.8 273 25.4
Farm buildings (m2) 0.1 13.1 198 1,251 19.8 125.1
Fences (m) 1.9 194 17.5
Stock water supply - 66 3.0
Capital sub total - - 731 1,251 65.6 125.1
Total Production - - 8,588 45,859 563.2 2,849.1
Yield (kg lamb carcass) 190 308
Post Production
Shipping NZ to UK (17,840 km) - - 2,030 - 124.9 -
Total Production Energy Input/Emissions - - 10,618 45,859 688.0 2,849.1
20
Comparison of NZ and UK lamb production
Table 5 compares the production, energy and carbon dioxide emissions for lamb production in
the UK and NZ. This shows that NZ has considerably lower direct energy inputs per tonne of
carcass at 4,158 MJ compared to 17,156 MJ in the UK. In case of indirect energy use the
energy input in NZ are also significantly lower at 3,698 MJ per tonne of carcass weight
compared to 27,452MJ in the UK. When the energy embodied in capital is included, NZ
energy inputs are lower still with total energy associated with production 8,588 MJ in NZ
compared with 45,859 MJ in the UK. Including transport to the UK market increases the
energy used in NZ production but just to 10,618 MJ which is under a quarter of that in the
UK. This reflects the extensive production system in NZ compared with the UK.
In the case of emissions NZ carbon dioxide emissions are lower at 688 kg CO2/Tonne carcass
compared to 2,849 in the UK.
This study aimed to compare, using the same methodology, production systems in the UK
with those in NZ; specifically to assess the validity of the food mile argument. There are a
number of areas where this research could be expanded. Firstly comparison across different
production systems and different sources of supply to the UK would be of value. The
inclusion of internal transport costs and processing would enable a more complete LCA to be
undertaken. The lack of data on the UK was an issue leading us to underestimate resource use
and emissions in the UK systems.
The analysis also assumed that the UK would be able to meet the shortage of supply if NZ did
not supply this market which would mean diverting land from other uses. This additional
land is also likely to be poorer quality and therefore may require greater inputs.
The food miles debate has highlighted the importance of the issue of climate change in
consumers and politicians minds and the growing importance of reducing carbon emissions.
Hence the movement towards carbon footprinting of individuals, supply chains and products.
21
This is an issue which is continuing to grow in importance. A variety of consumer concerns
such as pollution and the use of non-renewable resources have crystallised around the issue of
climate change and a general move towards reduction in carbon emissions. This is
underpinned by government policy and targets. The UK has taken the lead in this area with
the Climate Change Bill aiming to reduce total emissions in the UK by 60 per cent from 1990
to 2050 and has established a committee to aid achieving this. The EU proposes a reduction
of emissions in the EU by 20 per cent by 2020 and by between 60 and 80 per cent by 2050.
The US has agreed to reduce emission intensity (that is the ratio of emissions to output) by 18
per cent by 2012 and individual states have introduced their own level targets. California, for
example, is aiming to reduce emissions to 1990 levels by 2020 and 80 per cent by 2050 and
the NEG-ECP (Eastern US and Canada) to reduce emissions by 10 per cent by 2010. Japan
also has announced a 50 per cent reduction in emissions by 2050.
The concern about climate change has been seen also through changes in markets and
development of labelling schemes. The Carbon Trust in 2006 introduced a label called the
Carbon Reduction Label with the proviso that products have to reduce emissions by 20 per
cent over two years. Tesco has stated it is carbon footprinting 70,000 of its products and this
has been followed by other major supermarket chains. The UK has established an enquiry into
the environmental labelling under Environmental Audit Committee this is to focus on issues
around labelling including feasibility of an international labelling scheme. This is an
important initiative that shows that carbon footprinting is not just in the private sector but
government involvement may well lead to regulation as has been seen with other labelling
schemes.
Also significant is the initiative where the Carbon Trust, DEFRA and the British Standard
Institute have developed a draft Publicly Available Specification (PAS) 2050:2008 to assess
life-cycle greenhouse gas emissions of products and services. The PAS 2050:2008 draws on
both the World Business Council for Sustainable Development (WBCSD)’s GHG protocol
and the International Standardisation Organisation’s (ISO 14064) on GHG quantification and
reporting. It aims to provide a standardised and consistent method that organisations can use
to measure the GHG emissions embodied in their products and services, as there are currently
different options for measuring GHG impacts at very specific or general levels. Unlike the
traditional measurement process that takes up to three years to complete, PAS 2050 is a fast
track process taking only 8 -12 months (Defra, 2007b). The PAS 2050:2008 standard has been
designed to specifically focus on product-level carbon footprinting. Other standards such as
22
ISO 14064-1 have a less prescriptive and much broader approach as they include a wide range
of potential environmental impact categories including global warming, eutrophication,
acidification, human toxicity etc.
PAS applies to any organisation calculating the embodied GHG emissions of a product or
service across its life cycle. According to Defra (2007b) and the guide accompanying PAS
2050:2008, the method:
• Applies to all products and services with consideration given to how and whether it may
need customising for specific product groups, e.g. food, buildings, Energy Using
Products
• Considers all lifecycle stages along the supply/value chain of a product or
service, that is, from raw materials to end of life
• Considers all GHGs
• Could be used by all sizes and types of organisations
The PAS 2050 method uses a multi step process that develops a lifecycle assessment of a
product’s GHG emissions. An overview of this method is as follows (slight variations to the
order of this method can occur in some circumstances):
1. Build supply chain process map- define the lifecycle inputs, outputs and unit
processes
2. Define boundary conditions and identify data requirements- identify the entire product
life-cycle and its sub-systems.
3. Collect primary and secondary data required to develop the mass balance and calculate
the GHG emissions from each process step.
4. Calculate GHG emissions by supply chain process steps- develop a model and
calculate the mass balance and GHG emission from each process activity step.
5. Assess uncertainty and precision of the analysis.
Other standards under development
Currently, the International Organization for Standardization is developing international
standards on product-level carbon footprinting and so is the World Resources Institute. The
standards from the World Resources Institute under the Greenhouse Gas Protocol Initiative
23
are expected to be published by December 2010 and the publishing date for the ISO standard
is expected to be March 2011. The WRI and ISO standards when they are developed are
unlikely to vary much from PAS 2050:2008 for two main reasons. First, standards on GHG
emissions have traditionally been harmonised and this will probably happen with these
standards as well. Secondly, the Carbon Trust, who co-sponsored PAS 2050:2008, supports
the development of the future standards from the World Resources Institute and the BSi
British Standards who prepared the PAS are part of the ISO process.
Carbon labelling is not confined to the United Kingdom with a number of schemes
developing across European countries. In Sweden a climate certification standard is being
developed. In Switzerland products are being labelled ‘Climatop’ if they cause less damage to
the environment than similar products. In France one retailer is planning to label 3,000 of its
food items. Elsewhere in the world, Japan is trialling a scheme with the intention of
introducing this in 2009. Carbon labelling is also being explored in Canada and in Australia.
All of these schemes are under development and in their infancy. The UK retail and NGO
sectors have taken the leadership in this area and has schemes further developed than other
countries but other countries are catching up fast and the need for carbon footprinting will be
required. Interestingly these schemes do not generally allow for offsetting but stress reduction
in emissions so they require producers to reduce their footprint buy different amounts over a
period or show they are more carbon friendly than competitor’s products. Thus whilst it is the
private sector that has taken the initiative in developing carbon labelling schemes
governments becoming involved in these as seen above in the UK but also in Japan. There
are international standards to aid the development of measuring a carbon footprint and these
include the ISO standards and also the Greenhouse Gas Protocol these provide the framework
for undertaking a carbon footprint and guidance on the scope of footprint. However, there is
still considerable discussion around the exact methodology over factors about data to be
included, how data is to be collected and the coefficients to be used. An important factor to
note is that, as stated above, the EU is highly likely to subsidise farmers to measure and
reduce their carbon footprint using farm level data. This has implications for NZ exporters in
that they will have to footprint without subsidies but also this may mean collecting data at the
farm level as opposed to from secondary or modelling sources.
24
This is extremely important for NZ exporters, firstly because the markets above developing
these schemes are important to NZ. In particular schemes in the UK, Australia and Japan
would mean that supplying those markets producers would have to carbon footprint their
products and reduce this. Moreover, given the growth and importance of international
procurement chains standards developed in any important importing country generally
become necessary to supply other markets as well.
These carbon labelling schemes stress reduction in footprints but there are also industry
initiatives in the UK such as the Milk Road map which aims to have a reduction in emission
from dairy of between 20 and 30 per cent by 2020 from 1990 levels (Dairy Supply Chain
Forum, 2008). That report also states that methane emissions from dairy have fallen 13.4 per
cent from 1990 and carbon emission by 23 per cent since 2000. This is significant for NZ
dairy sector one of our most important emitters and emissions from this sector have been
growing. Thus the need for footprinting and reduction in this sector will become more
important.
Therefore, carbon footprinting and reduction in emission is set to become standard for our
markets and likely to be introduced in the next few years. .
Other issues which have arisen are the rise in the debate about seasonal consumption and the
debate of consuming locally produced foods. Studies in the US show that locally grown food
labels play a great influence on consumers. Given a choice, consumers are more likely to
purchase locally grown over organic foods produced in a distant region, even if the local
foods were produced using some pesticides (Leopold Center for Sustainable Agriculture
2004). This is given impetus by the rise in popularity of local food markets.
Clearly, it is important for New Zealand agri-businesses to show they are ‘carbon-friendly’
and reducing their footprint. Interestingly it was the reduction which is being stressed rather
than offsetting. Offsetting had lost some credibility in the UK firstly because it was seen as
dodging the problem but also some schemes had been shown to be spurious and verging on
fraudulent.
Another very important factor potentially to affect the issue of carbon footprinting and other
environmental and social aspects of food production which may affect our market access is
the interdiction of the Single Farm Payment in the EU. This is a huge change in policy from
market based support (which has historically and still causes NZ hardship) to direct payments
25
to farmers based on environmental criteria. The budget for this is huge with 75 billion Euros
per year almost equivalent to NZ’s national income.
The CAP 2003 reform includes a Single Farm Payment (SFP) in which subsidies are
decoupled from production. That is farmers receive a payment irrespective of what and how
much they choose to produce. The EU commission has recently announced that climate
change issues will be included as part of these payments. This potentially means that
individual farms in the EU will measure their carbon footprint and access to the payment will
depend upon reducing this footprint. Consequently this may well mean we have to do the
same in NZ and individually carbon footprint all farms. Whilst this may seem a huge
undertaking it does have the advantage that farmers here are generally better place to do his
than many of our competitors and moreover farmers generally find financial savings when
these audits are undertaken (Agra Europe 2007).
The CAP reform of 2003 also brings the importance of environment, quality and safety issues
into the EU agricultural support. To benefit from the SFP, farmers will have to comply with
existing legislation on those issues (cross-compliance). Assistance in the form of advisory
services for farmers is foreseen to help EU farmers to meet the standards. In addition the
support for voluntary agri-environmental measures has increased. Incentives are foreseen for
farmers who join food quality certification schemes and consumer information campaigns
(EU 2003).
The introduction of the SFP and also the agri-environmental schemes in the EU has lead to
greater emphasis on other environmental factors including biodiversity, water quality and
wildlife. The payments will help to subsidise farmers to meet requirements for these on their
farms and the market requirements may well increase for these attributes. This can already be
seen in the growth of such schemes as EureGAP which include requirements or
recommendations for environment and hygiene, environmental management including
wildlife policy, groundwater, staff facilities, training and health and safety. Whilst not all of
these are “must dos” at present the subsidisation of EU farmers to meet these requirements
will enable them to become “must dos” sooner.
Conclusion
In conclusion NZ exporters have growing opportunities in the world market as export
subsidies are reduced and removed. However, this opportunity may well rely on production
meeting various environmental criteria especially to access high-value markets. Climate
change is the most recent example of these criteria from which issues such as food miles have
26
arisen. This is clearly an erroneous concept as it ignores the full energy and carbon emissions
from production as the Lincoln AERU Food Miles report showed. Food miles, whist still
having traction with the popular media and maybe consumers, has lost credibility with the
supermarkets and government agencies who have turned their attention to carbon footprinting.
The emphasis now is therefore on measuring the carbon footprint of products and currently
DEFRA, the Carbon Trust and BSI are developing a method to do this. The key in factor is
reducing carbon footprint over time.
1 (Defra http://www.defra.gov.uk/environment/business/envrp/gas/05.htm)
27
References
Agra Europe (2006) 2233.
Agra Europe (2007) various issues
Agra Facts (2006). 87(6).
Christensen, V. and C. Saunders (2003). Economic Analysis of Issues Concerning Organic
Dairy Farming. Christchurch, AERU, Lincoln University.
Department for Environment Food and Rural Affairs. (2007b). Methods review to support the PAS for the measurement of the embodied greenhouse gas emissions of products and services. Retrieved 20-09-08, from Defra: http://www.bsi-global.com/upload/Standards%20&%20Publications/PSS/ProjectSpecification%20PAS%20Methods%20Review%20for%20Steering%20GroupWeb.pdf
EU (2003). Council regulation (EC) N0 1782/2003 of 29 September 2003.
EUREPGAP (2006). About EUREPGAP. http://www.eurepgap.org/about.html.
Fisher Boel, M. (2006). Member of the European Commission responsible for Agriculture
and Rural Development: Reform of the Fruits and Vegetables CMO: Speech to
European Parliament Inter-group on fruit and vegetables. Strasbourg.
Leopold Center for Sustainable Agriculture (2004). Ecolabel Value Assessment Phase II:
Consumer Perceptions of Local Foods, Iowa State University.
Martech Consulting Group (n.d). Trends that impact New Zealand's horticultural food
exports. Trends in Horticultural Foods.
28
OECD (2003). Agri-Environmental policy measures: overview of developments, Organisation
for Economic Co-operation and Development.
Saunders, C., A. Barber, et al. (2006). Food Miles - Comparative Energy/Emissions
Performance of New Zealand's Agriculture Industry, AERU - Lincoln University.
Wilkins, J. (2006). SNE 2005 Kicks Off With a Look at Food Systems and Health. Division
of Sustainable Food Systems Newsletter. Society for Nutrition Education.
www.sne.org/sne2005conferencematerials.html.
Audsley, E. (coord.), Alber S., Clift R., Cowell S., Crettaz P., Gaillard G., Hausheer J., Jolliet
O., Kleijn R., Mortensen B., Pearce D., Roger E., Teulon H., Weidema B., Van Zeijts,
H., 1997. Harmonisation of Environmental Life Cycle Assessment for Agriculture. Final
Report. Concerted Action AIR3-CT94-2028. European Commission. DG VI
Agriculture.
Barber, A., 2004a. Seven Case Study Farms: Total Energy & Carbon Indicators For New
Zealand Arable & Outdoor Vegetable Production, No City: AgriLINK New Zealand
Ltd; http://www.agrilink.co.nz/Files/Arable per cent20Vegetable per cent20Energy per
cent20Use per cent20 Main per cent20Report.pdf
Barber, A., 2004b. Total Energy & Carbon Indicators for New Zealand Kiwifruit Orchards: A
Pilot Survey, No City: AgriLINK New Zealand Ltd. Not publicly released.
Barber, A., and Lucock, D., 2006. Total Energy Indicators: Benchmarking Organic,
Integrated and Conventional Sheep and Beef Farms. ARGOS Research Report:
Number 06/07. Prepared by The AgriBusiness Group, Pukekohe.
Basset-Mens, C., Ledgard, S. and Carran, A., 2005. :First Life Cycle Assessment of Milk
Porduction Systems for New Zealand Dairy Farm Systems. Paper presented to the
ANZSEE conference.
29
Brentrup, F., Küsters, J., Kuhlmann, H. and Lammel, J., 2004a. ‘Environmental impact
assessment of agricultural production systems using life cycle assessment methodology
I. Theoretical concept of a LCA method tailored to crop production’, European Journal
of Agronomy 20 (2004) 247-264.
Brentrup, F., Küsters, J., Lammel, J., Barraclough, P. and Kuhlmann, H., 2004b.
‘Environmental impact assessment of agricultural production systems using life cycle
assessment (LCA) methodology II. The application to N fertiliser use in winter wheat
production systems’, European Journal of Agronomy 20 (2004) 265-279.
Burtt, E., 2004. Financial Budget Manual, Farm Management Group, Lincoln University.
CAE 1996. Energy Efficiency: A Guide to Current and Emerging Technologies. Volume 2:
Industry and Primary Production. Centre for Advanced Engineering, University of
Canterbury, Christchurch. www.caenz.com
Cederberg, C. and Flysjö, A., 2004. Life Cycle Inventory of 23 Dairy Farms in South-Western
Sweden, Göteborg: Sik; http://www.sik.se/archive/pdf-filer-katalog/SR728(1).pdf
Chalmers, A., Hounsome, B. and Rush, C., 2001. The British Survey of Fertiliser Practice:
Fertiliser Use on Farm Crops for Crop Year 2000, (No City: Crown);
http://www.defra.gov.uk/environ/pollute/bsfp/2000/index.htm
Colman, D., Farrar, J. and Zhuang, Y., 2004. Economics of Milk Production in England and
Wales 2002/03, Special Study in Agricultural economics No 58, Farm Business Unit,
University of Manchester, UK.
Defra 2005a. National Statistics. http://statistics.defra.gov.uk
Defra 2005c. United Kingdom Slaughter Statistics (slaughter statistics dataset: 26 May 2005),
http://statistics.defra.gov.uk/esg/datasets/slaughm.xls; accessed 14 June 2005.
Defra http://www.defra.gov.uk/environment/business/envrp/gas/05.htm)
30
Department for Transport 2003: Life cycle modelling CO2 emissions for lettuce, apples and
cherries,
http://www.dft.gov.uk/stellent/groups/dft_freight/documents/page/dft_freight_508272.h
csp
Doering, O.C., 1980. Accounting for energy in farm machinery and buildings. In: Pimentel,
D. (Ed.). Handbook of Energy Utilisation in Agriculture. CRC Press Inc., Boca Raton,
Florida.
Garnett, T., 2003. Wise Moves: Exploring the relationship between food, transport and CO2,
London: Transport 2000.
Garthwaite, D., Thomas, M. and Dean, S., 2001. Pesticide Usage Survey Report 172:
Orchards & Fruit Stores in Great Britain 2000, York: Cental Science Laboratory.
GTI 2005. World Trade Atlas, 2005
Keedwell, R., Robertson, L. and Barnett, J., 2002. Energy Use and Greenhouse Gases for
New Zealand Meat (Confidential to Meat New Zealand), No City: Fonterra Research
Centre.
MAF Policy 2005a. Pipfruit Monitoring Report. Ministry of Agriculture and Forestry.
Wellington. http://www.maf.govt.nz
MDC Datum 2004. Dairy Facts and Figures 2003, Cirencester: Milk Development Council
Nix, J., 2004. Farm Management Pocketbook: Thirty-Fifth Edition (2005), No City: The
Andersons Centre.
OECD/IEA 2001. Saving Oil and Reducing CO2 Emissions in Transport: Options &
Strategies, Paris: OECD/IEA,
http://www.iea.org/dbtw-wpd/Textbase/nppdf/free/2000/savingoil2001.pdf
31
Pirog, R., Van Pelt, T., Enshayan, K. and Cook, E., 2001. Food, Fuel, and Freeways: An Iowa
perspective on how far food travels, fuel usage, and greenhouse gas emissions, (Ames:
Leopold Center for Sustainable Agriculture, Iowa State University);
http://www.leopold.iastate.edu/pubs/staff/ppp/index.htm.
Pimentel, D., 1980. Energy Inputs for the Production, Formulation, Packaging, and Transport
of Various Pesticides. In: Pimentel, D. (Ed.). Handbook of Energy Utilisation in
Agriculture. CRC Press Inc., Boca Raton, Florida.
Pretty, J., Ball, A., Lang, T. and Morison, J., 2005. ‘Farm costs and food miles: An
assessment of the full cost of the UK weekly food basket’, Food Policy 30(1), 1-19.
Saunders, C.M., Barber, A. and Taylor, G., 2006. Food Miles – Comparative
Energy/Emissions Performance of New Zealand’s Agriculture Industry. AERU
Research Report No. 285, Lincoln University.
Smith, A., Watkiss, P., Tweddle, G., McKinnon, A., Browne, M., Hunt, A., Treleven, C.,
Nash, C. and Cross, S., 2005. The Validity of Food Miles as an Indicator of Sustainable
Development, Harwell: AEA Technology;
http://statistics.defra.gov.uk/esg/reports/foodmiles/final.pdf
Statistics NZ 2005. Key Statistics. Wellington, New Zealand
Tan, R. and Culaba, A., 2002. Environmental Life-Cycle Assessment: A Tool for Public and
Corporate Policy Development, http://www.lcacenter.org/library/pdf/PSME2002a.pdf
Tanton and Williams 2004.
Wells, C., 2001. Total Energy Indicators of Agricultural Sustainability: Dairy Farming Case
Study, Wellington: Ministry of Agriculture and Forestry
Wells, C. and Scarrow, S., 1997. Opportunities for Improving the Environmental Operations
of the Post Harvest Sector in Kiwifruit. Zespri International and MAF Policy,
Wellington NZ.
32

33