Embed Size (px)
Citation preview

Trading and Financial Update First Quarter 2021
27 May 2021

Page: 2
CONTENTS
ABOUT PANORO ................................................................................................................................................................. 3
HIGHLIGHTS AND EVENTS ................................................................................................................................................... 3 First quarter 2021 Trading Statement and Operational Highlights .................................................................................................................. 3
FINANCIAL INFORMATION .................................................................................................................................................. 6 Condensed Consolidated Statement of Comprehensive Income ..................................................................................................................... 6 Condensed Consolidated Statement of Financial Position ............................................................................................................................... 8 Condensed Consolidated Statement of Changes in Equity .............................................................................................................................. 9 Condensed Consolidated Statement of Cashflows ......................................................................................................................................... 10 Segment information ..................................................................................................................................................................................... 11 Notes .............................................................................................................................................................................................................. 12
OTHER INFORMATION ...................................................................................................................................................... 17 Glossary and definitions ................................................................................................................................................................................. 17 Disclaimer ....................................................................................................................................................................................................... 17
Page: 3
ABOUT PANORO Panoro Energy ASA is an independent exploration and production company based in London and listed on the main board of the
Oslo Stock Exchange with the ticker PEN. Panoro holds production, exploration and development assets in Africa, namely a
producing interest in Block G, offshore Equatorial Guinea, the Dussafu License offshore southern Gabon, OML 113 offshore
western Nigeria (held-for-sale, subject to completion), the TPS operated assets, Sfax Offshore Exploration Permit and Ras El Besh
Concession, offshore Tunisia and participation interest in an exploration Block 2B, offshore South Africa.
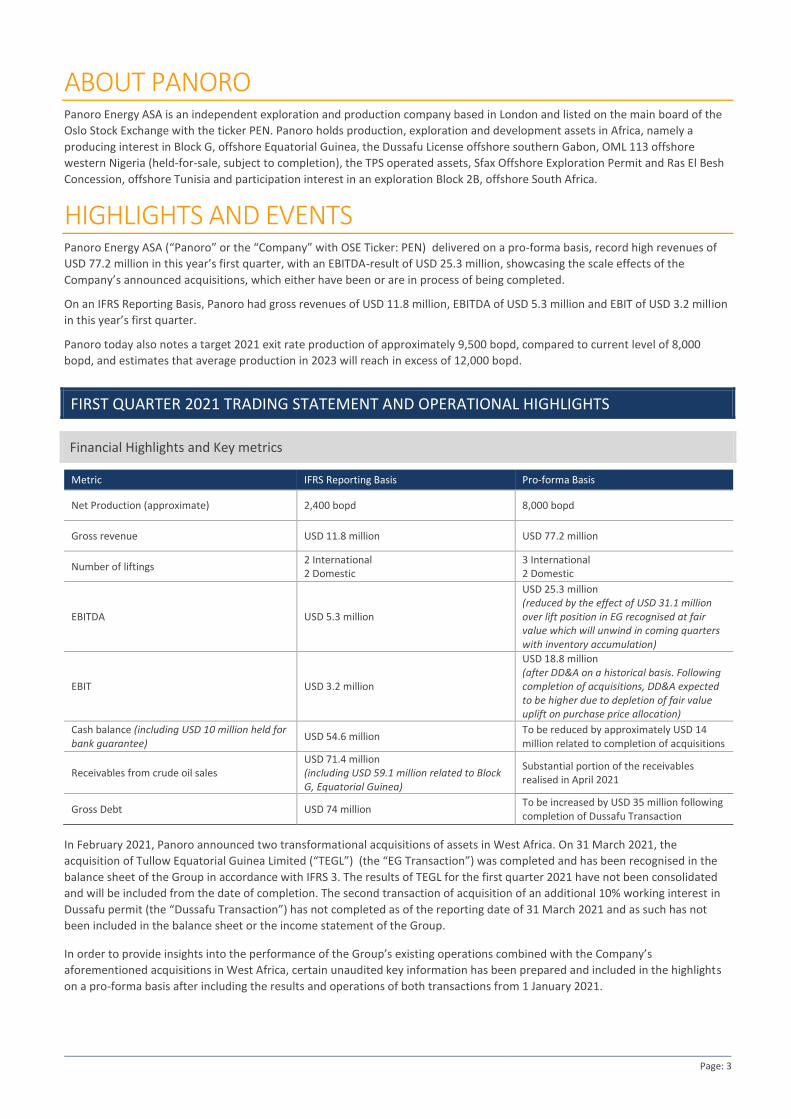
HIGHLIGHTS AND EVENTS Panoro Energy ASA (“Panoro” or the “Company” with OSE Ticker: PEN) delivered on a pro-forma basis, record high revenues of
USD 77.2 million in this year’s first quarter, with an EBITDA-result of USD 25.3 million, showcasing the scale effects of the
Company’s announced acquisitions, which either have been or are in process of being completed.
On an IFRS Reporting Basis, Panoro had gross revenues of USD 11.8 million, EBITDA of USD 5.3 million and EBIT of USD 3.2 million
in this year’s first quarter.
Panoro today also notes a target 2021 exit rate production of approximately 9,500 bopd, compared to current level of 8,000
bopd, and estimates that average production in 2023 will reach in excess of 12,000 bopd.
FIRST QUARTER 2021 TRADING STATEMENT AND OPERATIONAL HIGHLIGHTS
Financial Highlights and Key metrics
Metric IFRS Reporting Basis Pro-forma Basis
Net Production (approximate) 2,400 bopd 8,000 bopd
Gross revenue USD 11.8 million USD 77.2 million
Number of liftings 2 International 2 Domestic
3 International 2 Domestic
EBITDA USD 5.3 million
USD 25.3 million (reduced by the effect of USD 31.1 million over lift position in EG recognised at fair value which will unwind in coming quarters with inventory accumulation)
EBIT USD 3.2 million
USD 18.8 million (after DD&A on a historical basis. Following completion of acquisitions, DD&A expected to be higher due to depletion of fair value uplift on purchase price allocation)
Cash balance (including USD 10 million held for bank guarantee)
USD 54.6 million To be reduced by approximately USD 14 million related to completion of acquisitions
Receivables from crude oil sales USD 71.4 million (including USD 59.1 million related to Block G, Equatorial Guinea)
Substantial portion of the receivables realised in April 2021
Gross Debt USD 74 million To be increased by USD 35 million following completion of Dussafu Transaction
In February 2021, Panoro announced two transformational acquisitions of assets in West Africa. On 31 March 2021, the
acquisition of Tullow Equatorial Guinea Limited (“TEGL”) (the “EG Transaction”) was completed and has been recognised in the
balance sheet of the Group in accordance with IFRS 3. The results of TEGL for the first quarter 2021 have not been consolidated
and will be included from the date of completion. The second transaction of acquisition of an additional 10% working interest in
Dussafu permit (the “Dussafu Transaction”) has not completed as of the reporting date of 31 March 2021 and as such has not
been included in the balance sheet or the income statement of the Group.
In order to provide insights into the performance of the Group’s existing operations combined with the Company’s
aforementioned acquisitions in West Africa, certain unaudited key information has been prepared and included in the highlights
on a pro-forma basis after including the results and operations of both transactions from 1 January 2021.

Page: 4
The pro-forma information above is prepared for indicative purposes only and should not be construed as past performance of
the Group or be seen as a forward-looking guidance. The purpose of this information is solely to provide illustration and highlight
the key metrics of the business on an indicative basis after considering potential acquisitions. For information on the assumptions
used to prepare pro-forma information, please refer to note 7 of this publication.
Operational Highlights
• Production and lifting operations maintained and largely unaffected through the quarter
• Health and Safety systems and protocols proved resilient
Equatorial Guinea
• Average first quarter production of approximately 30,200 bopd gross (4,300 bopd net)
• One cargo under Panoro’s entitlement was lifted during the quarter, generating sales of USD 59.1 million
• The Okume upgrade project is nearing completion, adding additional power, water injection and gas lift capacity necessary for further facilities de-bottlenecking and additional electrical submersible pumps (ESPs). In April, partners commenced the second phase of the planned ESP program and upgraded the G-19 flowline, which has significantly enhanced production from that well. A rig has also been contracted for the upcoming infill drilling campaign, which is expected to arrive in country during 2Q to drill the three wells planned on the Elon field this year
• Three new production wells are planned for the Elon field in 2021
• The partners are now focussed on defining further production growth activities in 2022 and beyond, comprising additional development drilling and workover activity
Gabon
• Average first quarter production of 13,600 bopd gross on average (1,020 bopd net increasing to 2,380 bopd following completion of 10% additional working interest)
• Material cost and time savings through an alternative development plan for the Hibiscus/Ruche area using jack-up rigs in place of a wellhead platform
• USD 100 million gross in capital savings as compared to previous concept
• Break-even for next development phases of approximately USD 25 per barrel
• One crude oil lifting in 1Q, sold at USD 67 per barrel with cost of sales of USD 23 per barrel
Tunisia
• Average first quarter production In Tunisia of 4,543 bopd gross on average during the quarter (1,336 bopd net)
• A lifting of 96,000 bbls net to Panoro was completed during the quarter achieving a price of approximately USD 60/bbl. Additional domestic liftings also supplemented the revenues for this period
• Joint study in progress with partner ETAP to update subsurface models and plan further development of the Guebiba Field
Corporate Highlights
• Completion of acquisition from Tullow Oil plc of a 14.25% working interest in Block G, offshore Equatorial Guinea (“EG Transaction”) with remaining additional 10% working interest in Dussafu Marin Permit, offshore Gabon expected to complete in 2Q
• Equity private placement and subsequent offering during the quarter with net proceeds of USD 77.1 million
• First drawdown of USD 55 million under the USD 90 million debt facility with Trafigura/MCB to partially fund the EG Transaction
• Completion of farm-in of 12.5% working interest in Block 2B, offshore South Africa in April 2021

Page: 5
Outlook and Guidance
• Five new production wells to be completed during Q2 and Q3 (3 EG and 2 Gabon)
• Targeting 2021 exit rate production in excess of 9,500 bopd
• Production growth activity in Tunisia to continue with workovers planned at El Ain and Cercina
• Drilling of Hibiscus North exploration well in Q3
• Drilling of Gazania-1 exploration well in Block 2B by end of 2021
• Three international liftings expected in 2Q 2021
• Dividend of PetroNor shares to Panoro shareholders (upon completion of sale of Aje)

Page: 6
FINANCIAL INFORMATION The financial information set out below is intended as a high level update of the results and financial position of Panoro. This
information is unaudited and has been prepared using the same accounting policies and principles applied to preparation of the
Group’s 2020 Annual report.
CONDENSED CONSOLIDATED STATEMENT OF COMPREHENSIVE INCOME
Q1 2021
Q4 2020
Q1 2020
Amounts in USD 000 (Unaudited) (Unaudited) (Unaudited)
Total revenues 11,847 10,723 3,416
Operating expenses (3,987) (5,912) (1,329)
General and administrative costs (2,512) (1,827) (1,777)
EBITDA 5,348 2,984 310
Depreciation, depletion and amortisation (1,885) (1,796) (1,644)
Other non-operating items (231) (245) (240)
EBIT - Operating income/(loss) 3,232 943 (1,574)
Financial costs net of income (2,578) (2,443) 10,644
Profit/(loss) before tax 654 (1,500) 9,070
Income tax expense (1,797) (1,938) (1,052)
Net profit/(loss) from continuing operations (1,143) (3,438) 8,018
Net income/(loss) from discontinued operations (137) (829) (2,032)
Net profit/(loss) for the period (1,280) (4,267) 5,986
EARNINGS PER SHARE
Basic and diluted EPS on profit/(loss) for the period attributable to equity holders of the parent (USD) - Total
(0.02) (0.03) 0.09
Basic and diluted EPS on profit/(loss) for the period attributable to equity holders of the parent (USD) - Continuing operations
(0.01) (0.03) 0.12

Page: 7
Underlying Operating Profit/(Loss) before tax is considered by the Group to be a useful non-GAAP financial measure to help
understand underlying operational performance. The foregoing analysis has also been performed including, on an adjusted basis,
the Underlying Operating Profit/(Loss) before tax from continuing operations of the Group. A reconciliation with adjustments to
arrive at the Underlying Operating Profit/(Loss) before tax from continuing operations is included in the table below:
Q1 2021
Q4 2020
Q1 2020
Amounts in USD 000 (Unaudited) (Unaudited) (Unaudited)
Net income/(loss) before tax - continuing operations 654 (1,019) 9,070
Share based payments 231 228 240
Non-recurring costs 439 88 66
Loss/(gain) on disposal of oil and gas assets - - -
Impairment / (reversal) of impairment for Oil and gas assets - - -
Unrealised (gain)/loss on commodity hedges 1,638 1,810 (10,108)
Underlying operating profit/(loss) before tax 2,962 1,107 (732)
Underlying Operating Profit/(Loss) before tax is a supplemental non-GAAP financial measures used by management and external users of
the Company's consolidated financial statements, such as industry analysts, investors, lenders and rating agencies. The Company defines
Underlying Operating Profit/(loss) before tax as Net income (loss) from continuing operations before tax adjusted for (i) Share based
payment charges, (ii) unrealised (gain) loss on commodity hedges, (iii) (gain) loss on sale of oil and gas properties, (iv) impairments write-
off’s and reversals, and (v) similar other material items which management believes affect the comparability of operating results. We
believe that Underlying Operating Profit/(Loss) before tax and other similar measures are useful to investors because they are frequently
used by securities analysts, investors and other interested parties in the evaluation of companies in the oil and gas sector and will provide
investors with a useful tool for assessing the comparability between periods, among securities analysts, as well as company by company.
Because EBITDA and Underlying Operating Profit/(Loss) before tax excludes some, but not all, items that affect net income, these
measures as presented by us may not be comparable to similarly titled measures of other companies.
Page: 8
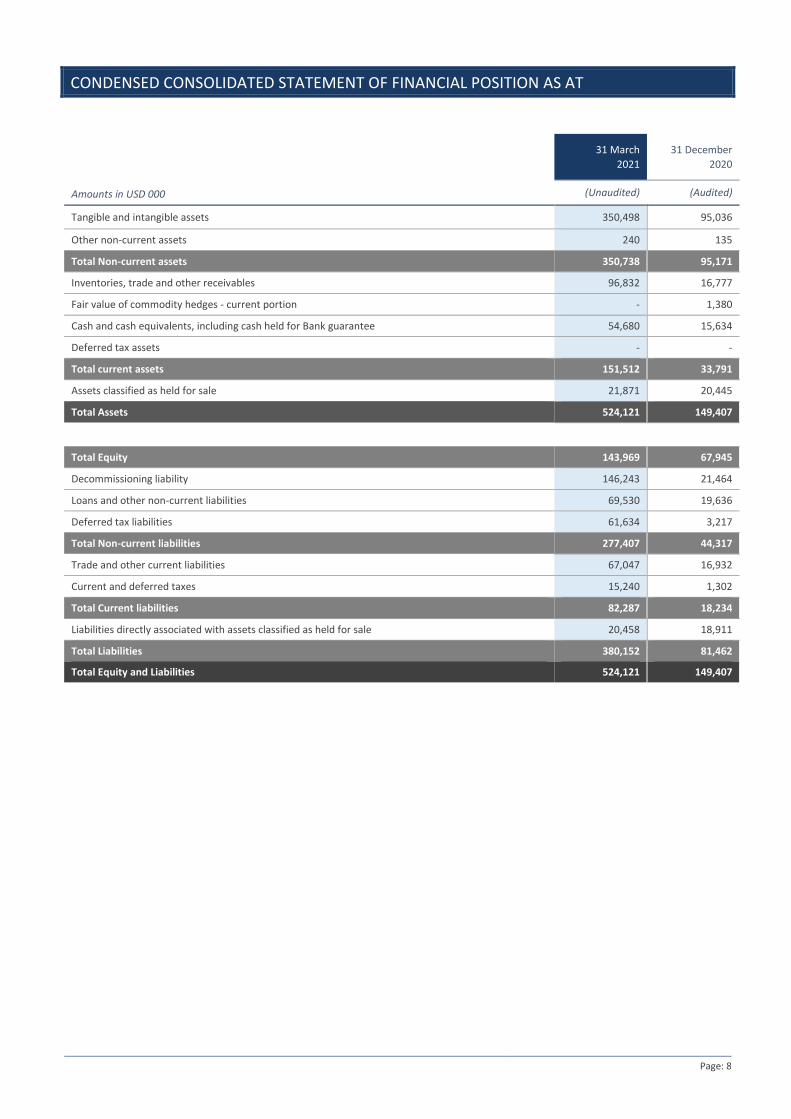
CONDENSED CONSOLIDATED STATEMENT OF FINANCIAL POSITION AS AT
31 March
2021
31 December
2020
Amounts in USD 000 (Unaudited) (Audited)
Tangible and intangible assets 350,498 95,036
Other non-current assets 240 135
Total Non-current assets 350,738 95,171
Inventories, trade and other receivables 96,832 16,777
Fair value of commodity hedges - current portion - 1,380
Cash and cash equivalents, including cash held for Bank guarantee 54,680 15,634
Deferred tax assets - -
Total current assets 151,512 33,791
Assets classified as held for sale 21,871 20,445
Total Assets 524,121 149,407
Total Equity 143,969 67,945
Decommissioning liability 146,243 21,464
Loans and other non-current liabilities 69,530 19,636
Deferred tax liabilities 61,634 3,217
Total Non-current liabilities 277,407 44,317
Trade and other current liabilities 67,047 16,932
Current and deferred taxes 15,240 1,302
Total Current liabilities 82,287 18,234
Liabilities directly associated with assets classified as held for sale 20,458 18,911
Total Liabilities 380,152 81,462
Total Equity and Liabilities 524,121 149,407

Page: 9
CONDENSED CONSOLIDATED STATEMENT OF CHANGES IN EQUITY
Attributable to equity holders of the parent
For the three months ended 31 March 2021 Amounts in USD 000
Issued capital
Share premium
Additional paid-in capital
Retained earnings
Other reserves
Currency translation
reserve Total
At 1 January 2021 (Audited) 459 349,446 122,465 (361,017) (37,647) (5,761) 67,945
Net income/(loss) for the period - continuing operations
- - - (1,143) - - (1,143)
Net income/(loss) for the period - discontinued operations
- - - (137) - - (137)
Total comprehensive income/(loss) - - - (1,280) - - (1,280)
Share issue for cash 259 79,856 - - - - 80,115
Share issue costs - (3,043) - - - - (3,043)
Employee share options charge - - 232 - - - 232
At 31 March 2021 (Unaudited) 718 426,259 122,697 (362,297) (37,647) (5,761) 143,969
Attributable to equity holders of the parent
For the quarter ended 31 December 2020 Amounts in USD 000
Issued capital
Share premium
Additional paid-in capital
Retained earnings
Other reserves
Currency translation
reserve Total
At 30 September 2020 (Unaudited) 459 349,446 122,222 (356,750) (37,647) (5,761) 71,969
Net income/(loss) for the period - continuing operations
- - - (3,438) - - (3,438)
Net income/(loss) for the period - discontinued operations
- - - (829) - - (829)
Total comprehensive income/(loss) - - - (4,267) - - (4,267)
Employee share options charge - - 214 - - - 214
Settlement of Restricted Share Units - - 29 - - - 29
At 31 December 2020 (Unaudited) 459 349,446 122,465 (361,017) (37,647) (5,761) 67,945
Attributable to equity holders of the parent
For the quarter ended 31 March 2020 Amounts in USD 000
Issued capital
Share premium
Additional paid-in capital
Retained earnings
Other reserves
Currency translation
reserve Total
At 1 January 2020 - (Audited) 458 349,193 122,131 (355,683) (37,647) (5,761) 72,691
Net income/(loss) for the period - continuing operations
- - - 8,018 - - 8,018
Net income/(loss) for the period - discontinued operations
- - - (2,032) - - (2,032)
Total comprehensive income/(loss) - - - 5,986 - - 5,986
Employee share options charge/(benefit) - - 240 - - - 240
At 31 March 2020 - (Unaudited) 458 349,193 122,371 (349,697) (37,647) (5,761) 78,917

Page: 10
CONDENSED CONSOLIDATED STATEMENT OF CASHFLOWS
Q1 2021
Q4 2020
Q1 2020
Cash inflows / (outflows) (USD 000) (Unaudited) (Unaudited) (Unaudited)
Net (loss)/income for the period before tax 517 (2,329) 7,038
ADJUSTED FOR:
Depreciation 1,885 1,796 1,644
Increase/(decrease) in working capital (3,247) 14,580 3,286
Taxes (2,236) (1,883) (1,711)
Net finance costs and losses/(gains) on commodity hedges 2,588 2,325 (10,459)
Other non-cash items 265 243 333
Net cash (out)/inflow from operations (228) 14,732 131
CASH FLOW FROM INVESTING ACTIVITIES Cash outflow related to acquisition(s) (88,827) - -
Investment in exploration, production and other assets (736) (14,308) (4,930)
Net cash (out)/inflow from investing activities (89,526) 667 (4,466)
CASH FLOW FROM FINANCING ACTIVITIES Proceeds from loans and borrowings (net of upfront and arrangement costs) 53,325 - -
Repayment of non-recourse loan (269) - (1,408)
Repayment of Senior Secured loan (720) (720) (720)
Realised gain/(loss) on commodity hedges (282) 654 1,118
Borrowing costs, including bank charges (224) (238) (352)
Gross proceeds from Equity Private Placement and Subsequent offering 80,115 - -
Cost of Equity Private Placement and Treasury shares issued (3,043) - -
Lease liability payments (61) (61) (63)
Net cash (out)/inflow from financing activities 128,841 (365) (1,425)
Change in cash and cash equivalents during the period 39,050 59 (6,224)
Change in cash and cash equivalents - assets held for sale (4) (4) 3
Cash and cash equivalents at the beginning of the period 5,674 5,619 20,493
Cash and cash equivalents at the end of the period 44,720 5,674 14,272

Page: 11
SEGMENT INFORMATION
Q1 2021
Q4 2020
Q1 2020
(Unaudited) (Unaudited) (Unaudited)
OPERATING SEGMENTS - GROUP NET SALES
Net average daily production - TPS assets (bopd) 1,336 1,349 1,178
Net average daily production - Dussafu (bopd) 1,020 1,008 864
Total Group Net average daily production (bopd) 2,356 2,357 2,042
Oil sales (bbls) - Net to Panoro - TPS assets, Tunisia 123,465 110,247 27,385
Oil sales (bbls) - Net to Panoro - Dussafu, Gabon 56,103 112,148 43,636
Total Group Net Sales (bbls) - continuing operations 179,568 222,395 71,021
Discontinued operations
Net average daily production - Aje (bopd) 169 177 264
Oil sales (bbls) - Net to Panoro - Aje, Nigeria - 23,666 63,049
OPERATING SEGMENT - WEST AFRICA - GABON
in USD 000
EBITDA 2,872 2,809 960
Impairment of E&E Assets - Charge/(Reversal) - - -
Depreciation and amortisation 593 644 610
Segment assets 66,532 50,513 48,210
OPERATING SEGMENT - WEST AFRICA - EQUATORIAL GUINEA
in USD 000
EBITDA (3) - -
Impairment of E&E Assets - Charge/(Reversal) - - -
Depreciation and amortisation - - -
Segment assets 333,209 - -
OPERATING SEGMENT - NORTH AFRICA - TUNISIA
in USD 000
EBITDA 4,571 1,738 851
Depreciation and amortisation 1,238 1,228 988
Segment assets 73,147 75,031 77,837
CORPORATE
in USD 000
EBITDA (2,092) (1,563) (1,501)
Depreciation and amortisation 54 (76) 46
Segment assets 29,362 3,418 10,234
Page: 12
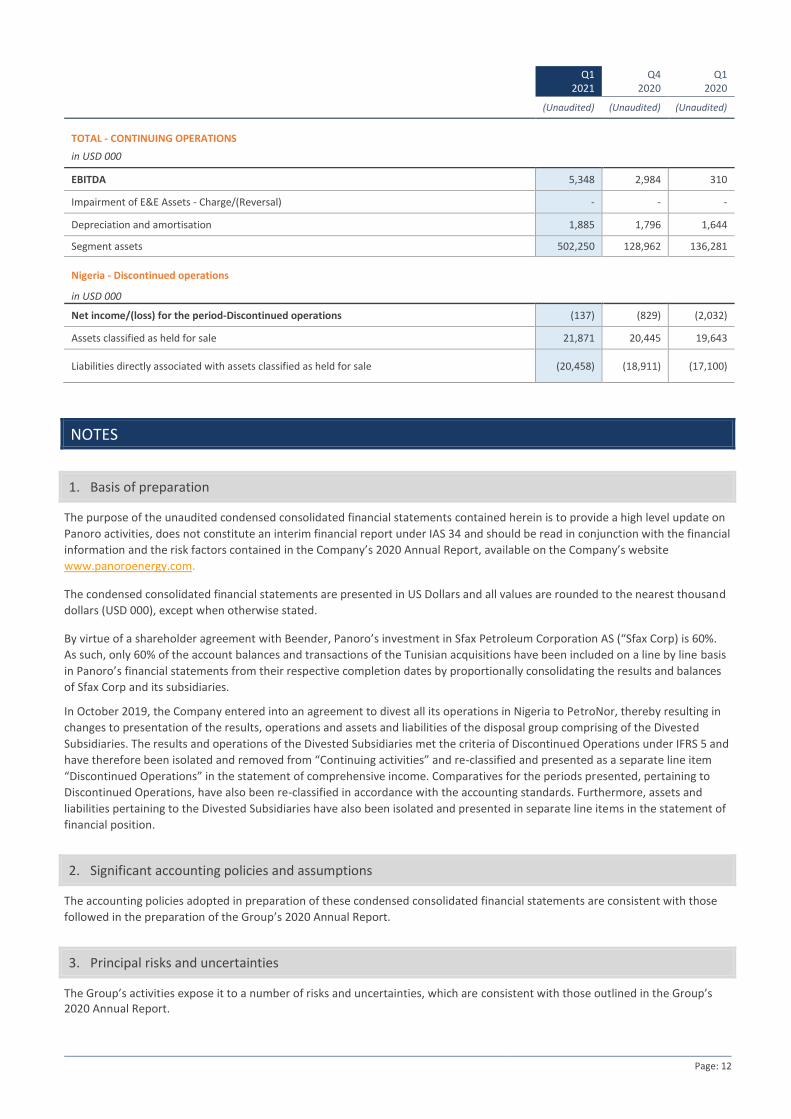
Q1 2021
Q4 2020
Q1 2020
(Unaudited) (Unaudited) (Unaudited)
TOTAL - CONTINUING OPERATIONS
in USD 000
EBITDA 5,348 2,984 310
Impairment of E&E Assets - Charge/(Reversal) - - -
Depreciation and amortisation 1,885 1,796 1,644
Segment assets 502,250 128,962 136,281
Nigeria - Discontinued operations
in USD 000
Net income/(loss) for the period-Discontinued operations (137) (829) (2,032)
Assets classified as held for sale 21,871 20,445 19,643
Liabilities directly associated with assets classified as held for sale (20,458) (18,911) (17,100)
NOTES
1. Basis of preparation
The purpose of the unaudited condensed consolidated financial statements contained herein is to provide a high level update on
Panoro activities, does not constitute an interim financial report under IAS 34 and should be read in conjunction with the financial
information and the risk factors contained in the Company’s 2020 Annual Report, available on the Company’s website
www.panoroenergy.com.
The condensed consolidated financial statements are presented in US Dollars and all values are rounded to the nearest thousand
dollars (USD 000), except when otherwise stated.
By virtue of a shareholder agreement with Beender, Panoro’s investment in Sfax Petroleum Corporation AS (“Sfax Corp) is 60%.
As such, only 60% of the account balances and transactions of the Tunisian acquisitions have been included on a line by line basis
in Panoro’s financial statements from their respective completion dates by proportionally consolidating the results and balances
of Sfax Corp and its subsidiaries.
In October 2019, the Company entered into an agreement to divest all its operations in Nigeria to PetroNor, thereby resulting in
changes to presentation of the results, operations and assets and liabilities of the disposal group comprising of the Divested
Subsidiaries. The results and operations of the Divested Subsidiaries met the criteria of Discontinued Operations under IFRS 5 and
have therefore been isolated and removed from “Continuing activities” and re-classified and presented as a separate line item
“Discontinued Operations” in the statement of comprehensive income. Comparatives for the periods presented, pertaining to
Discontinued Operations, have also been re-classified in accordance with the accounting standards. Furthermore, assets and
liabilities pertaining to the Divested Subsidiaries have also been isolated and presented in separate line items in the statement of
financial position.
2. Significant accounting policies and assumptions
The accounting policies adopted in preparation of these condensed consolidated financial statements are consistent with those
followed in the preparation of the Group’s 2020 Annual Report.
3. Principal risks and uncertainties
The Group’s activities expose it to a number of risks and uncertainties, which are consistent with those outlined in the Group’s 2020 Annual Report.

Page: 13
4. Business Combination and Asset Acquisition Transactions
4.1 EG Transaction
On 31 March 2021, Panoro completed the acquisition of 100% of the shares of PEGL from Tullow Overseas Holdings B.V. (“EG
Seller”), a fully owned subsidiary of Tullow Oil plc, for an initial cash consideration of USD 88.8 million that includes the customary
completion adjustments. Following the completion of the transaction the name of the company has been changed to Panoro
Equatorial Guinea Limited. PEGL holds a 14.25% non-operated WI in Block G that contains the Ceiba and Okume Complex assets,
offshore Equatorial Guinea (the “EG Assets”). The EG Assets comprise six producing oil fields in water depths of 50-850 metres,
approximately 35 kilometres from shore. The EG Assets hold net WI 2P reserves of 14.2 MMbbl and net WI 2C resources of 25.6
MMbbl as of 30 June 2020. Current net production is approximately 4,500 bopd, with a potential to grow - close to 8,000 bopd
net in 2023-25 driven by facility upgrades, well workovers, perforation of behind pipe zones and infill drilling.
In addition to the initial cash consideration of USD 88.8 million, as per the terms of the acquisition agreement, EG Seller will also
be entitled to a USD 5 million deferred consideration payable within 2 business days of completion of the Dussafu Transaction (as
explained below), which is expected to complete in Q2 2021. EG Seller is also entitled to a potential contingent consideration of
up USD 16 million, in aggregate, payable only in years where the average annual net production of the acquired interests is in
excess of 5,500 bopd. Once this initial net production threshold has been reached, in that year, and for the four consecutive
subsequent annual periods, annual contingent consideration of USD 5.5 million will be payable to EG Seller provided that the
production threshold is met in such annual period and the average daily Dated Brent oil prices in respect of the annual period is in
excess of USD 60/bbl, subject to the aforementioned cap of USD 16 million.
The purchase consideration, as set out above, is summarised in the following table:
Amounts in USD 000 Shares acquired
Cost of Business Combination
Purchase price paid on completion 100% 88,827
Deferred consideration(1) 5,000
Contingent consideration(2) 5,019
Total consideration 98,846
Carrying value of net assets acquired (35,240)
Excess value to be allocated 134,086
1. Deferred consideration remains unpaid at completion date but represents a high probability of the completion of the Dussafu Transaction.
2. Fair value estimate of the contingent consideration, payable only upon meeting the aforementioned criteria. This amount will be reviewed in conjunction with the criteria on an ongoing basis.

Page: 14
The preliminary fair values of the identifiable assets and liabilities of PEGL and the Purchase Price Allocation (“PPA”) at the date of
acquisition were as follows:
Amounts in USD 000
Balance sheet pre PPA
Adjustment 1 Adjustment 2 Balance sheet
post PPA
ASSETS
Concessions - 132,806 - 132,806
Goodwill acquired - 1,280 - 1,280
Goodwill related to step up / deferred tax - - 46,482 46,482
Intangible fixed assets - 134,086 46,482 180,568
Production assets and equipment 76,367 - - 76,367
Materials inventory 9,990 - - 9,990
Crude oil inventory 6,904 - - 6,904
Trade receivables 59,135 - - 59,135
Other current receivables 245 - - 245
Total assets 152,641 134,086 46,482 333,209
LIABILITIES
Decommissioning liability 124,646 - - 124,646
Deferred tax liability 12,298 - 46,482 58,780
Corporation tax liability 14,014 - - 14,014
Crude oil overlift 31,174 - - 31,174
Trade payables 5,749 - - 5,749
Total liabilities 187,881 - 46,482 234,363
Net assets (liabilities) acquired (35,240) 134,086 - 98,846
For the first quarter of 2021, the operating cashflow of PEGL was USD 10 million before taxes of USD 0.8 million and primarily
relates to payments of operating costs. I addition USD 3.4 million of cash was spent on investing activities in relation to capital
expenditure. All these items are already included in the final completion payment of USD 88.8 million.
4.2 Dussafu Transaction
On 9 February 2021, Panoro and its fully owned subsidiary Pan Petroleum Gabon BV, entered into an agreement with Tullow Oil
plc and Tullow Oil Gabon SA to acquire a 10% WI in the Dussafu Marin Permit, offshore Gabon for an initial cash consideration of
USD 46 million based on an effective date of 1 July 2020 which is subject to customary working capital and other customary
adjustments to be made at completion. Panoro currently holds 7.4997% WI in Dussafu and upon completion of the Dussafu
Acquisition, the Company will increase its WI to 17.4997%. Following completion of the Dussafu Acquisition, which is expected in
Q2 2021, Panoro’s net WI 2P reserves at Dussafu will be approximately 19 MMbbls, and net WI production from the field is
expected to increase from 1,200 bopd to approximately 2,800 bopd. The consideration for the Dussafu Acquisition consists of an
initial cash consideration of USD 46 million (to be adjusted at completion for working capital and other customary adjustments)
and a contingent consideration of up to USD 24 million (the “Dussafu Contingent Consideration”) which may be payable once
commercial production commences on Hibiscus and Ruche and achieves daily production equal to or greater than 33,000 bopd
gross over any 60-day continuous period. Once this milestone has been met, annual contingent consideration will apply to that
year and to each of the subsequent four years where the average daily Dated Brent oil price is in excess of USD 55 per barrel,
subject to the USD 24 million cap. Where the oil price threshold has been met, the Dussafu Contingent Consideration payable for
that year will be based on 15% of net free cashflow after all taxes, operating and capital costs from the acquired 10% WI. The
contingent payment will be capped for any year at USD 5 million.
Page: 15
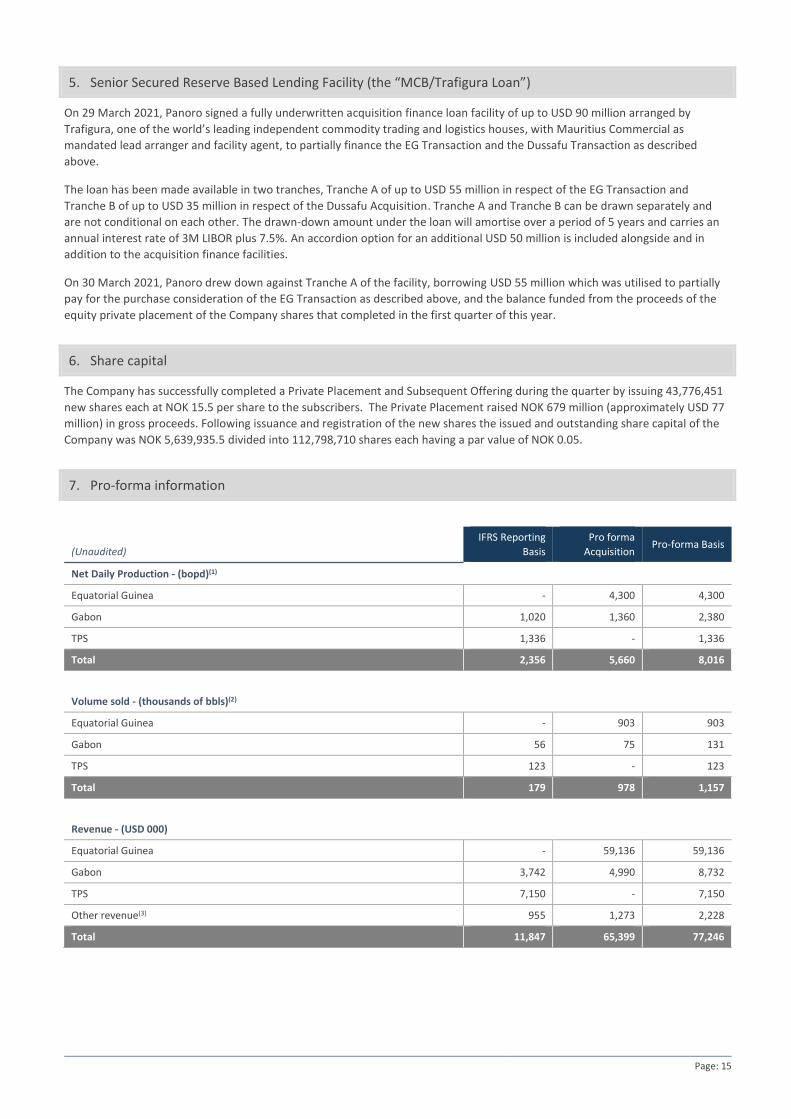
5. Senior Secured Reserve Based Lending Facility (the “MCB/Trafigura Loan”)
On 29 March 2021, Panoro signed a fully underwritten acquisition finance loan facility of up to USD 90 million arranged by
Trafigura, one of the world’s leading independent commodity trading and logistics houses, with Mauritius Commercial as
mandated lead arranger and facility agent, to partially finance the EG Transaction and the Dussafu Transaction as described
above.
The loan has been made available in two tranches, Tranche A of up to USD 55 million in respect of the EG Transaction and
Tranche B of up to USD 35 million in respect of the Dussafu Acquisition. Tranche A and Tranche B can be drawn separately and
are not conditional on each other. The drawn-down amount under the loan will amortise over a period of 5 years and carries an
annual interest rate of 3M LIBOR plus 7.5%. An accordion option for an additional USD 50 million is included alongside and in
addition to the acquisition finance facilities.
On 30 March 2021, Panoro drew down against Tranche A of the facility, borrowing USD 55 million which was utilised to partially
pay for the purchase consideration of the EG Transaction as described above, and the balance funded from the proceeds of the
equity private placement of the Company shares that completed in the first quarter of this year.
6. Share capital
The Company has successfully completed a Private Placement and Subsequent Offering during the quarter by issuing 43,776,451
new shares each at NOK 15.5 per share to the subscribers. The Private Placement raised NOK 679 million (approximately USD 77
million) in gross proceeds. Following issuance and registration of the new shares the issued and outstanding share capital of the
Company was NOK 5,639,935.5 divided into 112,798,710 shares each having a par value of NOK 0.05.
7. Pro-forma information
(Unaudited)
IFRS Reporting
Basis
Pro forma
Acquisition Pro-forma Basis
Net Daily Production - (bopd)(1)
Equatorial Guinea - 4,300 4,300
Gabon 1,020 1,360 2,380
TPS 1,336 - 1,336
Total 2,356 5,660 8,016
Volume sold - (thousands of bbls)(2)
Equatorial Guinea - 903 903
Gabon 56 75 131
TPS 123 - 123
Total 179 978 1,157
Revenue - (USD 000)
Equatorial Guinea - 59,136 59,136
Gabon 3,742 4,990 8,732
TPS 7,150 - 7,150
Other revenue(3) 955 1,273 2,228
Total 11,847 65,399 77,246
Page: 16
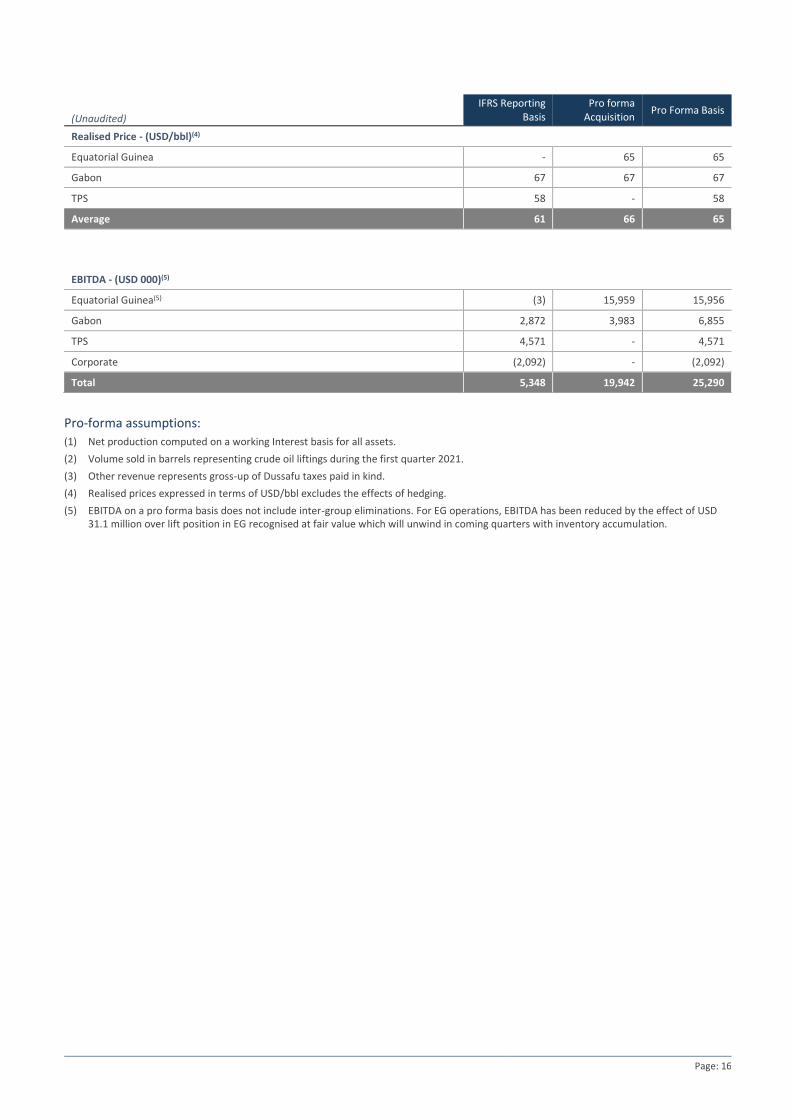
(Unaudited)
IFRS Reporting Basis
Pro forma Acquisition
Pro Forma Basis
Realised Price - (USD/bbl)(4)
Equatorial Guinea - 65 65
Gabon 67 67 67
TPS 58 - 58
Average 61 66 65
EBITDA - (USD 000)(5)
Equatorial Guinea(5) (3) 15,959 15,956
Gabon 2,872 3,983 6,855
TPS 4,571 - 4,571
Corporate (2,092) - (2,092)
Total 5,348 19,942 25,290
Pro-forma assumptions:
(1) Net production computed on a working Interest basis for all assets.
(2) Volume sold in barrels representing crude oil liftings during the first quarter 2021.
(3) Other revenue represents gross-up of Dussafu taxes paid in kind.
(4) Realised prices expressed in terms of USD/bbl excludes the effects of hedging.
(5) EBITDA on a pro forma basis does not include inter-group eliminations. For EG operations, EBITDA has been reduced by the effect of USD 31.1 million over lift position in EG recognised at fair value which will unwind in coming quarters with inventory accumulation.
Page: 17
OTHER INFORMATION
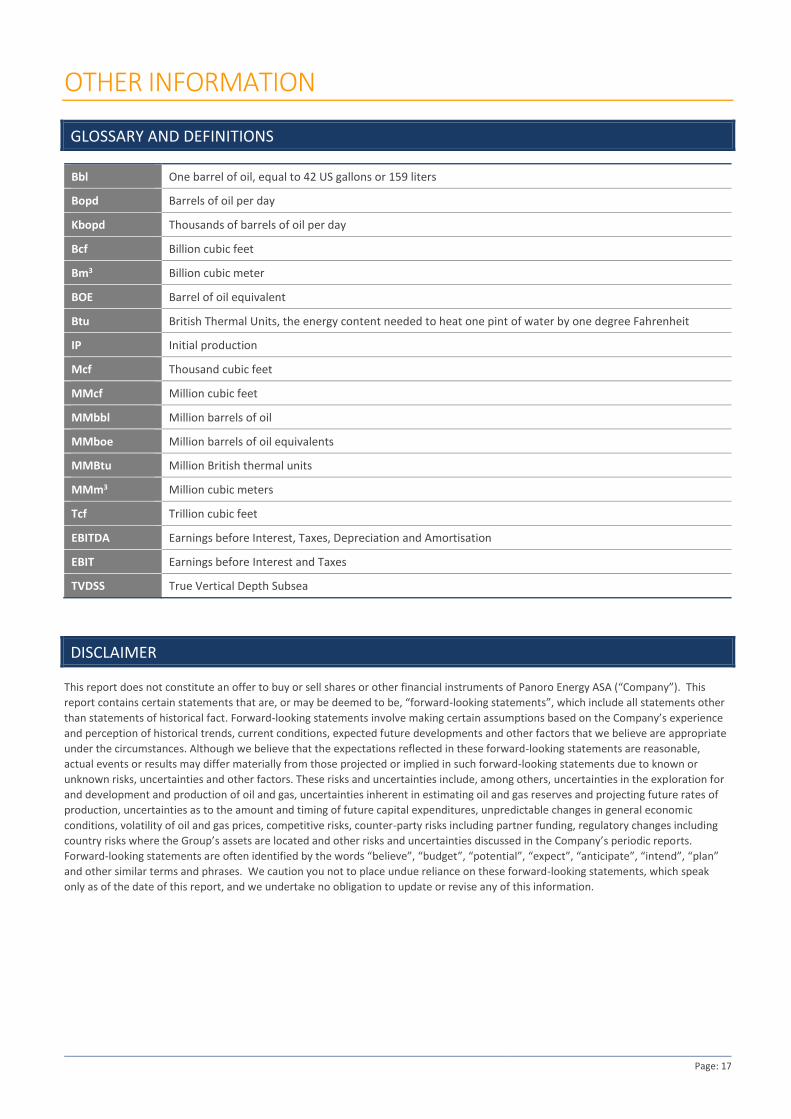
GLOSSARY AND DEFINITIONS
Bbl One barrel of oil, equal to 42 US gallons or 159 liters
Bopd Barrels of oil per day
Kbopd Thousands of barrels of oil per day
Bcf Billion cubic feet
Bm3 Billion cubic meter
BOE Barrel of oil equivalent
Btu British Thermal Units, the energy content needed to heat one pint of water by one degree Fahrenheit
IP Initial production
Mcf Thousand cubic feet
MMcf Million cubic feet
MMbbl Million barrels of oil
MMboe Million barrels of oil equivalents
MMBtu Million British thermal units
MMm3 Million cubic meters
Tcf Trillion cubic feet
EBITDA Earnings before Interest, Taxes, Depreciation and Amortisation
EBIT Earnings before Interest and Taxes
TVDSS True Vertical Depth Subsea
DISCLAIMER
This report does not constitute an offer to buy or sell shares or other financial instruments of Panoro Energy ASA (“Company”). This
report contains certain statements that are, or may be deemed to be, “forward-looking statements”, which include all statements other
than statements of historical fact. Forward-looking statements involve making certain assumptions based on the Company’s experience
and perception of historical trends, current conditions, expected future developments and other factors that we believe are appropriate
under the circumstances. Although we believe that the expectations reflected in these forward-looking statements are reasonable,
actual events or results may differ materially from those projected or implied in such forward-looking statements due to known or
unknown risks, uncertainties and other factors. These risks and uncertainties include, among others, uncertainties in the exploration for
and development and production of oil and gas, uncertainties inherent in estimating oil and gas reserves and projecting future rates of
production, uncertainties as to the amount and timing of future capital expenditures, unpredictable changes in general economic
conditions, volatility of oil and gas prices, competitive risks, counter-party risks including partner funding, regulatory changes including
country risks where the Group’s assets are located and other risks and uncertainties discussed in the Company’s periodic reports.
Forward-looking statements are often identified by the words “believe”, “budget”, “potential”, “expect”, “anticipate”, “intend”, “plan”
and other similar terms and phrases. We caution you not to place undue reliance on these forward-looking statements, which speak
only as of the date of this report, and we undertake no obligation to update or revise any of this information.

Page: 18
Contact information For further information, please contact:
John Hamilton, Chief Executive Officer Panoro Energy ASA/ Panoro Energy Limited [email protected] Tel: +44 20 3405 1060
Qazi Qadeer, Chief Financial Officer Panoro Energy ASA/ Panoro Energy Limited [email protected] Tel: +44 20 3405 1060
www.panoroenergy.com


![[ 'Pearson 2017 Q1 Trading Update' ]](https://img.pdfslide.net/doc/110x75/6169ec4111a7b741a34cdcbc/-pearson-2017-q1-trading-update-.jpg)