Embed Size (px)
DESCRIPTION
trading support resistance & trend lines
Citation preview
Trading Major Lines Hello everyone.I have been meaning to open up a new thread for a while. Although Its not the best time for me as I’m still busy with my day job, forex and helping my wife with her newly established company, I’ve decided to at least lauch this thread as a respond to the p.m’s I’ve been getting lately from some members of forex factory and improve it slowly by the time.-------------------------------------------------------------As some of you already know I was posting in Graeme’s great thread called “building euqity millipede” and I humbly but strongly advice traders to check out his thread as well as silent service method and james16 since i found them very helpful and informative ones.-------------------------------------------------------------I will try to keep things very simple.Actually if they are not simple then its not tradeable.period.K.I.S.S is probably one thing you’ve heard most in Forex but I don’t think you heard a lot about “how to K.I.S.S”-------------------------------------------------------------Some things you won’t see on my charts are:indicators,moving averages,channels,unclear s/r levels,repainting,illusion,delusion ,teaching a life lesson through chartswhat you will see are:1.major lines along with their median lines2.Fibonacci3.Price action interpretation.There is a lot of theory behind what i choose to use and what i not to choose..But I won’t go into details of this since I expect that to be revealed later on by the nature of my charts..And one last thing before we move on is that I don’t trade for money but to be in that %5 of the traders that considered to be “succesful”.So everything I share here is free and will stay free.But only thing I expect in return is respect to what I'm trying to do here.So If you didn't like what you'd seen here then please find somewhere else that suits you more.I'm just doing it for sharing.Thank you all..---------------------------------------------I'll go straight to the charts but It will take me some time to figure out to put them all together..I'll be posting one by one as I complete...I'll be back with the charts.
p.s:Please be aware that any questions you are thinking to ask such as "how long you been trading this,whats your r/r is,whats the gain.....etc" won't help you to implement this approach into your trading style..This has to be your own job to collect your own data..My data or past performance has got nothing to do with yours in the future.Keep in mind thatYOUR MONEY VALUABLE AND CANNOT BE SPENT FOR NOTHING.If you spending your money in "no man's land" that means you are wasting it.
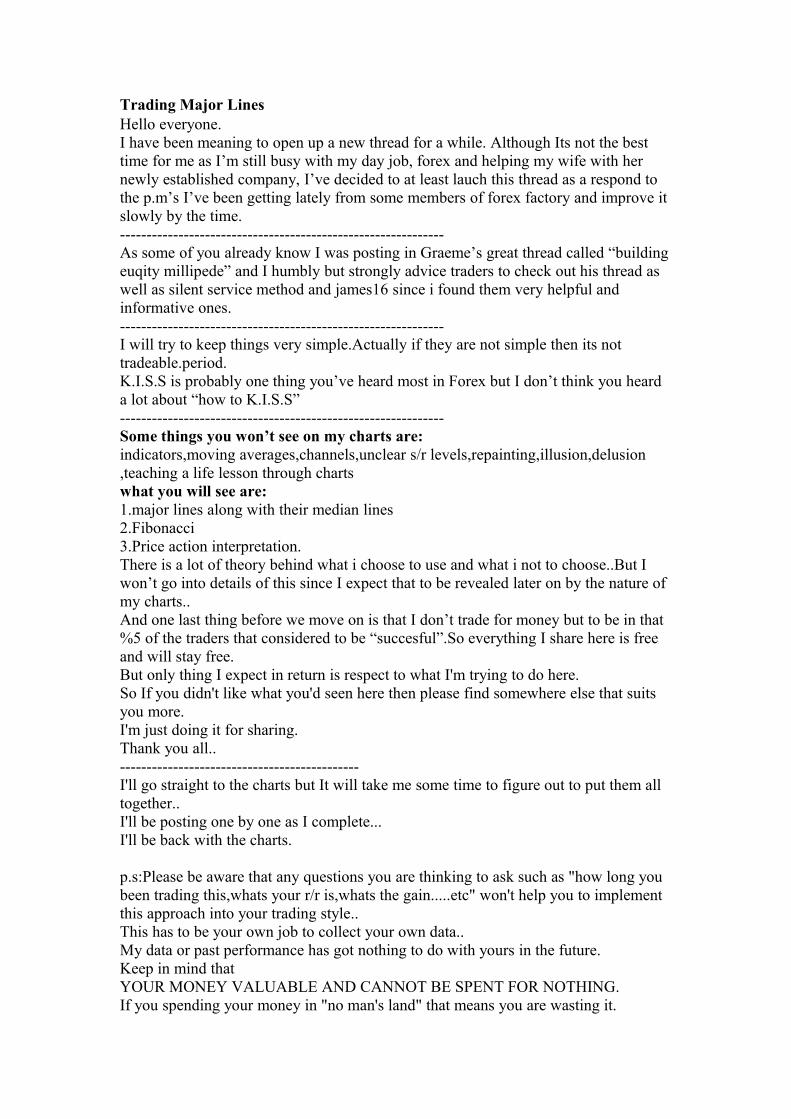
wait and risk it for something big...This chart is not empty.Attached Thumbnails
I'll focus on eurusd only for my charts but when I'm done with my explanation we can discuss more about other pairs as well...These charts illustrate my interested zones for different purposes.Attached Thumbnails
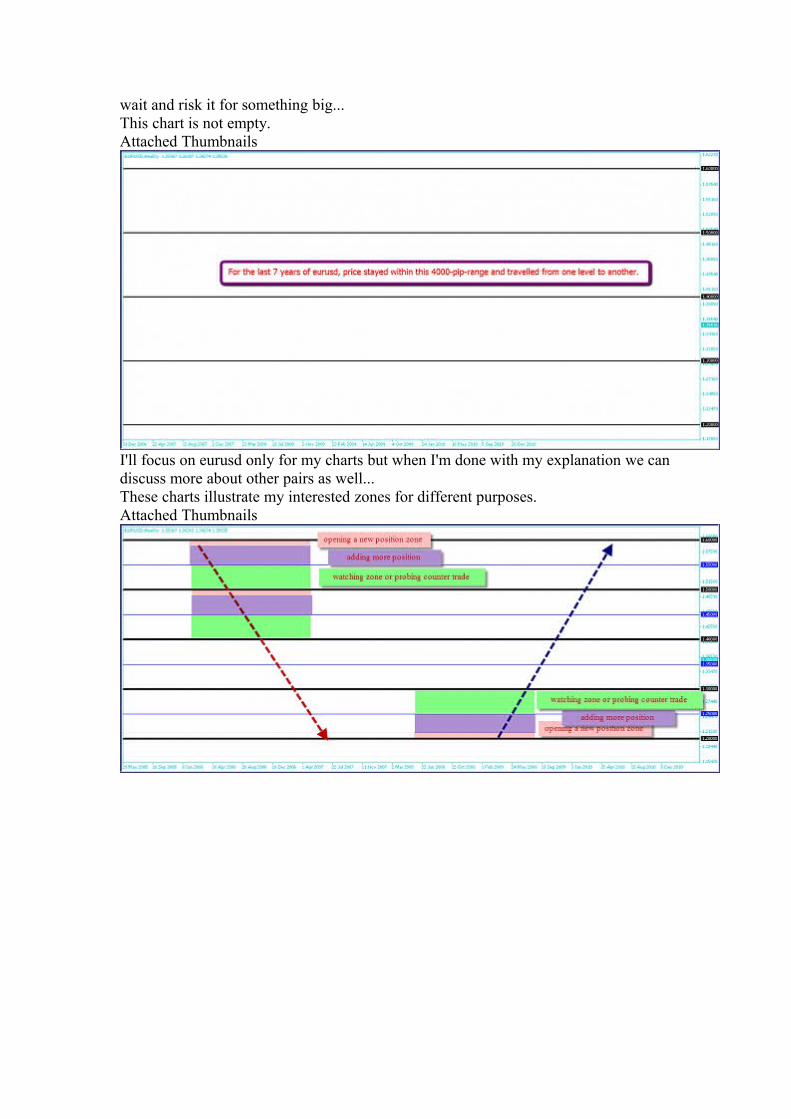
What I'm doing is focusing on 1.major lines to open a new position
2.and median lines to add more position..Focusing on the major lines more.
Its very easy to see what's happening there..First example will be up soon.Time-frames I prefer are
Weekly for price interpretation and hindsight(forget about the trend its all about price action)
4hr is secondary price action
5min is entry
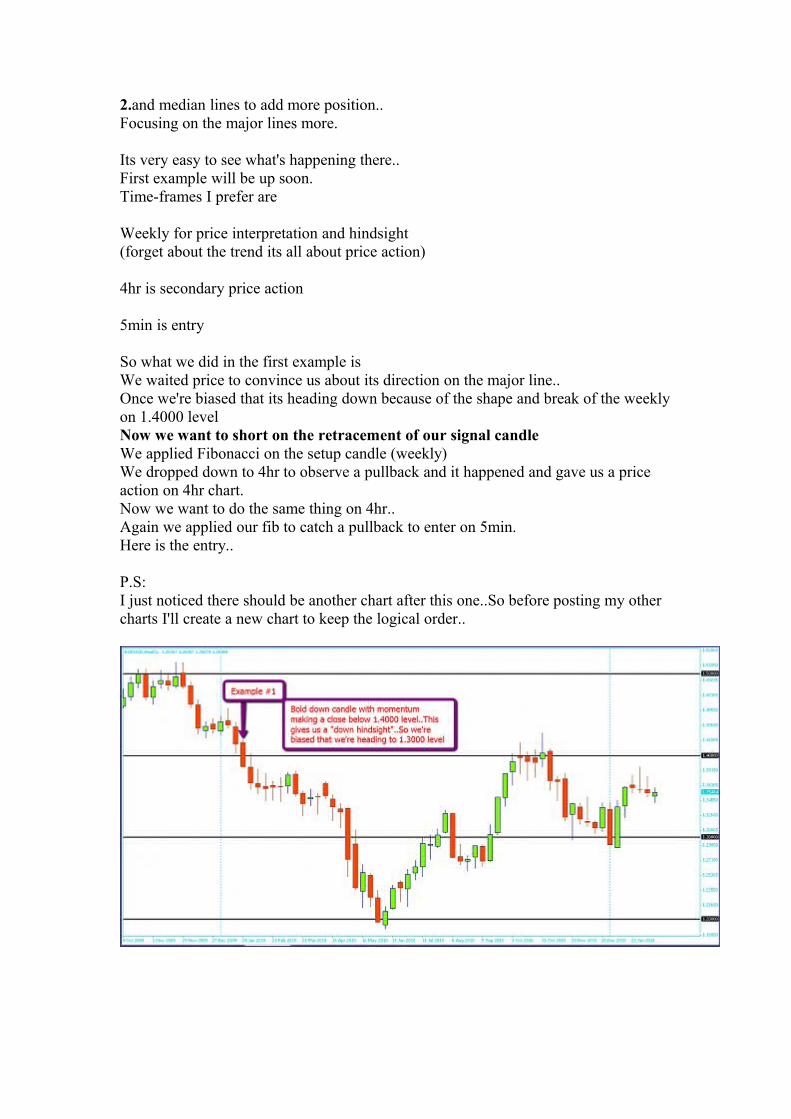
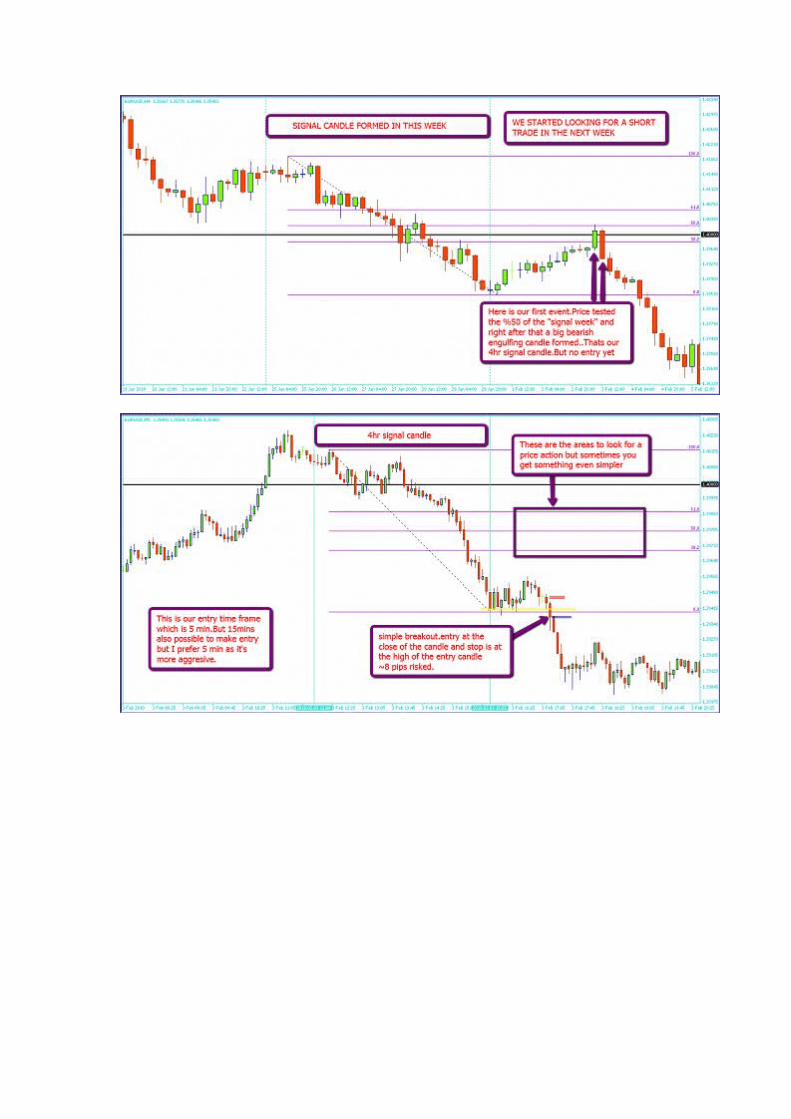
So what we did in the first example isWe waited price to convince us about its direction on the major line..Once we're biased that its heading down because of the shape and break of the weekly on 1.4000 levelNow we want to short on the retracement of our signal candleWe applied Fibonacci on the setup candle (weekly)We dropped down to 4hr to observe a pullback and it happened and gave us a price action on 4hr chart.Now we want to do the same thing on 4hr..Again we applied our fib to catch a pullback to enter on 5min. Here is the entry..
P.S:I just noticed there should be another chart after this one..So before posting my other charts I'll create a new chart to keep the logical order..
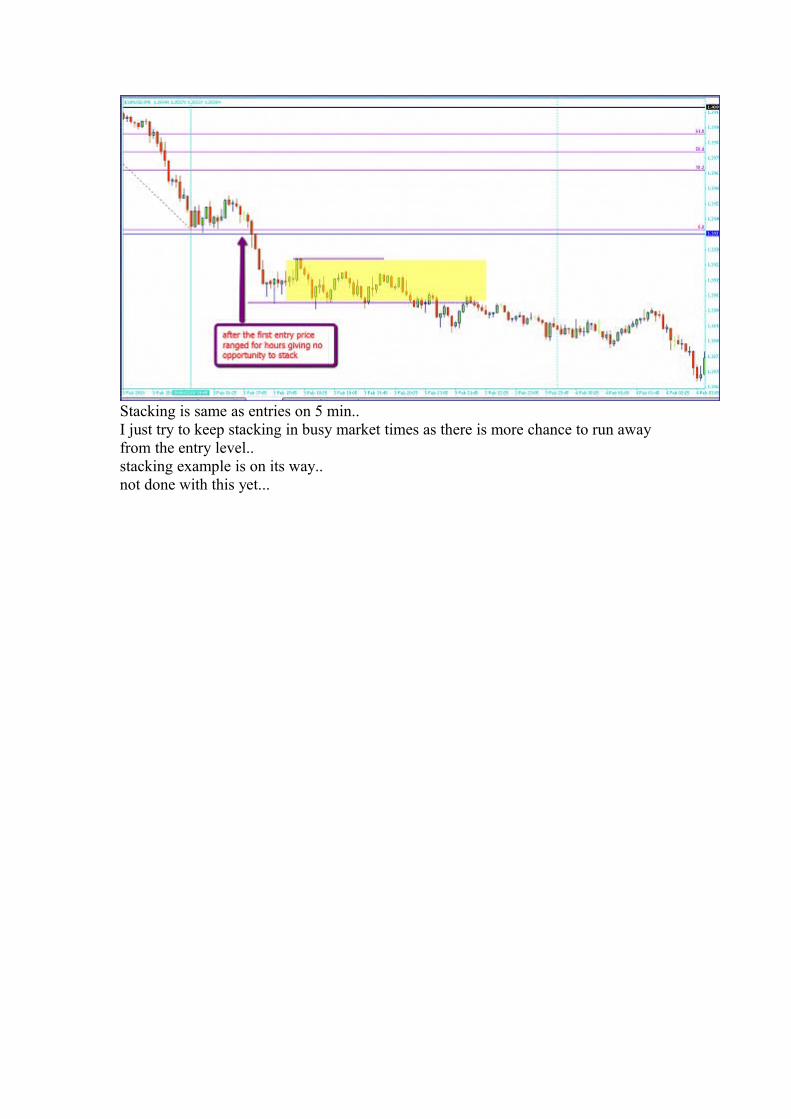
Stacking is same as entries on 5 min..I just try to keep stacking in busy market times as there is more chance to run away from the entry level..stacking example is on its way..not done with this yet...
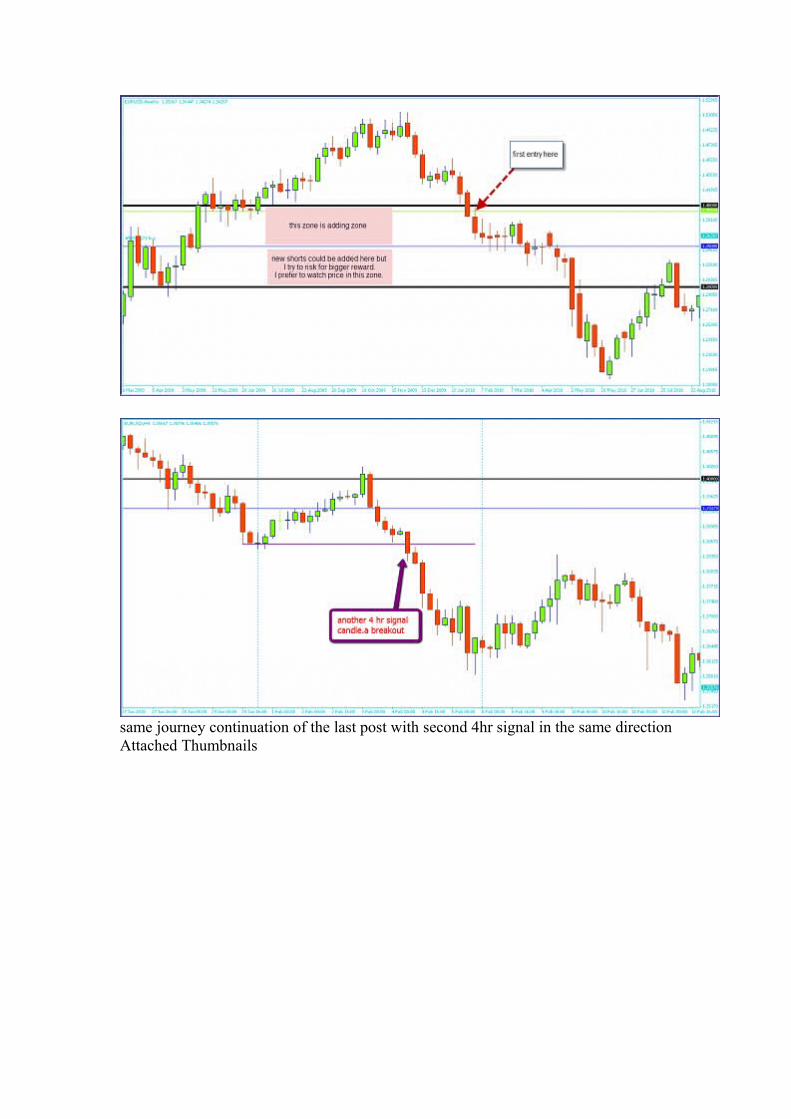
same journey continuation of the last post with second 4hr signal in the same directionAttached Thumbnails
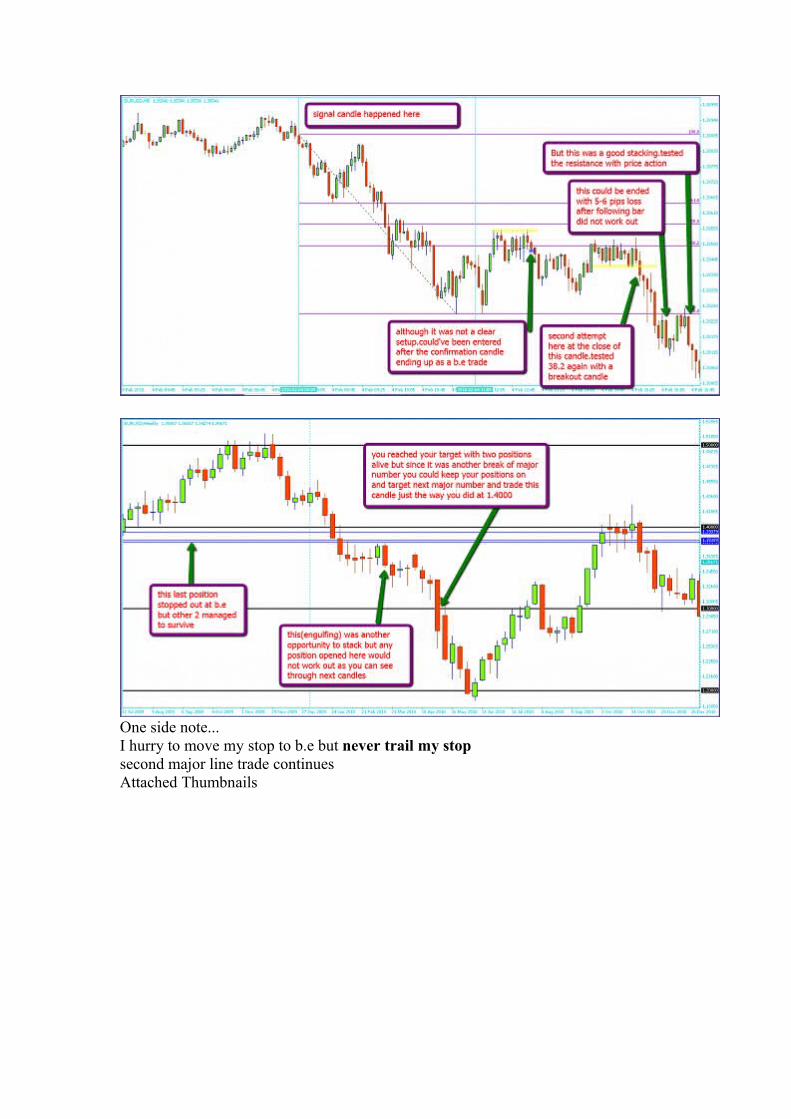
One side note...I hurry to move my stop to b.e but never trail my stopsecond major line trade continuesAttached Thumbnails
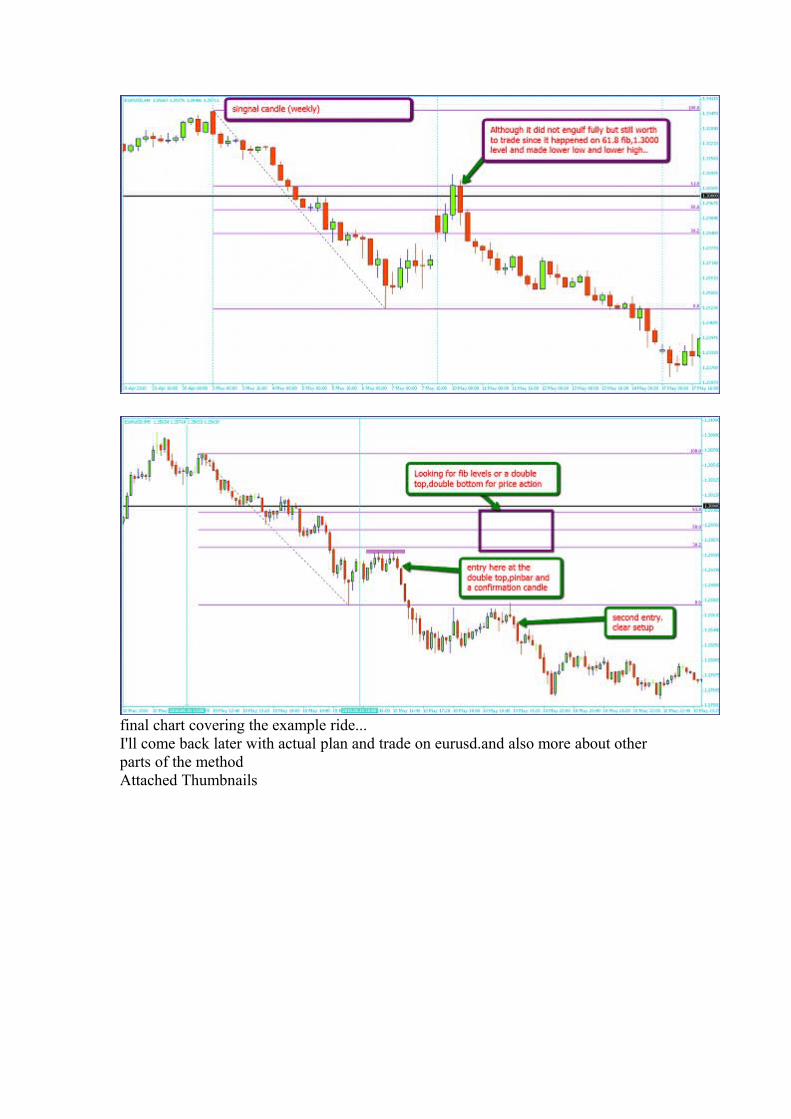
final chart covering the example ride...I'll come back later with actual plan and trade on eurusd.and also more about other parts of the methodAttached Thumbnails
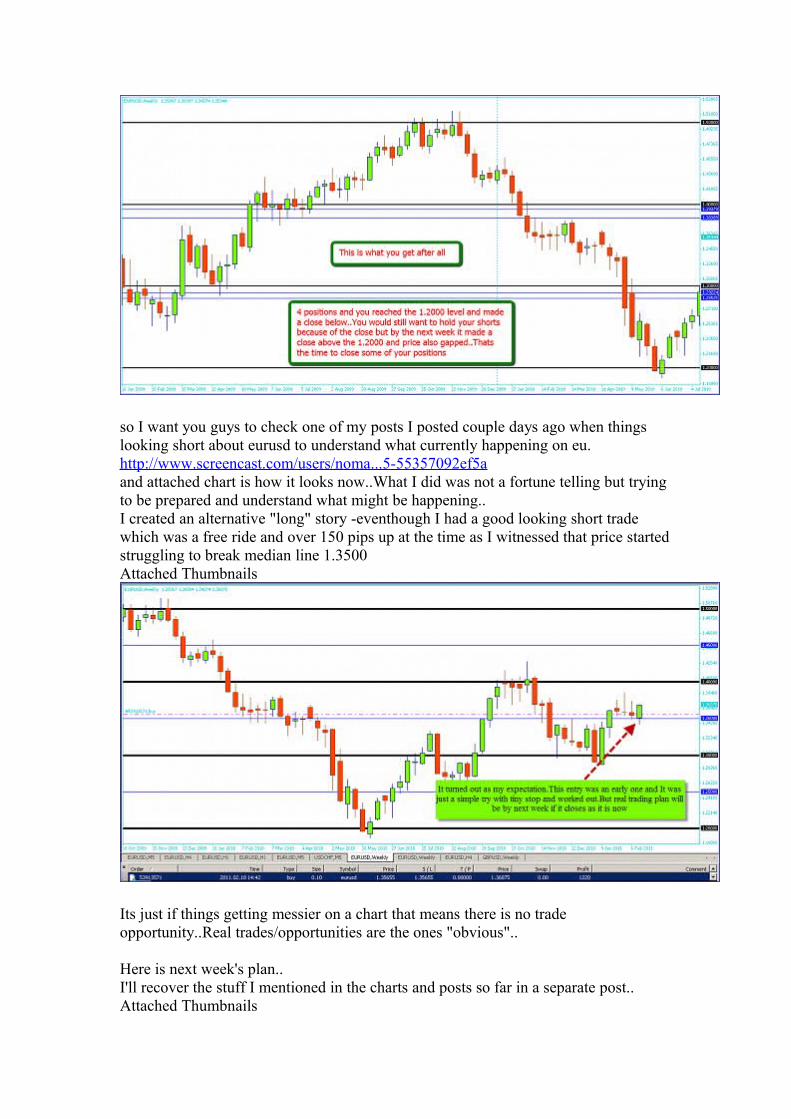
so I want you guys to check one of my posts I posted couple days ago when things looking short about eurusd to understand what currently happening on eu.http://www.screencast.com/users/noma...5-55357092ef5aand attached chart is how it looks now..What I did was not a fortune telling but trying to be prepared and understand what might be happening..I created an alternative "long" story -eventhough I had a good looking short trade which was a free ride and over 150 pips up at the time as I witnessed that price started struggling to break median line 1.3500Attached Thumbnails
Its just if things getting messier on a chart that means there is no trade opportunity..Real trades/opportunities are the ones "obvious"..
Here is next week's plan..I'll recover the stuff I mentioned in the charts and posts so far in a separate post..Attached Thumbnails
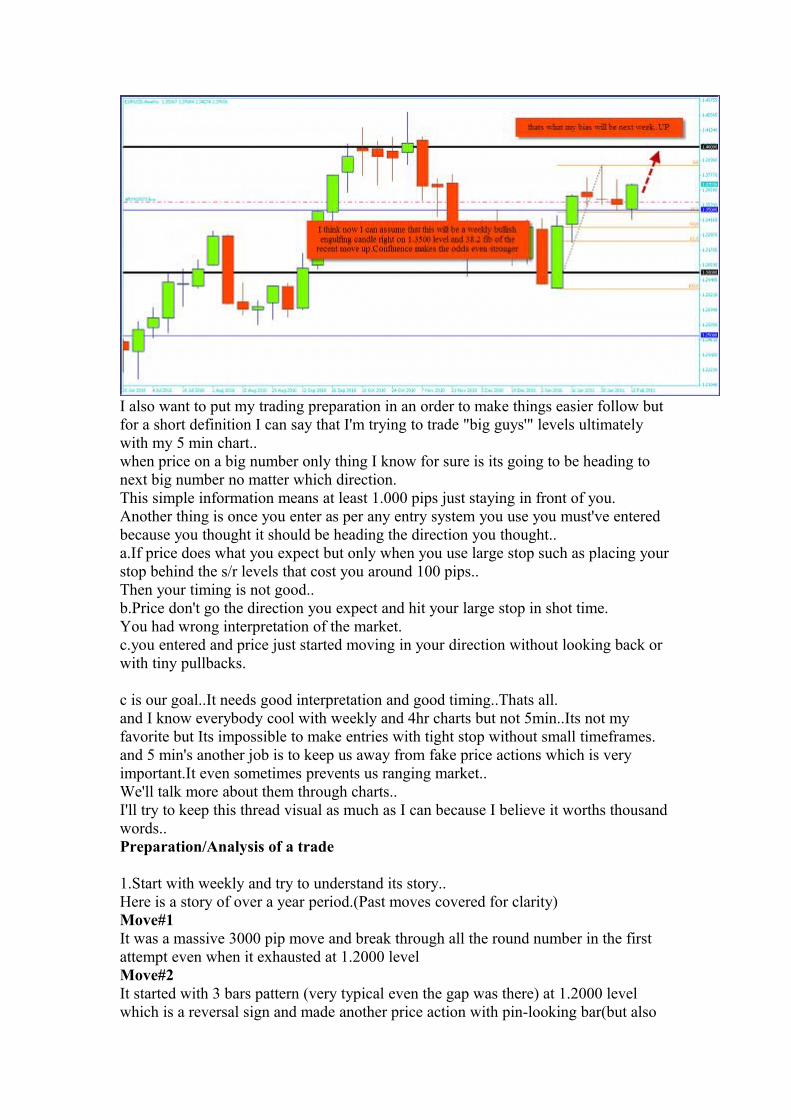
I also want to put my trading preparation in an order to make things easier follow but for a short definition I can say that I'm trying to trade "big guys'" levels ultimately with my 5 min chart..when price on a big number only thing I know for sure is its going to be heading to next big number no matter which direction.This simple information means at least 1.000 pips just staying in front of you.Another thing is once you enter as per any entry system you use you must've entered because you thought it should be heading the direction you thought..a.If price does what you expect but only when you use large stop such as placing your stop behind the s/r levels that cost you around 100 pips..Then your timing is not good..b.Price don't go the direction you expect and hit your large stop in shot time.You had wrong interpretation of the market.c.you entered and price just started moving in your direction without looking back or with tiny pullbacks.
c is our goal..It needs good interpretation and good timing..Thats all.and I know everybody cool with weekly and 4hr charts but not 5min..Its not my favorite but Its impossible to make entries with tight stop without small timeframes.and 5 min's another job is to keep us away from fake price actions which is very important.It even sometimes prevents us ranging market..We'll talk more about them through charts..I'll try to keep this thread visual as much as I can because I believe it worths thousand words..Preparation/Analysis of a trade
1.Start with weekly and try to understand its story..Here is a story of over a year period.(Past moves covered for clarity)Move#1It was a massive 3000 pip move and break through all the round number in the first attempt even when it exhausted at 1.2000 levelMove#2It started with 3 bars pattern (very typical even the gap was there) at 1.2000 level which is a reversal sign and made another price action with pin-looking bar(but also
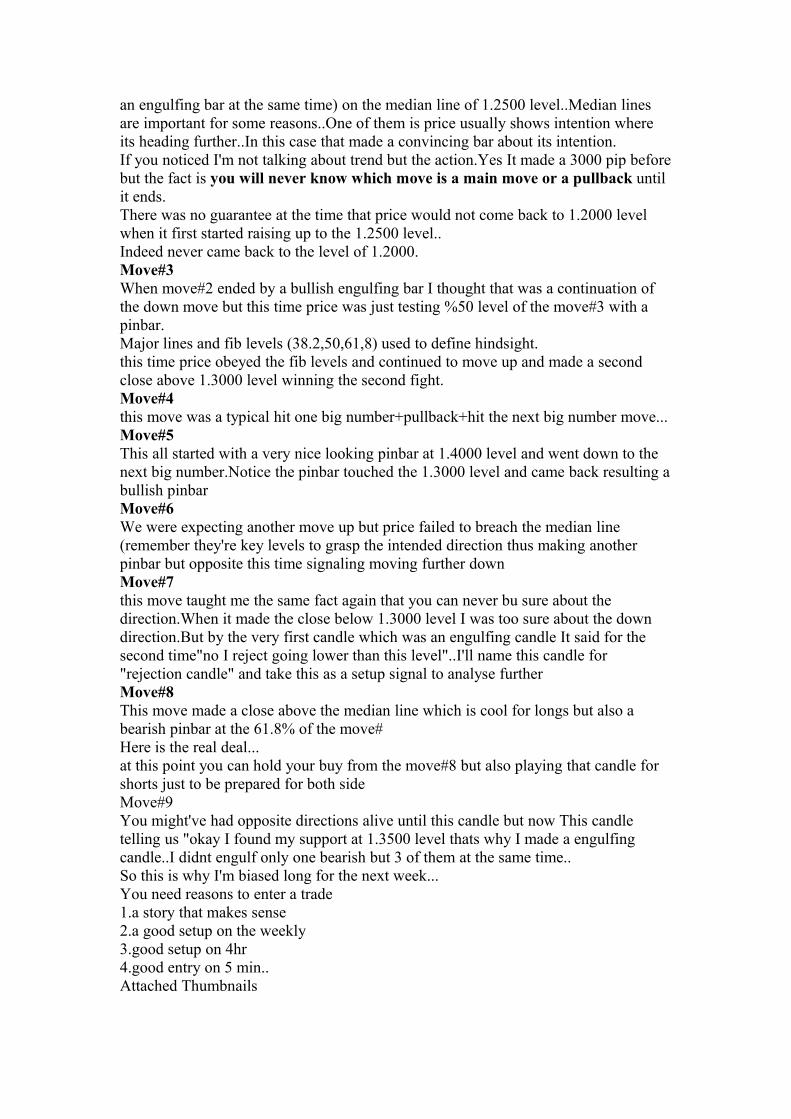
an engulfing bar at the same time) on the median line of 1.2500 level..Median lines are important for some reasons..One of them is price usually shows intention where its heading further..In this case that made a convincing bar about its intention.If you noticed I'm not talking about trend but the action.Yes It made a 3000 pip before but the fact is you will never know which move is a main move or a pullback until it ends.There was no guarantee at the time that price would not come back to 1.2000 level when it first started raising up to the 1.2500 level..Indeed never came back to the level of 1.2000.Move#3When move#2 ended by a bullish engulfing bar I thought that was a continuation of the down move but this time price was just testing %50 level of the move#3 with a pinbar.Major lines and fib levels (38.2,50,61,8) used to define hindsight.this time price obeyed the fib levels and continued to move up and made a second close above 1.3000 level winning the second fight.Move#4this move was a typical hit one big number+pullback+hit the next big number move...Move#5This all started with a very nice looking pinbar at 1.4000 level and went down to the next big number.Notice the pinbar touched the 1.3000 level and came back resulting a bullish pinbarMove#6We were expecting another move up but price failed to breach the median line (remember they're key levels to grasp the intended direction thus making another pinbar but opposite this time signaling moving further downMove#7this move taught me the same fact again that you can never bu sure about the direction.When it made the close below 1.3000 level I was too sure about the down direction.But by the very first candle which was an engulfing candle It said for the second time"no I reject going lower than this level"..I'll name this candle for "rejection candle" and take this as a setup signal to analyse furtherMove#8This move made a close above the median line which is cool for longs but also a bearish pinbar at the 61.8% of the move#Here is the real deal...at this point you can hold your buy from the move#8 but also playing that candle for shorts just to be prepared for both sideMove#9You might've had opposite directions alive until this candle but now This candle telling us "okay I found my support at 1.3500 level thats why I made a engulfing candle..I didnt engulf only one bearish but 3 of them at the same time..So this is why I'm biased long for the next week...You need reasons to enter a trade1.a story that makes sense2.a good setup on the weekly3.good setup on 4hr4.good entry on 5 min..Attached Thumbnails
This will get clearer by the time and charts I promise..One thing I can consider myself lucky is I was good at painting and math in school..art of trading is just painting and math...and as you already know every paint has a different story behind it..my favorite is Pieter Bruegel (I'm not a paint expert though)..Why is he?I found his works with lots of stories..when you look at his piece of works you feel watching a movie or reading a book..http://www.ibiblio.org/wm/paint/auth/bruegel/death.jpgHe's insane.. Sorry about that.I know I promised not to teach life lessons through charts but i think it doesn't count yet...
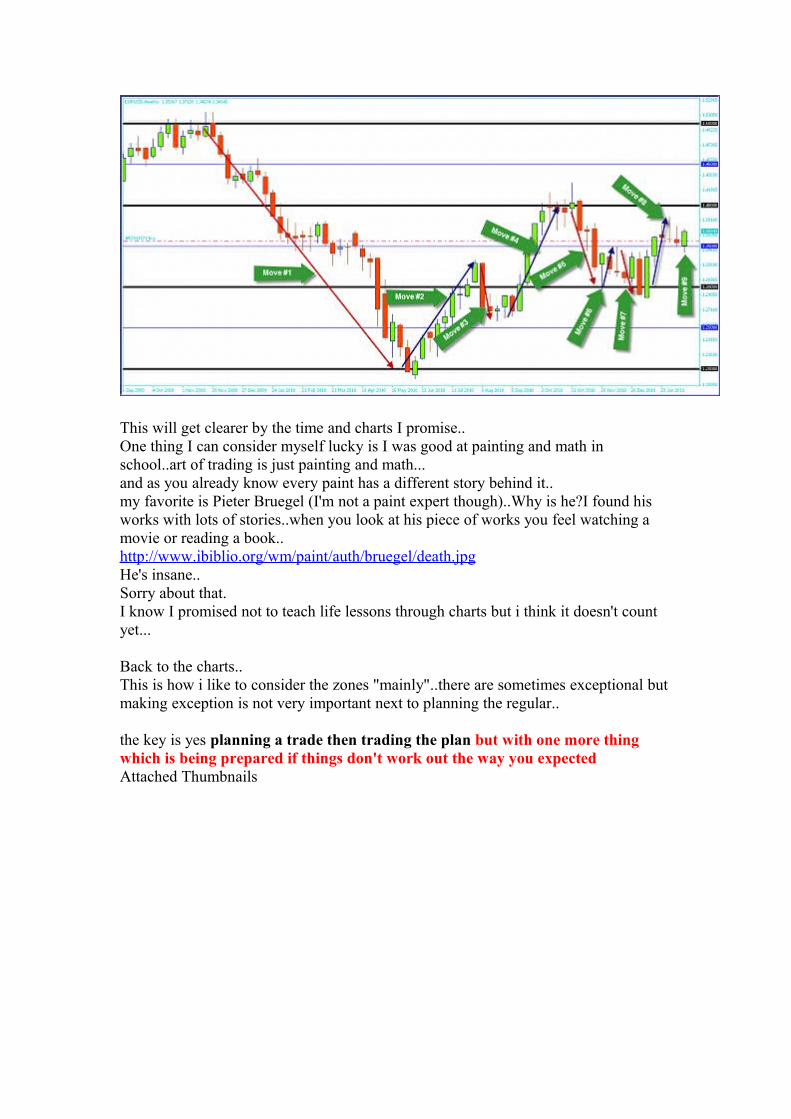
Back to the charts..This is how i like to consider the zones "mainly"..there are sometimes exceptional but making exception is not very important next to planning the regular..
the key is yes planning a trade then trading the plan but with one more thing which is being prepared if things don't work out the way you expectedAttached Thumbnails
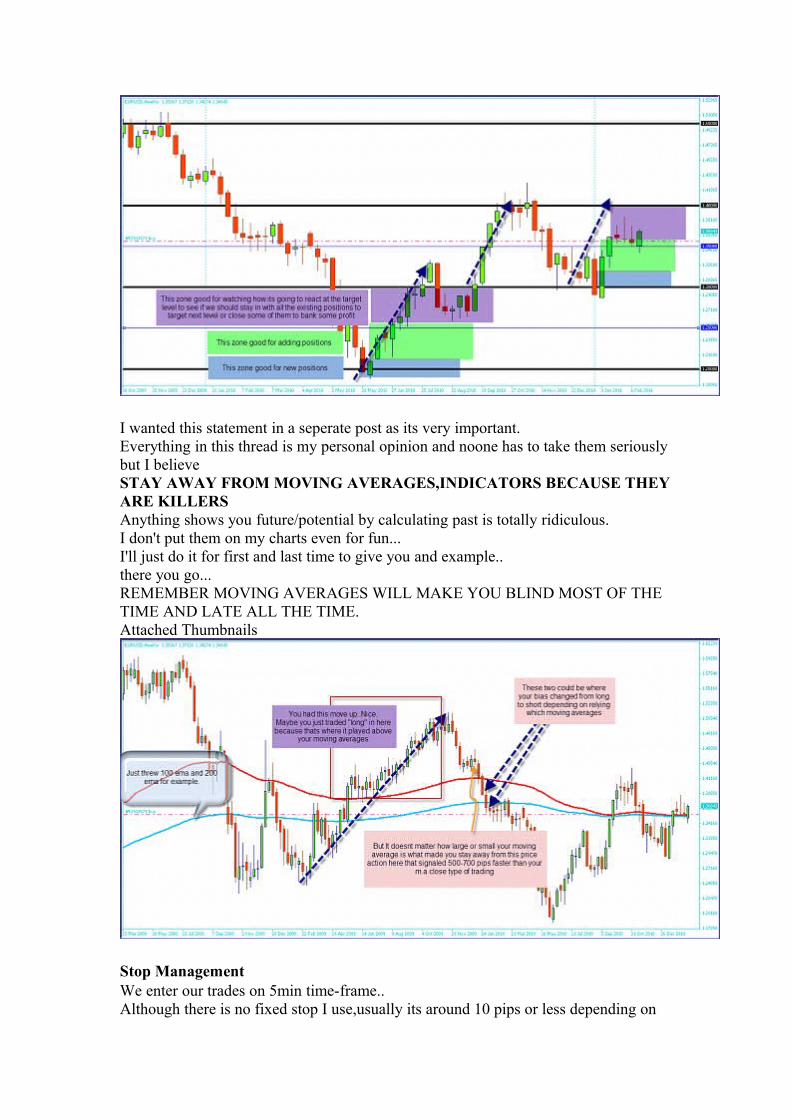
I wanted this statement in a seperate post as its very important.Everything in this thread is my personal opinion and noone has to take them seriously but I believeSTAY AWAY FROM MOVING AVERAGES,INDICATORS BECAUSE THEY ARE KILLERSAnything shows you future/potential by calculating past is totally ridiculous.I don't put them on my charts even for fun...I'll just do it for first and last time to give you and example..there you go...REMEMBER MOVING AVERAGES WILL MAKE YOU BLIND MOST OF THE TIME AND LATE ALL THE TIME.Attached Thumbnails
Stop Management We enter our trades on 5min time-frame..Although there is no fixed stop I use,usually its around 10 pips or less depending on

my entry candle and setup.If it stops moving after my entry I usually close it with small loss and wait until I believe it starts to move.But all entries made at the close of the candleRemember that you entering on 5 min but targeting >1000 pipsIt may sound nonsense but I know its possible through myself.No need to trail stops.Its a hit the big number or die at the break even issue..Sometimes this approach will save you from fake price actions as well as causing some frustrations reversing after couple hundred pips.I'll show you my losing attempts upon new trades because of they are part of the process.
So Far I read your trading strategy VERY low risk and VERY high profit .
actually i'm a newbie inthis bussiness, so i just want to ask one thing about Fake Out, can you share your experience (through chart and sample if possible ) about fake breakout in your trading strategi?a website link would be nice too.
because for us newbie fake out is real killer.
important question..Attached Thumbnails
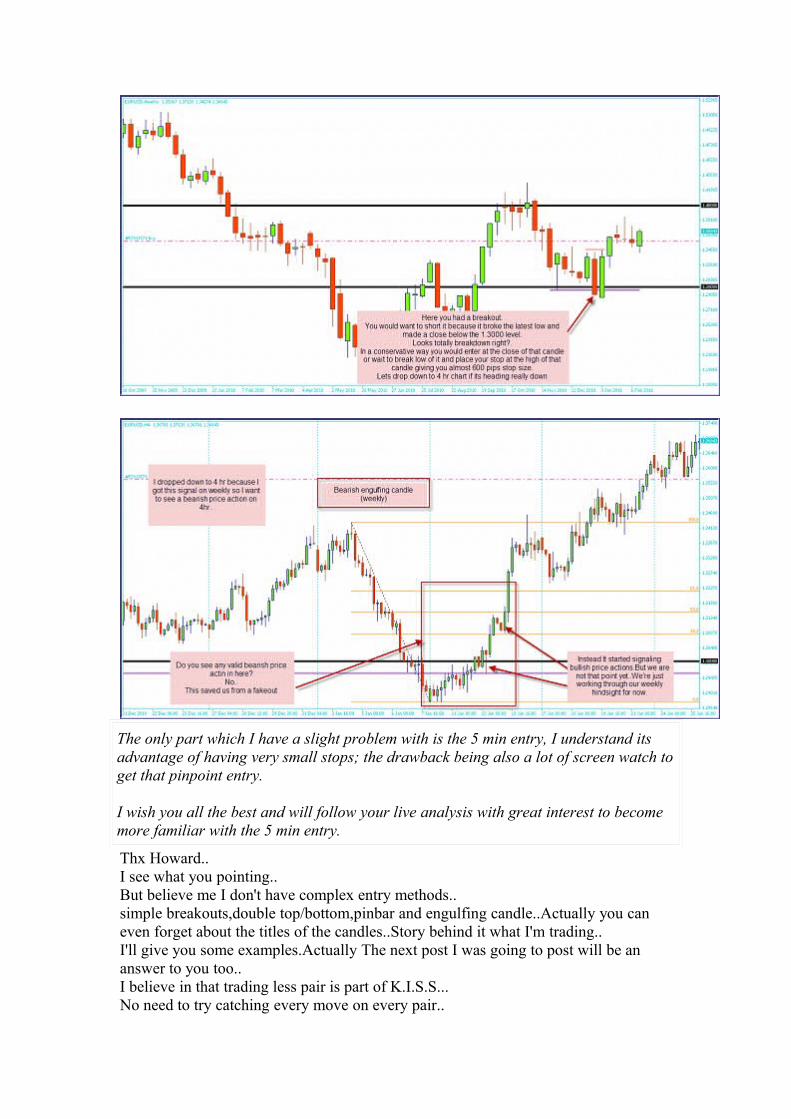
The only part which I have a slight problem with is the 5 min entry, I understand its advantage of having very small stops; the drawback being also a lot of screen watch to get that pinpoint entry.
I wish you all the best and will follow your live analysis with great interest to become more familiar with the 5 min entry.
Thx Howard..I see what you pointing..But believe me I don't have complex entry methods..simple breakouts,double top/bottom,pinbar and engulfing candle..Actually you can even forget about the titles of the candles..Story behind it what I'm trading..I'll give you some examples.Actually The next post I was going to post will be an answer to you too..I believe in that trading less pair is part of K.I.S.S...No need to try catching every move on every pair..
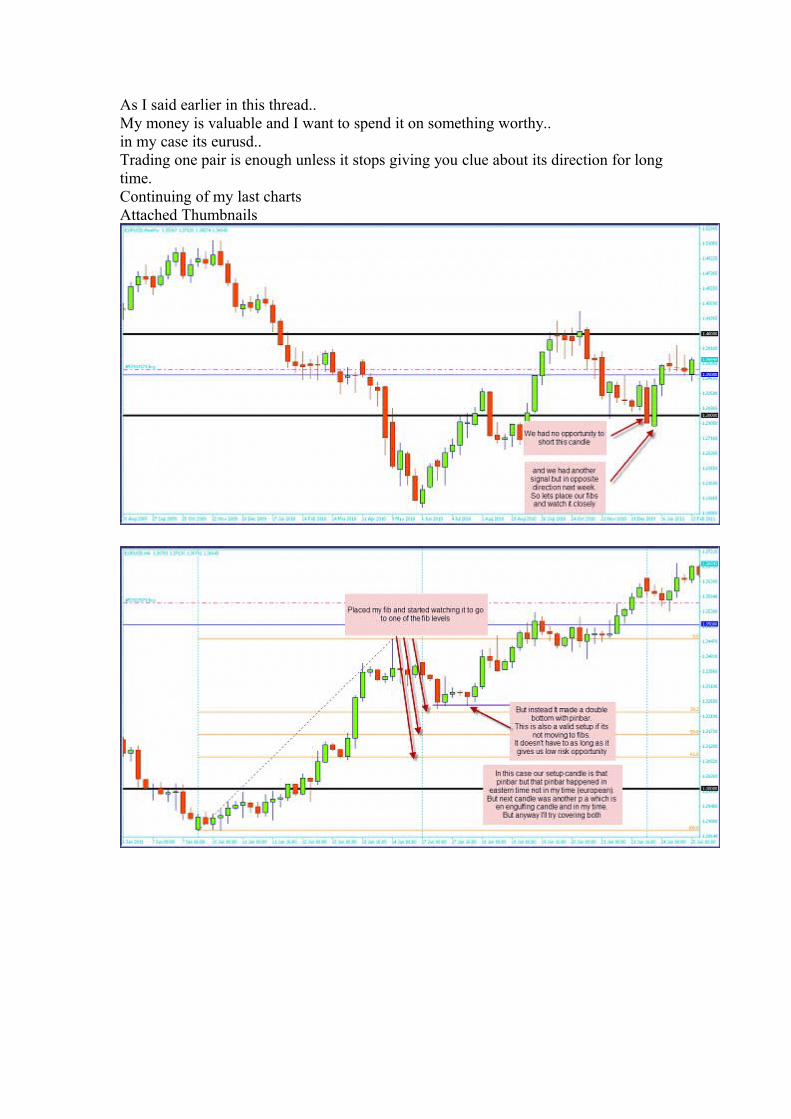
As I said earlier in this thread..My money is valuable and I want to spend it on something worthy..in my case its eurusd..Trading one pair is enough unless it stops giving you clue about its direction for long time.Continuing of my last chartsAttached Thumbnails
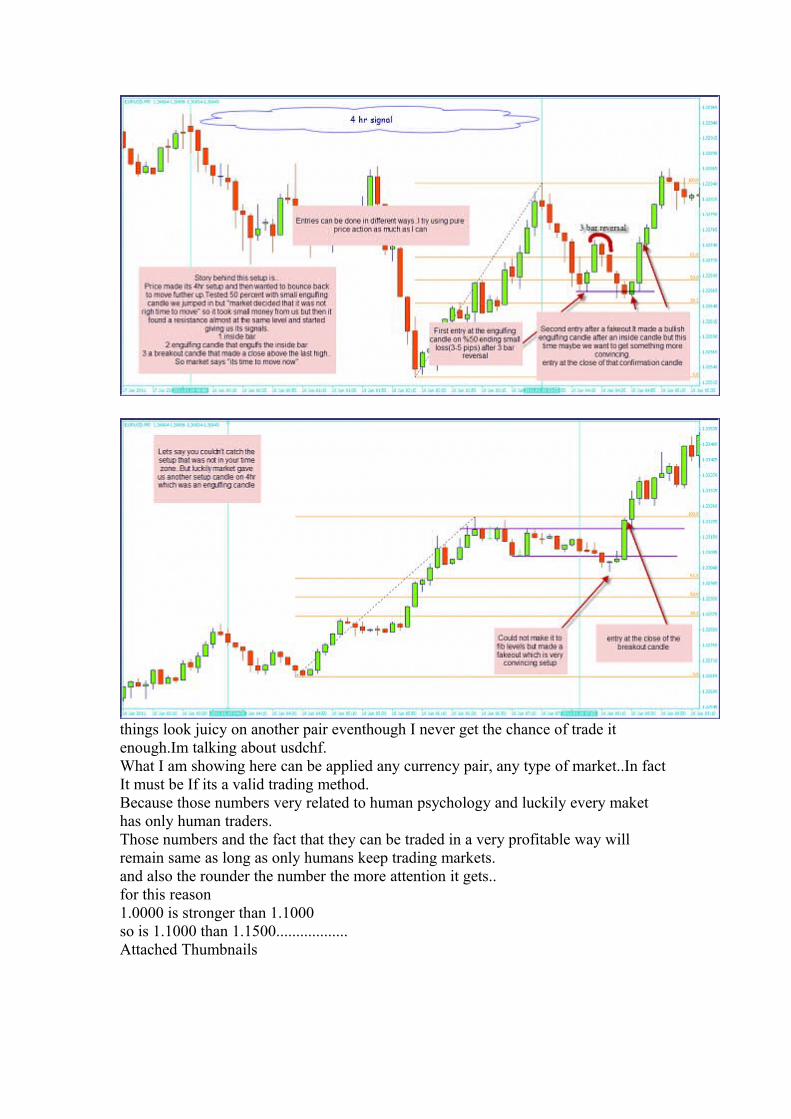
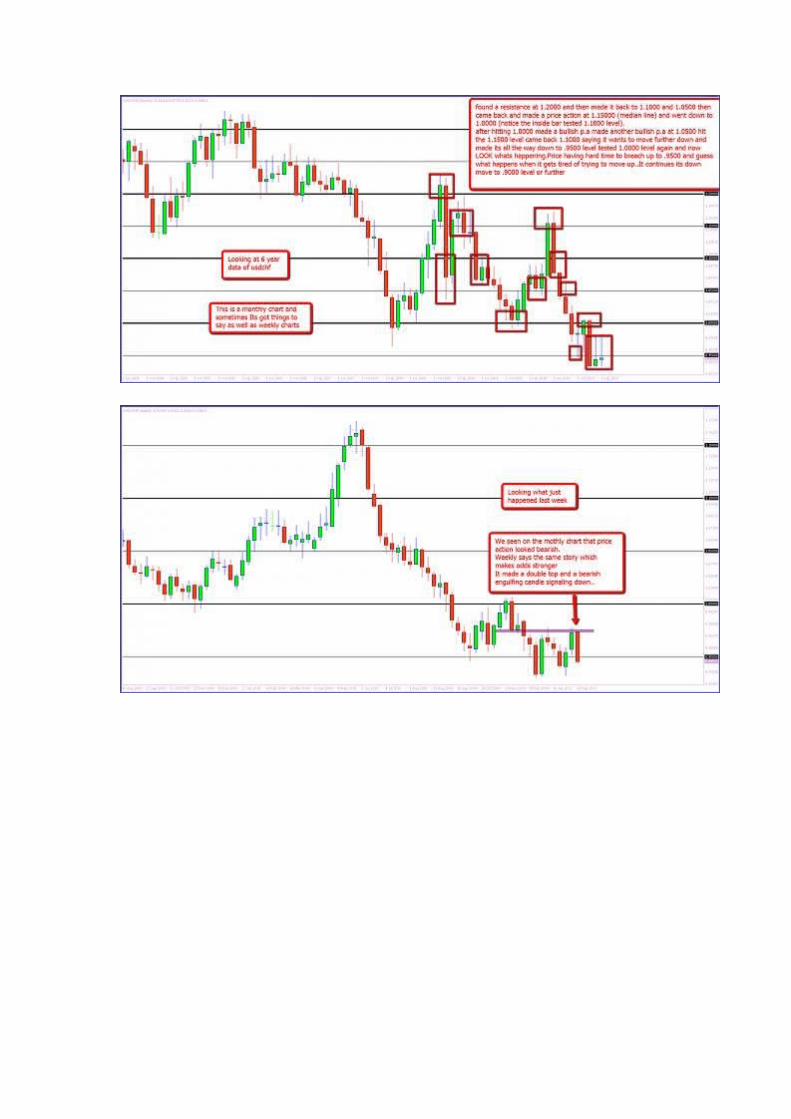
things look juicy on another pair eventhough I never get the chance of trade it enough.Im talking about usdchf.What I am showing here can be applied any currency pair, any type of market..In fact It must be If its a valid trading method.Because those numbers very related to human psychology and luckily every maket has only human traders.Those numbers and the fact that they can be traded in a very profitable way will remain same as long as only humans keep trading markets.and also the rounder the number the more attention it gets..for this reason1.0000 is stronger than 1.1000so is 1.1000 than 1.1500..................Attached Thumbnails