Embed Size (px)
Citation preview

Trading Signals Manual
Methodology
Trading signals follow a specific methodology of swing trading through price action analysis.
Signals are categorized into time frames. Each time frame acts as an independent virtual trader that
follows through the signals displayed. Multiple time frame trading can be achieved by following all
signals in all time frames for each instrument.
Signals can be used to outline possible trading scenarios and are an example of a trading
methodology executed in live market conditions. According to their own preference, traders can
decide in which time frame to trade. Lower time frames require longer hours for monitoring active
positions in the market. The lower the time frame traded, the higher the frequency of possible
trades. The higher the time frame the signal is presented in, the longer it will take for the trading
scenario to develop and conclude. Multiple time frame trading can be achieved by following all
signals across all time frames on each instrument. In each case, the execution of trading signals must
be accompanied by money management techniques in order to control active exposure.
Trading signals can also be used as a way to view an analysis of the market, identify the direction of
each time frame and see where targets are outlined, along with extreme price conditions, and
recognize trends. The trending characteristics of all time frames on a given instrument can give
traders an outlook for the state of the market and on how aligned trends are over multiple time
frames.
During signal output times, trading scenarios with entry levels prepared are outlined in the morning
and afternoon calls. Once a previously outlined signal has been activated, the next report will
continue to follow through the existing trade, managing exit levels along the way, until the trading
scenario has reached exit levels. After a trading scenario has ended, the specific time frame searches
for the next trading scenario.
Following through a specific methodology, in some cases, entry levels are formed and activated
between signal output times. In these cases, the activated signal or next opportunity to enter will be
outlined in the next report.
Each time frame acts as a separate virtual trader, however less volatile results can be achieved by
using money management to follow all signals on all time frames and on all instruments.
Each trading scenario is outlined with 2 take profit targets, where ongoing positions are closed 50%
at the first target and 50% at the second target. This can be achieved by manually closing 50% of the
position at the time the market reaches the first target or by entering 2 trade orders from the
beginning but outlining different profit targets. Both positions use the same stop-loss, and a trail of a
stop-loss towards entry level implies both stops to be moved in case both halves of the positions are
still active.
Output Times
Signals are released between 10:00 – 10:30 and 16:00 – 16:30 EET in winter and EEST in summer.
Chart
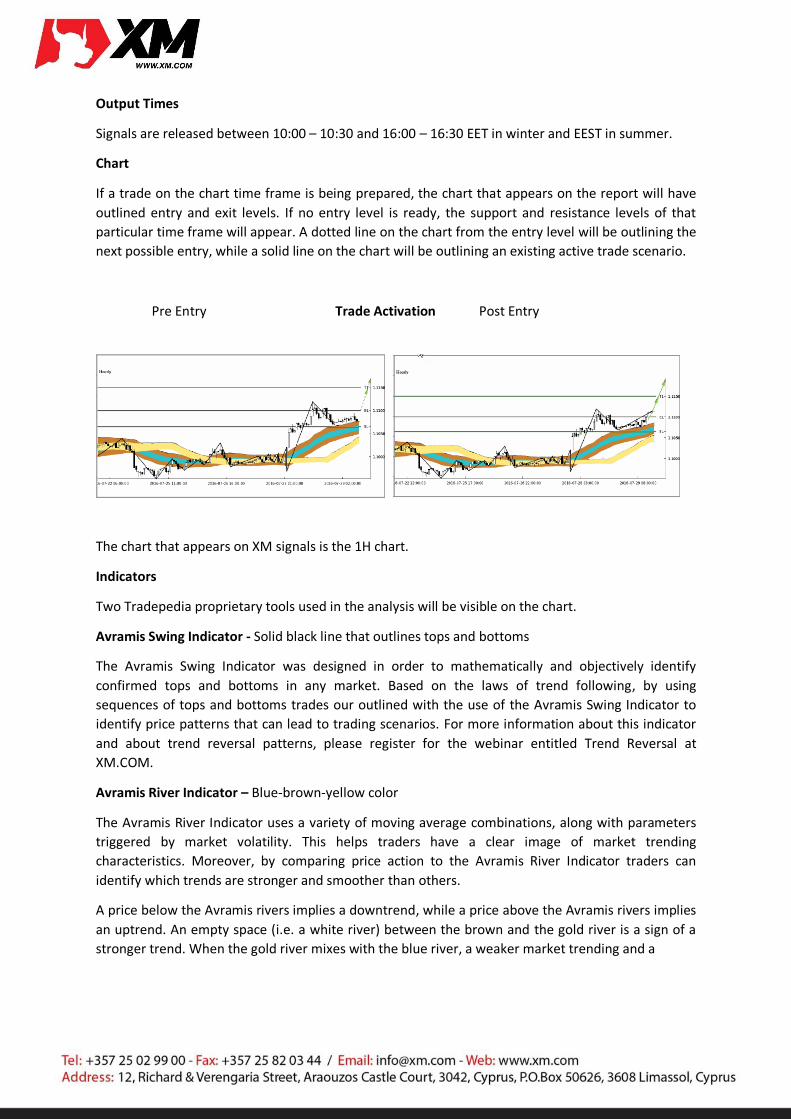
If a trade on the chart time frame is being prepared, the chart that appears on the report will have
outlined entry and exit levels. If no entry level is ready, the support and resistance levels of that
particular time frame will appear. A dotted line on the chart from the entry level will be outlining the
next possible entry, while a solid line on the chart will be outlining an existing active trade scenario.
Pre Entry Trade Activation Post Entry
The chart that appears on XM signals is the 1H chart.
Indicators
Two Tradepedia proprietary tools used in the analysis will be visible on the chart.
Avramis Swing Indicator - Solid black line that outlines tops and bottoms
The Avramis Swing Indicator was designed in order to mathematically and objectively identify
confirmed tops and bottoms in any market. Based on the laws of trend following, by using
sequences of tops and bottoms trades our outlined with the use of the Avramis Swing Indicator to
identify price patterns that can lead to trading scenarios. For more information about this indicator
and about trend reversal patterns, please register for the webinar entitled Trend Reversal at
XM.COM.
Avramis River Indicator – Blue-brown-yellow color
The Avramis River Indicator uses a variety of moving average combinations, along with parameters
triggered by market volatility. This helps traders have a clear image of market trending
characteristics. Moreover, by comparing price action to the Avramis River Indicator traders can
identify which trends are stronger and smoother than others.
A price below the Avramis rivers implies a downtrend, while a price above the Avramis rivers implies
an uptrend. An empty space (i.e. a white river) between the brown and the gold river is a sign of a
stronger trend. When the gold river mixes with the blue river, a weaker market trending and a
possible price ranging can be expected. For more information about the Avramis River Indicator,
please register for the webinar entitled Avramis River at XM.COM.
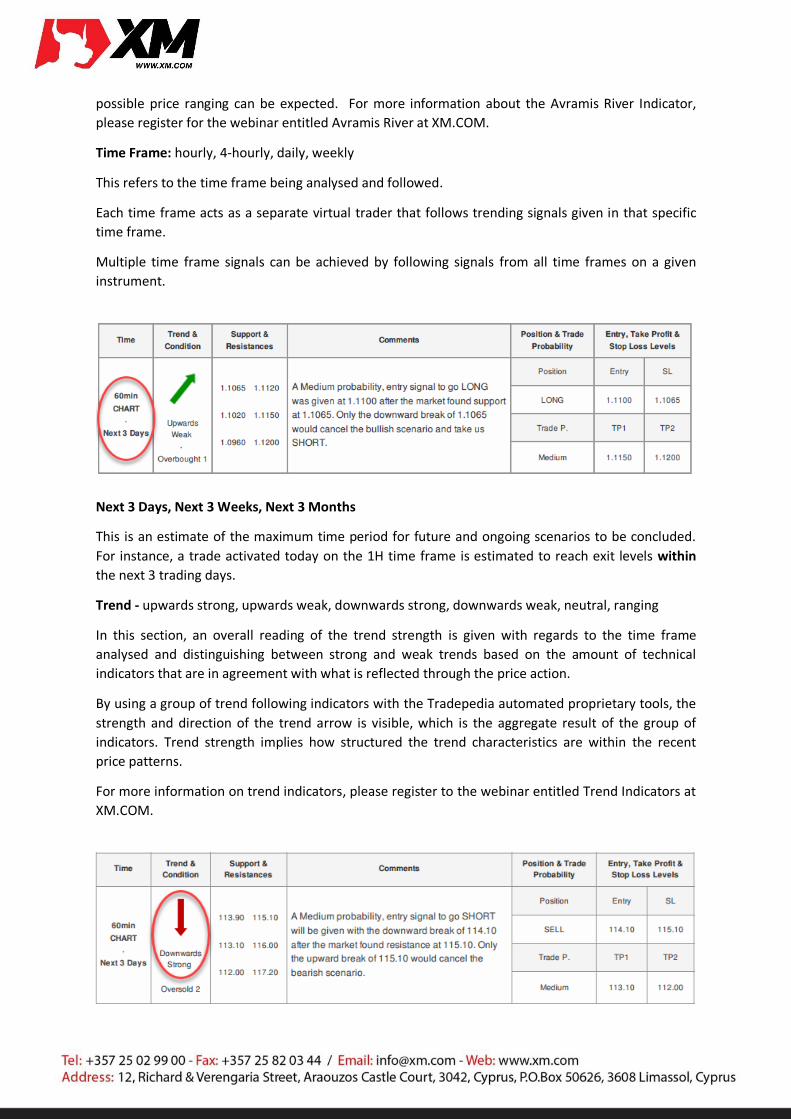
Time Frame: hourly, 4-hourly, daily, weekly
This refers to the time frame being analysed and followed.
Each time frame acts as a separate virtual trader that follows trending signals given in that specific
time frame.
Multiple time frame signals can be achieved by following signals from all time frames on a given
instrument.
Next 3 Days, Next 3 Weeks, Next 3 Months
This is an estimate of the maximum time period for future and ongoing scenarios to be concluded.
For instance, a trade activated today on the 1H time frame is estimated to reach exit levels within
the next 3 trading days.
Trend - upwards strong, upwards weak, downwards strong, downwards weak, neutral, ranging
In this section, an overall reading of the trend strength is given with regards to the time frame
analysed and distinguishing between strong and weak trends based on the amount of technical
indicators that are in agreement with what is reflected through the price action.
By using a group of trend following indicators with the Tradepedia automated proprietary tools, the
strength and direction of the trend arrow is visible, which is the aggregate result of the group of
indicators. Trend strength implies how structured the trend characteristics are within the recent
price patterns.
For more information on trend indicators, please register to the webinar entitled Trend Indicators at
XM.COM.
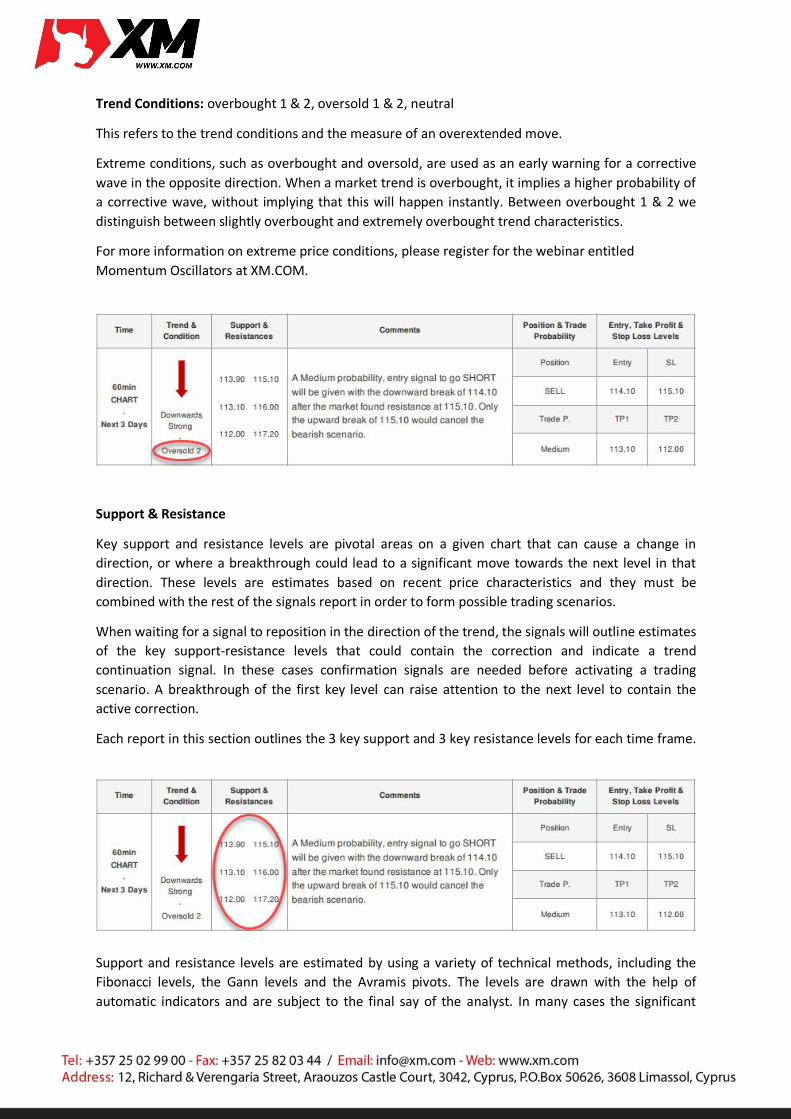
Trend Conditions: overbought 1 & 2, oversold 1 & 2, neutral
This refers to the trend conditions and the measure of an overextended move.
Extreme conditions, such as overbought and oversold, are used as an early warning for a corrective
wave in the opposite direction. When a market trend is overbought, it implies a higher probability of
a corrective wave, without implying that this will happen instantly. Between overbought 1 & 2 we
distinguish between slightly overbought and extremely overbought trend characteristics.
For more information on extreme price conditions, please register for the webinar entitled
Momentum Oscillators at XM.COM.
Support & Resistance
Key support and resistance levels are pivotal areas on a given chart that can cause a change in
direction, or where a breakthrough could lead to a significant move towards the next level in that
direction. These levels are estimates based on recent price characteristics and they must be
combined with the rest of the signals report in order to form possible trading scenarios.
When waiting for a signal to reposition in the direction of the trend, the signals will outline estimates
of the key support-resistance levels that could contain the correction and indicate a trend
continuation signal. In these cases confirmation signals are needed before activating a trading
scenario. A breakthrough of the first key level can raise attention to the next level to contain the
active correction.
Each report in this section outlines the 3 key support and 3 key resistance levels for each time frame.
Support and resistance levels are estimated by using a variety of technical methods, including the
Fibonacci levels, the Gann levels and the Avramis pivots. The levels are drawn with the help of
automatic indicators and are subject to the final say of the analyst. In many cases the significant
levels will coincide with the entry and exit levels of the trading scenario. However, once the trade
scenario becomes active and develops, the significant levels can be different from those of entry and
exit levels.
For more information about support-resistance levels, please register to the webinar entitled
Support and Resistance at XM.COM.
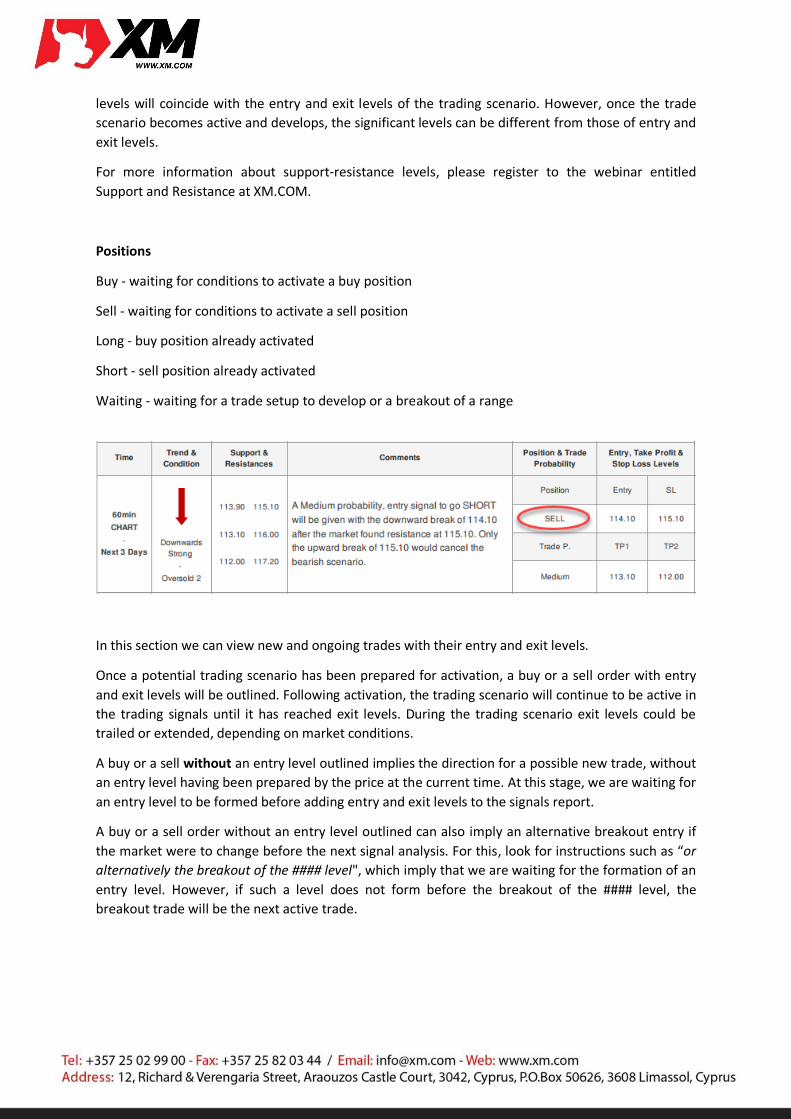
Positions
Buy - waiting for conditions to activate a buy position
Sell - waiting for conditions to activate a sell position
Long - buy position already activated
Short - sell position already activated
Waiting - waiting for a trade setup to develop or a breakout of a range
In this section we can view new and ongoing trades with their entry and exit levels.
Once a potential trading scenario has been prepared for activation, a buy or a sell order with entry
and exit levels will be outlined. Following activation, the trading scenario will continue to be active in
the trading signals until it has reached exit levels. During the trading scenario exit levels could be
trailed or extended, depending on market conditions.
A buy or a sell without an entry level outlined implies the direction for a possible new trade, without
an entry level having been prepared by the price at the current time. At this stage, we are waiting for
an entry level to be formed before adding entry and exit levels to the signals report.
A buy or a sell order without an entry level outlined can also imply an alternative breakout entry if
the market were to change before the next signal analysis. For this, look for instructions such as “or
alternatively the breakout of the #### level", which imply that we are waiting for the formation of an
entry level. However, if such a level does not form before the breakout of the #### level, the
breakout trade will be the next active trade.
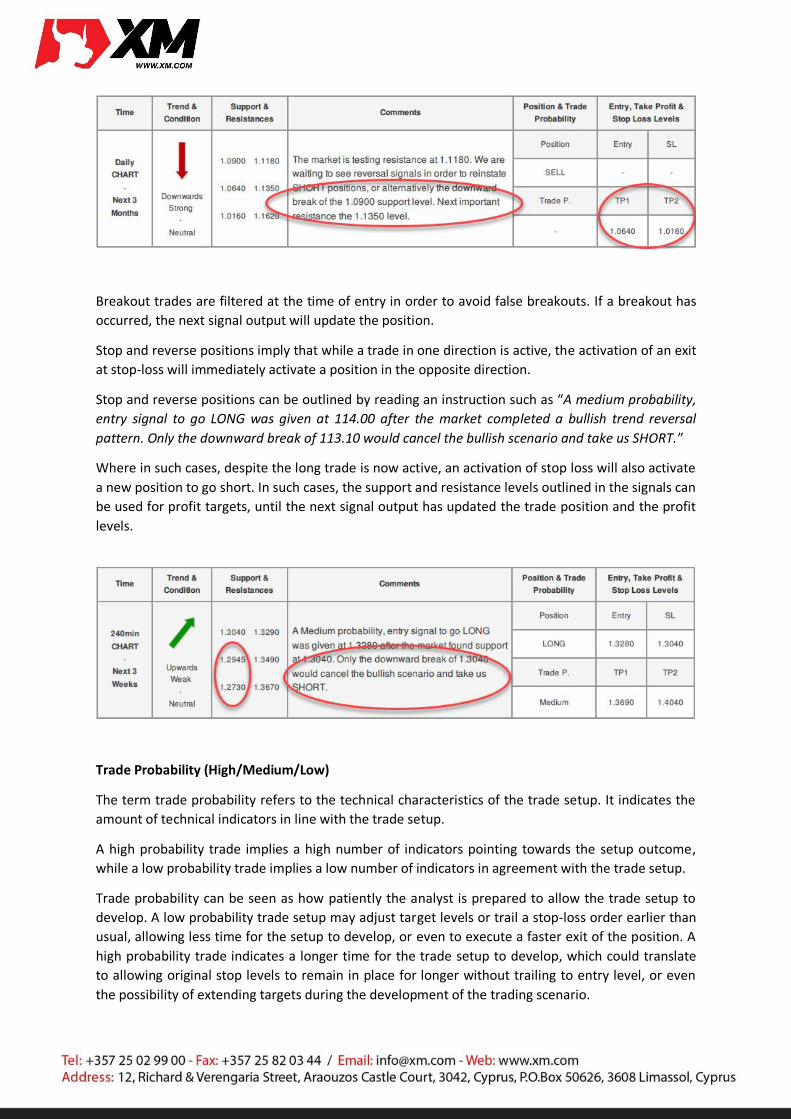
Breakout trades are filtered at the time of entry in order to avoid false breakouts. If a breakout has
occurred, the next signal output will update the position.
Stop and reverse positions imply that while a trade in one direction is active, the activation of an exit
at stop-loss will immediately activate a position in the opposite direction.
Stop and reverse positions can be outlined by reading an instruction such as “A medium probability,
entry signal to go LONG was given at 114.00 after the market completed a bullish trend reversal
pattern. Only the downward break of 113.10 would cancel the bullish scenario and take us SHORT.”
Where in such cases, despite the long trade is now active, an activation of stop loss will also activate
a new position to go short. In such cases, the support and resistance levels outlined in the signals can
be used for profit targets, until the next signal output has updated the trade position and the profit
levels.
Trade Probability (High/Medium/Low)
The term trade probability refers to the technical characteristics of the trade setup. It indicates the
amount of technical indicators in line with the trade setup.
A high probability trade implies a high number of indicators pointing towards the setup outcome,
while a low probability trade implies a low number of indicators in agreement with the trade setup.
Trade probability can be seen as how patiently the analyst is prepared to allow the trade setup to
develop. A low probability trade setup may adjust target levels or trail a stop-loss order earlier than
usual, allowing less time for the setup to develop, or even to execute a faster exit of the position. A
high probability trade indicates a longer time for the trade setup to develop, which could translate
to allowing original stop levels to remain in place for longer without trailing to entry level, or even
the possibility of extending targets during the development of the trading scenario.
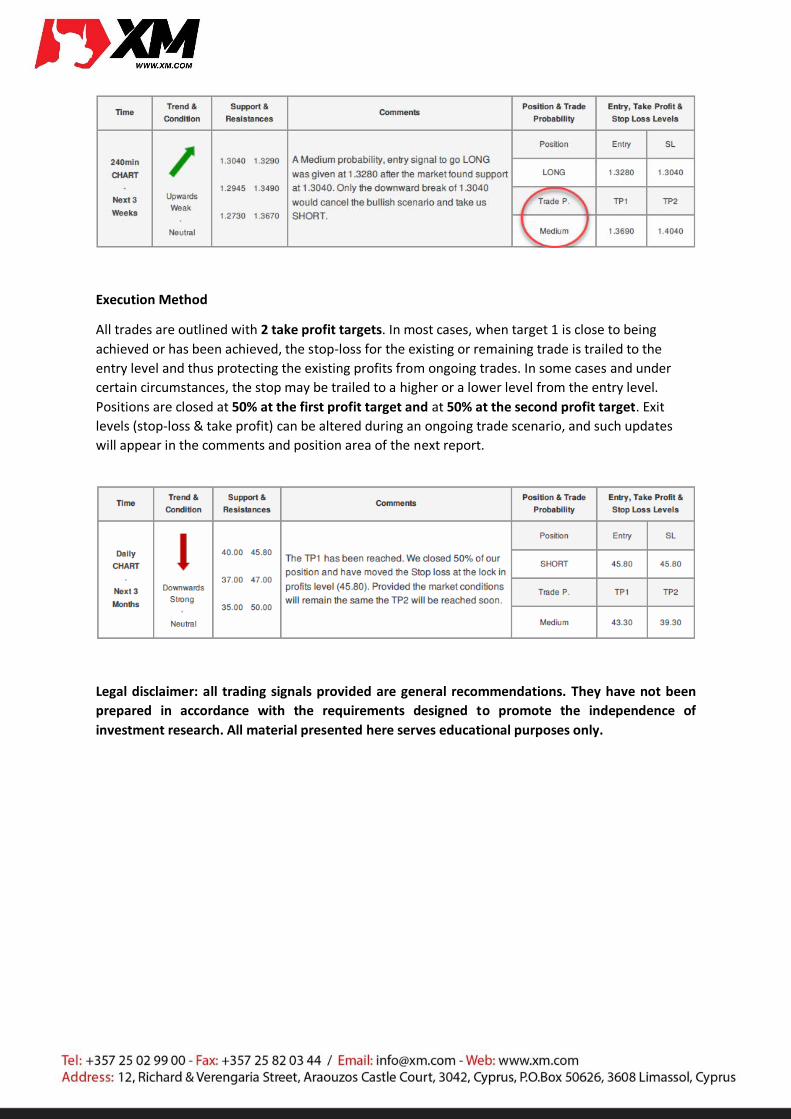
Execution Method
All trades are outlined with 2 take profit targets. In most cases, when target 1 is close to being
achieved or has been achieved, the stop-loss for the existing or remaining trade is trailed to the
entry level and thus protecting the existing profits from ongoing trades. In some cases and under
certain circumstances, the stop may be trailed to a higher or a lower level from the entry level.
Positions are closed at 50% at the first profit target and at 50% at the second profit target. Exit
levels (stop-loss & take profit) can be altered during an ongoing trade scenario, and such updates
will appear in the comments and position area of the next report.
Legal disclaimer: all trading signals provided are general recommendations. They have not been
prepared in accordance with the requirements designed to promote the independence of
investment research. All material presented here serves educational purposes only.