Embed Size (px)
Citation preview

Traditional Okanagan Environmental Knowledge and Fisheries Management
Adrienne Vedan, BA
Okanagan Nation Fisheries Commission
3255 C Shannon Lake Road Westbank British Columbia
V4T 1V4
May 2002
Abstract The Okanagan Nation Fisheries Commission is working towards restoring wild salmon stocks and indigenous species along with rebuilding the Okanagan River and marginalizing exotic species through habitat restoration and water management. Due to this emphasis on restoring historic salmon runs to the Okanagan River, the paper will highlight the importance of anadromous salmon and it’s importance to the aquatic systems of the Okanagan watershed by looking at the value of combining aboriginal traditional knowledge with western science. A considerable part of traditional Okanagan resource economy involved fishing and it is beneficial to examine how aquatic resources were traditionally governed without being destroyed or exhausted. This traditional knowledge it being incorporated into modern fisheries management because of the need for environmental sustainability and to include the individuals who are connected to and use these resources. This paper will look at Okanagan traditional knowledge, its form, function and relevance to the current ecosystem approached to fisheries management. Disclaimer Okanagan Nation Alliance reports frequently contain preliminary data and conclusions based on these may be subject to change. Reports may be cited in publications but their manuscript status (MS) must be noted. Please obtain the individual author’s permission before citing their work. Citation Vedan, Adrienne. 2002. Traditional Okanagan Environmental Knowledge and Fisheries Management. Prepared by Okanagan Nation Alliance, Westbank, BC.
20100226-5166 FERC PDF (Unofficial) 2/26/2010 4:21:25 PM
2
Without Prejudice
The participation of the Okanagan Nation Alliance (ONA) in this paper is without prejudice to the aboriginal rights of the Okanagan Nation or the aboriginal rights of any Okanagan band or any members thereof. Furthermore, the participation of the ONA is Without Prejudice to its position that it holds aboriginal title to the whole territory within which the project work and this report applies and any claim that the Okanagan Nation may make therefore, including a claim for fair compensation for any infringement on that title. In the event that the ONA develops its own policy on consultation, infringement and compensation, its participation in this paper and the information contained in this report and any related documentation will be subject to that policy. The research, writing, and subsequent analysis presented within this report are the endeavours of the authors. Any ideas, questions, and remarks generated within this project are reflections and interpretations of the subject matter. This information is limited to the subject matter and is regarded as Without Prejudice to the ONA and Member Bands.
20100226-5166 FERC PDF (Unofficial) 2/26/2010 4:21:25 PM

3
The value of combining aboriginal traditional knowledge with western science is of increasing significance in the management of environmental systems. A large portion of the traditional Okanagan resource economy involved fishing and it is useful to look at how aquatic resources were traditionally managed without the resource being destroyed or depleted. The holistic structure of the Okanagan society preserved and generated traditional knowledge, which emphasizes interaction and coexistence rather than control. The Okanagan world-view based on observation of the ecosystem as a whole was handed down over countless generations through legends and beliefs that defined the relationship between all living things. However, western management and science has previously managed these resources based on an economically driven value system, which has led to the depletion or destruction of resources. Today, fisheries management is now attempting to incorporate traditional knowledge because of the demand for environmental sustainability and to include the people who are affected by and use these resources. This paper will look at Okanagan traditional knowledge, its form, function and relevance to current ecosystem approaches to fisheries management. Because of the present emphasis on restoring historic salmon runs to the Okanagan River, the paper will highlight the importance of anadromous salmon and it’s importance to the aquatic ecosystems of the Okanagan Watershed. It is important to note that in the tradition of oral history, the stories presented in this paper are only a version that has been handed down. These stories appear in slight variation depending on the area the storyteller is from and storyteller but they all contain the same message. Also, the words that appear in Okanagan are only a phonetic spelling.
Traditionally, Okanagans occupied an area which extended over approximately 69 000 square kilometers. The northern area of this territory was close to the area of Mica Creek, just north of modern day Revelstoke, BC, and the eastern boundary was between Kaslo and Kootenay Lakes. The southern boundary extended to the vicinity of Wilbur, Washington and the western border extended into the Nicola Valley (Urban Systems 1998). Based on linguistic research of the Okanagan language, the different groups of this territory can be broken down to include: Northern Okanagan (along upper Okanagan Lake), Similkameen Okanagan (along the Similkameen River), southern Okanagan (along the lower Okanagan River), Methow Okanagan (along the Methow River), Sanpoil-Nespelem (along the Columbia River), Colville (along the Colville valley) and Lakes (Columbia River, Arrow Lakes and Slocan Lake)(Hudson 1990). Currently, the Okanagan Nation in Canada is made up of seven bands: the Okanagan Indian Band, Upper Nicola Indian Band, Westbank First Nation, Penticton Indian Band, Lower Similkameen Indian Band, Upper Similkameen Indian Band and Osoyoos Indian Band.
The Okanagan view of the world is one in which people, beliefs and nature are intertwined and inseparable. The plants, animals, hills and water were viewed has having their own spirits and were likewise treated with the utmost respect. The idea of humans having dominance over nature was non-existent; instead nature was viewed as a relative who provided assistance and was treated in a corresponding manner. “Before one cut a tree, mined a mountain, or dammed a brook, it was important to placate the spirit in charge of that particular situation and keep it placated” (White 1967). This worldview ensured sustained management (Baker 1990). This belief was passed down through generations.
A great deal of attention was focused on the education of children. Generally the elders of each family filled the role of the educator and they taught the children through the use of stories. These stories explain how and why the world and its creatures came to be. The stories
20100226-5166 FERC PDF (Unofficial) 2/26/2010 4:21:25 PM

4
come from a pre-human age when the Okanagan people were not human yet and instead had both animal and human characteristics; these first people were the animal people (Robinson 1989). Furthermore, these legends emphasize the laws that govern the Okanagan people. These laws include the beliefs to understand and live in harmony with nature and to ensure that knowledge is passed down in a respectful way to all creation (Maracle et. al. 1994). These values were passed down from one generation to the next as evidence of Okanagan history called chaptikwl1. This accumulation of knowledge is a record of what it means to be Okanagan rather than a history of dates. This record extends back to the last ice age and is verified in the setting for the story of the Northwind Monster.2 The meanings of chaptikwl are created through story and they hold the truths and knowledge of natural laws. In these stories, the Creator gave Sen’k’lip, coyote, the gift to help change things so that people could survive on earth. “Coyote’s travels across the land are a record of the natural laws our people learned in order to survive” (Maracle et. al. 1994)
Sen’k’lip is famous for bringing salmon up the Columbia River and this event takes place before humans existed. In the story, coyote heard that there were two bird sisters who made fish traps on the lower Columbia River and that the fish could not pass. Coyote thought to himself that he would go and break the weir and let the salmon come up the river. He changed himself into a wooden bowl and floated down the River where he was caught in the trap. One of the sisters brought the bowl back to their camp. They used the bowl to store salmon but whenever they left and returned, the bowl became empty so the sisters wanted to burn it. At this time, Coyote turned himself into an animal boy and asked the sisters if he could be their little brother. The sisters agreed and looked after him. One morning, Coyote broke the dam and told the sisters to leave the dam open and allow the salmon to run up the river because soon there would be humans. Since the sisters could not rebuild the dam the salmon leader was happy and thought coyote was good for helping them. The salmon followed Sen’k’lip up the river and along the way they stopped at the Yakima River. Here, coyote approached the animal people (not fully human yet) and told them if they would give him their prettiest daughters to marry they could have salmon forever but if they did not agree he would make a dam to keep the salmon away. Coyote was making laws. The creatures agreed to Coyote’s request because they wanted salmon for the humans. Coyote told the salmon that they would return to this spot every year and that they would choose their own leader and have their own ways. Coyote then continued to go up the river and its tributaries and when he came across settlements he would tell the animal creatures that soon there would be humans and they would need salmon. Coyote continued to go up the river and when he reached the confluence of the Okanagan and Similkameen Rivers, he held a meeting in present day Oroville. He asked the animal people for their prettiest daughters in exchange for salmon every summer forever but the Similkameen people told Coyote that they had mountain goat to eat. So Coyote made a big dam on the Similkameen River to stop the salmon from passing. Coyote then went to the mouth of Okanagan Lake where he also left salmon (Cline 1938). The story of Coyote bringing the salmon illustrates where salmon should and shouldn’t be. Sen’k’lip was creating natural laws by asking the creatures for their daughters in return for salmon and when they refused he did not allow fish passage. These rules were
1 Words that appear in Okanagan are only a phonetic spelling and the translation of these words appear in Appendix 2. 2 The story of the Northwind monster can be located in Mourning Dove. 1976. Tales of the Okanogans. Hines, D.M., ed. Ye Galleon Press, Fairfield, Washington. This story is set in a time when the earth was covered in snow ice.
20100226-5166 FERC PDF (Unofficial) 2/26/2010 4:21:25 PM

5
finalized and these places would either forever be with or without salmon. These areas are identified by name in the story.
Traditionally, six runs of salmon would come up the Columbia and its Okanagan tributary and into Okanagan Lake, the chinook (Oncorhynchus tshawytscha), sockeye (Oncorhynchus nerka), coho (Oncorhynchus kisutch), steelhead (Oncorhynchus mykiss), chum species (Oncorhynchus keta) and pink (Oncorhynchus gorbuscha) (Mourning Dove 1990; Atkinson 1967;Ernst 20003) Although Okanagan Falls was the most favored place to catch salmon, they did migrate past this location. Chinook were reported to have entered Okanagan Lake along with sockeye (Ernst and Vedan 20004). Before the Okanagan River section near the present day Penticton airport was made into a channel, there are accounts of steelhead (Ernst 20005). Elder, Joe Pierre recalls that “[t]oday it is called a river channel it was called oxbow before. It used to be rich in fish. Steelhead, coho, and sockeye and the king salmon” (Ernst 2000). Sockeye were also caught in this location, Mathew Baptiste recalls that they “used to go to Penticton by the bridge. There were thousands. They were so thick. Right now there is nothing.”(Ernst 20006). Skaha Lake was another site of fishing activity. Penticton historian, Reg Atkinson noted that natives used a number of platforms for fishing “over the deep water on the edge of the cliffs on the west side of Skaha Lake. From these precarious positions they could look straight down in to the clear water a considerable distance and no doubt some good catches were made.” (Atkinson 1967). The fishery on Skaha Lake is also addressed in a letter from the reserve commission to J.C. Haynes in 1877. In the letter, the commission reports that there is an old fishery and that it should be secured as a fishery for the natives (Reserve Commission 1877). Although, these two reports do not mention the type of fish harvested, it can be suggested that it was a salmon fishery because it would seem to be a large amount of work to harvest non-salmon species when there was an abundance of these in the creeks. The importance of salmon in Okanagan society is also noted in other colonial correspondence.
In the Okanagan Agency report on inland fisheries, Sproat points out that “there are in this part, and I believe generally throughout the interior of the country, Indian fisheries in stream flowing into Lakes. The Indians catch white fish at certain seasons. Probably these fish are valued articles of diet, though not to be compared with the almost necessary salmon” (Okanagan Agency 1877). Again the same sentiment regarding the importance of salmon is voiced in colonial correspondence by Indian Agent Irwin stating that “[f]ish especially salmon furnishes the staple supply of food for the Indians of this district” (Irwin 1898). The presence of anadromous salmon in Okanagan Lake is also verified by a biological survey of the Okanagan Lake in 1939 by Clemens, who reports that in the early days sockeye, chinook and coho entered the Lake. All of these accounts support the information handed down in chaptikwl.
According to the story of Coyote bringing salmon to the people, there are no salmon in the upper reaches of the Similkameen River. Anadromous fish species were denied access to the Similkameen River by Coyote rock, located several kilometers upstream from the mouth of
3 Joe Pierre, interview by Adrienne Vedan and Blaine Pierre, February 9, 2000. 4 Ned Louis, interview by Shirley Louis and Adrienne Vedan, January 12, 2000 and John Marchand, interview by Shirley Louis and AdrienneVedan, January 11, 2000 5 John Marchand, interview by Shirley Louis and AdrienneVedan, January 11, 2000 6 Mathew Baptiste, interview by Adrienne Vedan and Blaine Pierre, January 27, 2000
20100226-5166 FERC PDF (Unofficial) 2/26/2010 4:21:25 PM
6
the River in Washington State. Coyote rock was blasted and the natural falls were removed when Enloe Dam was being constructed between 1919-1920 in this location (American Rivers 2002). The Okanagan people respect coyote’s law prohibiting fish passage into the Similkameen. In the Annual Report of the Department of Indian Affairs for the Year Ended December 31st, 1890, the Indian agent reported that “at the mouth of the Similkameen River, in the United States Territory, are falls which prevent the ascent of salmon up the Similkameen...I have several times urged Indians to construct a fish ladder and thus provide themselves with a supply of salmon...”(Department of Indian Affairs 1890). The fact that they did not build a ladder illustrates that they followed Coyote’s laws.
Fisheries were used year round by the Okanagan people. The chart in Appendix 1 breaks Okanagan fisheries into season, species and location (Ernst 2000). Due to the abundance of various fish species in each season Okanagan people harvested not only salmonids but also other indigenous species in addition to the salmon fishery. In the spring, the main fishery was chinook, or also known as the king salmon because of it’s size and importance. Rainbow trout (Oncorhynchus mykiss), suckers (Catostomus spp.), whitefish (Prosopium spp.) and kokanee (Oncorhynchus nerka) were harvested in the spring. Next, were the sockeye and this fishery started in the early summer and extended into the fall. Also, continued throughout the summer months were the harvest of rainbow trout, steelhead, whitefish and kokanee. The fall included the harvest of sockeye, chinook, coho, steelhead, whites fish and kokanee .The kokanee fishery would extend into the early winter. In November, individuals would catch chum salmon. During the winter, the main fishery was for burbot (Lota lota). However, with the introduction of exotic species many of the indigenous species that Okanagans harvested were disappearing. In Norman Lerman’s field notes, Elder Pierre Logan talks about rainbow trout and kokanee and how “carp [Cyprinus carpio] have driven them away in last thirty years.”(1974: 10)
From a western scientific point of view, the consumption of fish is an excellent indicator of abundance. A study entitled “Indian Fisheries Productivity in Pre-Contact Times in the Pacific Salmon Area” looks at subsistence fishing of the Pacific salmon area to estimate aboriginal consumption of salmon. The consumption of salmon is viewed as the best measure of fishery resources. Hewes uses the dates between 1780 and 1790 to calculate the consumption of salmon. For the Okanagan and Lakes he estimates the catch to have been 500 pounds of salmon per person (1973). Additional studies have been done which estimate that around 1800, the Columbia River Catch would have been 365 pounds of salmon per year per person (Hewes 1998). Although this number dropped significantly between 1780 and 1800, it could be due to the fact that this count is only for the Kootenay area or the numbers could reflect that by 1800, the Columbia River fisheries were declining. Another possibility could be that early settlement pushed natives away from their fishery locations in addition to the unaccounted settlement consumption values. Although the amount of fish consumed paints a good picture of abundance and use, the concept illustrates a great cross-cultural barrier. This barrier was illustrated in a public hearing when the Indian Agent of the Merritt area questioned Chief Chillihitzia on the quantity of fish taken from Penask each year and he told them “As much as they want to for their use” and “fish enough to last to the next season.”(Thomas 2002). Chillihitzia’s response illustrates a qualitative answer, which exhibits cultural knowledge rather than a western quantitative response (Thomas). Again, the same sentiment is expressed by elder Edna Gregoire
20100226-5166 FERC PDF (Unofficial) 2/26/2010 4:21:25 PM

7
when asked how many fish were prepared for the water, she responded by saying “ It would have to be enough to last you the winter. We never used to count the fish or anything”(Ernst 20007).
There are many stories, which explain the laws of nature through Coyote’s actions. In the story How The Coyote Learned To Catch Fish In A New Way, it suggests that certain individuals should only do fishing and that different methods are used under different circumstances. In the story, while Sen’k’lip is traveling he came upon a teepee where two Fish Hawk people lived. As Coyote looked around the teepee he noticed that there was nothing for him to eat. The Fish Hawk people were mind readers and knew what he was thinking. The Fish Hawk man went out and gathered four new slim willow branches and brought them to the teepee. He then held them in the fire to make them soft and pliable. He then stuck the branches in his hair and flew up to the smoke hole and sat on the teepee poles. Nearby, he had cut a hole in the ice to fish through. Fish Hawk dove into the hole and when he came back to the teepee he had whitefish strung on the willow sticks. Coyote was happy to see all the fish. The Fish Hawk woman roasted the fish and Coyote ate a large amount. The Fish Hawk people gave Coyote the leftovers and wrapped it in a woven tule sack. When Coyote returned home, he cleaned his home in the same way the Fish Hawk people kept their home and then he fashioned his hair and his wife’s hair in the Fish Hawk manner. The Fish Hawk man stopped in for his sack and Coyote told him to stay and have something to eat. Then Coyote went outside and gathered willow branches and brought them inside by the fire. When the willow became soft he placed them in his hair and then he started to climb up the smoke hole. Coyote had a very difficult time climbing, falling sometimes and just hanging when he was tired. When he finally reached the top he had a hard time deciding if he was going to jump into the hole he had cut. At last, he finally made an effort and jumped but he missed the hole and landed so hard on his head that he was knocked out. While Coyote was lying there, Fish Hawk came out and took the willow branches and dove into the hole. Fish Hawk came back with two strings of fish. Then he picked up Coyote and brought him back to the teepee. When Coyote woke up, Fish Hawk sternly told him that those were fish hawk tricks not coyote’s.
This story suggests that certain individuals should only do fishing. Fish Hawk is the fisherman and Sen’k’lip wants to copy him; however, he is not skilled or does not have the knowledge to fish in the same manner and fails. He is aptly told that those aren’t his ways. This story parallels Okanagan society because individuals fished in manners according to the season and the status of the fisherman. Furthermore, there was variation among bands and families as to how much they fished; some families spent a large amount of time at various fishing grounds and some families stayed in the hills and subsisted on game (Post 1938). The story also illustrates that certain methods were used to fish during different seasons. In this story, there is a hole in the ice and during this time of year individuals would fish for whitefish and burbot. The manner in which the Fish Hawk made his fishing tools is also analogous to Okanagan society, it show how willow was made pliable in order carry fish. This story has many different teaching elements that were used by elders to educate children.
Resource management was further facilitated through group dichotomy. The social structure of Okanagan society ensured that there was restricted use of resources through supervision by certain band groups or families. Fishing or root gathering locations provided 7 Edna Gregoire, interview by Shirley Louis and Adrienne Vedan, January 17, 2000.
20100226-5166 FERC PDF (Unofficial) 2/26/2010 4:21:25 PM

8
central points for group identity and territory since they were the most important resources of a group (Hudson 1990). Although tribal territory were common lands and accessible to all for fishing, hunting, berrying or root picking it was a common rule that individuals from one region would ask the group of that vicinity for permission to use that area. Access was granted at the proper season (Teit and Boas 1973). Nevertheless, due to the vast social network in the Okanagan region permission to use a certain location was usually accessible through a relative or friend in the neighbouring group (Hudson 1990). In addition to families or groups supervising regions, there were also individuals whose role it was to manage particular resources.
The Salmon Chief controlled salmon fishing and his authority was restricted to the time of the salmon fishery; he had no special influence during the rest of the year (Kennedy and Bouchard 1975). He directed the construction of traps and weirs and also conducted the ceremony to mark the capture of the first salmon (Hudson1990; Ernst 20008). The salmon chief would ensure that there was a peaceful co-existence between the all the people at the fishing location and would also limit the number of fishing stations. Since the fishing site was monitored, individuals could not over-harvest. Although the Salmon Chief position is hereditary he had to undergo specific training in order to receive a guardian spirit that would allow him to possess the knowledge of the spirit powers connected with fishing. It was viewed that the Salmon Chief used his individually acquired spiritual power for the benefit of the group. In depth training meant that the Salmon Chief had intimate knowledge of the site and the salmon run and would therefore know if something was wrong in order to manage accordingly. Also, he would also have been trained by the previous Salmon Chief, which meant that information of previous years would have been passed on and likewise the previous Salmon Chief received his knowledge from his predecessor. The Salmon Chief was reported to have been powerful enough to wave salmon into a trap with his hand (Kennedy and Bouchard 1975). The Salmon Chief used his spiritual knowledge and training to conduct the first salmon ceremony.
The ceremony is a fisheries management tool. Once the first male and female salmon were caught, they were brought to the Salmon Chief and laid on a bed of boughs. The Salmon Chief would then instruct two young women to clean the salmon and place the entrails on the boughs. The fish was then cooked and once ready the Salmon Chief made an offering to the Creator and then the fish was passed out to everyone in the camp. During this time the Salmon Chief would tell the people how Sen’k’lip brought the salmon up the River to feed the people. Once everyone had finished their salmon, the bones were collected and added to the entrails. The Salmon Chief would then throw the fir bough containing the entrails and bones into the River and he would ask the salmon powers for a plentiful run of salmon (Kennedy and Bouchard 1975). The ceremony represents the dependence on salmon and the need to keep a good relationship with this renewable resource. This management approach emphasizes a symbiotic relationship rather than one of dominance by integrating a spiritual element instead of an impersonal relationship where nature exists independently from humans (Gadgil 2001)
Selective fishing practiced through different fishing methods was another form of management. Various fishing equipment was used according to the location and it’s conditions. Weirs were fence- like structures, which were used in favored sha llow positions of the river or stream to temporarily block passage. There are two fundamental location rules for building a 8 Lily Armstrong, interview by Adrienne Vedan and Blaine Pierre, February 11, 2000.
20100226-5166 FERC PDF (Unofficial) 2/26/2010 4:21:25 PM

9
weir and the first rule is that the water must not be over waist deep and the second rule is that there should be a large deep pool below this area in order for the fish to rest during the day. These weirs allowed people to spear, gaff, net or trap the salmon in the pools below the barrier or that passed through the narrow opening. In 1865, While surveyor C.Wilson was traveling through the southern Okanagan he noted in his journal that:
At Okanagan River, a weir, constructed of slight willow wands, was found, which extended right across the stream and at one end had an enclosure into which several openings were left; the remainder of the weir, being nearly, if not quite, impassable, all salmon passing up the River found their way into sort of ‘cul-de-sac’, where the Indians were busily engaged in spearing them (Wilson 1970).
This was an exceedingly effective means to harvest salmon and at the same time it let more fish up river than were harvested (Baker 1990; Martinez 2002). Harvesting salmon using traditional traps and weirs made it possible for individuals to monitor stock health, quantity, control the harvest, manage escapement, and catch different species. It also made it feasible to harvest strong stocks without harming weak stocks (Wilson 2002). When spearing the fish, they attempted to avoid any females in order to let them spawn. They would watch the salmon and the female would dig herself into the rock two or three times and the males would follow. When she broke away from the males she would lay her eggs. The fisherman would then spear the males because they would be the fish following (Lerman 1974).
Banning individuals of a certain age or sex from using certain harvest methods or using certain harvest methods was another resource management tool. There were many restrictions and rules for women. They were not allowed to go near the weir; therefore, camp was always made downstream at least half a mile from the fishing location. However, after the first four days a woman could go closer if someone who had spiritual powers accompanied her. Women were also not allowed to eat salmon for the first four days. They were also not supposed to eat the head or tails of the salmon. It was said if that a woman broke one of the rules, she would suffer from menstrual pains but one never broke the rules intentionally. One of the explanations for the fact that women were not allowed near the weir goes back to the story where Coyote brings salmon to the people and in this story; he breaks the dam of the two bird sisters. Afterwards, as part of Coyote’s instructions to men they were to keep fishing and weirs away from women (Post 1938). Woman also did not touch or make fishing equipment. Other rules at fishing camp included that women could not throw salmon entrails into or near the river because the odor could be carried to the fish. The blood and entrails would be buried away from dogs and footsteps of women (Mourning Dove 1990). By limiting access to fishing, long-term resource conservation could be reached by limiting the total amount harvested (Gadgil 2001). Since women were not seasoned fishers, they would not know what to look for and watch for. Furthermore, by restricting women’s access to fishing it confirmed both the role of males and females. Women were in charge of cleaning and preserving the salmon (Hudson 1990; Baker 1990; Ernst 20009) Non-salmon fisheries also fo llowed the same restrictions. Women were not allowed near the fishing grounds despite their age or stage of life but at some places they were
9 Herb Manuel, interview by Jonas Manuel and Adrienne Vedan, January 20, 2000.
20100226-5166 FERC PDF (Unofficial) 2/26/2010 4:21:25 PM

10
allowed to go if they were past menopause (Ernst 200010). Gender restrictions were part of a complex set of rules of resource management.
Limiting the amount of harvested salmon or other fish species in the immediate run would increase total yields on a long-term basis. This sacrifice illustrates that there is a legitimate show of restraint (Gadgil 2001). Generally, over harvesting was not practiced based solely on the relationship Okanagans had with nature and the view that they were part of each other; therefore, nature was not abused. The Salmon Chief also monitored the amounts caught and ensured that no one ind ividual caught more than what was needed. He also would tell the people when the fishery was closed and no more fish could be caught (Ernst 200011)
The fact that some species were not harvested in large amounts illustrates a management technique because it highlights the species that are available for gathering (Gadgil 2001) In Okanagan society, chum salmon were harvested on a lesser scale (Ernst 200012). Perhaps this species was seen as less desirable since there was a wide abundance of the other four species of salmon along with other fresh water fish like kokanee. Furthermore, chum salmon were harvested in November which meant that families would have already did the majority of their fishing in the early fall for sockeye and kokanee to prepare for winter. Nevertheless, when this species was harvested, people would catch them in Skaha Lake (Lerman 1974).
Leaving habitat untouched through selecting building material that grew away from streams was part of traditional habitat management. When materials were needed for the construction of weirs, other traps and drying racks, red willow was chosen which generally grew in the mountains. It was recognized that vegetative habitat surrounding streams and rivers were needed to provide oxygen and protection for the aquatic wildlife (DuBrett 200213). Furthermore, habitat areas remained in their natural state since large-scale development, grazing animals or pollutants did not exist. Preserving the natural habitat surrounding streams and rivers has a number of benefits for native fish. Vegetation provides shade and shelter and a temperature buffer. Furthermore, overhanging trees and bushes not only provide shade but when leaves fall it provides a deposit of organic material in the river and food for invertebrates and fish. Also, insects that drop in the water from surrounding vegetation also provides a source of food for fish. Vegetation also stabilizes riverbeds and banks by binding the soil with their roots and preventing erosion. Additionally, riparian habitat works as a filter for sediments and provides phosphorus and organic nitrogen, which improves water quality.
Other forms of traditional knowledge also played a factor in the management of fisheries. Individuals would wait for ecological indicators to provide them with the direction to proceed with harvest. One such indicator is the salmon berry bush. In the fall this bush turns red at the same time as the kokanee turn red and are ready to be harvested. Elder Irene Bryson stated, “When the salmon bushes turn red then you would know that the fish are here. When that bush got red we went fishing. That was our cue to go catch them.”(Ernst14). Another indicator that 10 Herb Manuel, interview by Jonas Manuel and Adrienne Vedan, January 20, 2000. 11 Joe Pierre, interview by Adrienne Vedan and Blaine Pierre, February 9, 2000. 12 Edward Allison, interview by Shirley Louis, February 9 2000, 284. 13 Clara DuBrett, telephone interview by Adrienne Vedan, 21 May 2002 14 Irene Bryson, interview by Adrienne Vedan and Blaine Pierre, January 26, 2000,
20100226-5166 FERC PDF (Unofficial) 2/26/2010 4:21:25 PM

11
Okanagan people used in the Douglas Lake Area was for kokanee fishing. Individuals would wait until the cranes would land where Nicola Creek goes into Spahomin Lake. When the cranes would start feeding off the top, individuals would know the kokanee were running and it was time to fish (Klahowya 2000).
The Okanagan language plays a part in resource management because it illustrates the comprehensiveness of a taxonomic system. Taxonomy is the foundation of building comprehensive systems of knowledge about nature. The Okanagan people had names for different aquatic species along with their names at different times of their life cycle. One example of the Okanagan taxonomic system was the word for chinook. Chinook salmon were referred to as the king salmon because he was the chief of all fish; the story of how chinook became the king salmon is told in the legend of the Four Chiefs. The Okanagan word for chinook is ntitiyix with the translation meaning king salmon and the word for late spawning chinook is sk’elwis which translates into old king salmon. Another example of the richness of Okanagan taxonomy is the differentiation of kokanee. Elder, Ned Louis, states that there are three subspecies of Okanagan Lake kokanee: kickinee which are the traditional stream spawners; na-tahx-ge-ah, which are large kokanee that shore spawn and puk-pu-xee-ah which are “white-nosed” kokanee that shore spawn (Machin and Long 2000). Okanagan knowledge of the natural environment is illustrated through the language because having an Okanagan word for a species illustrates their existence.
The Okanagan Nation Fisheries Commission’s (ONFC) work balances indigenous and western science in order to manage, protect and restore fisheries resources and aquatic habitat. Strategic objectives of the ONFC not only include bringing back wild salmon stocks and indigenous species but also to rebuild the Okanagan River and marginalize exotic species through habitat restoration and water management. The establishment of an Okanagan Basin ecosystem approach to fisheries management is assisted by community stewardship, education and networking. Projects that the ONFC has been involved with illustrate this goal and mandate.
One of the ONFC’s major projects has been on the “Evaluation of an experimental re-introduction of sockeye salmon into Skaha Lake”. This project consis ts of several studies which include disease risk assessment, exotic fish species risk assessment, sockeye habitat assessment in Okanagan River upstream of McIntyre Dam and a kokanee-sockeye lifecycle model. This project is working towards the removal of fish barriers in Okanagan River to allow for anadromous salmon passage into their historic range. The ONFC has made a proposal to the Bonneville Power Administration to determine migratory fish passage options past McIntyre Dam and the Skaha Lake Outlet Dam. These structures could be removed, by-passed or laddered to provide fish passage for anadromous salmon migration.
Enumerations are undertaken in order to estimate the populations of different species, and look at water quality and habitat usability. The ONFC has conducted kokanee enumerations on selected tributaries of Okanagan Lake. This project included stream spawning counts from August to October, collection of biosampling data, flow data and temperature data logger. This material will be important in the development of management plans for these systems. Another enumeration project focused on coho in Harris Creek, Creighton Creek, Duteau Creek, Bessette
20100226-5166 FERC PDF (Unofficial) 2/26/2010 4:21:25 PM

12
Creek, Ireland Creek, Bolean and Six-Mile Creeks. This project observed spawning population estimates, locations of spawning and observations of habitat quality. Enumeration work was also done for sockeye by running float surveys of the index section of Okanagan Lake counting sockeye spawning and holding. Furthermore, biosampling pre-spawn and post-spawn sockeye was completed. In addition, to working with fish species, ONFC also is involved in the restoration of aquatic resources.
The ONFC has been involved in a number of restoration projects throughout traditional Okanagan territory. A restoration and weir replacement project took place on Equesis Creek (Six Mile Creek). The project improved fish passage past a weir on the creek by creating a low gradient riffle between the weir crest and the natural bed elevation. The result was 1200 m of spawning and rearing habitat for salmonids. Creek restoration also occurred on Inkaneep Creek. This project comprised of building instream flow defectors for bank stabilization and recruitment structures accompanied with streamside fencing and planting. In addition to projects, the ONFC also provides assistance to Okanagan member bands. One example of assistance in the area of restoration work is the guidance provided to the Upper Nicola band in developing a proposal to complete riparian habitat work tha t will aid in increasing the quality of instream spawning habitat for Douglas Lake kokanee stocks.
In order to continue in the restoration of the Okanagan River and the restoration of anadromous salmon, there is a strong need for the transboundary relations. The Okanagan River is a transboundary system and there is a need to coordinate management between the various government agencies to ensure the continued survival of migratory stocks. There is great potential for significant benefits for stock management if habitat restoration and enhancement efforts are coordinated across the border. This includes building functional working relationships between the Canadian and U.S. governments, Aboriginal groups and hydro-producing companies.
The Okanagan Nation Fisheries Commission understands and incorporates aboriginal traditional knowledge in the management of environmental systems. The ONFC is involved in projects that look at restoring the environment and creating sustainability and including the people that are most affected by these resources. Okanagan traditional knowledge is relevant to the current ecosystem and approaches to fisheries management. Oral history provides a great deal of information such as where salmon should and shouldn’t be. However, more information needs to be acquired in order for ONFC to continue to integrate western science and traditional knowledge. There needs to be expanded research into more specific locations and times of year when species were harvested along with additional information on the species themselves. Further investigation is also needed in the area of language due to conflicting translations and name of species. There also is a need for expansion of traditional knowledge as it applies to the Upper Columbia regions and Arrow Lakes. Likewise, traditional knowledge regarding the Colville that is held in their archives, Bureau of Indian Affairs and other fisheries regulatory agencies needs to be explored. Lastly, there is a need to locate and identify private photograph collections.
20100226-5166 FERC PDF (Unofficial) 2/26/2010 4:21:25 PM

13
Works Cited American Rivers. 2002. Enloe. Available:
Http://www.amrivers.org/damremovaltoolkit/currenteffortsnorthwest.htm#enloe Atkinson, R.N. 1967. Historical Souvenir of Penticton, BC 1867-1967. Harris, J.G.,
ed., Penticton Branch of the Okanagan Historical Society, Penticton. Baker, J. 1990. Archaeological Research Concerning the origin of the Okanagan People. Pages
10-51 in Jean Webber and En’Owkin Centre, editors. Okanagan Sources. Theytus Books. Penticton, British Columbia.
Clemens, W.A., D.S. Rawson, and J.L. McHugh. 1939. A biological survey of Okangan Lake, British Columbia. Fisheries Research Board of Canada, Ottawa.
Cline, W., et. al. 1938. The Sinkaietk or Southern Okanagon of Washington. Spier, L., ed. George Banta Publishing Company, Menasha.
Department of Indian Affairs. 1890. Annual Report of the Department of Indian Affairs. Queen’s Printer, Ottawa. DuBrett, C. Personal Communication: Telephone interview by Adrienne Vedan, 21 May, 2002. Ernst, A. 2000. Aboriginal Fisheries Information within the Okanagan Basin. Vedan, A., ed. Okanagan Nation Fisheries Commission, Westbank. Gadgil, M. 2001. Traditional Resource Management Systems. Available:
http://ignca.nic.in/cd_08003.htm (Decemeber 2001). Harber, W.J. to Bostock, H., Department of Marine and Fisheries – Fishways – British Columbia. 1897. British Columbia Archives Part 1 Reel B11110 File 2908. Hewes, G.W. 1973. Indian Fisheries Productivity in Pre-Contact Times in the Pacific Salmon Area. Northwest Anthropological Research Notes 2 (2):133-154. Hewes, G.W. 1998. Fishing. Pages 620-640 in Walker, D.E., ed. Handbook of North American Indians; Smithsonian Institution; Plateau, Washington. Hudson, D.R. 1990. The Okanagan Indians of British Columbia. Pages 54-89 in Webber, J. and En’Owkin Centre, editors. Okanagan Sources. Theytus Books. Penticton. Irwin, A., Indian Agent to J. McLean, Secretary Department of Indian Affairs. 1898. Public Archives of Canada RG 10 Volume 3908 File 107, 297-1 Reel C-10159. Kennedy, D. and Bouchard, R. 1975. Utilization of Fish by Colville Okanagan Indian People. British Columbia Indian Language Project, Victoria. Klahowya. 2000. Kokanee Spawning. Videocassette. Lerman, N. 1974. Okanagan Ethnology. University of Washington, Seattle. Machin, D and Long, K. 2000. Kokanee Spawner Enumeration and Kokanee Habitat Characteristics of Equesis, Nashwito and Whiteman Creeks of Okanagan Lake. Okanagan Nation Fisheries Commission, Westbank. Maracle, L. et. al., editors. 1994. We Get Our Living Like Milk From the Land. Theytus Books, Penticton. Martinez, D. 2002. Traditional Environmental Knowledge. Available: http://www.uidaho.edu/e-journal/pan_eco/dennis.html (April 2002). Mourning Dove. 1990. A Salishan Autobiography. Miller, J., ed. University of Nebraska Press,Lincoln. Muir, R.J. and Rousseau, M.K. 1992. An Archaeological Impact Assessment for the proposed
Similkameen River Hydroelectric Project Near Princeton, South-Central BC. Similkameen Hydro-Power Ltd., Penticton.
20100226-5166 FERC PDF (Unofficial) 2/26/2010 4:21:25 PM

14
NSW Fisheries. 2002. Riparian Vegetation. Available: http://www.fisheries.nsw.gov.au/conservation/habitats/riparian_vegetation.htm (April 2002).
Okanagan Agency report of Gilbert Malcolm Sproat regarding inland fisheries. 1877. PublicArchives of Canada RG 10 Volume 7537 File 27, 150-8-14. Post, R.H. 1938. The Subsistence Quest. Spier, L., ed. The Sinkaietk or Southern Okanagon of Washington. George Banta Publishing Company, Menasha. Reserve Commission to J.C. Haynes. 1877. Public Archives of Canada RG 10 Volume 3641 file 7571,Reel C 10112. Robinson, H. 1989. Write it on Your Heart: The Epic World of An Okanagan Storeyteller. Wickwire, W., ed. Talonbooks, Vancouver. Teit, J. and Boas, F. 1973. The Salishan Tribes of the Western Plateaus. The Shorey Book Store, Seattle. Thomson, D. 1985. A History of the Okanagan: Indians and Whites in the Settlement Era, 1862-1920. Doctoral dissertation. University of British Columbia, Vancouver. Urban Systems. 1998. Traditional Land Use and Occupancy of the Okanagan Territory. Okanagan Nation Alliance, Westbank. White, L. 1967. The Historical Roots of Our Ecological Crisis. Science 155: 1203-1207. Wilson, Charles. 1970. Mapping the Frontier: Charles Wilson’s Diary of the survey of the 49th
parallel 1858-1862, while secretary of the British Boundary Commission. Stanley, G.F.G., ed. MacMillan of Canada, Toronto. Wilson, K. Back to the Furture? Watershed Talk. Available:
http://www.frafs.org/water_talk/2002/02_19_01.html (April 2002)
20100226-5166 FERC PDF (Unofficial) 2/26/2010 4:21:25 PM

15
Appendice 1 Season Location Species Scientific Name
Okanagan Lake Rainbow Trout (May) Oncoryhynchus mykiss Rainbow Trout (after March 26) Oncoryhynchus mykiss Six Mile Creek Spring salmon
Mission Creek Kokanee Oncoryhynchus nerka Inkaneep Creek Spring salmon Kokanee Oncoryhynchus nerka Okanagan Falls Suckers (April) Catostomus spp.
Deep Creek Kokanee Oncoryhynchus nerka Okanagan River Suckers (April) Catostomus spp. Eneas Creek Suckers Catostomus spp. Shingle Creek Rainbow Trout Oncoryhynchus mykiss Fish Lake Glimpse Lake Sapron Lake
Kokanee Oncoryhynchus nerka Trout
Douglas Lake
White fish Prospium spp. Salmon Lake (April) Peter Hope Lake Minnie Lake Nicola Lake Spahomin
Spring
Chaperon Lake Chinook (June) Oncorhynchus tshawytscha Okanagan River Scokeye Oncoryhynchus nerka
Whiteman's Creek Rainbow trout Oncoryhynchus mykiss Round Lake Rainbow trout Oncoryhynchus mykiss
Sockeye Kokanee Oncoryhynchus nerka Deep Creek Kokanee Oncoryhynchus nerka
Mission Creek Spring salmon Fish Lake Peter Hope Lake Glimpse Lake Minnie Lake Wasley lake
Summer
Salmon Lake Spahomin White fish Prospium spp. Douglas Lake Kokanee Oncoryhynchus nerka
Steelhead Oncorhynchus mykiss Coho Oncoryhynchus kisutch Sockeye Oncoryhynchus nerka
Okanagan River
Chinook Oncorhynchus tshawytscha
Fall
Whiteman's Creek Kokanee Oncoryhynchus nerka
20100226-5166 FERC PDF (Unofficial) 2/26/2010 4:21:25 PM

16
Six Mile Creek Kokanee Oncoryhynchus nerka Okanagan Lake Kokanee Oncoryhynchus nerka Kalamalka Lake Kokanee Oncoryhynchus nerka Irish Creek Kokanee Oncoryhynchus nerka Woods Lake Kokanee Oncoryhynchus nerka Mission Creek Kokanee Oncoryhynchus nerka Trout Creek Kokanee Oncoryhynchus nerka
Powers Creek Kokanee Oncoryhynchus nerka Okanagan Lake Burbot Lota lota Round Lake Burbot Lota lota Madeline Lake Burbot Lota lota Woods Lake Kokanee Oncoryhynchus nerka Sapron Lake Pikes Lake Minnie Lake Nicola Lake Douglas Lake Glimpse Lake Peter Hope Lake Salmon Lake Wasley Creek
Winter
Fish Lake
20100226-5166 FERC PDF (Unofficial) 2/26/2010 4:21:25 PM

17
Appendice 2 Glossary of Okanagan Words (Please note that these spellings are only phonetic)
Chaptikwl Stories set in a time before humans existed. These stories are about Coyote making natural laws and these are the laws that define what it means to be Okanagan. Kickinee Kokanee Na-tahx-ge-ah Large shore spawning kokanee Ntitiyix Chinook/King salmon Puk-pu-xee-ah White nosed kokanee that shore spawn Sen’k’lip Coyote Sk’elwis Old king salmon
20100226-5166 FERC PDF (Unofficial) 2/26/2010 4:21:25 PM
Paleolimnological Investigations in the Palmer Lake watershed, Okanogan County, WA
Phase #1 report
Jesse Ford Oregon State University
for Columbia River Intertribal Fish Commission
5 January 2010
20100226-5166 FERC PDF (Unofficial) 2/26/2010 4:21:25 PM

Phase #1 report 5 January 2010
Executive Summary
This paleolimnological study of the Palmer Lake watershed was undertaken to investigate
whether the Palmer Lake watershed may have supported anadromous salmonids prior to
the 1920 completion of Enloe Dam on its outlet, the Similkameen River. Two field
expeditions were made to the Palmer Lake system in fall of 2008 to
• initiate paleolimnological studies at Palmer Lake
• determine whether there were promising smaller lakes upstream of Palmer
Lake that combined likely salmonid habitat and reasonable logistic access,
and if so,
• initiate complementary paleolimnological studies at one or more of those
lakes.
Six surface sediment cores were taken from Palmer Lake of which two were suitable for
analysis. Five surface sediment cores were retrieved from the smaller upstream Blue
Lake Reservoir, which continued to drain to Palmer Lake via Sinlahekin Creek after the
1923 impoundment of the historic Blue Lake. Two of these cores were suitable for
analysis.
This report presents findings from initial analyses on one surface sediment core from
each lake. Cores were dated using the 210Pb method. Several standard analyses were
performed on contiguous 1-cm samples of bulk sediment: 1) loss-on-ignition studies to
determine organic and inorganic (carbonate) composition of the sediment matrix, 2)
analyses of the relative abundance (%) of carbon (C) and nitrogen (N) to determine the
general source of the sediment matrix (aquatic or terrestrial, based on C/N ratios), and 3)
analyses of the stable isotopes δ13C and δ 15N to shed light on within-lake processes and
sources of nitrogen, with particular emphasis on likely potential contributions of marine-
derived (heavy) nitrogen from anadromous salmonids.
The short (28 cm) surface core from Palmer is unremarkable, although there is a general
trend toward marginally higher δ13C and lower δ 15N signatures in sediments younger
than 1923. Overall, however, stratigraphic changes within the core are at best subtle, even
1
20100226-5166 FERC PDF (Unofficial) 2/26/2010 4:21:25 PM

Phase #1 report 5 January 2010
across the 1923 horizon (21-22 cm) that marks closure of the Enloe Dam on the
downstream Similkameen River. It is important to note, however, that this core only
barely penetrates the damming horizon. A longer core would help reveal whether there is
evidence of potential occurrence of anadromous salmonids earlier in watershed history.
The record from the linked upstream Blue Lake is more revealing. In its upper sections,
Blue Lake has a much slower sedimentation rate than Palmer Lake; at Blue Lake, the date
of 1924 occurs at 8-9 cm. Thus, the entire 46 cm core may be several hundred years old,
well beyond the range of 210Pb dating. There is a good deal of stratigraphic detail in the
Blue Lake core. In particular, post-dam δ15N signatures are decidedly lower than values
on much of the older underlying sediments.
Further paleolimnological studies are recommended in order to probe these initial
findings. These include:
• analysis of additional cores on hand from both Blue and Palmer Lakes
• acquisition of AMS 14C dates on macrofossils (if any) from Blue Lake core
BL04-02
• further analysis of Blue Lake core BL04-02 focusing on biological remains
• retrieval and analysis of one or more longer cores from Palmer Lake itself
• retrieval and analysis of cores from other linked upstream lakes in the Palmer
Lake watershed
This combination of analyses would (1) determine whether initial results can be
replicated, (2) establish a timeline for observed stratigraphic changes in BL04-02, and (3)
test predictions of expected changes in biological communities that should be associated
with changing nutrient status and grazing pressure associated under conditions of
changing salmonid dynamics. If these lines of evidence combine to provide additional
support for the hypothesis of historical use of the Palmer Lake watershed by anadromous
salmonids, additional cores would be useful to develop a landscape-scale understanding
of salmon use of this watershed.
2
20100226-5166 FERC PDF (Unofficial) 2/26/2010 4:21:25 PM

Phase #1 report 5 January 2010
Table of Contents
Introduction....................................................................................................................... 4 Site Description ................................................................................................................. 5 Methods.............................................................................................................................. 6
Field work ....................................................................................................................... 6 Laboratory analyses........................................................................................................ 7
Results .............................................................................................................................. 10 Water chemistry ............................................................................................................ 10 Radiometric dating........................................................................................................ 11 Loss-on-ignition ............................................................................................................ 12 Carbon and nitrogen..................................................................................................... 12 Stable isotopes .............................................................................................................. 13 Studies in progress ........................................................................................................ 13
Discussion......................................................................................................................... 13 Conclusion ....................................................................................................................... 16 Acknowledgements ......................................................................................................... 16 References ........................................................................................................................ 18 Tables
Table 1. Log of sediment cores, Palmer and Blue Lakes............................................. 19 Table 2. Water chemistry data, Palmer and Blue Lakes .............................................. 20 Table 3. OSU SIRU accuracy and precision results on C, N, δ15N and δ13C............... 21 Table 4. Age models: Palmer Lake (PL08-04) and Blue Lake (BL08-02) .................. 23
Figures
Figure 1. Natural falls on the Similkameen River prior to Enloe Dam ....................... 24 Figure 2. Enloe Dam on the Similkameen River ......................................................... 25 Figure 3. Location, bathymetry, and coring sites, Palmer and Blue Lakes ................. 26 Figure 4. Palmer Lake PL08-04: Total 210Pb and 226Ra activity.................................. 27 Figure 5. Blue Lake core BL08-02: Total 210Pb activity.............................................. 28 Figure 6. Palmer Lake core PL08-04: age vs. depth.................................................... 29 Figure 7. Blue Lake core BL08-02: age vs. depth ....................................................... 30 Figure 8. Palmer Lake (PL08-04) loss-on-ignition..................................................... 31 Figure 9. Blue Lake (BL08-02) loss-on-ignition ........................................................ 32 Figure 10. Palmer Lake core PL08-04: % carbon, % nitrogen, and C/N ratio ........... 33 Figure 11. Blue Lake core BL08-02: % carbon, % nitrogen, and C/N ratio............... 34 Figure 12. Palmer Lake core PL08-04: δ13C and δ15N ................................................ 35 Figure 13. Blue Lake core BL08-02: δ13C and δ15N.................................................... 36
3
20100226-5166 FERC PDF (Unofficial) 2/26/2010 4:21:25 PM

Phase #1 report 5 January 2010
Introduction There is currently no empirical evidence regarding whether the Palmer Lake watershed
supported anadromous salmonids prior to the 1920 completion of Enloe Dam on its
outlet, the Similkameen River. Understanding this issue is of particular interest to the
Columbia River Intertribal Fish Commission because the Okanogan County Public
Utility District (PUD) is in the final phases of a relicensing application for a Federal
Energy Regulatory Commission (FERC) to restore the Enloe Hydroelectric Project (EHP)
on the Similkameen River. This is the third attempt to relicense the project since the
powerhouse was decommissioned in 1959. The dam was originally relicensed in 1983,
but the license was rescinded in 1986 due to concerns about fish passage. FERC issued
another license in 1992, which was rescinded in 2000 after the National Marine Fisheries
Service required the installation of fish ladders, which the PUD considered too expensive
to be cost-effective.
The proposed EHP would entail developing a small hydropower plant just below the
existing dam, about 3.5 miles northwest of Oroville. The current concrete dam is 54 feet
high and 315 feet long. At the same time, there is a proposal to install a second,
significantly larger, water retention and hydroelectric dam upstream of Enloe Dam at
Shanker’s Bend (~river mile 7.3) (www.okanoganpud.org/shankers/shankersmain.htm).
The Shanker’s Bend Project is studying various alternatives including dam heights
ranging from 90 to 260 feet. At the maximum height the dam would be about 1,200 feet
long and impound an 18,000 acre reservoir with a storage capacity of ~1.7 million acre-
feet (www.okanoganpud.org/shankers/shankersmain.htm).
At issue is whether the 20 foot Similkameen Falls (Figure 1) in fact posed an historical
barrier to upriver salmonid passage prior to the construction of the original Enloe Dam
(Figure 2). In order to investigate this question, the Columbia River Intertribal Fish
Commission commissioned a study in fall 2008 to use paleolimnological approaches to
investigate whether anadromous salmonids may have used the Palmer Lake watershed
prior to construction of the Enloe Dam. This Phase #1 report summarizes initial findings
from that study.
4
20100226-5166 FERC PDF (Unofficial) 2/26/2010 4:21:25 PM

Phase #1 report 5 January 2010
Site Description Palmer Lake is a natural kidney-shaped lake about 3.5 miles long located four miles north
of Loomis, WA in a region that straddles the Northern Rocky Mountain and Okanogan
Highland ecoregions. It is situation in the arid Okanogan Valley; records compiled over
the period 1939-1969 indicate annual precipitation less than 20 inches of which less than
seven inches falls during the April-September growing season (Walters 1974).
The lake itself is located at an elevation of 1145 feet, with an area of about 2063 acres
and a maximum depth of 91 feet (Wolcott 1964). It has one outlet to the north, Palmer
Creek, which flows downstream to the Okanogan via the Similkameen River. Under
flood conditions, the flow of Palmer Creek can reverse and cause Palmer Lake to
temporarily store water from the Similkameen River (Walters 1974).
Field reconnaissance in September 2008 identified Blue Lake Reservoir as the most
promising linked lake upstream of Palmer Lake for complementary paleolimnological
studies of Palmer Lake itself. Blue Lake Reservoir (henceforth: Blue Lake) drains to
Palmer Lake via Sinlahekin Creek. It is small, deep enough to stratify, has good road
access, and can reasonably be expected to have provided likely salmonid habitat prior to
damming. The dam on the outlet of Blue Lake was erected in 1923 (three years after the
Enloe Dam on the Similkameen) as part of an irrigation diversion project to support
agricultural operations at the north end of the lake (Wolcott 1964; Dale Swedberg,
Sinlahekin Wildlife Refuge, pers. comm. October 2008 and December 2009). This dam
created an artificial reservoir that inundated three original lakes (Blue Lake (108 acres),
Long Lake (46 acres) and Round Lake (12.5 acres)) to create a single lake with three
basins. Blue Lake is located at an elevation of 1686 feet, with a current surface area of
about 186 acres. Maximum depth is given as 69 feet in Wolcott (1964), and as 114 feet
in Walker (1974).
5
20100226-5166 FERC PDF (Unofficial) 2/26/2010 4:21:25 PM

Phase #1 report 5 January 2010
Methods Field work
Two field expeditions were made to the Palmer Lake system in fall of 2008 (11-15 Sept
and 6-12 October). During the September 2008 trip, two short (< 30 cm) surface sediment
cores were retrieved from Palmer Lake using a hand-operated Kajak-Brinkhurst gravity
corer tripped by messenger. Cores were taken at one primary coring location with the
coring raft repositioned between drives. The margin of Palmer Lake was cruised using
the outboard-driven Chopaka Lodge dory, in part to observe the nature of inlets and the
complex Similkameen outlet. Field reconnaissance was undertaken to identify one or
more small target lakes upstream of Palmer Lake for further paleolimnological studies.
Blue Lake was selected for this purpose (see Site Description).
In October 2008, four additional surface sediment cores were obtained from Palmer Lake
using a lightweight 6.5 cm diameter gravity corer with various combinations of 10 lb
weights and a 10 lb hammer. The apparatus was deployed from a wooden coring raft
mounted on two inflatable Zodiac boats powered by a 4 hp outboard motor, and sediment
cores were retrieved using an electric winch. Cores were taken at two primary coring
locations, with the coring raft repositioned between drives. Weather conditions
complicated core recovery, and only one short (28 cm) core was retained for analysis. All
Palmer Lake cores from both expeditions were acquired from the northern basin due to
wind and weather conditions.
Five cores were retrieved from Blue Lake during the October 2008 expedition, of which
two were retained. Cores were taken at two primary coring locations, with the coring raft
repositioned between drives at the four shallower water locations.
All cores were sectioned in the field at 1 cm intervals within 48 hours, packaged into
Whirlpak™ bags, and stored at 4˚C in a dedicated cold room at Oregon State University.
Coordinates for coring locations at Palmer and Blue Lakes were acquired using a
handheld Garmin GPS unit. Coordinates are given in Table 1 together with date of core
6
20100226-5166 FERC PDF (Unofficial) 2/26/2010 4:21:25 PM

Phase #1 report 5 January 2010
acquisition, water depth at the coring location, and length of the sediment column
retrieved.
Figure 3 displays coring locations against bathymetric data from GIS files archived on
the State of Washington Department of Ecology (WDOE) website
(http://www.ecy.wa.gov/services/gis/data/data.htm). There are slight discrepancies between
water depths found in the field for and water depths estimated from GIS contour intervals
in the WDOE files. The actual water depth in which Palmer Lake cores PL08-03 and
PL08-04 were taken is slightly shallower than appears in Figure 3 (~66.4 vs 70-80 feet),
and the actual water depth in which Blue Lake cores BL08-01 through BL08-04 were
taken is slightly deeper than appears in Figure 3 (~62.7 vs. 50-55 feet). In general,
however, correspondence is quite good.
Basic water chemistry data was obtained from Palmer and Blue Lakes using a YSI-85
multimeter with the probe deployed at 1 meter, and a standard Secchi disk. Deep-water
samples were retrieved from both Palmer Lake (~20 m) and Blue Lake (18.25 m) using a
horizontal Van Dorn sampler. Analysis of these deeper water samples was performed
either from the coring raft (Blue Lake) or (due to weather conditions) later the same
evening (Palmer Lake).
Laboratory analyses
Funds for limited laboratory analysis became available in spring 2009. The initial focus
was on Palmer Lake core PL08-04. After results from this core were analyzed, it seemed
prudent to analyze sediments from Blue Lake as well. Core BL08-02 was chosen rather
than BL08-05 even though it was taken in shallower water (Figure 3) because it was a
longer core (48 vs. 30 cm). To date, one core from each lake has been dated by 210Pb and
initially analyzed for organic matter, carbonates, carbon, nitrogen, and the stable isotopes
δ15N and δ13C.
7
20100226-5166 FERC PDF (Unofficial) 2/26/2010 4:21:25 PM

Phase #1 report 5 January 2010
210Pb dating. Cores were analyzed for 210Pb by Flett Research Ltd using alpha
spectroscopy on 210Po (the granddaughter of 210Pb). Methods followed Eakins and
Morrison (1978).
For the Palmer Lake core, it was initially unclear whether or not background values of 210Pb had been reached at the base of the core. Accordingly this core was rerun, with
selected intervals also analyzed for 226Ra (8 -9 cm 16-17 cm, and 27–28 cm). Activities
of 210Pb and 226Ra in the 27-28 cm increment (only) are similar, indicating that
background levels of 210Pb had been achieved in this region of the core (Figure 4). Net
unsupported 210Pb was calculated by subtracting the nearest neighbor 226R measurement
from each total 210Pb value.
The Blue Lake core (BL08-02) gave simpler results that did not require 226Ra analyses.
The shape of the curve shows an orderly downcore exponential decrease, and background
levels were achieved well within the set of samples submitted for dating (Figure 5).
Age estimates calculated by Flett Research Ltd. used two approaches. The regression
model assumes a constant rate of input of both 210Pb and sediment. These assumptions
are approximately satisfied for the Palmer Lake core in the interval 3-18 cm and the Blue
Lake core in the interval 0-3; the model was therefore applied in this interval to estimate
sediment accumulation rates (SAR). This SAR estimate is used to verify the constant rate
of supply (CRS) model (Oldfield and Appleby, 1984, Appleby and Oldfield 1978). Over
the intervals analyzed (the only ranges in which comparison is possible) the CRS and
regression models predict very similar sedimentation rates, which suggest that the CRS
model is functioning correctly. In general, the CRS model is preferred for age models,
because it can provide valid predictions over the entire length of the modeled core, even
though the sediment accumulation rate is changing with time. The CRS model assumes
constant input of 210Pb and a core that is long enough to include all the measurable
atmospheric sources of 210Pb. For the Palmer Lake core, if one assumes that the 210Pb
activity in the 27-28 cm increment is the background level (an assumption supported by 226Ra results), the CRS model can be applied. For the Blue Lake core, there are no issues
8
20100226-5166 FERC PDF (Unofficial) 2/26/2010 4:21:25 PM

Phase #1 report 5 January 2010
that might interfere with the CRS model. Consequently, the CRS model is used for age
estimates on both cores in this report.
Loss on ignition. Contiguous samples of both cores were analyzed for water content, dry
density, and low (550±5ºC) and high (950±5°C) temperature loss-on-ignition (proxies for
organic matter and inorganic (carbonate) carbon, respectively) (Dean 1974). Subsamples
were weighed, dried for a minimum of 24 hours using a programmable Fisher Isotemp
oven at 100±1ºC, reweighed, and ashed for a minimum of 1.5 hours at 550±5ºC in a
muffle furnace with a digital temperature display and thermostatic temperature control.
After cooling and weighing, samples were re-ashed for a minimum of 1.5 hour at
950±5°C to determine percent inorganic carbon as carbonates (Dean 1974). Note that
analyses on BL08-02 are not yet complete; the bottom seven cm have not yet been
analyzed.
Carbon (C), nitrogen (N), and δ15N and δ13C stable isotopes. Samples were analyzed for
stable isotopes by the Stable Isotope Research Unit (SIRU), Dept. Crop and Soil Science,
Oregon State University. Water was removed from the wet samples by gentle oven-
heating at 45-50ºC. About 1 cc of the dry material was ground to a fine powder
consistency using a Bio101 FastPrep FP120 ceramic-bead beater. Approximately 25 mg
of ground material was weighed to three decimal places into tared 8x5 mm silver
capsules and the sample weights obtained using a Cahn C-31 microbalance.
In order to determine percent organic carbon as well as the δ13C signature of organic
carbon, inorganic carbonates must be removed. The procedure followed here is an acid
(HCl) fumigation rather than aqueous treatment by HCl, as some studies find that
aqueous HCl treatment can lead to underestimates of % organic carbon and occasionally
inaccurate δ13C signatures on organic carbon (Komada et al. 2008). Fumigation
decreases loss of water soluble carbon (Harris et al. 2001).
Fifty μL of a 1% (v/v) solution of HCl was added to each capsule and open capsules
incubated for eight hours in a closed desiccator with a beaker containing 50 mL of
9
20100226-5166 FERC PDF (Unofficial) 2/26/2010 4:21:25 PM
Phase #1 report 5 January 2010
concentrated HCl. Fumigated samples were redried at 45-50ºC, and the silver capsules
sealed and packaged into secondary 12x5 mm tin capsules.
Samples were analyzed in June 2009 (Palmer Lake) and December 2009 (Blue Lake) for
C, N, δ15N and δ13C on a PDZ Europa 20-20 isotope ratio mass spectrometer (IRMS)
(SerCon, Crewe, GB) interfaced with a PDZ Europa RoboPrep elemental analyzer
(EA/IRMS). Stable isotope ratios are reported in delta notation as parts per thousand (per
mille) deviation from the international standards V-PDB (carbon) and Air (nitrogen).
Typical precision for the SIRU IRMS is <0.3 per mille for δ15N and <0.2 per mille for
δ13C. Total C (mg) and N (μg) were measured after HCl fumigation to remove
carbonates; %C (presumed to be organic C) and %N values are reported based on the
original (prefumigated) sample mass.
The SIRU laboratory standard is NIST SRM1547 peach leaves (2.94% N, 15N AIR 1.98;
45.54% C, 13C VPDB -25.99). To correct for possible drift in the EA/IRMS combination
with time, drift correction standards of the equal mass were run every 10 samples. As a
check for linearity, 10 variable weight standards were run in each analysis. Additional
standards were run as dummy samples for every 10 samples. In addition, SIRU
periodically analyzes NIST SRM1547 peach leaves against a standard certified for C, N, 13C, and 15N (Elemental Microanalysis B2157 wheat flour, batch no. 2823) that has been
calibrated against IAEA-CH-6 for carbon and IAEA-N-1 for nitrogen. The most recent
analyses were in February 2009 and showed excellent accuracy and precision (Table 3).
Results Water chemistry
Water chemistry data taken in the field are given in Table 2. Dissolved oxygen values in
the deep water sample (~20 m) from Palmer Lake indicate that the lake was still stratified
on October 9, 2008. Specific conductance values from the deep water sample (18.25 m)
from Blue Lake also suggest stratification, although dissolved oxygen was not measured
(data were acquired on the stored water sample several hours after collection).
10
20100226-5166 FERC PDF (Unofficial) 2/26/2010 4:21:25 PM

Phase #1 report 5 January 2010
Radiometric dating
The Palmer Lake core shows an irregular but approximately exponential decrease in 210Pb
activity in the region 3-28 cm with a maximum activity of 5.61 DPM/g in the 3-4 cm
increment (Figure 4). In theory, highest 210Pb activities should be found in the most
surficial sediments; a more or less homogeneous signal in the top few centimeters
suggests some mixing in this region. Age estimates using the CRS model are summarized
in Table 4, and age-depth relationships are displayed in Figure 6.
The Blue Lake core shows an approximately exponential decrease in 210Pb activity as a
function of depth with maximum activity (16.37 DPM/g) in the 0-1 cm increment. The
exponential part of the curve extends to the 13-14 cm increment, where the lowest
activity (1.20 DPM/g) is found. The shape of the 210Pb activity profile indicates that
background activity levels were attained in the 12-13 cm increment (Figure 5). Downcore
of this, activities are slightly irregular, most likely due to slight irregularities in
supporting 226Ra. Age estimates using the CRS model are summarized in Table 4, and
age-depth relationships are displayed in Figure 7.
Radiometric dating results on both PL08-04 and BL08-02 are acceptable; both cores can
be confidently dated back to the 1920s. Dates older than this exceed four 210Pb half-lives
and so must be considered only coarse approximations.
Table 4 demonstrates that sedimentation rates are much slower at the Blue Lake coring
location than at the Palmer Lake coring location; dates in the early 1920s are achieved in
the 21-22 cm increment at Palmer Lake but in the 8-9 cm increment at Blue Lake. The
slow sedimentation rate at Blue Lake is somewhat surprising, but may be related in part
to the shoreward position from which the Blue Lake core was obtained (Figure 3). This
site (BL08-02) may serve as a sediment source to deeper water locations during spring
and/or fall turnover. If this is so, faster sedimentation rates with better temporal
resolution would be expected in core BL08-05, were it to be analyzed. If sedimentation
rates were relatively constant throughout these two cores, the Palmer Lake core would
date back to the late 1800s and the Blue Lake core to the early 1600s.
11
20100226-5166 FERC PDF (Unofficial) 2/26/2010 4:21:25 PM

Phase #1 report 5 January 2010
Loss-on-ignition Both high and low temperature loss-on-ignition results for Palmer Lake PL08-04 are
unremarkable (Figure 8). Organic matter is in the range 10-12%, and inorganic carbon in
the range of 2-4%. There is no evidence of significant carbonate deposition or of lenses
particularly rich in either organic or inorganic matter. The samples above the closing of
Enloe Dam in 1920 are not distinguishable from pre-dam samples.
Results from Blue Lake BL08-02 have slightly higher organic matter content in the early
1970s (12-14%) relative to underlying sediments ( 4-34 cm: 8-10%). Increments below
this region are markedly higher in organic matter (35-38 cm: 13-20%); the bottommost 7
cm (39-46 cm) have not yet been analyzed. As at Palmer Lake, inorganic carbon is in the
range of 2-4% through the 28-29 cm increment; below this, however, carbonate
deposition appears to be occurring. Around the period of dam construction the Blue Lake
sequence is generally similar to that found in the Palmer Lake core, as there is little
stratigraphy in this region of either core.
Carbon and nitrogen
The %C, %N, and C/N ratios from the Palmer Lake core are generally unremarkable. As
with the LOI data, the samples above the closing of Enloe Dam in 1920 are not
distinguishable in any way from the pre-dam samples. The low C/N ratios reflect
primarily algal rather than terrestrial sources of organic matter.
The %C, %N, and C/N ratios from the Blue Lake core are also generally unremarkable,
with samples above dam closure not distinguishable from pre-dam samples. The C/N
ratios are higher than those from Palmer Lake, indicating more terrestrial influence,
which is not surprising considering the smaller size of the Blue Lake basin. The meaning
of the excursion at 33 cm needs to be further investigated. It may be an analytical error,
or it may represent a lens of terrestrial input.
12
20100226-5166 FERC PDF (Unofficial) 2/26/2010 4:21:25 PM

Phase #1 report 5 January 2010
Stable isotopes
The Palmer Lake core has a narrow range of values for both δ15N (3-4 ‰) and δ13C
(-30.0 to -31.5 ‰). Values of δ15N decline very slightly since 1923, from a pre-1923
mean of about 3.7‰ to a low of 2.92 ‰ in 1982, before increasing slightly since about
1998 to about 3.3 ‰.Values of δ13C increase slightly after 1970 from a mean of about
-31.1 ‰ to a mean of about -30.5 ‰.
The situation at Blue Lake is similar to that at Palmer Lake in the time immediately
around dam construction, with relatively narrow ranges of both δ15N (1.5-4.0 ‰) and
δ13C (-27 to -29 ‰). In the Blue Lake core, both analytes generally decline slightly from
the pre-dam through the post-dam portions of the record. Deeper sections of this core,
however, provide a different picture, with a much broader range of both δ15N (1-10 ‰)
and δ13C (-28 to -22 ‰). Sediments in the region 11-37 cm are relatively rich in δ15N
(mean = 5.04 ‰), although the δ13C signal is stable. Below this level, δ15N declines and
δ13C increases.
Studies in progress
Studies still in progress include completion of basal loss-on-ignition analyses, quality
assurance of carbon, nitrogen, and stable isotope data, and intercomparison of results
from the fumigation methodology used by SIRU vs aqueous extraction used in previous
studies at Wapato Lake (Chelan Co, WA) by University of Alaska-Fairbanks
Discussion The Palmer Lake PL08-04 core captures the period following the closing of Enloe Dam,
but probably does not to go back further than the mid to late1800s. The history contained
in the PL08-04 is unremarkable, and does not vary in the immediate proximity of the
horizon in which the Enloe Dam came on line. Acquisition of longer cores from Palmer
Lake with older sediments might shed a different perspective on this history. Effort might
usefully be directed to the southern part of the basin, particularly near the inlet from
Sinlahekin Creek where spawning salmon may have lingered in their run up into the inlet
creek and on up into Blue Lake.
13
20100226-5166 FERC PDF (Unofficial) 2/26/2010 4:21:25 PM

Phase #1 report 5 January 2010
Results from the Blue Lake BL08-02 core are more interesting. As at Palmer Lake, the
history in the immediate proximity of the horizon in which the Enloe (and Blue Lake)
dams came on line is unremarkable. However, the record at Blue Lake is substantially
longer, and may represent a sediment archive of three to four centuries of information.
Given that Blue Lake is a small lake in rugged terrain, it is not surprising that C/N ratios
suggest a higher proportion of terrestrially-derived sedimentary carbon than at Palmer
Lake. Deeper sediments reflect carbonate deposition, although this is not a centrally
located core and carbonate stratigraphy can be complex in small basins (Wetzel 1970). A
long period of relatively enriched δ15N in the range of 4-6‰ ended sometime in the
1800s, prior to construction of the Enloe (and Blue Lake) dam(s). The enrichment period
is consistent with the possibility of presence of anadromous salmonids. Explanations of
sedimentary δ15N enrichment related to pollution and/or eutrophication are unlikely both
because the period of δ15N enrichment precedes settlement by EuroAmericans, and
because total nitrogen values are quite low (<1%).
Although the δ15N findings are tantalizing with respect to the possibility of anadromous
salmonids in the Palmer Lake watershed, it is unwise to rest paleoenvironmental
reconstructions on single proxies, particularly geochemical proxies that are endproducts
of a diversity of inputs mediated by a diversity of in-lake processes. Further investigation
should be made using independent lines of paleolimnological evidence to see if there are
patterns that are consistent with the waxing and waning salmon runs (and carcass
deposition) suggested in the Blue Lake δ15N record.
Recommended future studies include (1) additional studies on cores currently on hand
(AMS 14C dating and (quantities and preservation permitting) analysis of biological
proxies), (2) retrieval and analysis of one or more longer cores from Palmer Lake in order
to investigate whether the earlier history seen at Blue Lake echoes findings from the
significantly larger Palmer Lake, and (3) core retrieval and analysis from additional
linked upstream lakes in the Palmer Lake watershed. Specific recommendations include:
14
20100226-5166 FERC PDF (Unofficial) 2/26/2010 4:21:25 PM

Phase #1 report 5 January 2010
• analysis of second cores on hand from both Blue and Palmer Lakes for
proxies discussed in this report, in order to see whether these initial results can
be replicated
• acquisition of AMS 14C dates on macrofossils (if any) from Blue Lake core
BL04-02, in order to establish the temporal dimensions of observed
stratigraphic changes, particularly the changes in δ15N
• further analysis of Blue Lake core BL04-02 focusing on biological remains,
particularly diatom and zooplankton remains, possibly augmented by whole
sediment and (preservation permitting) pigment analysis. Diatom communities
would be expected to respond to changing water chemistry if large changes in
inputs of spawned-out salmon carcasses occurred. Similarly, zooplankton
communities would be expected to respond if large changes in juvenile
feeding occurred prior to outmigration (e.g., by sockeye salmon (Oncorhyncus
nerka)). Finally, both whole sediment and pigment analysis can give a general
insights into the composition of soft algae that do not preserve well but would
be expected to change in response to changing nutrient status and grazing
pressure associated with changing in salmonid dynamics. Whole sediment
analysis can also provide insight into soft zooplankton that do not preserve
well in lake sediments
• retrieval and analysis of one or more longer cores from Palmer Lake itself, in
order to determine whether there are downcore stratigraphic patterns that
complement those found at Blue Lake, and what the paleolimnological record
can reveal about historical limnology in these two linked water bodies. Due to
the size and weather conditions at Palmer Lake, a winter expedition might
provide the most successful approach
• retrieval and analysis of cores from other linked upstream lakes in the Palmer
Lake watershed to improve our understanding of the spatial dimensions of
possible pre-dam historical anadromy in the Palmer Lake watershed. Such
sites might include, for example, Chopaka Lake (although this has very poor
road access, and thus would probably best be attempted in summer), as well as
15
20100226-5166 FERC PDF (Unofficial) 2/26/2010 4:21:25 PM

Phase #1 report 5 January 2010
the oxbow lakes north of Palmer Lake (northwest of Champney’s Slough), at
least one of which appears to be accessible by road
Conclusion Although the short surface core from Palmer Lake (PL08-04) is unremarkable, it may be
too short to fully address the issue of whether there was historical use of Palmer Lake by
anadromous salmonids. By contrast, the record from the linked upstream Blue Lake (core
BL08-02) is longer and provides tantalizing results suggesting historic use of Blue Lake
by anadromous salmonids. Although there is little stratigraphic change in immediate
temporal proximity to dam construction, post-dam δ15N signatures are substantially lower
than values for the bulk of the Blue Lake record, most of which is undated but enriched in
δ15N. Sediment enrichment in δ15N is often taken as a proxy for anadromous salmonids.
The Blue Lake stratigraphy suggests that, if one accepts this preliminary interpretation,
one must also note that declines began before (perhaps well before) dam construction.
A series of further studies is recommended on sediment cores from the Palmer Lake
watershed currently on hand, to the extent that remaining sediment volume and
preservation allow. These studies would be usefully augmented by analysis of additional
sediment cores from the south end of Palmer Lake, as well as from other small linked
upstream water bodies in the Palmer Lake watershed.
Acknowledgements Dale Swedberg (Sinlahekin Wildlife Refuge) continues to be a fount of information on
the entire Palmer Lake watershed, having spent years perusing local archives and
conversing with local residents. Invaluable field assistance from Dr. Lisa Carlson
(Centralia Community College), Mer Wiren, and Jaarvi Kolonen made sediment
acquisition possible. Cathleen Rose assisted with loss-on-ignition studies. Lara Scott
applied her GIS skills to make the maps of Palmer and Blue lakes from GPS data coupled
with on-line files. Timely, high-quality data produced by colleagues Dr. Robert Flett and
Xiaoxi Hu (Flett Research, Ltd) and Rockie Yarwood (Stable Isotope Research Unit,
16
20100226-5166 FERC PDF (Unofficial) 2/26/2010 4:21:25 PM

Phase #1 report 5 January 2010
Dept. Crop and Soil Science, Oregon State University) is greatly appreciated. This
research was funded by the Columbia River Intertribal Fish Commission.
17
20100226-5166 FERC PDF (Unofficial) 2/26/2010 4:21:25 PM

Phase #1 report 5 January 2010
References Dean, W.E. Jr. 1974. Determination of carbonate and organic matter in calcareous
sediments and sedimentary rocks by loss on ignition: comparison with other methods.
J. Sed. Petrol. 44:242-248.
Komada, T., M.R. Anderson, and C.L. Dorfmeier. 2008. Carbonate removal from coastal
sediments for the determination of organic carbon and its isotopic signatures, δ13C and
Δ14C: comparison of fumigation and direct acidification by hydrochloric acid. Limnol.
Oceanogr: Methods 6:254-262.
Harris, D., W.R. Horwáth, and C. van Kessel. 2001. Acid fumigation of soils to remove
carbonates prior to total organic carbon or carbon-13 isotopic analysis. Soil Sci. Soc. Am.
J. 65:1853-1856.
Walters, K. 1974. Water in the Okanogan River Basin, Washington. Water-Supply
Bulletin 34. State of Washington, Dept. of Ecology. 164 pps.
Wetzel, R.G. 1970. Recent and Postglacial Production Rates of a Marl Lake. Limnology
and Oceanography 15:491-503.
Wolcott, E. 1964. Lakes of Washington. Volume II. Eastern Washington. Second Edition.
18
20100226-5166 FERC PDF (Unofficial) 2/26/2010 4:21:25 PM

Phase #1 report 5 January 2010
Table 1. Log of sediment cores, Palmer and Blue Lakes Date Core Site Position Core
length Water depth
Coring Comments
9/13/08 PL08-01 Palmer Lake
N48.91123 W119.63267
24 cm 18.6 m Lost some basal sediment before capping
9/13/08 PL080-02 Palmer Lake
N48.91125 W119.63254
30 cm ND*
10/10/08
PL08-03
Palmer Lake
N48.90952 W119.62686
28 cm
20.4
Bottom is water; bubbles rose and mixed the sediment. Core discarded
10/10/08
PL08-04
Palmer Lake
N48.90956 W119.62701
28 cm
ND*
Corer appeared to begin to penetrate a dense underlying layer. Lost some basal sediment during capping of bottom while broadside to whitecaps.
10/11/08
PL08-05
Palmer Lake
N48.91058 W119.63024
NM
19.5 m
Core hard to hammer. Bottom is water; bubbles rose and mixed the sediment. Core discarded
10/11/08
PL08-06
Palmer Lake
N48.91060 W119.63029
23 cm
19.5 m
Some mixing; retained for possible archive although should not be analyzed.
10/7/08 BL08-01 Blue Lake
N48.68557 W119.68973
47 cm 19.1 m Discarded
10/7/08 BL08-02 Blue Lake
N48.68557 W119.68946
48 cm 19.1 m Penetrated tan layer at about ~35 cm. Extruded depth 46 cm
10/7/08 BL08-03 Blue Lake
N48.68554 W119.68972
NM 19.1 m Water at bottom of core. Discarded
10/7/08 BL08-04 Blue Lake
N48.68571 W119.68987
40 cm 19.1 m Lost core
10/8/08 BL08-05 Blue Lake
N48.68601 W119.69115
30 cm 20.8 m
ND* = No data due to depth finder malfunction, but core taken close to previous core NM = Not measured BOLD = core discussed in this report
19
20100226-5166 FERC PDF (Unofficial) 2/26/2010 4:21:25 PM

Phase #1 report 5 January 2010
Table 2. Water chemistry data, Palmer and Blue Lakes Data acquired on October 7, 2008 (Blue Lake) and October 9, 2008 (Palmer Lake).
Palmer Lake
Palmer Lake
Blue Lake
Blue Lake
Water depth ~ 1 m ~ 20 m ~ 1 m 18.25 m Temperature (˚C) 14.0 ND 14.2 11.91 Dissolved O2 (mg/l)
9.2 0.52 8.4 ND1
O2 saturation (%) 89 4.1 81 ND1 Salinity (ppt) 0.1 0.1 0.1 ND Specific conductance (μS cm-1)
203
257.3
223
293
Secchi depth (m)
5.5
NA
5.5 (10/7/08) 4.6 (10/8/08)
NA
1Van Dorn water sample analyzed later that day; water temperature does not reflect ambient conditions; O2 would not reflect ambient conditions ND = Not determined NA = Not applicable
20
20100226-5166 FERC PDF (Unofficial) 2/26/2010 4:21:25 PM
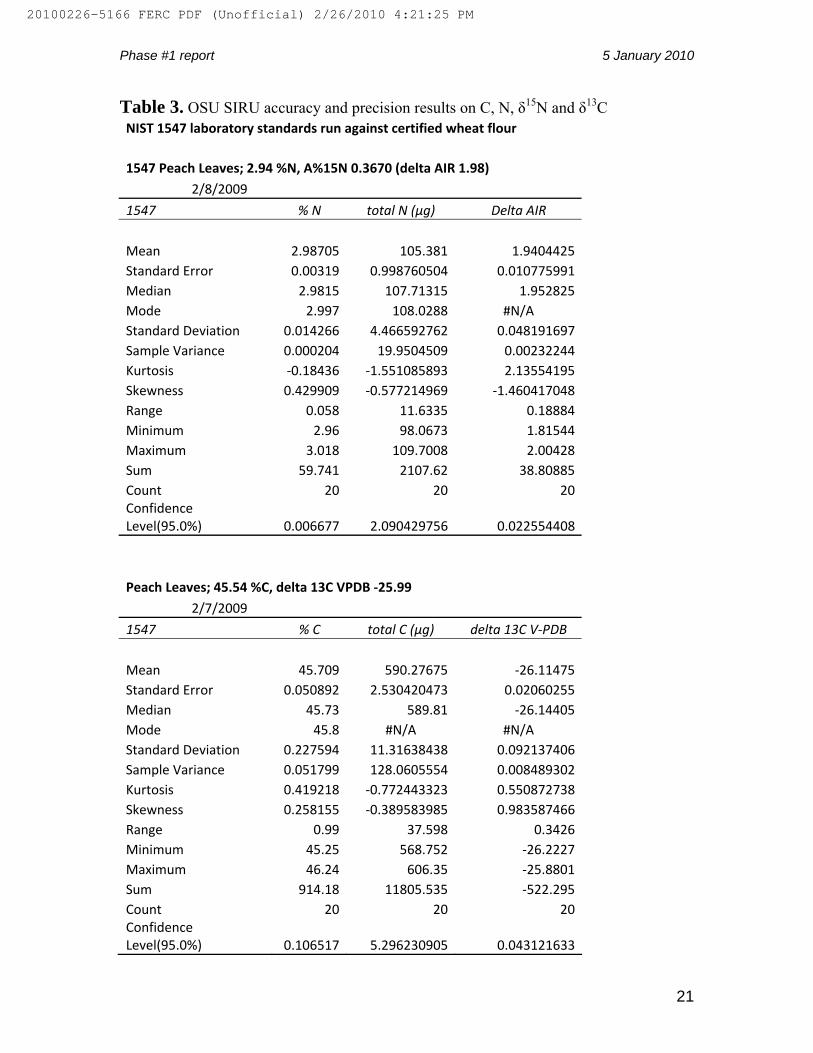
Phase #1 report 5 January 2010
Table 3. OSU SIRU accuracy and precision results on C, N, δ15N and δ13C NIST 1547 laboratory standards run against certified wheat flour 1547 Peach Leaves; 2.94 %N, A%15N 0.3670 (delta AIR 1.98)
2/8/2009
1547 % N total N (μg) Delta AIR Mean 2.98705 105.381 1.9404425 Standard Error 0.00319 0.998760504 0.010775991 Median 2.9815 107.71315 1.952825 Mode 2.997 108.0288 #N/A Standard Deviation 0.014266 4.466592762 0.048191697 Sample Variance 0.000204 19.9504509 0.00232244 Kurtosis ‐0.18436 ‐1.551085893 2.13554195 Skewness 0.429909 ‐0.577214969 ‐1.460417048 Range 0.058 11.6335 0.18884 Minimum 2.96 98.0673 1.81544 Maximum 3.018 109.7008 2.00428 Sum 59.741 2107.62 38.80885 Count 20 20 20 Confidence Level(95.0%) 0.006677 2.090429756 0.022554408
Peach Leaves; 45.54 %C, delta 13C VPDB ‐25.99
2/7/2009
1547 % C total C (μg) delta 13C V‐PDB Mean 45.709 590.27675 ‐26.11475 Standard Error 0.050892 2.530420473 0.02060255 Median 45.73 589.81 ‐26.14405 Mode 45.8 #N/A #N/A Standard Deviation 0.227594 11.31638438 0.092137406 Sample Variance 0.051799 128.0605554 0.008489302 Kurtosis 0.419218 ‐0.772443323 0.550872738 Skewness 0.258155 ‐0.389583985 0.983587466 Range 0.99 37.598 0.3426 Minimum 45.25 568.752 ‐26.2227 Maximum 46.24 606.35 ‐25.8801 Sum 914.18 11805.535 ‐522.295 Count 20 20 20 Confidence Level(95.0%) 0.106517 5.296230905 0.043121633
21
20100226-5166 FERC PDF (Unofficial) 2/26/2010 4:21:25 PM

Phase #1 report 5 January 2010
Table 3. (continued) Certified wheat flour run against NIST 1547 laboratory standards B2157 wheat flour; 1.47 +/‐ 0.07 % N, d15N V‐AIR 2.85 +/‐0.17.
2/8/2009
B2157 wheat % N total N (μg) Delta AIR Mean 1.472 103.481 2.866956667 Standard Error 0.003 0.263371885 0.022444104 Median 1.475 103.353 2.8827 Mode 1.475 #N/A #N/A Standard Deviation 0.005196 0.456173487 0.038874329 Sample Variance 2.7E‐05 0.20809425 0.001511213 Kurtosis #DIV/0! #DIV/0! #DIV/0! Skewness ‐1.73205 1.163262417 ‐1.523519174 Range 0.009 0.885 0.07281 Minimum 1.466 103.1025 2.82268 Maximum 1.475 103.9875 2.89549 Sum 4.416 310.443 8.60087 Count 3 3 3 Confidence Level(95.0%) 0.012908 1.133197761 0.096569186
B2157 wheat flour; 39.53 +/‐ 0.26 % C, d13C V‐PDB ‐27.21 +/‐0.13.
2/7/2009
B2157 controls % C total C (μg) delta 13C V‐PDB Mean 39.56667 567.1106667 ‐27.10396667 Standard Error 0.055478 4.674619747 0.059962942 Median 39.55 563.314 ‐27.1024 Mode #N/A #N/A #N/A Standard Deviation 0.09609 8.096678908 0.103858863 Sample Variance 0.009233 65.55620933 0.010786663 Kurtosis #DIV/0! #DIV/0! #DIV/0! Skewness 0.757035 1.646144529 ‐0.067865136 Range 0.19 14.798 0.2077 Minimum 39.48 561.61 ‐27.2086 Maximum 39.67 576.408 ‐27.0009 Sum 118.7 1701.332 ‐81.3119 Count 3 3 3 Confidence Level(95.0%) 0.238701 20.11326541 0.257999717
22
20100226-5166 FERC PDF (Unofficial) 2/26/2010 4:21:25 PM

Phase #1 report 5 January 2010
Table 4. Age models: Palmer Lake (PL08-04) and Blue Lake (BL08-02) Square brackets indicate age/date estimates that should be taken with extreme caution. Depths below bracketed age/date values are undated.
TOP of increment
(cm)
BOTTOM of
increment (cm)
PALMER LAKE
Age (yrs) (CRS Model Estimate)
PALMER LAKE Date
BLUE LAKE Age (yrs)
(CRS Model Estimate)
BLUE LAKE Date
0 1 1 2007 4.9 2003 1 2 2.5 2005 10.9 1997 2 3 5 2003 16.6 1991 3 4 7.5 2000 27.5 1981 4 5 10.1 1998 36.7 1971 5 6 12.5 1996 44.9 1963 6 7 15.9 1992 51.9 1956 7 8 19.9 1988 61.6 1946 8 9 22.6 1985 84.4 1924 9 10 26 1982 111 1897
10 11 30 1978 [156.5] [1852] 11 12 33.8 1974 12 13 38 1970 13 14 41.9 1966 14 15 45 1963 15 16 49.8 1958 16 17 54.9 1953 17 18 58.5 1949 18 19 65.7 1942 19 20 71.9 1936 20 21 76.9 1931 21 22 84.9 1923 22 23 98.4 1910 23 24 116.1 1892 24 25 [168] [1840] 25 26 26 27 27 28 28 28.5 Bottom PL08-04 29 30 31 32 33 34 35 36 37 38 39 40 41 42 43 44 45 Bottom BL08-02
23
20100226-5166 FERC PDF (Unofficial) 2/26/2010 4:21:25 PM

Phase #1 report 5 January 2010
Figure 1. Natural falls on the Similkameen River prior to Enloe Dam
Undated photo from local archives, courtesy of Dale Swedberg, Sinlahekin Wildlife Refuge
24
20100226-5166 FERC PDF (Unofficial) 2/26/2010 4:21:25 PM
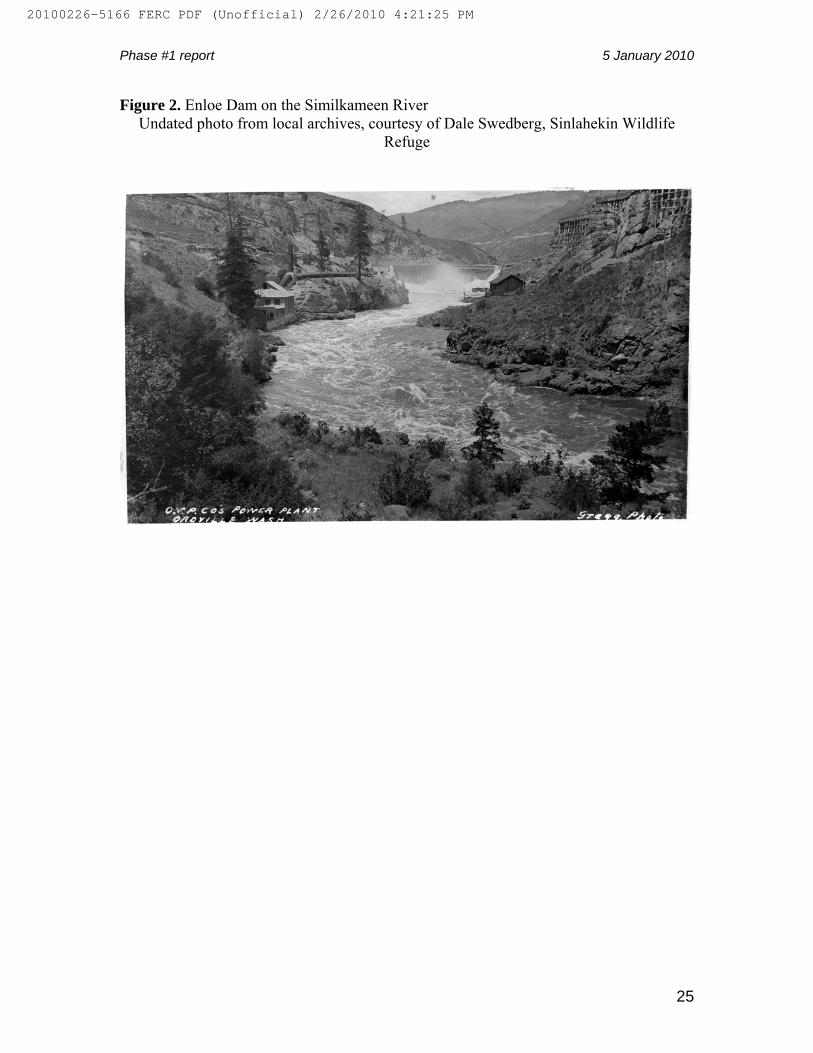
Phase #1 report 5 January 2010
Figure 2. Enloe Dam on the Similkameen River Undated photo from local archives, courtesy of Dale Swedberg, Sinlahekin Wildlife
Refuge
25
20100226-5166 FERC PDF (Unofficial) 2/26/2010 4:21:25 PM

Phase #1 report 5 January 2010
Figure 3. Location, bathymetry, and coring sites, Palmer and Blue Lakes (Okanogan County, WA). Coring locations are displayed against GIS bathymetry obtained from the Washington Dept. of Ecology website. Note that contour intervals in the WDOE files are 10 feet for Palmer Lake, but 5 feet for Blue Lake. See text (Methods) for a discussion of the discrepancy between observed and estimated (GIS) water.
26
20100226-5166 FERC PDF (Unofficial) 2/26/2010 4:21:25 PM
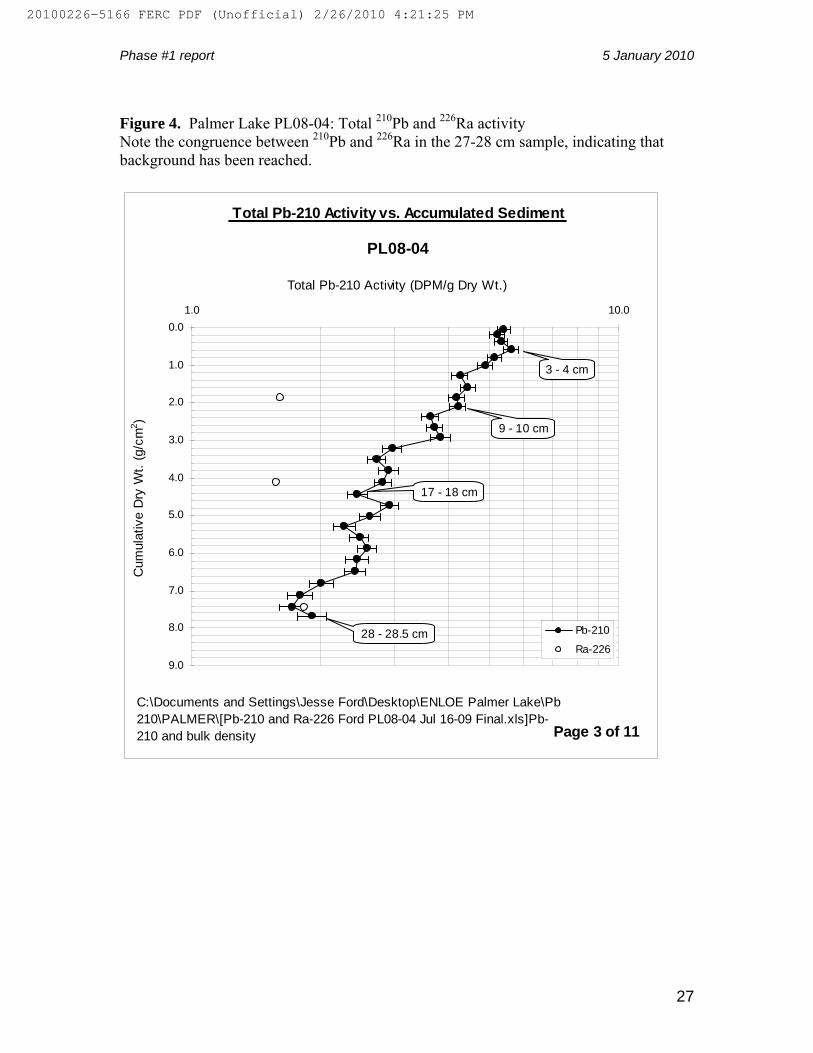
Phase #1 report 5 January 2010
Figure 4. Palmer Lake PL08-04: Total 210Pb and 226Ra activity Note the congruence between 210Pb and 226Ra in the 27-28 cm sample, indicating that background has been reached.
Total Pb-210 Activity vs. Accumulated Sediment
0.0
1.0
2.0
3.0
4.0
5.0
6.0
7.0
8.0
9.0
1.0 10.0
Total Pb-210 Activity (DPM/g Dry Wt.)
Cum
ulat
ive
Dry
Wt.
(g/c
m2 )
Pb-210
Ra-226
PL08-04
C:\Documents and Settings\Jesse Ford\Desktop\ENLOE Palmer Lake\Pb 210\PALMER\[Pb-210 and Ra-226 Ford PL08-04 Jul 16-09 Final.xls]Pb-210 and bulk density
17 - 18 cm
9 - 10 cm
3 - 4 cm
Page 3 of 11
28 - 28.5 cm
27
20100226-5166 FERC PDF (Unofficial) 2/26/2010 4:21:25 PM

Phase #1 report 5 January 2010
Figure 5. Blue Lake core BL08-02: Total 210Pb activity
Total Pb-210 Activity vs. Accumulated Sediment
0.0
1.0
2.0
3.0
4.0
5.0
6.0
7.0
8.0
9.0
1.0 10.0 100.0
Total Pb-210 Activity (DPM/g Dry Wt.)
Cum
ulat
ive
Dry
Wt.
(g/c
m2 )
BL08-02
C:\Documents and Settings\Jesse Ford\Desktop\ENLOE Palmer Lake\BLUE LAKE\210-Pb\[Pb-210 Ford BL08-02 Nov 10-09 Final.xls]Pb-210 and bulk density
12 - 13 cm
4 - 5 cm
Page 3 of 8
23 - 24 cm
28
20100226-5166 FERC PDF (Unofficial) 2/26/2010 4:21:25 PM
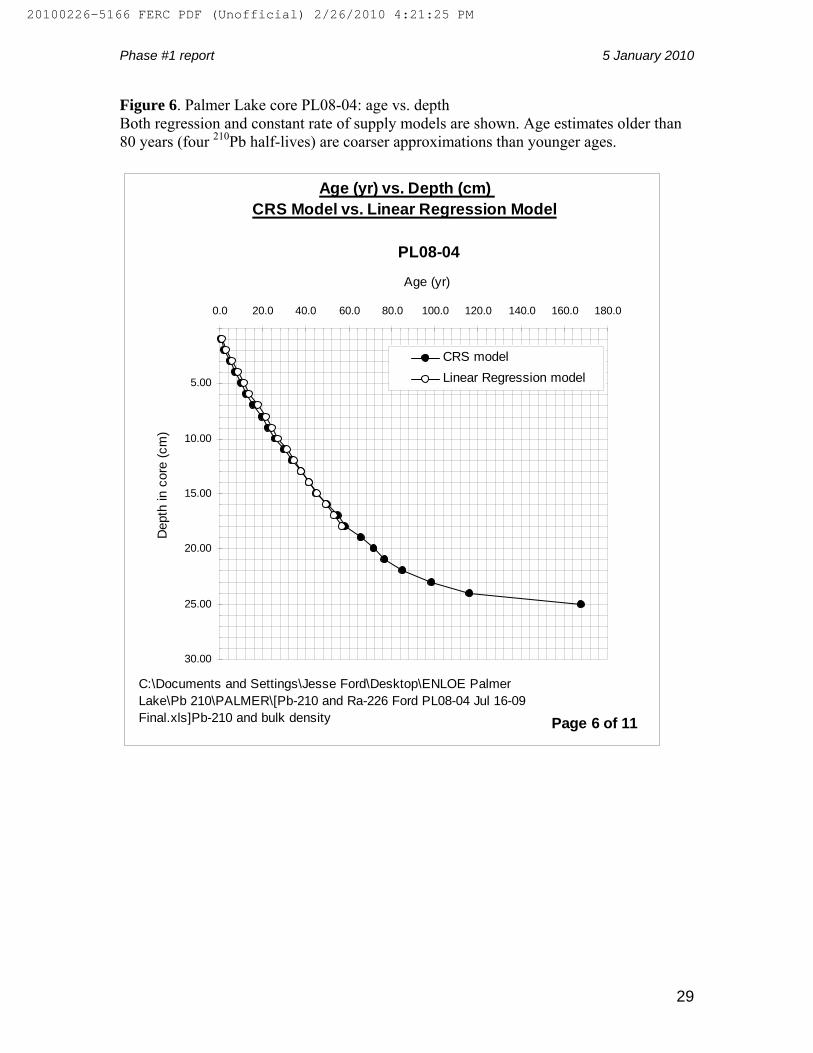
Phase #1 report 5 January 2010
Figure 6. Palmer Lake core PL08-04: age vs. depth Both regression and constant rate of supply models are shown. Age estimates older than 80 years (four 210Pb half-lives) are coarser approximations than younger ages.
Age (yr) vs. Depth (cm) CRS Model vs. Linear Regression Model
5.00
10.00
15.00
20.00
25.00
30.00
0.0 20.0 40.0 60.0 80.0 100.0 120.0 140.0 160.0 180.0
Age (yr)
Dep
th in
cor
e (c
m)
CRS modelLinear Regression model
PL08-04
C:\Documents and Settings\Jesse Ford\Desktop\ENLOE Palmer Lake\Pb 210\PALMER\[Pb-210 and Ra-226 Ford PL08-04 Jul 16-09 Final.xls]Pb-210 and bulk density Page 6 of 11
29
20100226-5166 FERC PDF (Unofficial) 2/26/2010 4:21:25 PM

Phase #1 report 5 January 2010
Figure 7. Blue Lake core BL08-02: age vs. depth Both regression and constant rate of supply models are shown. Age estimates older than 80 years (four 210Pb half-lives) are coarser approximations than younger ages.
Age (yr) vs. Depth (cm) CRS Model vs. Linear Regression Model
0
2
4
6
8
10
12
14
0 20 40 60 80 100 120 140 160 180
Age (yr)
Dep
th in
cor
e (c
m)
CRS modelLinear Regression model
BL08-02
C:\Documents and Settings\Jesse Ford\Desktop\ENLOE Palmer Lake\BLUE LAKE\210-Pb\[Pb-210 Ford BL08-02 Nov 10-09 Final.xls]Pb-210 and bulk density Page 7 of 8
30
20100226-5166 FERC PDF (Unofficial) 2/26/2010 4:21:25 PM
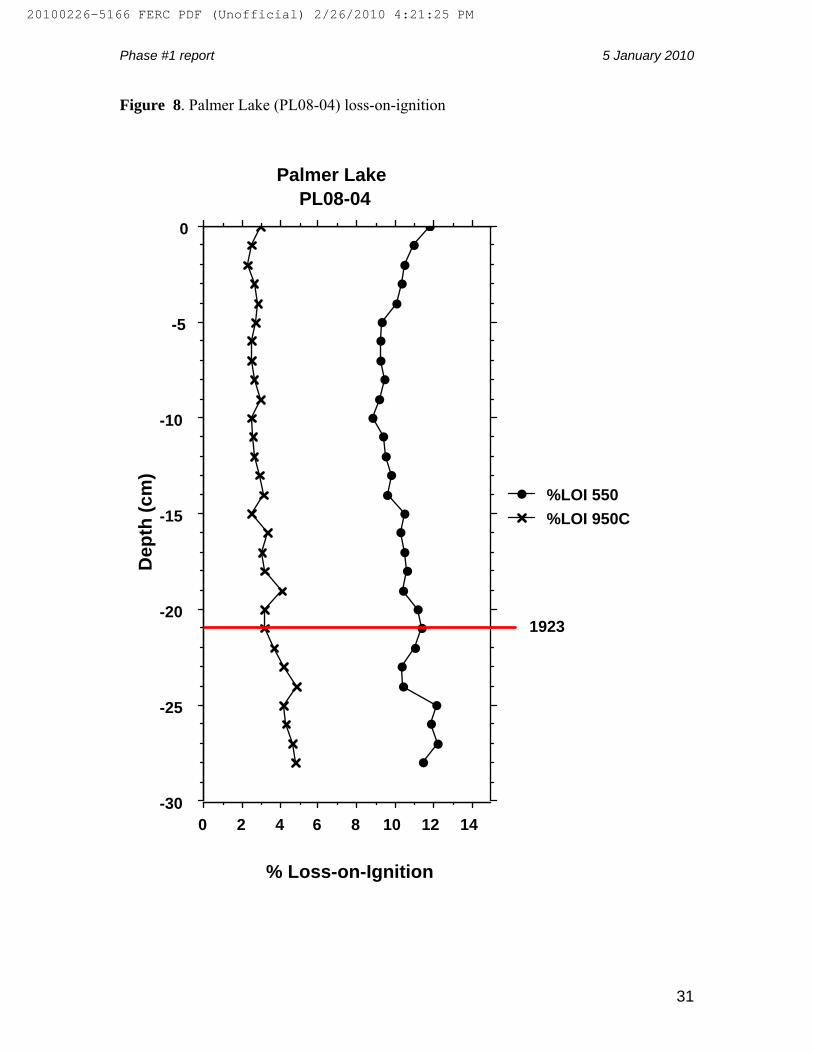
Phase #1 report 5 January 2010
Figure 8. Palmer Lake (PL08-04) loss-on-ignition
0 2 4 6 8 10 12 14
% Loss-on-Ignition
-30
-25
-20
-15
-10
-5
0
Dep
th (c
m)
%LOI 950C%LOI 550
Palmer Lake PL08-04
1923
31
20100226-5166 FERC PDF (Unofficial) 2/26/2010 4:21:25 PM

Phase #1 report 5 January 2010
Figure 9. Blue Lake (BL08-02) loss-on-ignition Note that seven samples from the base of the core (39-46 cm) are not yet analyzed
-38-37-36-35-34-33-32-31-30-29-28-27-26-25-24-23-22-21-20-19-18-17-16-15-14-13-12-11-10
-9-8-7-6-5-4-3-2-1
0
Dep
th (c
m)
0 4 8 12 16 20
% Loss-on-ignition
%LOI 950C%LOI 550C
Blue Lake BL08-02
1924
32
20100226-5166 FERC PDF (Unofficial) 2/26/2010 4:21:25 PM

Phase #1 report 5 January 2010
Figure 10. Palmer Lake core PL08-04: % carbon, % nitrogen, and C/N ratio
0 1 2 3 4 5 6 7 8 9-30
-25
-20
-15
-10
-5
0
Dep
th (c
m) C/N
% C% N
Palmer Lake PL08-04 % carbon, % nitrogen and C/N ratio
1923
33
20100226-5166 FERC PDF (Unofficial) 2/26/2010 4:21:25 PM

Phase #1 report 5 January 2010
Figure 11. Blue Lake core BL08-02: % carbon, % nitrogen, and C/N ratio
0 5 10 15 20 25 30 35 40-50
-45
-40
-35
-30
-25
-20
-15
-10
-5
0
Dep
th (c
m)
C/N% C% N
1924
Blue Lake BL08-02 % carbon, % nitrogen, and C/N ratio
34
20100226-5166 FERC PDF (Unofficial) 2/26/2010 4:21:25 PM

Phase #1 report 5 January 2010
Figure 12. Palmer Lake core PL08-04: δ13C and δ15N (units are ‰)
2.5 3 3.5 4
d15N
-30
-25
-20
-15
-10
-5
0
Dep
th (c
m)
-32 -31.5 -31 -30.5 -30d13C
-30
-25
-20
-15
-10
-5
0
1923
35
20100226-5166 FERC PDF (Unofficial) 2/26/2010 4:21:25 PM
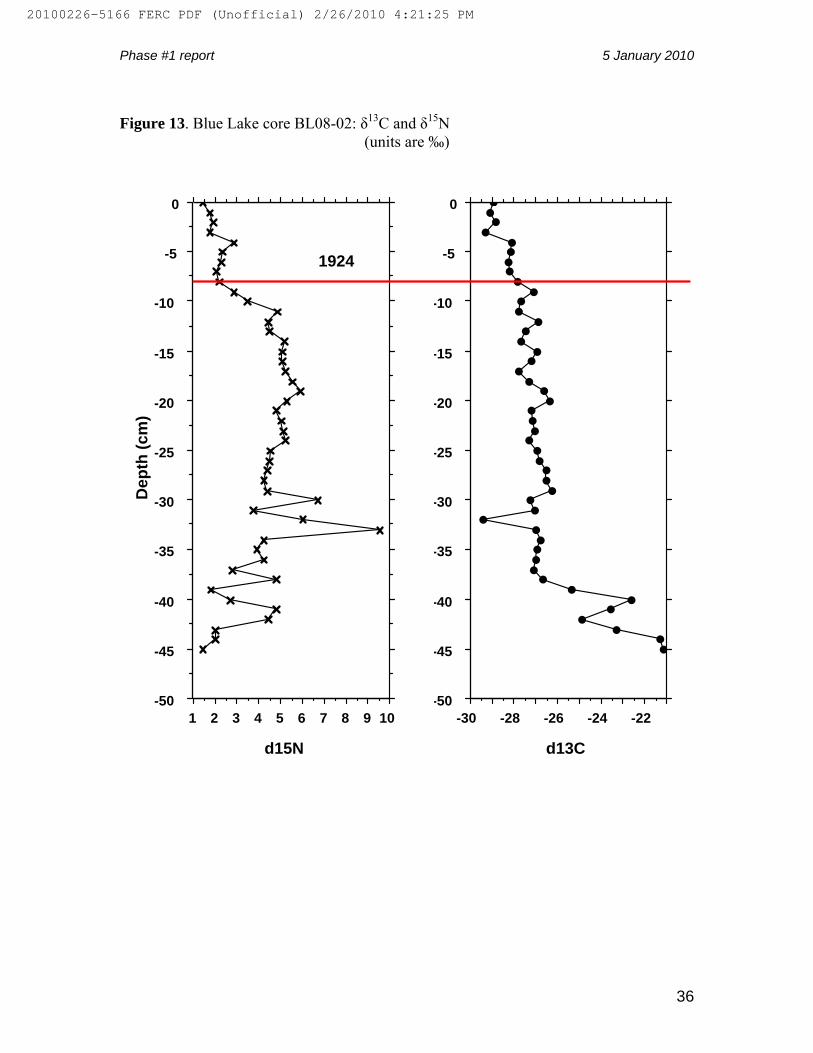
Phase #1 report 5 January 2010
36
Figure 13. Blue Lake core BL08-02: δ13C and δ15N
(units are ‰)
1 2 3 4 5 6 7 8 9 10
d15N
-50
-45
-40
-35
-30
-25
-20
-15
-10
-5
0
Dep
th (c
m)
-30 -28 -26 -24 -22
d13C
-50
-45
-40
-35
-30
-25
-20
-15
-10
-5
0
1924
20100226-5166 FERC PDF (Unofficial) 2/26/2010 4:21:25 PM

Document Content(s)
CCT Comments on Enloe Application.PDF.................................1--1
ExASmith2003a.PDF.....................................................0--2
ExBSmith2003b.PDF.....................................................-1--3
ExCVedan.PDF..........................................................-2-14
ExDTalayco2001.PDF....................................................15-13
ExEFord2010a.PDF......................................................14-50
ExFGustafson.PDF......................................................51-49
ExGMyers.PDF..........................................................50-48
ExHFord2010b.PDF......................................................49-47
20100226-5166 FERC PDF (Unofficial) 2/26/2010 4:21:25 PM