Embed Size (px)
Citation preview
ST. LUCIE COUNTY
TRAFFIC COUNTS PROGRAM EVALUATION
Technical Memorandum No. 4 – DEVELOPMENT OF DATA REPORTING SYSTEM REQUIREMENTS AND LONG RANGE IMPLEMENTATION PLAN
Prepared For: St. Lucie Transportation Planning Organization
2300 Virginia Avenue Fort Pierce, FL 34982
ph (772) 462-1593, fax (772)462-2549
Prepared By: Tindale-Oliver & Associates, Inc.
1000 Ashley Drive, Suite 100 Tampa, Florida 33602
ph (813) 224-8862, fax (813)226-2106
January 2010

Tindale-Oliver & Associates, Inc. St. Lucie County January 2010 i Traffic Counts Program Evaluation
TABLE OF CONTENTS
Section 1: INTRODUCTION.......................................................................... 1-1
Section 2: PROJECT WORKSHOPS............................................................ 2-1
Workshop Number 1..................................................................... 2-1
Workshop Number 2..................................................................... 2-2
Section 3: DATA REPORTING SYSTEM REQUIREMENTS........................ 3-1
Traffic Count Location Database Attributes .................................. 3-1
Traffic Count Data Attributes ........................................................ 3-3
Traffic Count Reporting Requirements ......................................... 3-4
Traffic Analysis Tools for Quality Control and Growth Rate Analysis
..................................................................................................... 3-5
Data Management and GIS Interface........................................... 3-6
Concurrency Needs and Traffic Data Interface Requirements ..... 3-7
User Security Considerations ....................................................... 3-8
Database Platform........................................................................ 3-8
Hardware and Software Needs .................................................... 3-9
Web Based Application Development Requirements ................... 3-9
Section 4: IMPLEMENTATION PLAN .......................................................... 4-1
Task Definition and Priority Rank ................................................. 4-1
Responsibility ............................................................................... 4-3
Schedule ...................................................................................... 4-3
Hardware costs ............................................................................ 4-4
Consultant costs........................................................................... 4-4
LIST OF FIGURES
Figure 4-1 – Traffic Count Program Implementation Schedule..... 4-3

Tindale-Oliver & Associates, Inc. St. Lucie County January 2010 ii Traffic Counts Program Evaluation
LIST OF APPENDICES
Appendix A. Workshop Number 1
Appendix B. Workshop Number 2
Appendix C. FDOT Conversion Factors in St Lucie County
Appendix D. Traffic Count Report Examples
Appendix E. Traffic Count Program Implementation Cost

Tindale-Oliver & Associates, Inc. St. Lucie County January 2010 1-1 Traffic Counts Program Evaluation
Section 1
INTRODUCTION
The St. Lucie Transportation Planning Organization (TPO) has requested the service of
Tindale-Oliver & Associates (TOA) to review the current traffic count practices used by
County and Cities to develop recommendations concerning how to select traffic count
locations, frequency of performing traffic counts, quality control techniques to determine
the reasonableness of the traffic count data, and the overall management of historical
traffic count data and its use in various planning and engineering processes and
studies.
This technical memorandum was prepared to document data reporting system
requirements and provide a suggested implementation plan for the recommended
Traffic Count Program. The remaining sections are summarized below.
Section 2 provides a summary to the two project workshops, including the agenda,
meeting notes and presentation for each workshop. Discussions and direction received
at these workshops provided input into the development of the Section 3, Data
Reporting System Requirements.
Section 3 documents the proposed Traffic Count Program Data Reporting System
Requirements. These requirements have been developed based on information,
findings and recommendations contained in the Technical Memorandums 1 through 3
and discussions and direction received at the two project workshops.
Section 4 provides a suggested Implementation Plan for the Traffic Counts Program.
The Implementation Plan includes program tasks, task priority, responsible party, task
schedule and estimated costs.
The Appendices contain supporting documentation as necessary for each of the above
sections.

Tindale-Oliver & Associates, Inc. St. Lucie County January 2010 2-1 Traffic Counts Program Evaluation
Section 2
PROJECT WORKSHOPS
This section discusses the two TPO workshops that occurred during the evaluation of
traffic count programs of the county and cities in St. Lucie County. Workshop number
one involved the review of Technical Memorandums 1, 2 and 3. Workshop number two
focused on the information necessary for development of Technical Memorandum 4.
Each of these workshops is discussed below.
Workshop Number 1
Workshop Number 1 occurred on October 2, 2009 from 10:00 a.m. to 12:00 p.m. in the
County Growth Management conference room. Staff from the TPO, county and cities
attended this workshop. The workshop agenda, meeting notes, attendees and
presentation are included in Appendix A.
The purpose of this workshop was to review the contents of Technical Memorandums 1,
2 and 3, drafts of which were provided to the workshop attendees. The topics reviewed
at the workshop are summarized below:
Overview Of Study Findings
Traffic Count Philosophy
Video Detection Capabilities
Quality Control Procedures
Annual Traffic Counts Update Process
Types Of Reporting Information
Organizational Placement Of Traffic Count Program
In-House Versus Out-Sourcing Of The Collection Of Annual Traffic Counts
Technical Memorandum Number 4 Outline
Decision Points And Next Steps
A Power Point presentation, provided to all participants, was used to guide discussions
on the above topics at the workshop.

Tindale-Oliver & Associates, Inc. St. Lucie County January 2010 2-2 Traffic Counts Program Evaluation
At the end of the workshop, participants were asked the following six questions:
Do you agree with the traffic count philosophy?
Do you agree with the quality control process?
Do you agree with the reporting information?
Do you agree with the TPO role in the traffic count program?
Do you think the counts should be outsourced?
Do you agree with the Technical Memorandum #4 Outline?
Consensus agreement, as presented by the Consultant and discussed by the
participants at the workshop, was reached on all of the above questions with the
exception of the question concerning whether the collection of traffic counts should be
outsourced. During the discussions on this topic, it was indicated that the person who
was in charge of the traffic count program for the County had left the County. Further
discussions indicated that processing traffic counts would be difficult at best, and
perhaps it would make sense to outsource the collection of traffic counts at this time.
However, the issue concerning the outsourcing of traffic counts was that neither the
cities nor the county had budgeted funding available for this purpose and it was unlikely
that either could obtain funding for this purpose. It was agreed that the outsourcing of
traffic counts would be further evaluated.
Workshop Number 2
Workshop Number 2 occurred on November 20, 2009 from 2 p.m. to 4:00 p.m. in the
Board of County Commissioners conference room. Staff from the TPO, county and
cities attended this workshop. The workshop agenda, meeting notes, attendees and
presentation are included in Appendix B.
This workshop discussed data system reporting requirements and the development of a
traffic counts program implementation plan. The topics reviewed at the workshop are
summarized below:
Data Attributes, Including But Not Limited To:
o Count Stations Properties o Count Data

Tindale-Oliver & Associates, Inc. St. Lucie County January 2010 2-3 Traffic Counts Program Evaluation
o Technical Attributes
Functions And Analysis Features, Including But Not Limited To:
o LOS Data Management and GIS Interface
o Add New Count Station
o Import Count Data
o Assign Count Station To Segments
o Regression Analysis
o Quality Control
Standard Reports And Queries, Including But Not Limited To:
o Count Station History Report
o Regression Analysis Report
o Count Station Location Report
o AADT or Peak Hour Volume Map
o Traffic Count Station Map
o Traffic Growth Rates Map
Implementation Matrix Considerations, Including But Not Limited To:
o System Functions
o Hardware Requirements And Costs
o Software And Consultant Costs
o Schedule And Implementation Priority
o Responsible Party For Implementation
A Power Point presentation, provided to all participants, was used to guide discussions
of the above topics at the Workshop. Additionally, the Consultant used its internally
developed software, vTIMAS (visual Transportation Inventory Management and
Analysis System), to demonstrate the traffic count program data attributes, functions
and features, and standard reports and query capabilities. A sampling of St. Lucie
County and FDOT traffic count data was used in this demonstration.
In addition to discussing the traffic counts program requirements and implementation
plan, several participants asked questions about the use of the traffic counts for
concurrency and level of service analysis and reporting. The Consultant provided a
demonstration of the vTIMAS level of service analysis and reporting functions. Topics
discussed and/or demonstrated at the workshop relative to level of service analysis and
reporting functions are summarized below:
Tindale-Oliver & Associates, Inc. St. Lucie County January 2010 2-4 Traffic Counts Program Evaluation
Data Attributes, Including But Not Limited To:
o Roadway analysis facility and individual segment identification attributes o Multi-modal level of service standards o Technical analysis variables
Functions And Analysis Features, Including But Not Limited To:
o LOS Data Management and GIS Interface
o Management of Multiple Alternative Analysis Year Files
o FDOT Generalized Tables LOS
o Change Traffic Volumes and LOS Recalculation on the Fly
o Change LOS Methodology from Generalized Tables to ART-PLAN
o Review ART-PLAN LOS Variables in vTIMAS
o Comment Tracking at the Segment Level
o System-wide Level of Service Analysis for Multiple Planning Years
o Geographic Area/Corridor Level of Service Analysis
o Concurrency Analysis Using Growth Rates or Checkbook Approach
o Document Management For Traffic Impact Studies and Supporting Data,
Development Orders, and Other Related Information tied to the Project
Level
Standard Reports And Queries, Including But Not Limited To:
o Detailed System-wide Level of Service Report in FDOT Accepted Format
o Standard Detailed Level of Service Report
o System-wide Analysis Summary Report
o Measure of Effectiveness Reports
o Tier I Generalized Tables Traffic Screening Report
o Individual Project Tracking Report
o Project Impacted Segments Report
o Cumulative Traffic Impacts Report
o Number of Lanes and Road Type Map
o Level of Service Standard Map
o Level of Service Map
o Level of Congestion Map
Following conclusion of the demonstration component of the workshop, workshop
participants discussed the functions presented at this workshop The following
summarizes these discussions:

Tindale-Oliver & Associates, Inc. St. Lucie County January 2010 2-5 Traffic Counts Program Evaluation
The Traffic Count Program and software discussed and demonstrated meets the
needs of the County, Cities and the TPO. The TPO requested the Consultant to
develop a scope of services to implement the Traffic Count Program and
software in the Phase II Project.
The issue of outsourcing the traffic counts was discussed. The TPO requested
the Consultant to include an option for collecting and processing the 2010 county
traffic counts as recommended in Technical Memorandum Number 2 in the
Phase II Project.
There was interest by workshop participants in considering the implementation of
the Consultant’s level of service analysis, reporting and concurrency
management software. Given this interest, the TPO requested the Consultant to
include an option for implementing this software in the Phase II Project.

Tindale-Oliver & Associates, Inc. St. Lucie County January 2010 3-1 Traffic Counts Program Evaluation
Section 3
DATA REPORTING SYSTEM REQUIREMENTS
Workshop Number 2, discussed in the previous section, presented desirable data
attributes, features and functions, and reporting requirements of the proposed Traffic
Counts Program for the St. Lucie County TPO, County and Cities. This section further
discusses the data reporting system requirements that must be addressed in the
successful implementation of the Traffic Counts Program for the St. Lucie County TPO,
County and Cities. Each of the following ten sub-sections will be discussed in the
remainder of Section 3:
Traffic Count Location Database Attributes
Traffic Count Data Attributes
Traffic Count Reporting Requirements, Standard And Ad-Hoc Reporting
Traffic Analysis Tools For Quality Control And Growth Rate Analysis
Data Management And GIS Interface
Concurrency Needs And Traffic Data Interface Requirements
User Security Considerations
Database Platform
Hardware And Software Needs
Web Based Application Development Requirements
Traffic Count Location Database Attributes
The data attributes concerning the location of traffic counts need to include the
following:
Count Station Identification Number: number given to identify the count station and
whether it is a County or FDOT count station.
Facility Type: if the facility is an interstate facility or not.
County Station Type:
o Permanent: Telemetered Traffic Monitoring Stations (TTMS)
o Temporary: Portable Traffic Monitoring Stations (PTMS)
Tindale-Oliver & Associates, Inc. St. Lucie County January 2010 3-2 Traffic Counts Program Evaluation
Roadway: road name on which the count station is on. For example:
On Street: Crosstown Parkway
Location: approximate location of the count station. For Example:
Location: 500 feet west of Interstate 95.
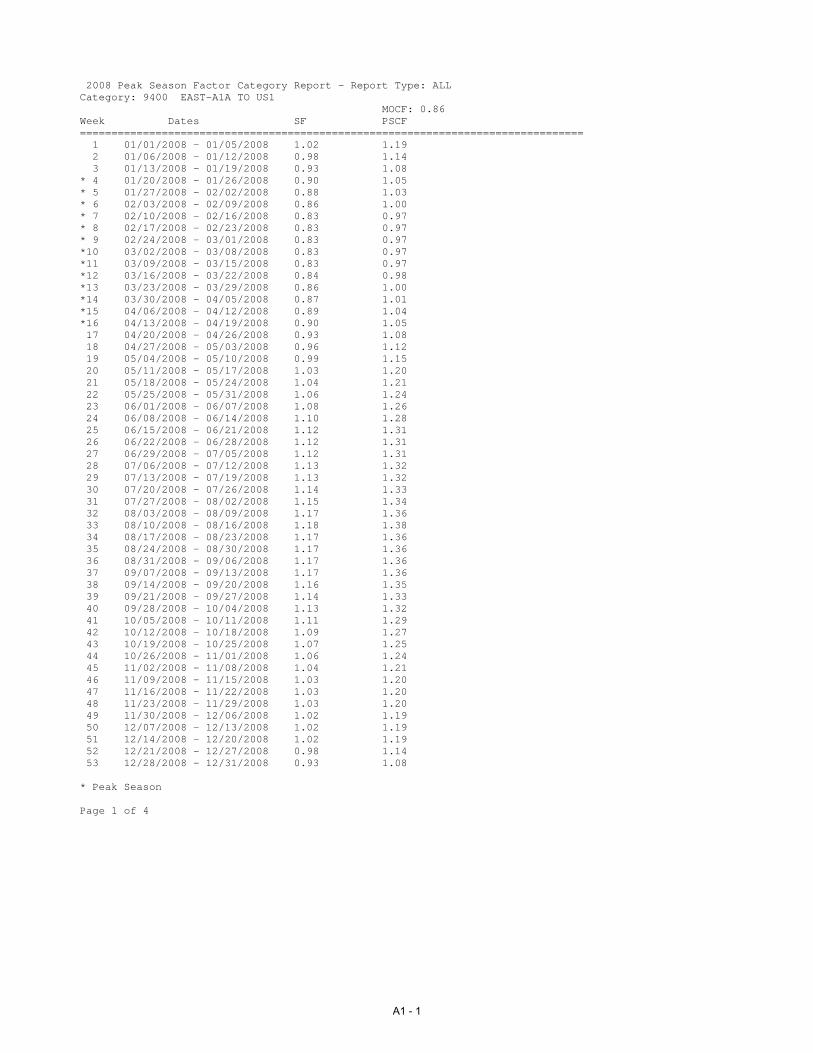
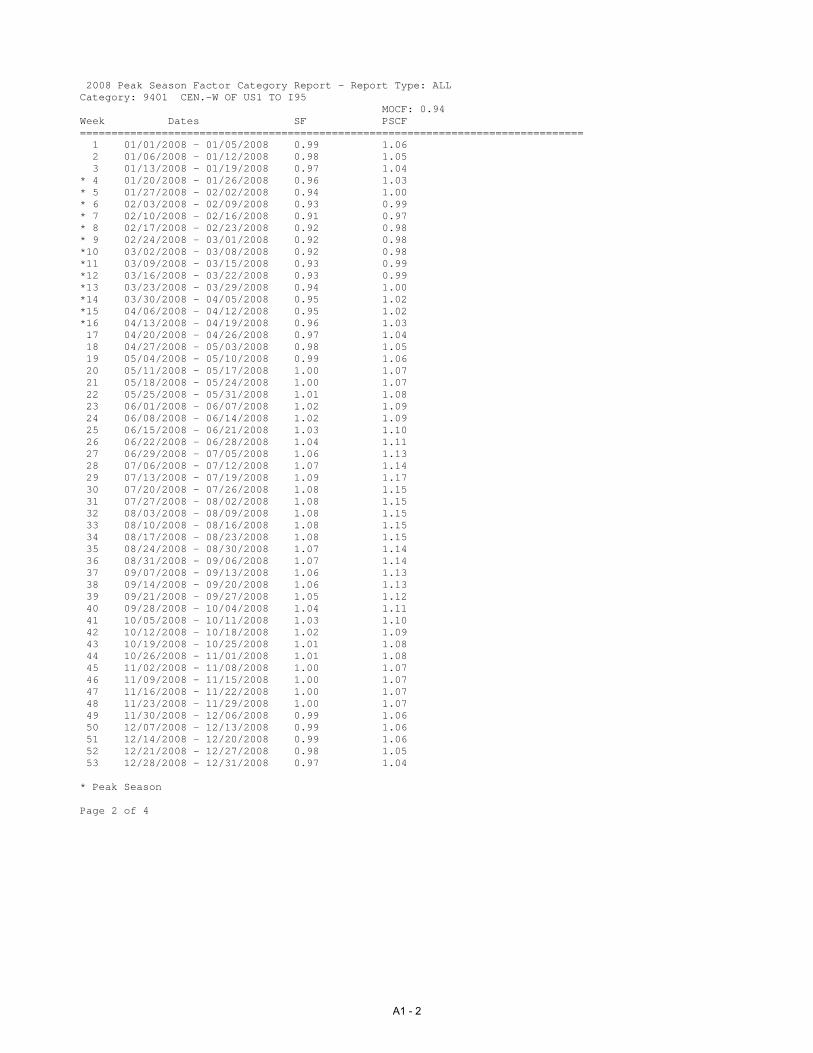
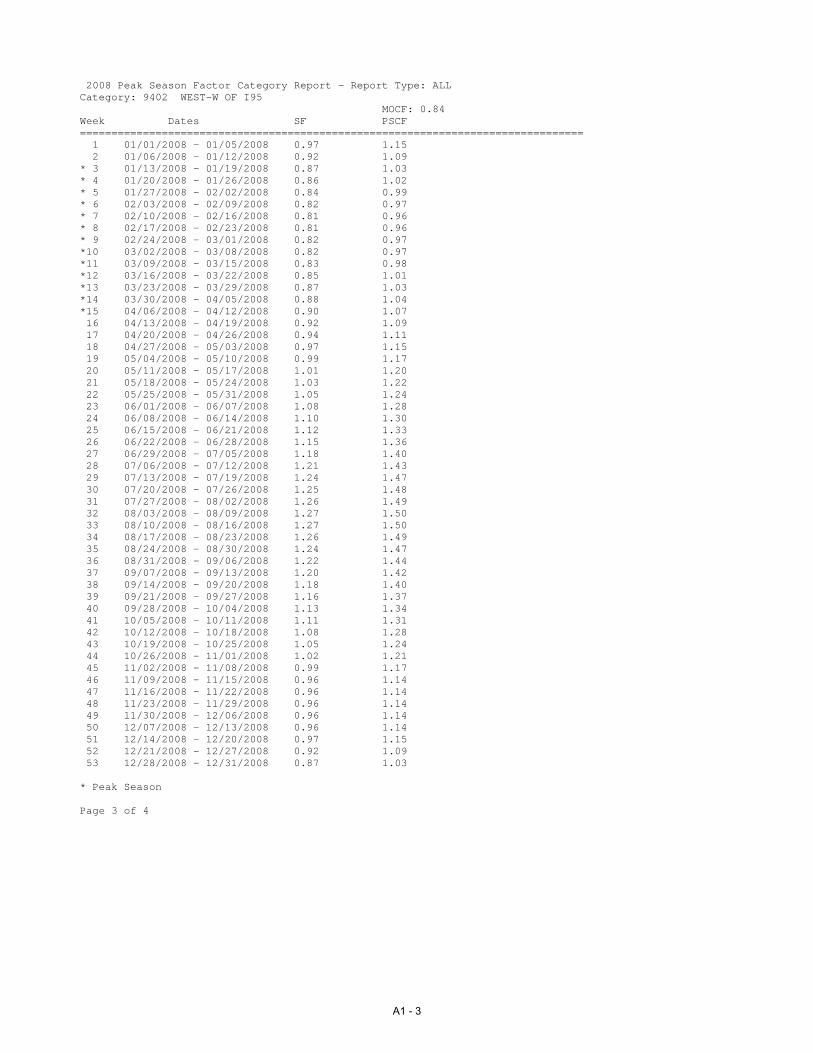
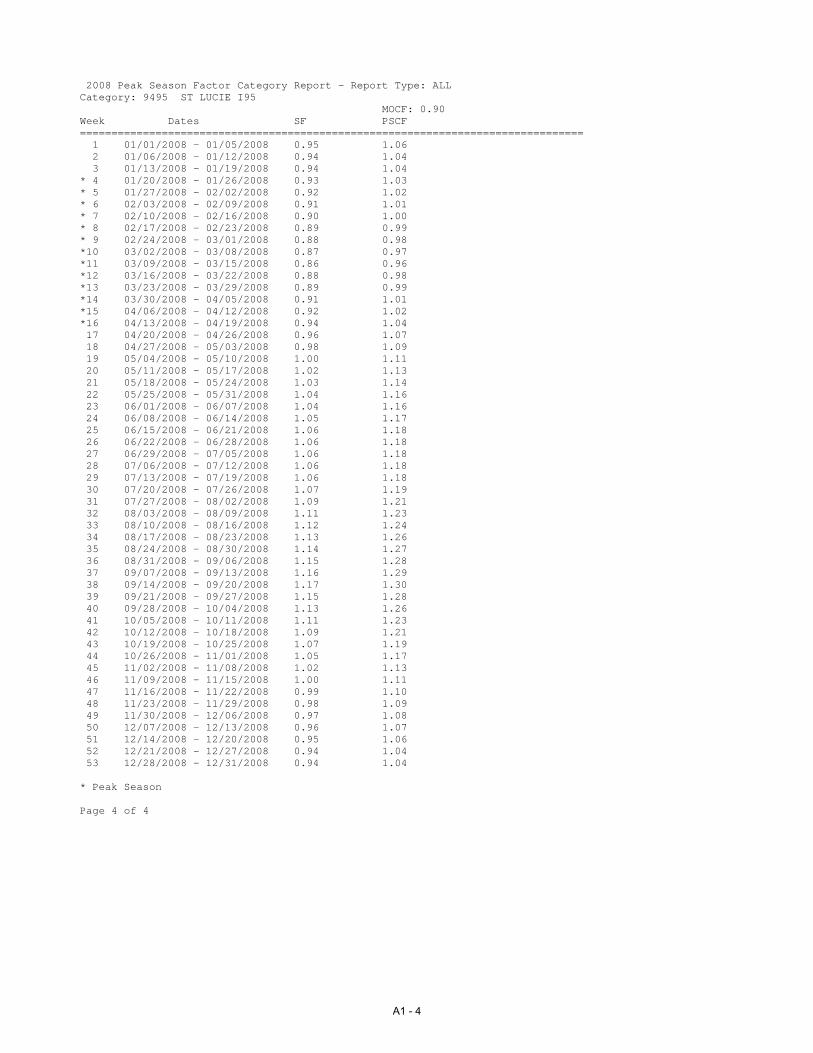
Seasonal Factor Location: this location is necessary to apply the correct season
adjustment factor to convert average daily volumes into average annual daily traffic
(AADT) volumes. St Lucie County is currently divided into four different geographic
areas:
o East: A1A to U.S.1
o Central: from west of U.S.1 to I-95
o West: west of I-95
o I-95: I-95 only
A list of the latest available Season Adjustment Factors have been included in
Appendix C.
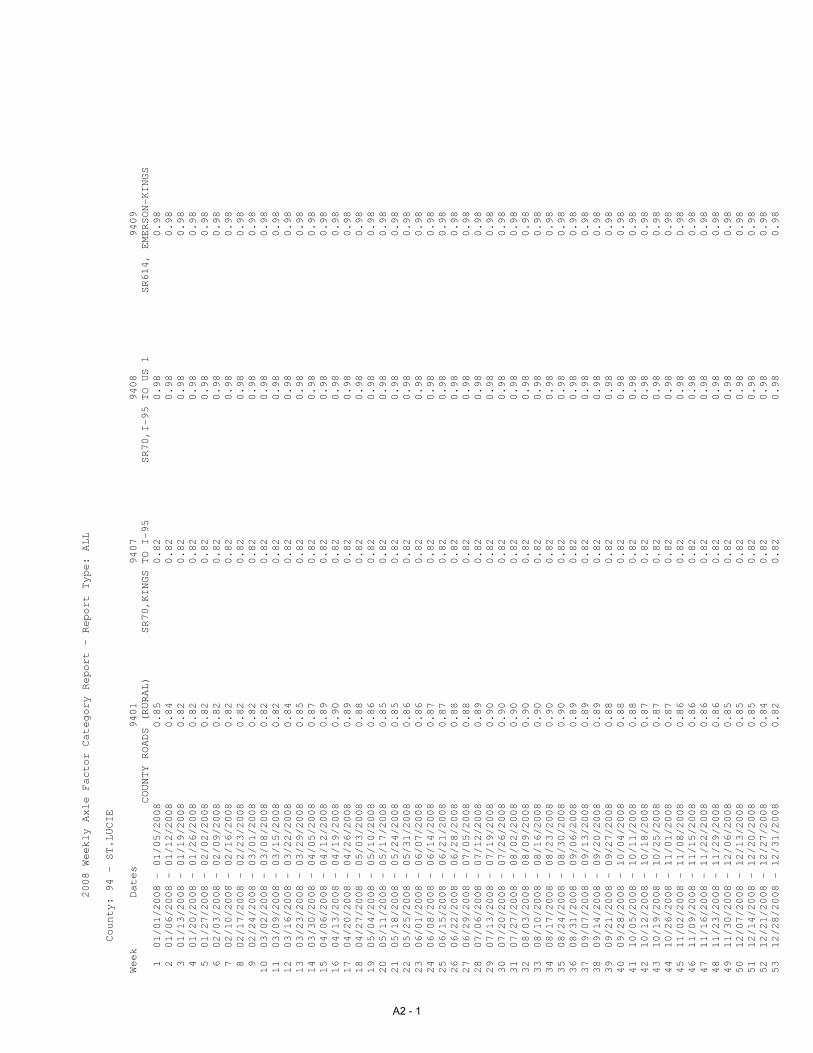
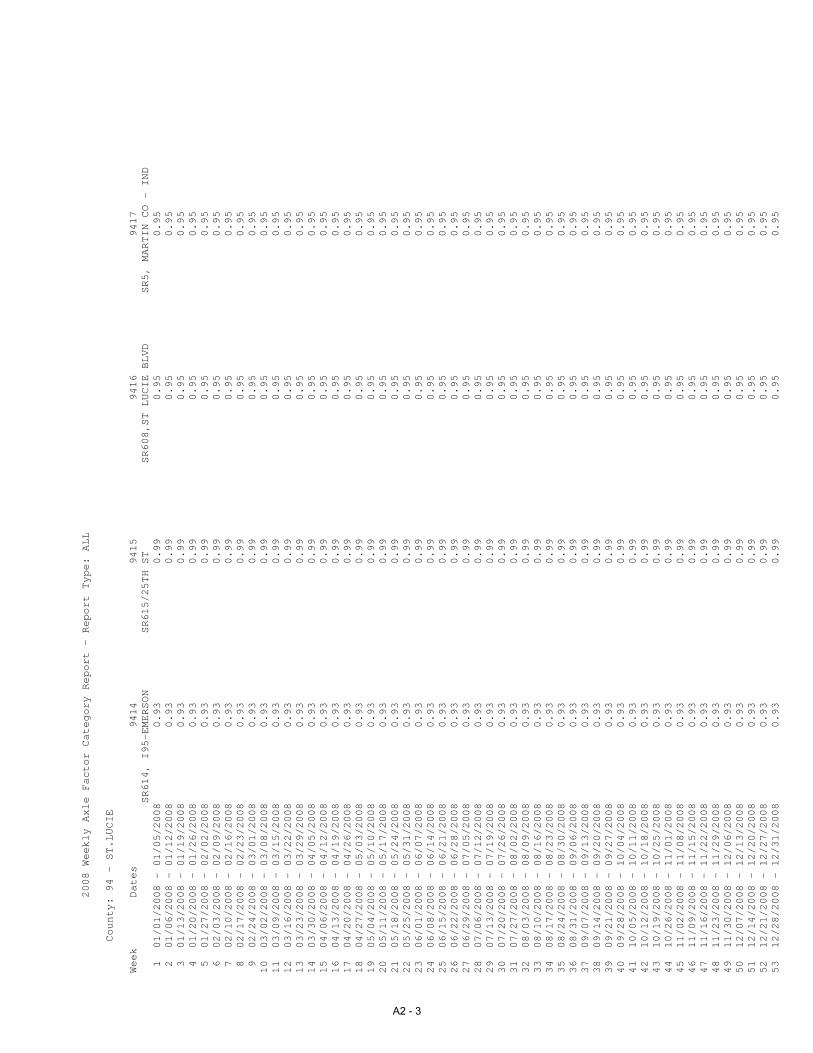
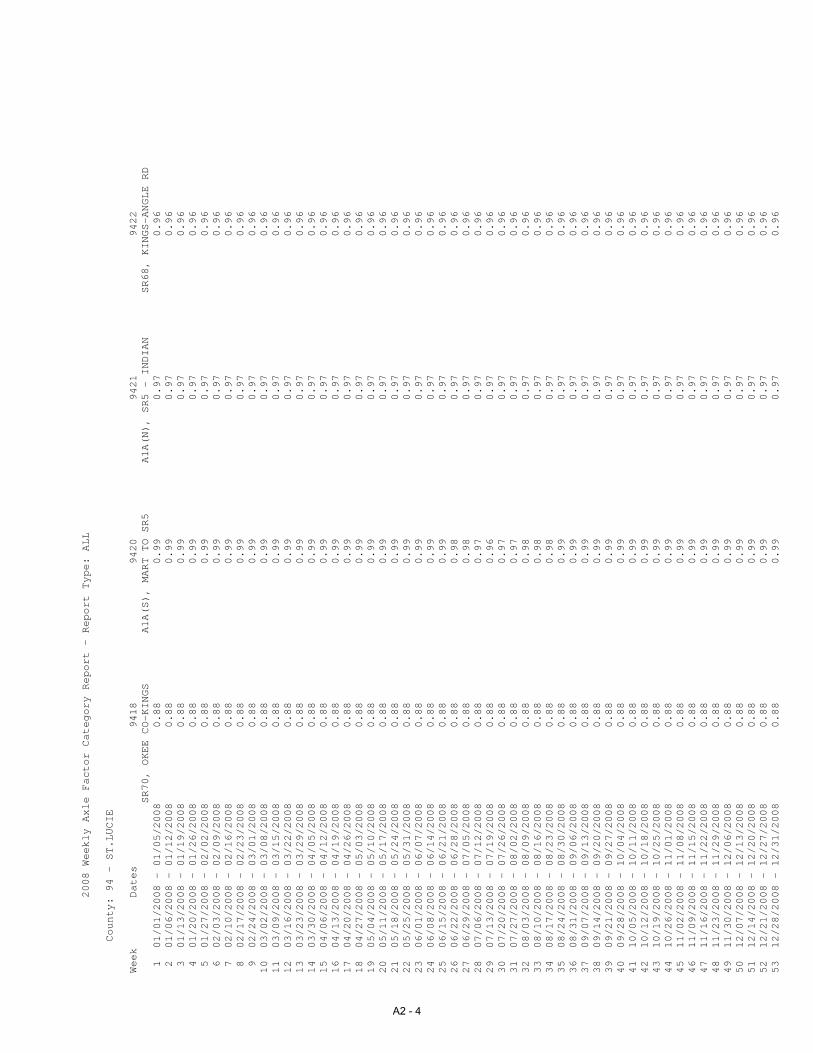
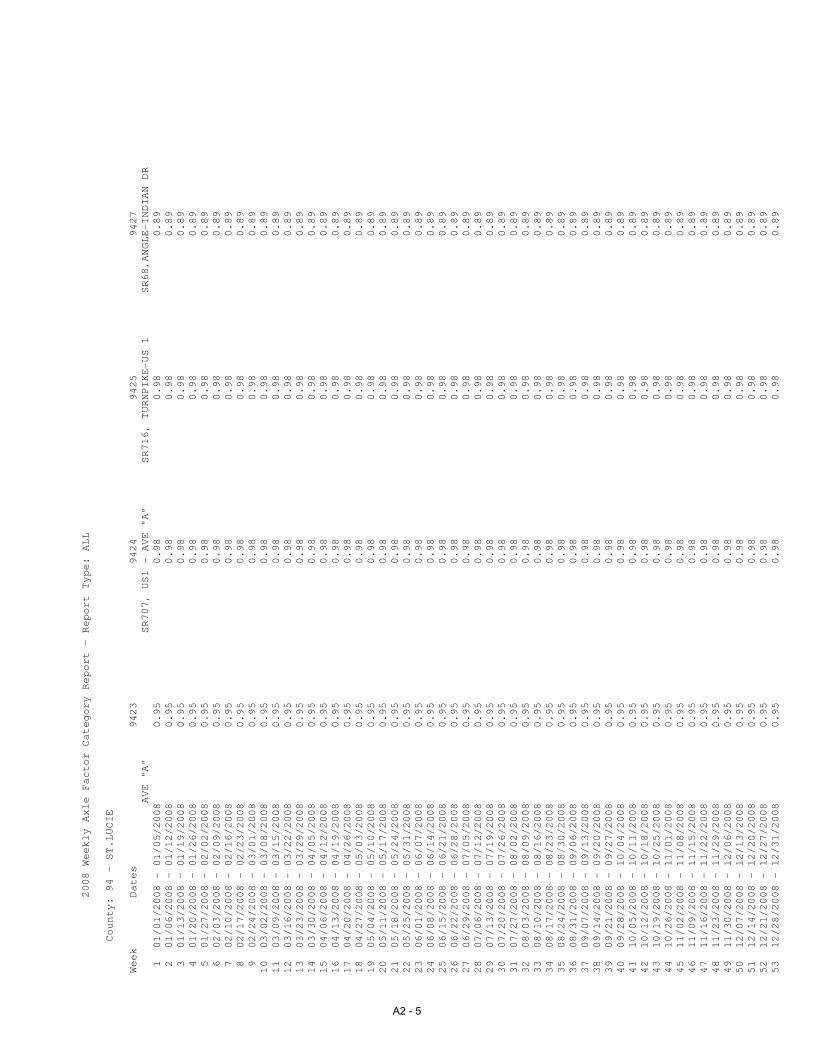
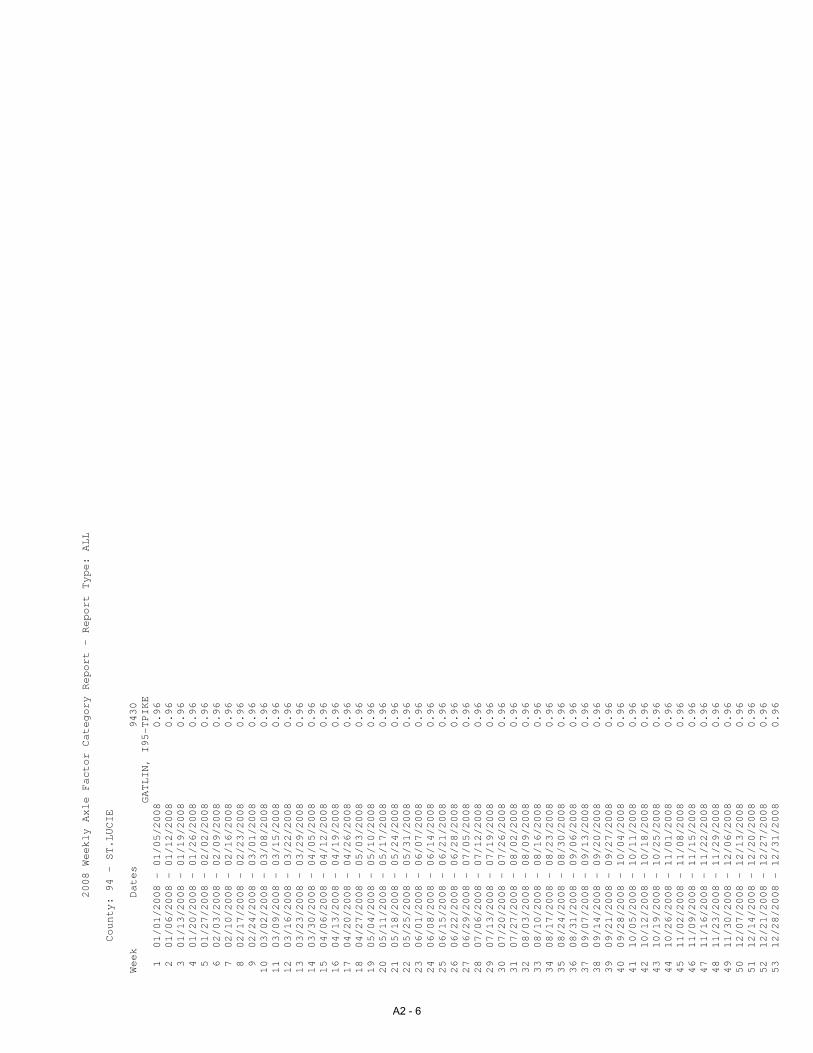
Axle Adjustment Factor Location: this location is necessary to apply the factor that
provides the axle correction to be used for portable monitoring sites where data is
collected using “tubes”. In other words, when using “tubes”, most of the heavy
vehicles are counted as two light vehicles and therefore, corrections are necessary.
St Lucie County is currently divided into twenty one axle adjustment factor
areas/roadways:
o 9401 - County Roads (Rural)
o 9407 - S.R.70 (Okeechobee Road) from Kings Highway to I-95
o 9408 - S.R.70 (Okeechobee Road/Virginia Avenue) from I-95 to U.S.1
o 9409 - S.R.614 (Indrio Road) from Emerson Avenue to Kings Highway
o 9410 - County Roads (Urban)
o 9411 – S.R.713 (Kings Highway) from I-95 to U.S.1
o 9412 – I-95
o 9413 – S.R.713 (Kings Highway) from S.R.70 to I-95
o 9414 – S.R.614 (Indrio Road) from I-95 to Emerson Avenue
o 9415 – S.R.615 (25th Street)
o 9416 – S.R.608 (St Lucie Boulevard)
o 9417 – S.R.5 (U.S.1)
o 9418 – S.R.70 (Kings Highway) from Okeechobee County to Kings Highway
o 9420 – A1A South from Martin County Line to U.S.1
o 9421 – A1A North from U.S.1 to Indian River County Line
o 9422 – S.R.68 (Orange Avenue) from Kings Highway to Nagle Road
Tindale-Oliver & Associates, Inc. St. Lucie County January 2010 3-3 Traffic Counts Program Evaluation
o 9423 – Avenue A
o 9424 – S.R.707 (Indian River Drive) from U.S.1 to Avenue A
o 9425 - S.R.716 (Port St Lucie Boulevard) from Turnpike to U.S.1
o 9427 – S.R.68 (Orange Avenue) from Angle Road to U.S.1
o 9430 – Gatlin Boulevard from I-95 to Turnpike
A list of the latest available Axle Adjustment Factors have been included in Appendix
C.
Notes: this field is used to add any additional information that the user considers
necessary regarding the particular count station.
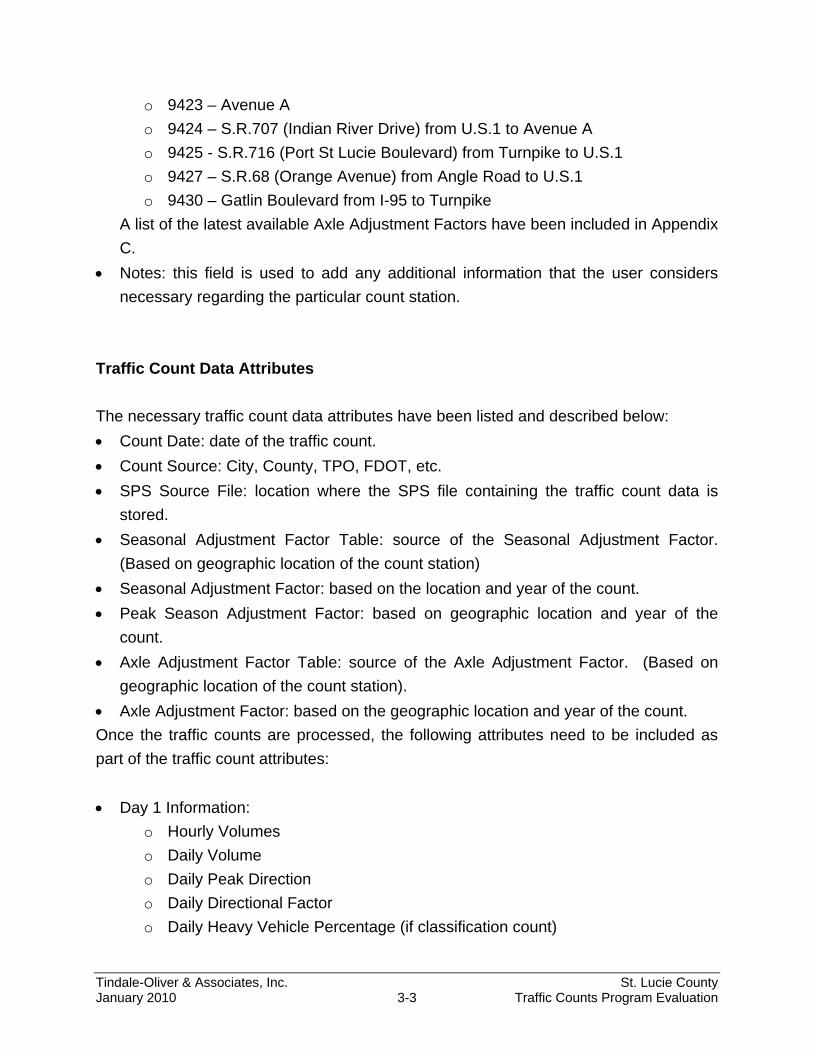
Traffic Count Data Attributes
The necessary traffic count data attributes have been listed and described below:
Count Date: date of the traffic count.
Count Source: City, County, TPO, FDOT, etc.
SPS Source File: location where the SPS file containing the traffic count data is
stored.
Seasonal Adjustment Factor Table: source of the Seasonal Adjustment Factor.
(Based on geographic location of the count station)
Seasonal Adjustment Factor: based on the location and year of the count.
Peak Season Adjustment Factor: based on geographic location and year of the
count.
Axle Adjustment Factor Table: source of the Axle Adjustment Factor. (Based on
geographic location of the count station).
Axle Adjustment Factor: based on the geographic location and year of the count.
Once the traffic counts are processed, the following attributes need to be included as
part of the traffic count attributes:
Day 1 Information:
o Hourly Volumes
o Daily Volume
o Daily Peak Direction
o Daily Directional Factor
o Daily Heavy Vehicle Percentage (if classification count)
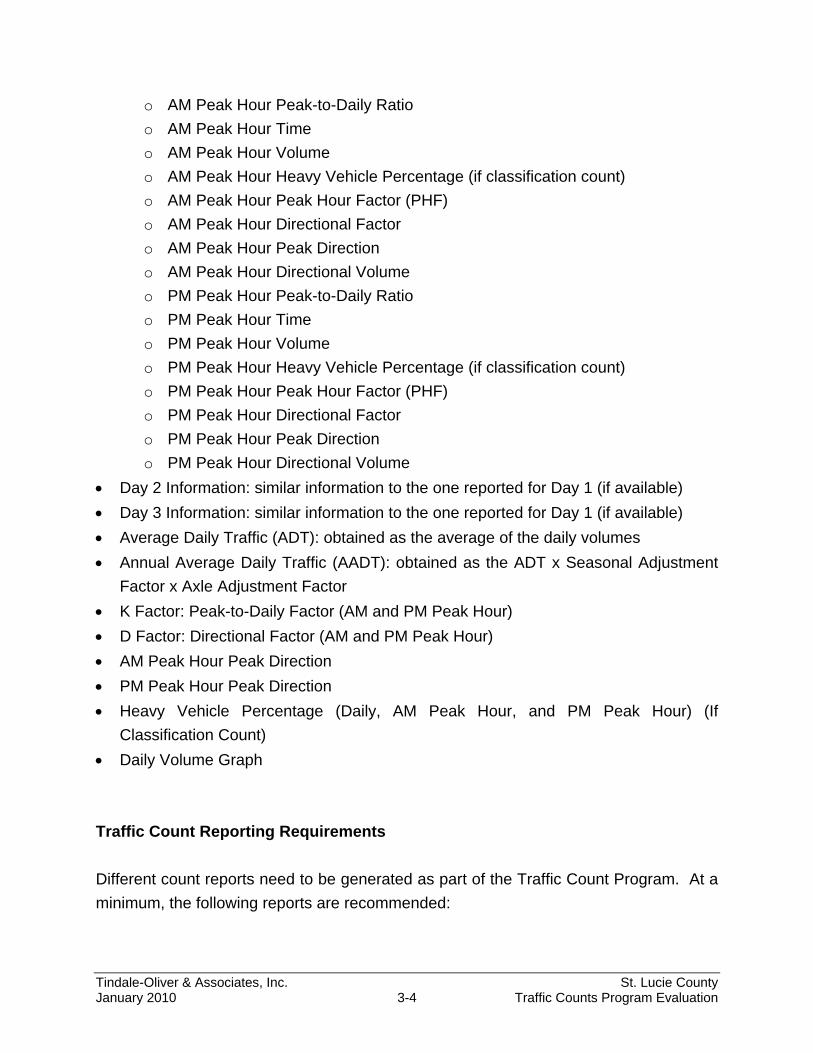
Tindale-Oliver & Associates, Inc. St. Lucie County January 2010 3-4 Traffic Counts Program Evaluation
o AM Peak Hour Peak-to-Daily Ratio
o AM Peak Hour Time
o AM Peak Hour Volume
o AM Peak Hour Heavy Vehicle Percentage (if classification count)
o AM Peak Hour Peak Hour Factor (PHF)
o AM Peak Hour Directional Factor
o AM Peak Hour Peak Direction
o AM Peak Hour Directional Volume
o PM Peak Hour Peak-to-Daily Ratio
o PM Peak Hour Time
o PM Peak Hour Volume
o PM Peak Hour Heavy Vehicle Percentage (if classification count)
o PM Peak Hour Peak Hour Factor (PHF)
o PM Peak Hour Directional Factor
o PM Peak Hour Peak Direction
o PM Peak Hour Directional Volume
Day 2 Information: similar information to the one reported for Day 1 (if available)
Day 3 Information: similar information to the one reported for Day 1 (if available)
Average Daily Traffic (ADT): obtained as the average of the daily volumes
Annual Average Daily Traffic (AADT): obtained as the ADT x Seasonal Adjustment
Factor x Axle Adjustment Factor
K Factor: Peak-to-Daily Factor (AM and PM Peak Hour)
D Factor: Directional Factor (AM and PM Peak Hour)
AM Peak Hour Peak Direction
PM Peak Hour Peak Direction
Heavy Vehicle Percentage (Daily, AM Peak Hour, and PM Peak Hour) (If
Classification Count)
Daily Volume Graph
Traffic Count Reporting Requirements
Different count reports need to be generated as part of the Traffic Count Program. At a
minimum, the following reports are recommended:
Tindale-Oliver & Associates, Inc. St. Lucie County January 2010 3-5 Traffic Counts Program Evaluation
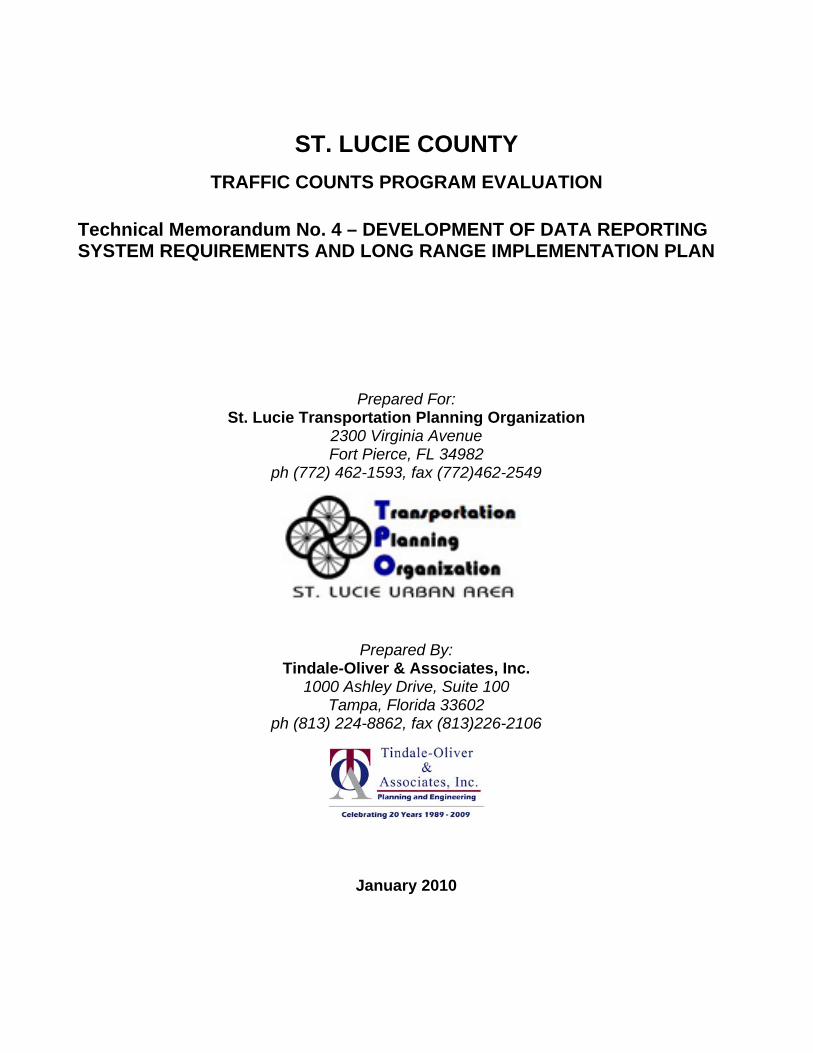
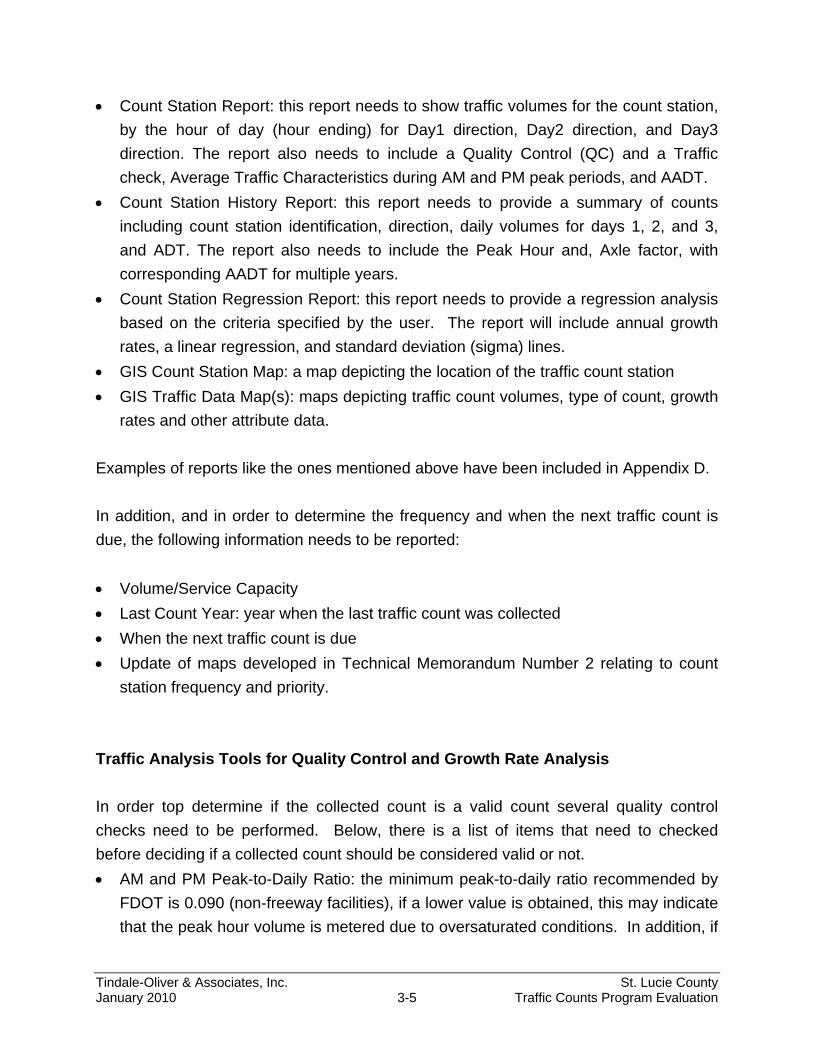
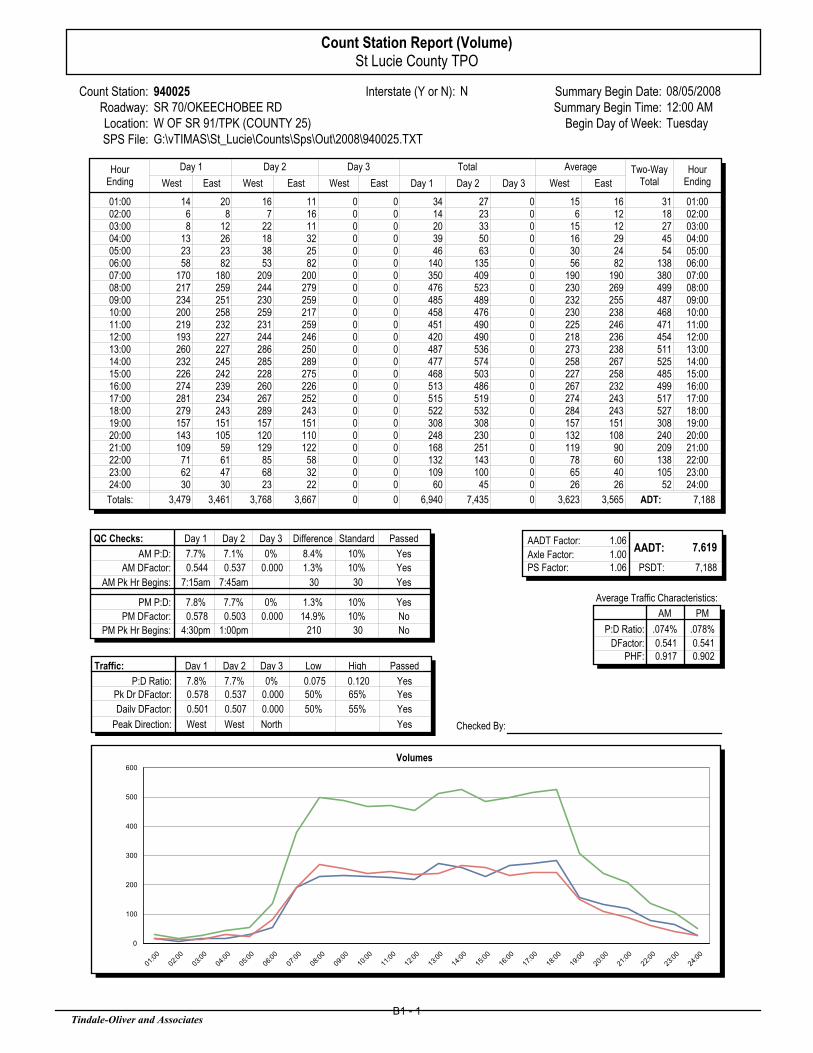
Count Station Report: this report needs to show traffic volumes for the count station,
by the hour of day (hour ending) for Day1 direction, Day2 direction, and Day3
direction. The report also needs to include a Quality Control (QC) and a Traffic
check, Average Traffic Characteristics during AM and PM peak periods, and AADT.
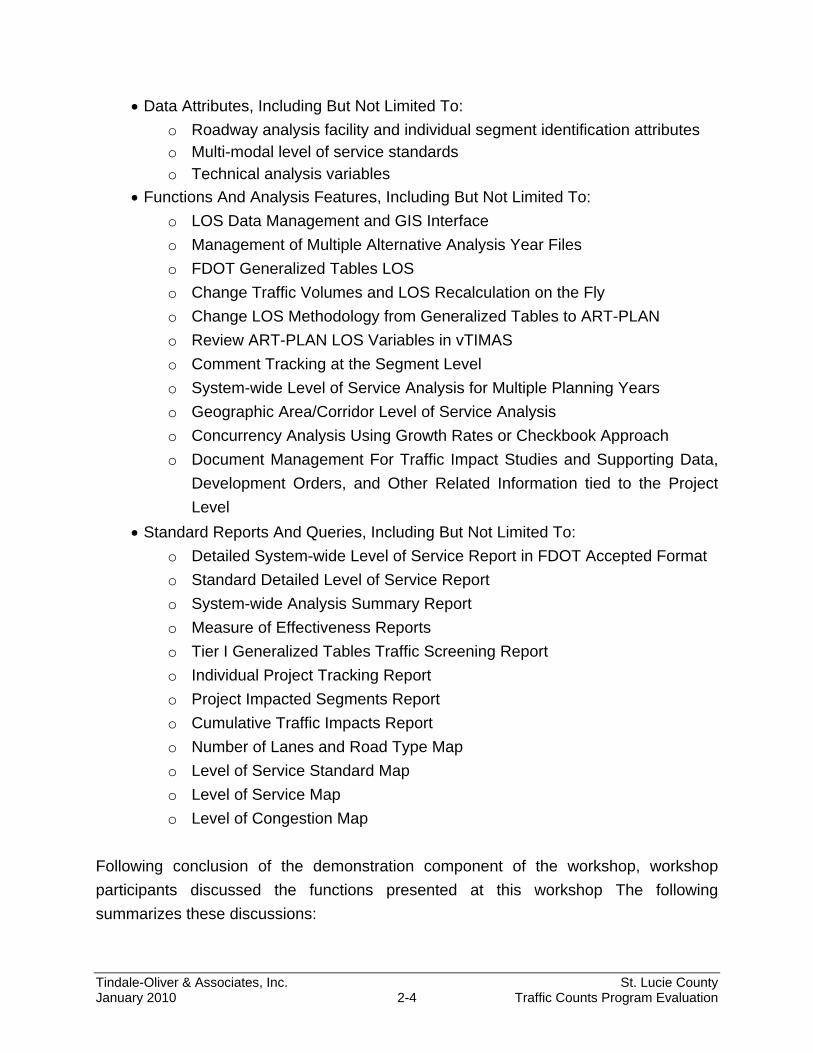
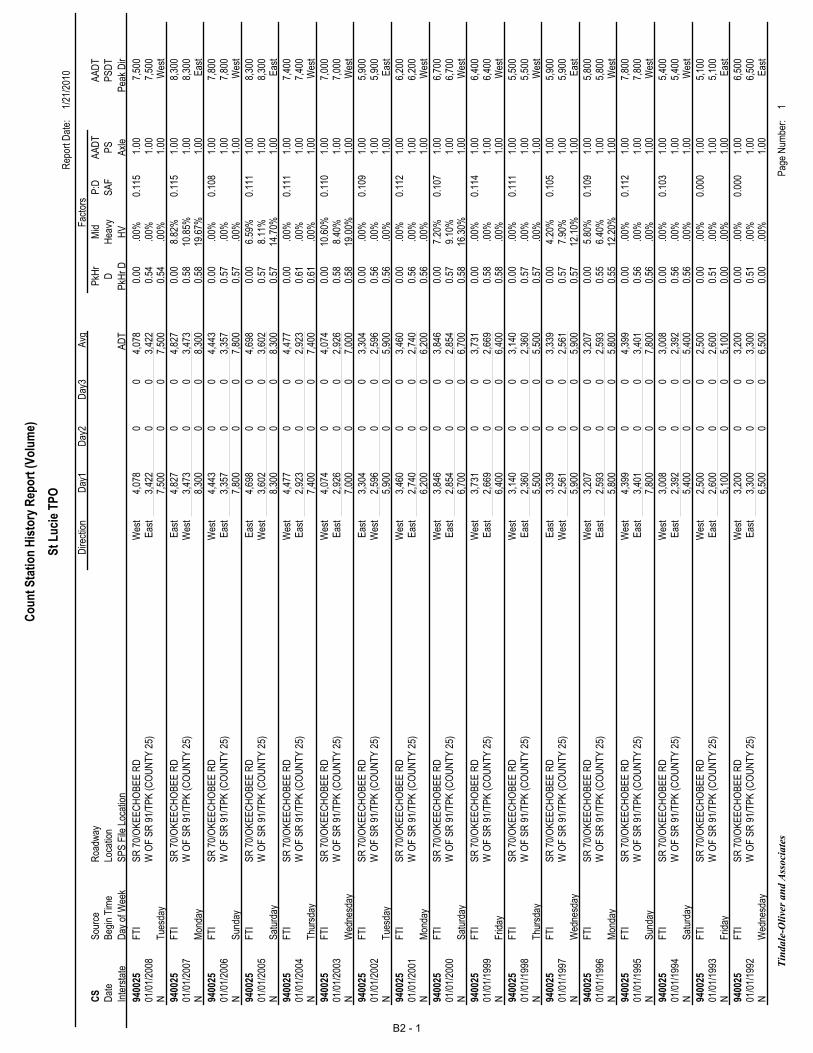
Count Station History Report: this report needs to provide a summary of counts
including count station identification, direction, daily volumes for days 1, 2, and 3,
and ADT. The report also needs to include the Peak Hour and, Axle factor, with
corresponding AADT for multiple years.
Count Station Regression Report: this report needs to provide a regression analysis
based on the criteria specified by the user. The report will include annual growth
rates, a linear regression, and standard deviation (sigma) lines.
GIS Count Station Map: a map depicting the location of the traffic count station
GIS Traffic Data Map(s): maps depicting traffic count volumes, type of count, growth
rates and other attribute data.
Examples of reports like the ones mentioned above have been included in Appendix D.
In addition, and in order to determine the frequency and when the next traffic count is
due, the following information needs to be reported:
Volume/Service Capacity
Last Count Year: year when the last traffic count was collected
When the next traffic count is due
Update of maps developed in Technical Memorandum Number 2 relating to count
station frequency and priority.
Traffic Analysis Tools for Quality Control and Growth Rate Analysis
In order top determine if the collected count is a valid count several quality control
checks need to be performed. Below, there is a list of items that need to checked
before deciding if a collected count should be considered valid or not.
AM and PM Peak-to-Daily Ratio: the minimum peak-to-daily ratio recommended by
FDOT is 0.090 (non-freeway facilities), if a lower value is obtained, this may indicate
that the peak hour volume is metered due to oversaturated conditions. In addition, if
Tindale-Oliver & Associates, Inc. St. Lucie County January 2010 3-6 Traffic Counts Program Evaluation
counts are collected along multiple days, in general a difference between days of up
to 10 percent is considered acceptable. If a higher difference is observed, further
research about field traffic conditions may be necessary as this may indicate that
abnormal conditions occurred during the days the count was taken.
AM and PM Peak Hour D Factor: the minimum D factor recommended by FDOT is
0.52, if a lower value is obtained, this may indicate that the peak hour volume is
metered due to oversaturated conditions. In addition, if counts are collected along
multiple days, in general a difference between days of up to 10 percent is
considered acceptable. If a higher difference is observed, further research about
field traffic conditions may be necessary as this may indicate that abnormal
conditions occurred during the days the count was taken.
AM and PM Peak Hour Starting Time: if counts are collected along multiple days, in
general a difference between the peak hour starting times between days of up to 30
minutes is considered reasonable. If a longer difference is observed, further
research about field traffic conditions may be necessary as this may indicate that
abnormal conditions occurred during the days the count was taken.
Historical Volume Regression: using the available historical data, the system needs
to be capable of developing a historical regression analysis.
Standard Deviation: once the historical regression analysis is developed, if any
traffic count falls outside of an acceptable range of standard deviation(s), it may
indicate that abnormal conditions occurred during the collection of the count and that
the count may needed to be removed from the analysis.
Valid Count: this feature is used when, due to any of the quality control procedures
described above, one specific count year is not considered acceptable for use. This
feature allows not including this specific count in the analysis.
Annual Growth Rate: after developing the linear regression and determining which
counts are valid and which ones are not, the system needs to be capable of
developing an annual average growth rate to be used in calculations of future traffic
volume estimates.
Data Management and GIS Interface
A GIS linkage to the traffic count database is necessary to be able to “map” the traffic
count station data attributes. This can be done by creating a unique count station
identification number (ID) for each count station. It is should be noted that this number

Tindale-Oliver & Associates, Inc. St. Lucie County January 2010 3-7 Traffic Counts Program Evaluation
should not be confused with the “Count Station Number”. The “Count Station Number”
is the number of the count station established by the County or FDOT.
Once the GIS interface is created as described above, any attribute traffic count data
can be displayed for analysis and reporting purposes.
Concurrency Needs and Traffic Data Interface Requirements
As discussed during Workshop Number 2, a number of workshop participants
expressed interest in using uniform data and methodologies for level of service analysis
and reporting. A key benefit of the Traffic Count Program is that it provides the
foundation for possible integration with Level of Service Analysis and Countywide
Concurrency Data Management tools discussed and demonstrated during Workshop
Number 2. The integration of traffic counts, level of service analysis and concurrency
tools will require the following:
Development of a standardized methodology and process for the collection,
updating and production of an Annual Level of Service Report, including a set of
traffic data that is approved for use by all local governments. The Annual Report
and associated data would then be used in all developer submitted traffic impact
studies and the concurrency determination processes of the County and Cities.
Selection and uploading of approved traffic count data into level of service analysis
tools.
Establishment of a countywide Transportation Network that includes all functionally
classified state, county and city roadways that are desired to be monitored.
Establishment of a uniform set of Transportation Network data for level of service
analysis, reporting and review of traffic impact studies for concurrency determination
purposes.
Development of a Concurrency Data Management Tool that has the flexibility of
using the following approaches based on the local jurisdiction’s needs:
o Growth Rates
o Checkbook
o Some combination of the above
Development of security considerations, as discussed below, concerning the use
and availability of data to both, local governments and the private sector.

Tindale-Oliver & Associates, Inc. St. Lucie County January 2010 3-8 Traffic Counts Program Evaluation
User Security Considerations
An objective of the Traffic Count Program is to provide a standardized set of data to the
users of the Program. However, different users will have different levels of access to
the Traffic Count Program as defined below:
Guest: a Guest is a user that has access to a set of approved data and can
download and generate reports if needed. However, a Guest user will not be able to
edit data maintained in the Traffic Counts Program. An example of this user would
be a local government representative or traffic consultant working for a developer
that is looking for approved traffic volume information for Transportation Network
roads.
Authorized User: in addition to the “Guest” user capabilities, an Authorized User
needs to be able to up-load counts, process traffic counts, perform quality control
checks, run reports and decide if the counts are valid or not. Pursuant to
discussions during the two project workshops, it was agreed that the St. Lucie TPO
will be the central housing agency that will keep and process all the count data.
Administrator: in addition to “Guest” and “Authorized User” user capabilities, the
Administrator will be able to make changes to database tables used by the software.
Examples would include updating new seasonal adjustment tables and changing
quality control tolerance levels. This Administrator would likely be the St. Lucie TPO
employee responsible for the management of the Traffic Count Program. The
Consultant may also have access to the Traffic Count Program as an Administrator.
Database Platform
The Traffic Count Program software uses a visual basic front end program and a
Microsoft Access database that is typically installed on a shared file server. This
combination of software provides an easy to use interface and reliable storage of traffic
count data. The Microsoft Access database would also be used for multi-modal
attribute inventory data used in level of service analysis and concurrency
determinations. The software demonstrated during the November 20, 2009 workshop
was written for Windows XP systems and has been tested using Windows Vista (and is
currently being tested using Windows 7). The software is designed to use Crystal
Reports as its reporting backend, and ESRI MapObjects as its mapping backend. Both
are distributed with the software.
Tindale-Oliver & Associates, Inc. St. Lucie County January 2010 3-9 Traffic Counts Program Evaluation
Hardware and Software Needs
The minimum hardware and software needs required to support the Traffic Count
Program are identified below:
Windows XP SP 2 (and Windows Vista)
Recommended: Pentium 4 Processor or better
Recommended: 1,000 MB RAM or more
50 MB Hard Drive space for vTIMAS program files and TOA Application Update
program files
Internet connection to download periodic updates
250 MB to 1,000 MB of server space
Web Based Application Development Requirements
As indicated above, the current version of the vTIMAS traffic count software program is
based on a Visual Basic and Access Database Platform. The implementation of a web
based application for the Traffic Counts Program and GIS interface, if desired, would
need to be developed as a subsequent work effort. Below are the basic and additional
functions and features, and the hosting and infrastructure options.
Basic Functions and Features
Ability to update traffic count station histories and locations using standard exports
from the TPO’s Traffic Count Program as described earlier in this Section
GIS map environment with standard functionality (e.g. pan, zoom, identify feature,
retrieve linked file)
Dynamic labeling and visibility of geographic features (i.e. local streets/labels only
appear when zoomed in beyond a specified extent)
Display of traffic count station locations and display official approved AADT and
count history data when an individual station is selected
Ability to click-on individual count station to open pdf files of count station history
report and download files
Tindale-Oliver & Associates, Inc. St. Lucie County January 2010 3-10 Traffic Counts Program Evaluation
Additional Functions and Features
Dynamic count station history reports (reports generated on the fly as a feature of
the GIS map environment rather than as a previously generated pdf created as part
of an annual update process)
Roadway Attributes
o AADTs
o Lanes, Median Type, and Functional Class
o LOS Standard/Grade
o Service Capacity
o Count Stations Assignments
o Projected Interim Year and Plan Year Volumes
o Volume Smoothing Method
Search feature (to look up count stations by name rather than finding them on the
map)
Hosting and Infrastructure
The TPO does not have a GIS web service/GIS division. The County has a GIS division
and a Map Gallery, but these are static (pdf) maps, not interactive maps. The City of
Port St. Lucie has an interactive GIS map site, but the extents of other data layers do
not appear to be countywide. For the TPO or the County to implement an interactive
GIS mapping site for traffic counts, one of the three options below would need to be
considered:
1. Invest in ESRI ArcGIS server software and support; or
2. Publish the traffic count data using Google Maps; or
3. Contract with a consultant to host and maintain an interactive TPO Traffic Count
Program website.
Generally, the first and third options could support both the minimum and optional
functionality. The second option most readily supports only the minimum requirements.
Should a web based Traffic Counts Program option be desired by the TPO, a systems
development specification should be developed as part of a subsequent work effort.
Tindale-Oliver & Associates, Inc. St. Lucie County January 2010 4-1 Traffic Counts Program Evaluation
Section 4
IMPLEMENTATION PLAN
The Implementation Plan includes three program areas: 1) Traffic Count Program Tool,
2) Level of Service Analysis and Reporting Tool, and 3) Concurrency Data Management
Tool. The Implementation Plan is organized into the following sub-sections:
Task Definition and Priority Rank
Responsibility for Implementation
Implementation Schedule
Hardware Costs
Consultant Costs
Each of the above sub-sections is discussed below.
Task Definition and Priority Rank
The tasks necessary to implement each of the above referenced program areas
includes the following:
1. Traffic Count Program Tool
a. Formalize a standardized methodology and process for the annual
collection and processing of traffic counts
b. Traffic Count Program Tool software modifications, testing and
acceptance review
c. Traffic Count Program Tool software installation and TPO staff training
d. Collection of 2010 traffic count data
e. Processing and quality control of 2010 Traffic counts
f. On-going Traffic Count Program Tool support services
2. Level of Service Analysis and Reporting Tool
a. Formalize a standardized methodology and process for the collection,
updating and production of an Annual Level of Service Report, including
update of data attributes
b. Level of Service Analysis and Reporting Tool software modifications,
testing and acceptance review
Tindale-Oliver & Associates, Inc. St. Lucie County January 2010 4-2 Traffic Counts Program Evaluation
c. Level of Service Analysis and Reporting Tool installation and TPO staff
training
d. Perform 2010 Level of Service Analysis and Produce Annual Level of
Service Report
e. On-going Level of Service Analysis and Reporting Tool support services
3. Concurrency Data Management Tool
a. Formalize standard traffic impact study methodology and review
procedures
b. Conduct presentations to private sector traffic consultants on standard
traffic impact study methodology and review procedures; obtain comments
and adjust procedures; and obtain community buy-in and TPO Board
approval of methodology and procedures
c. Concurrency Data Management Tool software modifications, testing and
acceptance review
d. Concurrency data management software installation and TPO staff
training
e. Concurrency data management software installation and training for
county and city staffs
f. On-going concurrency data management support services
The order in which the tasks have been defined above is the priority order that needs to
be followed during the implementation of the three program areas. To summarize:
First, it is necessary to have a Traffic Count Program that reasonably reflects the
historical and current traffic volume levels on the roadway network, and project
future traffic volumes based on staff approved growth rates (Traffic Count Program
Tool);
Second, once the traffic volumes are known and future projections can be
developed, level of service analysis needs to be performed to evaluate the level of
service operating condition of the roadway network. (Level of Service Analysis and
Reporting Tool); and
Third, given the development and approval of the Annual Level of Service Report,
future development proposals can be reviewed, tracked and approved as
appropriate (Countywide Concurrency Data Management Tool).
Tindale-Oliver & Associates, Inc. St. Lucie County January 2010 4-3 Traffic Counts Program Evaluation
1st Quarter 2nd Quarter 3rd Quarter 4th Quarter 1st Quarter 2nd Quarter
Traffic Count Tool
Level of Service Analysis and Reporting Tool
Countywide Concurrency Data Management Tool
Year 2010 Year 2011ACTIVITY
Responsibility
The current Traffic Count Program is managed by St. Lucie County’s Public Works
Department. However, due to staff shortage issues previously discussed, the existing
program is not able to be maintained. Also, at the present time, neither the City of Port
St. Lucie nor the City of Fort Pierce has a formal Traffic Count Program in place.
Pursuant to discussions that occurred during the workshops held on October 2, 2009
and November 20, 2009, the county and the cities have indicated concurrence that the
St Lucie TPO should be the responsible agency for the Traffic Counts Program and act
as a clearing house for the collection and management of all traffic counts performed in
St. Lucie County by the cities, County, and FDOT. In addition, since the St Lucie TPO
committees include representation from both the County and the Cities, it makes logical
sense that the TPO could also be the lead agency for the development of the County-
wide Annual Level of Service Report. This would also entail the updating of level of
service data attribute data and managing the Level of Service Analysis and Reporting
Tool previously discussed.
The agency responsible for the Concurrency Data Management Tool will need to be
agreed on between the cities, county, and TPO. One of the key decisions that needs to
be determined is if the Concurrency Data Management Tool will be developed as a
web-based application or be initially deployed as a server based tool. Should a web
based option be desired by the TPO, a systems development specification should be
developed as part of a subsequent work effort.
Schedule
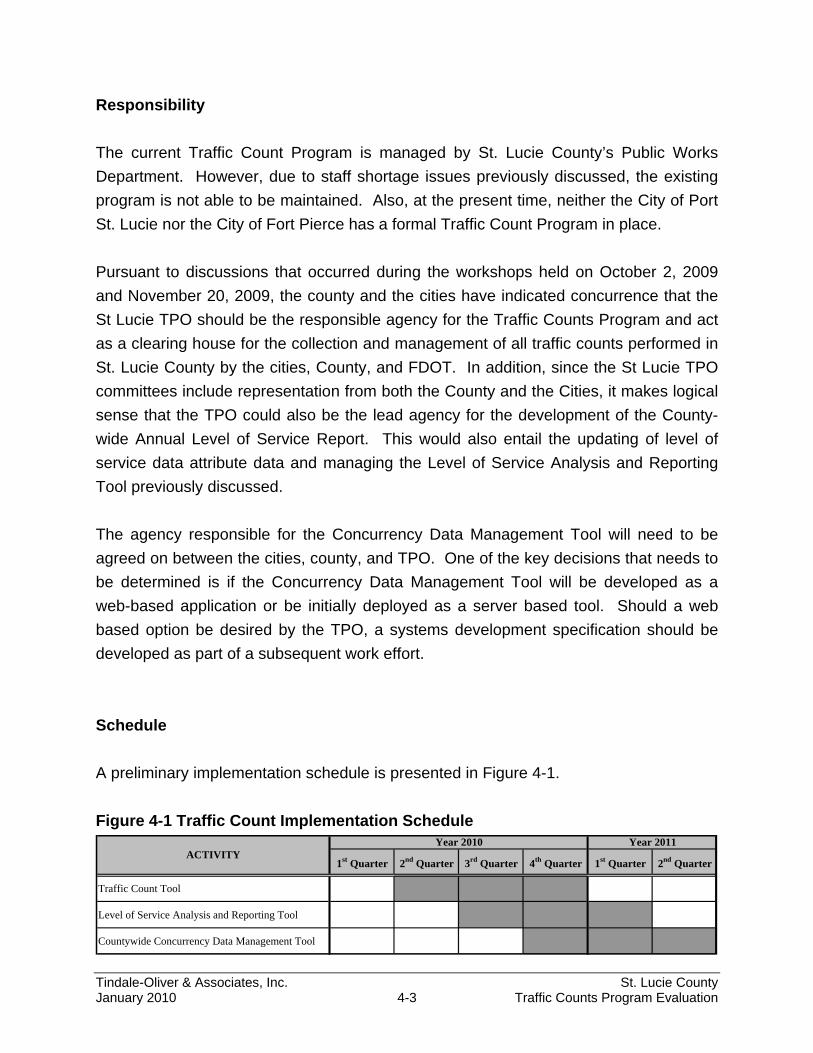
A preliminary implementation schedule is presented in Figure 4-1.
Figure 4-1 Traffic Count Implementation Schedule

Tindale-Oliver & Associates, Inc. St. Lucie County January 2010 4-4 Traffic Counts Program Evaluation
As shown in Figure 4-1, the complete implementation of the program is estimated to be
completed over a 15 month period. This schedule will be updated based on the
approved Phase II work effort.
Hardware Costs
Based on the hardware needs described in Section 3 of this Technical Memorandum, a
standard personal computer would be adequate for support of the proposed vTIMAS
software tool. As such, existing TPO work stations could be used for the vTIMAS
software tool. If additional computers are needed, they should be purchased using the
standard county personal computer bid specification.
Consultant Costs
The cost of the implementation of the Traffic Count Program has been prepared and is
included in Appendix E. This cost is estimated at $98,816.32 and includes the following
tasks:
1. Develop and formalize a standardized methodology and process for the annual
collection and processing of traffic counts
2. Traffic Count Program Tool software modifications, testing and acceptance review
3. Traffic Count Program Tool software installation and TPO staff training
4. Collection of 2010 traffic count data
5. Processing and quality control of 2010 Traffic counts
6. On-going Traffic Count Program Tool support services
The above number ($98,816.32) includes $36,661.08 corresponding to the outsourcing
of traffic counts.
Program areas 2 (Level of Service and Reporting Tool) and 3 (Concurrency Data
Management Tool) are not included in the project costs in Appendix E. A separate
budget will be prepared for these program areas.
APPENDIX A
ST. LUCIE COUNTY
TRAFFIC COUNTS PROGRAM EVALUATION
FDOT Conversion Factors in St Lucie County
1. Seasonal Conversion Factors
2. Axle Conversion Factors
2008 Peak Season Factor Category Report - Report Type: ALLCategory: 9400 EAST-A1A TO US1 MOCF: 0.86Week Dates SF PSCF================================================================================ 1 01/01/2008 - 01/05/2008 1.02 1.19 2 01/06/2008 - 01/12/2008 0.98 1.14 3 01/13/2008 - 01/19/2008 0.93 1.08* 4 01/20/2008 - 01/26/2008 0.90 1.05* 5 01/27/2008 - 02/02/2008 0.88 1.03* 6 02/03/2008 - 02/09/2008 0.86 1.00* 7 02/10/2008 - 02/16/2008 0.83 0.97* 8 02/17/2008 - 02/23/2008 0.83 0.97* 9 02/24/2008 - 03/01/2008 0.83 0.97*10 03/02/2008 - 03/08/2008 0.83 0.97*11 03/09/2008 - 03/15/2008 0.83 0.97*12 03/16/2008 - 03/22/2008 0.84 0.98*13 03/23/2008 - 03/29/2008 0.86 1.00*14 03/30/2008 - 04/05/2008 0.87 1.01*15 04/06/2008 - 04/12/2008 0.89 1.04*16 04/13/2008 - 04/19/2008 0.90 1.05 17 04/20/2008 - 04/26/2008 0.93 1.08 18 04/27/2008 - 05/03/2008 0.96 1.12 19 05/04/2008 - 05/10/2008 0.99 1.15 20 05/11/2008 - 05/17/2008 1.03 1.20 21 05/18/2008 - 05/24/2008 1.04 1.21 22 05/25/2008 - 05/31/2008 1.06 1.24 23 06/01/2008 - 06/07/2008 1.08 1.26 24 06/08/2008 - 06/14/2008 1.10 1.28 25 06/15/2008 - 06/21/2008 1.12 1.31 26 06/22/2008 - 06/28/2008 1.12 1.31 27 06/29/2008 - 07/05/2008 1.12 1.31 28 07/06/2008 - 07/12/2008 1.13 1.32 29 07/13/2008 - 07/19/2008 1.13 1.32 30 07/20/2008 - 07/26/2008 1.14 1.33 31 07/27/2008 - 08/02/2008 1.15 1.34 32 08/03/2008 - 08/09/2008 1.17 1.36 33 08/10/2008 - 08/16/2008 1.18 1.38 34 08/17/2008 - 08/23/2008 1.17 1.36 35 08/24/2008 - 08/30/2008 1.17 1.36 36 08/31/2008 - 09/06/2008 1.17 1.36 37 09/07/2008 - 09/13/2008 1.17 1.36 38 09/14/2008 - 09/20/2008 1.16 1.35 39 09/21/2008 - 09/27/2008 1.14 1.33 40 09/28/2008 - 10/04/2008 1.13 1.32 41 10/05/2008 - 10/11/2008 1.11 1.29 42 10/12/2008 - 10/18/2008 1.09 1.27 43 10/19/2008 - 10/25/2008 1.07 1.25 44 10/26/2008 - 11/01/2008 1.06 1.24 45 11/02/2008 - 11/08/2008 1.04 1.21 46 11/09/2008 - 11/15/2008 1.03 1.20 47 11/16/2008 - 11/22/2008 1.03 1.20 48 11/23/2008 - 11/29/2008 1.03 1.20 49 11/30/2008 - 12/06/2008 1.02 1.19 50 12/07/2008 - 12/13/2008 1.02 1.19 51 12/14/2008 - 12/20/2008 1.02 1.19 52 12/21/2008 - 12/27/2008 0.98 1.14 53 12/28/2008 - 12/31/2008 0.93 1.08
* Peak Season
Page 1 of 4
A1 - 1
2008 Peak Season Factor Category Report - Report Type: ALLCategory: 9401 CEN.-W OF US1 TO I95 MOCF: 0.94Week Dates SF PSCF================================================================================ 1 01/01/2008 - 01/05/2008 0.99 1.06 2 01/06/2008 - 01/12/2008 0.98 1.05 3 01/13/2008 - 01/19/2008 0.97 1.04* 4 01/20/2008 - 01/26/2008 0.96 1.03* 5 01/27/2008 - 02/02/2008 0.94 1.00* 6 02/03/2008 - 02/09/2008 0.93 0.99* 7 02/10/2008 - 02/16/2008 0.91 0.97* 8 02/17/2008 - 02/23/2008 0.92 0.98* 9 02/24/2008 - 03/01/2008 0.92 0.98*10 03/02/2008 - 03/08/2008 0.92 0.98*11 03/09/2008 - 03/15/2008 0.93 0.99*12 03/16/2008 - 03/22/2008 0.93 0.99*13 03/23/2008 - 03/29/2008 0.94 1.00*14 03/30/2008 - 04/05/2008 0.95 1.02*15 04/06/2008 - 04/12/2008 0.95 1.02*16 04/13/2008 - 04/19/2008 0.96 1.03 17 04/20/2008 - 04/26/2008 0.97 1.04 18 04/27/2008 - 05/03/2008 0.98 1.05 19 05/04/2008 - 05/10/2008 0.99 1.06 20 05/11/2008 - 05/17/2008 1.00 1.07 21 05/18/2008 - 05/24/2008 1.00 1.07 22 05/25/2008 - 05/31/2008 1.01 1.08 23 06/01/2008 - 06/07/2008 1.02 1.09 24 06/08/2008 - 06/14/2008 1.02 1.09 25 06/15/2008 - 06/21/2008 1.03 1.10 26 06/22/2008 - 06/28/2008 1.04 1.11 27 06/29/2008 - 07/05/2008 1.06 1.13 28 07/06/2008 - 07/12/2008 1.07 1.14 29 07/13/2008 - 07/19/2008 1.09 1.17 30 07/20/2008 - 07/26/2008 1.08 1.15 31 07/27/2008 - 08/02/2008 1.08 1.15 32 08/03/2008 - 08/09/2008 1.08 1.15 33 08/10/2008 - 08/16/2008 1.08 1.15 34 08/17/2008 - 08/23/2008 1.08 1.15 35 08/24/2008 - 08/30/2008 1.07 1.14 36 08/31/2008 - 09/06/2008 1.07 1.14 37 09/07/2008 - 09/13/2008 1.06 1.13 38 09/14/2008 - 09/20/2008 1.06 1.13 39 09/21/2008 - 09/27/2008 1.05 1.12 40 09/28/2008 - 10/04/2008 1.04 1.11 41 10/05/2008 - 10/11/2008 1.03 1.10 42 10/12/2008 - 10/18/2008 1.02 1.09 43 10/19/2008 - 10/25/2008 1.01 1.08 44 10/26/2008 - 11/01/2008 1.01 1.08 45 11/02/2008 - 11/08/2008 1.00 1.07 46 11/09/2008 - 11/15/2008 1.00 1.07 47 11/16/2008 - 11/22/2008 1.00 1.07 48 11/23/2008 - 11/29/2008 1.00 1.07 49 11/30/2008 - 12/06/2008 0.99 1.06 50 12/07/2008 - 12/13/2008 0.99 1.06 51 12/14/2008 - 12/20/2008 0.99 1.06 52 12/21/2008 - 12/27/2008 0.98 1.05 53 12/28/2008 - 12/31/2008 0.97 1.04
* Peak Season
Page 2 of 4
A1 - 2
2008 Peak Season Factor Category Report - Report Type: ALLCategory: 9402 WEST-W OF I95 MOCF: 0.84Week Dates SF PSCF================================================================================ 1 01/01/2008 - 01/05/2008 0.97 1.15 2 01/06/2008 - 01/12/2008 0.92 1.09* 3 01/13/2008 - 01/19/2008 0.87 1.03* 4 01/20/2008 - 01/26/2008 0.86 1.02* 5 01/27/2008 - 02/02/2008 0.84 0.99* 6 02/03/2008 - 02/09/2008 0.82 0.97* 7 02/10/2008 - 02/16/2008 0.81 0.96* 8 02/17/2008 - 02/23/2008 0.81 0.96* 9 02/24/2008 - 03/01/2008 0.82 0.97*10 03/02/2008 - 03/08/2008 0.82 0.97*11 03/09/2008 - 03/15/2008 0.83 0.98*12 03/16/2008 - 03/22/2008 0.85 1.01*13 03/23/2008 - 03/29/2008 0.87 1.03*14 03/30/2008 - 04/05/2008 0.88 1.04*15 04/06/2008 - 04/12/2008 0.90 1.07 16 04/13/2008 - 04/19/2008 0.92 1.09 17 04/20/2008 - 04/26/2008 0.94 1.11 18 04/27/2008 - 05/03/2008 0.97 1.15 19 05/04/2008 - 05/10/2008 0.99 1.17 20 05/11/2008 - 05/17/2008 1.01 1.20 21 05/18/2008 - 05/24/2008 1.03 1.22 22 05/25/2008 - 05/31/2008 1.05 1.24 23 06/01/2008 - 06/07/2008 1.08 1.28 24 06/08/2008 - 06/14/2008 1.10 1.30 25 06/15/2008 - 06/21/2008 1.12 1.33 26 06/22/2008 - 06/28/2008 1.15 1.36 27 06/29/2008 - 07/05/2008 1.18 1.40 28 07/06/2008 - 07/12/2008 1.21 1.43 29 07/13/2008 - 07/19/2008 1.24 1.47 30 07/20/2008 - 07/26/2008 1.25 1.48 31 07/27/2008 - 08/02/2008 1.26 1.49 32 08/03/2008 - 08/09/2008 1.27 1.50 33 08/10/2008 - 08/16/2008 1.27 1.50 34 08/17/2008 - 08/23/2008 1.26 1.49 35 08/24/2008 - 08/30/2008 1.24 1.47 36 08/31/2008 - 09/06/2008 1.22 1.44 37 09/07/2008 - 09/13/2008 1.20 1.42 38 09/14/2008 - 09/20/2008 1.18 1.40 39 09/21/2008 - 09/27/2008 1.16 1.37 40 09/28/2008 - 10/04/2008 1.13 1.34 41 10/05/2008 - 10/11/2008 1.11 1.31 42 10/12/2008 - 10/18/2008 1.08 1.28 43 10/19/2008 - 10/25/2008 1.05 1.24 44 10/26/2008 - 11/01/2008 1.02 1.21 45 11/02/2008 - 11/08/2008 0.99 1.17 46 11/09/2008 - 11/15/2008 0.96 1.14 47 11/16/2008 - 11/22/2008 0.96 1.14 48 11/23/2008 - 11/29/2008 0.96 1.14 49 11/30/2008 - 12/06/2008 0.96 1.14 50 12/07/2008 - 12/13/2008 0.96 1.14 51 12/14/2008 - 12/20/2008 0.97 1.15 52 12/21/2008 - 12/27/2008 0.92 1.09 53 12/28/2008 - 12/31/2008 0.87 1.03
* Peak Season
Page 3 of 4
A1 - 3
2008 Peak Season Factor Category Report - Report Type: ALLCategory: 9495 ST LUCIE I95 MOCF: 0.90Week Dates SF PSCF================================================================================ 1 01/01/2008 - 01/05/2008 0.95 1.06 2 01/06/2008 - 01/12/2008 0.94 1.04 3 01/13/2008 - 01/19/2008 0.94 1.04* 4 01/20/2008 - 01/26/2008 0.93 1.03* 5 01/27/2008 - 02/02/2008 0.92 1.02* 6 02/03/2008 - 02/09/2008 0.91 1.01* 7 02/10/2008 - 02/16/2008 0.90 1.00* 8 02/17/2008 - 02/23/2008 0.89 0.99* 9 02/24/2008 - 03/01/2008 0.88 0.98*10 03/02/2008 - 03/08/2008 0.87 0.97*11 03/09/2008 - 03/15/2008 0.86 0.96*12 03/16/2008 - 03/22/2008 0.88 0.98*13 03/23/2008 - 03/29/2008 0.89 0.99*14 03/30/2008 - 04/05/2008 0.91 1.01*15 04/06/2008 - 04/12/2008 0.92 1.02*16 04/13/2008 - 04/19/2008 0.94 1.04 17 04/20/2008 - 04/26/2008 0.96 1.07 18 04/27/2008 - 05/03/2008 0.98 1.09 19 05/04/2008 - 05/10/2008 1.00 1.11 20 05/11/2008 - 05/17/2008 1.02 1.13 21 05/18/2008 - 05/24/2008 1.03 1.14 22 05/25/2008 - 05/31/2008 1.04 1.16 23 06/01/2008 - 06/07/2008 1.04 1.16 24 06/08/2008 - 06/14/2008 1.05 1.17 25 06/15/2008 - 06/21/2008 1.06 1.18 26 06/22/2008 - 06/28/2008 1.06 1.18 27 06/29/2008 - 07/05/2008 1.06 1.18 28 07/06/2008 - 07/12/2008 1.06 1.18 29 07/13/2008 - 07/19/2008 1.06 1.18 30 07/20/2008 - 07/26/2008 1.07 1.19 31 07/27/2008 - 08/02/2008 1.09 1.21 32 08/03/2008 - 08/09/2008 1.11 1.23 33 08/10/2008 - 08/16/2008 1.12 1.24 34 08/17/2008 - 08/23/2008 1.13 1.26 35 08/24/2008 - 08/30/2008 1.14 1.27 36 08/31/2008 - 09/06/2008 1.15 1.28 37 09/07/2008 - 09/13/2008 1.16 1.29 38 09/14/2008 - 09/20/2008 1.17 1.30 39 09/21/2008 - 09/27/2008 1.15 1.28 40 09/28/2008 - 10/04/2008 1.13 1.26 41 10/05/2008 - 10/11/2008 1.11 1.23 42 10/12/2008 - 10/18/2008 1.09 1.21 43 10/19/2008 - 10/25/2008 1.07 1.19 44 10/26/2008 - 11/01/2008 1.05 1.17 45 11/02/2008 - 11/08/2008 1.02 1.13 46 11/09/2008 - 11/15/2008 1.00 1.11 47 11/16/2008 - 11/22/2008 0.99 1.10 48 11/23/2008 - 11/29/2008 0.98 1.09 49 11/30/2008 - 12/06/2008 0.97 1.08 50 12/07/2008 - 12/13/2008 0.96 1.07 51 12/14/2008 - 12/20/2008 0.95 1.06 52 12/21/2008 - 12/27/2008 0.94 1.04 53 12/28/2008 - 12/31/2008 0.94 1.04
* Peak Season
Page 4 of 4
A1 - 4

2008 Weekly Axle Factor Category Report - Report Type: ALL
County: 94 - ST.LUCIE
Week Dates 9401 9407 9408 9409
COUNTY ROADS (RURAL) SR70,KINGS TO I-95 SR70,I-95 TO US 1 SR614, EMERSON-KINGS
1 01/01/2008 - 01/05/2008 0.85 0.82 0.98 0.98
2 01/06/2008 - 01/12/2008 0.84 0.82 0.98 0.98
3 01/13/2008 - 01/19/2008 0.82 0.82 0.98 0.98
4 01/20/2008 - 01/26/2008 0.82 0.82 0.98 0.98
5 01/27/2008 - 02/02/2008 0.82 0.82 0.98 0.98
6 02/03/2008 - 02/09/2008 0.82 0.82 0.98 0.98
7 02/10/2008 - 02/16/2008 0.82 0.82 0.98 0.98
8 02/17/2008 - 02/23/2008 0.82 0.82 0.98 0.98
9 02/24/2008 - 03/01/2008 0.82 0.82 0.98 0.98
10 03/02/2008 - 03/08/2008 0.82 0.82 0.98 0.98
11 03/09/2008 - 03/15/2008 0.82 0.82 0.98 0.98
12 03/16/2008 - 03/22/2008 0.84 0.82 0.98 0.98
13 03/23/2008 - 03/29/2008 0.85 0.82 0.98 0.98
14 03/30/2008 - 04/05/2008 0.87 0.82 0.98 0.98
15 04/06/2008 - 04/12/2008 0.89 0.82 0.98 0.98
16 04/13/2008 - 04/19/2008 0.90 0.82 0.98 0.98
17 04/20/2008 - 04/26/2008 0.89 0.82 0.98 0.98
18 04/27/2008 - 05/03/2008 0.88 0.82 0.98 0.98
19 05/04/2008 - 05/10/2008 0.86 0.82 0.98 0.98
20 05/11/2008 - 05/17/2008 0.85 0.82 0.98 0.98
21 05/18/2008 - 05/24/2008 0.85 0.82 0.98 0.98
22 05/25/2008 - 05/31/2008 0.86 0.82 0.98 0.98
23 06/01/2008 - 06/07/2008 0.86 0.82 0.98 0.98
24 06/08/2008 - 06/14/2008 0.87 0.82 0.98 0.98
25 06/15/2008 - 06/21/2008 0.87 0.82 0.98 0.98
26 06/22/2008 - 06/28/2008 0.88 0.82 0.98 0.98
27 06/29/2008 - 07/05/2008 0.88 0.82 0.98 0.98
28 07/06/2008 - 07/12/2008 0.89 0.82 0.98 0.98
29 07/13/2008 - 07/19/2008 0.90 0.82 0.98 0.98
30 07/20/2008 - 07/26/2008 0.90 0.82 0.98 0.98
31 07/27/2008 - 08/02/2008 0.90 0.82 0.98 0.98
32 08/03/2008 - 08/09/2008 0.90 0.82 0.98 0.98
33 08/10/2008 - 08/16/2008 0.90 0.82 0.98 0.98
34 08/17/2008 - 08/23/2008 0.90 0.82 0.98 0.98
35 08/24/2008 - 08/30/2008 0.90 0.82 0.98 0.98
36 08/31/2008 - 09/06/2008 0.89 0.82 0.98 0.98
37 09/07/2008 - 09/13/2008 0.89 0.82 0.98 0.98
38 09/14/2008 - 09/20/2008 0.89 0.82 0.98 0.98
39 09/21/2008 - 09/27/2008 0.88 0.82 0.98 0.98
40 09/28/2008 - 10/04/2008 0.88 0.82 0.98 0.98
41 10/05/2008 - 10/11/2008 0.88 0.82 0.98 0.98
42 10/12/2008 - 10/18/2008 0.87 0.82 0.98 0.98
43 10/19/2008 - 10/25/2008 0.87 0.82 0.98 0.98
44 10/26/2008 - 11/01/2008 0.87 0.82 0.98 0.98
45 11/02/2008 - 11/08/2008 0.86 0.82 0.98 0.98
46 11/09/2008 - 11/15/2008 0.86 0.82 0.98 0.98
47 11/16/2008 - 11/22/2008 0.86 0.82 0.98 0.98
48 11/23/2008 - 11/29/2008 0.86 0.82 0.98 0.98
49 11/30/2008 - 12/06/2008 0.85 0.82 0.98 0.98
50 12/07/2008 - 12/13/2008 0.85 0.82 0.98 0.98
51 12/14/2008 - 12/20/2008 0.85 0.82 0.98 0.98
52 12/21/2008 - 12/27/2008 0.84 0.82 0.98 0.98
53 12/28/2008 - 12/31/2008 0.82 0.82 0.98 0.98
A2 - 1

2008 Weekly Axle Factor Category Report - Report Type: ALL
County: 94 - ST.LUCIE
Week Dates 9410 9411 9412 9413
COUNTY ROADS (URBAN) SR713, I-95-US 1 I-95 SR713, SR70 - I-95
1 01/01/2008 - 01/05/2008 0.98 0.95 0.86 0.84
2 01/06/2008 - 01/12/2008 0.98 0.95 0.86 0.84
3 01/13/2008 - 01/19/2008 0.98 0.95 0.86 0.84
4 01/20/2008 - 01/26/2008 0.98 0.95 0.86 0.84
5 01/27/2008 - 02/02/2008 0.98 0.95 0.85 0.84
6 02/03/2008 - 02/09/2008 0.98 0.95 0.84 0.84
7 02/10/2008 - 02/16/2008 0.98 0.95 0.84 0.84
8 02/17/2008 - 02/23/2008 0.98 0.95 0.84 0.84
9 02/24/2008 - 03/01/2008 0.98 0.95 0.85 0.84
10 03/02/2008 - 03/08/2008 0.98 0.95 0.85 0.84
11 03/09/2008 - 03/15/2008 0.98 0.95 0.85 0.84
12 03/16/2008 - 03/22/2008 0.98 0.95 0.85 0.84
13 03/23/2008 - 03/29/2008 0.98 0.95 0.85 0.84
14 03/30/2008 - 04/05/2008 0.98 0.95 0.85 0.84
15 04/06/2008 - 04/12/2008 0.98 0.95 0.85 0.84
16 04/13/2008 - 04/19/2008 0.98 0.95 0.85 0.84
17 04/20/2008 - 04/26/2008 0.98 0.95 0.85 0.84
18 04/27/2008 - 05/03/2008 0.98 0.95 0.84 0.84
19 05/04/2008 - 05/10/2008 0.98 0.95 0.83 0.84
20 05/11/2008 - 05/17/2008 0.98 0.95 0.83 0.84
21 05/18/2008 - 05/24/2008 0.98 0.95 0.83 0.84
22 05/25/2008 - 05/31/2008 0.98 0.95 0.83 0.84
23 06/01/2008 - 06/07/2008 0.98 0.95 0.84 0.84
24 06/08/2008 - 06/14/2008 0.98 0.95 0.84 0.84
25 06/15/2008 - 06/21/2008 0.98 0.95 0.84 0.84
26 06/22/2008 - 06/28/2008 0.98 0.95 0.84 0.84
27 06/29/2008 - 07/05/2008 0.98 0.95 0.84 0.84
28 07/06/2008 - 07/12/2008 0.98 0.95 0.84 0.84
29 07/13/2008 - 07/19/2008 0.98 0.95 0.84 0.84
30 07/20/2008 - 07/26/2008 0.98 0.95 0.84 0.84
31 07/27/2008 - 08/02/2008 0.98 0.95 0.85 0.84
32 08/03/2008 - 08/09/2008 0.98 0.95 0.85 0.84
33 08/10/2008 - 08/16/2008 0.98 0.95 0.85 0.84
34 08/17/2008 - 08/23/2008 0.98 0.95 0.85 0.84
35 08/24/2008 - 08/30/2008 0.98 0.95 0.84 0.84
36 08/31/2008 - 09/06/2008 0.98 0.95 0.84 0.84
37 09/07/2008 - 09/13/2008 0.98 0.95 0.83 0.84
38 09/14/2008 - 09/20/2008 0.98 0.95 0.83 0.84
39 09/21/2008 - 09/27/2008 0.98 0.95 0.83 0.84
40 09/28/2008 - 10/04/2008 0.98 0.95 0.83 0.84
41 10/05/2008 - 10/11/2008 0.98 0.95 0.83 0.84
42 10/12/2008 - 10/18/2008 0.98 0.95 0.83 0.84
43 10/19/2008 - 10/25/2008 0.98 0.95 0.84 0.84
44 10/26/2008 - 11/01/2008 0.98 0.95 0.85 0.84
45 11/02/2008 - 11/08/2008 0.98 0.95 0.85 0.84
46 11/09/2008 - 11/15/2008 0.98 0.95 0.86 0.84
47 11/16/2008 - 11/22/2008 0.98 0.95 0.86 0.84
48 11/23/2008 - 11/29/2008 0.98 0.95 0.86 0.84
49 11/30/2008 - 12/06/2008 0.98 0.95 0.86 0.84
50 12/07/2008 - 12/13/2008 0.98 0.95 0.86 0.84
51 12/14/2008 - 12/20/2008 0.98 0.95 0.86 0.84
52 12/21/2008 - 12/27/2008 0.98 0.95 0.86 0.84
53 12/28/2008 - 12/31/2008 0.98 0.95 0.86 0.84
A2 - 2
2008 Weekly Axle Factor Category Report - Report Type: ALL
County: 94 - ST.LUCIE
Week Dates 9414 9415 9416 9417
SR614, I95-EMERSON SR615/25TH ST SR608,ST LUCIE BLVD SR5, MARTIN CO - IND
1 01/01/2008 - 01/05/2008 0.93 0.99 0.95 0.95
2 01/06/2008 - 01/12/2008 0.93 0.99 0.95 0.95
3 01/13/2008 - 01/19/2008 0.93 0.99 0.95 0.95
4 01/20/2008 - 01/26/2008 0.93 0.99 0.95 0.95
5 01/27/2008 - 02/02/2008 0.93 0.99 0.95 0.95
6 02/03/2008 - 02/09/2008 0.93 0.99 0.95 0.95
7 02/10/2008 - 02/16/2008 0.93 0.99 0.95 0.95
8 02/17/2008 - 02/23/2008 0.93 0.99 0.95 0.95
9 02/24/2008 - 03/01/2008 0.93 0.99 0.95 0.95
10 03/02/2008 - 03/08/2008 0.93 0.99 0.95 0.95
11 03/09/2008 - 03/15/2008 0.93 0.99 0.95 0.95
12 03/16/2008 - 03/22/2008 0.93 0.99 0.95 0.95
13 03/23/2008 - 03/29/2008 0.93 0.99 0.95 0.95
14 03/30/2008 - 04/05/2008 0.93 0.99 0.95 0.95
15 04/06/2008 - 04/12/2008 0.93 0.99 0.95 0.95
16 04/13/2008 - 04/19/2008 0.93 0.99 0.95 0.95
17 04/20/2008 - 04/26/2008 0.93 0.99 0.95 0.95
18 04/27/2008 - 05/03/2008 0.93 0.99 0.95 0.95
19 05/04/2008 - 05/10/2008 0.93 0.99 0.95 0.95
20 05/11/2008 - 05/17/2008 0.93 0.99 0.95 0.95
21 05/18/2008 - 05/24/2008 0.93 0.99 0.95 0.95
22 05/25/2008 - 05/31/2008 0.93 0.99 0.95 0.95
23 06/01/2008 - 06/07/2008 0.93 0.99 0.95 0.95
24 06/08/2008 - 06/14/2008 0.93 0.99 0.95 0.95
25 06/15/2008 - 06/21/2008 0.93 0.99 0.95 0.95
26 06/22/2008 - 06/28/2008 0.93 0.99 0.95 0.95
27 06/29/2008 - 07/05/2008 0.93 0.99 0.95 0.95
28 07/06/2008 - 07/12/2008 0.93 0.99 0.95 0.95
29 07/13/2008 - 07/19/2008 0.93 0.99 0.95 0.95
30 07/20/2008 - 07/26/2008 0.93 0.99 0.95 0.95
31 07/27/2008 - 08/02/2008 0.93 0.99 0.95 0.95
32 08/03/2008 - 08/09/2008 0.93 0.99 0.95 0.95
33 08/10/2008 - 08/16/2008 0.93 0.99 0.95 0.95
34 08/17/2008 - 08/23/2008 0.93 0.99 0.95 0.95
35 08/24/2008 - 08/30/2008 0.93 0.99 0.95 0.95
36 08/31/2008 - 09/06/2008 0.93 0.99 0.95 0.95
37 09/07/2008 - 09/13/2008 0.93 0.99 0.95 0.95
38 09/14/2008 - 09/20/2008 0.93 0.99 0.95 0.95
39 09/21/2008 - 09/27/2008 0.93 0.99 0.95 0.95
40 09/28/2008 - 10/04/2008 0.93 0.99 0.95 0.95
41 10/05/2008 - 10/11/2008 0.93 0.99 0.95 0.95
42 10/12/2008 - 10/18/2008 0.93 0.99 0.95 0.95
43 10/19/2008 - 10/25/2008 0.93 0.99 0.95 0.95
44 10/26/2008 - 11/01/2008 0.93 0.99 0.95 0.95
45 11/02/2008 - 11/08/2008 0.93 0.99 0.95 0.95
46 11/09/2008 - 11/15/2008 0.93 0.99 0.95 0.95
47 11/16/2008 - 11/22/2008 0.93 0.99 0.95 0.95
48 11/23/2008 - 11/29/2008 0.93 0.99 0.95 0.95
49 11/30/2008 - 12/06/2008 0.93 0.99 0.95 0.95
50 12/07/2008 - 12/13/2008 0.93 0.99 0.95 0.95
51 12/14/2008 - 12/20/2008 0.93 0.99 0.95 0.95
52 12/21/2008 - 12/27/2008 0.93 0.99 0.95 0.95
53 12/28/2008 - 12/31/2008 0.93 0.99 0.95 0.95
A2 - 3
2008 Weekly Axle Factor Category Report - Report Type: ALL
County: 94 - ST.LUCIE
Week Dates 9418 9420 9421 9422
SR70, OKEE CO-KINGS A1A(S), MART TO SR5 A1A(N), SR5 - INDIAN SR68, KINGS-ANGLE RD
1 01/01/2008 - 01/05/2008 0.88 0.99 0.97 0.96
2 01/06/2008 - 01/12/2008 0.88 0.99 0.97 0.96
3 01/13/2008 - 01/19/2008 0.88 0.99 0.97 0.96
4 01/20/2008 - 01/26/2008 0.88 0.99 0.97 0.96
5 01/27/2008 - 02/02/2008 0.88 0.99 0.97 0.96
6 02/03/2008 - 02/09/2008 0.88 0.99 0.97 0.96
7 02/10/2008 - 02/16/2008 0.88 0.99 0.97 0.96
8 02/17/2008 - 02/23/2008 0.88 0.99 0.97 0.96
9 02/24/2008 - 03/01/2008 0.88 0.99 0.97 0.96
10 03/02/2008 - 03/08/2008 0.88 0.99 0.97 0.96
11 03/09/2008 - 03/15/2008 0.88 0.99 0.97 0.96
12 03/16/2008 - 03/22/2008 0.88 0.99 0.97 0.96
13 03/23/2008 - 03/29/2008 0.88 0.99 0.97 0.96
14 03/30/2008 - 04/05/2008 0.88 0.99 0.97 0.96
15 04/06/2008 - 04/12/2008 0.88 0.99 0.97 0.96
16 04/13/2008 - 04/19/2008 0.88 0.99 0.97 0.96
17 04/20/2008 - 04/26/2008 0.88 0.99 0.97 0.96
18 04/27/2008 - 05/03/2008 0.88 0.99 0.97 0.96
19 05/04/2008 - 05/10/2008 0.88 0.99 0.97 0.96
20 05/11/2008 - 05/17/2008 0.88 0.99 0.97 0.96
21 05/18/2008 - 05/24/2008 0.88 0.99 0.97 0.96
22 05/25/2008 - 05/31/2008 0.88 0.99 0.97 0.96
23 06/01/2008 - 06/07/2008 0.88 0.99 0.97 0.96
24 06/08/2008 - 06/14/2008 0.88 0.99 0.97 0.96
25 06/15/2008 - 06/21/2008 0.88 0.99 0.97 0.96
26 06/22/2008 - 06/28/2008 0.88 0.98 0.97 0.96
27 06/29/2008 - 07/05/2008 0.88 0.98 0.97 0.96
28 07/06/2008 - 07/12/2008 0.88 0.97 0.97 0.96
29 07/13/2008 - 07/19/2008 0.88 0.96 0.97 0.96
30 07/20/2008 - 07/26/2008 0.88 0.97 0.97 0.96
31 07/27/2008 - 08/02/2008 0.88 0.97 0.97 0.96
32 08/03/2008 - 08/09/2008 0.88 0.98 0.97 0.96
33 08/10/2008 - 08/16/2008 0.88 0.98 0.97 0.96
34 08/17/2008 - 08/23/2008 0.88 0.98 0.97 0.96
35 08/24/2008 - 08/30/2008 0.88 0.99 0.97 0.96
36 08/31/2008 - 09/06/2008 0.88 0.99 0.97 0.96
37 09/07/2008 - 09/13/2008 0.88 0.99 0.97 0.96
38 09/14/2008 - 09/20/2008 0.88 0.99 0.97 0.96
39 09/21/2008 - 09/27/2008 0.88 0.99 0.97 0.96
40 09/28/2008 - 10/04/2008 0.88 0.99 0.97 0.96
41 10/05/2008 - 10/11/2008 0.88 0.99 0.97 0.96
42 10/12/2008 - 10/18/2008 0.88 0.99 0.97 0.96
43 10/19/2008 - 10/25/2008 0.88 0.99 0.97 0.96
44 10/26/2008 - 11/01/2008 0.88 0.99 0.97 0.96
45 11/02/2008 - 11/08/2008 0.88 0.99 0.97 0.96
46 11/09/2008 - 11/15/2008 0.88 0.99 0.97 0.96
47 11/16/2008 - 11/22/2008 0.88 0.99 0.97 0.96
48 11/23/2008 - 11/29/2008 0.88 0.99 0.97 0.96
49 11/30/2008 - 12/06/2008 0.88 0.99 0.97 0.96
50 12/07/2008 - 12/13/2008 0.88 0.99 0.97 0.96
51 12/14/2008 - 12/20/2008 0.88 0.99 0.97 0.96
52 12/21/2008 - 12/27/2008 0.88 0.99 0.97 0.96
53 12/28/2008 - 12/31/2008 0.88 0.99 0.97 0.96
A2 - 4
2008 Weekly Axle Factor Category Report - Report Type: ALL
County: 94 - ST.LUCIE
Week Dates 9423 9424 9425 9427
AVE "A" SR707, US1 - AVE "A" SR716, TURNPIKE-US 1 SR68,ANGLE-INDIAN DR
1 01/01/2008 - 01/05/2008 0.95 0.98 0.98 0.89
2 01/06/2008 - 01/12/2008 0.95 0.98 0.98 0.89
3 01/13/2008 - 01/19/2008 0.95 0.98 0.98 0.89
4 01/20/2008 - 01/26/2008 0.95 0.98 0.98 0.89
5 01/27/2008 - 02/02/2008 0.95 0.98 0.98 0.89
6 02/03/2008 - 02/09/2008 0.95 0.98 0.98 0.89
7 02/10/2008 - 02/16/2008 0.95 0.98 0.98 0.89
8 02/17/2008 - 02/23/2008 0.95 0.98 0.98 0.89
9 02/24/2008 - 03/01/2008 0.95 0.98 0.98 0.89
10 03/02/2008 - 03/08/2008 0.95 0.98 0.98 0.89
11 03/09/2008 - 03/15/2008 0.95 0.98 0.98 0.89
12 03/16/2008 - 03/22/2008 0.95 0.98 0.98 0.89
13 03/23/2008 - 03/29/2008 0.95 0.98 0.98 0.89
14 03/30/2008 - 04/05/2008 0.95 0.98 0.98 0.89
15 04/06/2008 - 04/12/2008 0.95 0.98 0.98 0.89
16 04/13/2008 - 04/19/2008 0.95 0.98 0.98 0.89
17 04/20/2008 - 04/26/2008 0.95 0.98 0.98 0.89
18 04/27/2008 - 05/03/2008 0.95 0.98 0.98 0.89
19 05/04/2008 - 05/10/2008 0.95 0.98 0.98 0.89
20 05/11/2008 - 05/17/2008 0.95 0.98 0.98 0.89
21 05/18/2008 - 05/24/2008 0.95 0.98 0.98 0.89
22 05/25/2008 - 05/31/2008 0.95 0.98 0.98 0.89
23 06/01/2008 - 06/07/2008 0.95 0.98 0.98 0.89
24 06/08/2008 - 06/14/2008 0.95 0.98 0.98 0.89
25 06/15/2008 - 06/21/2008 0.95 0.98 0.98 0.89
26 06/22/2008 - 06/28/2008 0.95 0.98 0.98 0.89
27 06/29/2008 - 07/05/2008 0.95 0.98 0.98 0.89
28 07/06/2008 - 07/12/2008 0.95 0.98 0.98 0.89
29 07/13/2008 - 07/19/2008 0.95 0.98 0.98 0.89
30 07/20/2008 - 07/26/2008 0.95 0.98 0.98 0.89
31 07/27/2008 - 08/02/2008 0.95 0.98 0.98 0.89
32 08/03/2008 - 08/09/2008 0.95 0.98 0.98 0.89
33 08/10/2008 - 08/16/2008 0.95 0.98 0.98 0.89
34 08/17/2008 - 08/23/2008 0.95 0.98 0.98 0.89
35 08/24/2008 - 08/30/2008 0.95 0.98 0.98 0.89
36 08/31/2008 - 09/06/2008 0.95 0.98 0.98 0.89
37 09/07/2008 - 09/13/2008 0.95 0.98 0.98 0.89
38 09/14/2008 - 09/20/2008 0.95 0.98 0.98 0.89
39 09/21/2008 - 09/27/2008 0.95 0.98 0.98 0.89
40 09/28/2008 - 10/04/2008 0.95 0.98 0.98 0.89
41 10/05/2008 - 10/11/2008 0.95 0.98 0.98 0.89
42 10/12/2008 - 10/18/2008 0.95 0.98 0.98 0.89
43 10/19/2008 - 10/25/2008 0.95 0.98 0.98 0.89
44 10/26/2008 - 11/01/2008 0.95 0.98 0.98 0.89
45 11/02/2008 - 11/08/2008 0.95 0.98 0.98 0.89
46 11/09/2008 - 11/15/2008 0.95 0.98 0.98 0.89
47 11/16/2008 - 11/22/2008 0.95 0.98 0.98 0.89
48 11/23/2008 - 11/29/2008 0.95 0.98 0.98 0.89
49 11/30/2008 - 12/06/2008 0.95 0.98 0.98 0.89
50 12/07/2008 - 12/13/2008 0.95 0.98 0.98 0.89
51 12/14/2008 - 12/20/2008 0.95 0.98 0.98 0.89
52 12/21/2008 - 12/27/2008 0.95 0.98 0.98 0.89
53 12/28/2008 - 12/31/2008 0.95 0.98 0.98 0.89
A2 - 5
2008 Weekly Axle Factor Category Report - Report Type: ALL
County: 94 - ST.LUCIE
Week Dates 9430
GATLIN, I95-TPIKE
1 01/01/2008 - 01/05/2008 0.96
2 01/06/2008 - 01/12/2008 0.96
3 01/13/2008 - 01/19/2008 0.96
4 01/20/2008 - 01/26/2008 0.96
5 01/27/2008 - 02/02/2008 0.96
6 02/03/2008 - 02/09/2008 0.96
7 02/10/2008 - 02/16/2008 0.96
8 02/17/2008 - 02/23/2008 0.96
9 02/24/2008 - 03/01/2008 0.96
10 03/02/2008 - 03/08/2008 0.96
11 03/09/2008 - 03/15/2008 0.96
12 03/16/2008 - 03/22/2008 0.96
13 03/23/2008 - 03/29/2008 0.96
14 03/30/2008 - 04/05/2008 0.96
15 04/06/2008 - 04/12/2008 0.96
16 04/13/2008 - 04/19/2008 0.96
17 04/20/2008 - 04/26/2008 0.96
18 04/27/2008 - 05/03/2008 0.96
19 05/04/2008 - 05/10/2008 0.96
20 05/11/2008 - 05/17/2008 0.96
21 05/18/2008 - 05/24/2008 0.96
22 05/25/2008 - 05/31/2008 0.96
23 06/01/2008 - 06/07/2008 0.96
24 06/08/2008 - 06/14/2008 0.96
25 06/15/2008 - 06/21/2008 0.96
26 06/22/2008 - 06/28/2008 0.96
27 06/29/2008 - 07/05/2008 0.96
28 07/06/2008 - 07/12/2008 0.96
29 07/13/2008 - 07/19/2008 0.96
30 07/20/2008 - 07/26/2008 0.96
31 07/27/2008 - 08/02/2008 0.96
32 08/03/2008 - 08/09/2008 0.96
33 08/10/2008 - 08/16/2008 0.96
34 08/17/2008 - 08/23/2008 0.96
35 08/24/2008 - 08/30/2008 0.96
36 08/31/2008 - 09/06/2008 0.96
37 09/07/2008 - 09/13/2008 0.96
38 09/14/2008 - 09/20/2008 0.96
39 09/21/2008 - 09/27/2008 0.96
40 09/28/2008 - 10/04/2008 0.96
41 10/05/2008 - 10/11/2008 0.96
42 10/12/2008 - 10/18/2008 0.96
43 10/19/2008 - 10/25/2008 0.96
44 10/26/2008 - 11/01/2008 0.96
45 11/02/2008 - 11/08/2008 0.96
46 11/09/2008 - 11/15/2008 0.96
47 11/16/2008 - 11/22/2008 0.96
48 11/23/2008 - 11/29/2008 0.96
49 11/30/2008 - 12/06/2008 0.96
50 12/07/2008 - 12/13/2008 0.96
51 12/14/2008 - 12/20/2008 0.96
52 12/21/2008 - 12/27/2008 0.96
53 12/28/2008 - 12/31/2008 0.96
A2 - 6
APPENDIX B
ST. LUCIE COUNTY
TRAFFIC COUNTS PROGRAM EVALUATION
Traffic Count Report Examples
1. Count Station Report
2. Count Station History Report
3. Count Station Regression Report
St Lucie County TPOCount Station Report (Volume)
Tuesday12:00 AM08/05/2008
Begin Day of Week:Summary Begin Time:Summary Begin Date:NInterstate (Y or N):
W OF SR 91/TPK (COUNTY 25)SR 70/OKEECHOBEE RD940025
Location:Roadway:
Count Station:
EndingHour
TotalTwo-WayAverageTotalDay 3Day 2Day 1Hour
Ending EastWestDay 3Day 2Day 1EastWestEastWestEastWest
SPS File: G:\vTIMAS\St_Lucie\Counts\Sps\Out\2008\940025.TXT
01:00 01:00 14 20 16 11 0 0 34 27 0 15 16 3102:00 02:00 6 8 7 16 0 0 14 23 0 6 12 1803:00 03:00 8 12 22 11 0 0 20 33 0 15 12 2704:00 04:00 13 26 18 32 0 0 39 50 0 16 29 4505:00 05:00 23 23 38 25 0 0 46 63 0 30 24 5406:00 06:00 58 82 53 82 0 0 140 135 0 56 82 13807:00 07:00 170 180 209 200 0 0 350 409 0 190 190 38008:00 08:00 217 259 244 279 0 0 476 523 0 230 269 49909:00 09:00 234 251 230 259 0 0 485 489 0 232 255 48710:00 10:00 200 258 259 217 0 0 458 476 0 230 238 46811:00 11:00 219 232 231 259 0 0 451 490 0 225 246 47112:00 12:00 193 227 244 246 0 0 420 490 0 218 236 45413:00 13:00 260 227 286 250 0 0 487 536 0 273 238 51114:00 14:00 232 245 285 289 0 0 477 574 0 258 267 52515:00 15:00 226 242 228 275 0 0 468 503 0 227 258 48516:00 16:00 274 239 260 226 0 0 513 486 0 267 232 49917:00 17:00 281 234 267 252 0 0 515 519 0 274 243 51718:00 18:00 279 243 289 243 0 0 522 532 0 284 243 52719:00 19:00 157 151 157 151 0 0 308 308 0 157 151 30820:00 20:00 143 105 120 110 0 0 248 230 0 132 108 24021:00 21:00 109 59 129 122 0 0 168 251 0 119 90 20922:00 22:00 71 61 85 58 0 0 132 143 0 78 60 13823:00 23:00 62 47 68 32 0 0 109 100 0 65 40 10524:00 24:00 30 30 23 22 0 0 60 45 0 26 26 52
Totals:
QC Checks:
7.7% 7.1% 0%
7.8% 7.7% 0%
8.4%
1.3%
10% Yes
10% Yes
0.544 0.537 0.000
0.578 0.503 0.000
1.3% 10% Yes
14.9% 10% No
7:15am 7:45am
4:30pm 1:00pm
30 30 Yes
210 30 No
AM P:D:
AM DFactor:
AM Pk Hr Begins:
PM Pk Hr Begins:
PM DFactor:
PM P:D:
Day 1 Day 2 Day 3 Difference Standard Passed
Daily DFactor:
Pk Dr DFactor:
P:D Ratio:
Traffic:
Peak Direction:
PassedHighLowDay 3Day 2Day 1
7.8% 7.7% 0% 0.075 0.120 Yes 0.578 0.537 0.000 50% 65% Yes
0.501 0.507 0.000 50% 55% Yes
West West North Yes
PS Factor:Axle Factor:
AADT Factor: 1.06
1.06 1.00
AADT:
PSDT:
7,619
7,188
PHF:DFactor:
P:D Ratio:
Average Traffic Characteristics:
PMAM
.074% .078%
0.541 0.541 0.917 0.902
Checked By:
3,479 3,461 3,768 3,667 0 0 6,940 7,435 0 3,623 3,565 7,188ADT:
0
100
200
300
400
500
600
01:0
0
02:0
0
03:0
0
04:0
0
05:0
0
06:0
0
07:0
0
08:0
0
09:0
0
10:0
0
11:0
0
12:0
0
13:0
0
14:0
0
15:0
0
16:0
0
17:0
0
18:0
0
19:0
0
20:0
0
21:0
0
22:0
0
23:0
0
24:0
0
Volumes
Tindale-Oliver and AssociatesB1 - 1
1/21
/201
0R
epor
t Dat
e:
CS
Dat
eLo
catio
nR
oadw
ay
Inte
rsta
te
AA
DT
Axl
e
SA
F
Fac
tors
PS
Mid
Hea
vy
HV
Avg
Day
3D
ay2
Day
1D
irect
ion
AD
T
PS
DT
AA
DT
DP
kHr
SP
S F
ile L
ocat
ion
PkH
r D
P:D
Day
of W
eek
Beg
in T
ime
Sou
rce
St
Lu
cie
TP
O
Co
un
t S
tati
on
His
tory
Rep
ort
(V
olu
me)
Pea
k D
ir
W O
F S
R 9
1/T
PK
(C
OU
NT
Y 2
5)01
/01/
2008
SR
70/
OK
EE
CH
OB
EE
RD
9400
25W
est
Eas
t 4
,078
3,4
22 0 0
0 0 7
,500
0 0
4,0
78 3
,422
7,5
00N
1.0
0 1
.00
.00%
.00%
.00%
7,5
00 7
,500
0.0
0 0
.54
0.5
4 1
.00
0.1
15F
TI
Tue
sday
Wes
t
W O
F S
R 9
1/T
PK
(C
OU
NT
Y 2
5)01
/01/
2007
SR
70/
OK
EE
CH
OB
EE
RD
9400
25E
ast
Wes
t 4
,827
3,4
73 0 0
0 0 8
,300
0 0
4,8
27 3
,473
8,3
00N
1.0
0 1
.00
8.82
%10
.85%
19.6
7%
8,3
00 8
,300
0.0
0 0
.58
0.5
8 1
.00
0.1
15F
TI
Mon
day
Eas
t
W O
F S
R 9
1/T
PK
(C
OU
NT
Y 2
5)01
/01/
2006
SR
70/
OK
EE
CH
OB
EE
RD
9400
25W
est
Eas
t 4
,443
3,3
57 0 0
0 0 7
,800
0 0
4,4
43 3
,357
7,8
00N
1.0
0 1
.00
.00%
.00%
.00%
7,8
00 7
,800
0.0
0 0
.57
0.5
7 1
.00
0.1
08F
TI
Sun
day
Wes
t
W O
F S
R 9
1/T
PK
(C
OU
NT
Y 2
5)01
/01/
2005
SR
70/
OK
EE
CH
OB
EE
RD
9400
25E
ast
Wes
t 4
,698
3,6
02 0 0
0 0 8
,300
0 0
4,6
98 3
,602
8,3
00N
1.0
0 1
.00
6.59
%8.
11%
14.7
0%
8,3
00 8
,300
0.0
0 0
.57
0.5
7 1
.00
0.1
11F
TI
Sat
urda
yE
ast
W O
F S
R 9
1/T
PK
(C
OU
NT
Y 2
5)01
/01/
2004
SR
70/
OK
EE
CH
OB
EE
RD
9400
25W
est
Eas
t 4
,477
2,9
23 0 0
0 0 7
,400
0 0
4,4
77 2
,923
7,4
00N
1.0
0 1
.00
.00%
.00%
.00%
7,4
00 7
,400
0.0
0 0
.61
0.6
1 1
.00
0.1
11F
TI
Thu
rsda
yW
est
W O
F S
R 9
1/T
PK
(C
OU
NT
Y 2
5)01
/01/
2003
SR
70/
OK
EE
CH
OB
EE
RD
9400
25W
est
Eas
t 4
,074
2,9
26 0 0
0 0 7
,000
0 0
4,0
74 2
,926
7,0
00N
1.0
0 1
.00
10.6
0%8.
40%
19.0
0%
7,0
00 7
,000
0.0
0 0
.58
0.5
8 1
.00
0.1
10F
TI
Wed
nesd
ayW
est
W O
F S
R 9
1/T
PK
(C
OU
NT
Y 2
5)01
/01/
2002
SR
70/
OK
EE
CH
OB
EE
RD
9400
25E
ast
Wes
t 3
,304
2,5
96 0 0
0 0 5
,900
0 0
3,3
04 2
,596
5,9
00N
1.0
0 1
.00
.00%
.00%
.00%
5,9
00 5
,900
0.0
0 0
.56
0.5
6 1
.00
0.1
09F
TI
Tue
sday
Eas
t
W O
F S
R 9
1/T
PK
(C
OU
NT
Y 2
5)01
/01/
2001
SR
70/
OK
EE
CH
OB
EE
RD
9400
25W
est
Eas
t 3
,460
2,7
40 0 0
0 0 6
,200
0 0
3,4
60 2
,740
6,2
00N
1.0
0 1
.00
.00%
.00%
.00%
6,2
00 6
,200
0.0
0 0
.56
0.5
6 1
.00
0.1
12F
TI
Mon
day
Wes
t
W O
F S
R 9
1/T
PK
(C
OU
NT
Y 2
5)01
/01/
2000
SR
70/
OK
EE
CH
OB
EE
RD
9400
25W
est
Eas
t 3
,846
2,8
54 0 0
0 0 6
,700
0 0
3,8
46 2
,854
6,7
00N
1.0
0 1
.00
7.20
%9.
10%
16.3
0%
6,7
00 6
,700
0.0
0 0
.57
0.5
8 1
.00
0.1
07F
TI
Sat
urda
yW
est
W O
F S
R 9
1/T
PK
(C
OU
NT
Y 2
5)01
/01/
1999
SR
70/
OK
EE
CH
OB
EE
RD
9400
25W
est
Eas
t 3
,731
2,6
69 0 0
0 0 6
,400
0 0
3,7
31 2
,669
6,4
00N
1.0
0 1
.00
.00%
.00%
.00%
6,4
00 6
,400
0.0
0 0
.58
0.5
8 1
.00
0.1
14F
TI
Frid
ayW
est
W O
F S
R 9
1/T
PK
(C
OU
NT
Y 2
5)01
/01/
1998
SR
70/
OK
EE
CH
OB
EE
RD
9400
25W
est
Eas
t 3
,140
2,3
60 0 0
0 0 5
,500
0 0
3,1
40 2
,360
5,5
00N
1.0
0 1
.00
.00%
.00%
.00%
5,5
00 5
,500
0.0
0 0
.57
0.5
7 1
.00
0.1
11F
TI
Thu
rsda
yW
est
W O
F S
R 9
1/T
PK
(C
OU
NT
Y 2
5)01
/01/
1997
SR
70/
OK
EE
CH
OB
EE
RD
9400
25E
ast
Wes
t 3
,339
2,5
61 0 0
0 0 5
,900
0 0
3,3
39 2
,561
5,9
00N
1.0
0 1
.00
4.20
%7.
90%
12.1
0%
5,9
00 5
,900
0.0
0 0
.57
0.5
7 1
.00
0.1
05F
TI
Wed
nesd
ayE
ast
W O
F S
R 9
1/T
PK
(C
OU
NT
Y 2
5)01
/01/
1996
SR
70/
OK
EE
CH
OB
EE
RD
9400
25W
est
Eas
t 3
,207
2,5
93 0 0
0 0 5
,800
0 0
3,2
07 2
,593
5,8
00N
1.0
0 1
.00
5.80
%6.
40%
12.2
0%
5,8
00 5
,800
0.0
0 0
.55
0.5
5 1
.00
0.1
09F
TI
Mon
day
Wes
t
W O
F S
R 9
1/T
PK
(C
OU
NT
Y 2
5)01
/01/
1995
SR
70/
OK
EE
CH
OB
EE
RD
9400
25W
est
Eas
t 4
,399
3,4
01 0 0
0 0 7
,800
0 0
4,3
99 3
,401
7,8
00N
1.0
0 1
.00
.00%
.00%
.00%
7,8
00 7
,800
0.0
0 0
.56
0.5
6 1
.00
0.1
12F
TI
Sun
day
Wes
t
W O
F S
R 9
1/T
PK
(C
OU
NT
Y 2
5)01
/01/
1994
SR
70/
OK
EE
CH
OB
EE
RD
9400
25W
est
Eas
t 3
,008
2,3
92 0 0
0 0 5
,400
0 0
3,0
08 2
,392
5,4
00N
1.0
0 1
.00
.00%
.00%
.00%
5,4
00 5
,400
0.0
0 0
.56
0.5
6 1
.00
0.1
03F
TI
Sat
urda
yW
est
W O
F S
R 9
1/T
PK
(C
OU
NT
Y 2
5)01
/01/
1993
SR
70/
OK
EE
CH
OB
EE
RD
9400
25W
est
Eas
t 2
,500
2,6
00 0 0
0 0 5
,100
0 0
2,5
00 2
,600
5,1
00N
1.0
0 1
.00
.00%
.00%
.00%
5,1
00 5
,100
0.0
0 0
.51
0.0
0 1
.00
0.0
00F
TI
Frid
ayE
ast
W O
F S
R 9
1/T
PK
(C
OU
NT
Y 2
5)01
/01/
1992
SR
70/
OK
EE
CH
OB
EE
RD
9400
25W
est
Eas
t 3
,200
3,3
00 0 0
0 0 6
,500
0 0
3,2
00 3
,300
6,5
00N
1.0
0 1
.00
.00%
.00%
.00%
6,5
00 6
,500
0.0
0 0
.51
0.0
0 1
.00
0.0
00F
TI
Wed
nesd
ayE
ast
Tin
dale
-Oli
ver
and
Ass
ocia
tes
1P
age
Num
ber:
B2 - 1
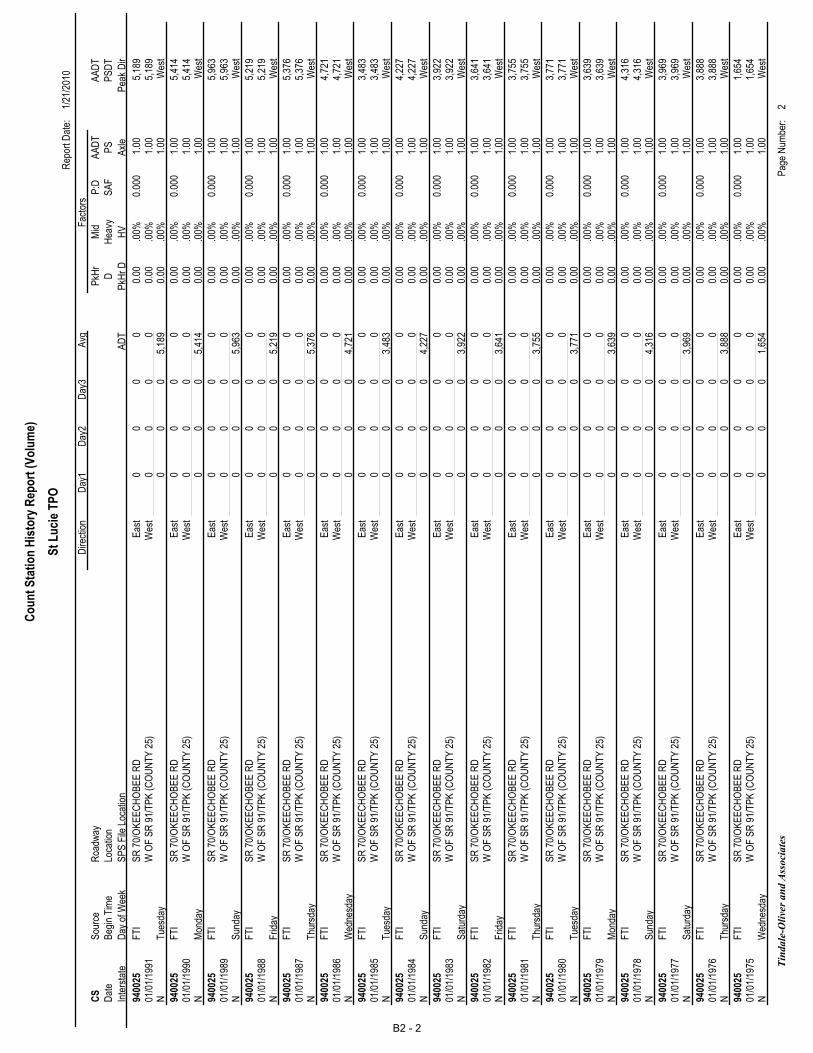
1/21
/201
0R
epor
t Dat
e:
CS
Dat
eLo
catio
nR
oadw
ay
Inte
rsta
te
AA
DT
Axl
e
SA
F
Fac
tors
PS
Mid
Hea
vy
HV
Avg
Day
3D
ay2
Day
1D
irect
ion
AD
T
PS
DT
AA
DT
DP
kHr
SP
S F
ile L
ocat
ion
PkH
r D
P:D
Day
of W
eek
Beg
in T
ime
Sou
rce
St
Lu
cie
TP
O
Co
un
t S
tati
on
His
tory
Rep
ort
(V
olu
me)
Pea
k D
ir
W O
F S
R 9
1/T
PK
(C
OU
NT
Y 2
5)01
/01/
1991
SR
70/
OK
EE
CH
OB
EE
RD
9400
25E
ast
Wes
t 0 0
0 0 0 0
0 0
0
0 0 5
,189
N
1.0
0 1
.00
.00%
.00%
.00%
5,1
89 5
,189
0.0
0 0
.00
0.0
0 1
.00
0.0
00F
TI
Tue
sday
Wes
t
W O
F S
R 9
1/T
PK
(C
OU
NT
Y 2
5)01
/01/
1990
SR
70/
OK
EE
CH
OB
EE
RD
9400
25E
ast
Wes
t 0 0
0 0 0 0
0 0
0
0 0 5
,414
N
1.0
0 1
.00
.00%
.00%
.00%
5,4
14 5
,414
0.0
0 0
.00
0.0
0 1
.00
0.0
00F
TI
Mon
day
Wes
t
W O
F S
R 9
1/T
PK
(C
OU
NT
Y 2
5)01
/01/
1989
SR
70/
OK
EE
CH
OB
EE
RD
9400
25E
ast
Wes
t 0 0
0 0 0 0
0 0
0
0 0 5
,963
N
1.0
0 1
.00
.00%
.00%
.00%
5,9
63 5
,963
0.0
0 0
.00
0.0
0 1
.00
0.0
00F
TI
Sun
day
Wes
t
W O
F S
R 9
1/T
PK
(C
OU
NT
Y 2
5)01
/01/
1988
SR
70/
OK
EE
CH
OB
EE
RD
9400
25E
ast
Wes
t 0 0
0 0 0 0
0 0
0
0 0 5
,219
N
1.0
0 1
.00
.00%
.00%
.00%
5,2
19 5
,219
0.0
0 0
.00
0.0
0 1
.00
0.0
00F
TI
Frid
ayW
est
W O
F S
R 9
1/T
PK
(C
OU
NT
Y 2
5)01
/01/
1987
SR
70/
OK
EE
CH
OB
EE
RD
9400
25E
ast
Wes
t 0 0
0 0 0 0
0 0
0
0 0 5
,376
N
1.0
0 1
.00
.00%
.00%
.00%
5,3
76 5
,376
0.0
0 0
.00
0.0
0 1
.00
0.0
00F
TI
Thu
rsda
yW
est
W O
F S
R 9
1/T
PK
(C
OU
NT
Y 2
5)01
/01/
1986
SR
70/
OK
EE
CH
OB
EE
RD
9400
25E
ast
Wes
t 0 0
0 0 0 0
0 0
0
0 0 4
,721
N
1.0
0 1
.00
.00%
.00%
.00%
4,7
21 4
,721
0.0
0 0
.00
0.0
0 1
.00
0.0
00F
TI
Wed
nesd
ayW
est
W O
F S
R 9
1/T
PK
(C
OU
NT
Y 2
5)01
/01/
1985
SR
70/
OK
EE
CH
OB
EE
RD
9400
25E
ast
Wes
t 0 0
0 0 0 0
0 0
0
0 0 3
,483
N
1.0
0 1
.00
.00%
.00%
.00%
3,4
83 3
,483
0.0
0 0
.00
0.0
0 1
.00
0.0
00F
TI
Tue
sday
Wes
t
W O
F S
R 9
1/T
PK
(C
OU
NT
Y 2
5)01
/01/
1984
SR
70/
OK
EE
CH
OB
EE
RD
9400
25E
ast
Wes
t 0 0
0 0 0 0
0 0
0
0 0 4
,227
N
1.0
0 1
.00
.00%
.00%
.00%
4,2
27 4
,227
0.0
0 0
.00
0.0
0 1
.00
0.0
00F
TI
Sun
day
Wes
t
W O
F S
R 9
1/T
PK
(C
OU
NT
Y 2
5)01
/01/
1983
SR
70/
OK
EE
CH
OB
EE
RD
9400
25E
ast
Wes
t 0 0
0 0 0 0
0 0
0
0 0 3
,922
N
1.0
0 1
.00
.00%
.00%
.00%
3,9
22 3
,922
0.0
0 0
.00
0.0
0 1
.00
0.0
00F
TI
Sat
urda
yW
est
W O
F S
R 9
1/T
PK
(C
OU
NT
Y 2
5)01
/01/
1982
SR
70/
OK
EE
CH
OB
EE
RD
9400
25E
ast
Wes
t 0 0
0 0 0 0
0 0
0
0 0 3
,641
N
1.0
0 1
.00
.00%
.00%
.00%
3,6
41 3
,641
0.0
0 0
.00
0.0
0 1
.00
0.0
00F
TI
Frid
ayW
est
W O
F S
R 9
1/T
PK
(C
OU
NT
Y 2
5)01
/01/
1981
SR
70/
OK
EE
CH
OB
EE
RD
9400
25E
ast
Wes
t 0 0
0 0 0 0
0 0
0
0 0 3
,755
N
1.0
0 1
.00
.00%
.00%
.00%
3,7
55 3
,755
0.0
0 0
.00
0.0
0 1
.00
0.0
00F
TI
Thu
rsda
yW
est
W O
F S
R 9
1/T
PK
(C
OU
NT
Y 2
5)01
/01/
1980
SR
70/
OK
EE
CH
OB
EE
RD
9400
25E
ast
Wes
t 0 0
0 0 0 0
0 0
0
0 0 3
,771
N
1.0
0 1
.00
.00%
.00%
.00%
3,7
71 3
,771
0.0
0 0
.00
0.0
0 1
.00
0.0
00F
TI
Tue
sday
Wes
t
W O
F S
R 9
1/T
PK
(C
OU
NT
Y 2
5)01
/01/
1979
SR
70/
OK
EE
CH
OB
EE
RD
9400
25E
ast
Wes
t 0 0
0 0 0 0
0 0
0
0 0 3
,639
N
1.0
0 1
.00
.00%
.00%
.00%
3,6
39 3
,639
0.0
0 0
.00
0.0
0 1
.00
0.0
00F
TI
Mon
day
Wes
t
W O
F S
R 9
1/T
PK
(C
OU
NT
Y 2
5)01
/01/
1978
SR
70/
OK
EE
CH
OB
EE
RD
9400
25E
ast
Wes
t 0 0
0 0 0 0
0 0
0
0 0 4
,316
N
1.0
0 1
.00
.00%
.00%
.00%
4,3
16 4
,316
0.0
0 0
.00
0.0
0 1
.00
0.0
00F
TI
Sun
day
Wes
t
W O
F S
R 9
1/T
PK
(C
OU
NT
Y 2
5)01
/01/
1977
SR
70/
OK
EE
CH
OB
EE
RD
9400
25E
ast
Wes
t 0 0
0 0 0 0
0 0
0
0 0 3
,969
N
1.0
0 1
.00
.00%
.00%
.00%
3,9
69 3
,969
0.0
0 0
.00
0.0
0 1
.00
0.0
00F
TI
Sat
urda
yW
est
W O
F S
R 9
1/T
PK
(C
OU
NT
Y 2
5)01
/01/
1976
SR
70/
OK
EE
CH
OB
EE
RD
9400
25E
ast
Wes
t 0 0
0 0 0 0
0 0
0
0 0 3
,888
N
1.0
0 1
.00
.00%
.00%
.00%
3,8
88 3
,888
0.0
0 0
.00
0.0
0 1
.00
0.0
00F
TI
Thu
rsda
yW
est
W O
F S
R 9
1/T
PK
(C
OU
NT
Y 2
5)01
/01/
1975
SR
70/
OK
EE
CH
OB
EE
RD
9400
25E
ast
Wes
t 0 0
0 0 0 0
0 0
0
0 0 1
,654
N
1.0
0 1
.00
.00%
.00%
.00%
1,6
54 1
,654
0.0
0 0
.00
0.0
0 1
.00
0.0
00F
TI
Wed
nesd
ayW
est
Tin
dale
-Oli
ver
and
Ass
ocia
tes
2P
age
Num
ber:
B2 - 2
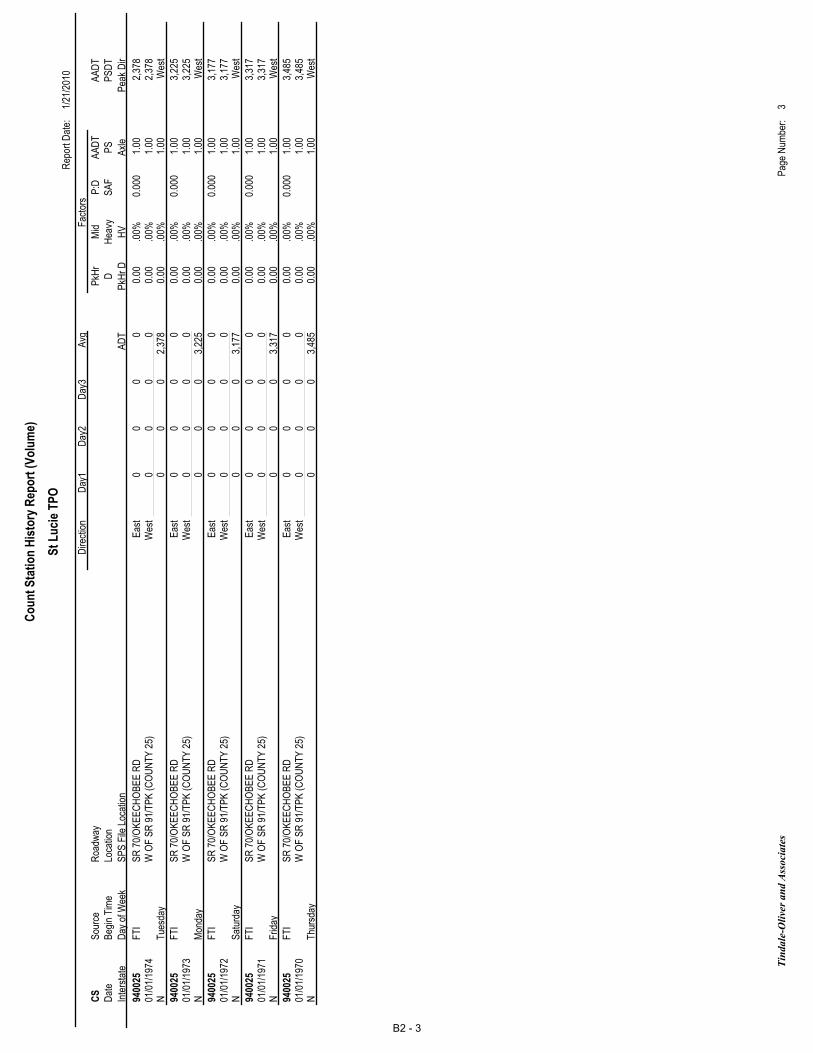
1/21
/201
0R
epor
t Dat
e:
CS
Dat
eLo
catio
nR
oadw
ay
Inte
rsta
te
AA
DT
Axl
e
SA
F
Fac
tors
PS
Mid
Hea
vy
HV
Avg
Day
3D
ay2
Day
1D
irect
ion
AD
T
PS
DT
AA
DT
DP
kHr
SP
S F
ile L
ocat
ion
PkH
r D
P:D
Day
of W
eek
Beg
in T
ime
Sou
rce
St
Lu
cie
TP
O
Co
un
t S
tati
on
His
tory
Rep
ort
(V
olu
me)
Pea
k D
ir
W O
F S
R 9
1/T
PK
(C
OU
NT
Y 2
5)01
/01/
1974
SR
70/
OK
EE
CH
OB
EE
RD
9400
25E
ast
Wes
t 0 0
0 0 0 0
0 0
0
0 0 2
,378
N
1.0
0 1
.00
.00%
.00%
.00%
2,3
78 2
,378
0.0
0 0
.00
0.0
0 1
.00
0.0
00F
TI
Tue
sday
Wes
t
W O
F S
R 9
1/T
PK
(C
OU
NT
Y 2
5)01
/01/
1973
SR
70/
OK
EE
CH
OB
EE
RD
9400
25E
ast
Wes
t 0 0
0 0 0 0
0 0
0
0 0 3
,225
N
1.0
0 1
.00
.00%
.00%
.00%
3,2
25 3
,225
0.0
0 0
.00
0.0
0 1
.00
0.0
00F
TI
Mon
day
Wes
t
W O
F S
R 9
1/T
PK
(C
OU
NT
Y 2
5)01
/01/
1972
SR
70/
OK
EE
CH
OB
EE
RD
9400
25E
ast
Wes
t 0 0
0 0 0 0
0 0
0
0 0 3
,177
N
1.0
0 1
.00
.00%
.00%
.00%
3,1
77 3
,177
0.0
0 0
.00
0.0
0 1
.00
0.0
00F
TI
Sat
urda
yW
est
W O
F S
R 9
1/T
PK
(C
OU
NT
Y 2
5)01
/01/
1971
SR
70/
OK
EE
CH
OB
EE
RD
9400
25E
ast
Wes
t 0 0
0 0 0 0
0 0
0
0 0 3
,317
N
1.0
0 1
.00
.00%
.00%
.00%
3,3
17 3
,317
0.0
0 0
.00
0.0
0 1
.00
0.0
00F
TI
Frid
ayW
est
W O
F S
R 9
1/T
PK
(C
OU
NT
Y 2
5)01
/01/
1970
SR
70/
OK
EE
CH
OB
EE
RD
9400
25E
ast
Wes
t 0 0
0 0 0 0
0 0
0
0 0 3
,485
N
1.0
0 1
.00
.00%
.00%
.00%
3,4
85 3
,485
0.0
0 0
.00
0.0
0 1
.00
0.0
00F
TI
Thu
rsda
yW
est
Tin
dale
-Oli
ver
and
Ass
ocia
tes
3P
age
Num
ber:
B2 - 3
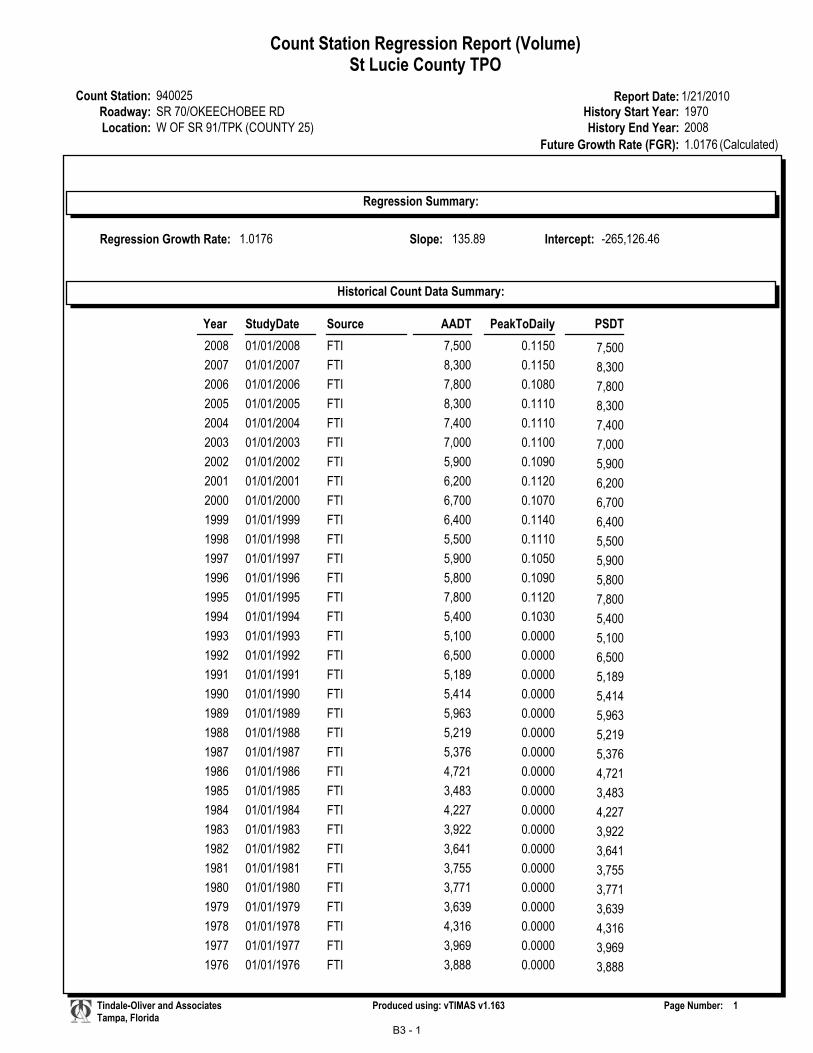
Count Station:Roadway:Location:
Report Date:940025SR 70/OKEECHOBEE RDW OF SR 91/TPK (COUNTY 25)
St Lucie County TPOCount Station Regression Report (Volume)
1/21/2010History Start Year:History End Year:
1970 2008
Regression Summary:
Future Growth Rate (FGR): 1.0176 (Calculated)
Slope: Intercept: 135.89 -265,126.46Regression Growth Rate: 1.0176
Year StudyDate Source AADT PeakToDaily PSDT
Historical Count Data Summary:
2008 01/01/2008 FTI 7,500 0.1150 7,500
2007 01/01/2007 FTI 8,300 0.1150 8,300
2006 01/01/2006 FTI 7,800 0.1080 7,800
2005 01/01/2005 FTI 8,300 0.1110 8,300
2004 01/01/2004 FTI 7,400 0.1110 7,400
2003 01/01/2003 FTI 7,000 0.1100 7,000
2002 01/01/2002 FTI 5,900 0.1090 5,900
2001 01/01/2001 FTI 6,200 0.1120 6,200
2000 01/01/2000 FTI 6,700 0.1070 6,700
1999 01/01/1999 FTI 6,400 0.1140 6,400
1998 01/01/1998 FTI 5,500 0.1110 5,500
1997 01/01/1997 FTI 5,900 0.1050 5,900
1996 01/01/1996 FTI 5,800 0.1090 5,800
1995 01/01/1995 FTI 7,800 0.1120 7,800
1994 01/01/1994 FTI 5,400 0.1030 5,400
1993 01/01/1993 FTI 5,100 0.0000 5,100
1992 01/01/1992 FTI 6,500 0.0000 6,500
1991 01/01/1991 FTI 5,189 0.0000 5,189
1990 01/01/1990 FTI 5,414 0.0000 5,414
1989 01/01/1989 FTI 5,963 0.0000 5,963
1988 01/01/1988 FTI 5,219 0.0000 5,219
1987 01/01/1987 FTI 5,376 0.0000 5,376
1986 01/01/1986 FTI 4,721 0.0000 4,721
1985 01/01/1985 FTI 3,483 0.0000 3,483
1984 01/01/1984 FTI 4,227 0.0000 4,227
1983 01/01/1983 FTI 3,922 0.0000 3,922
1982 01/01/1982 FTI 3,641 0.0000 3,641
1981 01/01/1981 FTI 3,755 0.0000 3,755
1980 01/01/1980 FTI 3,771 0.0000 3,771
1979 01/01/1979 FTI 3,639 0.0000 3,639
1978 01/01/1978 FTI 4,316 0.0000 4,316
1977 01/01/1977 FTI 3,969 0.0000 3,969
1976 01/01/1976 FTI 3,888 0.0000 3,888
Tindale-Oliver and AssociatesTampa, Florida
Produced using: vTIMAS v1.163 1Page Number:
B3 - 1
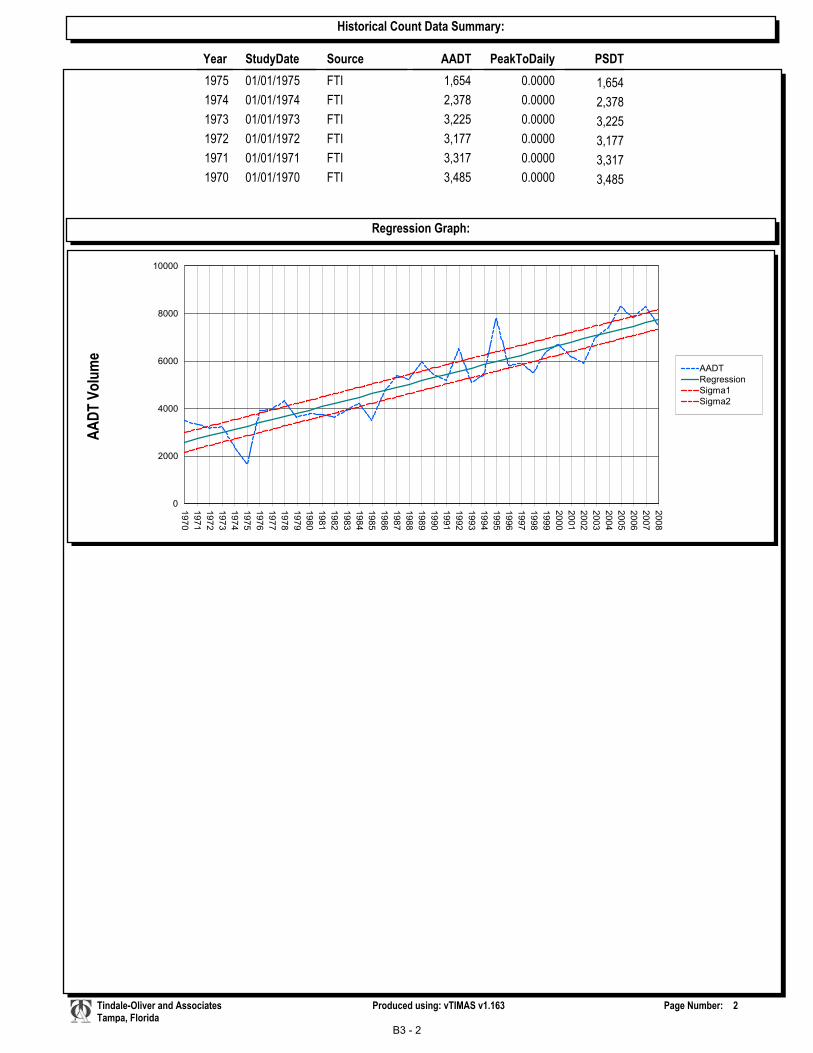
Year StudyDate Source AADT PeakToDaily PSDT
Historical Count Data Summary:
1975 01/01/1975 FTI 1,654 0.0000 1,654
1974 01/01/1974 FTI 2,378 0.0000 2,378
1973 01/01/1973 FTI 3,225 0.0000 3,225
1972 01/01/1972 FTI 3,177 0.0000 3,177
1971 01/01/1971 FTI 3,317 0.0000 3,317
1970 01/01/1970 FTI 3,485 0.0000 3,485
0
2000
4000
6000
8000
10000
19
70
19
71
19
72
19
73
19
74
19
75
19
76
19
77
19
78
19
79
19
80
19
81
19
82
19
83
19
84
19
85
19
86
19
87
19
88
19
89
19
90
19
91
19
92
19
93
19
94
19
95
19
96
19
97
19
98
19
99
20
00
20
01
20
02
20
03
20
04
20
05
20
06
20
07
20
08
AADT
Regression
Sigma1
Sigma2
Regression Graph:
AA
DT
Vo
lum
e
Tindale-Oliver and AssociatesTampa, Florida
Produced using: vTIMAS v1.163 2Page Number:
B3 - 2
APPENDIX C
ST. LUCIE COUNTY
TRAFFIC COUNTS PROGRAM EVALUATION
Traffic Count Program Implementation Cost
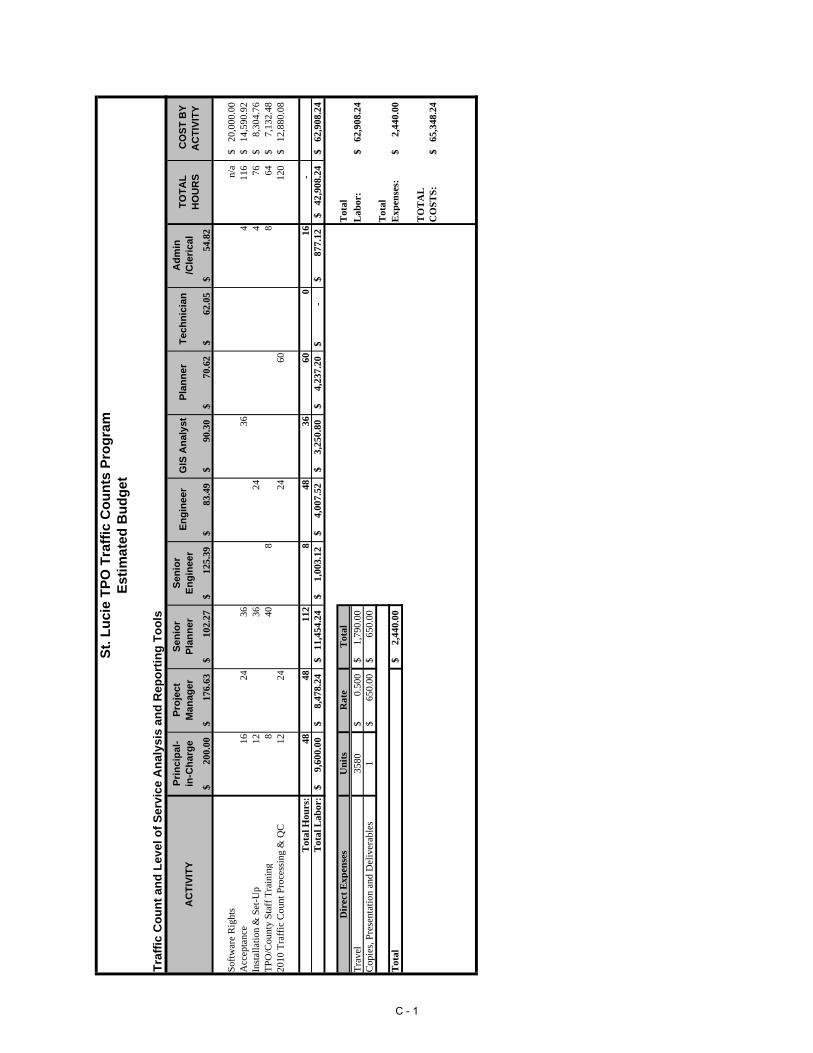
Tra
ffic
Co
un
t an
d L
evel
of
Ser
vice
An
alys
is a
nd
Rep
ort
ing
To
ols
Pri
nci
pal
-in
-Ch
arg
eP
roje
ctM
anag
erS
enio
rP
lan
ner
Sen
ior
En
gin
eer
En
gin
eer
GIS
An
alys
tP
lan
ner
Tec
hn
icia
nA
dm
in/C
leri
cal
200.
00$
17
6.63
$
102.
27$
12
5.39
$
83.4
9$
90.3
0$
70.6
2$
62.0
5$
54.8
2$
Sof
twar
e R
ight
sn/
a20
,000
.00
$
Acc
epta
nce
1624
3636
411
6
14,5
90.9
2$
In
stal
lati
on &
Set
-Up
1236
244
76
8,
304.
76$
TP
O/C
ount
y S
taff
Tra
inin
g8
408
864
7,13
2.48
$
20
10 T
raff
ic C
ount
Pro
cess
ing
& Q
C12
2424
6012
0
12,8
80.0
8$
Tot
al H
ours
:48
4811
28
4836
600
16-
Tot
al L
abor
:9,
600.
00$
8,47
8.24
$
11
,454
.24
$
1,00
3.12
$
4,
007.
52$
3,25
0.80
$
4,
237.
20$
-$
87
7.12
$
42,9
08.2
4$
62
,908
.24
$
Dir
ect
Exp
ense
sU
nit
sR
ate
Tot
alT
otal
Tra
vel
3580
0.50
0$
1,79
0.00
$
L
abor
:62
,908
.24
$
Cop
ies,
Pre
sent
atio
n an
d D
eliv
erab
les
165
0.00
$
650.
00$
T
otal
Tot
al2,
440.
00$
Ex p
ense
s:2,
440.
00$
TO
TA
LC
OS
TS
:65
,348
.24
$
AC
TIV
ITY
TO
TA
LH
OU
RS
CO
ST
BY
AC
TIV
ITY
St.
Lu
cie
TP
O T
raff
ic C
ou
nts
Pro
gra
mE
stim
ated
Bu
dg
et
C - 1