Embed Size (px)
Citation preview
Austin, Tsutsumi & Associates, Inc. Civil Engineers • Surveyors 501 Sumner Street, Suite 521 Honolulu, Hawaii 96817-5031 Telephone: (808) 533-3646 Facsimile: (808) 526-1267 E-mail: [email protected] Honolulu • Wailuku • Hilo, Hawaii
TRAFFIC IMPACT ANALYSIS REPORT CENTRAL MAUI REGIONAL SPORTS COMPLEX KAHULUI, MAUI, HAWAII May 20, 2014 Prepared for: R.M. Towill Corporation 2024 North King Street, Suite 200 Honolulu, Hawaii 96819
TRAFFIC IMPACT ANALYSIS REPORT
CENTRAL MAUI REGIONAL PARK
Kahului, Maui, Hawaii
Prepared for
R.M. Towill Corporation 2024 North King Street, Suite 200
Honolulu, Hawaii 96819
Prepared by
Austin, Tsutsumi & Associates, Inc.
Civil Engineers • Surveyors Honolulu • Wailuku • Hilo, Hawaii
May 20, 2014
i
TABLE OF CONTENTS
Page
I. INTRODUCTION ......................................................................................... 1-5
A. Project Description .......................................................................... 1
B. Location ........................................................................................... 4
C. Study Methodology .......................................................................... 4
D. Analysis Methodology ..................................................................... 4
II. EXISTING CONDITIONS ............................................................................ 5-8
A. Roadway System ............................................................................. 5
B. Existing Traffic Volumes .................................................................. 5
C. Existing Traffic Conditions Analysis and Observations ................... 6
III. BASE YEAR TRAFFIC ANALYSIS WITHOUT THE PROJECT ................. 9-15
A. Defacto Growth Rate ....................................................................... 9
B. Other Known Developments ............................................................ 9
C. Results of Intersection Analysis ...................................................... 10
IV. FUTURE YEAR TRAFFIC ANALYSIS WITH THE PROJECT .................... 16-26
A. Future Year 2015 – Phase 1 ........................................................... 16
B. Future Year 2022 – Phase 2 ........................................................... 22
V. CONCLUSIONS ......................................................................................... 27-28
VI. RECOMMENDATIONS ............................................................................... 28
VII. REFERENCES ............................................................................................ 30
TABLE OF CONTENTS Cont’d
Page
ii
TABLES
1. EXISTING LEVEL OF SERVICE ..................................................... 7
2. BASE YEAR 2015, BASE YEAR 2022, AND BASE YEAR 2022 WITH MITIGATION LOS ................................................................. 15
3. PROJECT TRIP GENERATION RATES ......................................... 17
4. PROJECT GENERATED TRAFFIC ................................................ 17
5. BASE YEAR 2015 AND FUTURE YEAR 2015 LOS ....................... 21
6. BASE YEAR 2022 WITH MITIGATION AND FUTURE YEAR 2022 26
FIGURES
1. LOCATION MAP ............................................................................. 2
2. PROJECT SITE MAP ...................................................................... 3
3. EXISTING 2012-2013 CONDITIONS – LANE CONFIGURATION, TRAFFIC VOLUMES, AND LOS ..................................................... 17
4. BASE YEAR 2015 – LANE CONFIGURATION, TRAFFIC VOLUMES, AND LOS ..................................................... 17
5. BASE YEAR 2022 – LANE CONFIGURATION, TRAFFIC VOLUMES, AND LOS ..................................................... 13
6. BASE YEAR 2022 WITH MITIGATION - LANE CONFIGURATION, TRAFFIC VOLUMES, AND LOS ........... 14
7. PHASE 1 PROJECT TRIP DISTRIBUTION .................................... 18
8. FUTURE YEAR 2015 – PHASE 1 LANE CONFIGURATION, TRAFFIC VOLUMES AND LOS ............ 20
9. PHASE 2 PROJECT TRIP DISTRIBUTION .................................... 23
10. FUTURE YEAR 2022 – PHASE 2 TRAFFIC VOLUMES, LANE CONFIGURATION, AND LOS ........... 24
TABLE OF CONTENTS Cont’d
iii
APPENDICES
A. TRAFFIC COUNT DATA
B. LEVEL OF SERVICE CRITERIA
C. LEVEL OF SERVICE CALCULATIONS)
D. TRAFFIC SIGNAL WARRANT
E. SUPPLEMENTAL SATURDAY PEAK TRIP GENERATION
TRAFFIC IMPACT ANALYSIS REPORT
CENTRAL MAUI REGIONAL SPORTS COMPLEX
Kahului, Maui, Hawaii
I. INTRODUCTION
This report documents the findings of a traffic study conducted by Austin,
Tsutsumi & Associates, Inc. (ATA) to evaluate the potential traffic impacts resulting from
the proposed Central Maui Regional Sports Complex, which will include approximately
65 acres of recreational park space (hereinafter referred to as the ‘Project’), located in
Kahului, Maui, Hawaii.
A. Project Description
The Project plans to provide approximately 65 acres of recreational park
space on an undeveloped parcel fronting Kuihelani Highway. The Project will
include two (2) phases of development. The Phase 1 of the development will
include four (4) little league baseball fields, four (4) softball fields, three (3) full-
size soccer fields, one (1) baseball field, two (2) concession/restroom buildings,
two (2) restroom buildings, a small drainage retention area, and approximately
600 parking stalls with primary vehicle access via South Kamehameha Avenue.
Phase 2, as part of the proposed Waiale Development, will increase the size of
the drainage retention area, provide two (2) vehicle accesses along what is
referred to as ‘Road C’, and restrict the vehicle access off of South Kamehameha
Avenue to maintenance and emergency vehicles only.
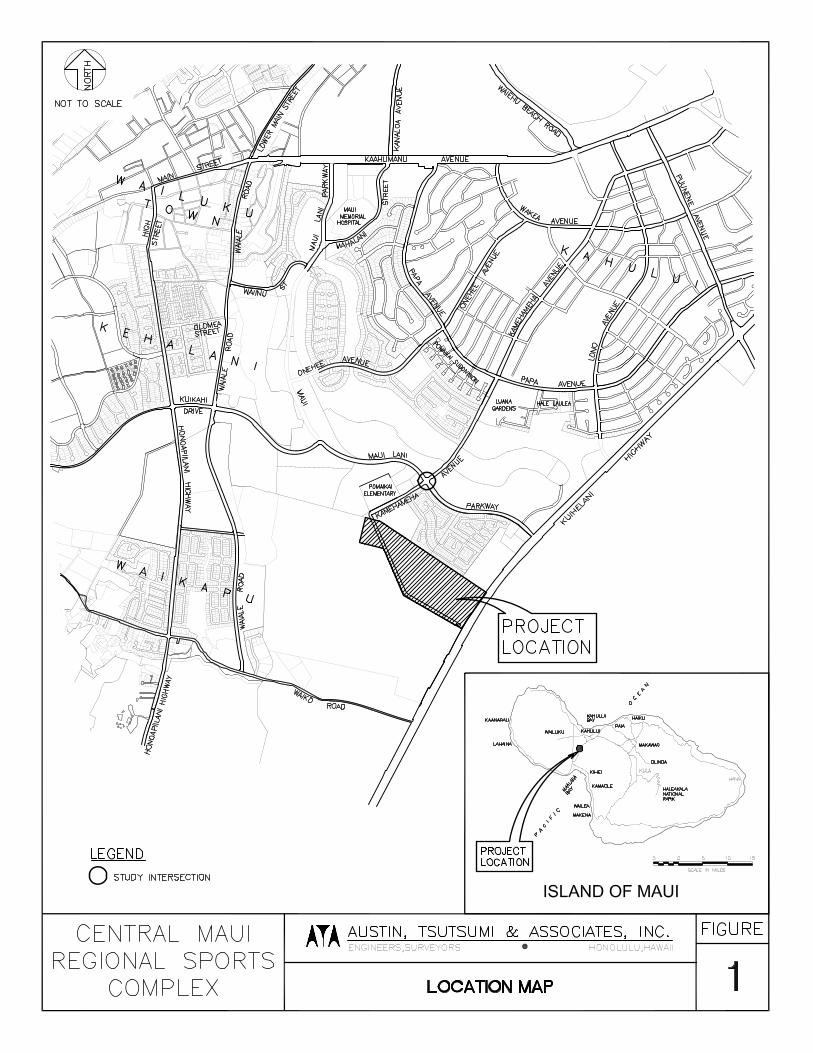
Figure 1 illustrates the location and study intersections for the Project.
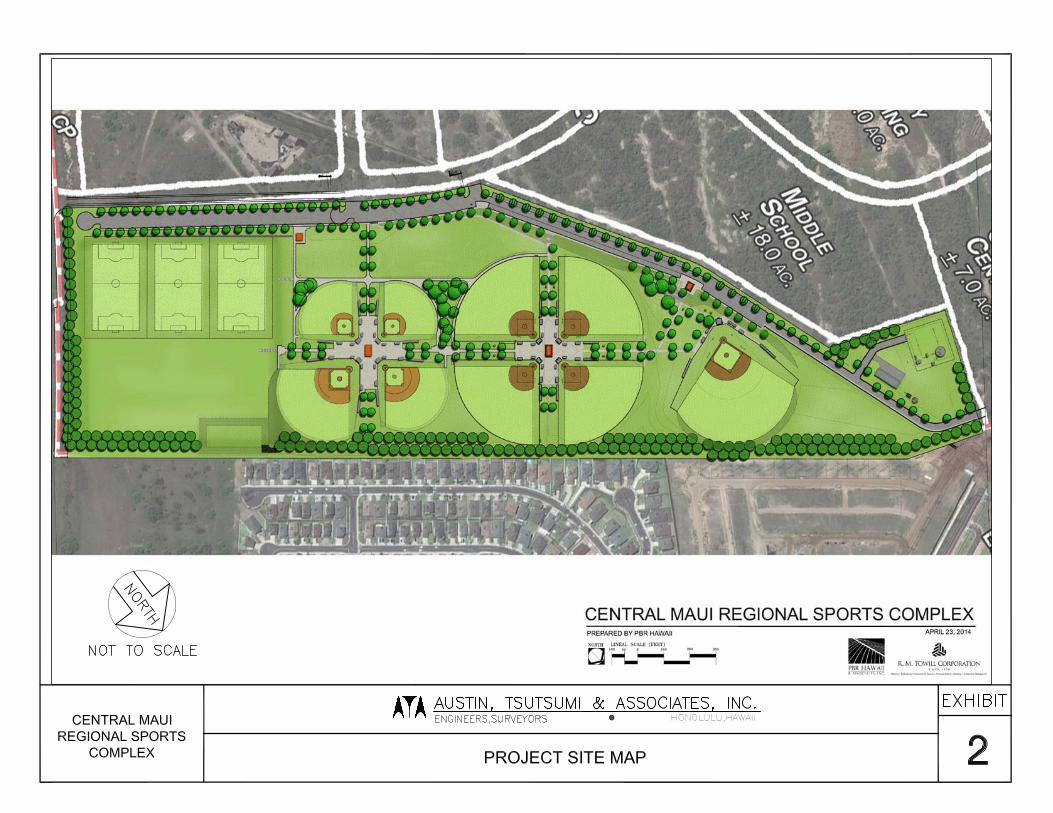
The Project Site Map is included as Figure 2.
4
B. Location
The Project is located in Kahului, on the island of Maui. The project site
is located along the west side of Kuihelani Highway between Maui Lani Parkway
and Waiko Road, and is bordered to the north by the Maui Lani Legends 2
residential development. Undeveloped parcels border the Project to the south
and west, with planned future development including a community center, middle
school, county housing, and the Waiale Project development. The Project site is
more specifically identified as TMK: (2) 3-8-007:101.
C. Study Methodology
This study will address the following:
1. Existing traffic operations at key locations within the study area during the
PM and Saturday peak hours of traffic.
2. Traffic projections for Base Year 2015 and 2022 (without the Project)
including traffic generated by an annual defacto growth rate, consistent
with the Maui Regional Long-Range Land Transportation Plan (MRTP),
and other known developments in the vicinity of the Project. These other
known developments in consideration are projects that are currently
under construction as well as known new/future developments that are
anticipated to affect traffic demand and operations within the study area.
3. Identification of potential traffic conditions for the Base Year 2015 and
2022.
4. Trip generation and traffic conditions for the proposed Project.
5. Determination of the impact of Project-generated traffic.
6. Recommendations for roadway improvements or other traffic mitigative
measures, as appropriate, to reduce or eliminate the adverse impacts
resulting from traffic generated by the Project.
D. Analysis Methodology
Level of Service (LOS) is a qualitative measure used to describe the
conditions of traffic flow at intersections, with values ranging from free-flow
conditions at LOS A to congested conditions at LOS F. The Highway Capacity
5
Manual – Special Report 209 (HCM), dated 2000, includes methods for
calculating volume to capacity ratios, delays, and corresponding Levels of
Service that were utilized in this study. LOS definitions for signalized and
unsignalized intersections are provided in Appendix B.
II. EXISTING CONDITIONS
A. Roadway System
The following are brief descriptions of the existing roadways in the vicinity
of the Project:
Maui Lani Parkway is generally an east-west, two-lane, two-way county
collector roadway. This roadway begins to the west at its intersection with
Waiale Road and Kuikahi Road, and terminates to the east at its intersection with
Kuihelani Highway. West of Kamehameha Avenue, this roadway is divided with
a posted speed limit of 30 miles per hour (mph). East of Kamehameha Avenue,
this roadway is undivided with a posted speed limit of 20 mph.
Kamehameha Avenue is a north-south, two-lane, two-way undivided
county collector roadway with a speed limit of 20 mph. This roadway begins to
the north at a T-intersection with Hana Highway and terminates approximately
1,600 feet to the south of its intersection with Maui Lani Parkway at the third
driveway to Pomaikai Elementary School.
Kuihelani Highway is a north-south, four-lane, two-way divided state
highway with posted speed limits ranging between 45 and 55 mph. This roadway
begins to the north at its intersection with Puunene Avenue where it continues to
the north as Dairy Road, and terminates to the south at its intersection with
Honoapiilani Highway.
B. Existing Traffic Volumes
Due to its proximity to the Project, the following intersection was studied:
Maui Lani Parkway/Kamehameha Avenue (unsignalized)
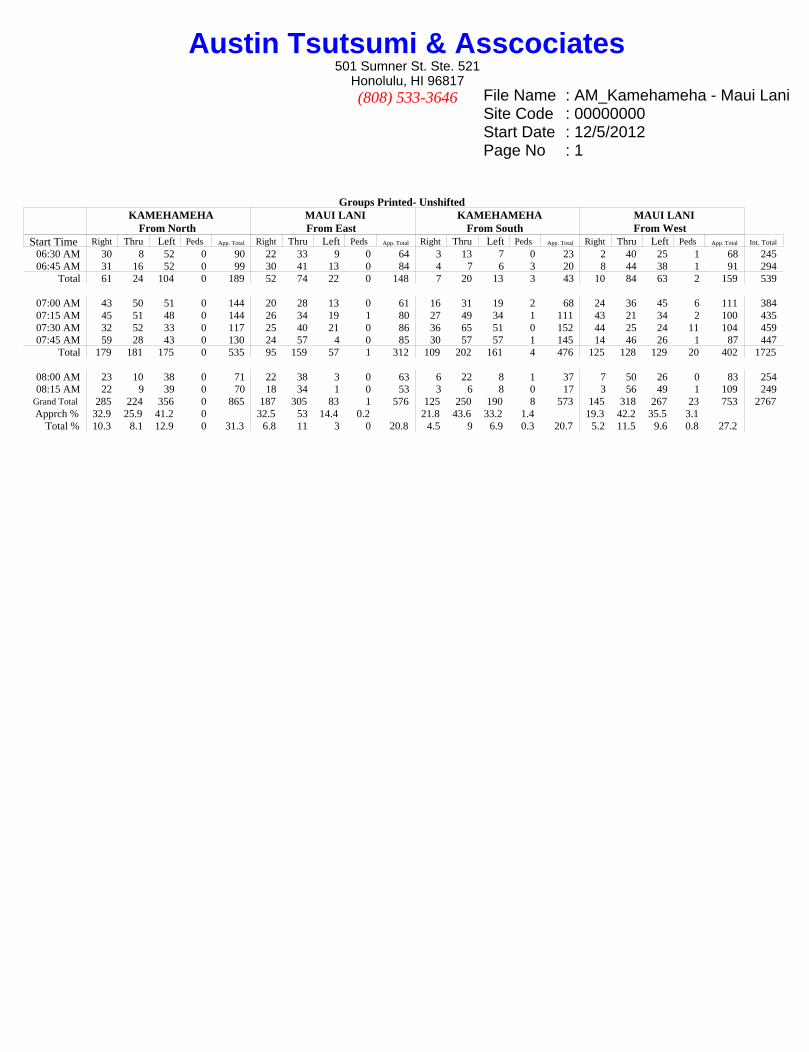
The Weekday Evening (PM) and Saturday (SAT) peak hour turning
movement data utilized in this report was collected on Tuesday, December 4th,
6
2012 and Saturday, April 6th, 2013. Based on this traffic count data, the
weekday PM peak hour of traffic was determined to be from 4:00 PM to 5:00 PM
and the SAT peak hour of traffic was determined to be from 11:30 AM to 12:30
PM. The traffic count data is provided in Appendix A. The Weekday Morning
(AM) peak hour was not studied due to minimal trips forecast to be generated by
the Project during this time period.
C. Existing Traffic Conditions Analysis and Observations
The existing all-way stop-controlled intersection at Maui Lani
Parkway/Kamehameha Avenue has flashing beacons on all approaches.
Marked crosswalks are provided on the northbound and eastbound approaches.
Pomaikai Elementary School is located along the west side of Kamehameha
Avenue, approximately 700 feet to the south of its intersection with Maui Lani
Parkway.
The study intersection was observed to operate with significant delay
during the PM peak hour of traffic. The eastbound and westbound approaches
were observed to operate at LOS F and overcapacity conditions. All other
movements were observed to operate at LOS D or better during the PM peak
hour. These observations confirmed the traffic analysis results.
Intersection operations during the Saturday peak hour of traffic were
observed to operate satisfactorily, with LOS C or better on all approaches.
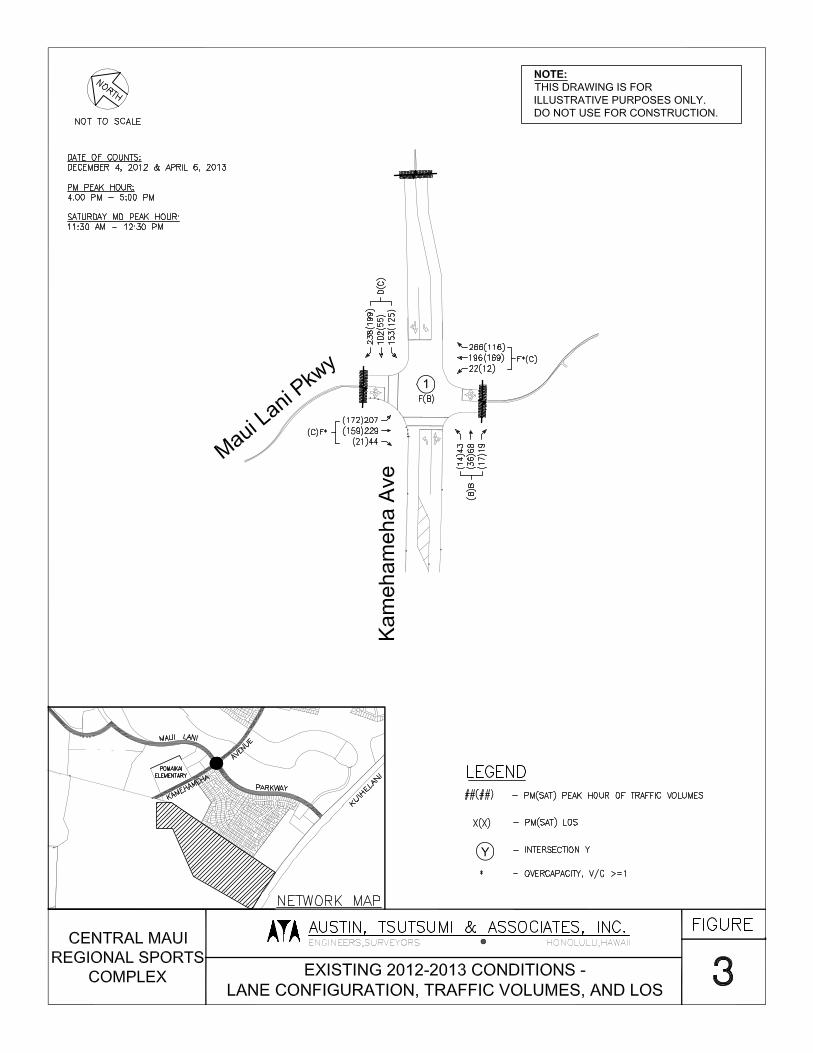
Based on existing traffic counts, the Maui Lani Parkway/Kamehameha
Avenue intersection currently meets the four-hour traffic warrant for a signalized
intersection. Appendix D shows the existing 2013 traffic volumes plotted against
the four-hour traffic warrant curves given in the Manual on Uniform Traffic Control
Devices (MUTCD), Chapter 4.
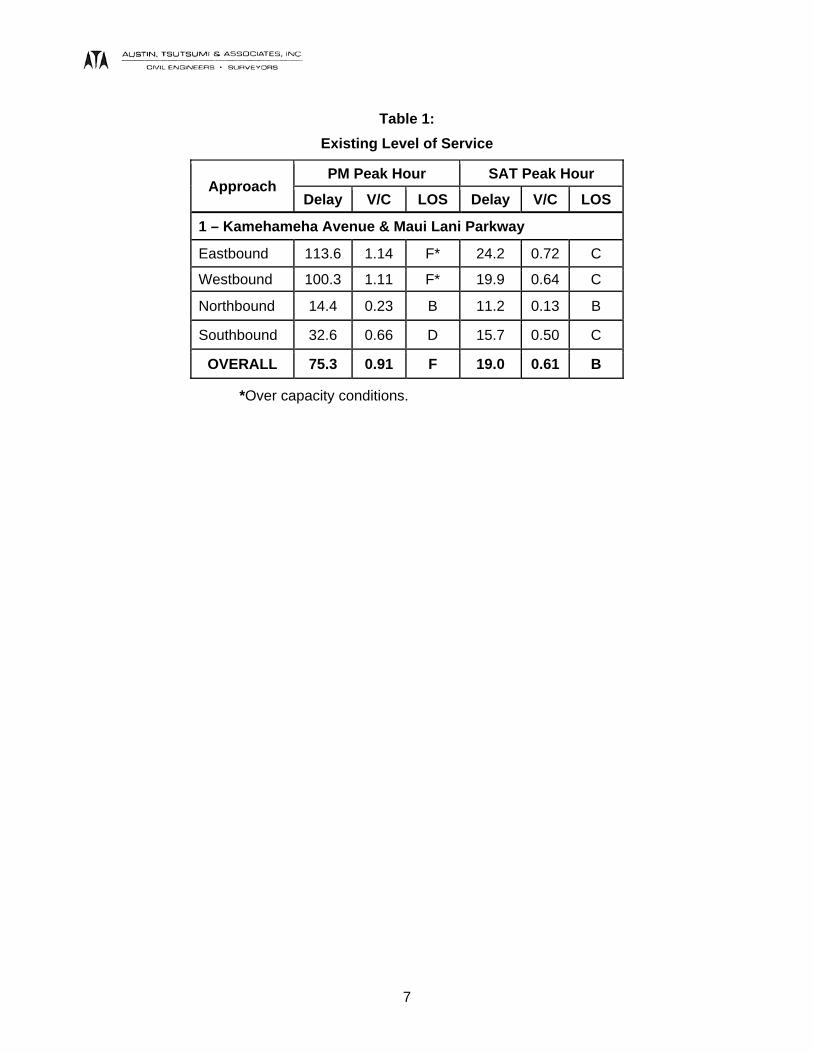
Table 1 below provides the existing delay, volume-to-capacity ratio (V/C),
and LOS for the study intersection, with the full LOS summary tables provided in
Appendix C. Existing traffic volumes, lane configurations and movement LOS
are illustrated in Figure 3.
7
Table 1:
Existing Level of Service
Approach PM Peak Hour SAT Peak Hour
Delay V/C LOS Delay V/C LOS
1 – Kamehameha Avenue & Maui Lani Parkway
Eastbound 113.6 1.14 F* 24.2 0.72 C
Westbound 100.3 1.11 F* 19.9 0.64 C
Northbound 14.4 0.23 B 11.2 0.13 B
Southbound 32.6 0.66 D 15.7 0.50 C
OVERALL 75.3 0.91 F 19.0 0.61 B
*Over capacity conditions.
9
III. BASE YEAR TRAFFIC ANALYSIS WITHOUT THE PROJECT
The year 2015 was selected as the base year to reflect the anticipated
completion year and full occupancy of Phase 1 of the Project. The year 2022 was
selected as the base year to reflect the anticipated completion year and full occupancy
of Phase 2 of the Project to coincide with the full build out of the Waiale Development.
A. Defacto Growth Rate
A defacto growth rate for each movement of the study intersection was
derived from the MRTP. These defacto growth rates ranged from 2.0 to 4.4
percent per year.
B. Other Known Developments
The future developments in the area that are anticipated to have a
transportation impact on the study intersection are the following:
By Base Year 2015
Maui Lani Residential – Mostly Single-Family Residential, defined as the
entire Maui Lani development excluding the Maui Lani Commercial
(VMX-C/R) parcel. Approximately 30 percent of the residential component is
complete and is anticipated to increase at a rate of one (1) dwelling unit per
week.
Maui Lani Commercial (VMX-C/R) – Commercial/Retail with Light Industrial
and Single-Family Residential. This development is currently under
construction and is anticipated to be completed over several phases through
2027.
Kehalani – Commercial space, residential units and an elementary school.
This development is approximately 50 percent complete.
By Base Year 2022
Waikapu Country Town – Commercial space and residential units near the
existing Maui Tropical Plantation. This development is currently in the
planning stages and is anticipated to begin occupancy in year 2020.
10
Waiale Development – Single-Family and Multi-Family Residential along with
commercial space, industrial space, and a middle school. This development
is currently in the planning stages and is anticipated to be complete by year
2022.
These future developments are included in the traffic projections from the
MRTP. As these land uses are already included in the defacto growth rate at the
study intersection, no additional traffic volumes were added to the Base Year
2015 forecast. However, the Waiale Development is anticipated to be completed
concurrently with Phase 2 of the Project and was not adequately represented by
the MRTP at the study intersection. Traffic volumes associated with the full build
and occupancy of the Waiale Development by year 2022 was determined using
the Waiale Development Traffic Impact Analysis Report TIAR published by ATA
in March of 2011 and supplemental trip generation for the Saturday peak hour
using the Trip Generation Manual, 9th Edition as shown in Appendix E.
The vehicle traffic generated by the Waiale development, as indicated in
the Waiale Development TIAR, was distributed through the study intersection
consistent with the report as background volumes for year 2022. The same
distribution was used for a proportionate amount of forecast Saturday peak hour
volumes.
In addition, the Waiale Development will include new roadways adjacent
to the Project, hereinafter referred to as ‘Road B’ and ‘Road C’. These two (2)
roadways are currently planned to create a T-intersection with the minor stop-
controlled movement, Road B, terminating at the Project site. Kamehameha
Avenue would also be extended further to the south and create a direct
connection between Maui Lani Parkway and the Waiale Development site.
C. Results of Intersection Analysis
Base Year 2015
At the time of this report, a traffic signal is under design and is assumed
to be installed at the Kamehameha Avenue/Maui Lani Parkway intersection by
Base Year 2015. Separate left-turn, through, and right-turn lanes are assumed
to be included for the westbound and eastbound approaches with the installation
11
of the traffic signal, as indicated in the Onehee Avenue Extension TIAR
published by ATA in April, 2013. The traffic signal is forecast to operate at
overall LOS B during the PM and Saturday peak hours, with all approaches
operating at LOS C or better.
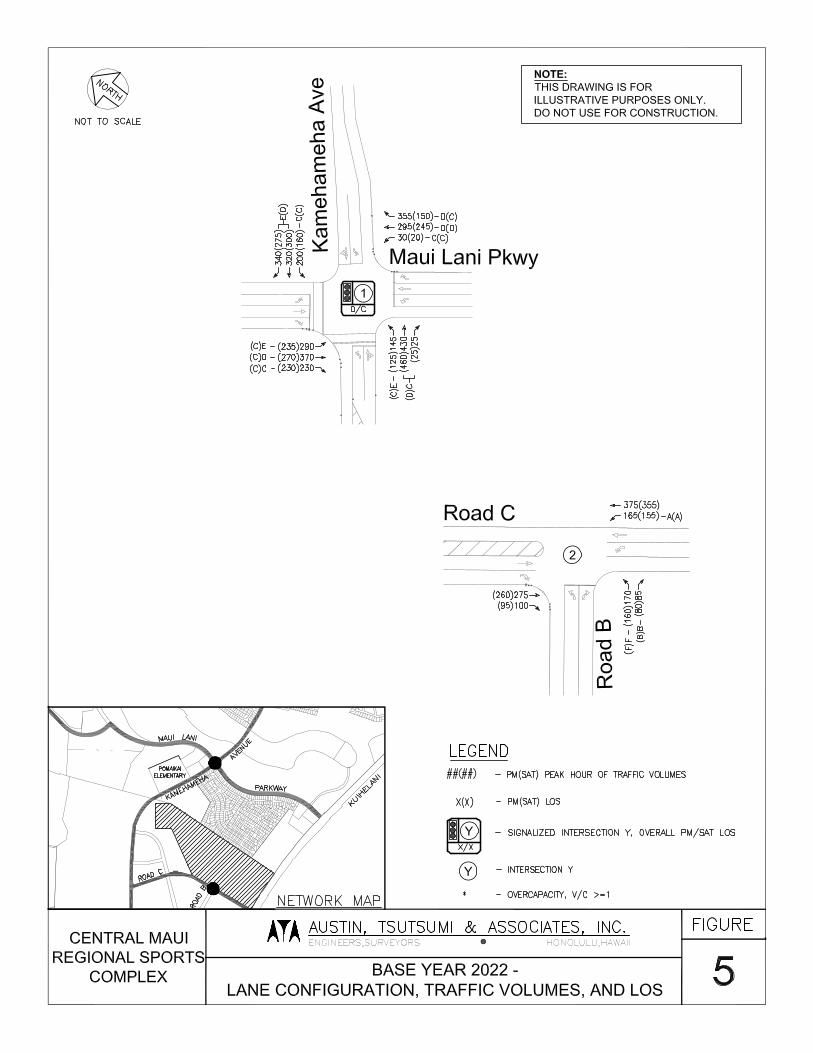
Base Year 2022
Traffic conditions at the study intersection without any improvements
besides the ones described above would yield LOS E and nearly reach
overcapacity conditions on several movements during the PM peak hour by year
2022. The Road C/Road B intersection will operate at LOS B or better on all
movements except for the northbound left-turn, which will operate at LOS F. In
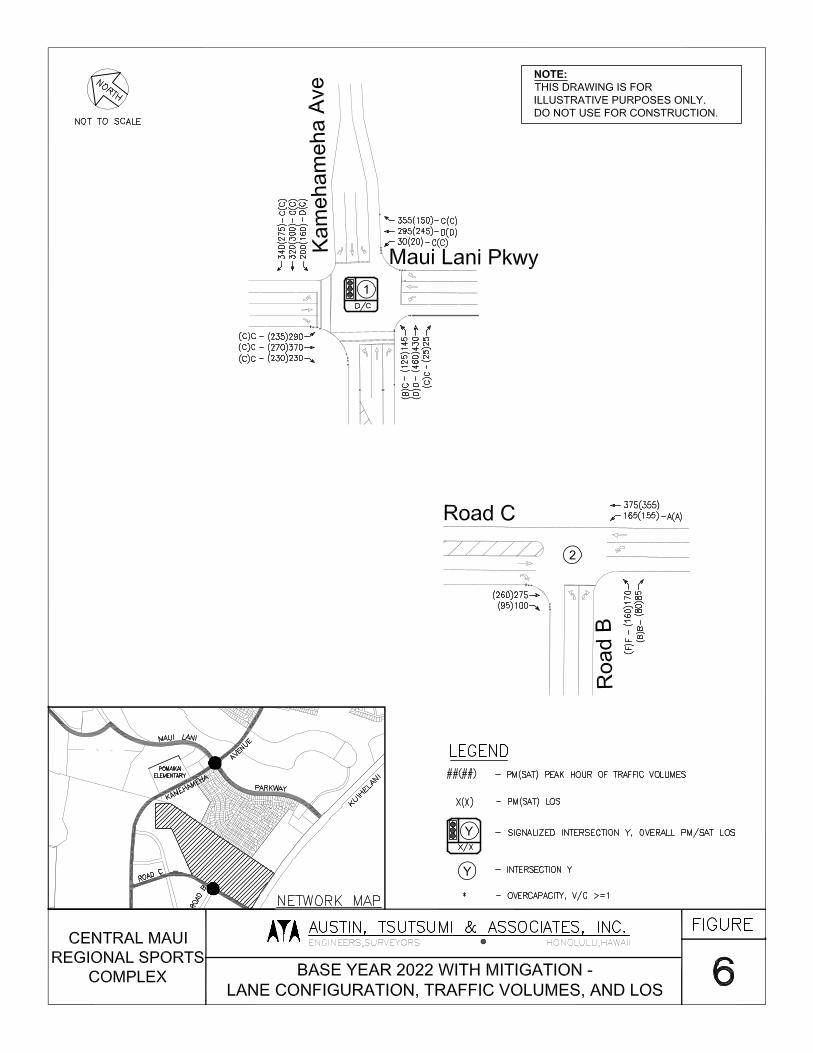
order to mitigate these traffic conditions, the following improvements are
recommended:
Kamehameha Avenue/Maui Lani Parkway
Mitigation:
o Northbound and southbound approaches: Provide exclusive left-
turn, through, and right-turn lanes.
Road C/Road B
Mitigation:
o Based upon forecast traffic volumes associated with nearby
development before construction of the proposed Project, a traffic
signal may be warranted by 2022. It is recommended that the
intersection be monitored after construction to determine when
and if the intersection meets traffic signal warrants.
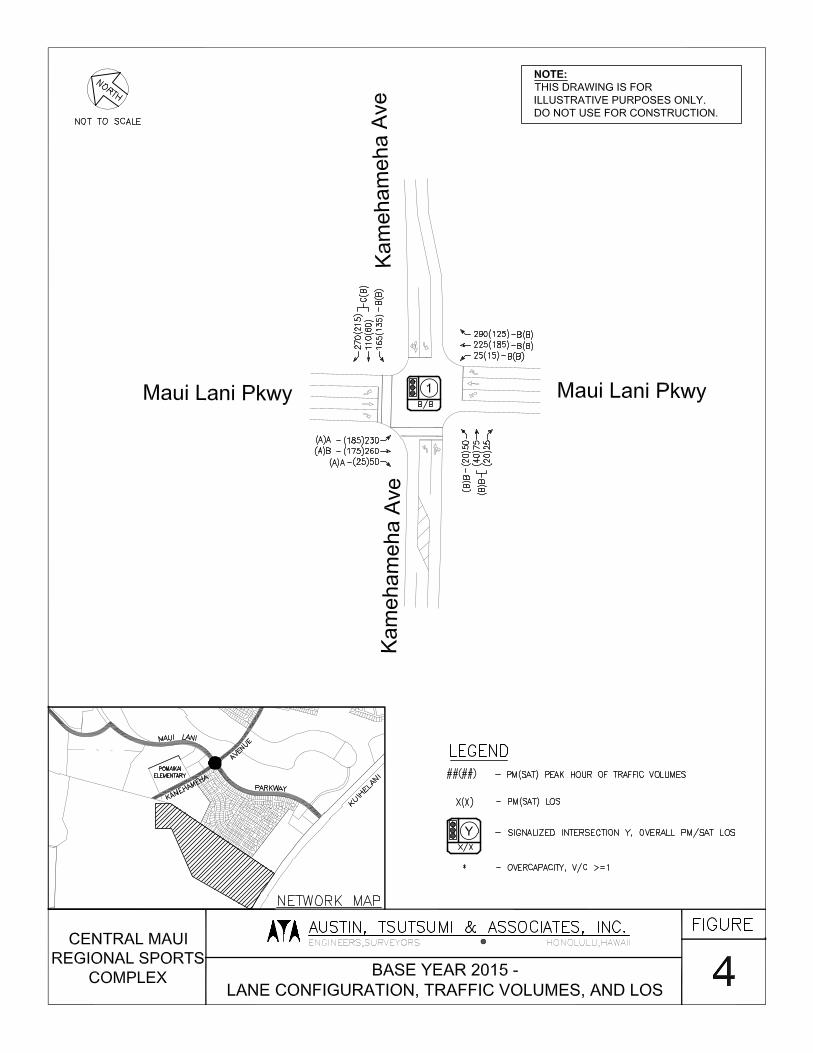
Figures 4-6 provide illustrations of the forecast traffic volumes, lane
configurations and movement LOS for Base Year 2015, Base Year 2022, and
Base Year 2022 with Mitigation conditions, respectively. Table 2 shows the Base
Year 2015, 2022, and 2022 with Mitigation LOS at the study intersection, with the
full LOS summary tables provided in Appendix C.
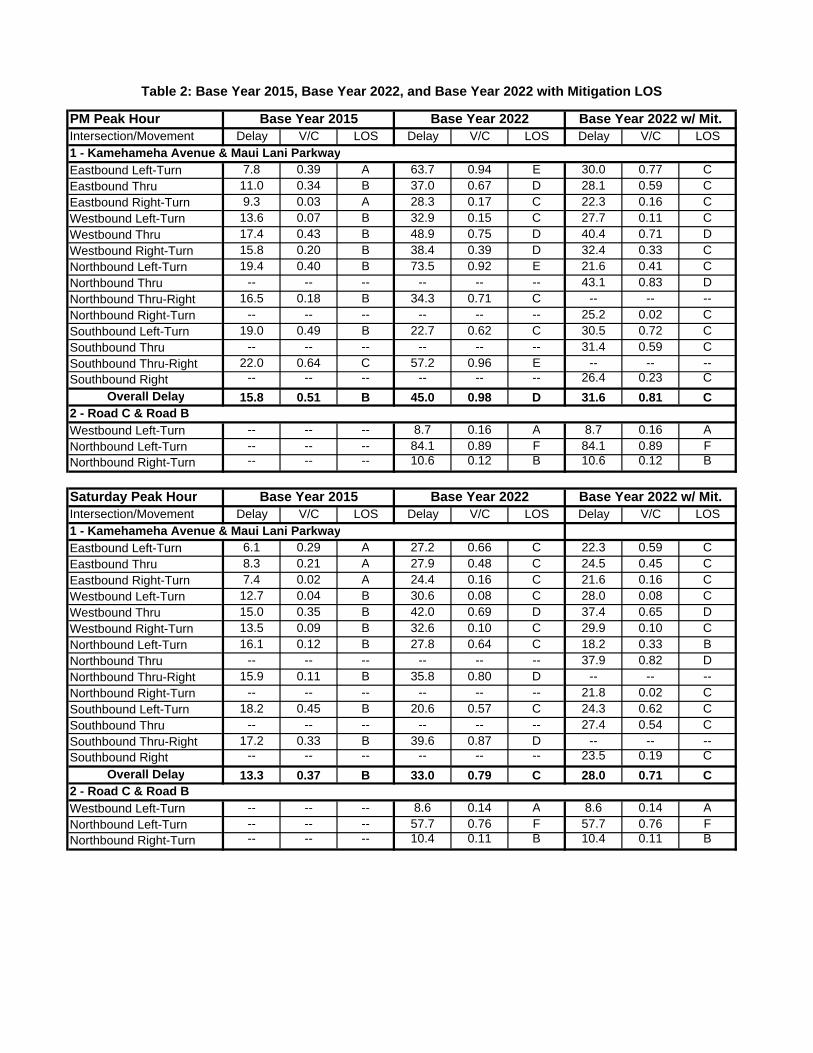
PM Peak HourIntersection/Movement Delay V/C LOS Delay V/C LOS Delay V/C LOS1 - Kamehameha Avenue & Maui Lani Parkway
Eastbound Left-Turn 7.8 0.39 A 63.7 0.94 E 30.0 0.77 CEastbound Thru 11.0 0.34 B 37.0 0.67 D 28.1 0.59 CEastbound Right-Turn 9.3 0.03 A 28.3 0.17 C 22.3 0.16 CWestbound Left-Turn 13.6 0.07 B 32.9 0.15 C 27.7 0.11 CWestbound Thru 17.4 0.43 B 48.9 0.75 D 40.4 0.71 DWestbound Right-Turn 15.8 0.20 B 38.4 0.39 D 32.4 0.33 CNorthbound Left-Turn 19.4 0.40 B 73.5 0.92 E 21.6 0.41 CNorthbound Thru -- -- -- -- -- -- 43.1 0.83 DNorthbound Thru-Right 16.5 0.18 B 34.3 0.71 C -- -- --Northbound Right-Turn -- -- -- -- -- -- 25.2 0.02 CSouthbound Left-Turn 19.0 0.49 B 22.7 0.62 C 30.5 0.72 CSouthbound Thru -- -- -- -- -- -- 31.4 0.59 CSouthbound Thru-Right 22.0 0.64 C 57.2 0.96 E -- -- --Southbound Right -- -- -- -- -- -- 26.4 0.23 C
Overall Delay 15.8 0.51 B 45.0 0.98 D 31.6 0.81 C2 - Road C & Road B
Westbound Left-Turn -- -- -- 8.7 0.16 A 8.7 0.16 ANorthbound Left-Turn -- -- -- 84.1 0.89 F 84.1 0.89 FNorthbound Right-Turn -- -- -- 10.6 0.12 B 10.6 0.12 B
Saturday Peak HourIntersection/Movement Delay V/C LOS Delay V/C LOS Delay V/C LOS1 - Kamehameha Avenue & Maui Lani Parkway
Eastbound Left-Turn 6.1 0.29 A 27.2 0.66 C 22.3 0.59 CEastbound Thru 8.3 0.21 A 27.9 0.48 C 24.5 0.45 CEastbound Right-Turn 7.4 0.02 A 24.4 0.16 C 21.6 0.16 CWestbound Left-Turn 12.7 0.04 B 30.6 0.08 C 28.0 0.08 CWestbound Thru 15.0 0.35 B 42.0 0.69 D 37.4 0.65 DWestbound Right-Turn 13.5 0.09 B 32.6 0.10 C 29.9 0.10 CNorthbound Left-Turn 16.1 0.12 B 27.8 0.64 C 18.2 0.33 BNorthbound Thru -- -- -- -- -- -- 37.9 0.82 DNorthbound Thru-Right 15.9 0.11 B 35.8 0.80 D -- -- --Northbound Right-Turn -- -- -- -- -- -- 21.8 0.02 CSouthbound Left-Turn 18.2 0.45 B 20.6 0.57 C 24.3 0.62 CSouthbound Thru -- -- -- -- -- -- 27.4 0.54 CSouthbound Thru-Right 17.2 0.33 B 39.6 0.87 D -- -- --Southbound Right -- -- -- -- -- -- 23.5 0.19 C
Overall Delay 13.3 0.37 B 33.0 0.79 C 28.0 0.71 C2 - Road C & Road B
Westbound Left-Turn -- -- -- 8.6 0.14 A 8.6 0.14 ANorthbound Left-Turn -- -- -- 57.7 0.76 F 57.7 0.76 FNorthbound Right-Turn -- -- -- 10.4 0.11 B 10.4 0.11 B
Table 2: Base Year 2015, Base Year 2022, and Base Year 2022 with Mitigation LOS
Base Year 2015 Base Year 2022 Base Year 2022 w/ Mit.
Base Year 2015 Base Year 2022 Base Year 2022 w/ Mit.
16
IV. FUTURE YEAR TRAFFIC ANALYSIS WITH THE PROJECT
A. Future Year 2015 – Phase 1
Project Trip Generation
The Institute of Transportation Engineers (ITE) publishes a book based
on empirical data compiled from a body of more than 4,250 trip generation
studies submitted by public agencies, developers, consulting firms, and
associations. This publication, titled Trip Generation Manual, 9th Edition,
provides trip rates and/or formulae based on graphs that correlate vehicular trips
with independent variables. The independent variables can range from Dwelling
Units (DU) for single-family attached homes to Gross Floor Area (GFA) for
commercial or office development to Acres for recreational park spaces. These
trip rates/formulae and their associated directional distributions were used to
estimate the increase in the number of vehicular trips generated by the Project.
By year 2015, Phase 1 of the Project is scheduled to include four (4) little
league baseball fields, four (4) softball fields, three (3) full-size soccer fields,
one (1) baseball field, and approximately 600 parking stalls on 65 acres of park
land. The most similar land uses from the Trip Generation Manual are the
‘County Park’ (LUC 412) and ‘Soccer Complex’ (LUC 488) due to the size of the
Project and forecast travel demand.
The forecast trip generation for the ‘County Park’ portion of the
development was determined by subtracting the land area used by the sports
fields and the drainage retention area. The remaining park area was estimated
to be 13 acres, which is forecast to generate two (2) PM peak hour trips and 29
Saturday peak hour trips. The ‘Soccer Complex’ portion of the development
used the same ‘Field’ units as if all the sports (baseball/softball/soccer) fields
were used for soccer, as the number of players and length of games are
comparable. The 12 sports fields are forecast to generate approximately 213 PM
peak hour trips and 369 Saturday peak hour trips.
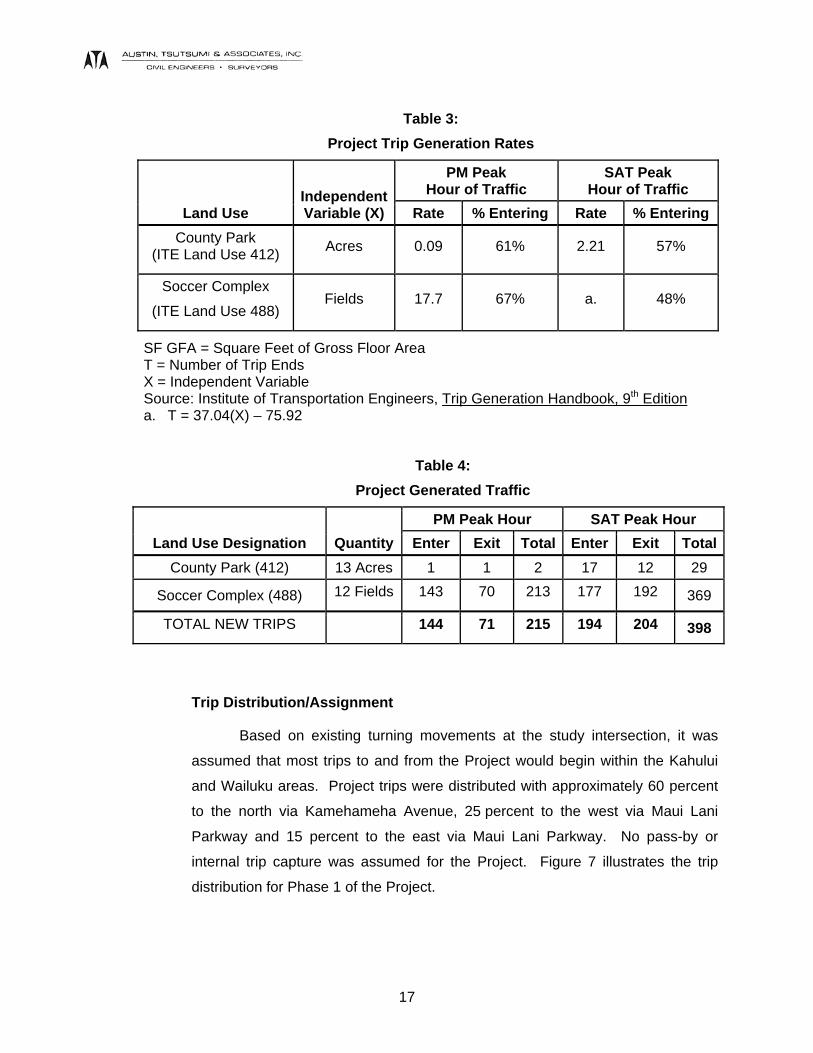
The trip generation rates for the Project are shown in Table 3 and the
trips generated are shown in Table 4.
17
Table 3:
Project Trip Generation Rates
Land Use Independent Variable (X)
PM Peak Hour of Traffic
SAT Peak Hour of Traffic
Rate % Entering Rate % Entering
County Park (ITE Land Use 412)
Acres 0.09 61% 2.21 57%
Soccer Complex
(ITE Land Use 488) Fields 17.7 67% a. 48%
SF GFA = Square Feet of Gross Floor Area T = Number of Trip Ends X = Independent Variable Source: Institute of Transportation Engineers, Trip Generation Handbook, 9th Edition a. T = 37.04(X) – 75.92
Table 4:
Project Generated Traffic
Land Use Designation Quantity
PM Peak Hour SAT Peak Hour
Enter Exit Total Enter Exit Total
County Park (412) 13 Acres 1 1 2 17 12 29
Soccer Complex (488) 12 Fields 143 70 213 177 192 369
TOTAL NEW TRIPS 144 71 215 194 204 398
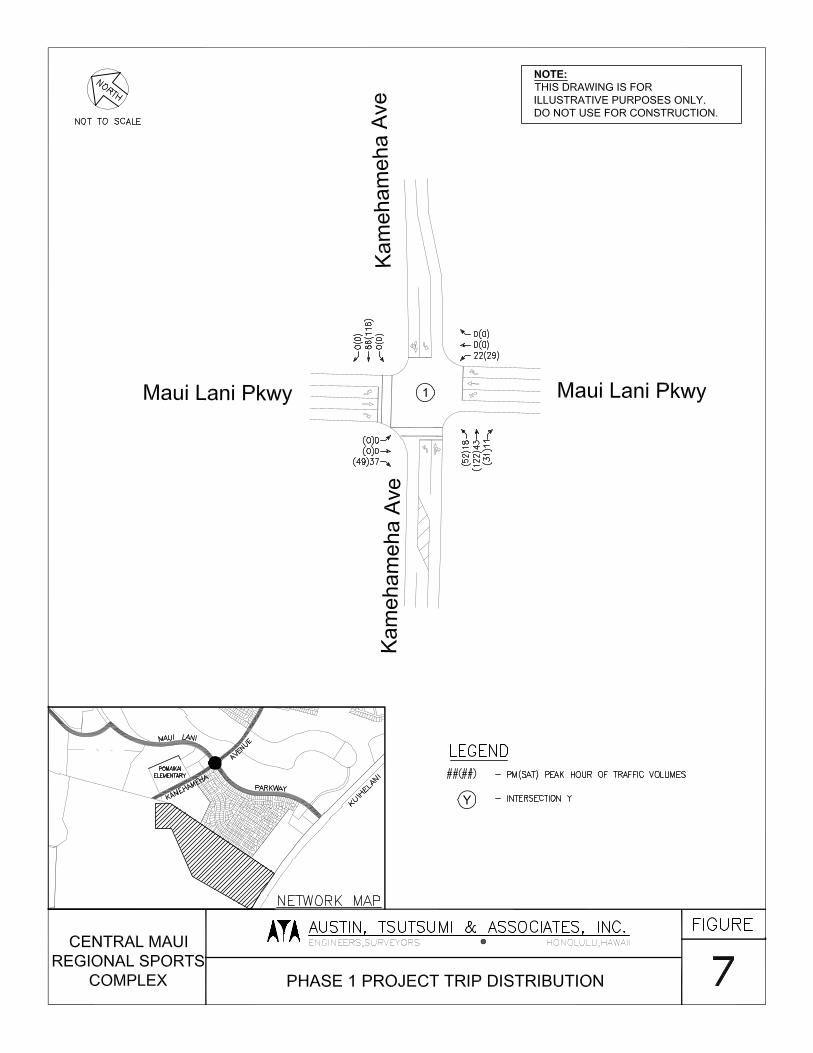
Trip Distribution/Assignment
Based on existing turning movements at the study intersection, it was
assumed that most trips to and from the Project would begin within the Kahului
and Wailuku areas. Project trips were distributed with approximately 60 percent
to the north via Kamehameha Avenue, 25 percent to the west via Maui Lani
Parkway and 15 percent to the east via Maui Lani Parkway. No pass-by or
internal trip capture was assumed for the Project. Figure 7 illustrates the trip
distribution for Phase 1 of the Project.
19
Future Year 2015 Analysis
A full access driveway will be provided on Kamehameha Avenue just
south of Pomaikai Elementary School, hereinafter referred to as the ‘West
Access’. As a result, all vehicles traveling to and from the Project are forecast to
utilize the study intersection during Phase 1.
With Project generated traffic volumes, the study intersection operations
are forecast to continue operating at overall LOS B during the PM and Saturday
peak hours with all movements operating at LOS C or better.
Figure 8 illustrates the forecast traffic volumes, lane configuration, and
LOS for Future 2015 – Phase 1 conditions. Table 5 summarizes the delay, V/C,
and LOS at the study intersection for Base Year 2015 and Future 2015 –
Phase 1 conditions.

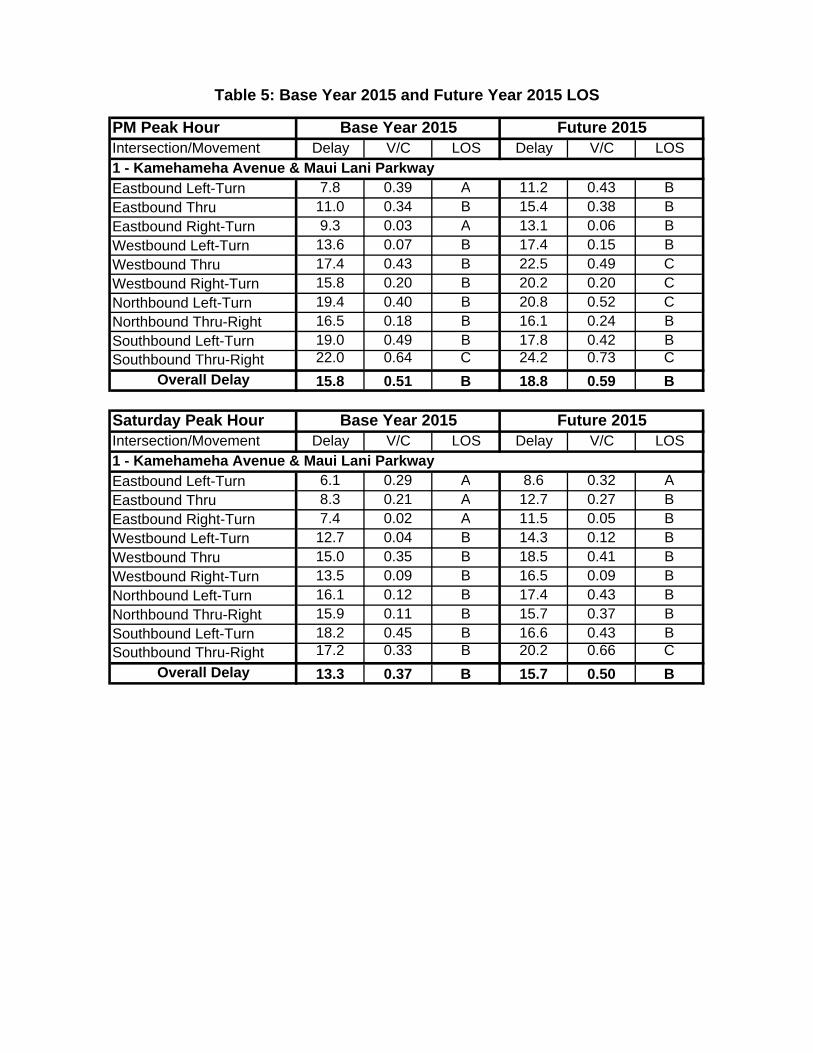
PM Peak HourIntersection/Movement Delay V/C LOS Delay V/C LOS1 - Kamehameha Avenue & Maui Lani ParkwayEastbound Left-Turn 7.8 0.39 A 11.2 0.43 BEastbound Thru 11.0 0.34 B 15.4 0.38 BEastbound Right-Turn 9.3 0.03 A 13.1 0.06 BWestbound Left-Turn 13.6 0.07 B 17.4 0.15 BWestbound Thru 17.4 0.43 B 22.5 0.49 CWestbound Right-Turn 15.8 0.20 B 20.2 0.20 CNorthbound Left-Turn 19.4 0.40 B 20.8 0.52 CNorthbound Thru-Right 16.5 0.18 B 16.1 0.24 BSouthbound Left-Turn 19.0 0.49 B 17.8 0.42 BSouthbound Thru-Right 22.0 0.64 C 24.2 0.73 C
Overall Delay 15.8 0.51 B 18.8 0.59 B
Saturday Peak HourIntersection/Movement Delay V/C LOS Delay V/C LOS1 - Kamehameha Avenue & Maui Lani ParkwayEastbound Left-Turn 6.1 0.29 A 8.6 0.32 AEastbound Thru 8.3 0.21 A 12.7 0.27 BEastbound Right-Turn 7.4 0.02 A 11.5 0.05 BWestbound Left-Turn 12.7 0.04 B 14.3 0.12 BWestbound Thru 15.0 0.35 B 18.5 0.41 BWestbound Right-Turn 13.5 0.09 B 16.5 0.09 BNorthbound Left-Turn 16.1 0.12 B 17.4 0.43 BNorthbound Thru-Right 15.9 0.11 B 15.7 0.37 BSouthbound Left-Turn 18.2 0.45 B 16.6 0.43 BSouthbound Thru-Right 17.2 0.33 B 20.2 0.66 C
Overall Delay 13.3 0.37 B 15.7 0.50 B
Base Year 2015 Future 2015
Table 5: Base Year 2015 and Future Year 2015 LOS
Base Year 2015 Future 2015
22
B. Future Year 2022 – Phase 2
Uses of the Project are planned to be fully built and functional by year
2015. However, with the anticipated future construction of the Waiale
Development to the south of the Project, alternate accesses would be provided.
At the time of this writing it is uncertain when the Waiale Development would be
completed, therefore, Year 2022 was selected as the build out year of that
development to be consistent with the March 2011 Waiale Development TIAR.
Furthermore, the Waiale Development is currently being revised and an update
TIAR is planned as a result. Therefore, the revised TIAR may recommend
different improvements at the intersections.
Project Trip Generation
By year 2022, Phase 2 of the Project is scheduled to increase the size of
the drainage retention area, provide two vehicle accesses along what is referred
to as ‘Road C’, and restrict the vehicle access off of South Kamehameha Avenue
to maintenance and emergency vehicles only. Phase 2 is not anticipated to
increase the overall Project trip generation as described in Section IV.A.
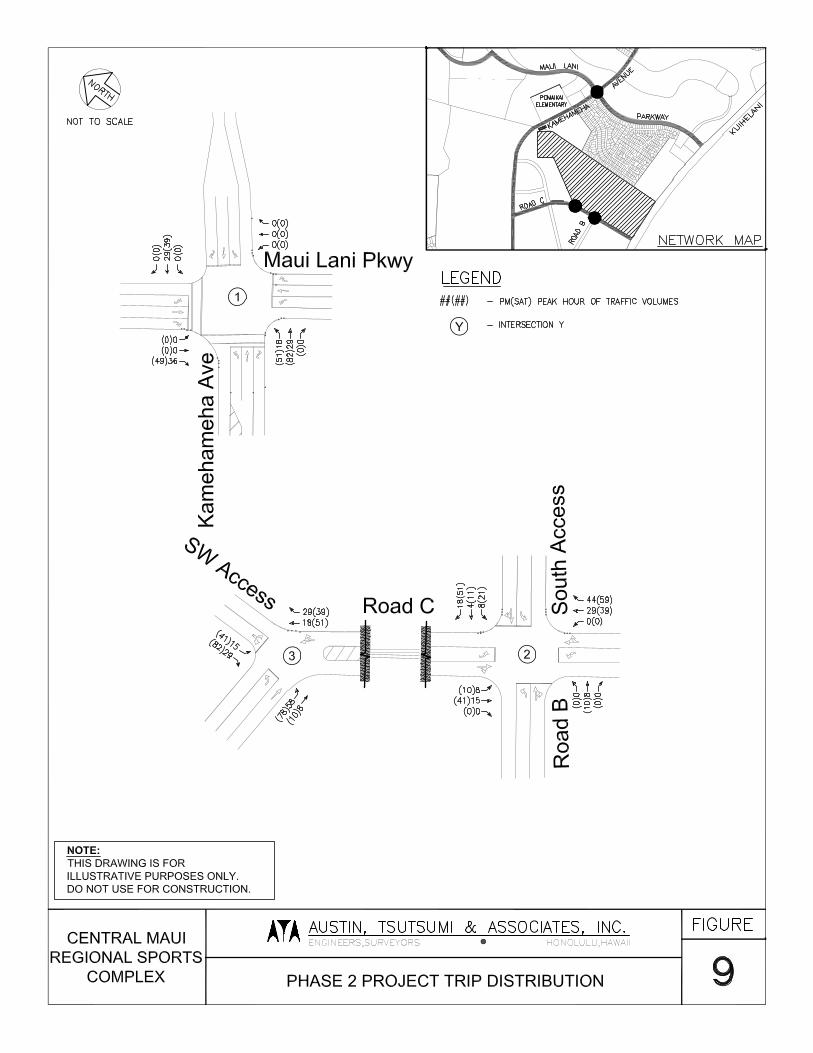
Trip Distribution/Assignment
Two (2) vehicle accesses will be provided along Road C to the south of
the Project as part of the Waiale Development and Phase 2 of the Project. Both
of the vehicle access driveways will provide full access. One (1) access
driveway will serve as the north leg of the Road C/Road B intersection,
hereinafter referred to as the ‘South Access’. The other vehicle access driveway
will be located approximately 500 feet to the west of the Road C/Road B
intersection, hereinafter referred to as the ‘SW Access’. Figure 9 illustrates the
trip distribution for Phase 2 of the Project.
24
Future Year 2022 Analysis
Kamehameha Avenue & Maui Lani Parkway
With Project generated traffic volumes and the improvements listed in
Section III.C, the Kamehameha Avenue/Maui Lani Parkway intersection is
forecast to operate at LOS C during the PM and Saturday peak hours, with all
movements operating at LOS D or better.
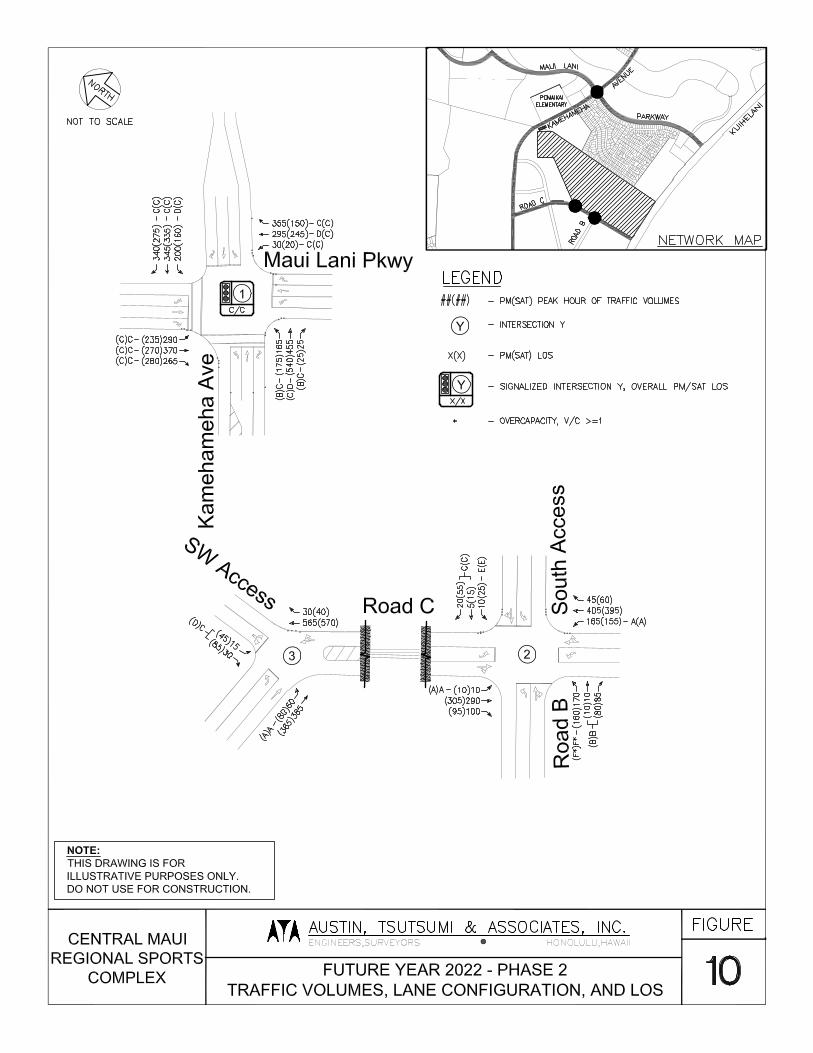
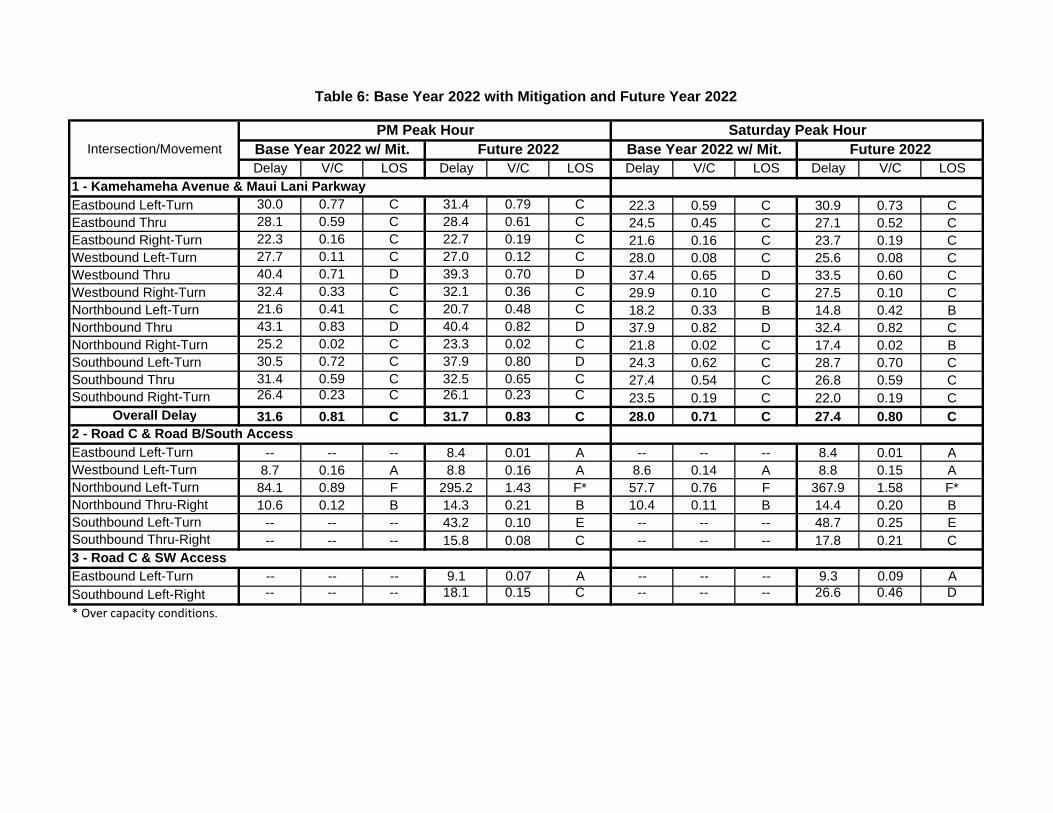
Road C & Road B/South Access
The South Access will serve as the north leg of the Road C/Road B
two-way stop-control intersection. Eastbound and westbound movements will
operate freely, with an exclusive left-turn lane and a through-right lane on each
approach. The northbound left-turn movement is forecast to operate at LOS F
and exceed capacity during PM and Saturday peak hours, while the southbound
left-turn movement will operate at LOS E during the PM peak hour and LOS F
during the Saturday peak hour. All other movements are forecast to operate at
LOS C or better. As discussed in Section III.C, it is recommended that the
intersection be monitored after construction to determine when and if the
intersection meets traffic signal warrants.
Road C & SW Access
All movements at this intersection are forecast to operate at LOS D or
better during the PM and Saturday peak hours.
Figure 10 illustrates the forecast traffic volumes, lane configuration, and
LOS for Future 2022 – Phase 2 conditions. Table 6 summarizes the delay, V/C,
and LOS at the study intersection for Base Year 2022 with Mitigation and Future
Year 2022 – Phase 2 conditions.
Delay V/C LOS Delay V/C LOS Delay V/C LOS Delay V/C LOS1 - Kamehameha Avenue & Maui Lani Parkway
Eastbound Left-Turn 30.0 0.77 C 31.4 0.79 C 22.3 0.59 C 30.9 0.73 CEastbound Thru 28.1 0.59 C 28.4 0.61 C 24.5 0.45 C 27.1 0.52 CEastbound Right-Turn 22.3 0.16 C 22.7 0.19 C 21.6 0.16 C 23.7 0.19 CWestbound Left-Turn 27.7 0.11 C 27.0 0.12 C 28.0 0.08 C 25.6 0.08 CWestbound Thru 40.4 0.71 D 39.3 0.70 D 37.4 0.65 D 33.5 0.60 CWestbound Right-Turn 32.4 0.33 C 32.1 0.36 C 29.9 0.10 C 27.5 0.10 CNorthbound Left-Turn 21.6 0.41 C 20.7 0.48 C 18.2 0.33 B 14.8 0.42 BNorthbound Thru 43.1 0.83 D 40.4 0.82 D 37.9 0.82 D 32.4 0.82 CNorthbound Right-Turn 25.2 0.02 C 23.3 0.02 C 21.8 0.02 C 17.4 0.02 BSouthbound Left-Turn 30.5 0.72 C 37.9 0.80 D 24.3 0.62 C 28.7 0.70 CSouthbound Thru 31.4 0.59 C 32.5 0.65 C 27.4 0.54 C 26.8 0.59 CSouthbound Right-Turn 26.4 0.23 C 26.1 0.23 C 23.5 0.19 C 22.0 0.19 C
Overall Delay 31.6 0.81 C 31.7 0.83 C 28.0 0.71 C 27.4 0.80 C2 - Road C & Road B/South Access
Eastbound Left-Turn -- -- -- 8.4 0.01 A -- -- -- 8.4 0.01 AWestbound Left-Turn 8.7 0.16 A 8.8 0.16 A 8.6 0.14 A 8.8 0.15 ANorthbound Left-Turn 84.1 0.89 F 295.2 1.43 F* 57.7 0.76 F 367.9 1.58 F*Northbound Thru-Right 10.6 0.12 B 14.3 0.21 B 10.4 0.11 B 14.4 0.20 BSouthbound Left-Turn -- -- -- 43.2 0.10 E -- -- -- 48.7 0.25 ESouthbound Thru-Right -- -- -- 15.8 0.08 C -- -- -- 17.8 0.21 C3 - Road C & SW AccessEastbound Left-Turn -- -- -- 9.1 0.07 A -- -- -- 9.3 0.09 ASouthbound Left-Right -- -- -- 18.1 0.15 C -- -- -- 26.6 0.46 D
* Over capacity conditions.
Table 6: Base Year 2022 with Mitigation and Future Year 2022
PM Peak Hour Saturday Peak HourIntersection/Movement Base Year 2022 w/ Mit. Future 2022Base Year 2022 w/ Mit. Future 2022
27
V. CONCLUSION
The Project plans to provide approximately 65 acres of recreational park space
on an undeveloped parcel fronting Kuihelani Highway with two (2) phases of
development. The first phase of development will include four (4) little league baseball
fields, four (4) softball fields, three (3) full-size soccer fields, one (1) baseball field, and a
small drainage retention area with primary vehicle access via South Kamehameha
Avenue. Phase 2 will increase the size of the drainage retention area, provide two (2)
vehicle accesses along what is referred to as ‘Road C’, and restrict the vehicle access
off of South Kamehameha Avenue to maintenance and emergency vehicles only.
The all-way stop-controlled Kamehameha Avenue/Maui Lani Parkway study
intersection currently operates at LOS F with eastbound and westbound approaches
experiencing average vehicle delays of one to two minutes during the PM peak hour.
Intersection operations during the Saturday peak hour of traffic were observed to
operate satisfactorily, with LOS C or better on all approaches. Based on existing traffic
count data, a traffic signal at the study intersection is currently warranted.
Base Year 2015 and 2022 PM and Saturday peak hour traffic conditions were
forecast using defacto growth rates for each movement based on the Maui Regional
Long-Range Land Transportation Plan (MRTP) and other known developments. The
study intersection is forecast to operate at LOS B for PM and Saturday peak hour
conditions in 2015 and LOS C in 2022 with the proposed mitigation. The
Road C/Road B intersection that will be constructed as part of the Waiale Development
is forecast to operate at LOS B or better for all movements during the PM and Saturday
peak hours except the northbound left-turn, which is forecast to operate at LOS F.
Based upon forecast traffic volumes, a traffic signal may be warranted by 2022.
Future Year 2015, full construction of Project’s uses – Phase 1 traffic conditions
were forecast by combining Project generated traffic with Base Year 2015 traffic. The
study intersection is forecast to continue operating at LOS B during the PM and
Saturday peak hours, with all movements operating at LOS C.
Future Year 2022, increase of Project’s drainage retention area, no increase in
Project traffic – Phase 2 traffic conditions were forecast by combining Project generated
traffic with Base Year 2022 traffic. The study intersection is forecast to operate at
LOS C during PM and Saturday peak hours with the proposed mitigation. The
28
Road C/Road B/South Access intersection is forecast to operate at LOS C or better for
all movements during the PM and Saturday peak hours except for the northbound left-
turn, which is forecast to operate at over capacity with LOS F, and the southbound left-
turn, which is forecast to operate at LOS E during the PM peak hour and LOS F during
the Saturday peak hour. The SW Access is forecast to operate at LOS D or better for all
movements during the PM and Saturday peak hours of traffic. Note that without the
Waiale Development, the Project access would remain along Kamehameha Avenue
similar to Phase 1.
VI. RECOMMENDATIONS
Base Year 2015 conditions without the Project:
Kamehameha Avenue/Maui Lani Parkway:
Provide exclusive left-turn and right-turn lanes along Maui Lani Parkway.
Install a traffic signal at the Kamehameha Avenue/Maui Lani Parkway
intersection.
Base Year 2022 conditions without the Project:
Kamehameha Avenue/Maui Lani Parkway:
Construct exclusive northbound and southbound right-turn lanes at the
Kamehameha Avenue/Maui Lani Parkway intersection.
Monitor the Road C/Road B intersection after construction. Consider installing a
traffic control signal at the Road C/Road B intersection when and if appropriate
warrants are met.
Future Year 2022 conditions with the Project:
Road C/Road B/South Access – stop controlled on the northbound and southbound
approaches:
All approaches: provide a left-turn lane and a shared through/right-turn lane.
Monitor the Road C/Road B intersection after construction. Consider installing a
traffic control signal at the Road C/Road B intersection when and if appropriate
warrants are met.
29
Road C/SW Access – stop controlled on the southbound approach:
Eastbound approach: provide a left-turn lane and a through lane.
Westbound approach: provide a shared through/right-turn lane.
Southbound approach: provide a shared left-turn/right-turn lane.
30
VII. REFERENCES
1. Transportation Research Board, Highway Capacity Manual, 2000.
2. Federal Highway Administration, Manual on Uniform Traffic Control Devices,
2009.
3. Austin, Tsutsumi, & Associates, Waiale Development TIAR, 2011.
4. Institute of Transportation Engineers, Trip Generation, 9th Edition, 2012.
5. American Association of State Highway and Transportation Officials, A Policy on
Geometric Design of Highways and Streets, 2011.
Z:\2013\13-025\Maui Regional Park\TIAR\101113\CMRP Report 101113.doc

A P P E N D I C E S
APPENDIX A
TRAFFIC COUNT DATA
Austin Tsutsumi & Asscociates501 Sumner St. Ste. 521
Honolulu, HI 96817
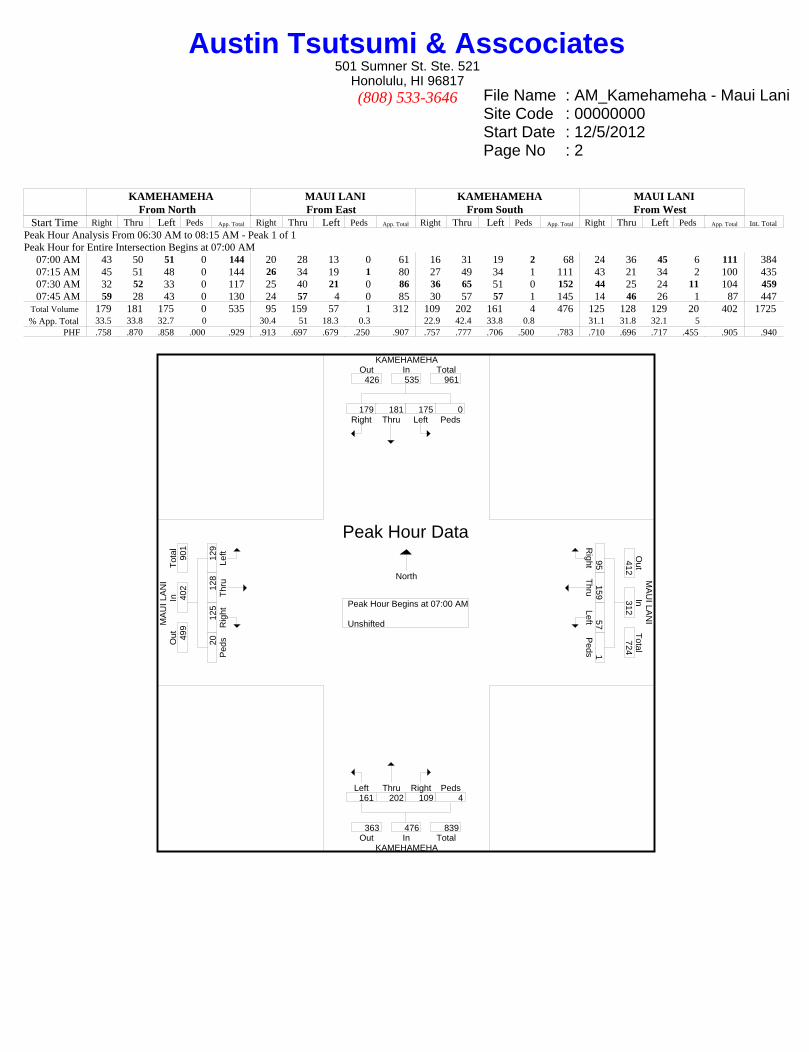
(808) 533-3646 File Name : AM_Kamehameha - Maui LaniSite Code : 00000000Start Date : 12/5/2012Page No : 1
Groups Printed- UnshiftedKAMEHAMEHA
From NorthMAUI LANIFrom East
KAMEHAMEHAFrom South
MAUI LANIFrom West
Start Time Right Thru Left Peds App. Total Right Thru Left Peds App. Total Right Thru Left Peds App. Total Right Thru Left Peds App. Total Int. Total
06:30 AM 30 8 52 0 90 22 33 9 0 64 3 13 7 0 23 2 40 25 1 68 24506:45 AM 31 16 52 0 99 30 41 13 0 84 4 7 6 3 20 8 44 38 1 91 294
Total 61 24 104 0 189 52 74 22 0 148 7 20 13 3 43 10 84 63 2 159 539
07:00 AM 43 50 51 0 144 20 28 13 0 61 16 31 19 2 68 24 36 45 6 111 38407:15 AM 45 51 48 0 144 26 34 19 1 80 27 49 34 1 111 43 21 34 2 100 43507:30 AM 32 52 33 0 117 25 40 21 0 86 36 65 51 0 152 44 25 24 11 104 45907:45 AM 59 28 43 0 130 24 57 4 0 85 30 57 57 1 145 14 46 26 1 87 447
Total 179 181 175 0 535 95 159 57 1 312 109 202 161 4 476 125 128 129 20 402 1725
08:00 AM 23 10 38 0 71 22 38 3 0 63 6 22 8 1 37 7 50 26 0 83 25408:15 AM 22 9 39 0 70 18 34 1 0 53 3 6 8 0 17 3 56 49 1 109 249
Grand Total 285 224 356 0 865 187 305 83 1 576 125 250 190 8 573 145 318 267 23 753 2767Apprch % 32.9 25.9 41.2 0 32.5 53 14.4 0.2 21.8 43.6 33.2 1.4 19.3 42.2 35.5 3.1
Total % 10.3 8.1 12.9 0 31.3 6.8 11 3 0 20.8 4.5 9 6.9 0.3 20.7 5.2 11.5 9.6 0.8 27.2
Austin Tsutsumi & Asscociates501 Sumner St. Ste. 521
Honolulu, HI 96817
(808) 533-3646 File Name : AM_Kamehameha - Maui LaniSite Code : 00000000Start Date : 12/5/2012Page No : 2
KAMEHAMEHAFrom North
MAUI LANIFrom East
KAMEHAMEHAFrom South
MAUI LANIFrom West
Start Time Right Thru Left Peds App. Total Right Thru Left Peds App. Total Right Thru Left Peds App. Total Right Thru Left Peds App. Total Int. Total
Peak Hour Analysis From 06:30 AM to 08:15 AM - Peak 1 of 1Peak Hour for Entire Intersection Begins at 07:00 AM
07:00 AM 43 50 51 0 144 20 28 13 0 61 16 31 19 2 68 24 36 45 6 111 38407:15 AM 45 51 48 0 144 26 34 19 1 80 27 49 34 1 111 43 21 34 2 100 43507:30 AM 32 52 33 0 117 25 40 21 0 86 36 65 51 0 152 44 25 24 11 104 45907:45 AM 59 28 43 0 130 24 57 4 0 85 30 57 57 1 145 14 46 26 1 87 447
Total Volume 179 181 175 0 535 95 159 57 1 312 109 202 161 4 476 125 128 129 20 402 1725% App. Total 33.5 33.8 32.7 0 30.4 51 18.3 0.3 22.9 42.4 33.8 0.8 31.1 31.8 32.1 5
PHF .758 .870 .858 .000 .929 .913 .697 .679 .250 .907 .757 .777 .706 .500 .783 .710 .696 .717 .455 .905 .940
KAMEHAMEHA
MA
UI LA
NI
MA
UI L
AN
I
KAMEHAMEHA
Right179
Thru181
Left175
Peds0
InOut Total426 535 961
Rig
ht
95
Thru
159
Left5
7
Peds1
Out
Tota
lIn
412
312
724
Left161
Thru202
Right109
Peds4
Out TotalIn363 476 839
Left
129
Thru128
Rig
ht
125
Peds20
Tota
lO
ut
In499
402
901
Peak Hour Begins at 07:00 AM Unshifted
Peak Hour Data
North
Your Company Name HereThis is your address
Your City, State, Zip Code
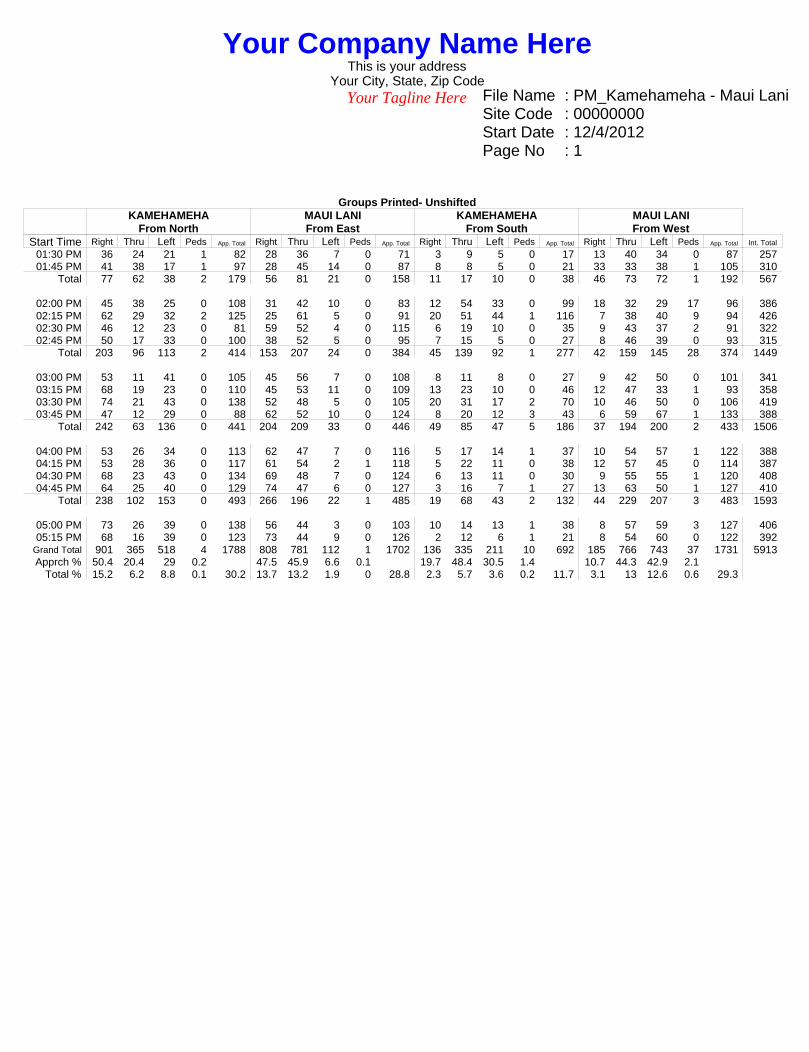
Your Tagline Here File Name : PM_Kamehameha - Maui LaniSite Code : 00000000Start Date : 12/4/2012Page No : 1
Groups Printed- UnshiftedKAMEHAMEHA
From NorthMAUI LANIFrom East
KAMEHAMEHAFrom South
MAUI LANIFrom West
Start Time Right Thru Left Peds App. Total Right Thru Left Peds App. Total Right Thru Left Peds App. Total Right Thru Left Peds App. Total Int. Total
01:30 PM 36 24 21 1 82 28 36 7 0 71 3 9 5 0 17 13 40 34 0 87 25701:45 PM 41 38 17 1 97 28 45 14 0 87 8 8 5 0 21 33 33 38 1 105 310
Total 77 62 38 2 179 56 81 21 0 158 11 17 10 0 38 46 73 72 1 192 567
02:00 PM 45 38 25 0 108 31 42 10 0 83 12 54 33 0 99 18 32 29 17 96 38602:15 PM 62 29 32 2 125 25 61 5 0 91 20 51 44 1 116 7 38 40 9 94 42602:30 PM 46 12 23 0 81 59 52 4 0 115 6 19 10 0 35 9 43 37 2 91 32202:45 PM 50 17 33 0 100 38 52 5 0 95 7 15 5 0 27 8 46 39 0 93 315
Total 203 96 113 2 414 153 207 24 0 384 45 139 92 1 277 42 159 145 28 374 1449
03:00 PM 53 11 41 0 105 45 56 7 0 108 8 11 8 0 27 9 42 50 0 101 34103:15 PM 68 19 23 0 110 45 53 11 0 109 13 23 10 0 46 12 47 33 1 93 35803:30 PM 74 21 43 0 138 52 48 5 0 105 20 31 17 2 70 10 46 50 0 106 41903:45 PM 47 12 29 0 88 62 52 10 0 124 8 20 12 3 43 6 59 67 1 133 388
Total 242 63 136 0 441 204 209 33 0 446 49 85 47 5 186 37 194 200 2 433 1506
04:00 PM 53 26 34 0 113 62 47 7 0 116 5 17 14 1 37 10 54 57 1 122 38804:15 PM 53 28 36 0 117 61 54 2 1 118 5 22 11 0 38 12 57 45 0 114 38704:30 PM 68 23 43 0 134 69 48 7 0 124 6 13 11 0 30 9 55 55 1 120 40804:45 PM 64 25 40 0 129 74 47 6 0 127 3 16 7 1 27 13 63 50 1 127 410
Total 238 102 153 0 493 266 196 22 1 485 19 68 43 2 132 44 229 207 3 483 1593
05:00 PM 73 26 39 0 138 56 44 3 0 103 10 14 13 1 38 8 57 59 3 127 40605:15 PM 68 16 39 0 123 73 44 9 0 126 2 12 6 1 21 8 54 60 0 122 392
Grand Total 901 365 518 4 1788 808 781 112 1 1702 136 335 211 10 692 185 766 743 37 1731 5913Apprch % 50.4 20.4 29 0.2 47.5 45.9 6.6 0.1 19.7 48.4 30.5 1.4 10.7 44.3 42.9 2.1
Total % 15.2 6.2 8.8 0.1 30.2 13.7 13.2 1.9 0 28.8 2.3 5.7 3.6 0.2 11.7 3.1 13 12.6 0.6 29.3
Your Company Name HereThis is your address
Your City, State, Zip Code
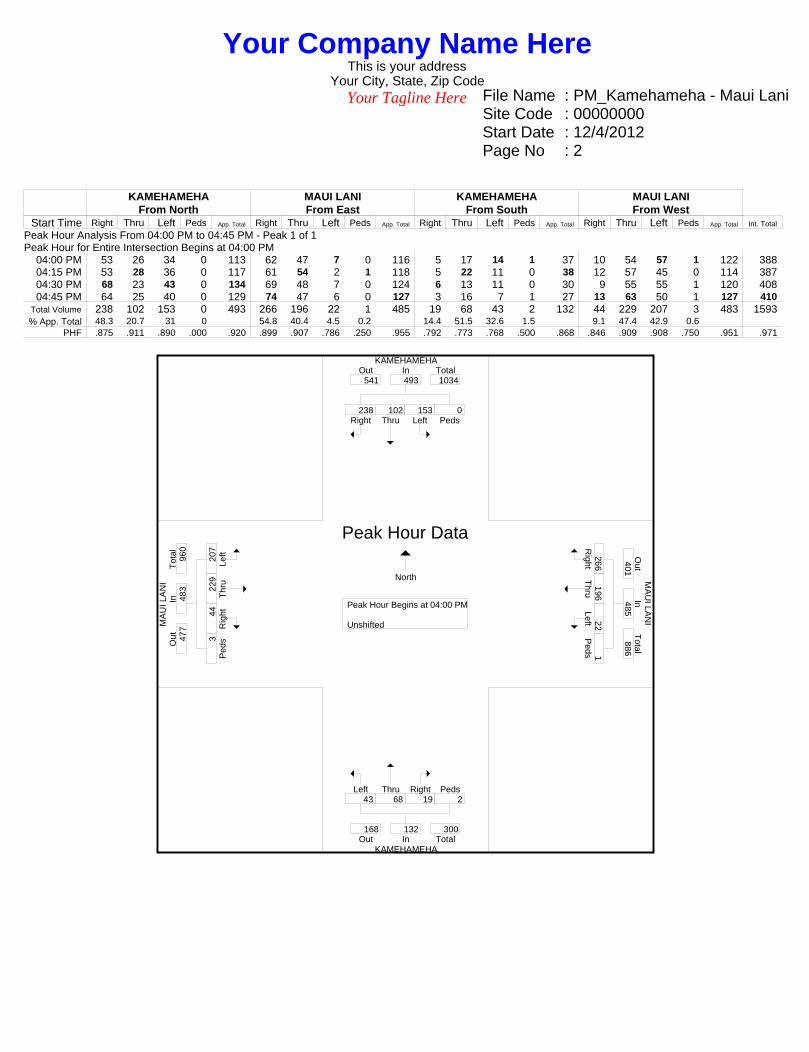
Your Tagline Here File Name : PM_Kamehameha - Maui LaniSite Code : 00000000Start Date : 12/4/2012Page No : 2
KAMEHAMEHAFrom North
MAUI LANIFrom East
KAMEHAMEHAFrom South
MAUI LANIFrom West
Start Time Right Thru Left Peds App. Total Right Thru Left Peds App. Total Right Thru Left Peds App. Total Right Thru Left Peds App. Total Int. Total
Peak Hour Analysis From 04:00 PM to 04:45 PM - Peak 1 of 1Peak Hour for Entire Intersection Begins at 04:00 PM
04:00 PM 53 26 34 0 113 62 47 7 0 116 5 17 14 1 37 10 54 57 1 122 38804:15 PM 53 28 36 0 117 61 54 2 1 118 5 22 11 0 38 12 57 45 0 114 38704:30 PM 68 23 43 0 134 69 48 7 0 124 6 13 11 0 30 9 55 55 1 120 40804:45 PM 64 25 40 0 129 74 47 6 0 127 3 16 7 1 27 13 63 50 1 127 410
Total Volume 238 102 153 0 493 266 196 22 1 485 19 68 43 2 132 44 229 207 3 483 1593% App. Total 48.3 20.7 31 0 54.8 40.4 4.5 0.2 14.4 51.5 32.6 1.5 9.1 47.4 42.9 0.6
PHF .875 .911 .890 .000 .920 .899 .907 .786 .250 .955 .792 .773 .768 .500 .868 .846 .909 .908 .750 .951 .971
KAMEHAMEHA
MA
UI
LA
NI
MA
UI L
AN
I
KAMEHAMEHA
Right238
Thru102
Left153
Peds0
InOut Total541 493 1034
Rig
ht
26
6
Th
ru1
96
L
eft 22
P
ed
s 1
Ou
tT
ota
lIn
40
1
48
5
88
6
Left43
Thru68
Right19
Peds2
Out TotalIn168 132 300
Le
ft2
07
T
hru22
9
Rig
ht
44
P
ed
s3
To
tal
Ou
tIn
47
7
48
3
96
0
Peak Hour Begins at 04:00 PM Unshifted
Peak Hour Data
North
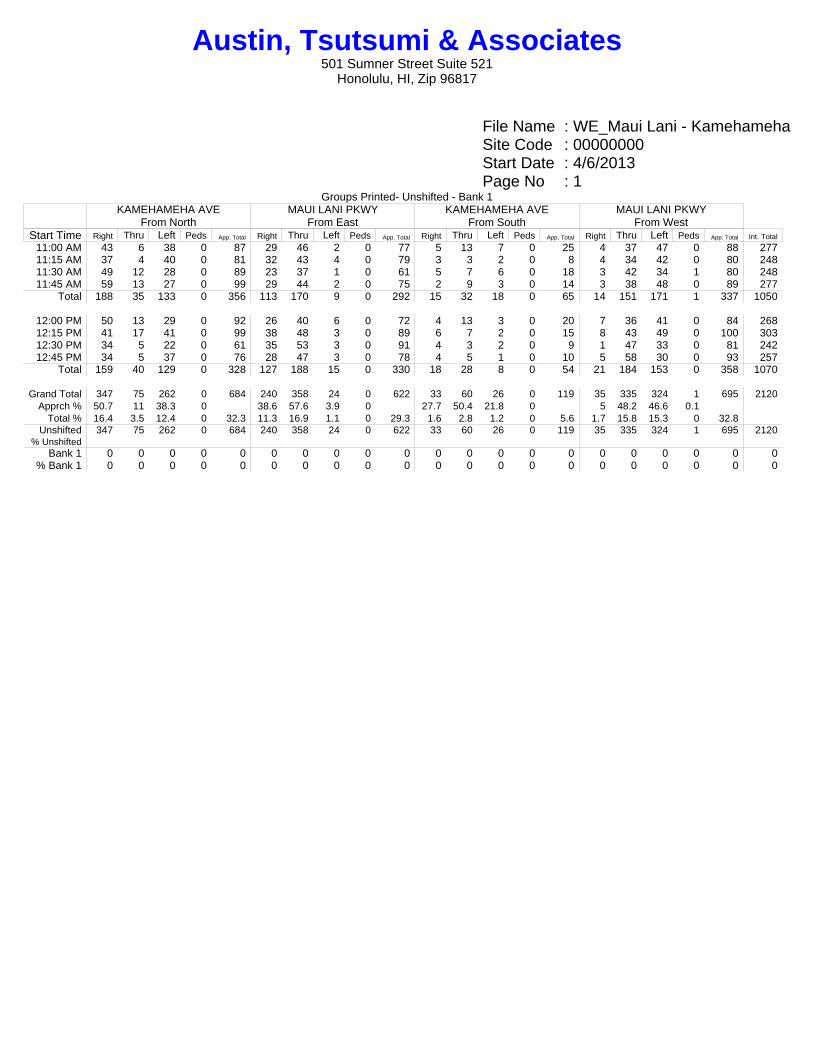
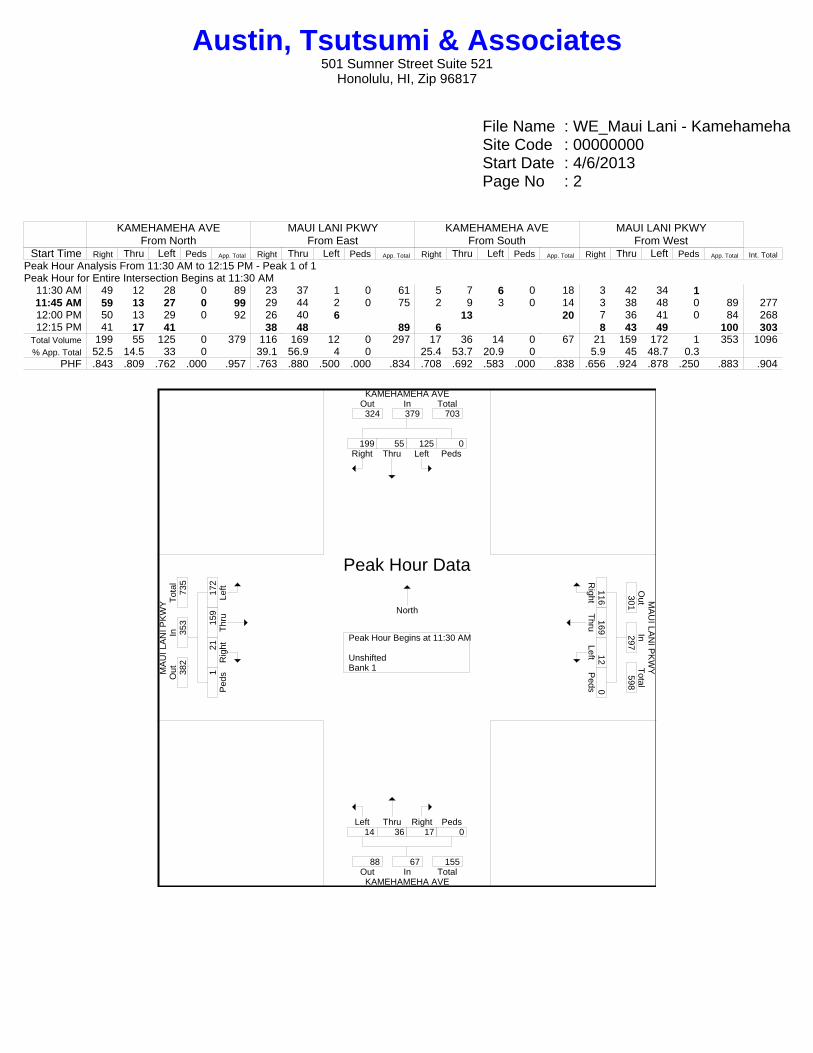
File Name : WE_Maui Lani - KamehamehaSite Code : 00000000Start Date : 4/6/2013Page No : 1
Groups Printed- Unshifted - Bank 1KAMEHAMEHA AVE
From NorthMAUI LANI PKWY
From EastKAMEHAMEHA AVE
From SouthMAUI LANI PKWY
From WestStart Time Right Thru Left Peds App. Total Right Thru Left Peds App. Total Right Thru Left Peds App. Total Right Thru Left Peds App. Total Int. Total
11:00 AM 43 6 38 0 87 29 46 2 0 77 5 13 7 0 25 4 37 47 0 88 27711:15 AM 37 4 40 0 81 32 43 4 0 79 3 3 2 0 8 4 34 42 0 80 24811:30 AM 49 12 28 0 89 23 37 1 0 61 5 7 6 0 18 3 42 34 1 80 24811:45 AM 59 13 27 0 99 29 44 2 0 75 2 9 3 0 14 3 38 48 0 89 277
Total 188 35 133 0 356 113 170 9 0 292 15 32 18 0 65 14 151 171 1 337 1050
12:00 PM 50 13 29 0 92 26 40 6 0 72 4 13 3 0 20 7 36 41 0 84 26812:15 PM 41 17 41 0 99 38 48 3 0 89 6 7 2 0 15 8 43 49 0 100 30312:30 PM 34 5 22 0 61 35 53 3 0 91 4 3 2 0 9 1 47 33 0 81 24212:45 PM 34 5 37 0 76 28 47 3 0 78 4 5 1 0 10 5 58 30 0 93 257
Total 159 40 129 0 328 127 188 15 0 330 18 28 8 0 54 21 184 153 0 358 1070
Grand Total 347 75 262 0 684 240 358 24 0 622 33 60 26 0 119 35 335 324 1 695 2120Apprch % 50.7 11 38.3 0 38.6 57.6 3.9 0 27.7 50.4 21.8 0 5 48.2 46.6 0.1
Total % 16.4 3.5 12.4 0 32.3 11.3 16.9 1.1 0 29.3 1.6 2.8 1.2 0 5.6 1.7 15.8 15.3 0 32.8Unshifted 347 75 262 0 684 240 358 24 0 622 33 60 26 0 119 35 335 324 1 695 2120
% UnshiftedBank 1 0 0 0 0 0 0 0 0 0 0 0 0 0 0 0 0 0 0 0 0 0
% Bank 1 0 0 0 0 0 0 0 0 0 0 0 0 0 0 0 0 0 0 0 0 0
Austin, Tsutsumi & Associates501 Sumner Street Suite 521
Honolulu, HI, Zip 96817
File Name : WE_Maui Lani - KamehamehaSite Code : 00000000Start Date : 4/6/2013Page No : 2
KAMEHAMEHA AVEFrom North
MAUI LANI PKWYFrom East
KAMEHAMEHA AVEFrom South
MAUI LANI PKWYFrom West
Start Time Right Thru Left Peds App. Total Right Thru Left Peds App. Total Right Thru Left Peds App. Total Right Thru Left Peds App. Total Int. Total
Peak Hour Analysis From 11:30 AM to 12:15 PM - Peak 1 of 1Peak Hour for Entire Intersection Begins at 11:30 AM
11:30 AM 49 12 28 0 89 23 37 1 0 61 5 7 6 0 18 3 42 34 111:45 AM 59 13 27 0 99 29 44 2 0 75 2 9 3 0 14 3 38 48 0 89 27712:00 PM 50 13 29 0 92 26 40 6 13 20 7 36 41 0 84 26812:15 PM 41 17 41 38 48 89 6 8 43 49 100 303
Total Volume 199 55 125 0 379 116 169 12 0 297 17 36 14 0 67 21 159 172 1 353 1096% App. Total 52.5 14.5 33 0 39.1 56.9 4 0 25.4 53.7 20.9 0 5.9 45 48.7 0.3
PHF .843 .809 .762 .000 .957 .763 .880 .500 .000 .834 .708 .692 .583 .000 .838 .656 .924 .878 .250 .883 .904
KAMEHAMEHA AVE
MA
UI
LAN
I PK
WY
MA
UI LA
NI P
KW
Y
KAMEHAMEHA AVE
Right199
Thru55
Left125
Peds0
InOut Total324 379 703
Right116
T
hru169
Left 12
Peds 0
Out
Total
In301
297 598
Left14
Thru36
Right17
Peds0
Out TotalIn88 67 155
Left
172
T
hru
159
Rig
ht21
Ped
s1
Tot
alO
utIn
382
353
735
Peak Hour Begins at 11:30 AM UnshiftedBank 1
Peak Hour Data
North
Austin, Tsutsumi & Associates501 Sumner Street Suite 521
Honolulu, HI, Zip 96817
APPENDIX B
LEVEL OF SERVICE CRITERIA
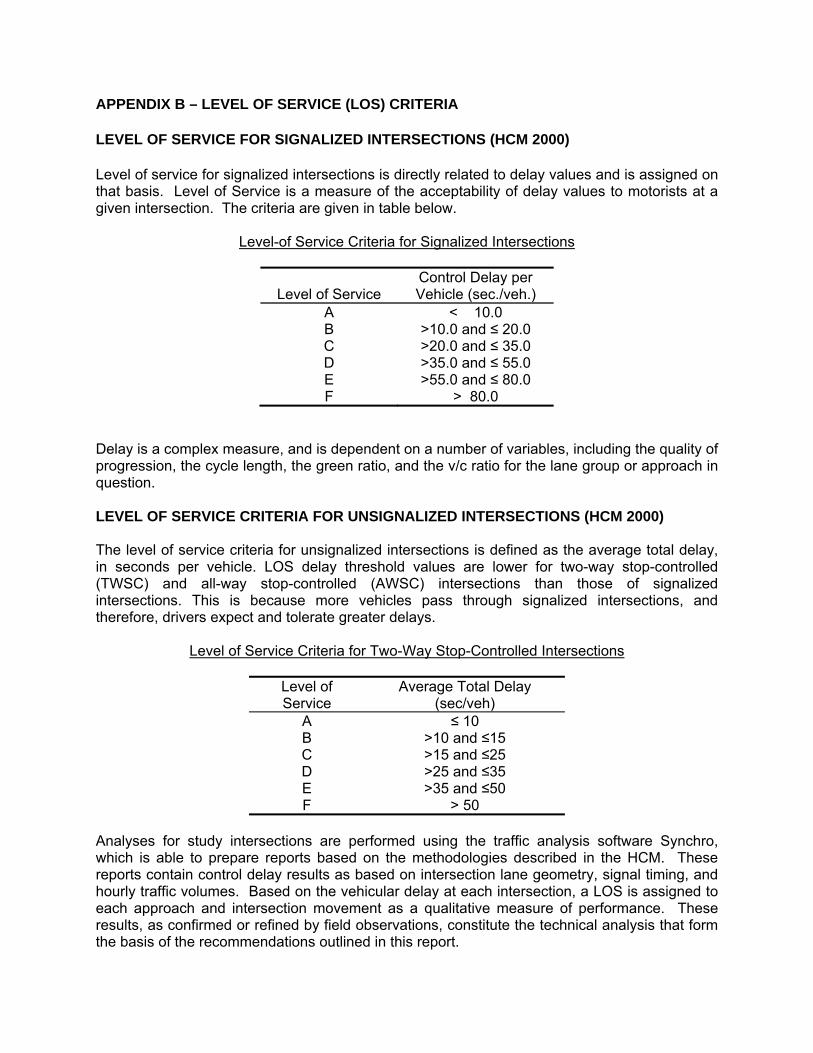
APPENDIX B – LEVEL OF SERVICE (LOS) CRITERIA LEVEL OF SERVICE FOR SIGNALIZED INTERSECTIONS (HCM 2000) Level of service for signalized intersections is directly related to delay values and is assigned on that basis. Level of Service is a measure of the acceptability of delay values to motorists at a given intersection. The criteria are given in table below.
Level-of Service Criteria for Signalized Intersections
Control Delay per Level of Service Vehicle (sec./veh.)
A < 10.0 B >10.0 and ≤ 20.0 C >20.0 and ≤ 35.0 D >35.0 and ≤ 55.0 E >55.0 and ≤ 80.0 F > 80.0
Delay is a complex measure, and is dependent on a number of variables, including the quality of progression, the cycle length, the green ratio, and the v/c ratio for the lane group or approach in question. LEVEL OF SERVICE CRITERIA FOR UNSIGNALIZED INTERSECTIONS (HCM 2000) The level of service criteria for unsignalized intersections is defined as the average total delay, in seconds per vehicle. LOS delay threshold values are lower for two-way stop-controlled (TWSC) and all-way stop-controlled (AWSC) intersections than those of signalized intersections. This is because more vehicles pass through signalized intersections, and therefore, drivers expect and tolerate greater delays.
Level of Service Criteria for Two-Way Stop-Controlled Intersections
Level of Service
Average Total Delay (sec/veh)
A ≤ 10 B >10 and ≤15 C >15 and ≤25 D >25 and ≤35 E >35 and ≤50 F > 50
Analyses for study intersections are performed using the traffic analysis software Synchro, which is able to prepare reports based on the methodologies described in the HCM. These reports contain control delay results as based on intersection lane geometry, signal timing, and hourly traffic volumes. Based on the vehicular delay at each intersection, a LOS is assigned to each approach and intersection movement as a qualitative measure of performance. These results, as confirmed or refined by field observations, constitute the technical analysis that form the basis of the recommendations outlined in this report.
APPENDIX C
LEVEL OF SERVICE CALCULATIONS

APPENDIX C
LEVEL OF SERVICE CALCULATIONS
• Existing PM Peak
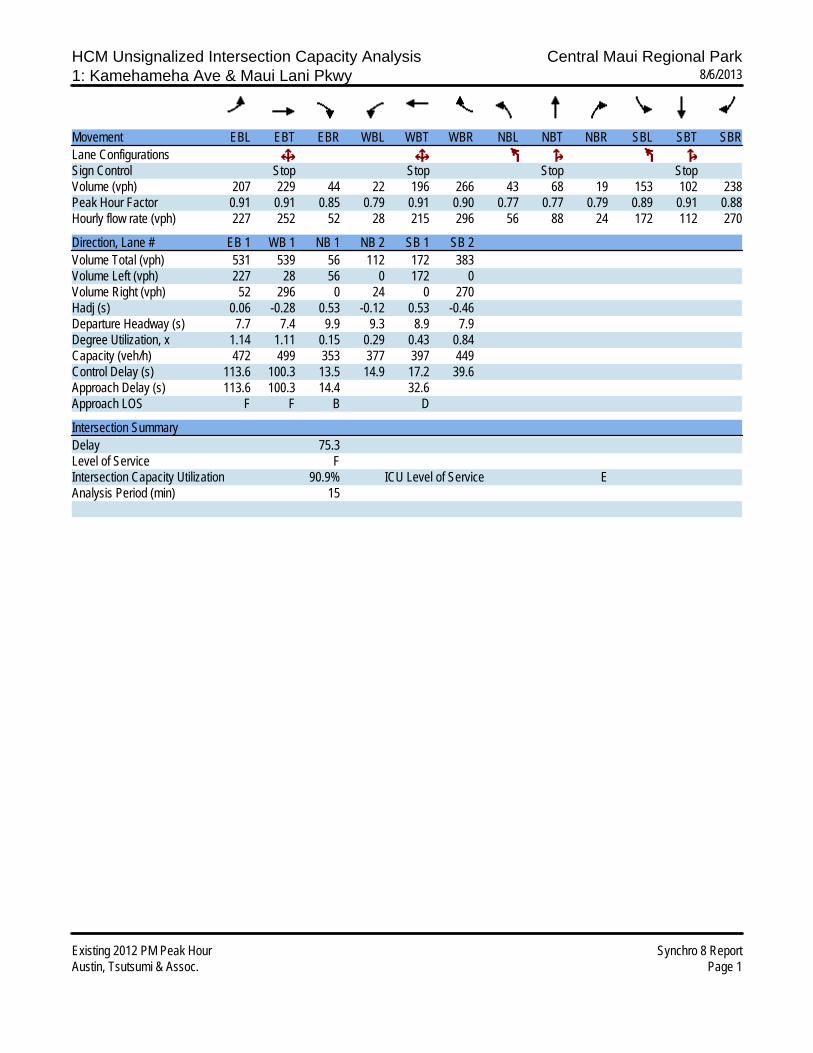
HCM Unsignalized Intersection Capacity Analysis Central Maui Regional Park1: Kamehameha Ave & Maui Lani Pkwy 8/6/2013
Existing 2012 PM Peak Hour Synchro 8 ReportAustin, Tsutsumi & Assoc. Page 1
Movement EBL EBT EBR WBL WBT WBR NBL NBT NBR SBL SBT SBRLane ConfigurationsSign Control Stop Stop Stop StopVolume (vph) 207 229 44 22 196 266 43 68 19 153 102 238Peak Hour Factor 0.91 0.91 0.85 0.79 0.91 0.90 0.77 0.77 0.79 0.89 0.91 0.88Hourly flow rate (vph) 227 252 52 28 215 296 56 88 24 172 112 270
Direction, Lane # EB 1 WB 1 NB 1 NB 2 SB 1 SB 2Volume Total (vph) 531 539 56 112 172 383Volume Left (vph) 227 28 56 0 172 0Volume Right (vph) 52 296 0 24 0 270Hadj (s) 0.06 -0.28 0.53 -0.12 0.53 -0.46Departure Headway (s) 7.7 7.4 9.9 9.3 8.9 7.9Degree Utilization, x 1.14 1.11 0.15 0.29 0.43 0.84Capacity (veh/h) 472 499 353 377 397 449Control Delay (s) 113.6 100.3 13.5 14.9 17.2 39.6Approach Delay (s) 113.6 100.3 14.4 32.6Approach LOS F F B D
Intersection SummaryDelay 75.3Level of Service FIntersection Capacity Utilization 90.9% ICU Level of Service EAnalysis Period (min) 15

APPENDIX C
LEVEL OF SERVICE CALCULATIONS
• Existing Saturday Peak
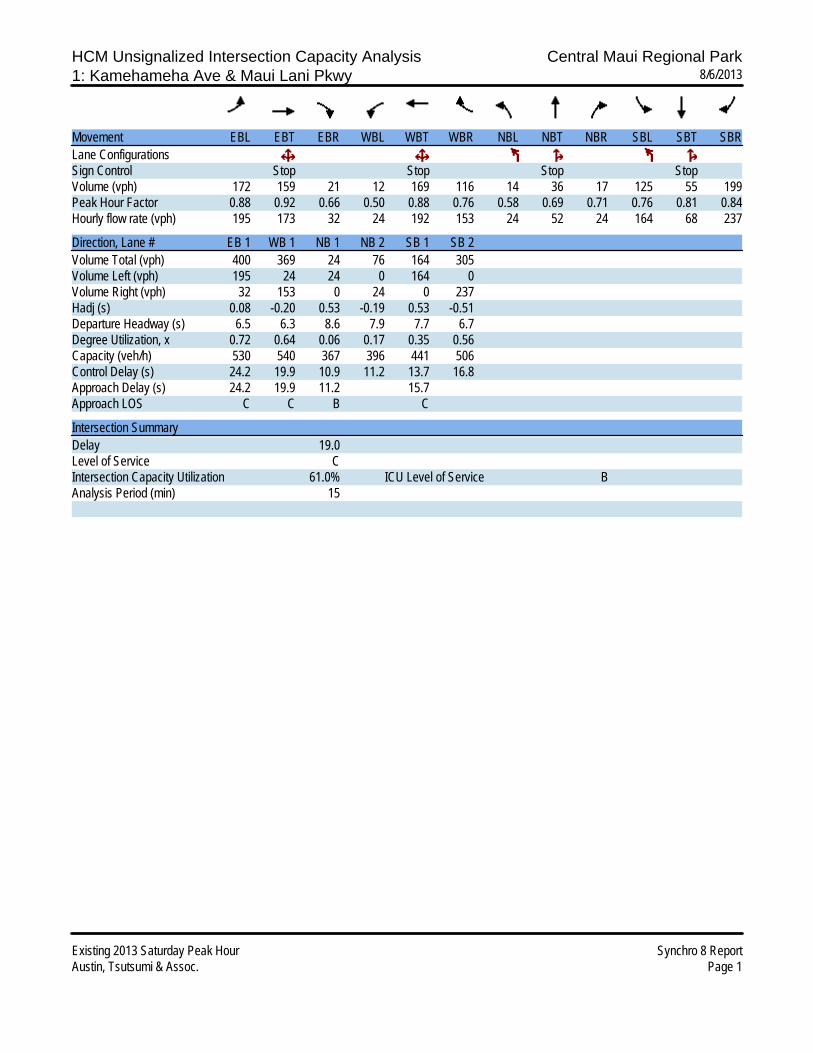
HCM Unsignalized Intersection Capacity Analysis Central Maui Regional Park1: Kamehameha Ave & Maui Lani Pkwy 8/6/2013
Existing 2013 Saturday Peak Hour Synchro 8 ReportAustin, Tsutsumi & Assoc. Page 1
Movement EBL EBT EBR WBL WBT WBR NBL NBT NBR SBL SBT SBRLane ConfigurationsSign Control Stop Stop Stop StopVolume (vph) 172 159 21 12 169 116 14 36 17 125 55 199Peak Hour Factor 0.88 0.92 0.66 0.50 0.88 0.76 0.58 0.69 0.71 0.76 0.81 0.84Hourly flow rate (vph) 195 173 32 24 192 153 24 52 24 164 68 237
Direction, Lane # EB 1 WB 1 NB 1 NB 2 SB 1 SB 2Volume Total (vph) 400 369 24 76 164 305Volume Left (vph) 195 24 24 0 164 0Volume Right (vph) 32 153 0 24 0 237Hadj (s) 0.08 -0.20 0.53 -0.19 0.53 -0.51Departure Headway (s) 6.5 6.3 8.6 7.9 7.7 6.7Degree Utilization, x 0.72 0.64 0.06 0.17 0.35 0.56Capacity (veh/h) 530 540 367 396 441 506Control Delay (s) 24.2 19.9 10.9 11.2 13.7 16.8Approach Delay (s) 24.2 19.9 11.2 15.7Approach LOS C C B C
Intersection SummaryDelay 19.0Level of Service CIntersection Capacity Utilization 61.0% ICU Level of Service BAnalysis Period (min) 15

APPENDIX C
LEVEL OF SERVICE CALCULATIONS
• Base Year 2015 PM Peak
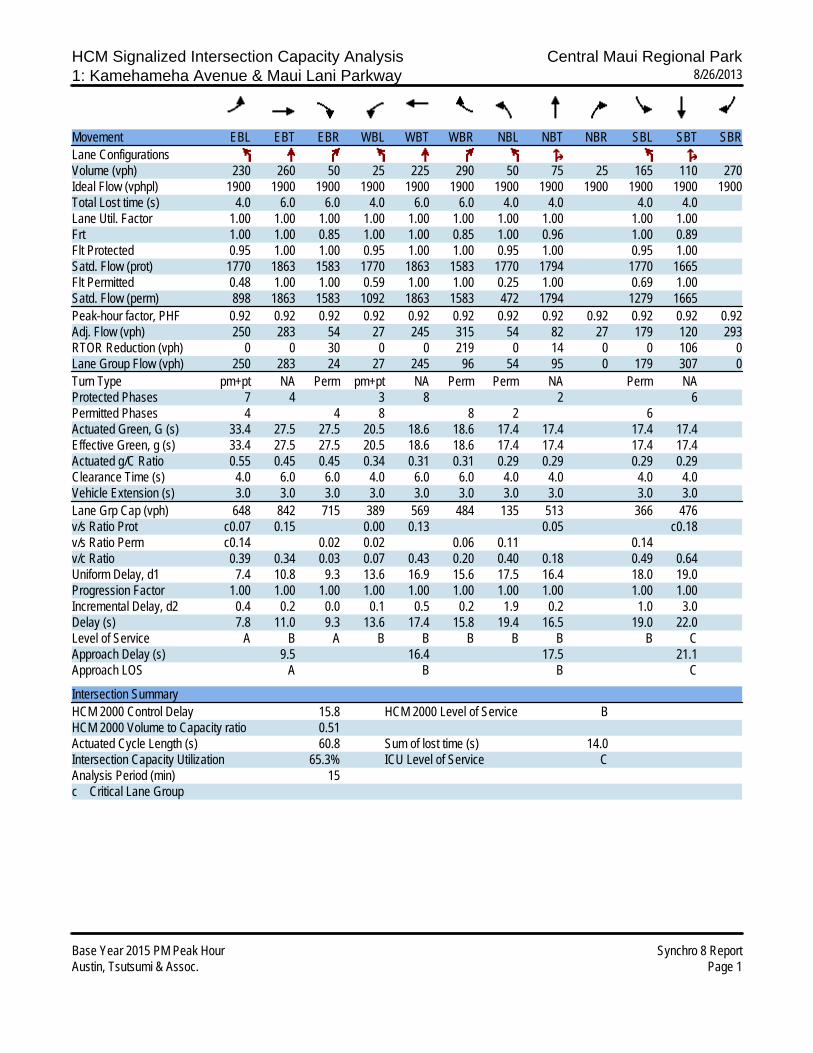
HCM Signalized Intersection Capacity Analysis Central Maui Regional Park1: Kamehameha Avenue & Maui Lani Parkway 8/26/2013
Base Year 2015 PM Peak Hour Synchro 8 ReportAustin, Tsutsumi & Assoc. Page 1
Movement EBL EBT EBR WBL WBT WBR NBL NBT NBR SBL SBT SBRLane ConfigurationsVolume (vph) 230 260 50 25 225 290 50 75 25 165 110 270Ideal Flow (vphpl) 1900 1900 1900 1900 1900 1900 1900 1900 1900 1900 1900 1900Total Lost time (s) 4.0 6.0 6.0 4.0 6.0 6.0 4.0 4.0 4.0 4.0Lane Util. Factor 1.00 1.00 1.00 1.00 1.00 1.00 1.00 1.00 1.00 1.00Frt 1.00 1.00 0.85 1.00 1.00 0.85 1.00 0.96 1.00 0.89Flt Protected 0.95 1.00 1.00 0.95 1.00 1.00 0.95 1.00 0.95 1.00Satd. Flow (prot) 1770 1863 1583 1770 1863 1583 1770 1794 1770 1665Flt Permitted 0.48 1.00 1.00 0.59 1.00 1.00 0.25 1.00 0.69 1.00Satd. Flow (perm) 898 1863 1583 1092 1863 1583 472 1794 1279 1665Peak-hour factor, PHF 0.92 0.92 0.92 0.92 0.92 0.92 0.92 0.92 0.92 0.92 0.92 0.92Adj. Flow (vph) 250 283 54 27 245 315 54 82 27 179 120 293RTOR Reduction (vph) 0 0 30 0 0 219 0 14 0 0 106 0Lane Group Flow (vph) 250 283 24 27 245 96 54 95 0 179 307 0Turn Type pm+pt NA Perm pm+pt NA Perm Perm NA Perm NAProtected Phases 7 4 3 8 2 6Permitted Phases 4 4 8 8 2 6Actuated Green, G (s) 33.4 27.5 27.5 20.5 18.6 18.6 17.4 17.4 17.4 17.4Effective Green, g (s) 33.4 27.5 27.5 20.5 18.6 18.6 17.4 17.4 17.4 17.4Actuated g/C Ratio 0.55 0.45 0.45 0.34 0.31 0.31 0.29 0.29 0.29 0.29Clearance Time (s) 4.0 6.0 6.0 4.0 6.0 6.0 4.0 4.0 4.0 4.0Vehicle Extension (s) 3.0 3.0 3.0 3.0 3.0 3.0 3.0 3.0 3.0 3.0Lane Grp Cap (vph) 648 842 715 389 569 484 135 513 366 476v/s Ratio Prot c0.07 0.15 0.00 0.13 0.05 c0.18v/s Ratio Perm c0.14 0.02 0.02 0.06 0.11 0.14v/c Ratio 0.39 0.34 0.03 0.07 0.43 0.20 0.40 0.18 0.49 0.64Uniform Delay, d1 7.4 10.8 9.3 13.6 16.9 15.6 17.5 16.4 18.0 19.0Progression Factor 1.00 1.00 1.00 1.00 1.00 1.00 1.00 1.00 1.00 1.00Incremental Delay, d2 0.4 0.2 0.0 0.1 0.5 0.2 1.9 0.2 1.0 3.0Delay (s) 7.8 11.0 9.3 13.6 17.4 15.8 19.4 16.5 19.0 22.0Level of Service A B A B B B B B B CApproach Delay (s) 9.5 16.4 17.5 21.1Approach LOS A B B C
Intersection SummaryHCM 2000 Control Delay 15.8 HCM 2000 Level of Service BHCM 2000 Volume to Capacity ratio 0.51Actuated Cycle Length (s) 60.8 Sum of lost time (s) 14.0Intersection Capacity Utilization 65.3% ICU Level of Service CAnalysis Period (min) 15c Critical Lane Group
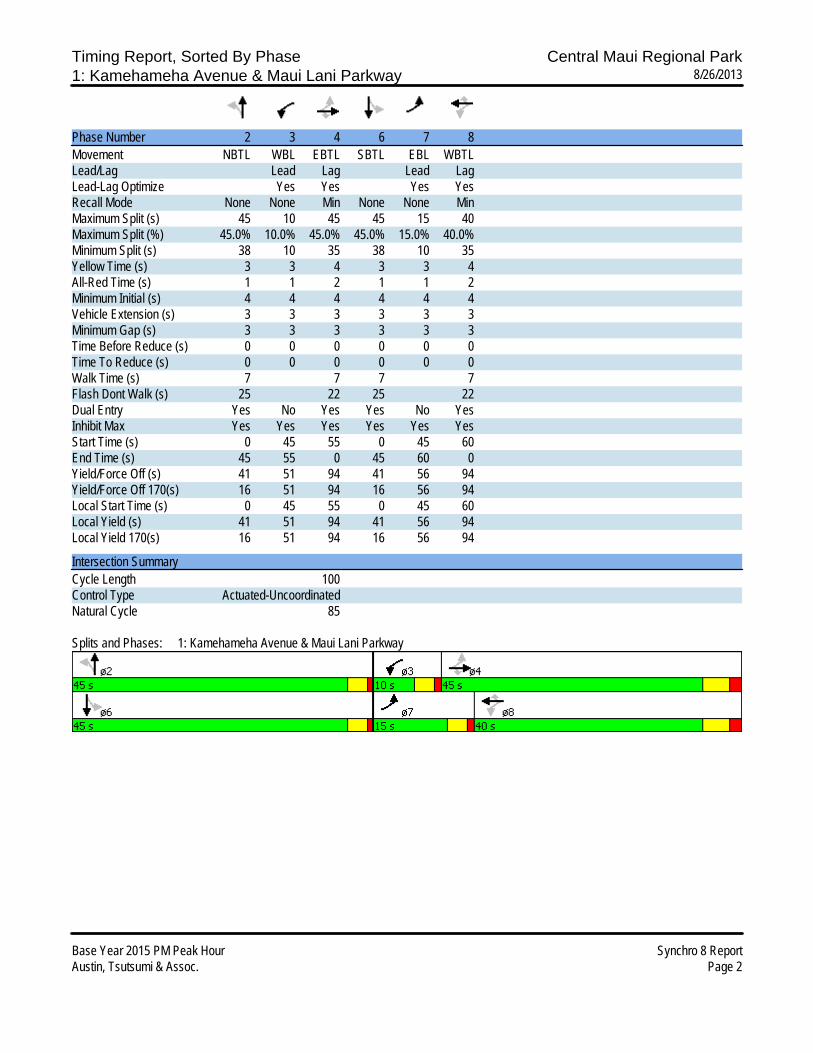
Timing Report, Sorted By Phase Central Maui Regional Park1: Kamehameha Avenue & Maui Lani Parkway 8/26/2013
Base Year 2015 PM Peak Hour Synchro 8 ReportAustin, Tsutsumi & Assoc. Page 2
Phase Number 2 3 4 6 7 8Movement NBTL WBL EBTL SBTL EBL WBTLLead/Lag Lead Lag Lead LagLead-Lag Optimize Yes Yes Yes YesRecall Mode None None Min None None MinMaximum Split (s) 45 10 45 45 15 40Maximum Split (%) 45.0% 10.0% 45.0% 45.0% 15.0% 40.0%Minimum Split (s) 38 10 35 38 10 35Yellow Time (s) 3 3 4 3 3 4All-Red Time (s) 1 1 2 1 1 2Minimum Initial (s) 4 4 4 4 4 4Vehicle Extension (s) 3 3 3 3 3 3Minimum Gap (s) 3 3 3 3 3 3Time Before Reduce (s) 0 0 0 0 0 0Time To Reduce (s) 0 0 0 0 0 0Walk Time (s) 7 7 7 7Flash Dont Walk (s) 25 22 25 22Dual Entry Yes No Yes Yes No YesInhibit Max Yes Yes Yes Yes Yes YesStart Time (s) 0 45 55 0 45 60End Time (s) 45 55 0 45 60 0Yield/Force Off (s) 41 51 94 41 56 94Yield/Force Off 170(s) 16 51 94 16 56 94Local Start Time (s) 0 45 55 0 45 60Local Yield (s) 41 51 94 41 56 94Local Yield 170(s) 16 51 94 16 56 94
Intersection SummaryCycle Length 100Control Type Actuated-UncoordinatedNatural Cycle 85
Splits and Phases: 1: Kamehameha Avenue & Maui Lani Parkway

APPENDIX C
LEVEL OF SERVICE CALCULATIONS
• Base Year 2015 Saturday Peak
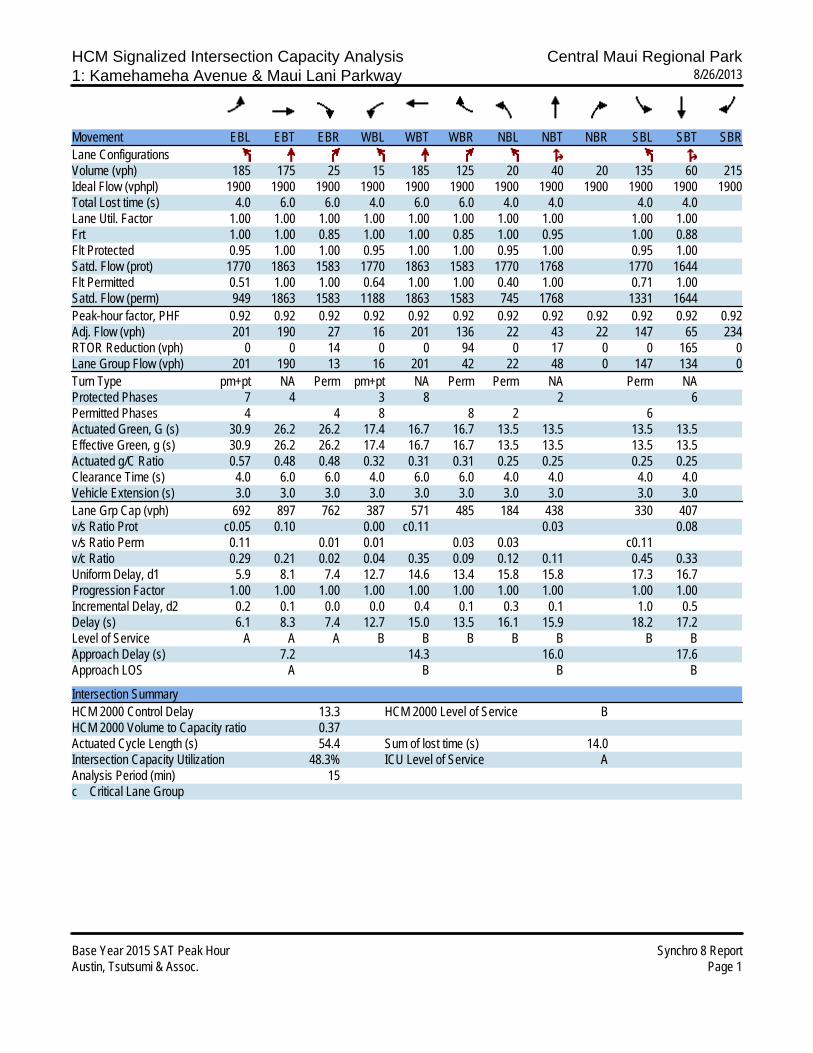
HCM Signalized Intersection Capacity Analysis Central Maui Regional Park1: Kamehameha Avenue & Maui Lani Parkway 8/26/2013
Base Year 2015 SAT Peak Hour Synchro 8 ReportAustin, Tsutsumi & Assoc. Page 1
Movement EBL EBT EBR WBL WBT WBR NBL NBT NBR SBL SBT SBRLane ConfigurationsVolume (vph) 185 175 25 15 185 125 20 40 20 135 60 215Ideal Flow (vphpl) 1900 1900 1900 1900 1900 1900 1900 1900 1900 1900 1900 1900Total Lost time (s) 4.0 6.0 6.0 4.0 6.0 6.0 4.0 4.0 4.0 4.0Lane Util. Factor 1.00 1.00 1.00 1.00 1.00 1.00 1.00 1.00 1.00 1.00Frt 1.00 1.00 0.85 1.00 1.00 0.85 1.00 0.95 1.00 0.88Flt Protected 0.95 1.00 1.00 0.95 1.00 1.00 0.95 1.00 0.95 1.00Satd. Flow (prot) 1770 1863 1583 1770 1863 1583 1770 1768 1770 1644Flt Permitted 0.51 1.00 1.00 0.64 1.00 1.00 0.40 1.00 0.71 1.00Satd. Flow (perm) 949 1863 1583 1188 1863 1583 745 1768 1331 1644Peak-hour factor, PHF 0.92 0.92 0.92 0.92 0.92 0.92 0.92 0.92 0.92 0.92 0.92 0.92Adj. Flow (vph) 201 190 27 16 201 136 22 43 22 147 65 234RTOR Reduction (vph) 0 0 14 0 0 94 0 17 0 0 165 0Lane Group Flow (vph) 201 190 13 16 201 42 22 48 0 147 134 0Turn Type pm+pt NA Perm pm+pt NA Perm Perm NA Perm NAProtected Phases 7 4 3 8 2 6Permitted Phases 4 4 8 8 2 6Actuated Green, G (s) 30.9 26.2 26.2 17.4 16.7 16.7 13.5 13.5 13.5 13.5Effective Green, g (s) 30.9 26.2 26.2 17.4 16.7 16.7 13.5 13.5 13.5 13.5Actuated g/C Ratio 0.57 0.48 0.48 0.32 0.31 0.31 0.25 0.25 0.25 0.25Clearance Time (s) 4.0 6.0 6.0 4.0 6.0 6.0 4.0 4.0 4.0 4.0Vehicle Extension (s) 3.0 3.0 3.0 3.0 3.0 3.0 3.0 3.0 3.0 3.0Lane Grp Cap (vph) 692 897 762 387 571 485 184 438 330 407v/s Ratio Prot c0.05 0.10 0.00 c0.11 0.03 0.08v/s Ratio Perm 0.11 0.01 0.01 0.03 0.03 c0.11v/c Ratio 0.29 0.21 0.02 0.04 0.35 0.09 0.12 0.11 0.45 0.33Uniform Delay, d1 5.9 8.1 7.4 12.7 14.6 13.4 15.8 15.8 17.3 16.7Progression Factor 1.00 1.00 1.00 1.00 1.00 1.00 1.00 1.00 1.00 1.00Incremental Delay, d2 0.2 0.1 0.0 0.0 0.4 0.1 0.3 0.1 1.0 0.5Delay (s) 6.1 8.3 7.4 12.7 15.0 13.5 16.1 15.9 18.2 17.2Level of Service A A A B B B B B B BApproach Delay (s) 7.2 14.3 16.0 17.6Approach LOS A B B B
Intersection SummaryHCM 2000 Control Delay 13.3 HCM 2000 Level of Service BHCM 2000 Volume to Capacity ratio 0.37Actuated Cycle Length (s) 54.4 Sum of lost time (s) 14.0Intersection Capacity Utilization 48.3% ICU Level of Service AAnalysis Period (min) 15c Critical Lane Group
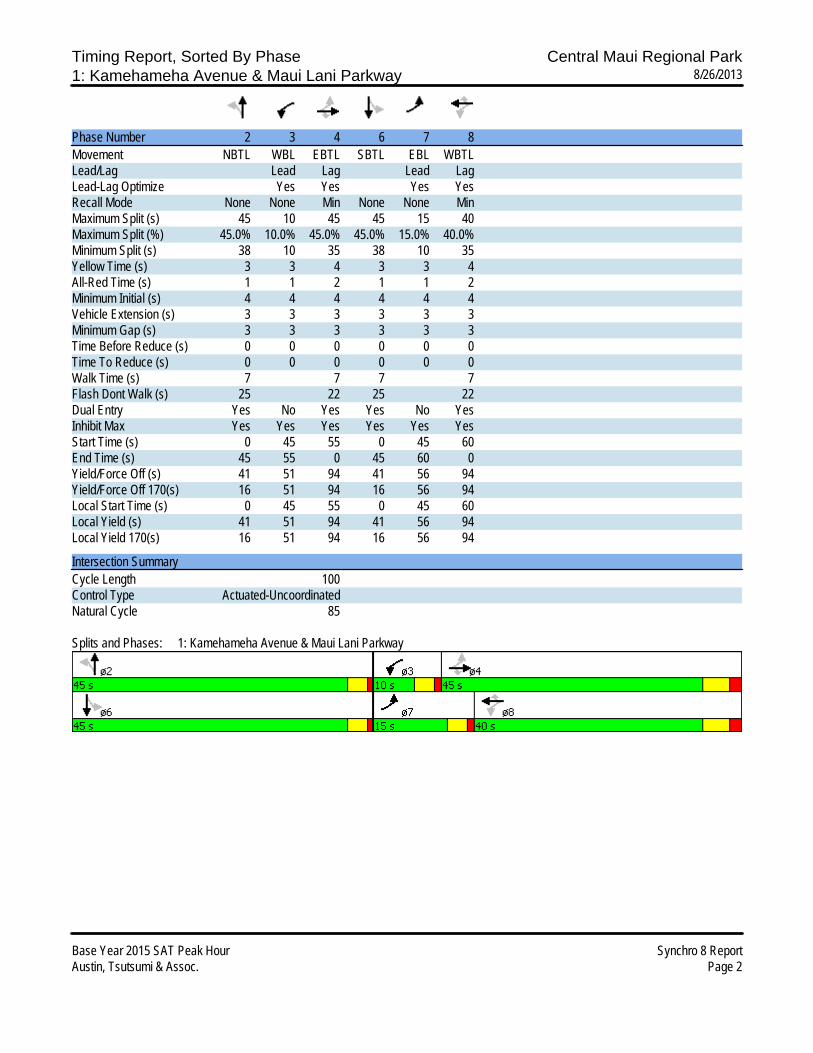
Timing Report, Sorted By Phase Central Maui Regional Park1: Kamehameha Avenue & Maui Lani Parkway 8/26/2013
Base Year 2015 SAT Peak Hour Synchro 8 ReportAustin, Tsutsumi & Assoc. Page 2
Phase Number 2 3 4 6 7 8Movement NBTL WBL EBTL SBTL EBL WBTLLead/Lag Lead Lag Lead LagLead-Lag Optimize Yes Yes Yes YesRecall Mode None None Min None None MinMaximum Split (s) 45 10 45 45 15 40Maximum Split (%) 45.0% 10.0% 45.0% 45.0% 15.0% 40.0%Minimum Split (s) 38 10 35 38 10 35Yellow Time (s) 3 3 4 3 3 4All-Red Time (s) 1 1 2 1 1 2Minimum Initial (s) 4 4 4 4 4 4Vehicle Extension (s) 3 3 3 3 3 3Minimum Gap (s) 3 3 3 3 3 3Time Before Reduce (s) 0 0 0 0 0 0Time To Reduce (s) 0 0 0 0 0 0Walk Time (s) 7 7 7 7Flash Dont Walk (s) 25 22 25 22Dual Entry Yes No Yes Yes No YesInhibit Max Yes Yes Yes Yes Yes YesStart Time (s) 0 45 55 0 45 60End Time (s) 45 55 0 45 60 0Yield/Force Off (s) 41 51 94 41 56 94Yield/Force Off 170(s) 16 51 94 16 56 94Local Start Time (s) 0 45 55 0 45 60Local Yield (s) 41 51 94 41 56 94Local Yield 170(s) 16 51 94 16 56 94
Intersection SummaryCycle Length 100Control Type Actuated-UncoordinatedNatural Cycle 85
Splits and Phases: 1: Kamehameha Avenue & Maui Lani Parkway
APPENDIX C
LEVEL OF SERVICE CALCULATIONS
• Base Year 2022 PM Peak
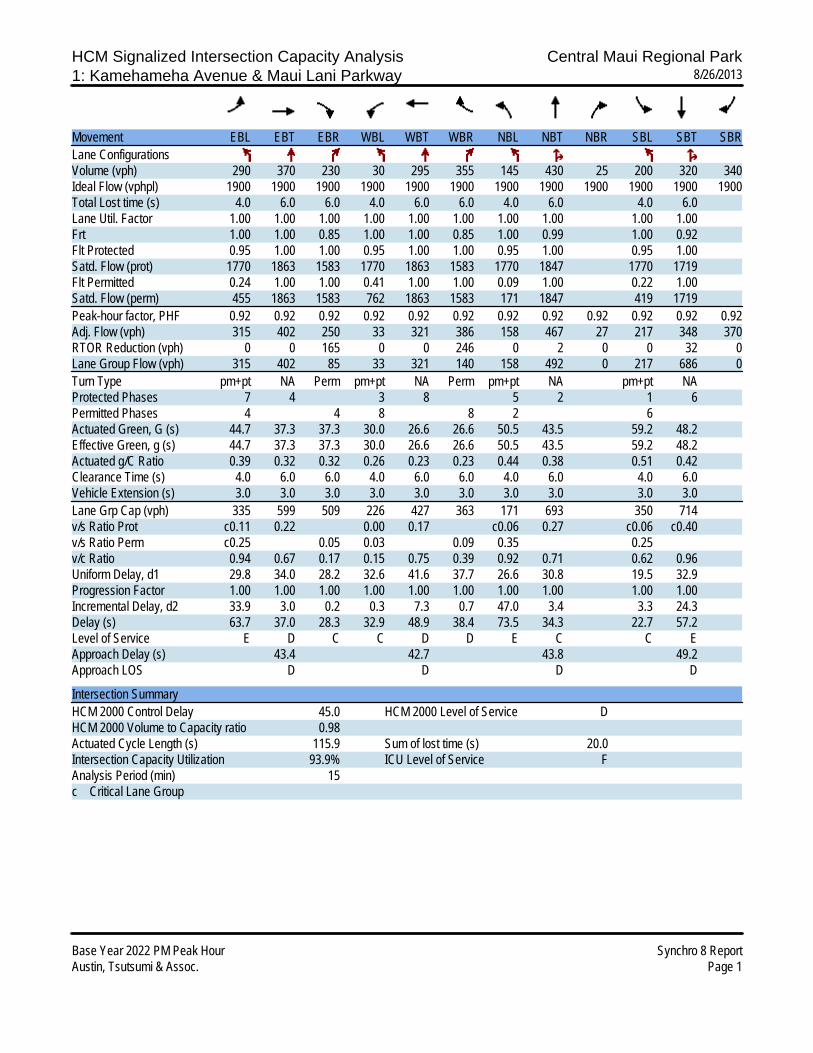
HCM Signalized Intersection Capacity Analysis Central Maui Regional Park1: Kamehameha Avenue & Maui Lani Parkway 8/26/2013
Base Year 2022 PM Peak Hour Synchro 8 ReportAustin, Tsutsumi & Assoc. Page 1
Movement EBL EBT EBR WBL WBT WBR NBL NBT NBR SBL SBT SBRLane ConfigurationsVolume (vph) 290 370 230 30 295 355 145 430 25 200 320 340Ideal Flow (vphpl) 1900 1900 1900 1900 1900 1900 1900 1900 1900 1900 1900 1900Total Lost time (s) 4.0 6.0 6.0 4.0 6.0 6.0 4.0 6.0 4.0 6.0Lane Util. Factor 1.00 1.00 1.00 1.00 1.00 1.00 1.00 1.00 1.00 1.00Frt 1.00 1.00 0.85 1.00 1.00 0.85 1.00 0.99 1.00 0.92Flt Protected 0.95 1.00 1.00 0.95 1.00 1.00 0.95 1.00 0.95 1.00Satd. Flow (prot) 1770 1863 1583 1770 1863 1583 1770 1847 1770 1719Flt Permitted 0.24 1.00 1.00 0.41 1.00 1.00 0.09 1.00 0.22 1.00Satd. Flow (perm) 455 1863 1583 762 1863 1583 171 1847 419 1719Peak-hour factor, PHF 0.92 0.92 0.92 0.92 0.92 0.92 0.92 0.92 0.92 0.92 0.92 0.92Adj. Flow (vph) 315 402 250 33 321 386 158 467 27 217 348 370RTOR Reduction (vph) 0 0 165 0 0 246 0 2 0 0 32 0Lane Group Flow (vph) 315 402 85 33 321 140 158 492 0 217 686 0Turn Type pm+pt NA Perm pm+pt NA Perm pm+pt NA pm+pt NAProtected Phases 7 4 3 8 5 2 1 6Permitted Phases 4 4 8 8 2 6Actuated Green, G (s) 44.7 37.3 37.3 30.0 26.6 26.6 50.5 43.5 59.2 48.2Effective Green, g (s) 44.7 37.3 37.3 30.0 26.6 26.6 50.5 43.5 59.2 48.2Actuated g/C Ratio 0.39 0.32 0.32 0.26 0.23 0.23 0.44 0.38 0.51 0.42Clearance Time (s) 4.0 6.0 6.0 4.0 6.0 6.0 4.0 6.0 4.0 6.0Vehicle Extension (s) 3.0 3.0 3.0 3.0 3.0 3.0 3.0 3.0 3.0 3.0Lane Grp Cap (vph) 335 599 509 226 427 363 171 693 350 714v/s Ratio Prot c0.11 0.22 0.00 0.17 c0.06 0.27 c0.06 c0.40v/s Ratio Perm c0.25 0.05 0.03 0.09 0.35 0.25v/c Ratio 0.94 0.67 0.17 0.15 0.75 0.39 0.92 0.71 0.62 0.96Uniform Delay, d1 29.8 34.0 28.2 32.6 41.6 37.7 26.6 30.8 19.5 32.9Progression Factor 1.00 1.00 1.00 1.00 1.00 1.00 1.00 1.00 1.00 1.00Incremental Delay, d2 33.9 3.0 0.2 0.3 7.3 0.7 47.0 3.4 3.3 24.3Delay (s) 63.7 37.0 28.3 32.9 48.9 38.4 73.5 34.3 22.7 57.2Level of Service E D C C D D E C C EApproach Delay (s) 43.4 42.7 43.8 49.2Approach LOS D D D D
Intersection SummaryHCM 2000 Control Delay 45.0 HCM 2000 Level of Service DHCM 2000 Volume to Capacity ratio 0.98Actuated Cycle Length (s) 115.9 Sum of lost time (s) 20.0Intersection Capacity Utilization 93.9% ICU Level of Service FAnalysis Period (min) 15c Critical Lane Group
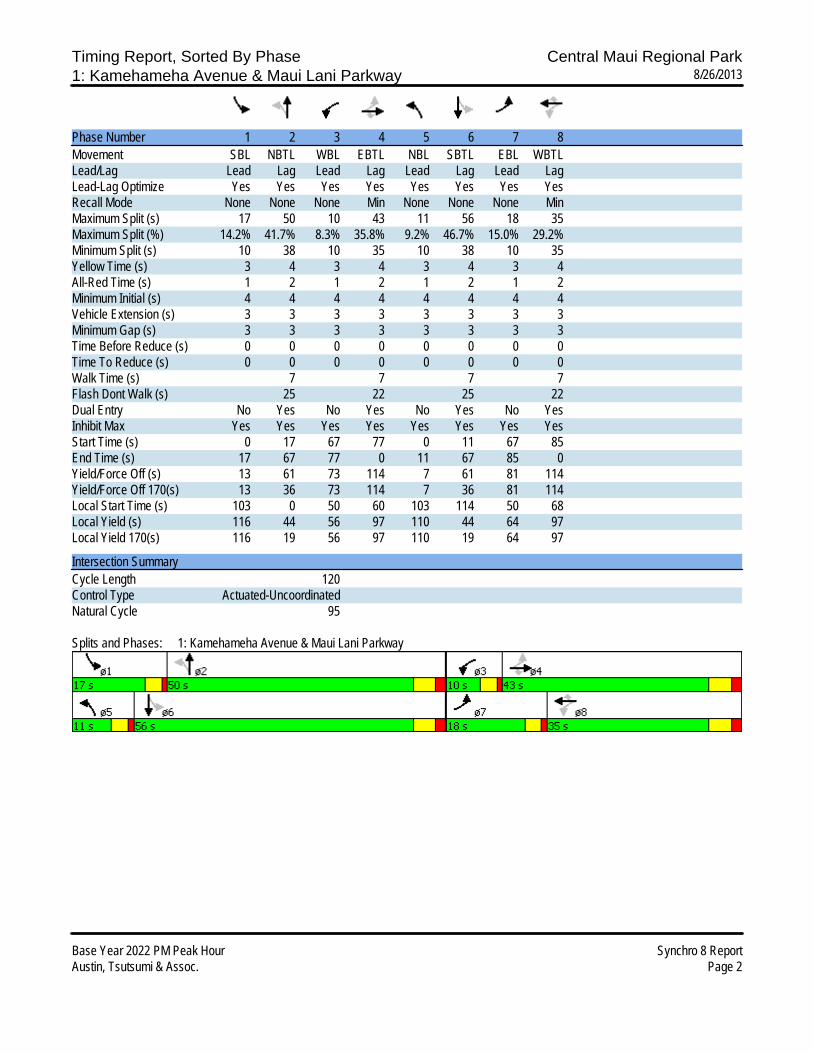
Timing Report, Sorted By Phase Central Maui Regional Park1: Kamehameha Avenue & Maui Lani Parkway 8/26/2013
Base Year 2022 PM Peak Hour Synchro 8 ReportAustin, Tsutsumi & Assoc. Page 2
Phase Number 1 2 3 4 5 6 7 8Movement SBL NBTL WBL EBTL NBL SBTL EBL WBTLLead/Lag Lead Lag Lead Lag Lead Lag Lead LagLead-Lag Optimize Yes Yes Yes Yes Yes Yes Yes YesRecall Mode None None None Min None None None MinMaximum Split (s) 17 50 10 43 11 56 18 35Maximum Split (%) 14.2% 41.7% 8.3% 35.8% 9.2% 46.7% 15.0% 29.2%Minimum Split (s) 10 38 10 35 10 38 10 35Yellow Time (s) 3 4 3 4 3 4 3 4All-Red Time (s) 1 2 1 2 1 2 1 2Minimum Initial (s) 4 4 4 4 4 4 4 4Vehicle Extension (s) 3 3 3 3 3 3 3 3Minimum Gap (s) 3 3 3 3 3 3 3 3Time Before Reduce (s) 0 0 0 0 0 0 0 0Time To Reduce (s) 0 0 0 0 0 0 0 0Walk Time (s) 7 7 7 7Flash Dont Walk (s) 25 22 25 22Dual Entry No Yes No Yes No Yes No YesInhibit Max Yes Yes Yes Yes Yes Yes Yes YesStart Time (s) 0 17 67 77 0 11 67 85End Time (s) 17 67 77 0 11 67 85 0Yield/Force Off (s) 13 61 73 114 7 61 81 114Yield/Force Off 170(s) 13 36 73 114 7 36 81 114Local Start Time (s) 103 0 50 60 103 114 50 68Local Yield (s) 116 44 56 97 110 44 64 97Local Yield 170(s) 116 19 56 97 110 19 64 97
Intersection SummaryCycle Length 120Control Type Actuated-UncoordinatedNatural Cycle 95
Splits and Phases: 1: Kamehameha Avenue & Maui Lani Parkway
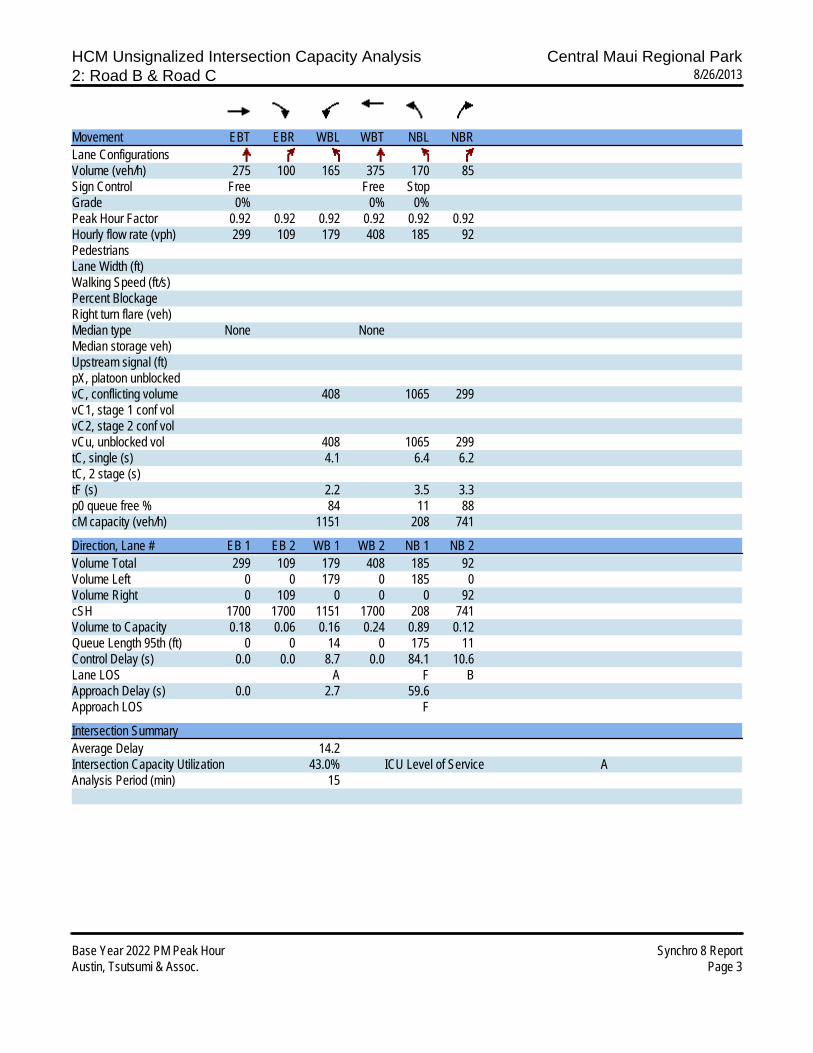
HCM Unsignalized Intersection Capacity Analysis Central Maui Regional Park2: Road B & Road C 8/26/2013
Base Year 2022 PM Peak Hour Synchro 8 ReportAustin, Tsutsumi & Assoc. Page 3
Movement EBT EBR WBL WBT NBL NBRLane ConfigurationsVolume (veh/h) 275 100 165 375 170 85Sign Control Free Free StopGrade 0% 0% 0%Peak Hour Factor 0.92 0.92 0.92 0.92 0.92 0.92Hourly flow rate (vph) 299 109 179 408 185 92PedestriansLane Width (ft)Walking Speed (ft/s)Percent BlockageRight turn flare (veh)Median type None NoneMedian storage veh)Upstream signal (ft)pX, platoon unblockedvC, conflicting volume 408 1065 299vC1, stage 1 conf volvC2, stage 2 conf volvCu, unblocked vol 408 1065 299tC, single (s) 4.1 6.4 6.2tC, 2 stage (s)tF (s) 2.2 3.5 3.3p0 queue free % 84 11 88cM capacity (veh/h) 1151 208 741
Direction, Lane # EB 1 EB 2 WB 1 WB 2 NB 1 NB 2Volume Total 299 109 179 408 185 92Volume Left 0 0 179 0 185 0Volume Right 0 109 0 0 0 92cSH 1700 1700 1151 1700 208 741Volume to Capacity 0.18 0.06 0.16 0.24 0.89 0.12Queue Length 95th (ft) 0 0 14 0 175 11Control Delay (s) 0.0 0.0 8.7 0.0 84.1 10.6Lane LOS A F BApproach Delay (s) 0.0 2.7 59.6Approach LOS F
Intersection SummaryAverage Delay 14.2Intersection Capacity Utilization 43.0% ICU Level of Service AAnalysis Period (min) 15
APPENDIX C
LEVEL OF SERVICE CALCULATIONS
• Base Year 2022 Saturday Peak

HCM Signalized Intersection Capacity Analysis Central Maui Regional Park1: Kamehameha Avenue & Maui Lani Parkway 8/27/2013
Base Year 2022 SAT Peak Hour Synchro 8 ReportAustin, Tsutsumi & Assoc. Page 1
Movement EBL EBT EBR WBL WBT WBR NBL NBT NBR SBL SBT SBRLane ConfigurationsVolume (vph) 235 270 230 20 245 150 125 460 25 160 300 275Ideal Flow (vphpl) 1900 1900 1900 1900 1900 1900 1900 1900 1900 1900 1900 1900Total Lost time (s) 4.0 6.0 6.0 4.0 6.0 6.0 4.0 6.0 4.0 6.0Lane Util. Factor 1.00 1.00 1.00 1.00 1.00 1.00 1.00 1.00 1.00 1.00Frt 1.00 1.00 0.85 1.00 1.00 0.85 1.00 0.99 1.00 0.93Flt Protected 0.95 1.00 1.00 0.95 1.00 1.00 0.95 1.00 0.95 1.00Satd. Flow (prot) 1770 1863 1583 1770 1863 1583 1770 1848 1770 1729Flt Permitted 0.31 1.00 1.00 0.58 1.00 1.00 0.16 1.00 0.18 1.00Satd. Flow (perm) 583 1863 1583 1082 1863 1583 295 1848 333 1729Peak-hour factor, PHF 0.92 0.92 0.92 0.92 0.92 0.92 0.92 0.92 0.92 0.92 0.92 0.92Adj. Flow (vph) 255 293 250 22 266 163 136 500 27 174 326 299RTOR Reduction (vph) 0 0 169 0 0 129 0 2 0 0 33 0Lane Group Flow (vph) 255 293 81 22 266 34 136 525 0 174 592 0Turn Type pm+pt NA Perm pm+pt NA Perm pm+pt NA pm+pt NAProtected Phases 7 4 3 8 5 2 1 6Permitted Phases 4 4 8 8 2 6Actuated Green, G (s) 39.1 33.0 33.0 23.2 21.1 21.1 42.4 36.2 50.0 40.0Effective Green, g (s) 39.1 33.0 33.0 23.2 21.1 21.1 42.4 36.2 50.0 40.0Actuated g/C Ratio 0.39 0.33 0.33 0.23 0.21 0.21 0.42 0.36 0.49 0.39Clearance Time (s) 4.0 6.0 6.0 4.0 6.0 6.0 4.0 6.0 4.0 6.0Vehicle Extension (s) 3.0 3.0 3.0 3.0 3.0 3.0 3.0 3.0 3.0 3.0Lane Grp Cap (vph) 389 606 515 262 388 329 213 660 306 682v/s Ratio Prot c0.09 0.16 0.00 0.14 0.04 0.28 c0.06 c0.34v/s Ratio Perm c0.16 0.05 0.02 0.02 0.23 0.22v/c Ratio 0.66 0.48 0.16 0.08 0.69 0.10 0.64 0.80 0.57 0.87Uniform Delay, d1 23.2 27.3 24.3 30.5 37.0 32.4 21.6 29.2 18.2 28.2Progression Factor 1.00 1.00 1.00 1.00 1.00 1.00 1.00 1.00 1.00 1.00Incremental Delay, d2 3.9 0.6 0.1 0.1 5.0 0.1 6.2 6.6 2.4 11.4Delay (s) 27.2 27.9 24.4 30.6 42.0 32.6 27.8 35.8 20.6 39.6Level of Service C C C C D C C D C DApproach Delay (s) 26.6 38.0 34.2 35.4Approach LOS C D C D
Intersection SummaryHCM 2000 Control Delay 33.0 HCM 2000 Level of Service CHCM 2000 Volume to Capacity ratio 0.79Actuated Cycle Length (s) 101.3 Sum of lost time (s) 20.0Intersection Capacity Utilization 82.1% ICU Level of Service EAnalysis Period (min) 15c Critical Lane Group
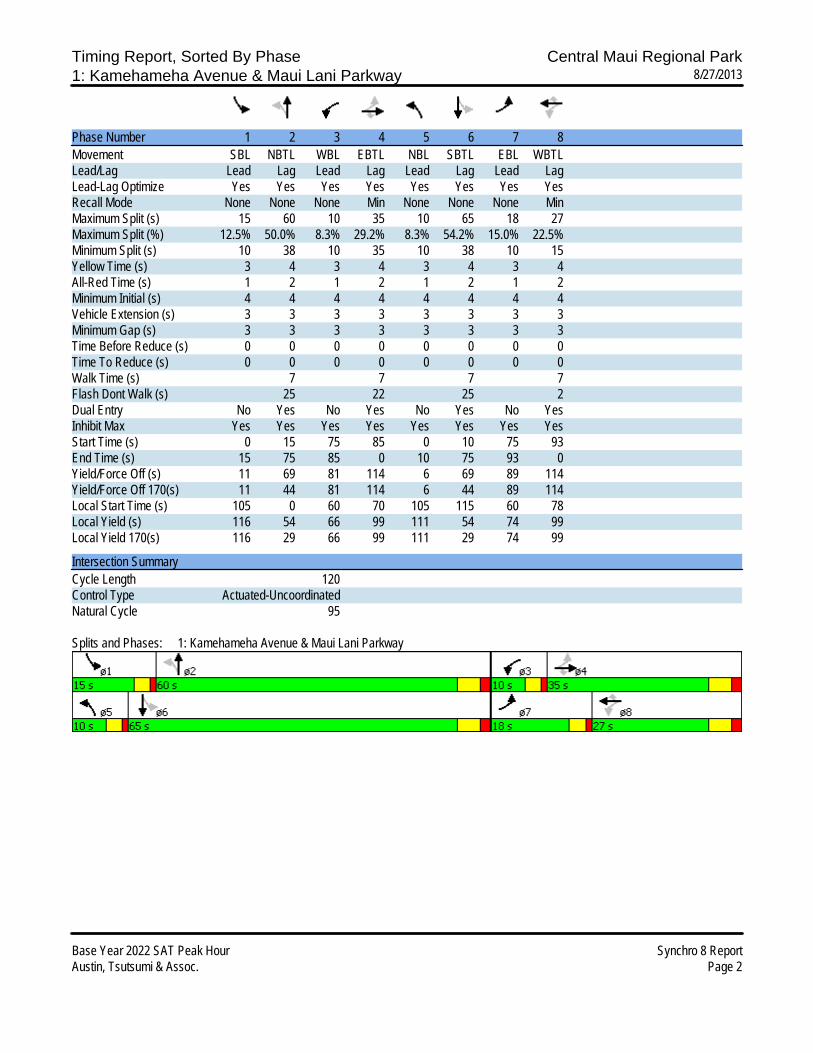
Timing Report, Sorted By Phase Central Maui Regional Park1: Kamehameha Avenue & Maui Lani Parkway 8/27/2013
Base Year 2022 SAT Peak Hour Synchro 8 ReportAustin, Tsutsumi & Assoc. Page 2
Phase Number 1 2 3 4 5 6 7 8Movement SBL NBTL WBL EBTL NBL SBTL EBL WBTLLead/Lag Lead Lag Lead Lag Lead Lag Lead LagLead-Lag Optimize Yes Yes Yes Yes Yes Yes Yes YesRecall Mode None None None Min None None None MinMaximum Split (s) 15 60 10 35 10 65 18 27Maximum Split (%) 12.5% 50.0% 8.3% 29.2% 8.3% 54.2% 15.0% 22.5%Minimum Split (s) 10 38 10 35 10 38 10 15Yellow Time (s) 3 4 3 4 3 4 3 4All-Red Time (s) 1 2 1 2 1 2 1 2Minimum Initial (s) 4 4 4 4 4 4 4 4Vehicle Extension (s) 3 3 3 3 3 3 3 3Minimum Gap (s) 3 3 3 3 3 3 3 3Time Before Reduce (s) 0 0 0 0 0 0 0 0Time To Reduce (s) 0 0 0 0 0 0 0 0Walk Time (s) 7 7 7 7Flash Dont Walk (s) 25 22 25 2Dual Entry No Yes No Yes No Yes No YesInhibit Max Yes Yes Yes Yes Yes Yes Yes YesStart Time (s) 0 15 75 85 0 10 75 93End Time (s) 15 75 85 0 10 75 93 0Yield/Force Off (s) 11 69 81 114 6 69 89 114Yield/Force Off 170(s) 11 44 81 114 6 44 89 114Local Start Time (s) 105 0 60 70 105 115 60 78Local Yield (s) 116 54 66 99 111 54 74 99Local Yield 170(s) 116 29 66 99 111 29 74 99
Intersection SummaryCycle Length 120Control Type Actuated-UncoordinatedNatural Cycle 95
Splits and Phases: 1: Kamehameha Avenue & Maui Lani Parkway

HCM Unsignalized Intersection Capacity Analysis Central Maui Regional Park2: Road B & Road C 8/27/2013
Base Year 2022 SAT Peak Hour Synchro 8 ReportAustin, Tsutsumi & Assoc. Page 3
Movement EBT EBR WBL WBT NBL NBRLane ConfigurationsVolume (veh/h) 260 95 155 355 160 80Sign Control Free Free StopGrade 0% 0% 0%Peak Hour Factor 0.92 0.92 0.92 0.92 0.92 0.92Hourly flow rate (vph) 283 103 168 386 174 87PedestriansLane Width (ft)Walking Speed (ft/s)Percent BlockageRight turn flare (veh)Median type None NoneMedian storage veh)Upstream signal (ft)pX, platoon unblockedvC, conflicting volume 386 1005 283vC1, stage 1 conf volvC2, stage 2 conf volvCu, unblocked vol 386 1005 283tC, single (s) 4.1 6.4 6.2tC, 2 stage (s)tF (s) 2.2 3.5 3.3p0 queue free % 86 24 89cM capacity (veh/h) 1173 229 756
Direction, Lane # EB 1 EB 2 WB 1 WB 2 NB 1 NB 2Volume Total 283 103 168 386 174 87Volume Left 0 0 168 0 174 0Volume Right 0 103 0 0 0 87cSH 1700 1700 1173 1700 229 756Volume to Capacity 0.17 0.06 0.14 0.23 0.76 0.11Queue Length 95th (ft) 0 0 13 0 133 10Control Delay (s) 0.0 0.0 8.6 0.0 57.7 10.4Lane LOS A F BApproach Delay (s) 0.0 2.6 41.9Approach LOS E
Intersection SummaryAverage Delay 10.3Intersection Capacity Utilization 41.1% ICU Level of Service AAnalysis Period (min) 15

APPENDIX C
LEVEL OF SERVICE CALCULATIONS
• Base Year 2022 with Mitigation PM Peak
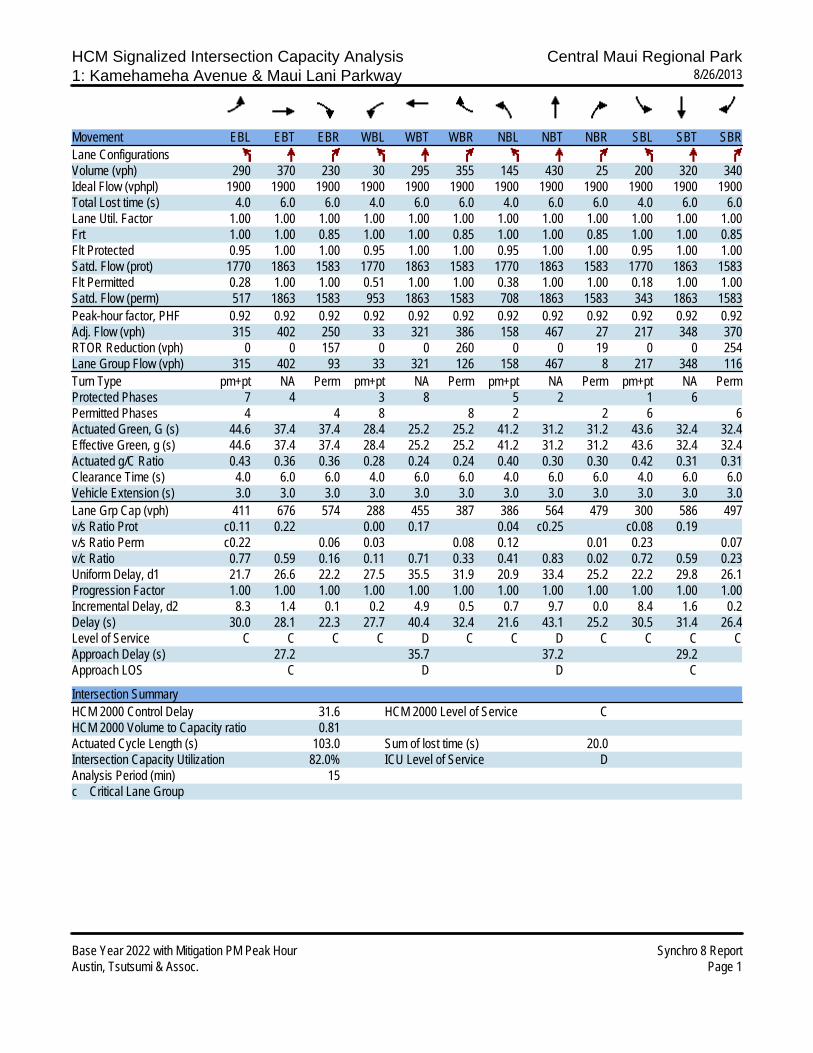
HCM Signalized Intersection Capacity Analysis Central Maui Regional Park1: Kamehameha Avenue & Maui Lani Parkway 8/26/2013
Base Year 2022 with Mitigation PM Peak Hour Synchro 8 ReportAustin, Tsutsumi & Assoc. Page 1
Movement EBL EBT EBR WBL WBT WBR NBL NBT NBR SBL SBT SBRLane ConfigurationsVolume (vph) 290 370 230 30 295 355 145 430 25 200 320 340Ideal Flow (vphpl) 1900 1900 1900 1900 1900 1900 1900 1900 1900 1900 1900 1900Total Lost time (s) 4.0 6.0 6.0 4.0 6.0 6.0 4.0 6.0 6.0 4.0 6.0 6.0Lane Util. Factor 1.00 1.00 1.00 1.00 1.00 1.00 1.00 1.00 1.00 1.00 1.00 1.00Frt 1.00 1.00 0.85 1.00 1.00 0.85 1.00 1.00 0.85 1.00 1.00 0.85Flt Protected 0.95 1.00 1.00 0.95 1.00 1.00 0.95 1.00 1.00 0.95 1.00 1.00Satd. Flow (prot) 1770 1863 1583 1770 1863 1583 1770 1863 1583 1770 1863 1583Flt Permitted 0.28 1.00 1.00 0.51 1.00 1.00 0.38 1.00 1.00 0.18 1.00 1.00Satd. Flow (perm) 517 1863 1583 953 1863 1583 708 1863 1583 343 1863 1583Peak-hour factor, PHF 0.92 0.92 0.92 0.92 0.92 0.92 0.92 0.92 0.92 0.92 0.92 0.92Adj. Flow (vph) 315 402 250 33 321 386 158 467 27 217 348 370RTOR Reduction (vph) 0 0 157 0 0 260 0 0 19 0 0 254Lane Group Flow (vph) 315 402 93 33 321 126 158 467 8 217 348 116Turn Type pm+pt NA Perm pm+pt NA Perm pm+pt NA Perm pm+pt NA PermProtected Phases 7 4 3 8 5 2 1 6Permitted Phases 4 4 8 8 2 2 6 6Actuated Green, G (s) 44.6 37.4 37.4 28.4 25.2 25.2 41.2 31.2 31.2 43.6 32.4 32.4Effective Green, g (s) 44.6 37.4 37.4 28.4 25.2 25.2 41.2 31.2 31.2 43.6 32.4 32.4Actuated g/C Ratio 0.43 0.36 0.36 0.28 0.24 0.24 0.40 0.30 0.30 0.42 0.31 0.31Clearance Time (s) 4.0 6.0 6.0 4.0 6.0 6.0 4.0 6.0 6.0 4.0 6.0 6.0Vehicle Extension (s) 3.0 3.0 3.0 3.0 3.0 3.0 3.0 3.0 3.0 3.0 3.0 3.0Lane Grp Cap (vph) 411 676 574 288 455 387 386 564 479 300 586 497v/s Ratio Prot c0.11 0.22 0.00 0.17 0.04 c0.25 c0.08 0.19v/s Ratio Perm c0.22 0.06 0.03 0.08 0.12 0.01 0.23 0.07v/c Ratio 0.77 0.59 0.16 0.11 0.71 0.33 0.41 0.83 0.02 0.72 0.59 0.23Uniform Delay, d1 21.7 26.6 22.2 27.5 35.5 31.9 20.9 33.4 25.2 22.2 29.8 26.1Progression Factor 1.00 1.00 1.00 1.00 1.00 1.00 1.00 1.00 1.00 1.00 1.00 1.00Incremental Delay, d2 8.3 1.4 0.1 0.2 4.9 0.5 0.7 9.7 0.0 8.4 1.6 0.2Delay (s) 30.0 28.1 22.3 27.7 40.4 32.4 21.6 43.1 25.2 30.5 31.4 26.4Level of Service C C C C D C C D C C C CApproach Delay (s) 27.2 35.7 37.2 29.2Approach LOS C D D C
Intersection SummaryHCM 2000 Control Delay 31.6 HCM 2000 Level of Service CHCM 2000 Volume to Capacity ratio 0.81Actuated Cycle Length (s) 103.0 Sum of lost time (s) 20.0Intersection Capacity Utilization 82.0% ICU Level of Service DAnalysis Period (min) 15c Critical Lane Group
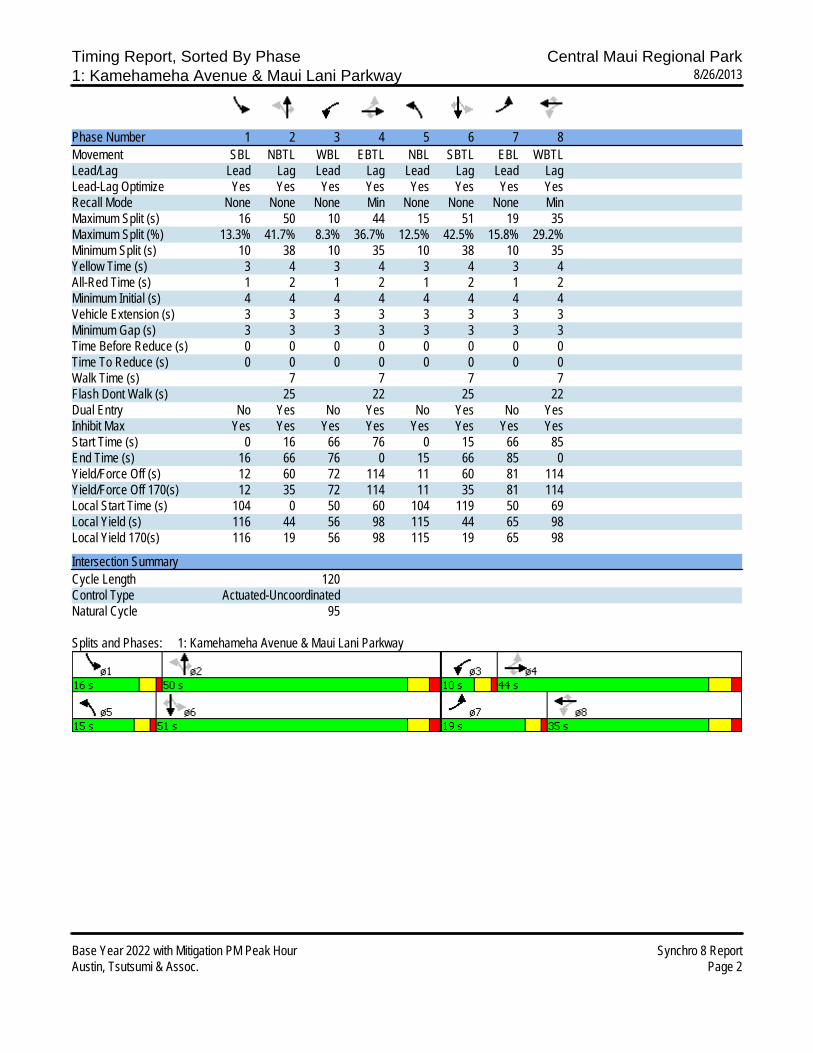
Timing Report, Sorted By Phase Central Maui Regional Park1: Kamehameha Avenue & Maui Lani Parkway 8/26/2013
Base Year 2022 with Mitigation PM Peak Hour Synchro 8 ReportAustin, Tsutsumi & Assoc. Page 2
Phase Number 1 2 3 4 5 6 7 8Movement SBL NBTL WBL EBTL NBL SBTL EBL WBTLLead/Lag Lead Lag Lead Lag Lead Lag Lead LagLead-Lag Optimize Yes Yes Yes Yes Yes Yes Yes YesRecall Mode None None None Min None None None MinMaximum Split (s) 16 50 10 44 15 51 19 35Maximum Split (%) 13.3% 41.7% 8.3% 36.7% 12.5% 42.5% 15.8% 29.2%Minimum Split (s) 10 38 10 35 10 38 10 35Yellow Time (s) 3 4 3 4 3 4 3 4All-Red Time (s) 1 2 1 2 1 2 1 2Minimum Initial (s) 4 4 4 4 4 4 4 4Vehicle Extension (s) 3 3 3 3 3 3 3 3Minimum Gap (s) 3 3 3 3 3 3 3 3Time Before Reduce (s) 0 0 0 0 0 0 0 0Time To Reduce (s) 0 0 0 0 0 0 0 0Walk Time (s) 7 7 7 7Flash Dont Walk (s) 25 22 25 22Dual Entry No Yes No Yes No Yes No YesInhibit Max Yes Yes Yes Yes Yes Yes Yes YesStart Time (s) 0 16 66 76 0 15 66 85End Time (s) 16 66 76 0 15 66 85 0Yield/Force Off (s) 12 60 72 114 11 60 81 114Yield/Force Off 170(s) 12 35 72 114 11 35 81 114Local Start Time (s) 104 0 50 60 104 119 50 69Local Yield (s) 116 44 56 98 115 44 65 98Local Yield 170(s) 116 19 56 98 115 19 65 98
Intersection SummaryCycle Length 120Control Type Actuated-UncoordinatedNatural Cycle 95
Splits and Phases: 1: Kamehameha Avenue & Maui Lani Parkway

HCM Unsignalized Intersection Capacity Analysis Central Maui Regional Park2: Road B & Road C 8/26/2013
Base Year 2022 with Mitigation PM Peak Hour Synchro 8 ReportAustin, Tsutsumi & Assoc. Page 3
Movement EBT EBR WBL WBT NBL NBRLane ConfigurationsVolume (veh/h) 275 100 165 375 170 85Sign Control Free Free StopGrade 0% 0% 0%Peak Hour Factor 0.92 0.92 0.92 0.92 0.92 0.92Hourly flow rate (vph) 299 109 179 408 185 92PedestriansLane Width (ft)Walking Speed (ft/s)Percent BlockageRight turn flare (veh)Median type None NoneMedian storage veh)Upstream signal (ft)pX, platoon unblockedvC, conflicting volume 408 1065 299vC1, stage 1 conf volvC2, stage 2 conf volvCu, unblocked vol 408 1065 299tC, single (s) 4.1 6.4 6.2tC, 2 stage (s)tF (s) 2.2 3.5 3.3p0 queue free % 84 11 88cM capacity (veh/h) 1151 208 741
Direction, Lane # EB 1 EB 2 WB 1 WB 2 NB 1 NB 2Volume Total 299 109 179 408 185 92Volume Left 0 0 179 0 185 0Volume Right 0 109 0 0 0 92cSH 1700 1700 1151 1700 208 741Volume to Capacity 0.18 0.06 0.16 0.24 0.89 0.12Queue Length 95th (ft) 0 0 14 0 175 11Control Delay (s) 0.0 0.0 8.7 0.0 84.1 10.6Lane LOS A F BApproach Delay (s) 0.0 2.7 59.6Approach LOS F
Intersection SummaryAverage Delay 14.2Intersection Capacity Utilization 43.0% ICU Level of Service AAnalysis Period (min) 15
APPENDIX C
LEVEL OF SERVICE CALCULATIONS
• Base Year 2022 with Mitigation Saturday Peak
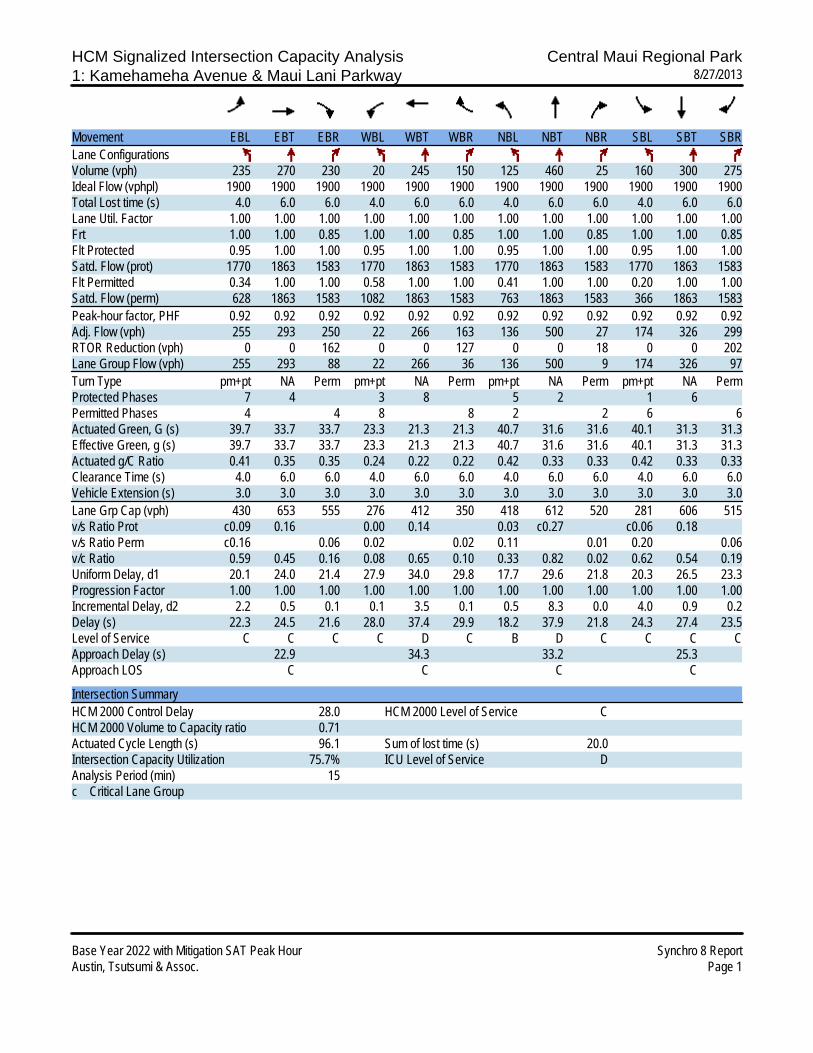
HCM Signalized Intersection Capacity Analysis Central Maui Regional Park1: Kamehameha Avenue & Maui Lani Parkway 8/27/2013
Base Year 2022 with Mitigation SAT Peak Hour Synchro 8 ReportAustin, Tsutsumi & Assoc. Page 1
Movement EBL EBT EBR WBL WBT WBR NBL NBT NBR SBL SBT SBRLane ConfigurationsVolume (vph) 235 270 230 20 245 150 125 460 25 160 300 275Ideal Flow (vphpl) 1900 1900 1900 1900 1900 1900 1900 1900 1900 1900 1900 1900Total Lost time (s) 4.0 6.0 6.0 4.0 6.0 6.0 4.0 6.0 6.0 4.0 6.0 6.0Lane Util. Factor 1.00 1.00 1.00 1.00 1.00 1.00 1.00 1.00 1.00 1.00 1.00 1.00Frt 1.00 1.00 0.85 1.00 1.00 0.85 1.00 1.00 0.85 1.00 1.00 0.85Flt Protected 0.95 1.00 1.00 0.95 1.00 1.00 0.95 1.00 1.00 0.95 1.00 1.00Satd. Flow (prot) 1770 1863 1583 1770 1863 1583 1770 1863 1583 1770 1863 1583Flt Permitted 0.34 1.00 1.00 0.58 1.00 1.00 0.41 1.00 1.00 0.20 1.00 1.00Satd. Flow (perm) 628 1863 1583 1082 1863 1583 763 1863 1583 366 1863 1583Peak-hour factor, PHF 0.92 0.92 0.92 0.92 0.92 0.92 0.92 0.92 0.92 0.92 0.92 0.92Adj. Flow (vph) 255 293 250 22 266 163 136 500 27 174 326 299RTOR Reduction (vph) 0 0 162 0 0 127 0 0 18 0 0 202Lane Group Flow (vph) 255 293 88 22 266 36 136 500 9 174 326 97Turn Type pm+pt NA Perm pm+pt NA Perm pm+pt NA Perm pm+pt NA PermProtected Phases 7 4 3 8 5 2 1 6Permitted Phases 4 4 8 8 2 2 6 6Actuated Green, G (s) 39.7 33.7 33.7 23.3 21.3 21.3 40.7 31.6 31.6 40.1 31.3 31.3Effective Green, g (s) 39.7 33.7 33.7 23.3 21.3 21.3 40.7 31.6 31.6 40.1 31.3 31.3Actuated g/C Ratio 0.41 0.35 0.35 0.24 0.22 0.22 0.42 0.33 0.33 0.42 0.33 0.33Clearance Time (s) 4.0 6.0 6.0 4.0 6.0 6.0 4.0 6.0 6.0 4.0 6.0 6.0Vehicle Extension (s) 3.0 3.0 3.0 3.0 3.0 3.0 3.0 3.0 3.0 3.0 3.0 3.0Lane Grp Cap (vph) 430 653 555 276 412 350 418 612 520 281 606 515v/s Ratio Prot c0.09 0.16 0.00 0.14 0.03 c0.27 c0.06 0.18v/s Ratio Perm c0.16 0.06 0.02 0.02 0.11 0.01 0.20 0.06v/c Ratio 0.59 0.45 0.16 0.08 0.65 0.10 0.33 0.82 0.02 0.62 0.54 0.19Uniform Delay, d1 20.1 24.0 21.4 27.9 34.0 29.8 17.7 29.6 21.8 20.3 26.5 23.3Progression Factor 1.00 1.00 1.00 1.00 1.00 1.00 1.00 1.00 1.00 1.00 1.00 1.00Incremental Delay, d2 2.2 0.5 0.1 0.1 3.5 0.1 0.5 8.3 0.0 4.0 0.9 0.2Delay (s) 22.3 24.5 21.6 28.0 37.4 29.9 18.2 37.9 21.8 24.3 27.4 23.5Level of Service C C C C D C B D C C C CApproach Delay (s) 22.9 34.3 33.2 25.3Approach LOS C C C C
Intersection SummaryHCM 2000 Control Delay 28.0 HCM 2000 Level of Service CHCM 2000 Volume to Capacity ratio 0.71Actuated Cycle Length (s) 96.1 Sum of lost time (s) 20.0Intersection Capacity Utilization 75.7% ICU Level of Service DAnalysis Period (min) 15c Critical Lane Group

Timing Report, Sorted By Phase Central Maui Regional Park1: Kamehameha Avenue & Maui Lani Parkway 8/27/2013
Base Year 2022 with Mitigation SAT Peak Hour Synchro 8 ReportAustin, Tsutsumi & Assoc. Page 2
Phase Number 1 2 3 4 5 6 7 8Movement SBL NBTL WBL EBTL NBL SBTL EBL WBTLLead/Lag Lead Lag Lead Lag Lead Lag Lead LagLead-Lag Optimize Yes Yes Yes Yes Yes Yes Yes YesRecall Mode None None None Min None None None MinMaximum Split (s) 13 57 10 40 14 56 19 31Maximum Split (%) 10.8% 47.5% 8.3% 33.3% 11.7% 46.7% 15.8% 25.8%Minimum Split (s) 10 38 10 35 10 38 10 15Yellow Time (s) 3 4 3 4 3 4 3 4All-Red Time (s) 1 2 1 2 1 2 1 2Minimum Initial (s) 4 4 4 4 4 4 4 4Vehicle Extension (s) 3 3 3 3 3 3 3 3Minimum Gap (s) 3 3 3 3 3 3 3 3Time Before Reduce (s) 0 0 0 0 0 0 0 0Time To Reduce (s) 0 0 0 0 0 0 0 0Walk Time (s) 7 7 7 7Flash Dont Walk (s) 25 22 25 2Dual Entry No Yes No Yes No Yes No YesInhibit Max Yes Yes Yes Yes Yes Yes Yes YesStart Time (s) 0 13 70 80 0 14 70 89End Time (s) 13 70 80 0 14 70 89 0Yield/Force Off (s) 9 64 76 114 10 64 85 114Yield/Force Off 170(s) 9 39 76 114 10 39 85 114Local Start Time (s) 106 119 56 66 106 0 56 75Local Yield (s) 115 50 62 100 116 50 71 100Local Yield 170(s) 115 25 62 100 116 25 71 100
Intersection SummaryCycle Length 120Control Type Actuated-UncoordinatedNatural Cycle 95
Splits and Phases: 1: Kamehameha Avenue & Maui Lani Parkway
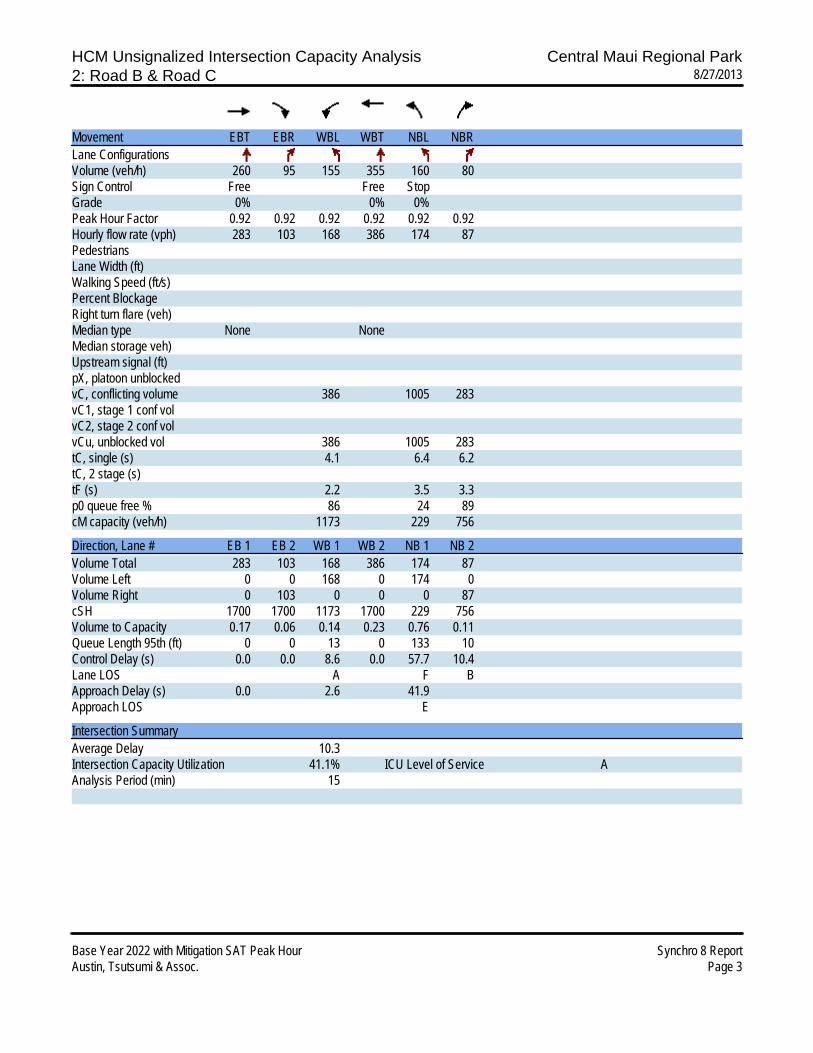
HCM Unsignalized Intersection Capacity Analysis Central Maui Regional Park2: Road B & Road C 8/27/2013
Base Year 2022 with Mitigation SAT Peak Hour Synchro 8 ReportAustin, Tsutsumi & Assoc. Page 3
Movement EBT EBR WBL WBT NBL NBRLane ConfigurationsVolume (veh/h) 260 95 155 355 160 80Sign Control Free Free StopGrade 0% 0% 0%Peak Hour Factor 0.92 0.92 0.92 0.92 0.92 0.92Hourly flow rate (vph) 283 103 168 386 174 87PedestriansLane Width (ft)Walking Speed (ft/s)Percent BlockageRight turn flare (veh)Median type None NoneMedian storage veh)Upstream signal (ft)pX, platoon unblockedvC, conflicting volume 386 1005 283vC1, stage 1 conf volvC2, stage 2 conf volvCu, unblocked vol 386 1005 283tC, single (s) 4.1 6.4 6.2tC, 2 stage (s)tF (s) 2.2 3.5 3.3p0 queue free % 86 24 89cM capacity (veh/h) 1173 229 756
Direction, Lane # EB 1 EB 2 WB 1 WB 2 NB 1 NB 2Volume Total 283 103 168 386 174 87Volume Left 0 0 168 0 174 0Volume Right 0 103 0 0 0 87cSH 1700 1700 1173 1700 229 756Volume to Capacity 0.17 0.06 0.14 0.23 0.76 0.11Queue Length 95th (ft) 0 0 13 0 133 10Control Delay (s) 0.0 0.0 8.6 0.0 57.7 10.4Lane LOS A F BApproach Delay (s) 0.0 2.6 41.9Approach LOS E
Intersection SummaryAverage Delay 10.3Intersection Capacity Utilization 41.1% ICU Level of Service AAnalysis Period (min) 15

APPENDIX C
LEVEL OF SERVICE CALCULATIONS
• Future Year 2015 PM Peak
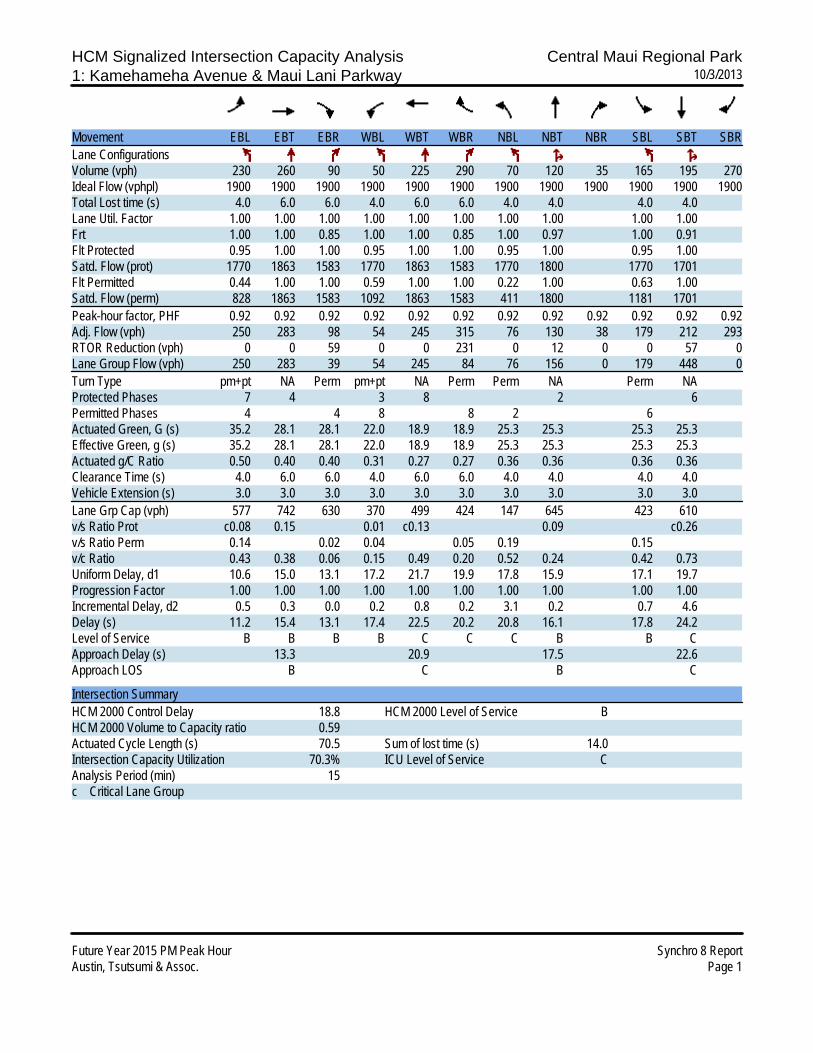
HCM Signalized Intersection Capacity Analysis Central Maui Regional Park1: Kamehameha Avenue & Maui Lani Parkway 10/3/2013
Future Year 2015 PM Peak Hour Synchro 8 ReportAustin, Tsutsumi & Assoc. Page 1
Movement EBL EBT EBR WBL WBT WBR NBL NBT NBR SBL SBT SBRLane ConfigurationsVolume (vph) 230 260 90 50 225 290 70 120 35 165 195 270Ideal Flow (vphpl) 1900 1900 1900 1900 1900 1900 1900 1900 1900 1900 1900 1900Total Lost time (s) 4.0 6.0 6.0 4.0 6.0 6.0 4.0 4.0 4.0 4.0Lane Util. Factor 1.00 1.00 1.00 1.00 1.00 1.00 1.00 1.00 1.00 1.00Frt 1.00 1.00 0.85 1.00 1.00 0.85 1.00 0.97 1.00 0.91Flt Protected 0.95 1.00 1.00 0.95 1.00 1.00 0.95 1.00 0.95 1.00Satd. Flow (prot) 1770 1863 1583 1770 1863 1583 1770 1800 1770 1701Flt Permitted 0.44 1.00 1.00 0.59 1.00 1.00 0.22 1.00 0.63 1.00Satd. Flow (perm) 828 1863 1583 1092 1863 1583 411 1800 1181 1701Peak-hour factor, PHF 0.92 0.92 0.92 0.92 0.92 0.92 0.92 0.92 0.92 0.92 0.92 0.92Adj. Flow (vph) 250 283 98 54 245 315 76 130 38 179 212 293RTOR Reduction (vph) 0 0 59 0 0 231 0 12 0 0 57 0Lane Group Flow (vph) 250 283 39 54 245 84 76 156 0 179 448 0Turn Type pm+pt NA Perm pm+pt NA Perm Perm NA Perm NAProtected Phases 7 4 3 8 2 6Permitted Phases 4 4 8 8 2 6Actuated Green, G (s) 35.2 28.1 28.1 22.0 18.9 18.9 25.3 25.3 25.3 25.3Effective Green, g (s) 35.2 28.1 28.1 22.0 18.9 18.9 25.3 25.3 25.3 25.3Actuated g/C Ratio 0.50 0.40 0.40 0.31 0.27 0.27 0.36 0.36 0.36 0.36Clearance Time (s) 4.0 6.0 6.0 4.0 6.0 6.0 4.0 4.0 4.0 4.0Vehicle Extension (s) 3.0 3.0 3.0 3.0 3.0 3.0 3.0 3.0 3.0 3.0Lane Grp Cap (vph) 577 742 630 370 499 424 147 645 423 610v/s Ratio Prot c0.08 0.15 0.01 c0.13 0.09 c0.26v/s Ratio Perm 0.14 0.02 0.04 0.05 0.19 0.15v/c Ratio 0.43 0.38 0.06 0.15 0.49 0.20 0.52 0.24 0.42 0.73Uniform Delay, d1 10.6 15.0 13.1 17.2 21.7 19.9 17.8 15.9 17.1 19.7Progression Factor 1.00 1.00 1.00 1.00 1.00 1.00 1.00 1.00 1.00 1.00Incremental Delay, d2 0.5 0.3 0.0 0.2 0.8 0.2 3.1 0.2 0.7 4.6Delay (s) 11.2 15.4 13.1 17.4 22.5 20.2 20.8 16.1 17.8 24.2Level of Service B B B B C C C B B CApproach Delay (s) 13.3 20.9 17.5 22.6Approach LOS B C B C
Intersection SummaryHCM 2000 Control Delay 18.8 HCM 2000 Level of Service BHCM 2000 Volume to Capacity ratio 0.59Actuated Cycle Length (s) 70.5 Sum of lost time (s) 14.0Intersection Capacity Utilization 70.3% ICU Level of Service CAnalysis Period (min) 15c Critical Lane Group

Timing Report, Sorted By Phase Central Maui Regional Park1: Kamehameha Avenue & Maui Lani Parkway 10/3/2013
Future Year 2015 PM Peak Hour Synchro 8 ReportAustin, Tsutsumi & Assoc. Page 2
Phase Number 2 3 4 6 7 8Movement NBTL WBL EBTL SBTL EBL WBTLLead/Lag Lead Lag Lead LagLead-Lag Optimize Yes Yes Yes YesRecall Mode None None Min None None MinMaximum Split (s) 48 10 42 48 17 35Maximum Split (%) 48.0% 10.0% 42.0% 48.0% 17.0% 35.0%Minimum Split (s) 38 10 35 38 10 35Yellow Time (s) 3 3 4 3 3 4All-Red Time (s) 1 1 2 1 1 2Minimum Initial (s) 4 4 4 4 4 4Vehicle Extension (s) 3 3 3 3 3 3Minimum Gap (s) 3 3 3 3 3 3Time Before Reduce (s) 0 0 0 0 0 0Time To Reduce (s) 0 0 0 0 0 0Walk Time (s) 7 7 7 7Flash Dont Walk (s) 25 22 25 22Dual Entry Yes No Yes Yes No YesInhibit Max Yes Yes Yes Yes Yes YesStart Time (s) 0 48 58 0 48 65End Time (s) 48 58 0 48 65 0Yield/Force Off (s) 44 54 94 44 61 94Yield/Force Off 170(s) 19 54 94 19 61 94Local Start Time (s) 0 48 58 0 48 65Local Yield (s) 44 54 94 44 61 94Local Yield 170(s) 19 54 94 19 61 94
Intersection SummaryCycle Length 100Control Type Actuated-UncoordinatedNatural Cycle 85
Splits and Phases: 1: Kamehameha Avenue & Maui Lani Parkway

APPENDIX C
LEVEL OF SERVICE CALCULATIONS
• Future Year 2015 Saturday Peak
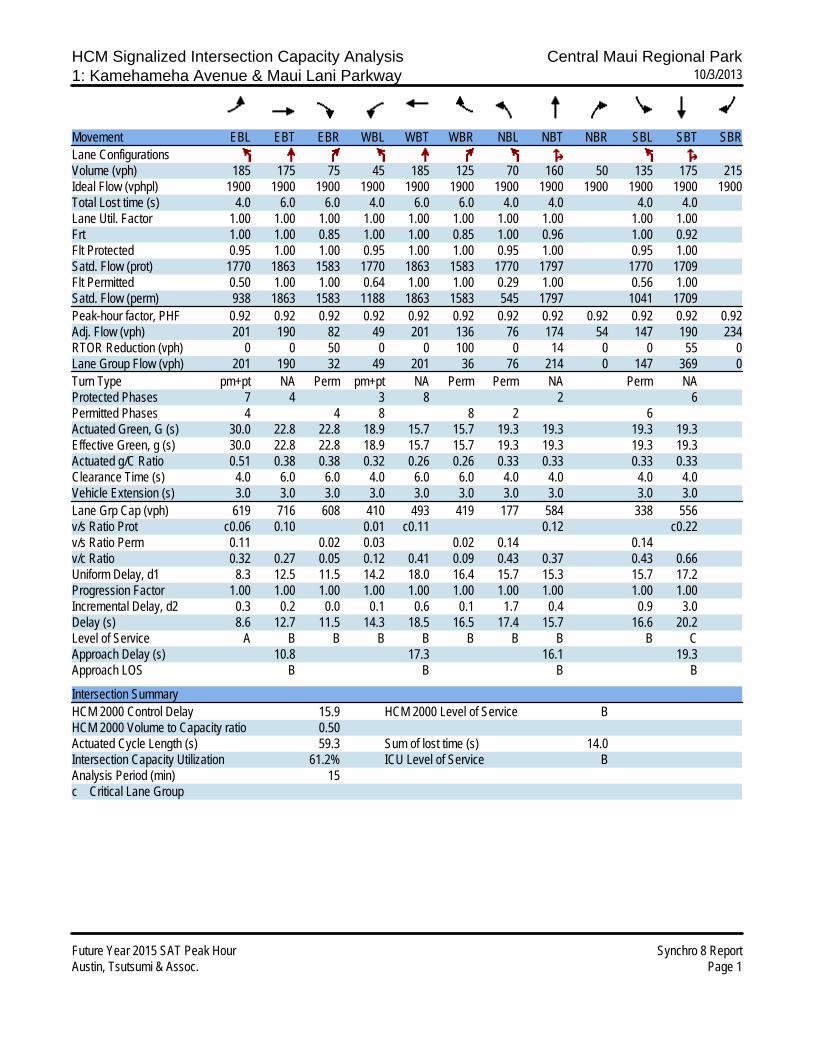
HCM Signalized Intersection Capacity Analysis Central Maui Regional Park1: Kamehameha Avenue & Maui Lani Parkway 10/3/2013
Future Year 2015 SAT Peak Hour Synchro 8 ReportAustin, Tsutsumi & Assoc. Page 1
Movement EBL EBT EBR WBL WBT WBR NBL NBT NBR SBL SBT SBRLane ConfigurationsVolume (vph) 185 175 75 45 185 125 70 160 50 135 175 215Ideal Flow (vphpl) 1900 1900 1900 1900 1900 1900 1900 1900 1900 1900 1900 1900Total Lost time (s) 4.0 6.0 6.0 4.0 6.0 6.0 4.0 4.0 4.0 4.0Lane Util. Factor 1.00 1.00 1.00 1.00 1.00 1.00 1.00 1.00 1.00 1.00Frt 1.00 1.00 0.85 1.00 1.00 0.85 1.00 0.96 1.00 0.92Flt Protected 0.95 1.00 1.00 0.95 1.00 1.00 0.95 1.00 0.95 1.00Satd. Flow (prot) 1770 1863 1583 1770 1863 1583 1770 1797 1770 1709Flt Permitted 0.50 1.00 1.00 0.64 1.00 1.00 0.29 1.00 0.56 1.00Satd. Flow (perm) 938 1863 1583 1188 1863 1583 545 1797 1041 1709Peak-hour factor, PHF 0.92 0.92 0.92 0.92 0.92 0.92 0.92 0.92 0.92 0.92 0.92 0.92Adj. Flow (vph) 201 190 82 49 201 136 76 174 54 147 190 234RTOR Reduction (vph) 0 0 50 0 0 100 0 14 0 0 55 0Lane Group Flow (vph) 201 190 32 49 201 36 76 214 0 147 369 0Turn Type pm+pt NA Perm pm+pt NA Perm Perm NA Perm NAProtected Phases 7 4 3 8 2 6Permitted Phases 4 4 8 8 2 6Actuated Green, G (s) 30.0 22.8 22.8 18.9 15.7 15.7 19.3 19.3 19.3 19.3Effective Green, g (s) 30.0 22.8 22.8 18.9 15.7 15.7 19.3 19.3 19.3 19.3Actuated g/C Ratio 0.51 0.38 0.38 0.32 0.26 0.26 0.33 0.33 0.33 0.33Clearance Time (s) 4.0 6.0 6.0 4.0 6.0 6.0 4.0 4.0 4.0 4.0Vehicle Extension (s) 3.0 3.0 3.0 3.0 3.0 3.0 3.0 3.0 3.0 3.0Lane Grp Cap (vph) 619 716 608 410 493 419 177 584 338 556v/s Ratio Prot c0.06 0.10 0.01 c0.11 0.12 c0.22v/s Ratio Perm 0.11 0.02 0.03 0.02 0.14 0.14v/c Ratio 0.32 0.27 0.05 0.12 0.41 0.09 0.43 0.37 0.43 0.66Uniform Delay, d1 8.3 12.5 11.5 14.2 18.0 16.4 15.7 15.3 15.7 17.2Progression Factor 1.00 1.00 1.00 1.00 1.00 1.00 1.00 1.00 1.00 1.00Incremental Delay, d2 0.3 0.2 0.0 0.1 0.6 0.1 1.7 0.4 0.9 3.0Delay (s) 8.6 12.7 11.5 14.3 18.5 16.5 17.4 15.7 16.6 20.2Level of Service A B B B B B B B B CApproach Delay (s) 10.8 17.3 16.1 19.3Approach LOS B B B B
Intersection SummaryHCM 2000 Control Delay 15.9 HCM 2000 Level of Service BHCM 2000 Volume to Capacity ratio 0.50Actuated Cycle Length (s) 59.3 Sum of lost time (s) 14.0Intersection Capacity Utilization 61.2% ICU Level of Service BAnalysis Period (min) 15c Critical Lane Group
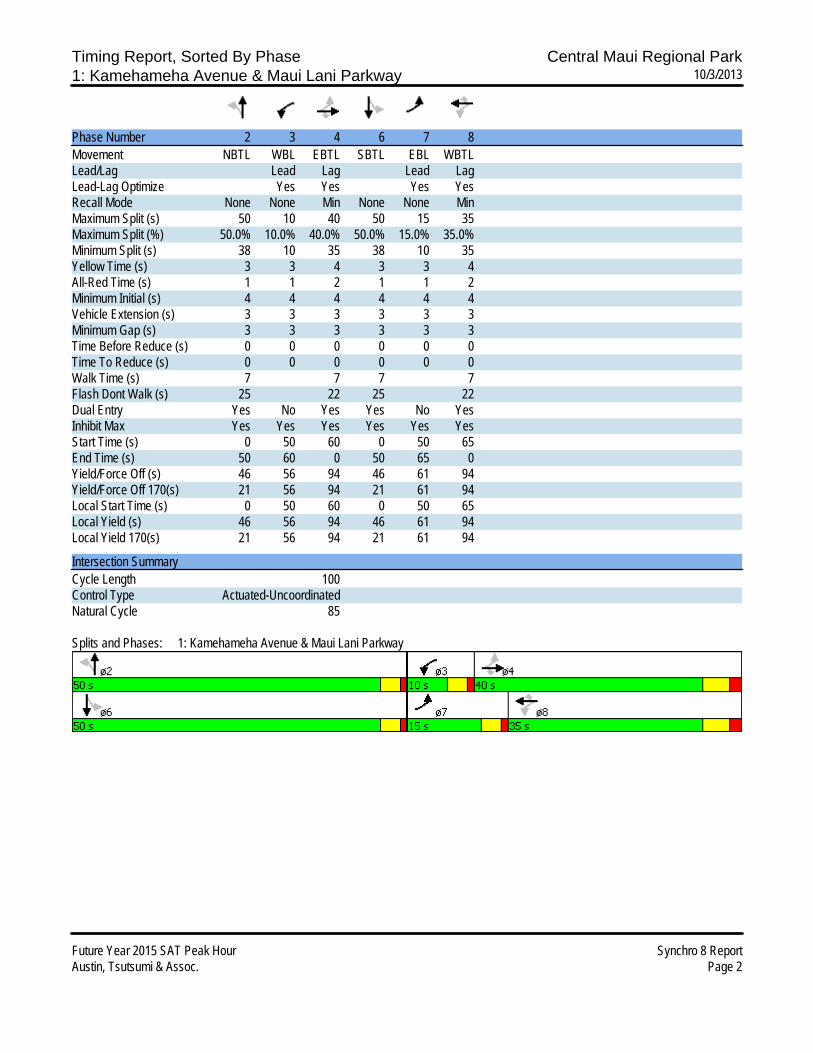
Timing Report, Sorted By Phase Central Maui Regional Park1: Kamehameha Avenue & Maui Lani Parkway 10/3/2013
Future Year 2015 SAT Peak Hour Synchro 8 ReportAustin, Tsutsumi & Assoc. Page 2
Phase Number 2 3 4 6 7 8Movement NBTL WBL EBTL SBTL EBL WBTLLead/Lag Lead Lag Lead LagLead-Lag Optimize Yes Yes Yes YesRecall Mode None None Min None None MinMaximum Split (s) 50 10 40 50 15 35Maximum Split (%) 50.0% 10.0% 40.0% 50.0% 15.0% 35.0%Minimum Split (s) 38 10 35 38 10 35Yellow Time (s) 3 3 4 3 3 4All-Red Time (s) 1 1 2 1 1 2Minimum Initial (s) 4 4 4 4 4 4Vehicle Extension (s) 3 3 3 3 3 3Minimum Gap (s) 3 3 3 3 3 3Time Before Reduce (s) 0 0 0 0 0 0Time To Reduce (s) 0 0 0 0 0 0Walk Time (s) 7 7 7 7Flash Dont Walk (s) 25 22 25 22Dual Entry Yes No Yes Yes No YesInhibit Max Yes Yes Yes Yes Yes YesStart Time (s) 0 50 60 0 50 65End Time (s) 50 60 0 50 65 0Yield/Force Off (s) 46 56 94 46 61 94Yield/Force Off 170(s) 21 56 94 21 61 94Local Start Time (s) 0 50 60 0 50 65Local Yield (s) 46 56 94 46 61 94Local Yield 170(s) 21 56 94 21 61 94
Intersection SummaryCycle Length 100Control Type Actuated-UncoordinatedNatural Cycle 85
Splits and Phases: 1: Kamehameha Avenue & Maui Lani Parkway

APPENDIX C
LEVEL OF SERVICE CALCULATIONS
• Future Year 2022 PM Peak
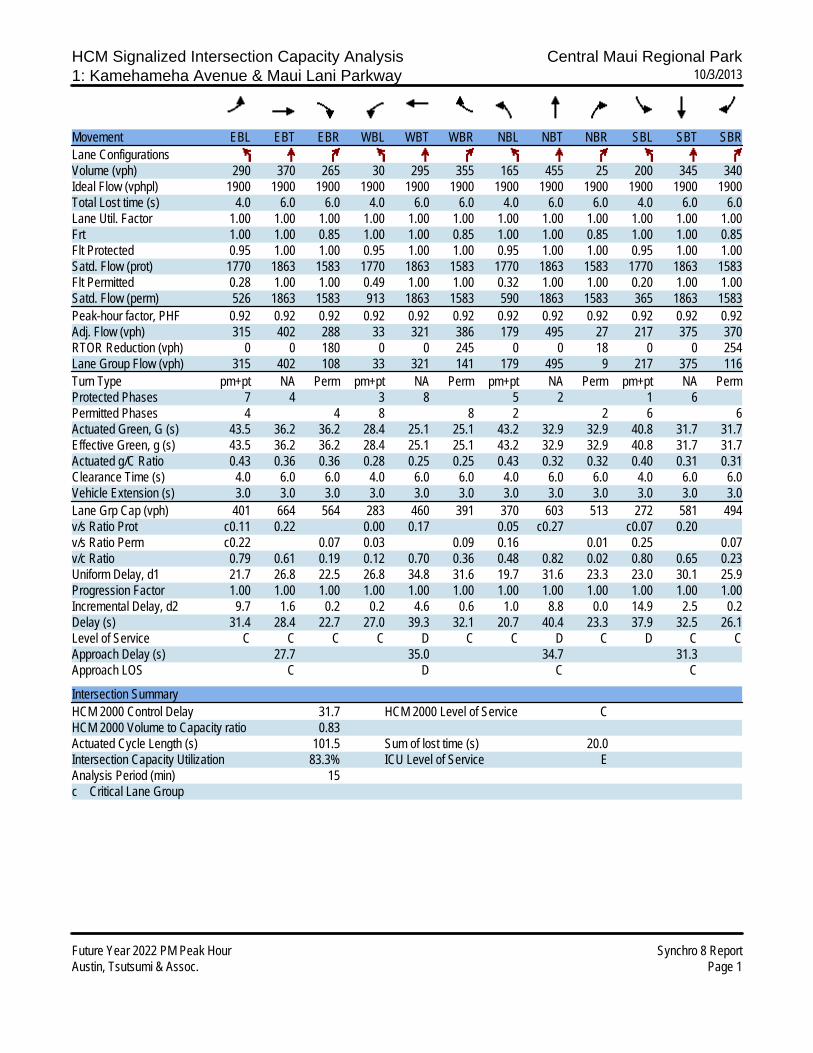
HCM Signalized Intersection Capacity Analysis Central Maui Regional Park1: Kamehameha Avenue & Maui Lani Parkway 10/3/2013
Future Year 2022 PM Peak Hour Synchro 8 ReportAustin, Tsutsumi & Assoc. Page 1
Movement EBL EBT EBR WBL WBT WBR NBL NBT NBR SBL SBT SBRLane ConfigurationsVolume (vph) 290 370 265 30 295 355 165 455 25 200 345 340Ideal Flow (vphpl) 1900 1900 1900 1900 1900 1900 1900 1900 1900 1900 1900 1900Total Lost time (s) 4.0 6.0 6.0 4.0 6.0 6.0 4.0 6.0 6.0 4.0 6.0 6.0Lane Util. Factor 1.00 1.00 1.00 1.00 1.00 1.00 1.00 1.00 1.00 1.00 1.00 1.00Frt 1.00 1.00 0.85 1.00 1.00 0.85 1.00 1.00 0.85 1.00 1.00 0.85Flt Protected 0.95 1.00 1.00 0.95 1.00 1.00 0.95 1.00 1.00 0.95 1.00 1.00Satd. Flow (prot) 1770 1863 1583 1770 1863 1583 1770 1863 1583 1770 1863 1583Flt Permitted 0.28 1.00 1.00 0.49 1.00 1.00 0.32 1.00 1.00 0.20 1.00 1.00Satd. Flow (perm) 526 1863 1583 913 1863 1583 590 1863 1583 365 1863 1583Peak-hour factor, PHF 0.92 0.92 0.92 0.92 0.92 0.92 0.92 0.92 0.92 0.92 0.92 0.92Adj. Flow (vph) 315 402 288 33 321 386 179 495 27 217 375 370RTOR Reduction (vph) 0 0 180 0 0 245 0 0 18 0 0 254Lane Group Flow (vph) 315 402 108 33 321 141 179 495 9 217 375 116Turn Type pm+pt NA Perm pm+pt NA Perm pm+pt NA Perm pm+pt NA PermProtected Phases 7 4 3 8 5 2 1 6Permitted Phases 4 4 8 8 2 2 6 6Actuated Green, G (s) 43.5 36.2 36.2 28.4 25.1 25.1 43.2 32.9 32.9 40.8 31.7 31.7Effective Green, g (s) 43.5 36.2 36.2 28.4 25.1 25.1 43.2 32.9 32.9 40.8 31.7 31.7Actuated g/C Ratio 0.43 0.36 0.36 0.28 0.25 0.25 0.43 0.32 0.32 0.40 0.31 0.31Clearance Time (s) 4.0 6.0 6.0 4.0 6.0 6.0 4.0 6.0 6.0 4.0 6.0 6.0Vehicle Extension (s) 3.0 3.0 3.0 3.0 3.0 3.0 3.0 3.0 3.0 3.0 3.0 3.0Lane Grp Cap (vph) 401 664 564 283 460 391 370 603 513 272 581 494v/s Ratio Prot c0.11 0.22 0.00 0.17 0.05 c0.27 c0.07 0.20v/s Ratio Perm c0.22 0.07 0.03 0.09 0.16 0.01 0.25 0.07v/c Ratio 0.79 0.61 0.19 0.12 0.70 0.36 0.48 0.82 0.02 0.80 0.65 0.23Uniform Delay, d1 21.7 26.8 22.5 26.8 34.8 31.6 19.7 31.6 23.3 23.0 30.1 25.9Progression Factor 1.00 1.00 1.00 1.00 1.00 1.00 1.00 1.00 1.00 1.00 1.00 1.00Incremental Delay, d2 9.7 1.6 0.2 0.2 4.6 0.6 1.0 8.8 0.0 14.9 2.5 0.2Delay (s) 31.4 28.4 22.7 27.0 39.3 32.1 20.7 40.4 23.3 37.9 32.5 26.1Level of Service C C C C D C C D C D C CApproach Delay (s) 27.7 35.0 34.7 31.3Approach LOS C D C C
Intersection SummaryHCM 2000 Control Delay 31.7 HCM 2000 Level of Service CHCM 2000 Volume to Capacity ratio 0.83Actuated Cycle Length (s) 101.5 Sum of lost time (s) 20.0Intersection Capacity Utilization 83.3% ICU Level of Service EAnalysis Period (min) 15c Critical Lane Group

Timing Report, Sorted By Phase Central Maui Regional Park1: Kamehameha Avenue & Maui Lani Parkway 10/3/2013
Future Year 2022 PM Peak Hour Synchro 8 ReportAustin, Tsutsumi & Assoc. Page 2
Phase Number 1 2 3 4 5 6 7 8Movement SBL NBTL WBL EBTL NBL SBTL EBL WBTLLead/Lag Lead Lag Lead Lag Lead Lag Lead LagLead-Lag Optimize Yes Yes Yes Yes Yes Yes Yes YesRecall Mode None None None Min None None None MinMaximum Split (s) 13 54 10 43 15 52 18 35Maximum Split (%) 10.8% 45.0% 8.3% 35.8% 12.5% 43.3% 15.0% 29.2%Minimum Split (s) 10 38 10 35 10 38 10 35Yellow Time (s) 3 4 3 4 3 4 3 4All-Red Time (s) 1 2 1 2 1 2 1 2Minimum Initial (s) 4 4 4 4 4 4 4 4Vehicle Extension (s) 3 3 3 3 3 3 3 3Minimum Gap (s) 3 3 3 3 3 3 3 3Time Before Reduce (s) 0 0 0 0 0 0 0 0Time To Reduce (s) 0 0 0 0 0 0 0 0Walk Time (s) 7 7 7 7Flash Dont Walk (s) 25 22 25 22Dual Entry No Yes No Yes No Yes No YesInhibit Max Yes Yes Yes Yes Yes Yes Yes YesStart Time (s) 0 13 67 77 0 15 67 85End Time (s) 13 67 77 0 15 67 85 0Yield/Force Off (s) 9 61 73 114 11 61 81 114Yield/Force Off 170(s) 9 36 73 114 11 36 81 114Local Start Time (s) 105 118 52 62 105 0 52 70Local Yield (s) 114 46 58 99 116 46 66 99Local Yield 170(s) 114 21 58 99 116 21 66 99
Intersection SummaryCycle Length 120Control Type Actuated-UncoordinatedNatural Cycle 95
Splits and Phases: 1: Kamehameha Avenue & Maui Lani Parkway
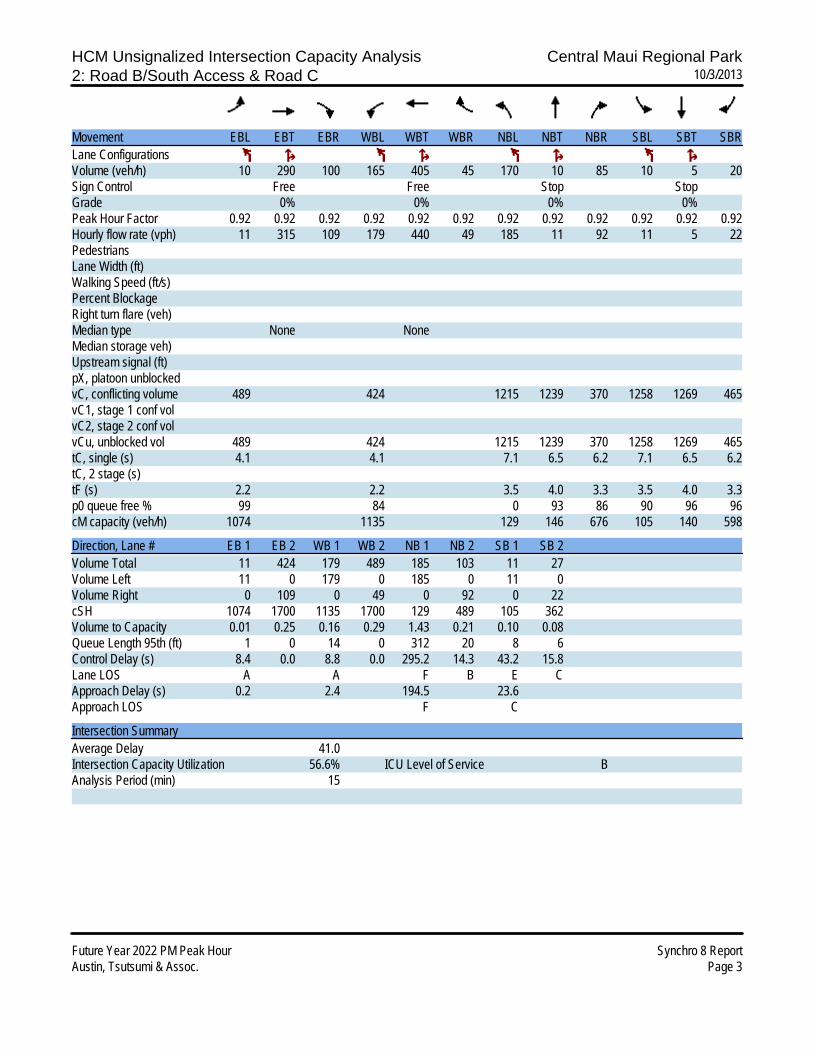
HCM Unsignalized Intersection Capacity Analysis Central Maui Regional Park2: Road B/South Access & Road C 10/3/2013
Future Year 2022 PM Peak Hour Synchro 8 ReportAustin, Tsutsumi & Assoc. Page 3
Movement EBL EBT EBR WBL WBT WBR NBL NBT NBR SBL SBT SBRLane ConfigurationsVolume (veh/h) 10 290 100 165 405 45 170 10 85 10 5 20Sign Control Free Free Stop StopGrade 0% 0% 0% 0%Peak Hour Factor 0.92 0.92 0.92 0.92 0.92 0.92 0.92 0.92 0.92 0.92 0.92 0.92Hourly flow rate (vph) 11 315 109 179 440 49 185 11 92 11 5 22PedestriansLane Width (ft)Walking Speed (ft/s)Percent BlockageRight turn flare (veh)Median type None NoneMedian storage veh)Upstream signal (ft)pX, platoon unblockedvC, conflicting volume 489 424 1215 1239 370 1258 1269 465vC1, stage 1 conf volvC2, stage 2 conf volvCu, unblocked vol 489 424 1215 1239 370 1258 1269 465tC, single (s) 4.1 4.1 7.1 6.5 6.2 7.1 6.5 6.2tC, 2 stage (s)tF (s) 2.2 2.2 3.5 4.0 3.3 3.5 4.0 3.3p0 queue free % 99 84 0 93 86 90 96 96cM capacity (veh/h) 1074 1135 129 146 676 105 140 598
Direction, Lane # EB 1 EB 2 WB 1 WB 2 NB 1 NB 2 SB 1 SB 2Volume Total 11 424 179 489 185 103 11 27Volume Left 11 0 179 0 185 0 11 0Volume Right 0 109 0 49 0 92 0 22cSH 1074 1700 1135 1700 129 489 105 362Volume to Capacity 0.01 0.25 0.16 0.29 1.43 0.21 0.10 0.08Queue Length 95th (ft) 1 0 14 0 312 20 8 6Control Delay (s) 8.4 0.0 8.8 0.0 295.2 14.3 43.2 15.8Lane LOS A A F B E CApproach Delay (s) 0.2 2.4 194.5 23.6Approach LOS F C
Intersection SummaryAverage Delay 41.0Intersection Capacity Utilization 56.6% ICU Level of Service BAnalysis Period (min) 15

HCM Unsignalized Intersection Capacity Analysis Central Maui Regional Park3: Road C & SW Access 10/3/2013
Future Year 2022 PM Peak Hour Synchro 8 ReportAustin, Tsutsumi & Assoc. Page 4
Movement EBL EBT WBT WBR SBL SBRLane ConfigurationsVolume (veh/h) 60 385 565 30 15 30Sign Control Free Free StopGrade 0% 0% 0%Peak Hour Factor 0.92 0.92 0.92 0.92 0.92 0.92Hourly flow rate (vph) 65 418 614 33 16 33PedestriansLane Width (ft)Walking Speed (ft/s)Percent BlockageRight turn flare (veh)Median type None NoneMedian storage veh)Upstream signal (ft)pX, platoon unblockedvC, conflicting volume 647 1179 630vC1, stage 1 conf volvC2, stage 2 conf volvCu, unblocked vol 647 1179 630tC, single (s) 4.1 6.4 6.2tC, 2 stage (s)tF (s) 2.2 3.5 3.3p0 queue free % 93 92 93cM capacity (veh/h) 939 196 481
Direction, Lane # EB 1 EB 2 WB 1 SB 1Volume Total 65 418 647 49Volume Left 65 0 0 16Volume Right 0 0 33 33cSH 939 1700 1700 324Volume to Capacity 0.07 0.25 0.38 0.15Queue Length 95th (ft) 6 0 0 13Control Delay (s) 9.1 0.0 0.0 18.1Lane LOS A CApproach Delay (s) 1.2 0.0 18.1Approach LOS C
Intersection SummaryAverage Delay 1.3Intersection Capacity Utilization 48.2% ICU Level of Service AAnalysis Period (min) 15

APPENDIX C
LEVEL OF SERVICE CALCULATIONS
• Future Year 2022 Saturday Peak
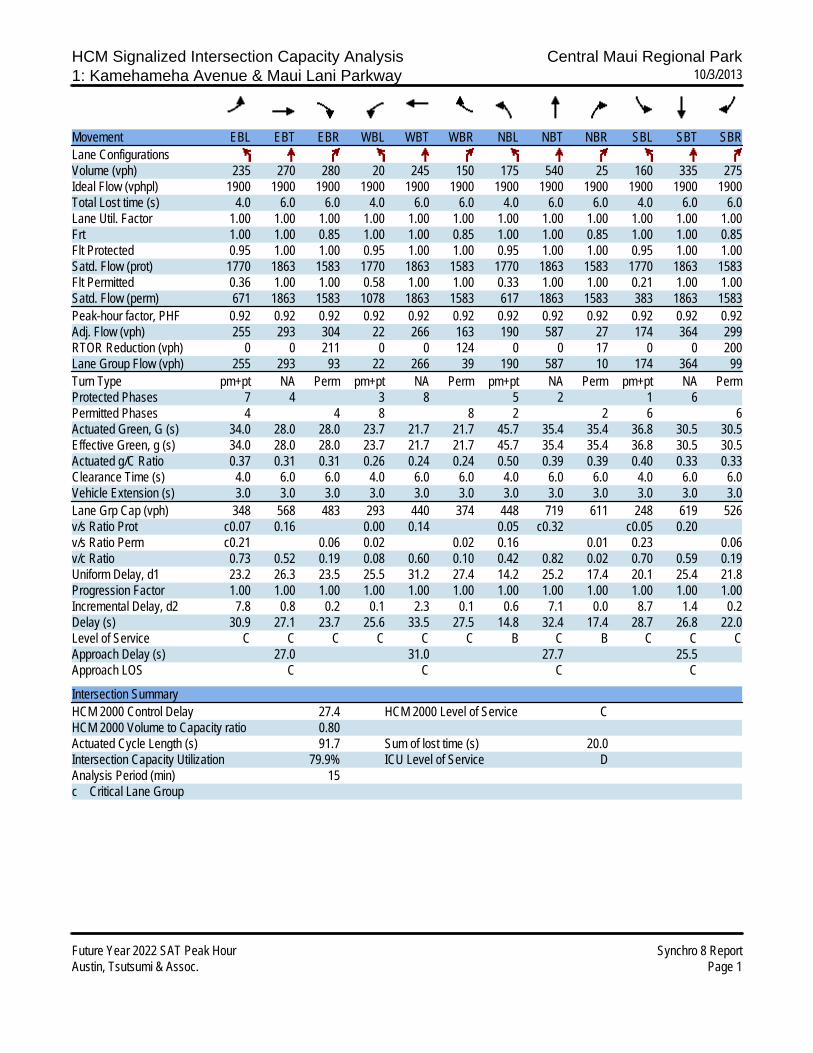
HCM Signalized Intersection Capacity Analysis Central Maui Regional Park1: Kamehameha Avenue & Maui Lani Parkway 10/3/2013
Future Year 2022 SAT Peak Hour Synchro 8 ReportAustin, Tsutsumi & Assoc. Page 1
Movement EBL EBT EBR WBL WBT WBR NBL NBT NBR SBL SBT SBRLane ConfigurationsVolume (vph) 235 270 280 20 245 150 175 540 25 160 335 275Ideal Flow (vphpl) 1900 1900 1900 1900 1900 1900 1900 1900 1900 1900 1900 1900Total Lost time (s) 4.0 6.0 6.0 4.0 6.0 6.0 4.0 6.0 6.0 4.0 6.0 6.0Lane Util. Factor 1.00 1.00 1.00 1.00 1.00 1.00 1.00 1.00 1.00 1.00 1.00 1.00Frt 1.00 1.00 0.85 1.00 1.00 0.85 1.00 1.00 0.85 1.00 1.00 0.85Flt Protected 0.95 1.00 1.00 0.95 1.00 1.00 0.95 1.00 1.00 0.95 1.00 1.00Satd. Flow (prot) 1770 1863 1583 1770 1863 1583 1770 1863 1583 1770 1863 1583Flt Permitted 0.36 1.00 1.00 0.58 1.00 1.00 0.33 1.00 1.00 0.21 1.00 1.00Satd. Flow (perm) 671 1863 1583 1078 1863 1583 617 1863 1583 383 1863 1583Peak-hour factor, PHF 0.92 0.92 0.92 0.92 0.92 0.92 0.92 0.92 0.92 0.92 0.92 0.92Adj. Flow (vph) 255 293 304 22 266 163 190 587 27 174 364 299RTOR Reduction (vph) 0 0 211 0 0 124 0 0 17 0 0 200Lane Group Flow (vph) 255 293 93 22 266 39 190 587 10 174 364 99Turn Type pm+pt NA Perm pm+pt NA Perm pm+pt NA Perm pm+pt NA PermProtected Phases 7 4 3 8 5 2 1 6Permitted Phases 4 4 8 8 2 2 6 6Actuated Green, G (s) 34.0 28.0 28.0 23.7 21.7 21.7 45.7 35.4 35.4 36.8 30.5 30.5Effective Green, g (s) 34.0 28.0 28.0 23.7 21.7 21.7 45.7 35.4 35.4 36.8 30.5 30.5Actuated g/C Ratio 0.37 0.31 0.31 0.26 0.24 0.24 0.50 0.39 0.39 0.40 0.33 0.33Clearance Time (s) 4.0 6.0 6.0 4.0 6.0 6.0 4.0 6.0 6.0 4.0 6.0 6.0Vehicle Extension (s) 3.0 3.0 3.0 3.0 3.0 3.0 3.0 3.0 3.0 3.0 3.0 3.0Lane Grp Cap (vph) 348 568 483 293 440 374 448 719 611 248 619 526v/s Ratio Prot c0.07 0.16 0.00 0.14 0.05 c0.32 c0.05 0.20v/s Ratio Perm c0.21 0.06 0.02 0.02 0.16 0.01 0.23 0.06v/c Ratio 0.73 0.52 0.19 0.08 0.60 0.10 0.42 0.82 0.02 0.70 0.59 0.19Uniform Delay, d1 23.2 26.3 23.5 25.5 31.2 27.4 14.2 25.2 17.4 20.1 25.4 21.8Progression Factor 1.00 1.00 1.00 1.00 1.00 1.00 1.00 1.00 1.00 1.00 1.00 1.00Incremental Delay, d2 7.8 0.8 0.2 0.1 2.3 0.1 0.6 7.1 0.0 8.7 1.4 0.2Delay (s) 30.9 27.1 23.7 25.6 33.5 27.5 14.8 32.4 17.4 28.7 26.8 22.0Level of Service C C C C C C B C B C C CApproach Delay (s) 27.0 31.0 27.7 25.5Approach LOS C C C C
Intersection SummaryHCM 2000 Control Delay 27.4 HCM 2000 Level of Service CHCM 2000 Volume to Capacity ratio 0.80Actuated Cycle Length (s) 91.7 Sum of lost time (s) 20.0Intersection Capacity Utilization 79.9% ICU Level of Service DAnalysis Period (min) 15c Critical Lane Group
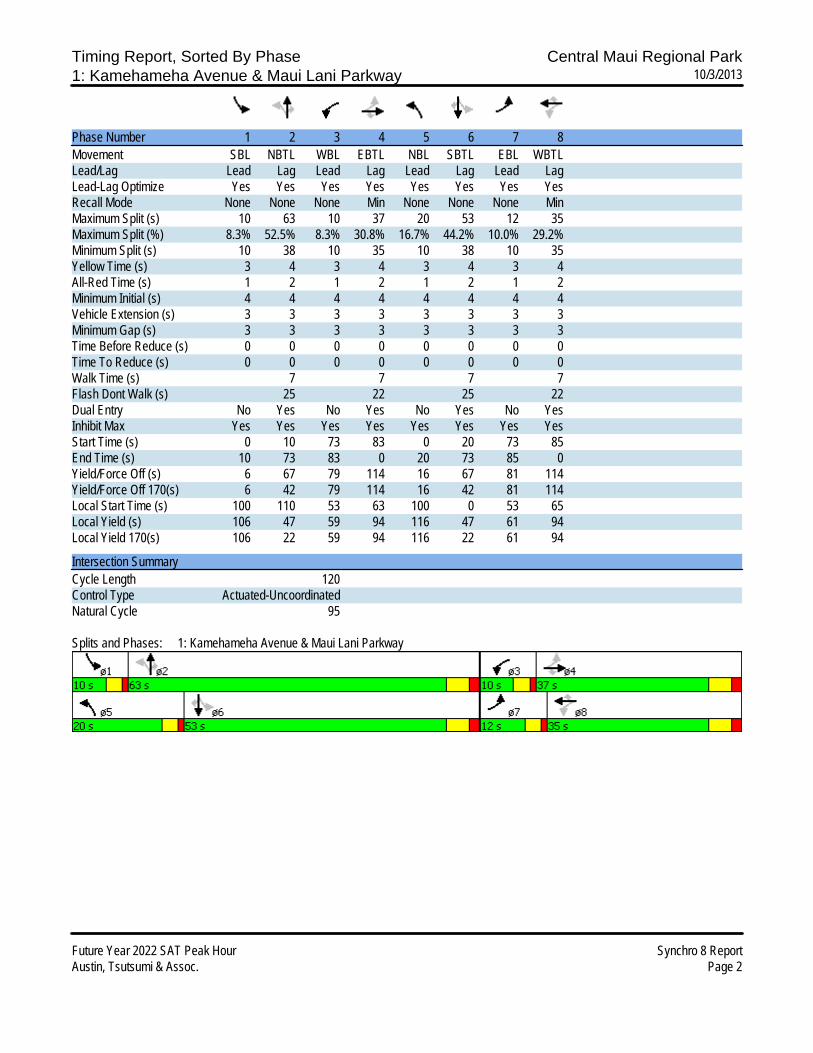
Timing Report, Sorted By Phase Central Maui Regional Park1: Kamehameha Avenue & Maui Lani Parkway 10/3/2013
Future Year 2022 SAT Peak Hour Synchro 8 ReportAustin, Tsutsumi & Assoc. Page 2
Phase Number 1 2 3 4 5 6 7 8Movement SBL NBTL WBL EBTL NBL SBTL EBL WBTLLead/Lag Lead Lag Lead Lag Lead Lag Lead LagLead-Lag Optimize Yes Yes Yes Yes Yes Yes Yes YesRecall Mode None None None Min None None None MinMaximum Split (s) 10 63 10 37 20 53 12 35Maximum Split (%) 8.3% 52.5% 8.3% 30.8% 16.7% 44.2% 10.0% 29.2%Minimum Split (s) 10 38 10 35 10 38 10 35Yellow Time (s) 3 4 3 4 3 4 3 4All-Red Time (s) 1 2 1 2 1 2 1 2Minimum Initial (s) 4 4 4 4 4 4 4 4Vehicle Extension (s) 3 3 3 3 3 3 3 3Minimum Gap (s) 3 3 3 3 3 3 3 3Time Before Reduce (s) 0 0 0 0 0 0 0 0Time To Reduce (s) 0 0 0 0 0 0 0 0Walk Time (s) 7 7 7 7Flash Dont Walk (s) 25 22 25 22Dual Entry No Yes No Yes No Yes No YesInhibit Max Yes Yes Yes Yes Yes Yes Yes YesStart Time (s) 0 10 73 83 0 20 73 85End Time (s) 10 73 83 0 20 73 85 0Yield/Force Off (s) 6 67 79 114 16 67 81 114Yield/Force Off 170(s) 6 42 79 114 16 42 81 114Local Start Time (s) 100 110 53 63 100 0 53 65Local Yield (s) 106 47 59 94 116 47 61 94Local Yield 170(s) 106 22 59 94 116 22 61 94
Intersection SummaryCycle Length 120Control Type Actuated-UncoordinatedNatural Cycle 95
Splits and Phases: 1: Kamehameha Avenue & Maui Lani Parkway
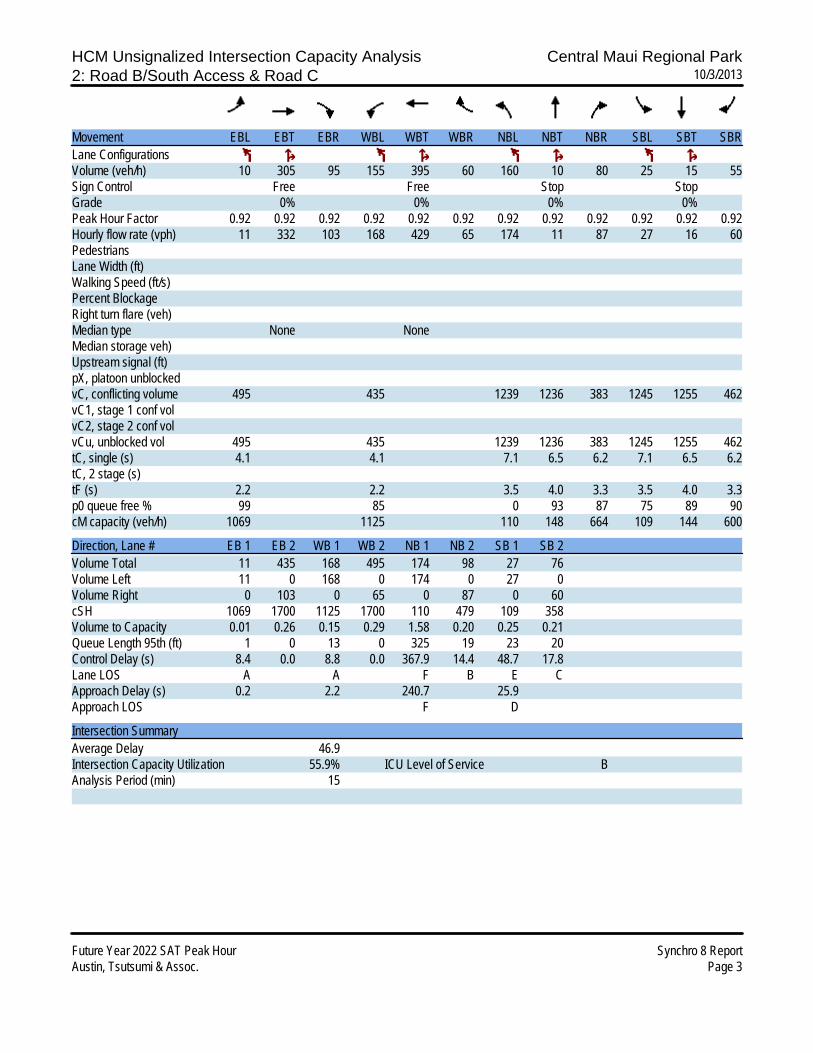
HCM Unsignalized Intersection Capacity Analysis Central Maui Regional Park2: Road B/South Access & Road C 10/3/2013
Future Year 2022 SAT Peak Hour Synchro 8 ReportAustin, Tsutsumi & Assoc. Page 3
Movement EBL EBT EBR WBL WBT WBR NBL NBT NBR SBL SBT SBRLane ConfigurationsVolume (veh/h) 10 305 95 155 395 60 160 10 80 25 15 55Sign Control Free Free Stop StopGrade 0% 0% 0% 0%Peak Hour Factor 0.92 0.92 0.92 0.92 0.92 0.92 0.92 0.92 0.92 0.92 0.92 0.92Hourly flow rate (vph) 11 332 103 168 429 65 174 11 87 27 16 60PedestriansLane Width (ft)Walking Speed (ft/s)Percent BlockageRight turn flare (veh)Median type None NoneMedian storage veh)Upstream signal (ft)pX, platoon unblockedvC, conflicting volume 495 435 1239 1236 383 1245 1255 462vC1, stage 1 conf volvC2, stage 2 conf volvCu, unblocked vol 495 435 1239 1236 383 1245 1255 462tC, single (s) 4.1 4.1 7.1 6.5 6.2 7.1 6.5 6.2tC, 2 stage (s)tF (s) 2.2 2.2 3.5 4.0 3.3 3.5 4.0 3.3p0 queue free % 99 85 0 93 87 75 89 90cM capacity (veh/h) 1069 1125 110 148 664 109 144 600
Direction, Lane # EB 1 EB 2 WB 1 WB 2 NB 1 NB 2 SB 1 SB 2Volume Total 11 435 168 495 174 98 27 76Volume Left 11 0 168 0 174 0 27 0Volume Right 0 103 0 65 0 87 0 60cSH 1069 1700 1125 1700 110 479 109 358Volume to Capacity 0.01 0.26 0.15 0.29 1.58 0.20 0.25 0.21Queue Length 95th (ft) 1 0 13 0 325 19 23 20Control Delay (s) 8.4 0.0 8.8 0.0 367.9 14.4 48.7 17.8Lane LOS A A F B E CApproach Delay (s) 0.2 2.2 240.7 25.9Approach LOS F D
Intersection SummaryAverage Delay 46.9Intersection Capacity Utilization 55.9% ICU Level of Service BAnalysis Period (min) 15
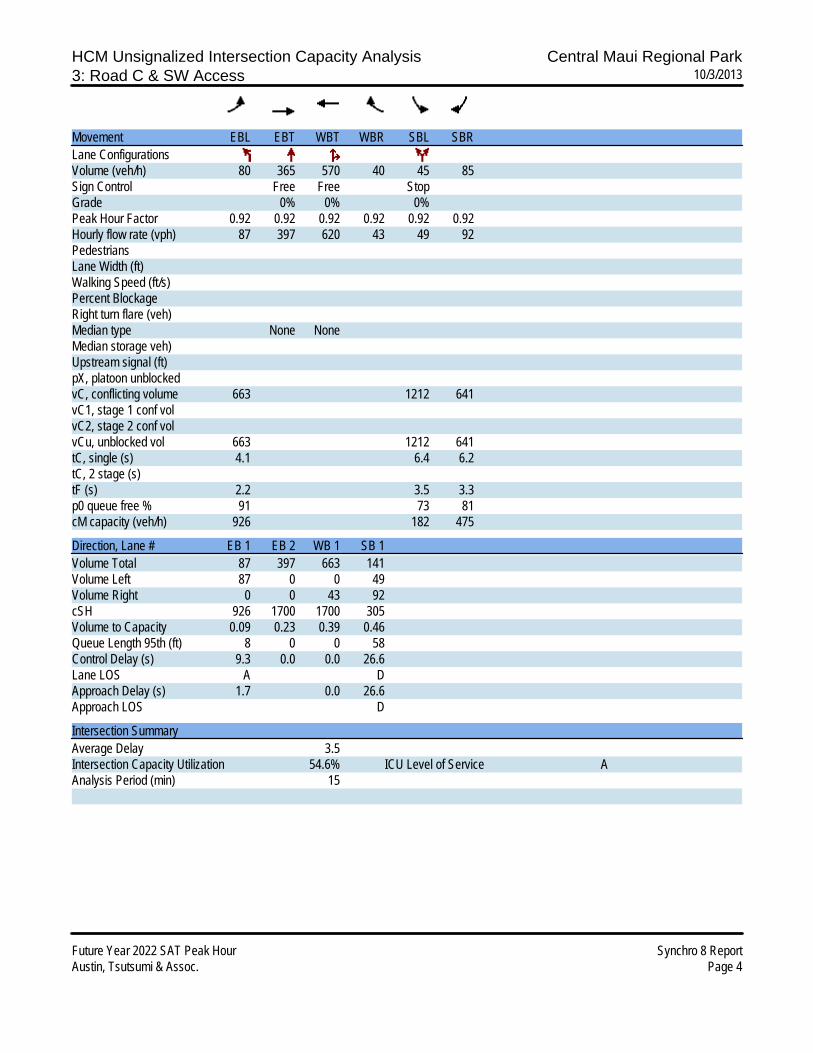
HCM Unsignalized Intersection Capacity Analysis Central Maui Regional Park3: Road C & SW Access 10/3/2013
Future Year 2022 SAT Peak Hour Synchro 8 ReportAustin, Tsutsumi & Assoc. Page 4
Movement EBL EBT WBT WBR SBL SBRLane ConfigurationsVolume (veh/h) 80 365 570 40 45 85Sign Control Free Free StopGrade 0% 0% 0%Peak Hour Factor 0.92 0.92 0.92 0.92 0.92 0.92Hourly flow rate (vph) 87 397 620 43 49 92PedestriansLane Width (ft)Walking Speed (ft/s)Percent BlockageRight turn flare (veh)Median type None NoneMedian storage veh)Upstream signal (ft)pX, platoon unblockedvC, conflicting volume 663 1212 641vC1, stage 1 conf volvC2, stage 2 conf volvCu, unblocked vol 663 1212 641tC, single (s) 4.1 6.4 6.2tC, 2 stage (s)tF (s) 2.2 3.5 3.3p0 queue free % 91 73 81cM capacity (veh/h) 926 182 475
Direction, Lane # EB 1 EB 2 WB 1 SB 1Volume Total 87 397 663 141Volume Left 87 0 0 49Volume Right 0 0 43 92cSH 926 1700 1700 305Volume to Capacity 0.09 0.23 0.39 0.46Queue Length 95th (ft) 8 0 0 58Control Delay (s) 9.3 0.0 0.0 26.6Lane LOS A DApproach Delay (s) 1.7 0.0 26.6Approach LOS D
Intersection SummaryAverage Delay 3.5Intersection Capacity Utilization 54.6% ICU Level of Service AAnalysis Period (min) 15

APPENDIX D
TRAFFIC SIGNAL WARRANT
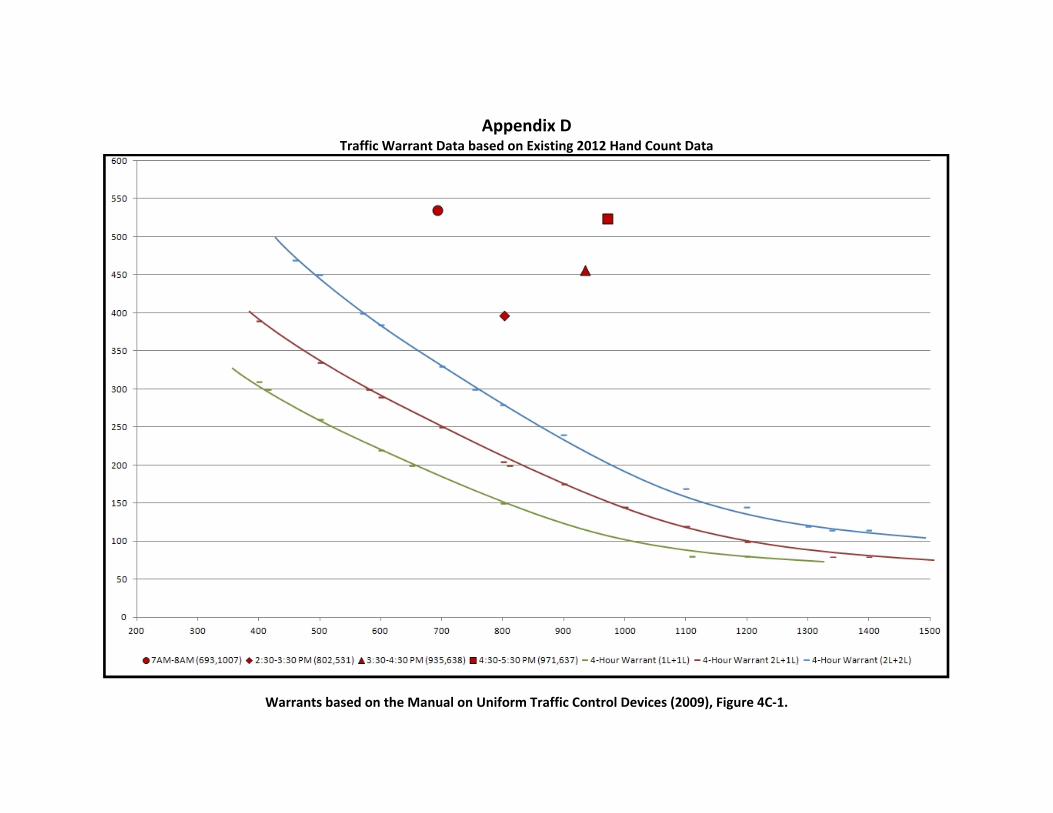
Appendix D
Traffic Warrant Data based on Existing 2012 Hand Count Data
Warrants based on the Manual on Uniform Traffic Control Devices (2009), Figure 4C‐1.
APPENDIX E
SUPPLEMENTAL SATURDAY PEAK TRIP GENERATION
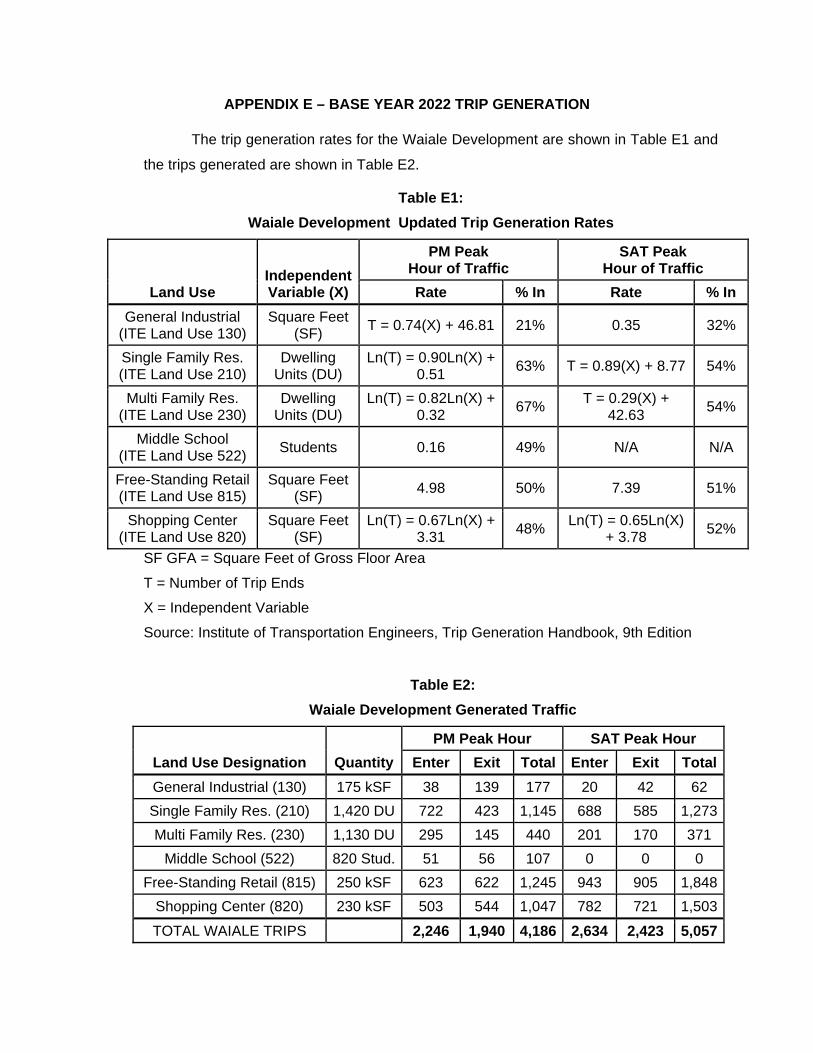
APPENDIX E – BASE YEAR 2022 TRIP GENERATION
The trip generation rates for the Waiale Development are shown in Table E1 and
the trips generated are shown in Table E2.
Table E1:
Waiale Development Updated Trip Generation Rates
Land Use Independent Variable (X)
PM Peak Hour of Traffic
SAT Peak Hour of Traffic
Rate % In Rate % In
General Industrial (ITE Land Use 130)
Square Feet (SF)
T = 0.74(X) + 46.81 21% 0.35 32%
Single Family Res. (ITE Land Use 210)
Dwelling Units (DU)
Ln(T) = 0.90Ln(X) + 0.51
63% T = 0.89(X) + 8.77 54%
Multi Family Res. (ITE Land Use 230)
Dwelling Units (DU)
Ln(T) = 0.82Ln(X) + 0.32
67% T = 0.29(X) +
42.63 54%
Middle School (ITE Land Use 522)
Students 0.16 49% N/A N/A
Free-Standing Retail (ITE Land Use 815)
Square Feet (SF)
4.98 50% 7.39 51%
Shopping Center (ITE Land Use 820)
Square Feet (SF)
Ln(T) = 0.67Ln(X) + 3.31
48% Ln(T) = 0.65Ln(X)
+ 3.78 52%
SF GFA = Square Feet of Gross Floor Area
T = Number of Trip Ends
X = Independent Variable
Source: Institute of Transportation Engineers, Trip Generation Handbook, 9th Edition
Table E2:
Waiale Development Generated Traffic
Land Use Designation Quantity
PM Peak Hour SAT Peak Hour
Enter Exit Total Enter Exit Total
General Industrial (130) 175 kSF 38 139 177 20 42 62
Single Family Res. (210) 1,420 DU 722 423 1,145 688 585 1,273
Multi Family Res. (230) 1,130 DU 295 145 440 201 170 371
Middle School (522) 820 Stud. 51 56 107 0 0 0
Free-Standing Retail (815) 250 kSF 623 622 1,245 943 905 1,848
Shopping Center (820) 230 kSF 503 544 1,047 782 721 1,503
TOTAL WAIALE TRIPS 2,246 1,940 4,186 2,634 2,423 5,057
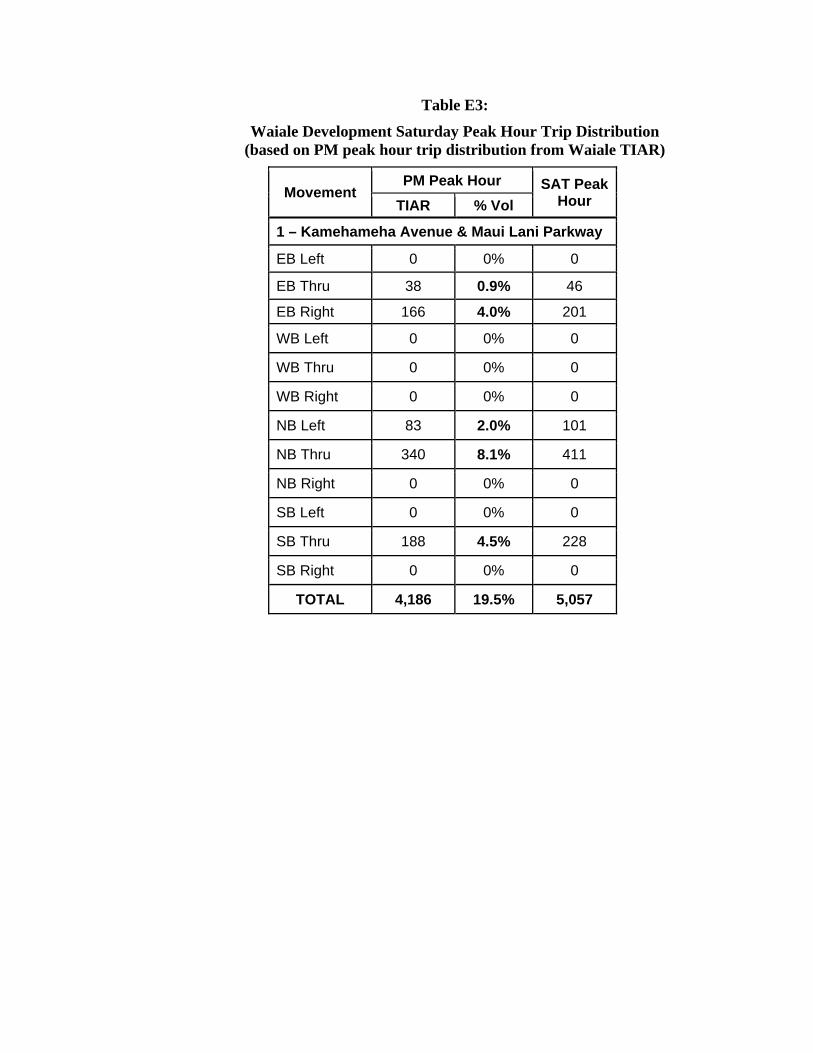
Table E3:
Waiale Development Saturday Peak Hour Trip Distribution (based on PM peak hour trip distribution from Waiale TIAR)
Movement PM Peak Hour SAT Peak
Hour TIAR % Vol
1 – Kamehameha Avenue & Maui Lani Parkway
EB Left 0 0% 0
EB Thru 38 0.9% 46
EB Right 166 4.0% 201
WB Left 0 0% 0
WB Thru 0 0% 0
WB Right 0 0% 0
NB Left 83 2.0% 101
NB Thru 340 8.1% 411
NB Right 0 0% 0
SB Left 0 0% 0
SB Thru 188 4.5% 228
SB Right 0 0% 0
TOTAL 4,186 19.5% 5,057