Embed Size (px)
Citation preview
Traffic Impact Study forWinCo Foods Expansion
in the
City of Chico
August 13, 2009

Traffic Impact Study for WinCo Expansion in the City of Chico August 13, 2009 Page i
Table of Contents
Page
Executive Summary .......................................................................................................................................... 1
Introduction and Study Parameters .............................................................................................................. 2
Baseline Conditions .......................................................................................................................................... 6
Plus Project Conditions ................................................................................................................................ 11
Conclusions and Recommendations ......................................................................................................... 17
Study Participants and References ............................................................................................................. 18
Figures
1 Lane Configurations ........................................................................................................................................... 3 2 Existing Traffic Volumes .................................................................................................................................... 7 3 Future Traffic Volumes .................................................................................................................................... 10 4 Site Plan ............................................................................................................................................................... 12 5 Project Traffic Volumes ................................................................................................................................... 14
Tables
1 Intersection Level of Service Criteria ............................................................................................................ 4 2 Summary of Existing Peak Hour Intersection Level of Service Calculations ........................................ 8 3 Summary of Future PM Peak Hour Level of Service Calculations .......................................................... 9 4 Trip Generation Summary .............................................................................................................................. 11 5 Trip Distribution Assumptions ...................................................................................................................... 13
Appendices
A Intersection Level of Service Calculations B Signal Warrant Calculations

Traffic Impact Study for WinCo Foods Expansion in the City of Chico August 13, 2009 Page 1
Executive Summary
This report presents an analysis of the anticipated traffic impacts that would be associated with the expansion of the WinCo Grocery store located northeast of the intersection of Forest Avenue/East 20th Street in the City of Chico. The proposed project would expand the existing 79,324 square foot store by 10,667 square feet on the west side of the existing building. Access to the project is proposed via three existing driveways for the WinCo Grocery Store. The traffic study was completed in accordance with the criteria established by the City of Chico, and is consistent with standard traffic engineering techniques. Operating conditions were evaluated during both the weekday a.m. and p.m. peak hours under Existing Conditions, Existing plus Project Conditions, Future Conditions, and Future plus Project Conditions.
Operation was evaluated at the intersections of Forest Avenue/WinCo Access-Mall Access, Forest Avenue/East 20th Street, East 20th Street/WinCo Access, and East 20th Street/Huntington Drive. The study intersections are currently operating acceptably at LOS C or better during both peak periods.
The project is expected to produce an average of 709 new trips daily, with 38 during the a.m. peak hour and 60 during the p.m. peak hour. The project is expected to have less-than-significant impacts on levels of service based on the applicable standards when added to both existing and future conditions. Though the City of Chico has no standards of significance for private street approaches, under Future conditions the side street approaches to Forest Avenue and East 20th Street are expected to operate at LOS F during the p.m. peak without and with the project.
Traffic signal warrants were reviewed to determine the potential need for a signal at Forest Avenue/ WinCo Access-Mall Access. Peak hour and eight hour left-turn and through volume warrants were not met.
Transit and bicycle facilities located in the vicinity of the project are expected to accommodate customers and employees to and from the project site. Upon build out of the project, the existing bicycle racks should be relocated to a centralized area to promote bicycling. Pedestrian facilities exist in the general vicinity of the project, but are discontinuous and lacking at the intersection of Forest Avenue/WinCo Access-Mall Access. Pedestrian upgrades should be implemented at this location including sidewalks/walkways along the north and south sides of the entrance together with a marked crosswalk with median protection at the entrance. Restriping of the centerline to be yellow, as is standard, is also recommended.
Traffic Impact Study for WinCo Foods Expansion in the City of Chico August 13, 2009 Page 2
Introduction and Study Parameters
Introduction
This report presents an analysis of the potential traffic impacts that would be associated with the proposed expansion of the WinCo Foods Store located on the northeast corner of East 20th Street/ Forest Avenue in the City of Chico. The traffic study was completed in accordance with the criteria established by the City of Chico, and is consistent with standard traffic engineering techniques.
Prelude
The purpose of a traffic impact study is to provide City staff and policy makers with data that they can use to make an informed decision regarding the potential traffic impacts of a proposed project, and any associated improvements that would be required in order to mitigate these impacts to a level of insignificance as defined by the City’s General Plan or other policies. Traffic impacts are typically evaluated by determining the number of new trips that the proposed use would be expected to generate, distributing these trips to the surrounding street system based on existing travel patterns or anticipated travel patterns specific to the proposed project, then analyzing the impact the new traffic would be expected to have on critical intersections or roadway segments.
Project Profile
The proposed project consists of expanding the western side of the existing WinCo Foods Store by 10,667 square feet. The project site at East 20th Street and Forest Avenue is shown in Figure 1. All access points would remain the same.
Study Area and Periods
The study area consists of the following intersections and driveways:
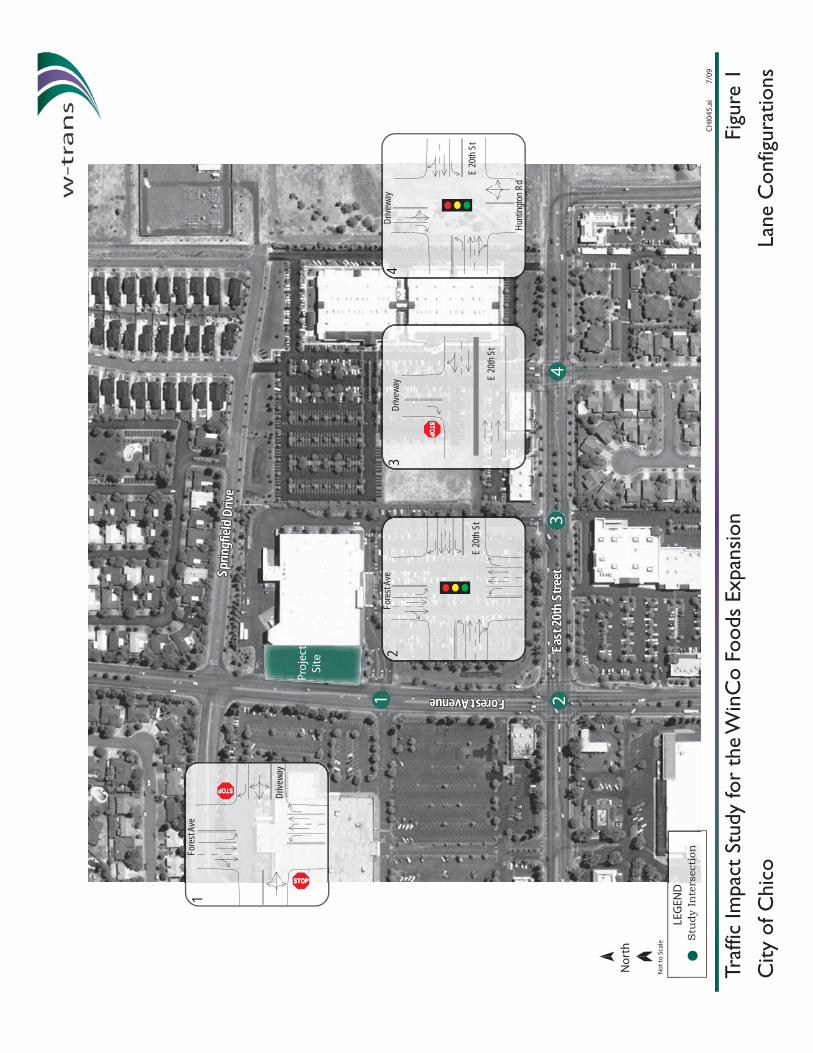
1. Forest Avenue/WinCo Access-Mall Access 2. Forest Avenue/East 20th Street 3. East 20th Street/WinCo Access 4. East 20th Street/Huntington Drive
Operating conditions during the a.m. and p.m. peak periods were evaluated to capture the highest potential impacts for the proposed project as well as the highest volumes on the local transportation network. The morning peak hour occurs between 7:00 and 9:00 a.m. and reflects conditions during the home to work or school commute, while the p.m. peak hour occurs between 4:00 and 6:00 p.m. and typically reflects the highest level of congestion during the homeward bound commute.
Intersection Level of Service Methodologies
Level of Service (LOS) is used to rank traffic operation on various types of facilities based on traffic volumes and roadway capacity using a series of letter designations ranging from A to F. Generally, Level of Service A represents free flow conditions and Level of Service F represents forced flow or breakdown conditions. A unit of measure that indicates a level of delay generally accompanies the LOS designation.
The study intersections were analyzed using methodologies published in the Highway Capacity Manual (HCM), Transportation Research Board, 2000. This source contains methodologies for various types of intersection control, all of which are related to a measurement of delay in average number of seconds per vehicle.
Sprin
gfiel
d Dr
iveSp
ringf
ield
Drive
East
20th
Stre
etEa
st 20
th S
treet
Forest Avenue Forest Avenue
Pro
ject
Si
te
1 23
4
Forest Avenue
East
20th
Stre
etSprin
gfiel
d Dr
ive
Lane
Con
figur
atio
nsFi
gure
1C
HI0
45.a
i 7/
09
Traf
fic Im
pact
Stu
dy fo
r th
e W
inC
o Fo
ods
Expa
nsio
nC
ity o
f Chi
co
LEG
END
Stu
dy I
nte
rsec
tion
No
rth
No
t to
Sca
le
Drive
way
Fore
st Av
e1
E 20
th St
Fore
st Av
e2
3Dr
ivewa
y E 20
th St
4Dr
ivewa
y
Hunti
ngton
Rd
E 20
th St
Traffic Impact Study for WinCo Foods Expansion in the City of Chico August 13, 2009 Page 4
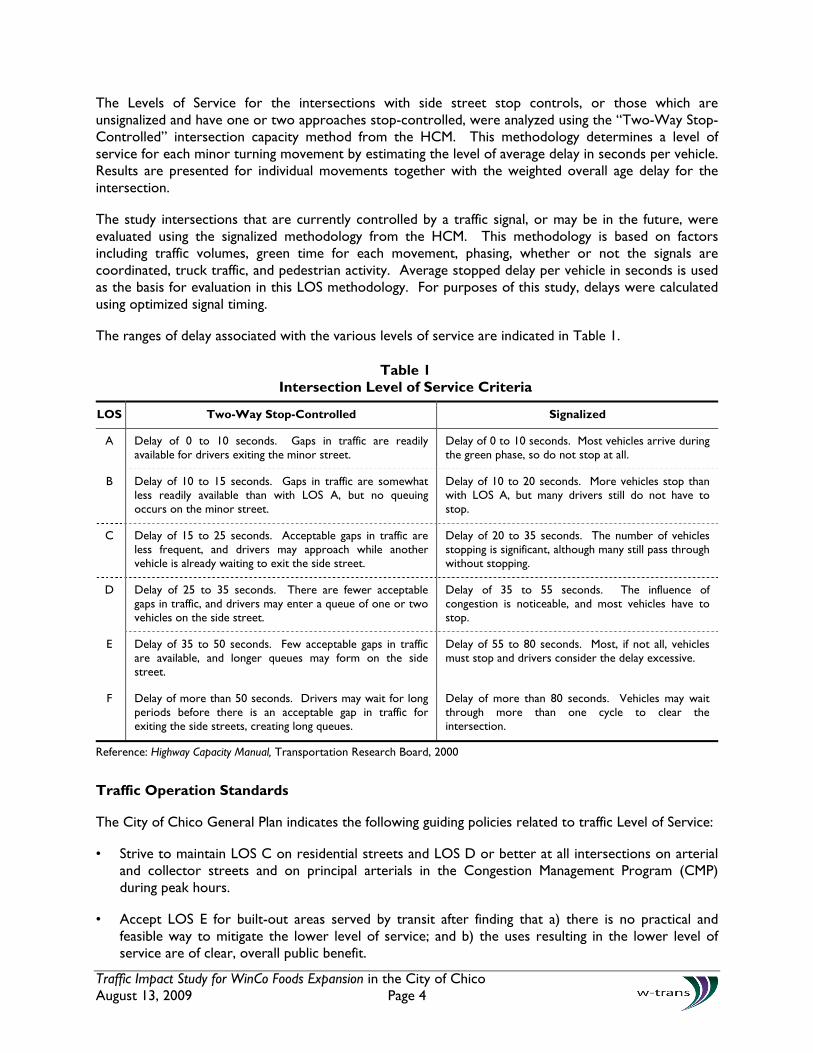
The Levels of Service for the intersections with side street stop controls, or those which are unsignalized and have one or two approaches stop-controlled, were analyzed using the “Two-Way Stop-Controlled” intersection capacity method from the HCM. This methodology determines a level of service for each minor turning movement by estimating the level of average delay in seconds per vehicle. Results are presented for individual movements together with the weighted overall age delay for the intersection.
The study intersections that are currently controlled by a traffic signal, or may be in the future, were evaluated using the signalized methodology from the HCM. This methodology is based on factors including traffic volumes, green time for each movement, phasing, whether or not the signals are coordinated, truck traffic, and pedestrian activity. Average stopped delay per vehicle in seconds is used as the basis for evaluation in this LOS methodology. For purposes of this study, delays were calculated using optimized signal timing.
The ranges of delay associated with the various levels of service are indicated in Table 1.
Table 1 Intersection Level of Service Criteria
LOS Two-Way Stop-Controlled Signalized
A Delay of 0 to 10 seconds. Gaps in traffic are readily available for drivers exiting the minor street.
Delay of 0 to 10 seconds. Most vehicles arrive during the green phase, so do not stop at all.
B Delay of 10 to 15 seconds. Gaps in traffic are somewhat less readily available than with LOS A, but no queuing occurs on the minor street.
Delay of 10 to 20 seconds. More vehicles stop than with LOS A, but many drivers still do not have to stop.
C Delay of 15 to 25 seconds. Acceptable gaps in traffic are less frequent, and drivers may approach while another vehicle is already waiting to exit the side street.
Delay of 20 to 35 seconds. The number of vehicles stopping is significant, although many still pass through without stopping.
D Delay of 25 to 35 seconds. There are fewer acceptable gaps in traffic, and drivers may enter a queue of one or two vehicles on the side street.
Delay of 35 to 55 seconds. The influence of congestion is noticeable, and most vehicles have to stop.
E Delay of 35 to 50 seconds. Few acceptable gaps in traffic are available, and longer queues may form on the side street.
Delay of 55 to 80 seconds. Most, if not all, vehicles must stop and drivers consider the delay excessive.
F Delay of more than 50 seconds. Drivers may wait for long periods before there is an acceptable gap in traffic for exiting the side streets, creating long queues.
Delay of more than 80 seconds. Vehicles may wait through more than one cycle to clear the intersection.
Reference: Highway Capacity Manual, Transportation Research Board, 2000
Traffic Operation Standards
The City of Chico General Plan indicates the following guiding policies related to traffic Level of Service:
• Strive to maintain LOS C on residential streets and LOS D or better at all intersections on arterial and collector streets and on principal arterials in the Congestion Management Program (CMP) during peak hours.
• Accept LOS E for built-out areas served by transit after finding that a) there is no practical and feasible way to mitigate the lower level of service; and b) the uses resulting in the lower level of service are of clear, overall public benefit.
Traffic Impact Study for WinCo Foods Expansion in the City of Chico August 13, 2009 Page 5
The side street approaches to Forest Avenue and East 20th Street from WinCo and the Mall are private streets for which there are no designated standards of significance. The City of Chico has established that the City's LOS standards should not be applied to private intersections or private driveway approaches to City arterials. These intersections were evaluated based on traffic issues related to safety, sight distance, adherence to design standards, turn lane warrants, conflicts with adjacent intersections, and/or potential for vehicle conflicts. Impacts related to congestion were only considered if they resulted in impacts to adjacent intersections or traffic safety.
Traffic Impact Study for WinCo Foods Expansion in the City of Chico August 13, 2009 Page 6
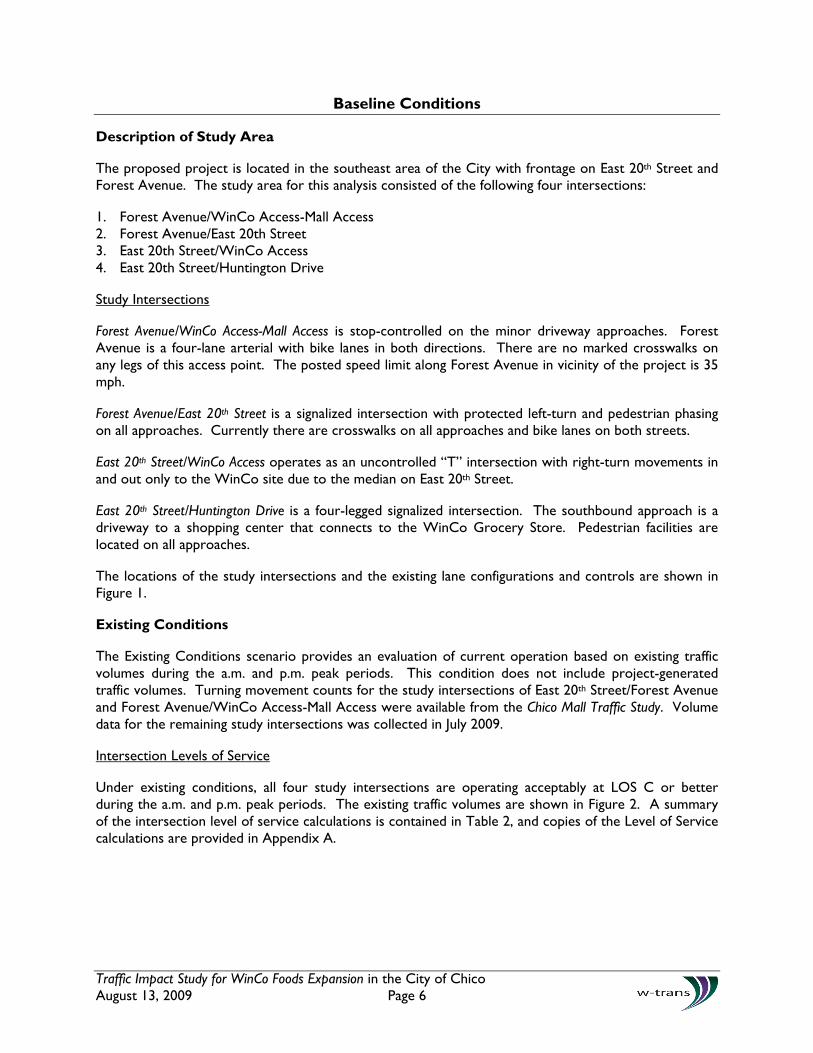
Baseline Conditions
Description of Study Area
The proposed project is located in the southeast area of the City with frontage on East 20th Street and Forest Avenue. The study area for this analysis consisted of the following four intersections:
1. Forest Avenue/WinCo Access-Mall Access 2. Forest Avenue/East 20th Street 3. East 20th Street/WinCo Access 4. East 20th Street/Huntington Drive
Study Intersections
Forest Avenue/WinCo Access-Mall Access is stop-controlled on the minor driveway approaches. Forest Avenue is a four-lane arterial with bike lanes in both directions. There are no marked crosswalks on any legs of this access point. The posted speed limit along Forest Avenue in vicinity of the project is 35 mph.
Forest Avenue/East 20th Street is a signalized intersection with protected left-turn and pedestrian phasing on all approaches. Currently there are crosswalks on all approaches and bike lanes on both streets.
East 20th Street/WinCo Access operates as an uncontrolled “T” intersection with right-turn movements in and out only to the WinCo site due to the median on East 20th Street.
East 20th Street/Huntington Drive is a four-legged signalized intersection. The southbound approach is a driveway to a shopping center that connects to the WinCo Grocery Store. Pedestrian facilities are located on all approaches.
The locations of the study intersections and the existing lane configurations and controls are shown in Figure 1.
Existing Conditions
The Existing Conditions scenario provides an evaluation of current operation based on existing traffic volumes during the a.m. and p.m. peak periods. This condition does not include project-generated traffic volumes. Turning movement counts for the study intersections of East 20th Street/Forest Avenue and Forest Avenue/WinCo Access-Mall Access were available from the Chico Mall Traffic Study. Volume data for the remaining study intersections was collected in July 2009.
Intersection Levels of Service
Under existing conditions, all four study intersections are operating acceptably at LOS C or better during the a.m. and p.m. peak periods. The existing traffic volumes are shown in Figure 2. A summary of the intersection level of service calculations is contained in Table 2, and copies of the Level of Service calculations are provided in Appendix A.

Sprin
gfiel
d Dr
iveSp
ringf
ield
Drive
East
20th
Stre
etEa
st 20
th S
treet
Forest Avenue Forest Avenue
Pro
ject
Si
te
1 23
4
Forest Avenue
East
20th
Stre
etSprin
gfiel
d Dr
ive
Exis
ting T
raffi
c Vol
umes
Figu
re 2
CH
I045
.ai
7/09
Traf
fic Im
pact
Stu
dy fo
r th
e W
inC
o Fo
ods
Expa
nsio
nC
ity o
f Chi
co
LEG
END
xx
(xx)
A.M
. Pea
k H
our
Vol
um
eS
tudy
In
ters
ecti
on
P.M
. Pea
k H
our
Vol
um
e
No
rth
No
t to
Sca
le
76(125)
15 (
25)
314(
515)
(570
)348
3
16(9
9)0
(5)
7 (4
8)
(29)
4 (
8)0
(54)
5 (47) 15(510)317(152) 49
8 (34)437(434)30 (71)
1
139(
119)
229(
307)
46 (
64)
(309
)125
(458
)179
(153
)186
(358)134(314)124 (97) 21
185(220)206(255)84 (139)
2
15 (
40)
223(
365)
6 (
10)
(70
) 43
(485
)296
(45
) 55
(55)45 (0) 0(15)10
34 (55)9 (15)101(165)
4
Traffic Impact Study for WinCo Foods Expansion in the City of Chico August 13, 2009 Page 8
Table 2 Summary of Existing Peak Hour Intersection Level of Service Calculations
Study Intersection Approach
Existing Conditions Existing plus Project
AM Peak PM Peak AM Peak PM Peak
Delay LOS Delay LOS Delay LOS Delay LOS
1. Forest Ave/WinCo Access-Mall Access 0.8 A 4.2 A 1.0 A 4.6 A
WinCo Driveway Approach 12.7 B 21.9 C 12.9 B 23.1 C
2. Forest Ave/20th St 30.1 C 34.3 C 30.1 C 34.4 C
3. 20th St/WinCo Access 1.0 A 1.1 A 1.0 A 1.1 A
WinCo Driveway Approach 9.6 A 10.9 B 9.6 A 10.9 B
4. 20th St/Huntington Dr 18.6 B 20.4 C 18.8 B 20.7 C
Notes: Delay is measured in average seconds per vehicle; LOS = Level of Service Results for minor approaches to two-way stop-controlled intersections are indicated in italics Alternative Modes
Transit
Transit access to the site is provided by Butte Regional Transit. Route 40, which runs on weekends, and Route 7, which runs on weekdays, operate along East 20th Street. Route 7 also travels along Forest Avenue on weekdays, while Route 20 runs on this street during the weekend. A bus stop is located along the Chico Mall frontage on Forest Avenue and a second transit stop is located approximately 150 feet east of Forest Avenue on 20th Street along the project site.
Bicycles
There are marked bicycle lanes on Forest Avenue and 20th Street, both of which are Class II facilities. Bike racks are currently found on site.
Pedestrians
Sidewalks currently exist along public streets within the study area, but there is not a connection between Forest Avenue and the WinCo Grocery Store. Pedestrians coming from the south typically walk along the south side of the driveway access leading to the site, which results in conflicts between pedestrians walking in the roadway and vehicles entering the site. On the north side of the site driveway there is an L-shaped path behind a grassy knoll and some shrubs that line the exit lane of the driveway. There is not a marked crosswalk across the driveway, which is a vehicle dominated area.
Sidewalks along Forest Avenue terminate on either sides of the entrance point to the truck docking access and do not lead into the site. Future Conditions
Future peak hour volume projections were taken from a build out analysis done for the Chico Wal-Mart Store Expansion Traffic Impact Study. Future volumes were only available for one of the study intersections, (20th Street/Forest Avenue), and reflect 2020 projections. Although some of the anticipated development included in this previous effort may already be complete and occupied, to
Traffic Impact Study for WinCo Foods Expansion in the City of Chico August 13, 2009 Page 9
provide a conservative estimate of future operation, the incremental increase in trips associated with build out was added to current volumes in order to determine Future operating conditions without the project. Volumes for the remaining three intersections were developed through the use of the growth ratios at Forest Avenue/20th Street.
As noted in the Chico Wal-Mart Store Expansion Traffic Impact Study, it is anticipated that the intersection of 20th Street/Forest Avenue will be modified to include additional lanes and the lane configuration changed. These improvements include a southbound right-turn lane, a westbound shared through/right-turn lane, an additional eastbound through lane, an eastbound shared through/right-turn lane, and a second left-turn lane and exclusive right-turn lane on the northbound approach, which were assumed to be in place in evaluating future conditions.
Under the anticipated Future volumes, and with the addition of intersection improvements at 20th Street/Forest Avenue, the study intersections are expected to operate acceptably overall at LOS D or better during the a.m. and p.m. peak periods. The private street approaches to Forest Avenue and East 20th Street would be expected to operate at LOS F during the p.m. peak. Future volumes are shown in Figure 3 and operating conditions are summarized in Table 3.
Table 3 Summary of Future PM Peak Hour Level of Service Calculations
Study Intersection Approach
Future Conditions Future plus Project
AM Peak PM Peak AM Peak PM Peak
Delay LOS Delay LOS Delay LOS Delay LOS
1. 20th St/WinCo Access-Mall Access 1.0 A 23.1 C 1.1 A 30.0 D
Westbound Approach 17.6 C ** F 18.0 C ** F
2. Forest Ave/20th St 30.9 C 51.6 D 31.0 C 52.2 D
3. 20th St/ WinCo Access 2.2 A 11.6 B 2.3 A 12.1 B
Southbound Approach 22.1 C 115 F 22.2 C 118.9 F
4. 20th St/Huntington Dr 26.4 C 49.3 D 26.7 C 52.1 D
Notes: Delay is measured in average seconds of delay per vehicle, LOS = Level of Service Results for minor approaches to two-way stop-controlled intersections are indicated in italics ** Delay is greater than 120 seconds
Sprin
gfiel
d Dr
iveSp
ringf
ield
Drive
East
20th
Stre
etEa
st 20
th S
treet
Forest Avenue Forest Avenue
Pro
ject
Si
te
1 23
4
Forest Avenue
East
20th
Stre
etSprin
gfiel
d Dr
ive
Futu
re T
raffi
c Vol
umes
Figu
re 3
CH
I045
.ai
7/09
Traf
fic Im
pact
Stu
dy fo
r th
e W
inC
o Fo
ods
Expa
nsio
nC
ity o
f Chi
co
LEG
END
xx
(xx)
A.M
. Pea
k H
our
Vol
um
eS
tudy
In
ters
ecti
on
P.M
. Pea
k H
our
Vol
um
e
No
rth
No
t to
Sca
le
264(368)
53
(74)
1087
(151
8)
(168
0)12
03
3
24(1
41)
0 (7
)11
(68)
(41)
6(11
)0(7
7)8
(67) 23(724)478(216) 74
12 (48)659(616)45 (101)
1
52 (
118)
770(
1076
)21
(29
)
(20
6) 1
48(1
429)
1024
(13
3) 1
90
(162)156 (0) 0 (44) 35
116(162)32 (44)348(486)
4
191
(98)
1115
(131
9)19
1 (2
51)
(37
9)20
5(1
460)
722
(46
3)41
1
(762)262(558)165(153) 64
266(227)343(455)132(208)
2
Traffic Impact Study for WinCo Foods Expansion in the City of Chico August 13, 2009 Page 11
Plus Project Conditions
Project Description
The project consists of expanding the existing WinCo Grocery Store along the west side of the building by 10,667 square feet to a total of 89,967 square feet. The main access to the WinCo Grocery Store is along Forest Avenue across from a Chico Mall entrance. There are two other access points that connect the WinCo Grocery Store to 20th Street. The first is approximately 450 feet east of the intersection with Forest Avenue and the second is at Huntington Drive. There are no new access points proposed. The project site plan is shown in Figure 4.
Trip Generation
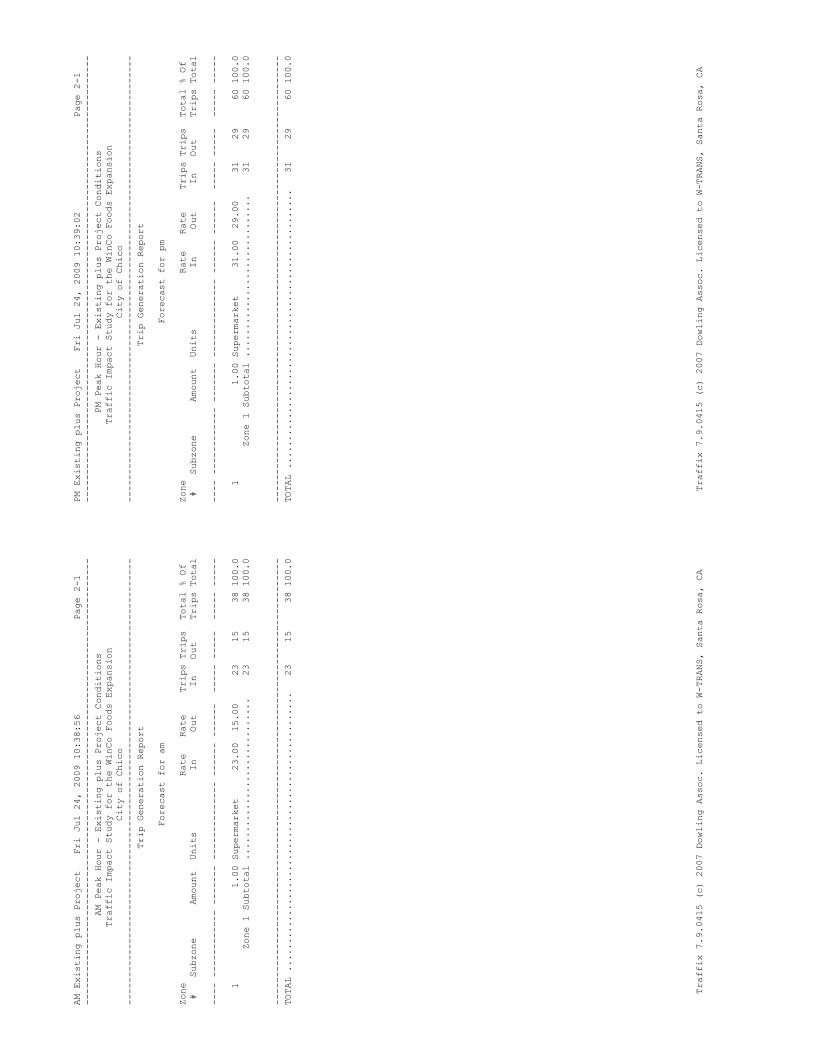
The anticipated trip generation for the proposed project was estimated using standard rates published by the Institute of Transportation Engineers (ITE) in Trip Generation, 8th Edition, 2008. The trip generation potential of the project as planned was developed using the published standard rates for “Grocery Store” (ITE LU #850). Because the daily and p.m. peak hour trip generation rates are variable depending on the size of the project, vehicle trip estimates were determined under both existing and proposed uses with the new trips based on the difference between the two estimates. The expected trip generation potential for the proposed project is indicated in Table 4. The proposed expansion would be expected to generate an average of 709 new trips on a daily basis, including 38 trips during the morning peak hour and 60 during the evening peak hour.
Table 4 Trip Generation Summary
Land Use Units Daily AM Peak Hour PM Peak Hour
Rate Trips Rate Trips In Out Rate Trips In Out
Existing
Grocery Store 79.3ksf 84.5 6701 3.59 285 174 111 9.43 748 381 367
Proposed
Expanded Grocery Store 89.9ksf 82.43 7410 3.59 323 197 126 8.62 808 412 396
Net New Trips 10.67ksf 709 38 23 15 60 31 29
Note: ksf = 1,000 square feet Trip Distribution
The pattern used to allocate new project trips to the street network was based on data from the 2000 Census for home-to-work or work-to-home trips. The applied distribution assumptions and resulting trips are shown in Table 5.
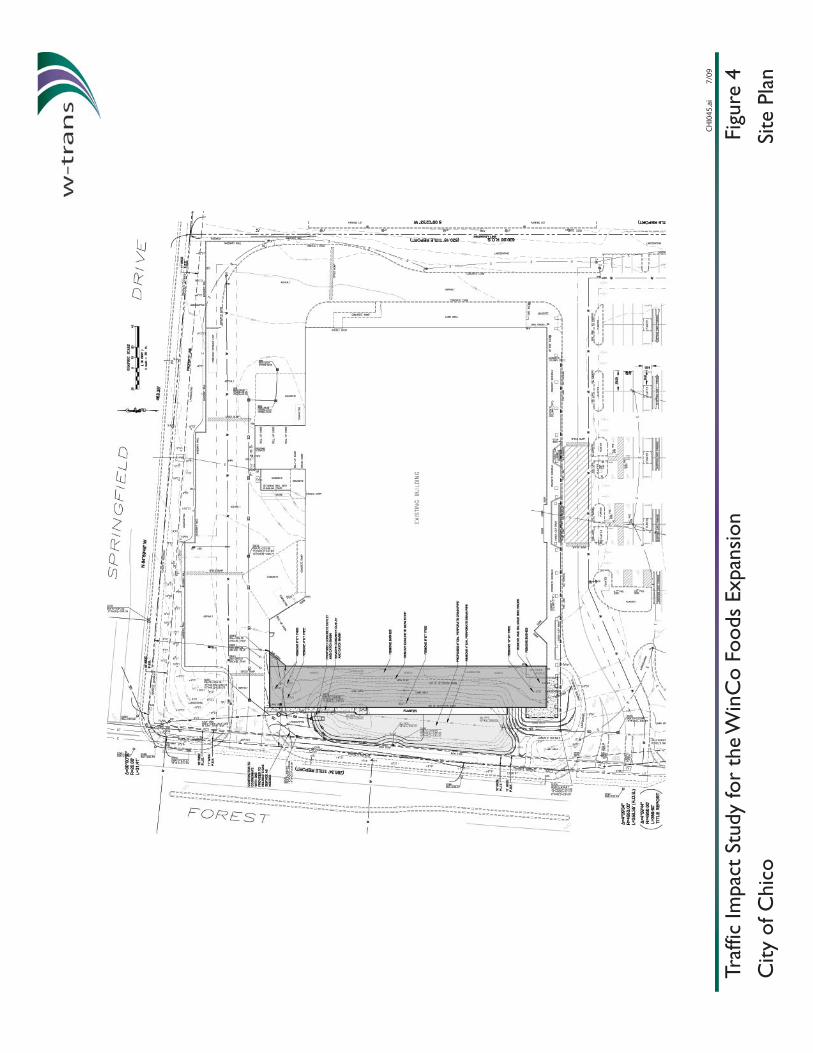
Site
Pla
nFi
gure
4C
HI0
45.a
i 7/
09
Traf
fic Im
pact
Stu
dy fo
r th
e W
inC
o Fo
ods
Expa
nsio
nC
ity o
f Chi
co
Traffic Impact Study for WinCo Foods Expansion in the City of Chico August 13, 2009 Page 13
Table 5 Trip Distribution Assumptions
Route Percent Daily Trips
AM Trips
PM Trips
Forest Ave – north 30% 212 11 18
Forest Ave – south 20% 142 8 12
20th St – west 15% 107 6 9
20th St – east 35% 248 13 21
TOTAL 100% 709 38 60 Intersection Operation
Existing plus Project Conditions
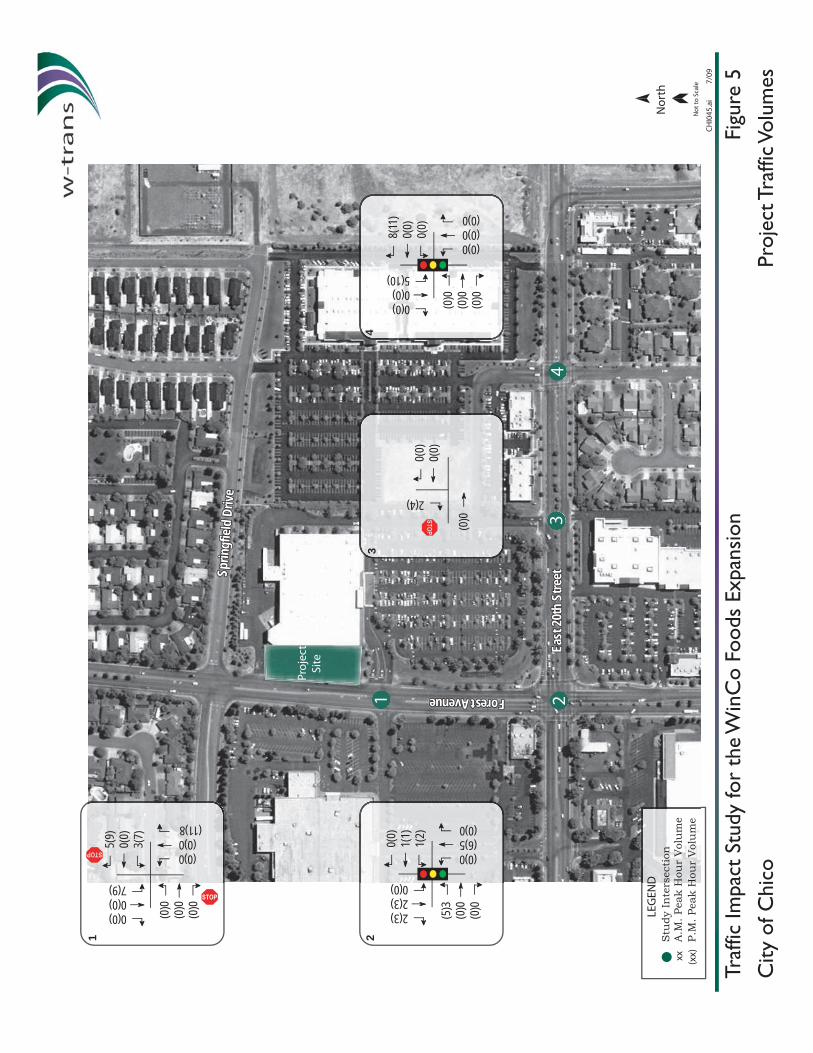
Upon the addition of project-related traffic to the existing volumes, the study intersections are expected to operate acceptably at LOS C or better during both peak periods evaluated. These results are summarized in Table 2. Project traffic volumes are shown in Figure 5.
Impact: The study intersections are expected to continue operating acceptably at the same levels of service upon the addition of project-generated traffic. The project’s impact is less-than-significant.
Recommendation: None needed.
Future plus Project Conditions
Upon the addition of project-generated traffic to the anticipated Future volumes, and with the planned improvements, the study intersections are expected to operate acceptably. The private street approaches to Forest Avenue and East 20th Street would be expected to operate at LOS F during the p.m. peak hour, but there is no operational standard for these private streets. The Future plus Project operating conditions are summarized in Table 2.
Impact: All public street approaches to the study intersections will continue operating at acceptable Levels of Service with project traffic added. The project’s impact is less-than-significant.
Recommendation: None needed.
Signal Warrants
Signal warrants were reviewed for the intersection of Forest Avenue/WinCo Access-Mall Access to determine if there is a demonstrated need for a change in the traffic control at the intersection. Issues considered include the volume of traffic, collision history, as well as the proximity of the adjacent traffic signals at East 20th Street and Springfield Drive. A review of collisions for a five-year period showed no recorded collisions at this location, therefore indicating no pre-existing safety concern. Volume warrants are based on threshold levels for the combined volume on the main street (Forest Avenue) and the highest volume side street, which in this case is the WinCo Access-Mall Access. Warrants for both the peak hour and eight-hour conditions were reviewed based on the left-turn and through volumes on the WinCo-Mall Access approach. Right-turn movements were not included in the calculations because there is a separate right-turn lane, so delay on the approach is generally only
Sprin
gfiel
d Dr
iveSp
ringf
ield
Drive
East
20th
Stre
etEa
st 20
th S
treet
Forest Avenue Forest Avenue
Pro
ject
Si
te
1 23
4
Forest Avenue
East
20th
Stre
etSprin
gfiel
d Dr
ive
Proj
ect T
raffi
c Vol
umes
Figu
re 5
CH
I045
.ai
7/09
Traf
fic Im
pact
Stu
dy fo
r th
e W
inC
o Fo
ods
Expa
nsio
nC
ity o
f Chi
co
LEG
END
xx
(xx)
A.M
. Pea
k H
our
Vol
um
eS
tudy
In
ters
ecti
on
P.M
. Pea
k H
our
Vol
um
e
No
rth
No
t to
Sca
le
2(4)
0(0)
0(0)
(0)0
3
5(9)
0(0)
3(7)
(0)0
(0)0
(0)0
(0)0 (0)0(11)8
0(0)0(0)7(9)
1
0(0)
1(1)
1(2)
(5)3
(0)0
(0)0
(0)0(6)5(0)0
2(3)2(3)0(0)
2
8(11
)0(
0)0(
0)
(0)0
(0)0
(0)0
(0)0(0)0(0)0
0(0)0(0)5(10)
4
Traffic Impact Study for WinCo Foods Expansion in the City of Chico August 13, 2009 Page 15
experienced by through and left-turning vehicles. Under all conditions evaluated, the volumes of traffic at the WinCo-Mall approach are insufficient to meet peak hour and eight-hour warrants. (It should be noted that if the right-turn volumes had been included in the calculations, a traffic signal would be warranted under all project scenarios.) Calculations for the signal warrant can be found in Appendix B.
Impact: A traffic signal is not warranted under any of the volumes evaluated.
Recommendation: None needed.
Site Access and Internal Circulation
Access to the project will continue via three existing driveways. One is located directly across Forest Avenue from the Chico Mall entrance and the remaining two are along 20th Street. The driveways on Forest Avenue and at Huntington Drive have full access, while the driveway just east of Forest Avenue on 20th Street is limited to right-turns in and out. The driveway on Forest Avenue is the main access to the project site as it serves the highest vehicle volumes. Current striping at this access is not consistent with regular roadway layouts. The center line at the access point is painted white instead of the typical yellow, which is used to divide vehicles traveling in opposing directions. The centerline on the approach to Forest Avenue should be repainted yellow.
A separate entrance is located approximately 120 feet south of the intersection of Forest Avenue/ Springfield Drive; this access is typically used by trucks making WinCo deliveries.
Alternative Modes
Transit
Existing transit facilities will accommodate any new users upon build out of the project and into the future.
Bicycles
Marked bicycle lanes in the vicinity of the project will adequately accommodate bicycle traffic associated with the project. The most recent site plan for the WinCo expansion shows existing bike racks will be relocated due to the expansion area. The bike racks should be located centrally to promote bicycling to the site.
Pedestrians
Pedestrian access in vicinity of the project is expected to be adequate except on Forest Avenue, where upgrades are needed. Adding sidewalk along the south side of the WinCo Access to the existing crosswalk located at the front entrance will help create a safe pedestrian access and minimize interference with vehicles turning into the site. Though there is sidewalk on the north side of the entrance way, sidewalk should be added to provide a continuous path to the site. Adding a marked crosswalk across the entrance will help bring pedestrian activity to the attention of drivers turning into and out of the site. Because the entrance on Forest Avenue south of Springfield Drive is designated for trucks and there is no entrance to the grocery store in this area, pedestrian conflicts are expected to be minimal and were therefore not considered an issue.
Impact: The site has adequate transit access and bicycle facilities. Pedestrian facilities are adequate except for the access at Forest Avenue/WinCo Access-Mall Access where pedestrian facilities should be enhanced.
Traffic Impact Study for WinCo Foods Expansion in the City of Chico August 13, 2009 Page 16
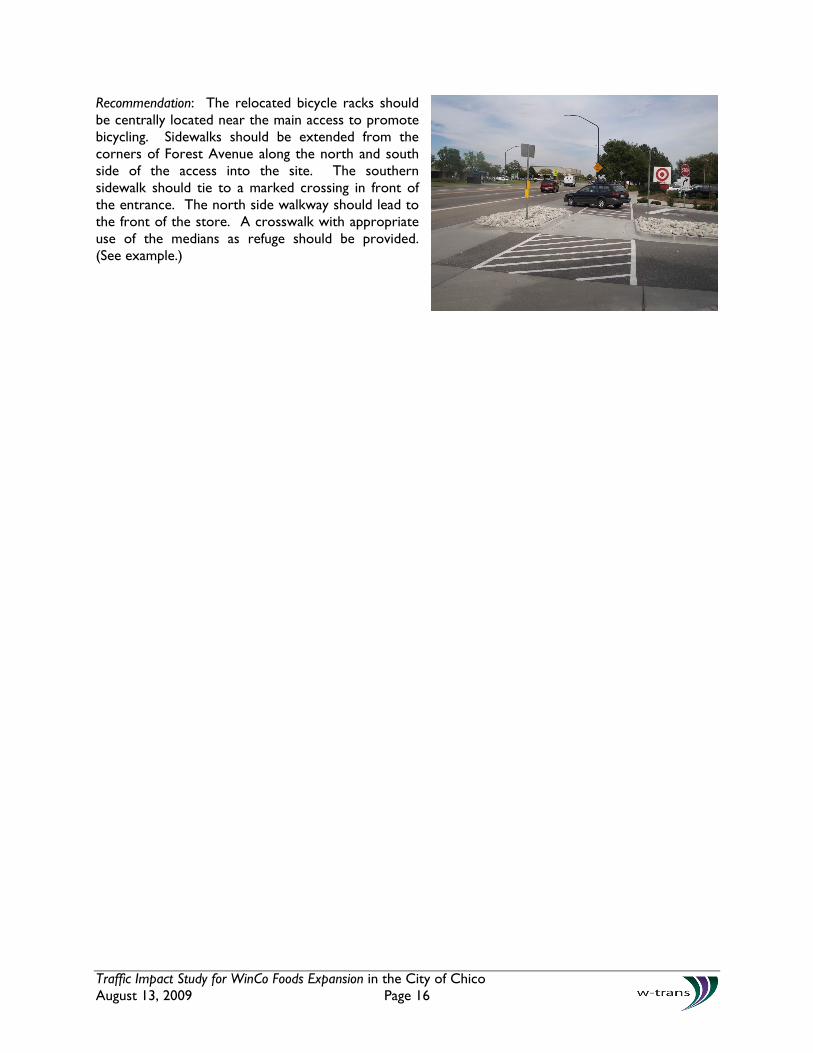
Recommendation: The relocated bicycle racks should be centrally located near the main access to promote bicycling. Sidewalks should be extended from the corners of Forest Avenue along the north and south side of the access into the site. The southern sidewalk should tie to a marked crossing in front of the entrance. The north side walkway should lead to the front of the store. A crosswalk with appropriate use of the medians as refuge should be provided. (See example.)
Traffic Impact Study for WinCo Foods Expansion in the City of Chico August 13, 2009 Page 17
Conclusions and Recommendations
Conclusions
• The proposed expansion of the existing WinCo grocery store will generate an average of 709 new daily trips, including 38 during the a.m. peak hour and 60 during the p.m. peak hour.
• All study intersections are currently operating acceptably at LOS C or better during studied peak periods and are expected to do so under build out of the proposed project.
• With planned improvements and under projected future volumes, the intersection of Forest Avenue/20th Street is expected to operate acceptably at LOS D or better without or with the project. The private street approaches to Forest Avenue and East 20th Street are expected to operate at LOS F during the p.m. peak hour.
• A traffic signal is not warranted at Forest Avenue/WinCo Access-Mall Access under any of the volume scenarios evaluated.
• The project site is well served by transit.
• Bicyclists will be adequately served by Class II bike lanes along Forest Avenue and 20th Street.
• Lack of sidewalk between Forest Avenue and the WinCo Store and lack of a striped crosswalk at the entrance result in conditions that are not suitable for safe pedestrian access to site.
• The existing white centerline on the WinCo Access approach to Forest Avenue is non-standard.
• Access at existing driveways is expected to continue operating acceptably upon build out of the project.
Recommendations
• Sidewalks should be provided along the north and south sides of the WinCo Access driveway between Forest Avenue and the store to provide safe pedestrian access to the site.
• A crosswalk should be striped across the WinCo entrance at Forest Avenue with median refuge to enhance pedestrian access.
• The centerline at Forest Avenue/WinCo Access should be re-striped to a yellow line, which is consistent with standards.
• At build out of the project bicycle racks should be relocated to a centralized position to promote bicycling.
Traffic Impact Study for WinCo Foods Expansion in the City of Chico August 13, 2009 Page 18
Study Participants and References
Study Participants
Principal in Charge: Steve Weinberger, P.E., PTOE Assistant Engineer: Vanessa Aguayo Technician/Graphics: Deborah Dunn Editing/Formatting: Angela McCoy Report Review: Dalene J. Whitlock, P.E., PTOE References
City of Chico General Plan, City of Chico, 1999 Highway Capacity Manual, Transportation Research Board, 2000 United States Census 2000, United States Census Bureau, 2000 Trip Generation, 8th Edition, Institute of Transportation Engineers, 2008 B-Line (Butte Regional Transit), http://www.bcag.org/Transit/Routes--Schedules/index.html Communications
June 29, 2009 Ron Schrieber, email with CAD drawing and proposed ksf for project July 15, 2009 Ron Schrieber, email existing ksf July 23, 2009 Ron Schrieber, pdf of site plan for project CHI045
Traffic Impact Study for WinCo Foods Expansion in the City of Chico August 2009
Appendix A
Intersection Level of Service Calculations

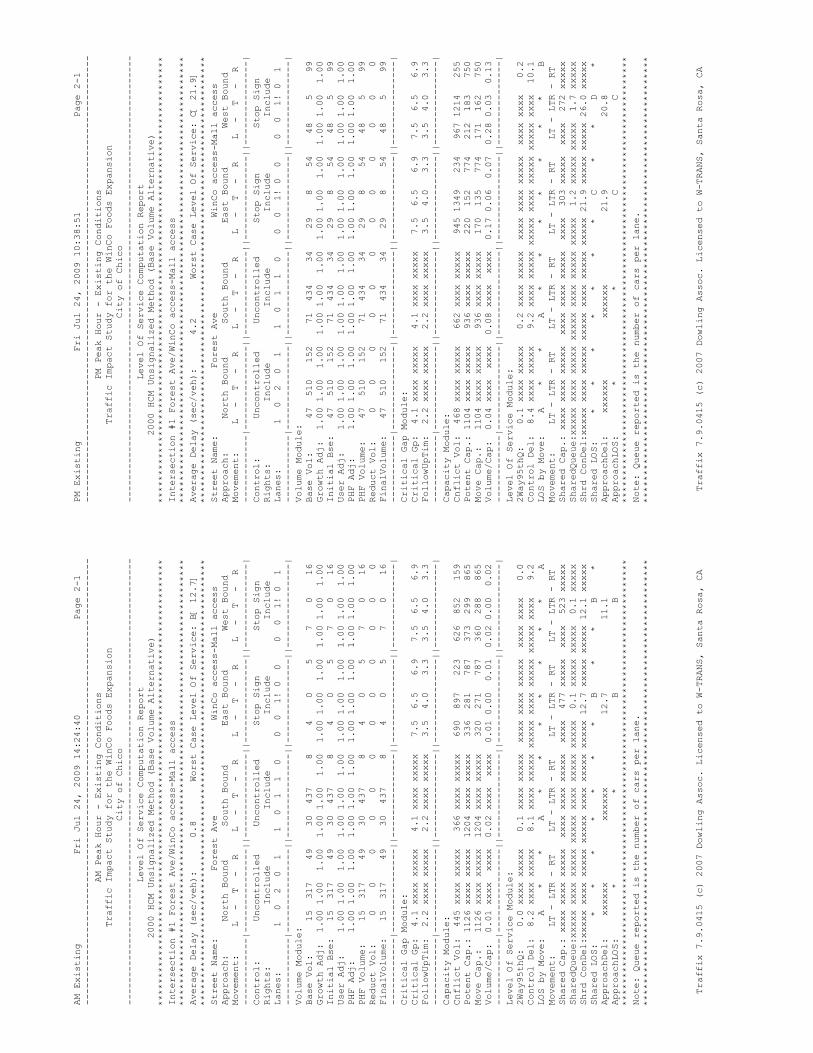
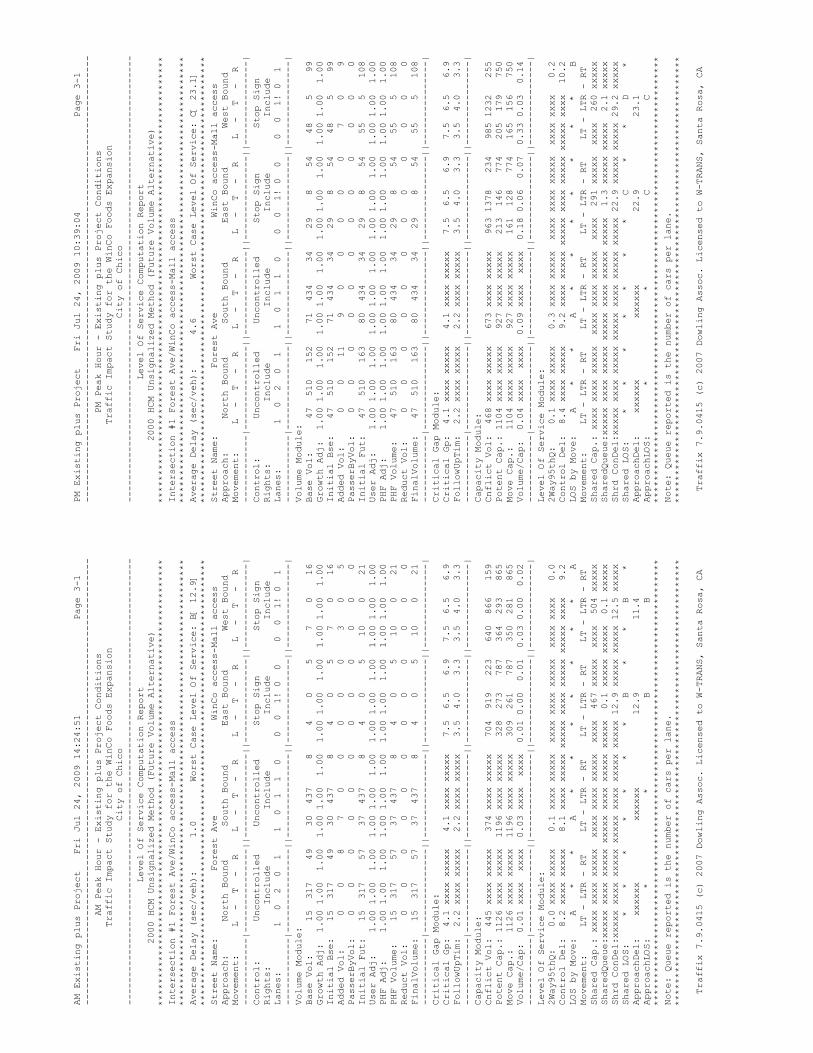
AM Existing Fri Jul 24, 2009 14:24:40 Page 2-1
--------------------------------------------------------------------------------
AM Peak Hour - Existing Conditions
Traffic Impact Study for the WinCo Foods Expansion
City of Chico
--------------------------------------------------------------------------------
Level Of Service Computation Report
2000 HCM Unsignalized Method (Base Volume Alternative)
********************************************************************************
Intersection #1 Forest Ave/WinCo access-Mall access
********************************************************************************
Average Delay (sec/veh): 0.8 Worst Case Level Of Service: B[ 12.7]
********************************************************************************
Street Name: Forest Ave WinCo access-Mall access
Approach: North Bound South Bound East Bound West Bound
Movement: L - T - R L - T - R L - T - R L - T - R
------------|---------------||---------------||---------------||---------------|
Control: Uncontrolled Uncontrolled Stop Sign Stop Sign
Rights: Include Include Include Include
Lanes: 1 0 2 0 1 1 0 1 1 0 0 0 1! 0 0 0 0 1! 0 1
------------|---------------||---------------||---------------||---------------|
Volume Module:
Base Vol: 15 317 49 30 437 8 4 0 5 7 0 16
Growth Adj: 1.00 1.00 1.00 1.00 1.00 1.00 1.00 1.00 1.00 1.00 1.00 1.00
Initial Bse: 15 317 49 30 437 8 4 0 5 7 0 16
User Adj: 1.00 1.00 1.00 1.00 1.00 1.00 1.00 1.00 1.00 1.00 1.00 1.00
PHF Adj: 1.00 1.00 1.00 1.00 1.00 1.00 1.00 1.00 1.00 1.00 1.00 1.00
PHF Volume: 15 317 49 30 437 8 4 0 5 7 0 16
Reduct Vol: 0 0 0 0 0 0 0 0 0 0 0 0
FinalVolume: 15 317 49 30 437 8 4 0 5 7 0 16
------------|---------------||---------------||---------------||---------------|
Critical Gap Module:
Critical Gp: 4.1 xxxx xxxxx 4.1 xxxx xxxxx 7.5 6.5 6.9 7.5 6.5 6.9
FollowUpTim: 2.2 xxxx xxxxx 2.2 xxxx xxxxx 3.5 4.0 3.3 3.5 4.0 3.3
------------|---------------||---------------||---------------||---------------|
Capacity Module:
Cnflict Vol: 445 xxxx xxxxx 366 xxxx xxxxx 690 897 223 626 852 159
Potent Cap.: 1126 xxxx xxxxx 1204 xxxx xxxxx 336 281 787 373 299 865
Move Cap.: 1126 xxxx xxxxx 1204 xxxx xxxxx 320 271 787 360 288 865
Volume/Cap: 0.01 xxxx xxxx 0.02 xxxx xxxx 0.01 0.00 0.01 0.02 0.00 0.02
------------|---------------||---------------||---------------||---------------|
Level Of Service Module:
2Way95thQ: 0.0 xxxx xxxxx 0.1 xxxx xxxxx xxxx xxxx xxxxx xxxx xxxx 0.0
Control Del: 8.2 xxxx xxxxx 8.1 xxxx xxxxx xxxxx xxxx xxxxx xxxxx xxxx 9.2
LOS by Move: A * * A * * * * * * * A
Movement: LT - LTR - RT LT - LTR - RT LT - LTR - RT LT - LTR - RT
Shared Cap.: xxxx xxxx xxxxx xxxx xxxx xxxxx xxxx 477 xxxxx xxxx 523 xxxxx
SharedQueue:xxxxx xxxx xxxxx xxxxx xxxx xxxxx xxxxx 0.1 xxxxx xxxxx 0.1 xxxxx
Shrd ConDel:xxxxx xxxx xxxxx xxxxx xxxx xxxxx xxxxx 12.7 xxxxx xxxxx 12.1 xxxxx
Shared LOS: * * * * * * * B * * B *
ApproachDel: xxxxxx xxxxxx 12.7 11.1
ApproachLOS: * * B B
********************************************************************************
Note: Queue reported is the number of cars per lane.
********************************************************************************
Traffix 7.9.0415 (c) 2007 Dowling Assoc. Licensed to W-TRANS, Santa Rosa, CA
PM Existing Fri Jul 24, 2009 10:38:51 Page 2-1
--------------------------------------------------------------------------------
PM Peak Hour - Existing Conditions
Traffic Impact Study for the WinCo Foods Expansion
City of Chico
--------------------------------------------------------------------------------
Level Of Service Computation Report
2000 HCM Unsignalized Method (Base Volume Alternative)
********************************************************************************
Intersection #1 Forest Ave/WinCo access-Mall access
********************************************************************************
Average Delay (sec/veh): 4.2 Worst Case Level Of Service: C[ 21.9]
********************************************************************************
Street Name: Forest Ave WinCo access-Mall access
Approach: North Bound South Bound East Bound West Bound
Movement: L - T - R L - T - R L - T - R L - T - R
------------|---------------||---------------||---------------||---------------|
Control: Uncontrolled Uncontrolled Stop Sign Stop Sign
Rights: Include Include Include Include
Lanes: 1 0 2 0 1 1 0 1 1 0 0 0 1! 0 0 0 0 1! 0 1
------------|---------------||---------------||---------------||---------------|
Volume Module:
Base Vol: 47 510 152 71 434 34 29 8 54 48 5 99
Growth Adj: 1.00 1.00 1.00 1.00 1.00 1.00 1.00 1.00 1.00 1.00 1.00 1.00
Initial Bse: 47 510 152 71 434 34 29 8 54 48 5 99
User Adj: 1.00 1.00 1.00 1.00 1.00 1.00 1.00 1.00 1.00 1.00 1.00 1.00
PHF Adj: 1.00 1.00 1.00 1.00 1.00 1.00 1.00 1.00 1.00 1.00 1.00 1.00
PHF Volume: 47 510 152 71 434 34 29 8 54 48 5 99
Reduct Vol: 0 0 0 0 0 0 0 0 0 0 0 0
FinalVolume: 47 510 152 71 434 34 29 8 54 48 5 99
------------|---------------||---------------||---------------||---------------|
Critical Gap Module:
Critical Gp: 4.1 xxxx xxxxx 4.1 xxxx xxxxx 7.5 6.5 6.9 7.5 6.5 6.9
FollowUpTim: 2.2 xxxx xxxxx 2.2 xxxx xxxxx 3.5 4.0 3.3 3.5 4.0 3.3
------------|---------------||---------------||---------------||---------------|
Capacity Module:
Cnflict Vol: 468 xxxx xxxxx 662 xxxx xxxxx 945 1349 234 967 1214 255
Potent Cap.: 1104 xxxx xxxxx 936 xxxx xxxxx 220 152 774 212 183 750
Move Cap.: 1104 xxxx xxxxx 936 xxxx xxxxx 170 135 774 171 162 750
Volume/Cap: 0.04 xxxx xxxx 0.08 xxxx xxxx 0.17 0.06 0.07 0.28 0.03 0.13
------------|---------------||---------------||---------------||---------------|
Level Of Service Module:
2Way95thQ: 0.1 xxxx xxxxx 0.2 xxxx xxxxx xxxx xxxx xxxxx xxxx xxxx 0.2
Control Del: 8.4 xxxx xxxxx 9.2 xxxx xxxxx xxxxx xxxx xxxxx xxxxx xxxx 10.1
LOS by Move: A * * A * * * * * * * B
Movement: LT - LTR - RT LT - LTR - RT LT - LTR - RT LT - LTR - RT
Shared Cap.: xxxx xxxx xxxxx xxxx xxxx xxxxx xxxx 303 xxxxx xxxx 272 xxxxx
SharedQueue:xxxxx xxxx xxxxx xxxxx xxxx xxxxx xxxxx 1.2 xxxxx xxxxx 1.7 xxxxx
Shrd ConDel:xxxxx xxxx xxxxx xxxxx xxxx xxxxx xxxxx 21.9 xxxxx xxxxx 26.0 xxxxx
Shared LOS: * * * * * * * C * * D *
ApproachDel: xxxxxx xxxxxx 21.9 20.8
ApproachLOS: * * C C
********************************************************************************
Note: Queue reported is the number of cars per lane.
********************************************************************************
Traffix 7.9.0415 (c) 2007 Dowling Assoc. Licensed to W-TRANS, Santa Rosa, CA
AM Existing Fri Jul 24, 2009 10:38:48 Page 3-1
--------------------------------------------------------------------------------
AM Peak Hour - Existing Conditions
Traffic Impact Study for the WinCo Foods Expansion
City of Chico
--------------------------------------------------------------------------------
Level Of Service Computation Report
2000 HCM Operations Method (Base Volume Alternative)
********************************************************************************
Intersection #2 East 20th St/Forest Ave
********************************************************************************
Cycle (sec): 100 Critical Vol./Cap.(X): 0.376
Loss Time (sec): 8 (Y+R=4.0 sec) Average Delay (sec/veh): 30.1
Optimal Cycle: 26 Level Of Service: C
********************************************************************************
Street Name: Forest Ave East 20th St
Approach: North Bound South Bound East Bound West Bound
Movement: L - T - R L - T - R L - T - R L - T - R
------------|---------------||---------------||---------------||---------------|
Control: Protected Protected Protected Protected
Rights: Include Include Include Include
Min. Green: 0 0 0 0 0 0 0 0 0 0 0 0
Lanes: 1 0 2 0 1 1 0 1 1 0 1 0 1 1 0 1 0 2 0 1
------------|---------------||---------------||---------------||---------------|
Volume Module:
Base Vol: 134 124 21 84 206 185 125 179 186 46 229 139
Growth Adj: 1.00 1.00 1.00 1.00 1.00 1.00 1.00 1.00 1.00 1.00 1.00 1.00
Initial Bse: 134 124 21 84 206 185 125 179 186 46 229 139
User Adj: 1.00 1.00 1.00 1.00 1.00 1.00 1.00 1.00 1.00 1.00 1.00 1.00
PHF Adj: 1.00 1.00 1.00 1.00 1.00 1.00 1.00 1.00 1.00 1.00 1.00 1.00
PHF Volume: 134 124 21 84 206 185 125 179 186 46 229 139
Reduct Vol: 0 0 0 0 0 0 0 0 0 0 0 0
Reduced Vol: 134 124 21 84 206 185 125 179 186 46 229 139
PCE Adj: 1.00 1.00 1.00 1.00 1.00 1.00 1.00 1.00 1.00 1.00 1.00 1.00
MLF Adj: 1.00 1.00 1.00 1.00 1.00 1.00 1.00 1.00 1.00 1.00 1.00 1.00
FinalVolume: 134 124 21 84 206 185 125 179 186 46 229 139
------------|---------------||---------------||---------------||---------------|
Saturation Flow Module:
Sat/Lane: 1900 1900 1900 1900 1900 1900 1900 1900 1900 1900 1900 1900
Adjustment: 0.95 0.95 0.85 0.95 0.88 0.88 0.95 0.88 0.88 0.95 0.95 0.85
Lanes: 1.00 2.00 1.00 1.00 1.05 0.95 1.00 1.00 1.00 1.00 2.00 1.00
Final Sat.: 1805 3610 1615 1805 1767 1587 1805 1668 1668 1805 3610 1615
------------|---------------||---------------||---------------||---------------|
Capacity Analysis Module:
Vol/Sat: 0.07 0.03 0.01 0.05 0.12 0.12 0.07 0.11 0.11 0.03 0.06 0.09
Crit Moves: **** **** **** ****
Green/Cycle: 0.20 0.22 0.22 0.29 0.31 0.31 0.18 0.34 0.34 0.08 0.23 0.23
Volume/Cap: 0.38 0.16 0.06 0.16 0.38 0.38 0.38 0.32 0.33 0.33 0.28 0.38
Delay/Veh: 35.5 32.0 31.3 26.4 27.2 27.2 36.5 24.9 25.0 45.1 31.9 33.2
User DelAdj: 1.00 1.00 1.00 1.00 1.00 1.00 1.00 1.00 1.00 1.00 1.00 1.00
AdjDel/Veh: 35.5 32.0 31.3 26.4 27.2 27.2 36.5 24.9 25.0 45.1 31.9 33.2
LOS by Move: D C C C C C D C C D C C
HCM2k95thQ: 8 3 1 4 10 10 7 9 9 3 6 7
********************************************************************************
Note: Queue reported is the number of cars per lane.
********************************************************************************
Traffix 7.9.0415 (c) 2007 Dowling Assoc. Licensed to W-TRANS, Santa Rosa, CA
PM Existing Fri Jul 24, 2009 14:24:45 Page 3-1
--------------------------------------------------------------------------------
PM Peak Hour - Existing Conditions
Traffic Impact Study for the WinCo Foods Expansion
City of Chico
--------------------------------------------------------------------------------
Level Of Service Computation Report
2000 HCM Operations Method (Base Volume Alternative)
********************************************************************************
Intersection #2 East 20th St/Forest Ave
********************************************************************************
Cycle (sec): 100 Critical Vol./Cap.(X): 0.648
Loss Time (sec): 8 (Y+R=4.0 sec) Average Delay (sec/veh): 34.3
Optimal Cycle: 43 Level Of Service: C
********************************************************************************
Street Name: Forest Ave East 20th St
Approach: North Bound South Bound East Bound West Bound
Movement: L - T - R L - T - R L - T - R L - T - R
------------|---------------||---------------||---------------||---------------|
Control: Protected Protected Protected Protected
Rights: Include Include Include Include
Min. Green: 0 0 0 0 0 0 0 0 0 0 0 0
Lanes: 1 0 2 0 1 1 0 1 1 0 1 0 1 1 0 1 0 2 0 1
------------|---------------||---------------||---------------||---------------|
Volume Module:
Base Vol: 358 314 97 139 255 220 309 458 153 64 307 119
Growth Adj: 1.00 1.00 1.00 1.00 1.00 1.00 1.00 1.00 1.00 1.00 1.00 1.00
Initial Bse: 358 314 97 139 255 220 309 458 153 64 307 119
User Adj: 1.00 1.00 1.00 1.00 1.00 1.00 1.00 1.00 1.00 1.00 1.00 1.00
PHF Adj: 1.00 1.00 1.00 1.00 1.00 1.00 1.00 1.00 1.00 1.00 1.00 1.00
PHF Volume: 358 314 97 139 255 220 309 458 153 64 307 119
Reduct Vol: 0 0 0 0 0 0 0 0 0 0 0 0
Reduced Vol: 358 314 97 139 255 220 309 458 153 64 307 119
PCE Adj: 1.00 1.00 1.00 1.00 1.00 1.00 1.00 1.00 1.00 1.00 1.00 1.00
MLF Adj: 1.00 1.00 1.00 1.00 1.00 1.00 1.00 1.00 1.00 1.00 1.00 1.00
FinalVolume: 358 314 97 139 255 220 309 458 153 64 307 119
------------|---------------||---------------||---------------||---------------|
Saturation Flow Module:
Sat/Lane: 1900 1900 1900 1900 1900 1900 1900 1900 1900 1900 1900 1900
Adjustment: 0.95 0.95 0.85 0.95 0.88 0.88 0.95 0.91 0.91 0.95 0.95 0.85
Lanes: 1.00 2.00 1.00 1.00 1.07 0.93 1.00 1.50 0.50 1.00 2.00 1.00
Final Sat.: 1805 3610 1615 1805 1804 1557 1805 2606 871 1805 3610 1615
------------|---------------||---------------||---------------||---------------|
Capacity Analysis Module:
Vol/Sat: 0.20 0.09 0.06 0.08 0.14 0.14 0.17 0.18 0.18 0.04 0.09 0.07
Crit Moves: **** **** **** ****
Green/Cycle: 0.31 0.28 0.28 0.25 0.22 0.22 0.26 0.33 0.33 0.07 0.13 0.13
Volume/Cap: 0.65 0.31 0.22 0.31 0.65 0.65 0.65 0.53 0.53 0.53 0.65 0.56
Delay/Veh: 32.7 28.7 28.0 31.2 37.6 37.6 35.8 27.8 27.8 49.8 44.4 44.1
User DelAdj: 1.00 1.00 1.00 1.00 1.00 1.00 1.00 1.00 1.00 1.00 1.00 1.00
AdjDel/Veh: 32.7 28.7 28.0 31.2 37.6 37.6 35.8 27.8 27.8 49.8 44.4 44.1
LOS by Move: C C C C D D D C C D D D
HCM2k95thQ: 19 8 5 7 15 15 17 16 16 4 9 7
********************************************************************************
Note: Queue reported is the number of cars per lane.
********************************************************************************
Traffix 7.9.0415 (c) 2007 Dowling Assoc. Licensed to W-TRANS, Santa Rosa, CA
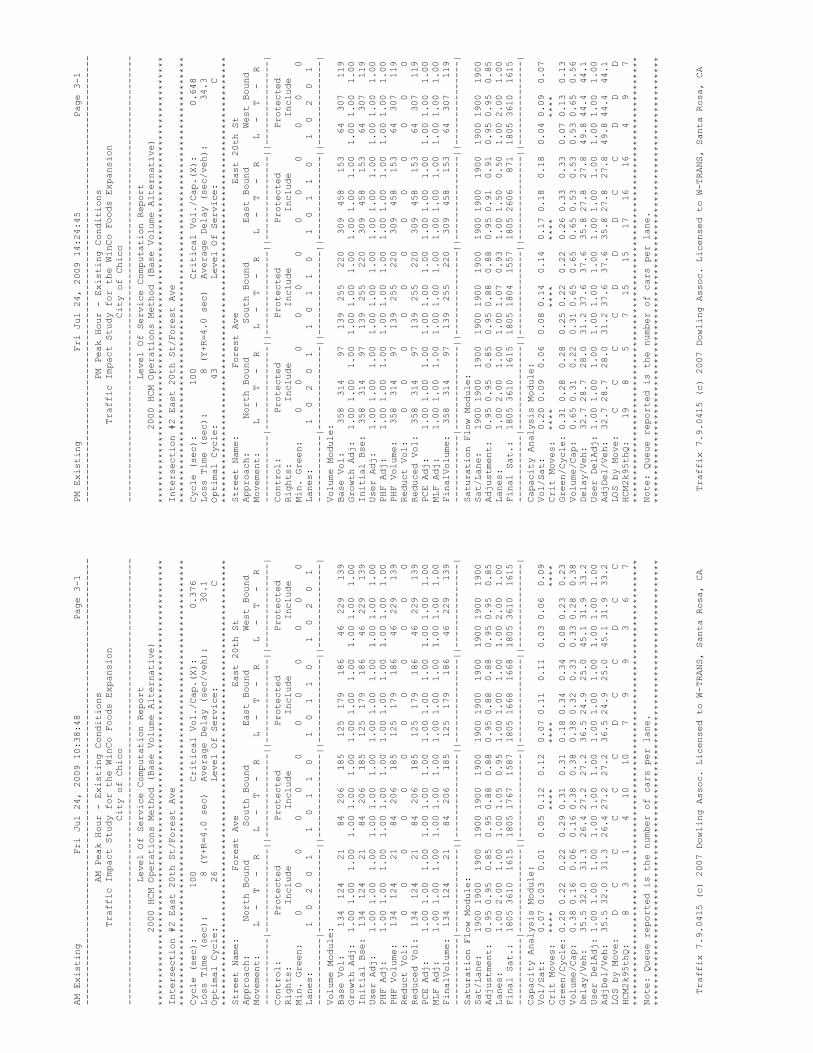
AM Existing Fri Jul 24, 2009 10:38:48 Page 4-1
--------------------------------------------------------------------------------
AM Peak Hour - Existing Conditions
Traffic Impact Study for the WinCo Foods Expansion
City of Chico
--------------------------------------------------------------------------------
Level Of Service Computation Report
2000 HCM Unsignalized Method (Base Volume Alternative)
********************************************************************************
Intersection #3 E 20th St/Driveway
********************************************************************************
Average Delay (sec/veh): 1.0 Worst Case Level Of Service: A[ 9.6]
********************************************************************************
Street Name: Driveway E 20th St
Approach: North Bound South Bound East Bound West Bound
Movement: L - T - R L - T - R L - T - R L - T - R
------------|---------------||---------------||---------------||---------------|
Control: Stop Sign Stop Sign Uncontrolled Uncontrolled
Rights: Include Include Include Include
Lanes: 0 0 0 0 0 0 0 0 0 1 0 0 2 0 0 0 0 1 1 0
------------|---------------||---------------||---------------||---------------|
Volume Module:
Base Vol: 0 0 0 0 0 76 0 348 0 0 314 15
Growth Adj: 1.00 1.00 1.00 1.00 1.00 1.00 1.00 1.00 1.00 1.00 1.00 1.00
Initial Bse: 0 0 0 0 0 76 0 348 0 0 314 15
User Adj: 1.00 1.00 1.00 1.00 1.00 1.00 1.00 1.00 1.00 1.00 1.00 1.00
PHF Adj: 1.00 1.00 1.00 1.00 1.00 1.00 1.00 1.00 1.00 1.00 1.00 1.00
PHF Volume: 0 0 0 0 0 76 0 348 0 0 314 15
Reduct Vol: 0 0 0 0 0 0 0 0 0 0 0 0
FinalVolume: 0 0 0 0 0 76 0 348 0 0 314 15
------------|---------------||---------------||---------------||---------------|
Critical Gap Module:
Critical Gp:xxxxx xxxx xxxxx xxxxx xxxx 6.9 xxxxx xxxx xxxxx xxxxx xxxx xxxxx
FollowUpTim:xxxxx xxxx xxxxx xxxxx xxxx 3.3 xxxxx xxxx xxxxx xxxxx xxxx xxxxx
------------|---------------||---------------||---------------||---------------|
Capacity Module:
Cnflict Vol: xxxx xxxx xxxxx xxxx xxxx 165 xxxx xxxx xxxxx xxxx xxxx xxxxx
Potent Cap.: xxxx xxxx xxxxx xxxx xxxx 857 xxxx xxxx xxxxx xxxx xxxx xxxxx
Move Cap.: xxxx xxxx xxxxx xxxx xxxx 857 xxxx xxxx xxxxx xxxx xxxx xxxxx
Volume/Cap: xxxx xxxx xxxx xxxx xxxx 0.09 xxxx xxxx xxxx xxxx xxxx xxxx
------------|---------------||---------------||---------------||---------------|
Level Of Service Module:
2Way95thQ: xxxx xxxx xxxxx xxxx xxxx 0.3 xxxx xxxx xxxxx xxxx xxxx xxxxx
Control Del:xxxxx xxxx xxxxx xxxxx xxxx 9.6 xxxxx xxxx xxxxx xxxxx xxxx xxxxx
LOS by Move: * * * * * A * * * * * *
Movement: LT - LTR - RT LT - LTR - RT LT - LTR - RT LT - LTR - RT
Shared Cap.: xxxx xxxx xxxxx xxxx xxxx xxxxx xxxx xxxx xxxxx xxxx xxxx xxxxx
SharedQueue:xxxxx xxxx xxxxx xxxxx xxxx xxxxx xxxxx xxxx xxxxx xxxxx xxxx xxxxx
Shrd ConDel:xxxxx xxxx xxxxx xxxxx xxxx xxxxx xxxxx xxxx xxxxx xxxxx xxxx xxxxx
Shared LOS: * * * * * * * * * * * *
ApproachDel: xxxxxx 9.6 xxxxxx xxxxxx
ApproachLOS: * A * *
********************************************************************************
Note: Queue reported is the number of cars per lane.
********************************************************************************
Traffix 7.9.0415 (c) 2007 Dowling Assoc. Licensed to W-TRANS, Santa Rosa, CA
PM Existing Fri Jul 24, 2009 10:38:51 Page 4-1
--------------------------------------------------------------------------------
PM Peak Hour - Existing Conditions
Traffic Impact Study for the WinCo Foods Expansion
City of Chico
--------------------------------------------------------------------------------
Level Of Service Computation Report
2000 HCM Unsignalized Method (Base Volume Alternative)
********************************************************************************
Intersection #3 E 20th St/Driveway
********************************************************************************
Average Delay (sec/veh): 1.1 Worst Case Level Of Service: B[ 10.9]
********************************************************************************
Street Name: Driveway E 20th St
Approach: North Bound South Bound East Bound West Bound
Movement: L - T - R L - T - R L - T - R L - T - R
------------|---------------||---------------||---------------||---------------|
Control: Stop Sign Stop Sign Uncontrolled Uncontrolled
Rights: Include Include Include Include
Lanes: 0 0 0 0 0 0 0 0 0 1 0 0 2 0 0 0 0 1 1 0
------------|---------------||---------------||---------------||---------------|
Volume Module:
Base Vol: 0 0 0 0 0 125 0 570 0 0 515 25
Growth Adj: 1.00 1.00 1.00 1.00 1.00 1.00 1.00 1.00 1.00 1.00 1.00 1.00
Initial Bse: 0 0 0 0 0 125 0 570 0 0 515 25
User Adj: 1.00 1.00 1.00 1.00 1.00 1.00 1.00 1.00 1.00 1.00 1.00 1.00
PHF Adj: 1.00 1.00 1.00 1.00 1.00 1.00 1.00 1.00 1.00 1.00 1.00 1.00
PHF Volume: 0 0 0 0 0 125 0 570 0 0 515 25
Reduct Vol: 0 0 0 0 0 0 0 0 0 0 0 0
FinalVolume: 0 0 0 0 0 125 0 570 0 0 515 25
------------|---------------||---------------||---------------||---------------|
Critical Gap Module:
Critical Gp:xxxxx xxxx xxxxx xxxxx xxxx 6.9 xxxxx xxxx xxxxx xxxxx xxxx xxxxx
FollowUpTim:xxxxx xxxx xxxxx xxxxx xxxx 3.3 xxxxx xxxx xxxxx xxxxx xxxx xxxxx
------------|---------------||---------------||---------------||---------------|
Capacity Module:
Cnflict Vol: xxxx xxxx xxxxx xxxx xxxx 270 xxxx xxxx xxxxx xxxx xxxx xxxxx
Potent Cap.: xxxx xxxx xxxxx xxxx xxxx 734 xxxx xxxx xxxxx xxxx xxxx xxxxx
Move Cap.: xxxx xxxx xxxxx xxxx xxxx 734 xxxx xxxx xxxxx xxxx xxxx xxxxx
Volume/Cap: xxxx xxxx xxxx xxxx xxxx 0.17 xxxx xxxx xxxx xxxx xxxx xxxx
------------|---------------||---------------||---------------||---------------|
Level Of Service Module:
2Way95thQ: xxxx xxxx xxxxx xxxx xxxx 0.6 xxxx xxxx xxxxx xxxx xxxx xxxxx
Control Del:xxxxx xxxx xxxxx xxxxx xxxx 10.9 xxxxx xxxx xxxxx xxxxx xxxx xxxxx
LOS by Move: * * * * * B * * * * * *
Movement: LT - LTR - RT LT - LTR - RT LT - LTR - RT LT - LTR - RT
Shared Cap.: xxxx xxxx xxxxx xxxx xxxx xxxxx xxxx xxxx xxxxx xxxx xxxx xxxxx
SharedQueue:xxxxx xxxx xxxxx xxxxx xxxx xxxxx xxxxx xxxx xxxxx xxxxx xxxx xxxxx
Shrd ConDel:xxxxx xxxx xxxxx xxxxx xxxx xxxxx xxxxx xxxx xxxxx xxxxx xxxx xxxxx
Shared LOS: * * * * * * * * * * * *
ApproachDel: xxxxxx 10.9 xxxxxx xxxxxx
ApproachLOS: * B * *
********************************************************************************
Note: Queue reported is the number of cars per lane.
********************************************************************************
Traffix 7.9.0415 (c) 2007 Dowling Assoc. Licensed to W-TRANS, Santa Rosa, CA
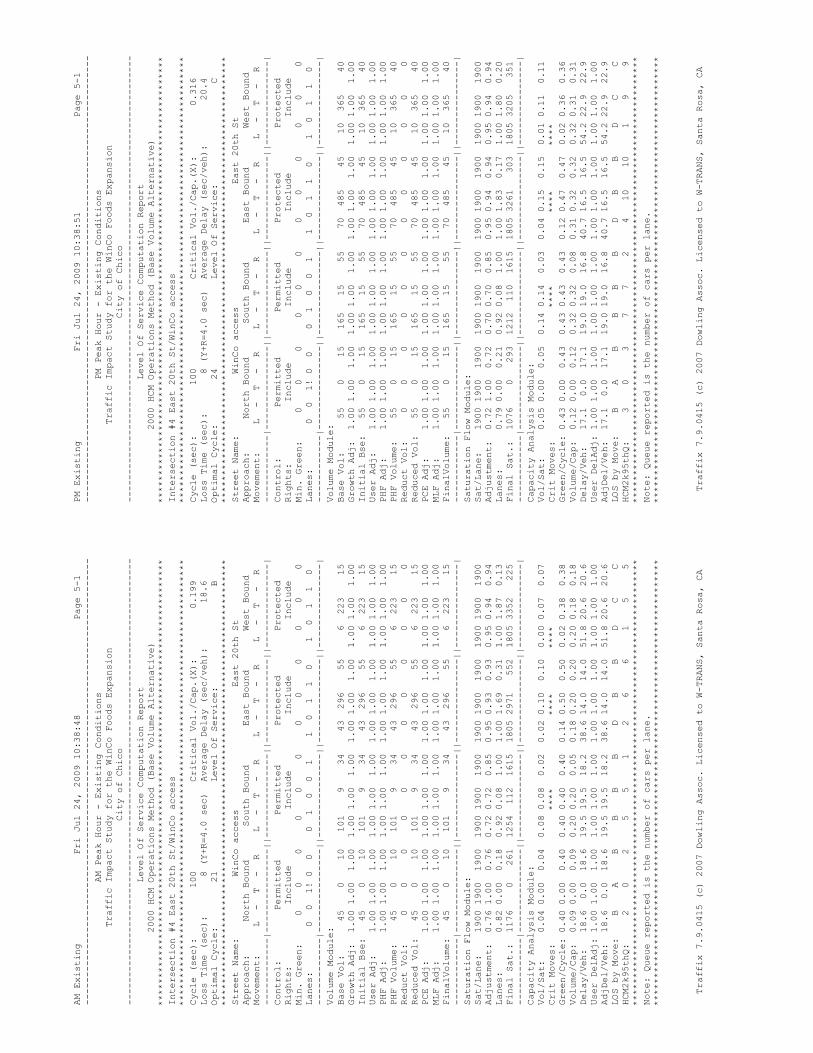
AM Existing Fri Jul 24, 2009 10:38:48 Page 5-1
--------------------------------------------------------------------------------
AM Peak Hour - Existing Conditions
Traffic Impact Study for the WinCo Foods Expansion
City of Chico
--------------------------------------------------------------------------------
Level Of Service Computation Report
2000 HCM Operations Method (Base Volume Alternative)
********************************************************************************
Intersection #4 East 20th St/WinCo access
********************************************************************************
Cycle (sec): 100 Critical Vol./Cap.(X): 0.199
Loss Time (sec): 8 (Y+R=4.0 sec) Average Delay (sec/veh): 18.6
Optimal Cycle: 21 Level Of Service: B
********************************************************************************
Street Name: WinCo access East 20th St
Approach: North Bound South Bound East Bound West Bound
Movement: L - T - R L - T - R L - T - R L - T - R
------------|---------------||---------------||---------------||---------------|
Control: Permitted Permitted Protected Protected
Rights: Include Include Include Include
Min. Green: 0 0 0 0 0 0 0 0 0 0 0 0
Lanes: 0 0 1! 0 0 0 1 0 0 1 1 0 1 1 0 1 0 1 1 0
------------|---------------||---------------||---------------||---------------|
Volume Module:
Base Vol: 45 0 10 101 9 34 43 296 55 6 223 15
Growth Adj: 1.00 1.00 1.00 1.00 1.00 1.00 1.00 1.00 1.00 1.00 1.00 1.00
Initial Bse: 45 0 10 101 9 34 43 296 55 6 223 15
User Adj: 1.00 1.00 1.00 1.00 1.00 1.00 1.00 1.00 1.00 1.00 1.00 1.00
PHF Adj: 1.00 1.00 1.00 1.00 1.00 1.00 1.00 1.00 1.00 1.00 1.00 1.00
PHF Volume: 45 0 10 101 9 34 43 296 55 6 223 15
Reduct Vol: 0 0 0 0 0 0 0 0 0 0 0 0
Reduced Vol: 45 0 10 101 9 34 43 296 55 6 223 15
PCE Adj: 1.00 1.00 1.00 1.00 1.00 1.00 1.00 1.00 1.00 1.00 1.00 1.00
MLF Adj: 1.00 1.00 1.00 1.00 1.00 1.00 1.00 1.00 1.00 1.00 1.00 1.00
FinalVolume: 45 0 10 101 9 34 43 296 55 6 223 15
------------|---------------||---------------||---------------||---------------|
Saturation Flow Module:
Sat/Lane: 1900 1900 1900 1900 1900 1900 1900 1900 1900 1900 1900 1900
Adjustment: 0.76 1.00 0.76 0.72 0.72 0.85 0.95 0.93 0.93 0.95 0.94 0.94
Lanes: 0.82 0.00 0.18 0.92 0.08 1.00 1.00 1.69 0.31 1.00 1.87 0.13
Final Sat.: 1176 0 261 1254 112 1615 1805 2971 552 1805 3352 225
------------|---------------||---------------||---------------||---------------|
Capacity Analysis Module:
Vol/Sat: 0.04 0.00 0.04 0.08 0.08 0.02 0.02 0.10 0.10 0.00 0.07 0.07
Crit Moves: **** **** ****
Green/Cycle: 0.40 0.00 0.40 0.40 0.40 0.40 0.14 0.50 0.50 0.02 0.38 0.38
Volume/Cap: 0.09 0.00 0.09 0.20 0.20 0.05 0.18 0.20 0.20 0.20 0.18 0.18
Delay/Veh: 18.6 0.0 18.6 19.5 19.5 18.2 38.6 14.0 14.0 51.8 20.6 20.6
User DelAdj: 1.00 1.00 1.00 1.00 1.00 1.00 1.00 1.00 1.00 1.00 1.00 1.00
AdjDel/Veh: 18.6 0.0 18.6 19.5 19.5 18.2 38.6 14.0 14.0 51.8 20.6 20.6
LOS by Move: B A B B B B D B B D C C
HCM2k95thQ: 2 0 2 5 5 1 2 6 6 1 5 5
********************************************************************************
Note: Queue reported is the number of cars per lane.
********************************************************************************
Traffix 7.9.0415 (c) 2007 Dowling Assoc. Licensed to W-TRANS, Santa Rosa, CA
PM Existing Fri Jul 24, 2009 10:38:51 Page 5-1
--------------------------------------------------------------------------------
PM Peak Hour - Existing Conditions
Traffic Impact Study for the WinCo Foods Expansion
City of Chico
--------------------------------------------------------------------------------
Level Of Service Computation Report
2000 HCM Operations Method (Base Volume Alternative)
********************************************************************************
Intersection #4 East 20th St/WinCo access
********************************************************************************
Cycle (sec): 100 Critical Vol./Cap.(X): 0.316
Loss Time (sec): 8 (Y+R=4.0 sec) Average Delay (sec/veh): 20.4
Optimal Cycle: 24 Level Of Service: C
********************************************************************************
Street Name: WinCo access East 20th St
Approach: North Bound South Bound East Bound West Bound
Movement: L - T - R L - T - R L - T - R L - T - R
------------|---------------||---------------||---------------||---------------|
Control: Permitted Permitted Protected Protected
Rights: Include Include Include Include
Min. Green: 0 0 0 0 0 0 0 0 0 0 0 0
Lanes: 0 0 1! 0 0 0 1 0 0 1 1 0 1 1 0 1 0 1 1 0
------------|---------------||---------------||---------------||---------------|
Volume Module:
Base Vol: 55 0 15 165 15 55 70 485 45 10 365 40
Growth Adj: 1.00 1.00 1.00 1.00 1.00 1.00 1.00 1.00 1.00 1.00 1.00 1.00
Initial Bse: 55 0 15 165 15 55 70 485 45 10 365 40
User Adj: 1.00 1.00 1.00 1.00 1.00 1.00 1.00 1.00 1.00 1.00 1.00 1.00
PHF Adj: 1.00 1.00 1.00 1.00 1.00 1.00 1.00 1.00 1.00 1.00 1.00 1.00
PHF Volume: 55 0 15 165 15 55 70 485 45 10 365 40
Reduct Vol: 0 0 0 0 0 0 0 0 0 0 0 0
Reduced Vol: 55 0 15 165 15 55 70 485 45 10 365 40
PCE Adj: 1.00 1.00 1.00 1.00 1.00 1.00 1.00 1.00 1.00 1.00 1.00 1.00
MLF Adj: 1.00 1.00 1.00 1.00 1.00 1.00 1.00 1.00 1.00 1.00 1.00 1.00
FinalVolume: 55 0 15 165 15 55 70 485 45 10 365 40
------------|---------------||---------------||---------------||---------------|
Saturation Flow Module:
Sat/Lane: 1900 1900 1900 1900 1900 1900 1900 1900 1900 1900 1900 1900
Adjustment: 0.72 1.00 0.72 0.70 0.70 0.85 0.95 0.94 0.94 0.95 0.94 0.94
Lanes: 0.79 0.00 0.21 0.92 0.08 1.00 1.00 1.83 0.17 1.00 1.80 0.20
Final Sat.: 1076 0 293 1212 110 1615 1805 3261 303 1805 3205 351
------------|---------------||---------------||---------------||---------------|
Capacity Analysis Module:
Vol/Sat: 0.05 0.00 0.05 0.14 0.14 0.03 0.04 0.15 0.15 0.01 0.11 0.11
Crit Moves: **** **** ****
Green/Cycle: 0.43 0.00 0.43 0.43 0.43 0.43 0.12 0.47 0.47 0.02 0.36 0.36
Volume/Cap: 0.12 0.00 0.12 0.32 0.32 0.08 0.31 0.32 0.32 0.32 0.31 0.31
Delay/Veh: 17.1 0.0 17.1 19.0 19.0 16.8 40.7 16.5 16.5 54.2 22.9 22.9
User DelAdj: 1.00 1.00 1.00 1.00 1.00 1.00 1.00 1.00 1.00 1.00 1.00 1.00
AdjDel/Veh: 17.1 0.0 17.1 19.0 19.0 16.8 40.7 16.5 16.5 54.2 22.9 22.9
LOS by Move: B A B B B B D B B D C C
HCM2k95thQ: 3 0 3 7 7 2 4 10 10 1 9 9
********************************************************************************
Note: Queue reported is the number of cars per lane.
********************************************************************************
Traffix 7.9.0415 (c) 2007 Dowling Assoc. Licensed to W-TRANS, Santa Rosa, CA
AM Existing plus Project Fri Jul 24, 2009 10:38:56 Page 2-1
--------------------------------------------------------------------------------
AM Peak Hour - Existing plus Project Conditions
Traffic Impact Study for the WinCo Foods Expansion
City of Chico
--------------------------------------------------------------------------------
Trip Generation Report
Forecast for am
Zone Rate Rate Trips Trips Total % Of
# Subzone Amount Units In Out In Out Trips Total
---- ------------ ------- -------------- ------ ------ ----- ----- ----- -----
1 1.00 Supermarket 23.00 15.00 23 15 38 100.0
Zone 1 Subtotal ............................. 23 15 38 100.0
--------------------------------------------------------------------------------
TOTAL .................................................. 23 15 38 100.0
Traffix 7.9.0415 (c) 2007 Dowling Assoc. Licensed to W-TRANS, Santa Rosa, CA
PM Existing plus Project Fri Jul 24, 2009 10:39:02 Page 2-1
--------------------------------------------------------------------------------
PM Peak Hour - Existing plus Project Conditions
Traffic Impact Study for the WinCo Foods Expansion
City of Chico
--------------------------------------------------------------------------------
Trip Generation Report
Forecast for pm
Zone Rate Rate Trips Trips Total % Of
# Subzone Amount Units In Out In Out Trips Total
---- ------------ ------- -------------- ------ ------ ----- ----- ----- -----
1 1.00 Supermarket 31.00 29.00 31 29 60 100.0
Zone 1 Subtotal ............................. 31 29 60 100.0
--------------------------------------------------------------------------------
TOTAL .................................................. 31 29 60 100.0
Traffix 7.9.0415 (c) 2007 Dowling Assoc. Licensed to W-TRANS, Santa Rosa, CA
AM Existing plus Project Fri Jul 24, 2009 14:24:51 Page 3-1
--------------------------------------------------------------------------------
AM Peak Hour - Existing plus Project Conditions
Traffic Impact Study for the WinCo Foods Expansion
City of Chico
--------------------------------------------------------------------------------
Level Of Service Computation Report
2000 HCM Unsignalized Method (Future Volume Alternative)
********************************************************************************
Intersection #1 Forest Ave/WinCo access-Mall access
********************************************************************************
Average Delay (sec/veh): 1.0 Worst Case Level Of Service: B[ 12.9]
********************************************************************************
Street Name: Forest Ave WinCo access-Mall access
Approach: North Bound South Bound East Bound West Bound
Movement: L - T - R L - T - R L - T - R L - T - R
------------|---------------||---------------||---------------||---------------|
Control: Uncontrolled Uncontrolled Stop Sign Stop Sign
Rights: Include Include Include Include
Lanes: 1 0 2 0 1 1 0 1 1 0 0 0 1! 0 0 0 0 1! 0 1
------------|---------------||---------------||---------------||---------------|
Volume Module:
Base Vol: 15 317 49 30 437 8 4 0 5 7 0 16
Growth Adj: 1.00 1.00 1.00 1.00 1.00 1.00 1.00 1.00 1.00 1.00 1.00 1.00
Initial Bse: 15 317 49 30 437 8 4 0 5 7 0 16
Added Vol: 0 0 8 7 0 0 0 0 0 3 0 5
PasserByVol: 0 0 0 0 0 0 0 0 0 0 0 0
Initial Fut: 15 317 57 37 437 8 4 0 5 10 0 21
User Adj: 1.00 1.00 1.00 1.00 1.00 1.00 1.00 1.00 1.00 1.00 1.00 1.00
PHF Adj: 1.00 1.00 1.00 1.00 1.00 1.00 1.00 1.00 1.00 1.00 1.00 1.00
PHF Volume: 15 317 57 37 437 8 4 0 5 10 0 21
Reduct Vol: 0 0 0 0 0 0 0 0 0 0 0 0
FinalVolume: 15 317 57 37 437 8 4 0 5 10 0 21
------------|---------------||---------------||---------------||---------------|
Critical Gap Module:
Critical Gp: 4.1 xxxx xxxxx 4.1 xxxx xxxxx 7.5 6.5 6.9 7.5 6.5 6.9
FollowUpTim: 2.2 xxxx xxxxx 2.2 xxxx xxxxx 3.5 4.0 3.3 3.5 4.0 3.3
------------|---------------||---------------||---------------||---------------|
Capacity Module:
Cnflict Vol: 445 xxxx xxxxx 374 xxxx xxxxx 704 919 223 640 866 159
Potent Cap.: 1126 xxxx xxxxx 1196 xxxx xxxxx 328 273 787 364 293 865
Move Cap.: 1126 xxxx xxxxx 1196 xxxx xxxxx 309 261 787 350 281 865
Volume/Cap: 0.01 xxxx xxxx 0.03 xxxx xxxx 0.01 0.00 0.01 0.03 0.00 0.02
------------|---------------||---------------||---------------||---------------|
Level Of Service Module:
2Way95thQ: 0.0 xxxx xxxxx 0.1 xxxx xxxxx xxxx xxxx xxxxx xxxx xxxx 0.0
Control Del: 8.2 xxxx xxxxx 8.1 xxxx xxxxx xxxxx xxxx xxxxx xxxxx xxxx 9.2
LOS by Move: A * * A * * * * * * * A
Movement: LT - LTR - RT LT - LTR - RT LT - LTR - RT LT - LTR - RT
Shared Cap.: xxxx xxxx xxxxx xxxx xxxx xxxxx xxxx 467 xxxxx xxxx 504 xxxxx
SharedQueue:xxxxx xxxx xxxxx xxxxx xxxx xxxxx xxxxx 0.1 xxxxx xxxxx 0.1 xxxxx
Shrd ConDel:xxxxx xxxx xxxxx xxxxx xxxx xxxxx xxxxx 12.9 xxxxx xxxxx 12.5 xxxxx
Shared LOS: * * * * * * * B * * B *
ApproachDel: xxxxxx xxxxxx 12.9 11.4
ApproachLOS: * * B B
********************************************************************************
Note: Queue reported is the number of cars per lane.
********************************************************************************
Traffix 7.9.0415 (c) 2007 Dowling Assoc. Licensed to W-TRANS, Santa Rosa, CA
PM Existing plus Project Fri Jul 24, 2009 10:39:04 Page 3-1
--------------------------------------------------------------------------------
PM Peak Hour - Existing plus Project Conditions
Traffic Impact Study for the WinCo Foods Expansion
City of Chico
--------------------------------------------------------------------------------
Level Of Service Computation Report
2000 HCM Unsignalized Method (Future Volume Alternative)
********************************************************************************
Intersection #1 Forest Ave/WinCo access-Mall access
********************************************************************************
Average Delay (sec/veh): 4.6 Worst Case Level Of Service: C[ 23.1]
********************************************************************************
Street Name: Forest Ave WinCo access-Mall access
Approach: North Bound South Bound East Bound West Bound
Movement: L - T - R L - T - R L - T - R L - T - R
------------|---------------||---------------||---------------||---------------|
Control: Uncontrolled Uncontrolled Stop Sign Stop Sign
Rights: Include Include Include Include
Lanes: 1 0 2 0 1 1 0 1 1 0 0 0 1! 0 0 0 0 1! 0 1
------------|---------------||---------------||---------------||---------------|
Volume Module:
Base Vol: 47 510 152 71 434 34 29 8 54 48 5 99
Growth Adj: 1.00 1.00 1.00 1.00 1.00 1.00 1.00 1.00 1.00 1.00 1.00 1.00
Initial Bse: 47 510 152 71 434 34 29 8 54 48 5 99
Added Vol: 0 0 11 9 0 0 0 0 0 7 0 9
PasserByVol: 0 0 0 0 0 0 0 0 0 0 0 0
Initial Fut: 47 510 163 80 434 34 29 8 54 55 5 108
User Adj: 1.00 1.00 1.00 1.00 1.00 1.00 1.00 1.00 1.00 1.00 1.00 1.00
PHF Adj: 1.00 1.00 1.00 1.00 1.00 1.00 1.00 1.00 1.00 1.00 1.00 1.00
PHF Volume: 47 510 163 80 434 34 29 8 54 55 5 108
Reduct Vol: 0 0 0 0 0 0 0 0 0 0 0 0
FinalVolume: 47 510 163 80 434 34 29 8 54 55 5 108
------------|---------------||---------------||---------------||---------------|
Critical Gap Module:
Critical Gp: 4.1 xxxx xxxxx 4.1 xxxx xxxxx 7.5 6.5 6.9 7.5 6.5 6.9
FollowUpTim: 2.2 xxxx xxxxx 2.2 xxxx xxxxx 3.5 4.0 3.3 3.5 4.0 3.3
------------|---------------||---------------||---------------||---------------|
Capacity Module:
Cnflict Vol: 468 xxxx xxxxx 673 xxxx xxxxx 963 1378 234 985 1232 255
Potent Cap.: 1104 xxxx xxxxx 927 xxxx xxxxx 213 146 774 205 179 750
Move Cap.: 1104 xxxx xxxxx 927 xxxx xxxxx 161 128 774 165 156 750
Volume/Cap: 0.04 xxxx xxxx 0.09 xxxx xxxx 0.18 0.06 0.07 0.33 0.03 0.14
------------|---------------||---------------||---------------||---------------|
Level Of Service Module:
2Way95thQ: 0.1 xxxx xxxxx 0.3 xxxx xxxxx xxxx xxxx xxxxx xxxx xxxx 0.2
Control Del: 8.4 xxxx xxxxx 9.2 xxxx xxxxx xxxxx xxxx xxxxx xxxxx xxxx 10.2
LOS by Move: A * * A * * * * * * * B
Movement: LT - LTR - RT LT - LTR - RT LT - LTR - RT LT - LTR - RT
Shared Cap.: xxxx xxxx xxxxx xxxx xxxx xxxxx xxxx 291 xxxxx xxxx 260 xxxxx
SharedQueue:xxxxx xxxx xxxxx xxxxx xxxx xxxxx xxxxx 1.3 xxxxx xxxxx 2.1 xxxxx
Shrd ConDel:xxxxx xxxx xxxxx xxxxx xxxx xxxxx xxxxx 22.9 xxxxx xxxxx 29.2 xxxxx
Shared LOS: * * * * * * * C * * D *
ApproachDel: xxxxxx xxxxxx 22.9 23.1
ApproachLOS: * * C C
********************************************************************************
Note: Queue reported is the number of cars per lane.
********************************************************************************
Traffix 7.9.0415 (c) 2007 Dowling Assoc. Licensed to W-TRANS, Santa Rosa, CA

AM Existing plus Project Fri Jul 24, 2009 10:38:58 Page 4-1
--------------------------------------------------------------------------------
AM Peak Hour - Existing plus Project Conditions
Traffic Impact Study for the WinCo Foods Expansion
City of Chico
--------------------------------------------------------------------------------
Level Of Service Computation Report
2000 HCM Operations Method (Future Volume Alternative)
********************************************************************************
Intersection #2 East 20th St/Forest Ave
********************************************************************************
Cycle (sec): 100 Critical Vol./Cap.(X): 0.379
Loss Time (sec): 8 (Y+R=4.0 sec) Average Delay (sec/veh): 30.1
Optimal Cycle: 26 Level Of Service: C
********************************************************************************
Street Name: Forest Ave East 20th St
Approach: North Bound South Bound East Bound West Bound
Movement: L - T - R L - T - R L - T - R L - T - R
------------|---------------||---------------||---------------||---------------|
Control: Protected Protected Protected Protected
Rights: Include Include Include Include
Min. Green: 0 0 0 0 0 0 0 0 0 0 0 0
Lanes: 1 0 2 0 1 1 0 1 1 0 1 0 1 1 0 1 0 2 0 1
------------|---------------||---------------||---------------||---------------|
Volume Module:
Base Vol: 134 124 21 84 206 185 125 179 186 46 229 139
Growth Adj: 1.00 1.00 1.00 1.00 1.00 1.00 1.00 1.00 1.00 1.00 1.00 1.00
Initial Bse: 134 124 21 84 206 185 125 179 186 46 229 139
Added Vol: 0 5 0 0 2 2 3 0 0 1 1 0
PasserByVol: 0 0 0 0 0 0 0 0 0 0 0 0
Initial Fut: 134 129 21 84 208 187 128 179 186 47 230 139
User Adj: 1.00 1.00 1.00 1.00 1.00 1.00 1.00 1.00 1.00 1.00 1.00 1.00
PHF Adj: 1.00 1.00 1.00 1.00 1.00 1.00 1.00 1.00 1.00 1.00 1.00 1.00
PHF Volume: 134 129 21 84 208 187 128 179 186 47 230 139
Reduct Vol: 0 0 0 0 0 0 0 0 0 0 0 0
Reduced Vol: 134 129 21 84 208 187 128 179 186 47 230 139
PCE Adj: 1.00 1.00 1.00 1.00 1.00 1.00 1.00 1.00 1.00 1.00 1.00 1.00
MLF Adj: 1.00 1.00 1.00 1.00 1.00 1.00 1.00 1.00 1.00 1.00 1.00 1.00
FinalVolume: 134 129 21 84 208 187 128 179 186 47 230 139
------------|---------------||---------------||---------------||---------------|
Saturation Flow Module:
Sat/Lane: 1900 1900 1900 1900 1900 1900 1900 1900 1900 1900 1900 1900
Adjustment: 0.95 0.95 0.85 0.95 0.88 0.88 0.95 0.88 0.88 0.95 0.95 0.85
Lanes: 1.00 2.00 1.00 1.00 1.05 0.95 1.00 1.00 1.00 1.00 2.00 1.00
Final Sat.: 1805 3610 1615 1805 1766 1588 1805 1668 1668 1805 3610 1615
------------|---------------||---------------||---------------||---------------|
Capacity Analysis Module:
Vol/Sat: 0.07 0.04 0.01 0.05 0.12 0.12 0.07 0.11 0.11 0.03 0.06 0.09
Crit Moves: **** **** **** ****
Green/Cycle: 0.20 0.22 0.22 0.29 0.31 0.31 0.19 0.34 0.34 0.08 0.23 0.23
Volume/Cap: 0.38 0.16 0.06 0.16 0.38 0.38 0.38 0.32 0.33 0.33 0.28 0.38
Delay/Veh: 35.6 31.7 30.9 26.9 27.2 27.2 36.3 24.9 25.0 45.0 32.1 33.4
User DelAdj: 1.00 1.00 1.00 1.00 1.00 1.00 1.00 1.00 1.00 1.00 1.00 1.00
AdjDel/Veh: 35.6 31.7 30.9 26.9 27.2 27.2 36.3 24.9 25.0 45.0 32.1 33.4
LOS by Move: D C C C C C D C C D C C
HCM2k95thQ: 8 4 1 4 10 10 7 9 9 3 6 7
********************************************************************************
Note: Queue reported is the number of cars per lane.
Traffix 7.9.0415 (c) 2007 Dowling Assoc. Licensed to W-TRANS, Santa Rosa, CA
PM Existing plus Project Fri Jul 24, 2009 14:24:58 Page 4-1
--------------------------------------------------------------------------------
PM Peak Hour - Existing plus Project Conditions
Traffic Impact Study for the WinCo Foods Expansion
City of Chico
--------------------------------------------------------------------------------
Level Of Service Computation Report
2000 HCM Operations Method (Future Volume Alternative)
********************************************************************************
Intersection #2 East 20th St/Forest Ave
********************************************************************************
Cycle (sec): 100 Critical Vol./Cap.(X): 0.653
Loss Time (sec): 8 (Y+R=4.0 sec) Average Delay (sec/veh): 34.4
Optimal Cycle: 43 Level Of Service: C
********************************************************************************
Street Name: Forest Ave East 20th St
Approach: North Bound South Bound East Bound West Bound
Movement: L - T - R L - T - R L - T - R L - T - R
------------|---------------||---------------||---------------||---------------|
Control: Protected Protected Protected Protected
Rights: Include Include Include Include
Min. Green: 0 0 0 0 0 0 0 0 0 0 0 0
Lanes: 1 0 2 0 1 1 0 1 1 0 1 0 1 1 0 1 0 2 0 1
------------|---------------||---------------||---------------||---------------|
Volume Module:
Base Vol: 358 314 97 139 255 220 309 458 153 64 307 119
Growth Adj: 1.00 1.00 1.00 1.00 1.00 1.00 1.00 1.00 1.00 1.00 1.00 1.00
Initial Bse: 358 314 97 139 255 220 309 458 153 64 307 119
Added Vol: 0 6 0 0 3 3 5 0 0 2 1 0
PasserByVol: 0 0 0 0 0 0 0 0 0 0 0 0
Initial Fut: 358 320 97 139 258 223 314 458 153 66 308 119
User Adj: 1.00 1.00 1.00 1.00 1.00 1.00 1.00 1.00 1.00 1.00 1.00 1.00
PHF Adj: 1.00 1.00 1.00 1.00 1.00 1.00 1.00 1.00 1.00 1.00 1.00 1.00
PHF Volume: 358 320 97 139 258 223 314 458 153 66 308 119
Reduct Vol: 0 0 0 0 0 0 0 0 0 0 0 0
Reduced Vol: 358 320 97 139 258 223 314 458 153 66 308 119
PCE Adj: 1.00 1.00 1.00 1.00 1.00 1.00 1.00 1.00 1.00 1.00 1.00 1.00
MLF Adj: 1.00 1.00 1.00 1.00 1.00 1.00 1.00 1.00 1.00 1.00 1.00 1.00
FinalVolume: 358 320 97 139 258 223 314 458 153 66 308 119
------------|---------------||---------------||---------------||---------------|
Saturation Flow Module:
Sat/Lane: 1900 1900 1900 1900 1900 1900 1900 1900 1900 1900 1900 1900
Adjustment: 0.95 0.95 0.85 0.95 0.88 0.88 0.95 0.91 0.91 0.95 0.95 0.85
Lanes: 1.00 2.00 1.00 1.00 1.07 0.93 1.00 1.50 0.50 1.00 2.00 1.00
Final Sat.: 1805 3610 1615 1805 1801 1557 1805 2606 871 1805 3610 1615
------------|---------------||---------------||---------------||---------------|
Capacity Analysis Module:
Vol/Sat: 0.20 0.09 0.06 0.08 0.14 0.14 0.17 0.18 0.18 0.04 0.09 0.07
Crit Moves: **** **** **** ****
Green/Cycle: 0.30 0.28 0.28 0.24 0.22 0.22 0.27 0.33 0.33 0.07 0.13 0.13
Volume/Cap: 0.65 0.32 0.21 0.32 0.65 0.65 0.65 0.53 0.53 0.53 0.65 0.56
Delay/Veh: 33.1 28.6 27.8 31.4 37.7 37.7 35.8 27.8 27.8 49.6 44.6 44.3
User DelAdj: 1.00 1.00 1.00 1.00 1.00 1.00 1.00 1.00 1.00 1.00 1.00 1.00
AdjDel/Veh: 33.1 28.6 27.8 31.4 37.7 37.7 35.8 27.8 27.8 49.6 44.6 44.3
LOS by Move: C C C C D D D C C D D D
HCM2k95thQ: 19 8 5 7 15 15 18 16 16 4 9 7
********************************************************************************
Note: Queue reported is the number of cars per lane.
Traffix 7.9.0415 (c) 2007 Dowling Assoc. Licensed to W-TRANS, Santa Rosa, CA
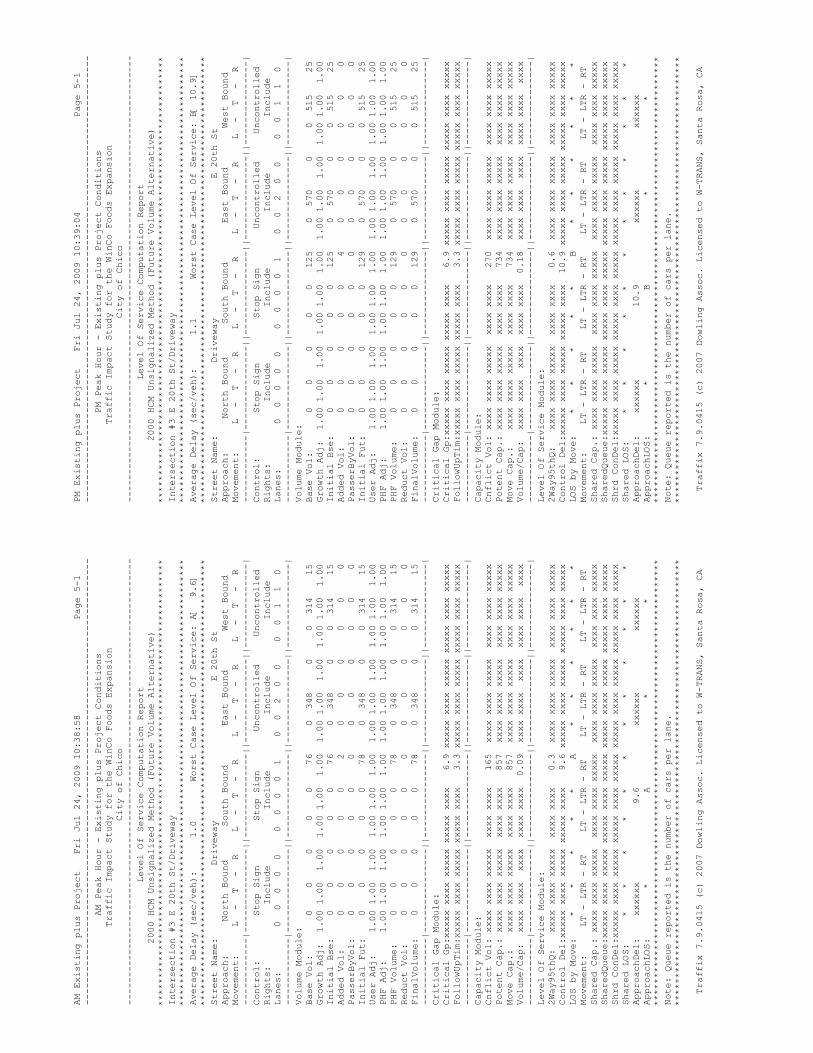
AM Existing plus Project Fri Jul 24, 2009 10:38:58 Page 5-1
--------------------------------------------------------------------------------
AM Peak Hour - Existing plus Project Conditions
Traffic Impact Study for the WinCo Foods Expansion
City of Chico
--------------------------------------------------------------------------------
Level Of Service Computation Report
2000 HCM Unsignalized Method (Future Volume Alternative)
********************************************************************************
Intersection #3 E 20th St/Driveway
********************************************************************************
Average Delay (sec/veh): 1.0 Worst Case Level Of Service: A[ 9.6]
********************************************************************************
Street Name: Driveway E 20th St
Approach: North Bound South Bound East Bound West Bound
Movement: L - T - R L - T - R L - T - R L - T - R
------------|---------------||---------------||---------------||---------------|
Control: Stop Sign Stop Sign Uncontrolled Uncontrolled
Rights: Include Include Include Include
Lanes: 0 0 0 0 0 0 0 0 0 1 0 0 2 0 0 0 0 1 1 0
------------|---------------||---------------||---------------||---------------|
Volume Module:
Base Vol: 0 0 0 0 0 76 0 348 0 0 314 15
Growth Adj: 1.00 1.00 1.00 1.00 1.00 1.00 1.00 1.00 1.00 1.00 1.00 1.00
Initial Bse: 0 0 0 0 0 76 0 348 0 0 314 15
Added Vol: 0 0 0 0 0 2 0 0 0 0 0 0
PasserByVol: 0 0 0 0 0 0 0 0 0 0 0 0
Initial Fut: 0 0 0 0 0 78 0 348 0 0 314 15
User Adj: 1.00 1.00 1.00 1.00 1.00 1.00 1.00 1.00 1.00 1.00 1.00 1.00
PHF Adj: 1.00 1.00 1.00 1.00 1.00 1.00 1.00 1.00 1.00 1.00 1.00 1.00
PHF Volume: 0 0 0 0 0 78 0 348 0 0 314 15
Reduct Vol: 0 0 0 0 0 0 0 0 0 0 0 0
FinalVolume: 0 0 0 0 0 78 0 348 0 0 314 15
------------|---------------||---------------||---------------||---------------|
Critical Gap Module:
Critical Gp:xxxxx xxxx xxxxx xxxxx xxxx 6.9 xxxxx xxxx xxxxx xxxxx xxxx xxxxx
FollowUpTim:xxxxx xxxx xxxxx xxxxx xxxx 3.3 xxxxx xxxx xxxxx xxxxx xxxx xxxxx
------------|---------------||---------------||---------------||---------------|
Capacity Module:
Cnflict Vol: xxxx xxxx xxxxx xxxx xxxx 165 xxxx xxxx xxxxx xxxx xxxx xxxxx
Potent Cap.: xxxx xxxx xxxxx xxxx xxxx 857 xxxx xxxx xxxxx xxxx xxxx xxxxx
Move Cap.: xxxx xxxx xxxxx xxxx xxxx 857 xxxx xxxx xxxxx xxxx xxxx xxxxx
Volume/Cap: xxxx xxxx xxxx xxxx xxxx 0.09 xxxx xxxx xxxx xxxx xxxx xxxx
------------|---------------||---------------||---------------||---------------|
Level Of Service Module:
2Way95thQ: xxxx xxxx xxxxx xxxx xxxx 0.3 xxxx xxxx xxxxx xxxx xxxx xxxxx
Control Del:xxxxx xxxx xxxxx xxxxx xxxx 9.6 xxxxx xxxx xxxxx xxxxx xxxx xxxxx
LOS by Move: * * * * * A * * * * * *
Movement: LT - LTR - RT LT - LTR - RT LT - LTR - RT LT - LTR - RT
Shared Cap.: xxxx xxxx xxxxx xxxx xxxx xxxxx xxxx xxxx xxxxx xxxx xxxx xxxxx
SharedQueue:xxxxx xxxx xxxxx xxxxx xxxx xxxxx xxxxx xxxx xxxxx xxxxx xxxx xxxxx
Shrd ConDel:xxxxx xxxx xxxxx xxxxx xxxx xxxxx xxxxx xxxx xxxxx xxxxx xxxx xxxxx
Shared LOS: * * * * * * * * * * * *
ApproachDel: xxxxxx 9.6 xxxxxx xxxxxx
ApproachLOS: * A * *
********************************************************************************
Note: Queue reported is the number of cars per lane.
********************************************************************************
Traffix 7.9.0415 (c) 2007 Dowling Assoc. Licensed to W-TRANS, Santa Rosa, CA
PM Existing plus Project Fri Jul 24, 2009 10:39:04 Page 5-1
--------------------------------------------------------------------------------
PM Peak Hour - Existing plus Project Conditions
Traffic Impact Study for the WinCo Foods Expansion
City of Chico
--------------------------------------------------------------------------------
Level Of Service Computation Report
2000 HCM Unsignalized Method (Future Volume Alternative)
********************************************************************************
Intersection #3 E 20th St/Driveway
********************************************************************************
Average Delay (sec/veh): 1.1 Worst Case Level Of Service: B[ 10.9]
********************************************************************************
Street Name: Driveway E 20th St
Approach: North Bound South Bound East Bound West Bound
Movement: L - T - R L - T - R L - T - R L - T - R
------------|---------------||---------------||---------------||---------------|
Control: Stop Sign Stop Sign Uncontrolled Uncontrolled
Rights: Include Include Include Include
Lanes: 0 0 0 0 0 0 0 0 0 1 0 0 2 0 0 0 0 1 1 0
------------|---------------||---------------||---------------||---------------|
Volume Module:
Base Vol: 0 0 0 0 0 125 0 570 0 0 515 25
Growth Adj: 1.00 1.00 1.00 1.00 1.00 1.00 1.00 1.00 1.00 1.00 1.00 1.00
Initial Bse: 0 0 0 0 0 125 0 570 0 0 515 25
Added Vol: 0 0 0 0 0 4 0 0 0 0 0 0
PasserByVol: 0 0 0 0 0 0 0 0 0 0 0 0
Initial Fut: 0 0 0 0 0 129 0 570 0 0 515 25
User Adj: 1.00 1.00 1.00 1.00 1.00 1.00 1.00 1.00 1.00 1.00 1.00 1.00
PHF Adj: 1.00 1.00 1.00 1.00 1.00 1.00 1.00 1.00 1.00 1.00 1.00 1.00
PHF Volume: 0 0 0 0 0 129 0 570 0 0 515 25
Reduct Vol: 0 0 0 0 0 0 0 0 0 0 0 0
FinalVolume: 0 0 0 0 0 129 0 570 0 0 515 25
------------|---------------||---------------||---------------||---------------|
Critical Gap Module:
Critical Gp:xxxxx xxxx xxxxx xxxxx xxxx 6.9 xxxxx xxxx xxxxx xxxxx xxxx xxxxx
FollowUpTim:xxxxx xxxx xxxxx xxxxx xxxx 3.3 xxxxx xxxx xxxxx xxxxx xxxx xxxxx
------------|---------------||---------------||---------------||---------------|
Capacity Module:
Cnflict Vol: xxxx xxxx xxxxx xxxx xxxx 270 xxxx xxxx xxxxx xxxx xxxx xxxxx
Potent Cap.: xxxx xxxx xxxxx xxxx xxxx 734 xxxx xxxx xxxxx xxxx xxxx xxxxx
Move Cap.: xxxx xxxx xxxxx xxxx xxxx 734 xxxx xxxx xxxxx xxxx xxxx xxxxx
Volume/Cap: xxxx xxxx xxxx xxxx xxxx 0.18 xxxx xxxx xxxx xxxx xxxx xxxx
------------|---------------||---------------||---------------||---------------|
Level Of Service Module:
2Way95thQ: xxxx xxxx xxxxx xxxx xxxx 0.6 xxxx xxxx xxxxx xxxx xxxx xxxxx
Control Del:xxxxx xxxx xxxxx xxxxx xxxx 10.9 xxxxx xxxx xxxxx xxxxx xxxx xxxxx
LOS by Move: * * * * * B * * * * * *
Movement: LT - LTR - RT LT - LTR - RT LT - LTR - RT LT - LTR - RT
Shared Cap.: xxxx xxxx xxxxx xxxx xxxx xxxxx xxxx xxxx xxxxx xxxx xxxx xxxxx
SharedQueue:xxxxx xxxx xxxxx xxxxx xxxx xxxxx xxxxx xxxx xxxxx xxxxx xxxx xxxxx
Shrd ConDel:xxxxx xxxx xxxxx xxxxx xxxx xxxxx xxxxx xxxx xxxxx xxxxx xxxx xxxxx
Shared LOS: * * * * * * * * * * * *
ApproachDel: xxxxxx 10.9 xxxxxx xxxxxx
ApproachLOS: * B * *
********************************************************************************
Note: Queue reported is the number of cars per lane.
********************************************************************************
Traffix 7.9.0415 (c) 2007 Dowling Assoc. Licensed to W-TRANS, Santa Rosa, CA
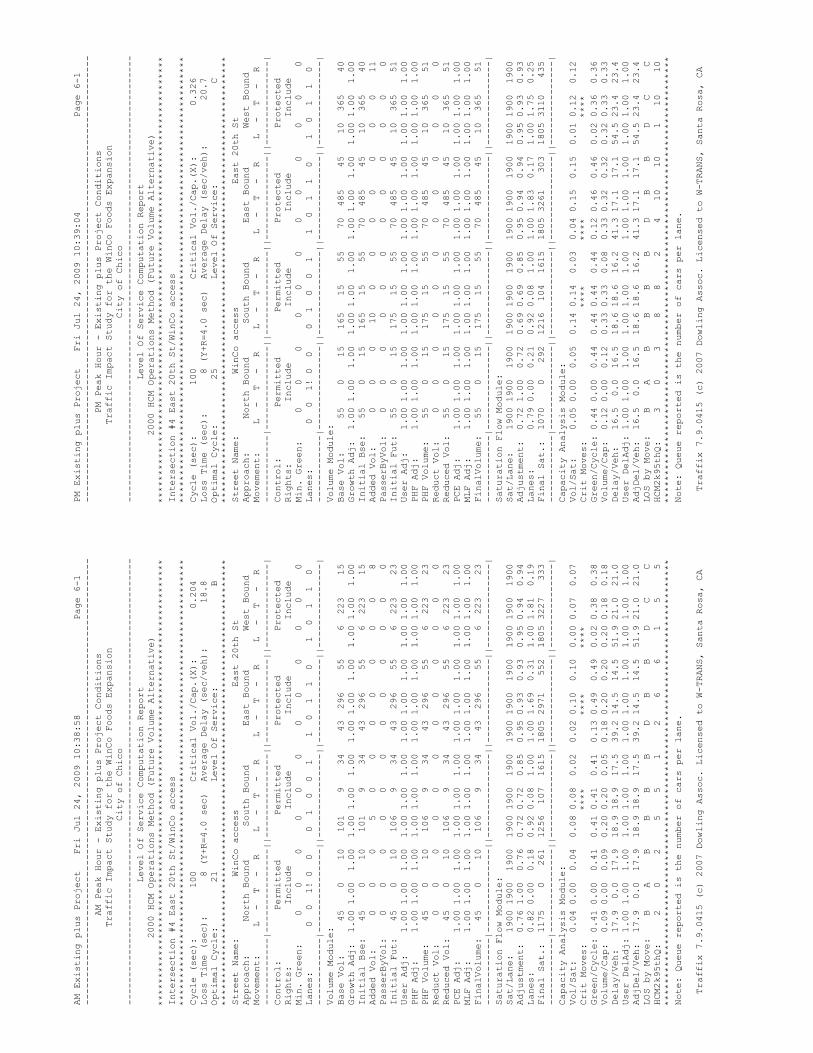
AM Existing plus Project Fri Jul 24, 2009 10:38:58 Page 6-1
--------------------------------------------------------------------------------
AM Peak Hour - Existing plus Project Conditions
Traffic Impact Study for the WinCo Foods Expansion
City of Chico
--------------------------------------------------------------------------------
Level Of Service Computation Report
2000 HCM Operations Method (Future Volume Alternative)
********************************************************************************
Intersection #4 East 20th St/WinCo access
********************************************************************************
Cycle (sec): 100 Critical Vol./Cap.(X): 0.204
Loss Time (sec): 8 (Y+R=4.0 sec) Average Delay (sec/veh): 18.8
Optimal Cycle: 21 Level Of Service: B
********************************************************************************
Street Name: WinCo access East 20th St
Approach: North Bound South Bound East Bound West Bound
Movement: L - T - R L - T - R L - T - R L - T - R
------------|---------------||---------------||---------------||---------------|
Control: Permitted Permitted Protected Protected
Rights: Include Include Include Include
Min. Green: 0 0 0 0 0 0 0 0 0 0 0 0
Lanes: 0 0 1! 0 0 0 1 0 0 1 1 0 1 1 0 1 0 1 1 0
------------|---------------||---------------||---------------||---------------|
Volume Module:
Base Vol: 45 0 10 101 9 34 43 296 55 6 223 15
Growth Adj: 1.00 1.00 1.00 1.00 1.00 1.00 1.00 1.00 1.00 1.00 1.00 1.00
Initial Bse: 45 0 10 101 9 34 43 296 55 6 223 15
Added Vol: 0 0 0 5 0 0 0 0 0 0 0 8
PasserByVol: 0 0 0 0 0 0 0 0 0 0 0 0
Initial Fut: 45 0 10 106 9 34 43 296 55 6 223 23
User Adj: 1.00 1.00 1.00 1.00 1.00 1.00 1.00 1.00 1.00 1.00 1.00 1.00
PHF Adj: 1.00 1.00 1.00 1.00 1.00 1.00 1.00 1.00 1.00 1.00 1.00 1.00
PHF Volume: 45 0 10 106 9 34 43 296 55 6 223 23
Reduct Vol: 0 0 0 0 0 0 0 0 0 0 0 0
Reduced Vol: 45 0 10 106 9 34 43 296 55 6 223 23
PCE Adj: 1.00 1.00 1.00 1.00 1.00 1.00 1.00 1.00 1.00 1.00 1.00 1.00
MLF Adj: 1.00 1.00 1.00 1.00 1.00 1.00 1.00 1.00 1.00 1.00 1.00 1.00
FinalVolume: 45 0 10 106 9 34 43 296 55 6 223 23
------------|---------------||---------------||---------------||---------------|
Saturation Flow Module:
Sat/Lane: 1900 1900 1900 1900 1900 1900 1900 1900 1900 1900 1900 1900
Adjustment: 0.76 1.00 0.76 0.72 0.72 0.85 0.95 0.93 0.93 0.95 0.94 0.94
Lanes: 0.82 0.00 0.18 0.92 0.08 1.00 1.00 1.69 0.31 1.00 1.81 0.19
Final Sat.: 1175 0 261 1256 107 1615 1805 2971 552 1805 3227 333
------------|---------------||---------------||---------------||---------------|
Capacity Analysis Module:
Vol/Sat: 0.04 0.00 0.04 0.08 0.08 0.02 0.02 0.10 0.10 0.00 0.07 0.07
Crit Moves: **** **** ****
Green/Cycle: 0.41 0.00 0.41 0.41 0.41 0.41 0.13 0.49 0.49 0.02 0.38 0.38
Volume/Cap: 0.09 0.00 0.09 0.20 0.20 0.05 0.18 0.20 0.20 0.20 0.18 0.18
Delay/Veh: 17.9 0.0 17.9 18.9 18.9 17.5 39.2 14.5 14.5 51.9 21.0 21.0
User DelAdj: 1.00 1.00 1.00 1.00 1.00 1.00 1.00 1.00 1.00 1.00 1.00 1.00
AdjDel/Veh: 17.9 0.0 17.9 18.9 18.9 17.5 39.2 14.5 14.5 51.9 21.0 21.0
LOS by Move: B A B B B B D B B D C C
HCM2k95thQ: 2 0 2 5 5 1 2 6 6 1 5 5
********************************************************************************
Note: Queue reported is the number of cars per lane.
Traffix 7.9.0415 (c) 2007 Dowling Assoc. Licensed to W-TRANS, Santa Rosa, CA
PM Existing plus Project Fri Jul 24, 2009 10:39:04 Page 6-1
--------------------------------------------------------------------------------
PM Peak Hour - Existing plus Project Conditions
Traffic Impact Study for the WinCo Foods Expansion
City of Chico
--------------------------------------------------------------------------------
Level Of Service Computation Report
2000 HCM Operations Method (Future Volume Alternative)
********************************************************************************
Intersection #4 East 20th St/WinCo access
********************************************************************************
Cycle (sec): 100 Critical Vol./Cap.(X): 0.326
Loss Time (sec): 8 (Y+R=4.0 sec) Average Delay (sec/veh): 20.7
Optimal Cycle: 25 Level Of Service: C
********************************************************************************
Street Name: WinCo access East 20th St
Approach: North Bound South Bound East Bound West Bound
Movement: L - T - R L - T - R L - T - R L - T - R
------------|---------------||---------------||---------------||---------------|
Control: Permitted Permitted Protected Protected
Rights: Include Include Include Include
Min. Green: 0 0 0 0 0 0 0 0 0 0 0 0
Lanes: 0 0 1! 0 0 0 1 0 0 1 1 0 1 1 0 1 0 1 1 0
------------|---------------||---------------||---------------||---------------|
Volume Module:
Base Vol: 55 0 15 165 15 55 70 485 45 10 365 40
Growth Adj: 1.00 1.00 1.00 1.00 1.00 1.00 1.00 1.00 1.00 1.00 1.00 1.00
Initial Bse: 55 0 15 165 15 55 70 485 45 10 365 40
Added Vol: 0 0 0 10 0 0 0 0 0 0 0 11
PasserByVol: 0 0 0 0 0 0 0 0 0 0 0 0
Initial Fut: 55 0 15 175 15 55 70 485 45 10 365 51
User Adj: 1.00 1.00 1.00 1.00 1.00 1.00 1.00 1.00 1.00 1.00 1.00 1.00
PHF Adj: 1.00 1.00 1.00 1.00 1.00 1.00 1.00 1.00 1.00 1.00 1.00 1.00
PHF Volume: 55 0 15 175 15 55 70 485 45 10 365 51
Reduct Vol: 0 0 0 0 0 0 0 0 0 0 0 0
Reduced Vol: 55 0 15 175 15 55 70 485 45 10 365 51
PCE Adj: 1.00 1.00 1.00 1.00 1.00 1.00 1.00 1.00 1.00 1.00 1.00 1.00
MLF Adj: 1.00 1.00 1.00 1.00 1.00 1.00 1.00 1.00 1.00 1.00 1.00 1.00
FinalVolume: 55 0 15 175 15 55 70 485 45 10 365 51
------------|---------------||---------------||---------------||---------------|
Saturation Flow Module:
Sat/Lane: 1900 1900 1900 1900 1900 1900 1900 1900 1900 1900 1900 1900
Adjustment: 0.72 1.00 0.72 0.69 0.69 0.85 0.95 0.94 0.94 0.95 0.93 0.93
Lanes: 0.79 0.00 0.21 0.92 0.08 1.00 1.00 1.83 0.17 1.00 1.75 0.25
Final Sat.: 1070 0 292 1216 104 1615 1805 3261 303 1805 3110 435
------------|---------------||---------------||---------------||---------------|
Capacity Analysis Module:
Vol/Sat: 0.05 0.00 0.05 0.14 0.14 0.03 0.04 0.15 0.15 0.01 0.12 0.12
Crit Moves: **** **** ****
Green/Cycle: 0.44 0.00 0.44 0.44 0.44 0.44 0.12 0.46 0.46 0.02 0.36 0.36
Volume/Cap: 0.12 0.00 0.12 0.33 0.33 0.08 0.33 0.32 0.32 0.32 0.33 0.33
Delay/Veh: 16.5 0.0 16.5 18.6 18.6 16.2 41.3 17.1 17.1 54.5 23.4 23.4
User DelAdj: 1.00 1.00 1.00 1.00 1.00 1.00 1.00 1.00 1.00 1.00 1.00 1.00
AdjDel/Veh: 16.5 0.0 16.5 18.6 18.6 16.2 41.3 17.1 17.1 54.5 23.4 23.4
LOS by Move: B A B B B B D B B D C C
HCM2k95thQ: 3 0 3 8 8 2 4 10 10 1 10 10
********************************************************************************
Note: Queue reported is the number of cars per lane.
Traffix 7.9.0415 (c) 2007 Dowling Assoc. Licensed to W-TRANS, Santa Rosa, CA
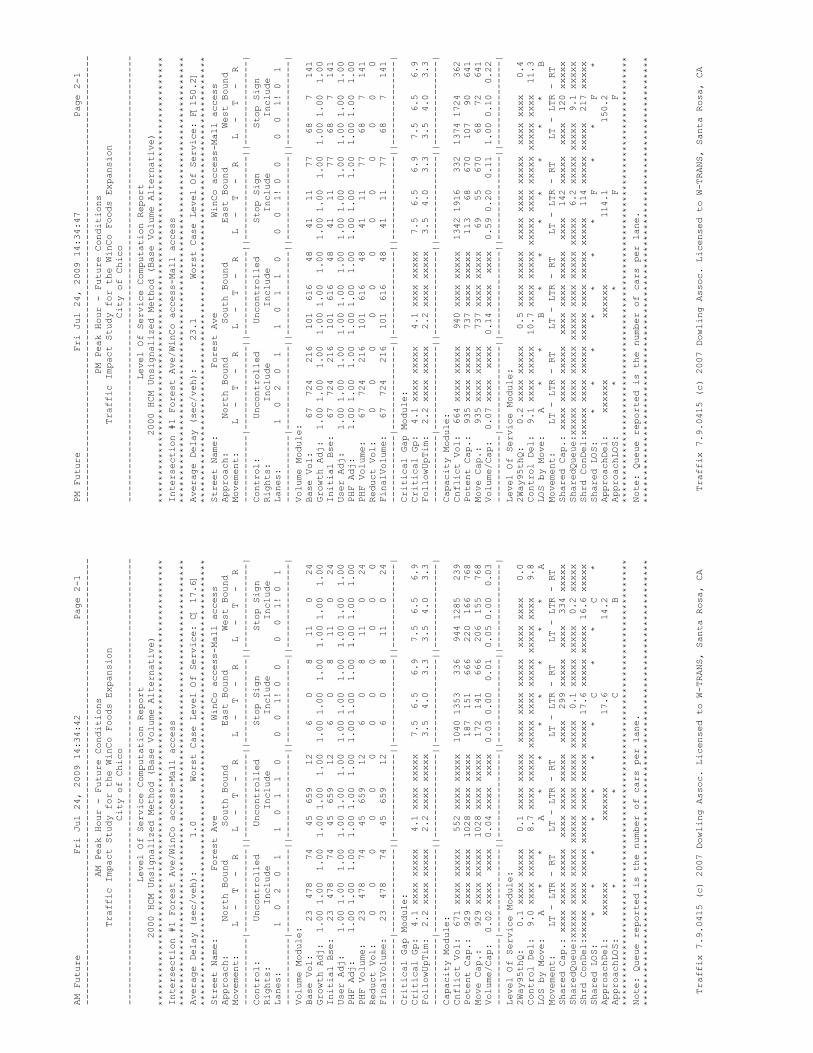
AM Future Fri Jul 24, 2009 14:34:42 Page 2-1
--------------------------------------------------------------------------------
AM Peak Hour - Future Conditions
Traffic Impact Study for the WinCo Foods Expansion
City of Chico
--------------------------------------------------------------------------------
Level Of Service Computation Report
2000 HCM Unsignalized Method (Base Volume Alternative)
********************************************************************************
Intersection #1 Forest Ave/WinCo access-Mall access
********************************************************************************
Average Delay (sec/veh): 1.0 Worst Case Level Of Service: C[ 17.6]
********************************************************************************
Street Name: Forest Ave WinCo access-Mall access
Approach: North Bound South Bound East Bound West Bound
Movement: L - T - R L - T - R L - T - R L - T - R
------------|---------------||---------------||---------------||---------------|
Control: Uncontrolled Uncontrolled Stop Sign Stop Sign
Rights: Include Include Include Include
Lanes: 1 0 2 0 1 1 0 1 1 0 0 0 1! 0 0 0 0 1! 0 1
------------|---------------||---------------||---------------||---------------|
Volume Module:
Base Vol: 23 478 74 45 659 12 6 0 8 11 0 24
Growth Adj: 1.00 1.00 1.00 1.00 1.00 1.00 1.00 1.00 1.00 1.00 1.00 1.00
Initial Bse: 23 478 74 45 659 12 6 0 8 11 0 24
User Adj: 1.00 1.00 1.00 1.00 1.00 1.00 1.00 1.00 1.00 1.00 1.00 1.00
PHF Adj: 1.00 1.00 1.00 1.00 1.00 1.00 1.00 1.00 1.00 1.00 1.00 1.00
PHF Volume: 23 478 74 45 659 12 6 0 8 11 0 24
Reduct Vol: 0 0 0 0 0 0 0 0 0 0 0 0
FinalVolume: 23 478 74 45 659 12 6 0 8 11 0 24
------------|---------------||---------------||---------------||---------------|
Critical Gap Module:
Critical Gp: 4.1 xxxx xxxxx 4.1 xxxx xxxxx 7.5 6.5 6.9 7.5 6.5 6.9
FollowUpTim: 2.2 xxxx xxxxx 2.2 xxxx xxxxx 3.5 4.0 3.3 3.5 4.0 3.3
------------|---------------||---------------||---------------||---------------|
Capacity Module:
Cnflict Vol: 671 xxxx xxxxx 552 xxxx xxxxx 1040 1353 336 944 1285 239
Potent Cap.: 929 xxxx xxxxx 1028 xxxx xxxxx 187 151 666 220 166 768
Move Cap.: 929 xxxx xxxxx 1028 xxxx xxxxx 172 141 666 206 155 768
Volume/Cap: 0.02 xxxx xxxx 0.04 xxxx xxxx 0.03 0.00 0.01 0.05 0.00 0.03
------------|---------------||---------------||---------------||---------------|
Level Of Service Module:
2Way95thQ: 0.1 xxxx xxxxx 0.1 xxxx xxxxx xxxx xxxx xxxxx xxxx xxxx 0.0
Control Del: 9.0 xxxx xxxxx 8.7 xxxx xxxxx xxxxx xxxx xxxxx xxxxx xxxx 9.8
LOS by Move: A * * A * * * * * * * A
Movement: LT - LTR - RT LT - LTR - RT LT - LTR - RT LT - LTR - RT
Shared Cap.: xxxx xxxx xxxxx xxxx xxxx xxxxx xxxx 299 xxxxx xxxx 334 xxxxx
SharedQueue:xxxxx xxxx xxxxx xxxxx xxxx xxxxx xxxxx 0.1 xxxxx xxxxx 0.2 xxxxx
Shrd ConDel:xxxxx xxxx xxxxx xxxxx xxxx xxxxx xxxxx 17.6 xxxxx xxxxx 16.6 xxxxx
Shared LOS: * * * * * * * C * * C *
ApproachDel: xxxxxx xxxxxx 17.6 14.2
ApproachLOS: * * C B
********************************************************************************
Note: Queue reported is the number of cars per lane.
********************************************************************************
Traffix 7.9.0415 (c) 2007 Dowling Assoc. Licensed to W-TRANS, Santa Rosa, CA
PM Future Fri Jul 24, 2009 14:34:47 Page 2-1
--------------------------------------------------------------------------------
PM Peak Hour - Future Conditions
Traffic Impact Study for the WinCo Foods Expansion
City of Chico
--------------------------------------------------------------------------------
Level Of Service Computation Report
2000 HCM Unsignalized Method (Base Volume Alternative)
********************************************************************************
Intersection #1 Forest Ave/WinCo access-Mall access
********************************************************************************
Average Delay (sec/veh): 23.1 Worst Case Level Of Service: F[150.2]
********************************************************************************
Street Name: Forest Ave WinCo access-Mall access
Approach: North Bound South Bound East Bound West Bound
Movement: L - T - R L - T - R L - T - R L - T - R
------------|---------------||---------------||---------------||---------------|
Control: Uncontrolled Uncontrolled Stop Sign Stop Sign
Rights: Include Include Include Include
Lanes: 1 0 2 0 1 1 0 1 1 0 0 0 1! 0 0 0 0 1! 0 1
------------|---------------||---------------||---------------||---------------|
Volume Module:
Base Vol: 67 724 216 101 616 48 41 11 77 68 7 141
Growth Adj: 1.00 1.00 1.00 1.00 1.00 1.00 1.00 1.00 1.00 1.00 1.00 1.00
Initial Bse: 67 724 216 101 616 48 41 11 77 68 7 141
User Adj: 1.00 1.00 1.00 1.00 1.00 1.00 1.00 1.00 1.00 1.00 1.00 1.00
PHF Adj: 1.00 1.00 1.00 1.00 1.00 1.00 1.00 1.00 1.00 1.00 1.00 1.00
PHF Volume: 67 724 216 101 616 48 41 11 77 68 7 141
Reduct Vol: 0 0 0 0 0 0 0 0 0 0 0 0
FinalVolume: 67 724 216 101 616 48 41 11 77 68 7 141
------------|---------------||---------------||---------------||---------------|
Critical Gap Module:
Critical Gp: 4.1 xxxx xxxxx 4.1 xxxx xxxxx 7.5 6.5 6.9 7.5 6.5 6.9
FollowUpTim: 2.2 xxxx xxxxx 2.2 xxxx xxxxx 3.5 4.0 3.3 3.5 4.0 3.3
------------|---------------||---------------||---------------||---------------|
Capacity Module:
Cnflict Vol: 664 xxxx xxxxx 940 xxxx xxxxx 1342 1916 332 1374 1724 362
Potent Cap.: 935 xxxx xxxxx 737 xxxx xxxxx 113 68 670 107 90 641
Move Cap.: 935 xxxx xxxxx 737 xxxx xxxxx 69 55 670 68 72 641
Volume/Cap: 0.07 xxxx xxxx 0.14 xxxx xxxx 0.59 0.20 0.11 1.00 0.10 0.22
------------|---------------||---------------||---------------||---------------|
Level Of Service Module:
2Way95thQ: 0.2 xxxx xxxxx 0.5 xxxx xxxxx xxxx xxxx xxxxx xxxx xxxx 0.4
Control Del: 9.1 xxxx xxxxx 10.7 xxxx xxxxx xxxxx xxxx xxxxx xxxxx xxxx 11.3
LOS by Move: A * * B * * * * * * * B
Movement: LT - LTR - RT LT - LTR - RT LT - LTR - RT LT - LTR - RT
Shared Cap.: xxxx xxxx xxxxx xxxx xxxx xxxxx xxxx 142 xxxxx xxxx 120 xxxxx
SharedQueue:xxxxx xxxx xxxxx xxxxx xxxx xxxxx xxxxx 6.2 xxxxx xxxxx 9.1 xxxxx
Shrd ConDel:xxxxx xxxx xxxxx xxxxx xxxx xxxxx xxxxx 114 xxxxx xxxxx 217 xxxxx
Shared LOS: * * * * * * * F * * F *
ApproachDel: xxxxxx xxxxxx 114.1 150.2
ApproachLOS: * * F F
********************************************************************************
Note: Queue reported is the number of cars per lane.
********************************************************************************
Traffix 7.9.0415 (c) 2007 Dowling Assoc. Licensed to W-TRANS, Santa Rosa, CA
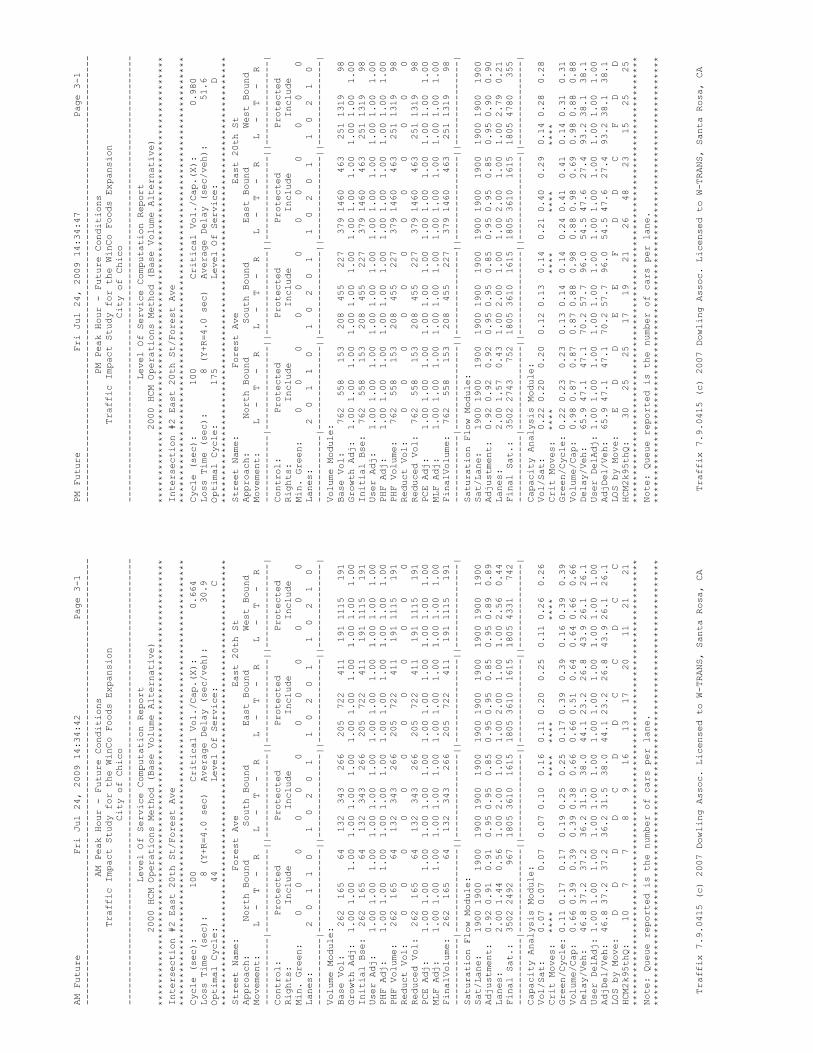
AM Future Fri Jul 24, 2009 14:34:42 Page 3-1
--------------------------------------------------------------------------------
AM Peak Hour - Future Conditions
Traffic Impact Study for the WinCo Foods Expansion
City of Chico
--------------------------------------------------------------------------------
Level Of Service Computation Report
2000 HCM Operations Method (Base Volume Alternative)
********************************************************************************
Intersection #2 East 20th St/Forest Ave
********************************************************************************
Cycle (sec): 100 Critical Vol./Cap.(X): 0.664
Loss Time (sec): 8 (Y+R=4.0 sec) Average Delay (sec/veh): 30.9
Optimal Cycle: 44 Level Of Service: C
********************************************************************************
Street Name: Forest Ave East 20th St
Approach: North Bound South Bound East Bound West Bound
Movement: L - T - R L - T - R L - T - R L - T - R
------------|---------------||---------------||---------------||---------------|
Control: Protected Protected Protected Protected
Rights: Include Include Include Include
Min. Green: 0 0 0 0 0 0 0 0 0 0 0 0
Lanes: 2 0 1 1 0 1 0 2 0 1 1 0 2 0 1 1 0 2 1 0
------------|---------------||---------------||---------------||---------------|
Volume Module:
Base Vol: 262 165 64 132 343 266 205 722 411 191 1115 191
Growth Adj: 1.00 1.00 1.00 1.00 1.00 1.00 1.00 1.00 1.00 1.00 1.00 1.00
Initial Bse: 262 165 64 132 343 266 205 722 411 191 1115 191
User Adj: 1.00 1.00 1.00 1.00 1.00 1.00 1.00 1.00 1.00 1.00 1.00 1.00
PHF Adj: 1.00 1.00 1.00 1.00 1.00 1.00 1.00 1.00 1.00 1.00 1.00 1.00
PHF Volume: 262 165 64 132 343 266 205 722 411 191 1115 191
Reduct Vol: 0 0 0 0 0 0 0 0 0 0 0 0
Reduced Vol: 262 165 64 132 343 266 205 722 411 191 1115 191
PCE Adj: 1.00 1.00 1.00 1.00 1.00 1.00 1.00 1.00 1.00 1.00 1.00 1.00
MLF Adj: 1.00 1.00 1.00 1.00 1.00 1.00 1.00 1.00 1.00 1.00 1.00 1.00
FinalVolume: 262 165 64 132 343 266 205 722 411 191 1115 191
------------|---------------||---------------||---------------||---------------|
Saturation Flow Module:
Sat/Lane: 1900 1900 1900 1900 1900 1900 1900 1900 1900 1900 1900 1900
Adjustment: 0.92 0.91 0.91 0.95 0.95 0.85 0.95 0.95 0.85 0.95 0.89 0.89
Lanes: 2.00 1.44 0.56 1.00 2.00 1.00 1.00 2.00 1.00 1.00 2.56 0.44
Final Sat.: 3502 2492 967 1805 3610 1615 1805 3610 1615 1805 4331 742
------------|---------------||---------------||---------------||---------------|
Capacity Analysis Module:
Vol/Sat: 0.07 0.07 0.07 0.07 0.10 0.16 0.11 0.20 0.25 0.11 0.26 0.26
Crit Moves: **** **** **** ****
Green/Cycle: 0.11 0.17 0.17 0.19 0.25 0.25 0.17 0.39 0.39 0.16 0.39 0.39
Volume/Cap: 0.66 0.39 0.39 0.39 0.38 0.66 0.66 0.51 0.64 0.64 0.66 0.66
Delay/Veh: 46.8 37.2 37.2 36.2 31.5 38.0 44.1 23.2 26.8 43.9 26.1 26.1
User DelAdj: 1.00 1.00 1.00 1.00 1.00 1.00 1.00 1.00 1.00 1.00 1.00 1.00
AdjDel/Veh: 46.8 37.2 37.2 36.2 31.5 38.0 44.1 23.2 26.8 43.9 26.1 26.1
LOS by Move: D D D D C D D C C D C C
HCM2k95thQ: 10 7 7 8 9 16 13 17 20 11 21 21
********************************************************************************
Note: Queue reported is the number of cars per lane.
********************************************************************************
Traffix 7.9.0415 (c) 2007 Dowling Assoc. Licensed to W-TRANS, Santa Rosa, CA
PM Future Fri Jul 24, 2009 14:34:47 Page 3-1
--------------------------------------------------------------------------------
PM Peak Hour - Future Conditions
Traffic Impact Study for the WinCo Foods Expansion
City of Chico
--------------------------------------------------------------------------------
Level Of Service Computation Report
2000 HCM Operations Method (Base Volume Alternative)
********************************************************************************
Intersection #2 East 20th St/Forest Ave
********************************************************************************
Cycle (sec): 100 Critical Vol./Cap.(X): 0.980
Loss Time (sec): 8 (Y+R=4.0 sec) Average Delay (sec/veh): 51.6
Optimal Cycle: 175 Level Of Service: D
********************************************************************************
Street Name: Forest Ave East 20th St
Approach: North Bound South Bound East Bound West Bound
Movement: L - T - R L - T - R L - T - R L - T - R
------------|---------------||---------------||---------------||---------------|
Control: Protected Protected Protected Protected
Rights: Include Include Include Include
Min. Green: 0 0 0 0 0 0 0 0 0 0 0 0
Lanes: 2 0 1 1 0 1 0 2 0 1 1 0 2 0 1 1 0 2 1 0
------------|---------------||---------------||---------------||---------------|
Volume Module:
Base Vol: 762 558 153 208 455 227 379 1460 463 251 1319 98
Growth Adj: 1.00 1.00 1.00 1.00 1.00 1.00 1.00 1.00 1.00 1.00 1.00 1.00
Initial Bse: 762 558 153 208 455 227 379 1460 463 251 1319 98
User Adj: 1.00 1.00 1.00 1.00 1.00 1.00 1.00 1.00 1.00 1.00 1.00 1.00
PHF Adj: 1.00 1.00 1.00 1.00 1.00 1.00 1.00 1.00 1.00 1.00 1.00 1.00
PHF Volume: 762 558 153 208 455 227 379 1460 463 251 1319 98
Reduct Vol: 0 0 0 0 0 0 0 0 0 0 0 0
Reduced Vol: 762 558 153 208 455 227 379 1460 463 251 1319 98
PCE Adj: 1.00 1.00 1.00 1.00 1.00 1.00 1.00 1.00 1.00 1.00 1.00 1.00
MLF Adj: 1.00 1.00 1.00 1.00 1.00 1.00 1.00 1.00 1.00 1.00 1.00 1.00
FinalVolume: 762 558 153 208 455 227 379 1460 463 251 1319 98
------------|---------------||---------------||---------------||---------------|
Saturation Flow Module:
Sat/Lane: 1900 1900 1900 1900 1900 1900 1900 1900 1900 1900 1900 1900
Adjustment: 0.92 0.92 0.92 0.95 0.95 0.85 0.95 0.95 0.85 0.95 0.90 0.90
Lanes: 2.00 1.57 0.43 1.00 2.00 1.00 1.00 2.00 1.00 1.00 2.79 0.21
Final Sat.: 3502 2743 752 1805 3610 1615 1805 3610 1615 1805 4780 355
------------|---------------||---------------||---------------||---------------|
Capacity Analysis Module:
Vol/Sat: 0.22 0.20 0.20 0.12 0.13 0.14 0.21 0.40 0.29 0.14 0.28 0.28
Crit Moves: **** **** **** ****
Green/Cycle: 0.22 0.23 0.23 0.13 0.14 0.14 0.24 0.41 0.41 0.14 0.31 0.31
Volume/Cap: 0.98 0.87 0.87 0.87 0.88 0.98 0.88 0.98 0.69 0.98 0.88 0.88
Delay/Veh: 65.9 47.1 47.1 70.2 57.7 96.0 54.5 47.6 27.4 93.2 38.1 38.1
User DelAdj: 1.00 1.00 1.00 1.00 1.00 1.00 1.00 1.00 1.00 1.00 1.00 1.00
AdjDel/Veh: 65.9 47.1 47.1 70.2 57.7 96.0 54.5 47.6 27.4 93.2 38.1 38.1
LOS by Move: E D D E E F D D C F D D
HCM2k95thQ: 30 25 25 17 19 21 26 48 23 15 25 25
********************************************************************************
Note: Queue reported is the number of cars per lane.
********************************************************************************
Traffix 7.9.0415 (c) 2007 Dowling Assoc. Licensed to W-TRANS, Santa Rosa, CA
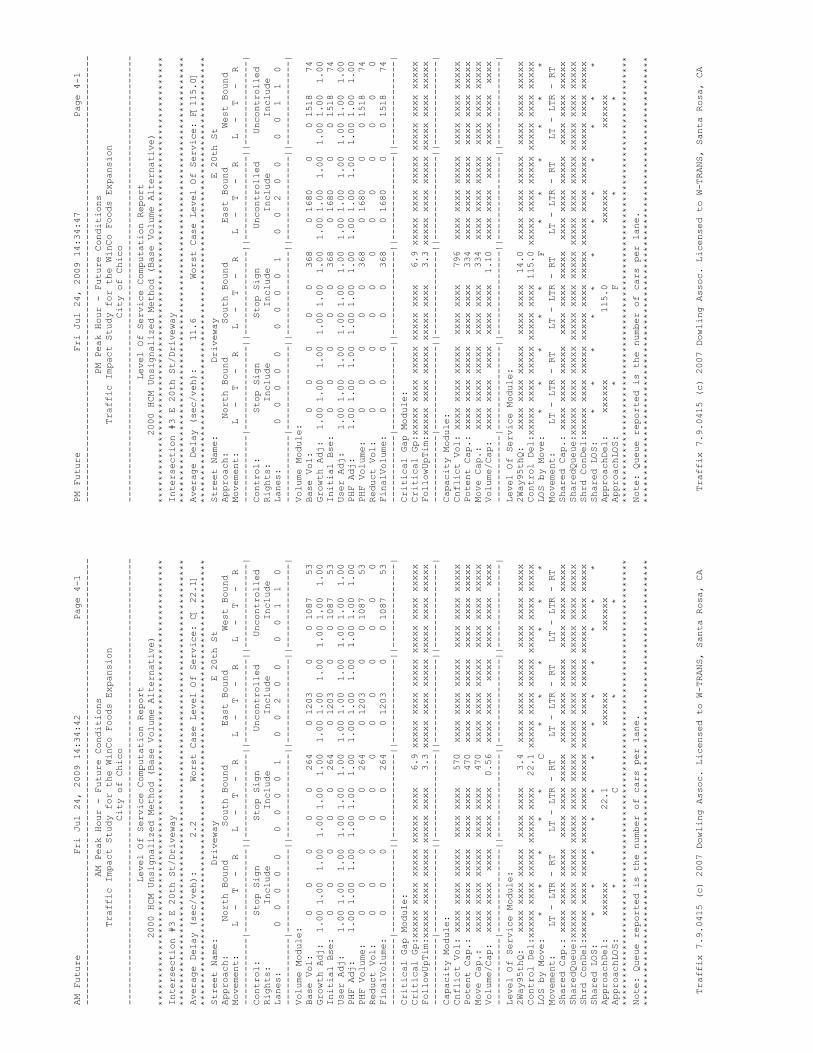
AM Future Fri Jul 24, 2009 14:34:42 Page 4-1
--------------------------------------------------------------------------------
AM Peak Hour - Future Conditions
Traffic Impact Study for the WinCo Foods Expansion
City of Chico
--------------------------------------------------------------------------------
Level Of Service Computation Report
2000 HCM Unsignalized Method (Base Volume Alternative)
********************************************************************************
Intersection #3 E 20th St/Driveway
********************************************************************************
Average Delay (sec/veh): 2.2 Worst Case Level Of Service: C[ 22.1]
********************************************************************************
Street Name: Driveway E 20th St
Approach: North Bound South Bound East Bound West Bound
Movement: L - T - R L - T - R L - T - R L - T - R
------------|---------------||---------------||---------------||---------------|
Control: Stop Sign Stop Sign Uncontrolled Uncontrolled
Rights: Include Include Include Include
Lanes: 0 0 0 0 0 0 0 0 0 1 0 0 2 0 0 0 0 1 1 0
------------|---------------||---------------||---------------||---------------|
Volume Module:
Base Vol: 0 0 0 0 0 264 0 1203 0 0 1087 53
Growth Adj: 1.00 1.00 1.00 1.00 1.00 1.00 1.00 1.00 1.00 1.00 1.00 1.00
Initial Bse: 0 0 0 0 0 264 0 1203 0 0 1087 53
User Adj: 1.00 1.00 1.00 1.00 1.00 1.00 1.00 1.00 1.00 1.00 1.00 1.00
PHF Adj: 1.00 1.00 1.00 1.00 1.00 1.00 1.00 1.00 1.00 1.00 1.00 1.00
PHF Volume: 0 0 0 0 0 264 0 1203 0 0 1087 53
Reduct Vol: 0 0 0 0 0 0 0 0 0 0 0 0
FinalVolume: 0 0 0 0 0 264 0 1203 0 0 1087 53
------------|---------------||---------------||---------------||---------------|
Critical Gap Module:
Critical Gp:xxxxx xxxx xxxxx xxxxx xxxx 6.9 xxxxx xxxx xxxxx xxxxx xxxx xxxxx
FollowUpTim:xxxxx xxxx xxxxx xxxxx xxxx 3.3 xxxxx xxxx xxxxx xxxxx xxxx xxxxx
------------|---------------||---------------||---------------||---------------|
Capacity Module:
Cnflict Vol: xxxx xxxx xxxxx xxxx xxxx 570 xxxx xxxx xxxxx xxxx xxxx xxxxx
Potent Cap.: xxxx xxxx xxxxx xxxx xxxx 470 xxxx xxxx xxxxx xxxx xxxx xxxxx
Move Cap.: xxxx xxxx xxxxx xxxx xxxx 470 xxxx xxxx xxxxx xxxx xxxx xxxxx
Volume/Cap: xxxx xxxx xxxx xxxx xxxx 0.56 xxxx xxxx xxxx xxxx xxxx xxxx
------------|---------------||---------------||---------------||---------------|
Level Of Service Module:
2Way95thQ: xxxx xxxx xxxxx xxxx xxxx 3.4 xxxx xxxx xxxxx xxxx xxxx xxxxx
Control Del:xxxxx xxxx xxxxx xxxxx xxxx 22.1 xxxxx xxxx xxxxx xxxxx xxxx xxxxx
LOS by Move: * * * * * C * * * * * *
Movement: LT - LTR - RT LT - LTR - RT LT - LTR - RT LT - LTR - RT
Shared Cap.: xxxx xxxx xxxxx xxxx xxxx xxxxx xxxx xxxx xxxxx xxxx xxxx xxxxx
SharedQueue:xxxxx xxxx xxxxx xxxxx xxxx xxxxx xxxxx xxxx xxxxx xxxxx xxxx xxxxx
Shrd ConDel:xxxxx xxxx xxxxx xxxxx xxxx xxxxx xxxxx xxxx xxxxx xxxxx xxxx xxxxx
Shared LOS: * * * * * * * * * * * *
ApproachDel: xxxxxx 22.1 xxxxxx xxxxxx
ApproachLOS: * C * *
********************************************************************************
Note: Queue reported is the number of cars per lane.
********************************************************************************
Traffix 7.9.0415 (c) 2007 Dowling Assoc. Licensed to W-TRANS, Santa Rosa, CA
PM Future Fri Jul 24, 2009 14:34:47 Page 4-1
--------------------------------------------------------------------------------
PM Peak Hour - Future Conditions
Traffic Impact Study for the WinCo Foods Expansion
City of Chico
--------------------------------------------------------------------------------
Level Of Service Computation Report
2000 HCM Unsignalized Method (Base Volume Alternative)
********************************************************************************
Intersection #3 E 20th St/Driveway
********************************************************************************
Average Delay (sec/veh): 11.6 Worst Case Level Of Service: F[115.0]
********************************************************************************
Street Name: Driveway E 20th St
Approach: North Bound South Bound East Bound West Bound
Movement: L - T - R L - T - R L - T - R L - T - R
------------|---------------||---------------||---------------||---------------|
Control: Stop Sign Stop Sign Uncontrolled Uncontrolled
Rights: Include Include Include Include
Lanes: 0 0 0 0 0 0 0 0 0 1 0 0 2 0 0 0 0 1 1 0
------------|---------------||---------------||---------------||---------------|
Volume Module:
Base Vol: 0 0 0 0 0 368 0 1680 0 0 1518 74
Growth Adj: 1.00 1.00 1.00 1.00 1.00 1.00 1.00 1.00 1.00 1.00 1.00 1.00
Initial Bse: 0 0 0 0 0 368 0 1680 0 0 1518 74
User Adj: 1.00 1.00 1.00 1.00 1.00 1.00 1.00 1.00 1.00 1.00 1.00 1.00
PHF Adj: 1.00 1.00 1.00 1.00 1.00 1.00 1.00 1.00 1.00 1.00 1.00 1.00
PHF Volume: 0 0 0 0 0 368 0 1680 0 0 1518 74
Reduct Vol: 0 0 0 0 0 0 0 0 0 0 0 0
FinalVolume: 0 0 0 0 0 368 0 1680 0 0 1518 74
------------|---------------||---------------||---------------||---------------|
Critical Gap Module:
Critical Gp:xxxxx xxxx xxxxx xxxxx xxxx 6.9 xxxxx xxxx xxxxx xxxxx xxxx xxxxx
FollowUpTim:xxxxx xxxx xxxxx xxxxx xxxx 3.3 xxxxx xxxx xxxxx xxxxx xxxx xxxxx
------------|---------------||---------------||---------------||---------------|
Capacity Module:
Cnflict Vol: xxxx xxxx xxxxx xxxx xxxx 796 xxxx xxxx xxxxx xxxx xxxx xxxxx
Potent Cap.: xxxx xxxx xxxxx xxxx xxxx 334 xxxx xxxx xxxxx xxxx xxxx xxxxx
Move Cap.: xxxx xxxx xxxxx xxxx xxxx 334 xxxx xxxx xxxxx xxxx xxxx xxxxx
Volume/Cap: xxxx xxxx xxxx xxxx xxxx 1.10 xxxx xxxx xxxx xxxx xxxx xxxx
------------|---------------||---------------||---------------||---------------|
Level Of Service Module:
2Way95thQ: xxxx xxxx xxxxx xxxx xxxx 14.0 xxxx xxxx xxxxx xxxx xxxx xxxxx
Control Del:xxxxx xxxx xxxxx xxxxx xxxx 115.0 xxxxx xxxx xxxxx xxxxx xxxx xxxxx
LOS by Move: * * * * * F * * * * * *
Movement: LT - LTR - RT LT - LTR - RT LT - LTR - RT LT - LTR - RT
Shared Cap.: xxxx xxxx xxxxx xxxx xxxx xxxxx xxxx xxxx xxxxx xxxx xxxx xxxxx
SharedQueue:xxxxx xxxx xxxxx xxxxx xxxx xxxxx xxxxx xxxx xxxxx xxxxx xxxx xxxxx
Shrd ConDel:xxxxx xxxx xxxxx xxxxx xxxx xxxxx xxxxx xxxx xxxxx xxxxx xxxx xxxxx
Shared LOS: * * * * * * * * * * * *
ApproachDel: xxxxxx 115.0 xxxxxx xxxxxx
ApproachLOS: * F * *
********************************************************************************
Note: Queue reported is the number of cars per lane.
********************************************************************************
Traffix 7.9.0415 (c) 2007 Dowling Assoc. Licensed to W-TRANS, Santa Rosa, CA
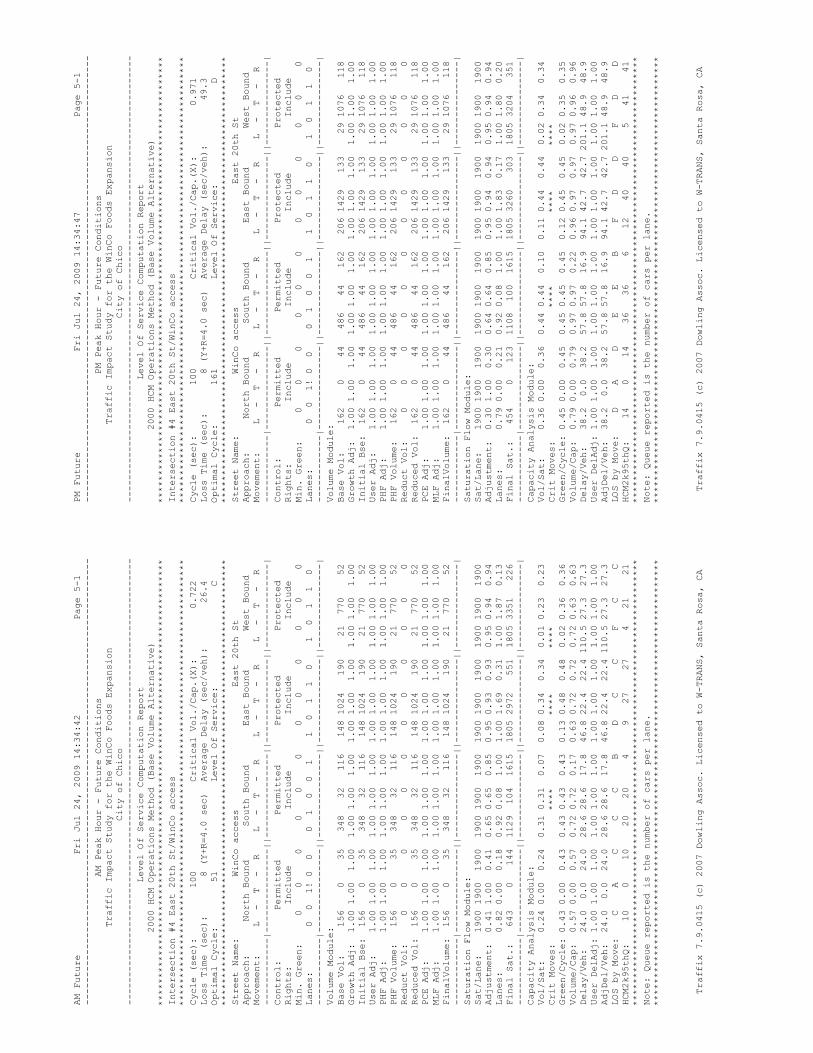
AM Future Fri Jul 24, 2009 14:34:42 Page 5-1
--------------------------------------------------------------------------------
AM Peak Hour - Future Conditions
Traffic Impact Study for the WinCo Foods Expansion
City of Chico
--------------------------------------------------------------------------------
Level Of Service Computation Report
2000 HCM Operations Method (Base Volume Alternative)
********************************************************************************
Intersection #4 East 20th St/WinCo access
********************************************************************************
Cycle (sec): 100 Critical Vol./Cap.(X): 0.722
Loss Time (sec): 8 (Y+R=4.0 sec) Average Delay (sec/veh): 26.4
Optimal Cycle: 51 Level Of Service: C
********************************************************************************
Street Name: WinCo access East 20th St
Approach: North Bound South Bound East Bound West Bound
Movement: L - T - R L - T - R L - T - R L - T - R
------------|---------------||---------------||---------------||---------------|
Control: Permitted Permitted Protected Protected
Rights: Include Include Include Include
Min. Green: 0 0 0 0 0 0 0 0 0 0 0 0
Lanes: 0 0 1! 0 0 0 1 0 0 1 1 0 1 1 0 1 0 1 1 0
------------|---------------||---------------||---------------||---------------|
Volume Module:
Base Vol: 156 0 35 348 32 116 148 1024 190 21 770 52
Growth Adj: 1.00 1.00 1.00 1.00 1.00 1.00 1.00 1.00 1.00 1.00 1.00 1.00
Initial Bse: 156 0 35 348 32 116 148 1024 190 21 770 52
User Adj: 1.00 1.00 1.00 1.00 1.00 1.00 1.00 1.00 1.00 1.00 1.00 1.00
PHF Adj: 1.00 1.00 1.00 1.00 1.00 1.00 1.00 1.00 1.00 1.00 1.00 1.00
PHF Volume: 156 0 35 348 32 116 148 1024 190 21 770 52
Reduct Vol: 0 0 0 0 0 0 0 0 0 0 0 0
Reduced Vol: 156 0 35 348 32 116 148 1024 190 21 770 52
PCE Adj: 1.00 1.00 1.00 1.00 1.00 1.00 1.00 1.00 1.00 1.00 1.00 1.00
MLF Adj: 1.00 1.00 1.00 1.00 1.00 1.00 1.00 1.00 1.00 1.00 1.00 1.00
FinalVolume: 156 0 35 348 32 116 148 1024 190 21 770 52
------------|---------------||---------------||---------------||---------------|
Saturation Flow Module:
Sat/Lane: 1900 1900 1900 1900 1900 1900 1900 1900 1900 1900 1900 1900
Adjustment: 0.41 1.00 0.41 0.65 0.65 0.85 0.95 0.93 0.93 0.95 0.94 0.94
Lanes: 0.82 0.00 0.18 0.92 0.08 1.00 1.00 1.69 0.31 1.00 1.87 0.13
Final Sat.: 643 0 144 1129 104 1615 1805 2972 551 1805 3351 226
------------|---------------||---------------||---------------||---------------|
Capacity Analysis Module:
Vol/Sat: 0.24 0.00 0.24 0.31 0.31 0.07 0.08 0.34 0.34 0.01 0.23 0.23
Crit Moves: **** **** ****
Green/Cycle: 0.43 0.00 0.43 0.43 0.43 0.43 0.13 0.48 0.48 0.02 0.36 0.36
Volume/Cap: 0.57 0.00 0.57 0.72 0.72 0.17 0.63 0.72 0.72 0.72 0.63 0.63
Delay/Veh: 24.0 0.0 24.0 28.6 28.6 17.8 46.8 22.4 22.4 110.5 27.3 27.3
User DelAdj: 1.00 1.00 1.00 1.00 1.00 1.00 1.00 1.00 1.00 1.00 1.00 1.00
AdjDel/Veh: 24.0 0.0 24.0 28.6 28.6 17.8 46.8 22.4 22.4 110.5 27.3 27.3
LOS by Move: C A C C C B D C C F C C
HCM2k95thQ: 10 0 10 20 20 4 9 27 27 4 21 21
********************************************************************************
Note: Queue reported is the number of cars per lane.
********************************************************************************
Traffix 7.9.0415 (c) 2007 Dowling Assoc. Licensed to W-TRANS, Santa Rosa, CA
PM Future Fri Jul 24, 2009 14:34:47 Page 5-1
--------------------------------------------------------------------------------
PM Peak Hour - Future Conditions
Traffic Impact Study for the WinCo Foods Expansion
City of Chico
--------------------------------------------------------------------------------
Level Of Service Computation Report
2000 HCM Operations Method (Base Volume Alternative)
********************************************************************************
Intersection #4 East 20th St/WinCo access
********************************************************************************
Cycle (sec): 100 Critical Vol./Cap.(X): 0.971
Loss Time (sec): 8 (Y+R=4.0 sec) Average Delay (sec/veh): 49.3
Optimal Cycle: 161 Level Of Service: D
********************************************************************************
Street Name: WinCo access East 20th St
Approach: North Bound South Bound East Bound West Bound
Movement: L - T - R L - T - R L - T - R L - T - R
------------|---------------||---------------||---------------||---------------|
Control: Permitted Permitted Protected Protected
Rights: Include Include Include Include
Min. Green: 0 0 0 0 0 0 0 0 0 0 0 0
Lanes: 0 0 1! 0 0 0 1 0 0 1 1 0 1 1 0 1 0 1 1 0
------------|---------------||---------------||---------------||---------------|
Volume Module:
Base Vol: 162 0 44 486 44 162 206 1429 133 29 1076 118
Growth Adj: 1.00 1.00 1.00 1.00 1.00 1.00 1.00 1.00 1.00 1.00 1.00 1.00
Initial Bse: 162 0 44 486 44 162 206 1429 133 29 1076 118
User Adj: 1.00 1.00 1.00 1.00 1.00 1.00 1.00 1.00 1.00 1.00 1.00 1.00
PHF Adj: 1.00 1.00 1.00 1.00 1.00 1.00 1.00 1.00 1.00 1.00 1.00 1.00
PHF Volume: 162 0 44 486 44 162 206 1429 133 29 1076 118
Reduct Vol: 0 0 0 0 0 0 0 0 0 0 0 0
Reduced Vol: 162 0 44 486 44 162 206 1429 133 29 1076 118
PCE Adj: 1.00 1.00 1.00 1.00 1.00 1.00 1.00 1.00 1.00 1.00 1.00 1.00
MLF Adj: 1.00 1.00 1.00 1.00 1.00 1.00 1.00 1.00 1.00 1.00 1.00 1.00
FinalVolume: 162 0 44 486 44 162 206 1429 133 29 1076 118
------------|---------------||---------------||---------------||---------------|
Saturation Flow Module:
Sat/Lane: 1900 1900 1900 1900 1900 1900 1900 1900 1900 1900 1900 1900
Adjustment: 0.30 1.00 0.30 0.64 0.64 0.85 0.95 0.94 0.94 0.95 0.94 0.94
Lanes: 0.79 0.00 0.21 0.92 0.08 1.00 1.00 1.83 0.17 1.00 1.80 0.20
Final Sat.: 454 0 123 1108 100 1615 1805 3260 303 1805 3204 351
------------|---------------||---------------||---------------||---------------|
Capacity Analysis Module:
Vol/Sat: 0.36 0.00 0.36 0.44 0.44 0.10 0.11 0.44 0.44 0.02 0.34 0.34
Crit Moves: **** **** ****
Green/Cycle: 0.45 0.00 0.45 0.45 0.45 0.45 0.12 0.45 0.45 0.02 0.35 0.35
Volume/Cap: 0.79 0.00 0.79 0.97 0.97 0.22 0.96 0.97 0.97 0.97 0.96 0.96
Delay/Veh: 38.2 0.0 38.2 57.8 57.8 16.9 94.1 42.7 42.7 201.1 48.9 48.9
User DelAdj: 1.00 1.00 1.00 1.00 1.00 1.00 1.00 1.00 1.00 1.00 1.00 1.00
AdjDel/Veh: 38.2 0.0 38.2 57.8 57.8 16.9 94.1 42.7 42.7 201.1 48.9 48.9
LOS by Move: D A D E E B F D D F D D
HCM2k95thQ: 14 0 14 36 36 6 12 40 40 5 41 41
********************************************************************************
Note: Queue reported is the number of cars per lane.
********************************************************************************
Traffix 7.9.0415 (c) 2007 Dowling Assoc. Licensed to W-TRANS, Santa Rosa, CA
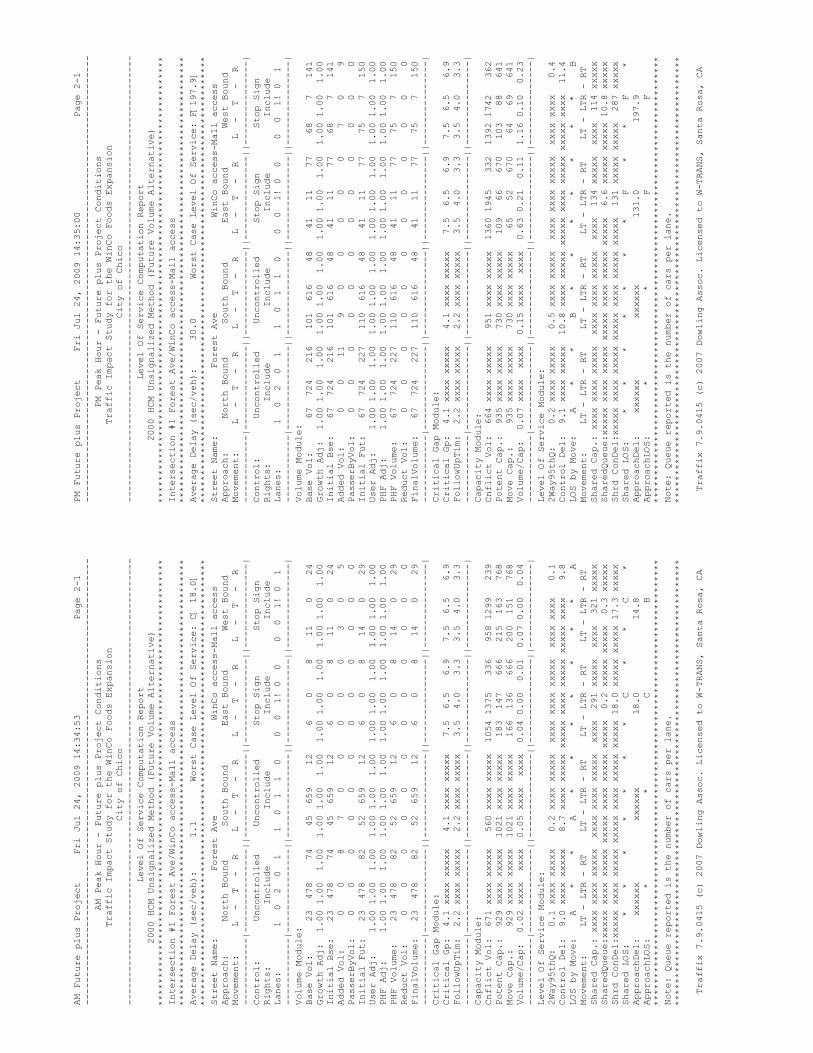
AM Future plus Project Fri Jul 24, 2009 14:34:53 Page 2-1
--------------------------------------------------------------------------------
AM Peak Hour - Future plus Project Conditions
Traffic Impact Study for the WinCo Foods Expansion
City of Chico
--------------------------------------------------------------------------------
Level Of Service Computation Report
2000 HCM Unsignalized Method (Future Volume Alternative)
********************************************************************************
Intersection #1 Forest Ave/WinCo access-Mall access
********************************************************************************
Average Delay (sec/veh): 1.1 Worst Case Level Of Service: C[ 18.0]
********************************************************************************
Street Name: Forest Ave WinCo access-Mall access
Approach: North Bound South Bound East Bound West Bound
Movement: L - T - R L - T - R L - T - R L - T - R
------------|---------------||---------------||---------------||---------------|
Control: Uncontrolled Uncontrolled Stop Sign Stop Sign
Rights: Include Include Include Include
Lanes: 1 0 2 0 1 1 0 1 1 0 0 0 1! 0 0 0 0 1! 0 1
------------|---------------||---------------||---------------||---------------|
Volume Module:
Base Vol: 23 478 74 45 659 12 6 0 8 11 0 24
Growth Adj: 1.00 1.00 1.00 1.00 1.00 1.00 1.00 1.00 1.00 1.00 1.00 1.00
Initial Bse: 23 478 74 45 659 12 6 0 8 11 0 24
Added Vol: 0 0 8 7 0 0 0 0 0 3 0 5
PasserByVol: 0 0 0 0 0 0 0 0 0 0 0 0
Initial Fut: 23 478 82 52 659 12 6 0 8 14 0 29
User Adj: 1.00 1.00 1.00 1.00 1.00 1.00 1.00 1.00 1.00 1.00 1.00 1.00
PHF Adj: 1.00 1.00 1.00 1.00 1.00 1.00 1.00 1.00 1.00 1.00 1.00 1.00
PHF Volume: 23 478 82 52 659 12 6 0 8 14 0 29
Reduct Vol: 0 0 0 0 0 0 0 0 0 0 0 0
FinalVolume: 23 478 82 52 659 12 6 0 8 14 0 29
------------|---------------||---------------||---------------||---------------|
Critical Gap Module:
Critical Gp: 4.1 xxxx xxxxx 4.1 xxxx xxxxx 7.5 6.5 6.9 7.5 6.5 6.9
FollowUpTim: 2.2 xxxx xxxxx 2.2 xxxx xxxxx 3.5 4.0 3.3 3.5 4.0 3.3
------------|---------------||---------------||---------------||---------------|
Capacity Module:
Cnflict Vol: 671 xxxx xxxxx 560 xxxx xxxxx 1054 1375 336 958 1299 239
Potent Cap.: 929 xxxx xxxxx 1021 xxxx xxxxx 183 147 666 215 163 768
Move Cap.: 929 xxxx xxxxx 1021 xxxx xxxxx 166 136 666 200 151 768
Volume/Cap: 0.02 xxxx xxxx 0.05 xxxx xxxx 0.04 0.00 0.01 0.07 0.00 0.04
------------|---------------||---------------||---------------||---------------|
Level Of Service Module:
2Way95thQ: 0.1 xxxx xxxxx 0.2 xxxx xxxxx xxxx xxxx xxxxx xxxx xxxx 0.1
Control Del: 9.0 xxxx xxxxx 8.7 xxxx xxxxx xxxxx xxxx xxxxx xxxxx xxxx 9.8
LOS by Move: A * * A * * * * * * * A
Movement: LT - LTR - RT LT - LTR - RT LT - LTR - RT LT - LTR - RT
Shared Cap.: xxxx xxxx xxxxx xxxx xxxx xxxxx xxxx 291 xxxxx xxxx 321 xxxxx
SharedQueue:xxxxx xxxx xxxxx xxxxx xxxx xxxxx xxxxx 0.2 xxxxx xxxxx 0.3 xxxxx
Shrd ConDel:xxxxx xxxx xxxxx xxxxx xxxx xxxxx xxxxx 18.0 xxxxx xxxxx 17.3 xxxxx
Shared LOS: * * * * * * * C * * C *
ApproachDel: xxxxxx xxxxxx 18.0 14.8
ApproachLOS: * * C B
********************************************************************************
Note: Queue reported is the number of cars per lane.
********************************************************************************
Traffix 7.9.0415 (c) 2007 Dowling Assoc. Licensed to W-TRANS, Santa Rosa, CA
PM Future plus Project Fri Jul 24, 2009 14:35:00 Page 2-1
--------------------------------------------------------------------------------
PM Peak Hour - Future plus Project Conditions
Traffic Impact Study for the WinCo Foods Expansion
City of Chico
--------------------------------------------------------------------------------
Level Of Service Computation Report
2000 HCM Unsignalized Method (Future Volume Alternative)
********************************************************************************
Intersection #1 Forest Ave/WinCo access-Mall access
********************************************************************************
Average Delay (sec/veh): 30.0 Worst Case Level Of Service: F[197.9]
********************************************************************************
Street Name: Forest Ave WinCo access-Mall access
Approach: North Bound South Bound East Bound West Bound
Movement: L - T - R L - T - R L - T - R L - T - R
------------|---------------||---------------||---------------||---------------|
Control: Uncontrolled Uncontrolled Stop Sign Stop Sign
Rights: Include Include Include Include
Lanes: 1 0 2 0 1 1 0 1 1 0 0 0 1! 0 0 0 0 1! 0 1
------------|---------------||---------------||---------------||---------------|
Volume Module:
Base Vol: 67 724 216 101 616 48 41 11 77 68 7 141
Growth Adj: 1.00 1.00 1.00 1.00 1.00 1.00 1.00 1.00 1.00 1.00 1.00 1.00
Initial Bse: 67 724 216 101 616 48 41 11 77 68 7 141
Added Vol: 0 0 11 9 0 0 0 0 0 7 0 9
PasserByVol: 0 0 0 0 0 0 0 0 0 0 0 0
Initial Fut: 67 724 227 110 616 48 41 11 77 75 7 150
User Adj: 1.00 1.00 1.00 1.00 1.00 1.00 1.00 1.00 1.00 1.00 1.00 1.00
PHF Adj: 1.00 1.00 1.00 1.00 1.00 1.00 1.00 1.00 1.00 1.00 1.00 1.00
PHF Volume: 67 724 227 110 616 48 41 11 77 75 7 150
Reduct Vol: 0 0 0 0 0 0 0 0 0 0 0 0
FinalVolume: 67 724 227 110 616 48 41 11 77 75 7 150
------------|---------------||---------------||---------------||---------------|
Critical Gap Module:
Critical Gp: 4.1 xxxx xxxxx 4.1 xxxx xxxxx 7.5 6.5 6.9 7.5 6.5 6.9
FollowUpTim: 2.2 xxxx xxxxx 2.2 xxxx xxxxx 3.5 4.0 3.3 3.5 4.0 3.3
------------|---------------||---------------||---------------||---------------|
Capacity Module:
Cnflict Vol: 664 xxxx xxxxx 951 xxxx xxxxx 1360 1945 332 1392 1742 362
Potent Cap.: 935 xxxx xxxxx 730 xxxx xxxxx 109 66 670 103 88 641
Move Cap.: 935 xxxx xxxxx 730 xxxx xxxxx 65 52 670 64 69 641
Volume/Cap: 0.07 xxxx xxxx 0.15 xxxx xxxx 0.63 0.21 0.11 1.16 0.10 0.23
------------|---------------||---------------||---------------||---------------|
Level Of Service Module:
2Way95thQ: 0.2 xxxx xxxxx 0.5 xxxx xxxxx xxxx xxxx xxxxx xxxx xxxx 0.4
Control Del: 9.1 xxxx xxxxx 10.8 xxxx xxxxx xxxxx xxxx xxxxx xxxxx xxxx 11.4
LOS by Move: A * * B * * * * * * * B
Movement: LT - LTR - RT LT - LTR - RT LT - LTR - RT LT - LTR - RT
Shared Cap.: xxxx xxxx xxxxx xxxx xxxx xxxxx xxxx 134 xxxxx xxxx 114 xxxxx
SharedQueue:xxxxx xxxx xxxxx xxxxx xxxx xxxxx xxxxx 6.6 xxxxx xxxxx 10.8 xxxxx
Shrd ConDel:xxxxx xxxx xxxxx xxxxx xxxx xxxxx xxxxx 131 xxxxx xxxxx 287 xxxxx
Shared LOS: * * * * * * * F * * F *
ApproachDel: xxxxxx xxxxxx 131.0 197.9
ApproachLOS: * * F F
********************************************************************************
Note: Queue reported is the number of cars per lane.
********************************************************************************
Traffix 7.9.0415 (c) 2007 Dowling Assoc. Licensed to W-TRANS, Santa Rosa, CA

AM Future plus Project Fri Jul 24, 2009 14:34:53 Page 3-1
--------------------------------------------------------------------------------
AM Peak Hour - Future plus Project Conditions
Traffic Impact Study for the WinCo Foods Expansion
City of Chico
--------------------------------------------------------------------------------
Level Of Service Computation Report
2000 HCM Operations Method (Future Volume Alternative)
********************************************************************************
Intersection #2 East 20th St/Forest Ave
********************************************************************************
Cycle (sec): 100 Critical Vol./Cap.(X): 0.667
Loss Time (sec): 8 (Y+R=4.0 sec) Average Delay (sec/veh): 31.0
Optimal Cycle: 45 Level Of Service: C
********************************************************************************
Street Name: Forest Ave East 20th St
Approach: North Bound South Bound East Bound West Bound
Movement: L - T - R L - T - R L - T - R L - T - R
------------|---------------||---------------||---------------||---------------|
Control: Protected Protected Protected Protected
Rights: Include Include Include Include
Min. Green: 0 0 0 0 0 0 0 0 0 0 0 0
Lanes: 2 0 1 1 0 1 0 2 0 1 1 0 2 0 1 1 0 2 1 0
------------|---------------||---------------||---------------||---------------|
Volume Module:
Base Vol: 262 165 64 132 343 266 205 722 411 191 1115 191
Growth Adj: 1.00 1.00 1.00 1.00 1.00 1.00 1.00 1.00 1.00 1.00 1.00 1.00
Initial Bse: 262 165 64 132 343 266 205 722 411 191 1115 191
Added Vol: 0 5 0 0 2 2 3 0 0 1 1 0
PasserByVol: 0 0 0 0 0 0 0 0 0 0 0 0
Initial Fut: 262 170 64 132 345 268 208 722 411 192 1116 191
User Adj: 1.00 1.00 1.00 1.00 1.00 1.00 1.00 1.00 1.00 1.00 1.00 1.00
PHF Adj: 1.00 1.00 1.00 1.00 1.00 1.00 1.00 1.00 1.00 1.00 1.00 1.00
PHF Volume: 262 170 64 132 345 268 208 722 411 192 1116 191
Reduct Vol: 0 0 0 0 0 0 0 0 0 0 0 0
Reduced Vol: 262 170 64 132 345 268 208 722 411 192 1116 191
PCE Adj: 1.00 1.00 1.00 1.00 1.00 1.00 1.00 1.00 1.00 1.00 1.00 1.00
MLF Adj: 1.00 1.00 1.00 1.00 1.00 1.00 1.00 1.00 1.00 1.00 1.00 1.00
FinalVolume: 262 170 64 132 345 268 208 722 411 192 1116 191
------------|---------------||---------------||---------------||---------------|
Saturation Flow Module:
Sat/Lane: 1900 1900 1900 1900 1900 1900 1900 1900 1900 1900 1900 1900
Adjustment: 0.92 0.91 0.91 0.95 0.95 0.85 0.95 0.95 0.85 0.95 0.89 0.89
Lanes: 2.00 1.45 0.55 1.00 2.00 1.00 1.00 2.00 1.00 1.00 2.56 0.44
Final Sat.: 3502 2515 947 1805 3610 1615 1805 3610 1615 1805 4332 741
------------|---------------||---------------||---------------||---------------|
Capacity Analysis Module:
Vol/Sat: 0.07 0.07 0.07 0.07 0.10 0.17 0.12 0.20 0.25 0.11 0.26 0.26
Crit Moves: **** **** **** ****
Green/Cycle: 0.11 0.17 0.17 0.19 0.25 0.25 0.17 0.39 0.39 0.16 0.39 0.39
Volume/Cap: 0.67 0.39 0.39 0.39 0.38 0.67 0.67 0.51 0.65 0.65 0.67 0.67
Delay/Veh: 46.9 37.1 37.1 36.3 31.5 38.1 44.1 23.2 26.9 43.9 26.3 26.3
User DelAdj: 1.00 1.00 1.00 1.00 1.00 1.00 1.00 1.00 1.00 1.00 1.00 1.00
AdjDel/Veh: 46.9 37.1 37.1 36.3 31.5 38.1 44.1 23.2 26.9 43.9 26.3 26.3
LOS by Move: D D D D C D D C C D C C
HCM2k95thQ: 10 7 7 8 9 16 14 17 20 11 21 21
********************************************************************************
Note: Queue reported is the number of cars per lane.
Traffix 7.9.0415 (c) 2007 Dowling Assoc. Licensed to W-TRANS, Santa Rosa, CA
PM Future plus Project Fri Jul 24, 2009 14:35:00 Page 3-1
--------------------------------------------------------------------------------
PM Peak Hour - Future plus Project Conditions
Traffic Impact Study for the WinCo Foods Expansion
City of Chico
--------------------------------------------------------------------------------
Level Of Service Computation Report
2000 HCM Operations Method (Future Volume Alternative)
********************************************************************************
Intersection #2 East 20th St/Forest Ave
********************************************************************************
Cycle (sec): 100 Critical Vol./Cap.(X): 0.983
Loss Time (sec): 8 (Y+R=4.0 sec) Average Delay (sec/veh): 52.2
Optimal Cycle: 180 Level Of Service: D
********************************************************************************
Street Name: Forest Ave East 20th St
Approach: North Bound South Bound East Bound West Bound
Movement: L - T - R L - T - R L - T - R L - T - R
------------|---------------||---------------||---------------||---------------|
Control: Protected Protected Protected Protected
Rights: Include Include Include Include
Min. Green: 0 0 0 0 0 0 0 0 0 0 0 0
Lanes: 2 0 1 1 0 1 0 2 0 1 1 0 2 0 1 1 0 2 1 0
------------|---------------||---------------||---------------||---------------|
Volume Module:
Base Vol: 762 558 153 208 455 227 379 1460 463 251 1319 98
Growth Adj: 1.00 1.00 1.00 1.00 1.00 1.00 1.00 1.00 1.00 1.00 1.00 1.00
Initial Bse: 762 558 153 208 455 227 379 1460 463 251 1319 98
Added Vol: 0 6 0 0 3 3 5 0 0 2 1 0
PasserByVol: 0 0 0 0 0 0 0 0 0 0 0 0
Initial Fut: 762 564 153 208 458 230 384 1460 463 253 1320 98
User Adj: 1.00 1.00 1.00 1.00 1.00 1.00 1.00 1.00 1.00 1.00 1.00 1.00
PHF Adj: 1.00 1.00 1.00 1.00 1.00 1.00 1.00 1.00 1.00 1.00 1.00 1.00
PHF Volume: 762 564 153 208 458 230 384 1460 463 253 1320 98
Reduct Vol: 0 0 0 0 0 0 0 0 0 0 0 0
Reduced Vol: 762 564 153 208 458 230 384 1460 463 253 1320 98
PCE Adj: 1.00 1.00 1.00 1.00 1.00 1.00 1.00 1.00 1.00 1.00 1.00 1.00
MLF Adj: 1.00 1.00 1.00 1.00 1.00 1.00 1.00 1.00 1.00 1.00 1.00 1.00
FinalVolume: 762 564 153 208 458 230 384 1460 463 253 1320 98
------------|---------------||---------------||---------------||---------------|
Saturation Flow Module:
Sat/Lane: 1900 1900 1900 1900 1900 1900 1900 1900 1900 1900 1900 1900
Adjustment: 0.92 0.92 0.92 0.95 0.95 0.85 0.95 0.95 0.85 0.95 0.90 0.90
Lanes: 2.00 1.57 0.43 1.00 2.00 1.00 1.00 2.00 1.00 1.00 2.79 0.21
Final Sat.: 3502 2749 746 1805 3610 1615 1805 3610 1615 1805 4780 355
------------|---------------||---------------||---------------||---------------|
Capacity Analysis Module:
Vol/Sat: 0.22 0.21 0.21 0.12 0.13 0.14 0.21 0.40 0.29 0.14 0.28 0.28
Crit Moves: **** **** **** ****
Green/Cycle: 0.22 0.23 0.23 0.13 0.14 0.14 0.24 0.41 0.41 0.14 0.31 0.31
Volume/Cap: 0.98 0.88 0.88 0.88 0.88 0.98 0.88 0.98 0.70 0.98 0.88 0.88
Delay/Veh: 66.8 47.3 47.3 70.9 57.2 96.6 55.3 48.5 27.6 94.0 38.8 38.8
User DelAdj: 1.00 1.00 1.00 1.00 1.00 1.00 1.00 1.00 1.00 1.00 1.00 1.00
AdjDel/Veh: 66.8 47.3 47.3 70.9 57.2 96.6 55.3 48.5 27.6 94.0 38.8 38.8
LOS by Move: E D D E E F E D C F D D
HCM2k95thQ: 30 25 25 17 19 21 26 49 23 15 25 25
********************************************************************************
Note: Queue reported is the number of cars per lane.
Traffix 7.9.0415 (c) 2007 Dowling Assoc. Licensed to W-TRANS, Santa Rosa, CA
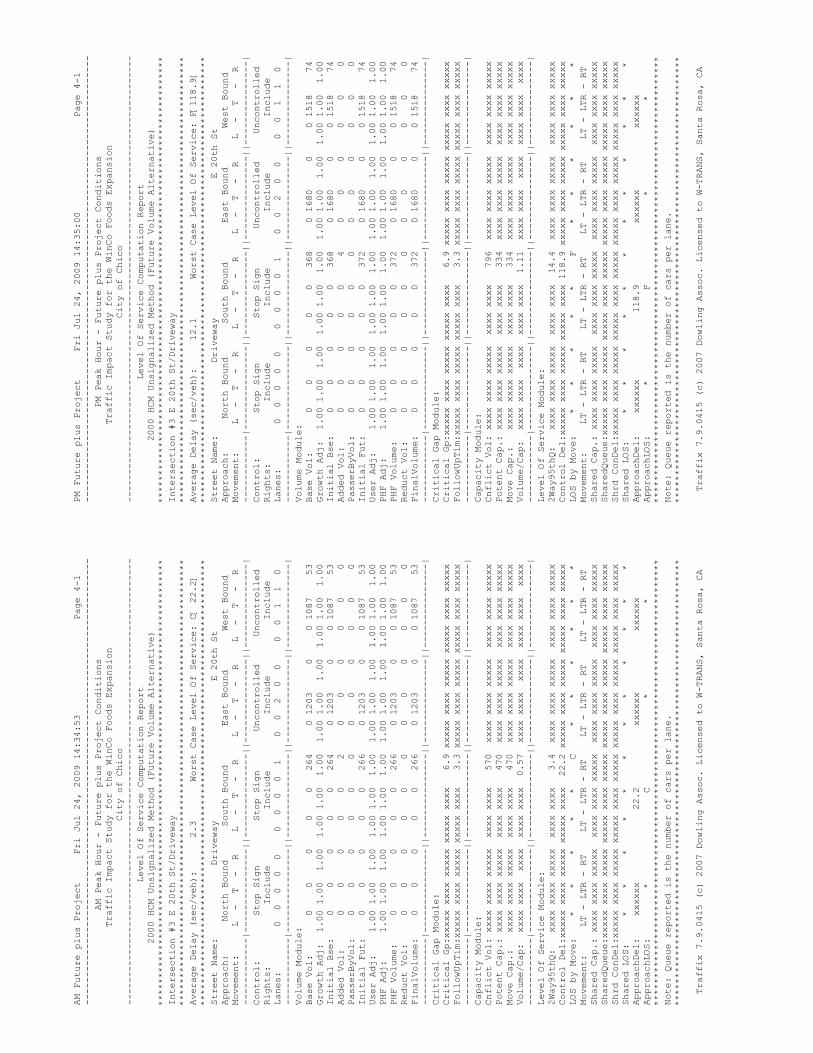
AM Future plus Project Fri Jul 24, 2009 14:34:53 Page 4-1
--------------------------------------------------------------------------------
AM Peak Hour - Future plus Project Conditions
Traffic Impact Study for the WinCo Foods Expansion
City of Chico
--------------------------------------------------------------------------------
Level Of Service Computation Report
2000 HCM Unsignalized Method (Future Volume Alternative)
********************************************************************************
Intersection #3 E 20th St/Driveway
********************************************************************************
Average Delay (sec/veh): 2.3 Worst Case Level Of Service: C[ 22.2]
********************************************************************************
Street Name: Driveway E 20th St
Approach: North Bound South Bound East Bound West Bound
Movement: L - T - R L - T - R L - T - R L - T - R
------------|---------------||---------------||---------------||---------------|
Control: Stop Sign Stop Sign Uncontrolled Uncontrolled
Rights: Include Include Include Include
Lanes: 0 0 0 0 0 0 0 0 0 1 0 0 2 0 0 0 0 1 1 0
------------|---------------||---------------||---------------||---------------|
Volume Module:
Base Vol: 0 0 0 0 0 264 0 1203 0 0 1087 53
Growth Adj: 1.00 1.00 1.00 1.00 1.00 1.00 1.00 1.00 1.00 1.00 1.00 1.00
Initial Bse: 0 0 0 0 0 264 0 1203 0 0 1087 53
Added Vol: 0 0 0 0 0 2 0 0 0 0 0 0
PasserByVol: 0 0 0 0 0 0 0 0 0 0 0 0
Initial Fut: 0 0 0 0 0 266 0 1203 0 0 1087 53
User Adj: 1.00 1.00 1.00 1.00 1.00 1.00 1.00 1.00 1.00 1.00 1.00 1.00
PHF Adj: 1.00 1.00 1.00 1.00 1.00 1.00 1.00 1.00 1.00 1.00 1.00 1.00
PHF Volume: 0 0 0 0 0 266 0 1203 0 0 1087 53
Reduct Vol: 0 0 0 0 0 0 0 0 0 0 0 0
FinalVolume: 0 0 0 0 0 266 0 1203 0 0 1087 53
------------|---------------||---------------||---------------||---------------|
Critical Gap Module:
Critical Gp:xxxxx xxxx xxxxx xxxxx xxxx 6.9 xxxxx xxxx xxxxx xxxxx xxxx xxxxx
FollowUpTim:xxxxx xxxx xxxxx xxxxx xxxx 3.3 xxxxx xxxx xxxxx xxxxx xxxx xxxxx
------------|---------------||---------------||---------------||---------------|
Capacity Module:
Cnflict Vol: xxxx xxxx xxxxx xxxx xxxx 570 xxxx xxxx xxxxx xxxx xxxx xxxxx
Potent Cap.: xxxx xxxx xxxxx xxxx xxxx 470 xxxx xxxx xxxxx xxxx xxxx xxxxx
Move Cap.: xxxx xxxx xxxxx xxxx xxxx 470 xxxx xxxx xxxxx xxxx xxxx xxxxx
Volume/Cap: xxxx xxxx xxxx xxxx xxxx 0.57 xxxx xxxx xxxx xxxx xxxx xxxx
------------|---------------||---------------||---------------||---------------|
Level Of Service Module:
2Way95thQ: xxxx xxxx xxxxx xxxx xxxx 3.4 xxxx xxxx xxxxx xxxx xxxx xxxxx
Control Del:xxxxx xxxx xxxxx xxxxx xxxx 22.2 xxxxx xxxx xxxxx xxxxx xxxx xxxxx
LOS by Move: * * * * * C * * * * * *
Movement: LT - LTR - RT LT - LTR - RT LT - LTR - RT LT - LTR - RT
Shared Cap.: xxxx xxxx xxxxx xxxx xxxx xxxxx xxxx xxxx xxxxx xxxx xxxx xxxxx
SharedQueue:xxxxx xxxx xxxxx xxxxx xxxx xxxxx xxxxx xxxx xxxxx xxxxx xxxx xxxxx
Shrd ConDel:xxxxx xxxx xxxxx xxxxx xxxx xxxxx xxxxx xxxx xxxxx xxxxx xxxx xxxxx
Shared LOS: * * * * * * * * * * * *
ApproachDel: xxxxxx 22.2 xxxxxx xxxxxx
ApproachLOS: * C * *
********************************************************************************
Note: Queue reported is the number of cars per lane.
********************************************************************************
Traffix 7.9.0415 (c) 2007 Dowling Assoc. Licensed to W-TRANS, Santa Rosa, CA
PM Future plus Project Fri Jul 24, 2009 14:35:00 Page 4-1
--------------------------------------------------------------------------------
PM Peak Hour - Future plus Project Conditions
Traffic Impact Study for the WinCo Foods Expansion
City of Chico
--------------------------------------------------------------------------------
Level Of Service Computation Report
2000 HCM Unsignalized Method (Future Volume Alternative)
********************************************************************************
Intersection #3 E 20th St/Driveway
********************************************************************************
Average Delay (sec/veh): 12.1 Worst Case Level Of Service: F[118.9]
********************************************************************************
Street Name: Driveway E 20th St
Approach: North Bound South Bound East Bound West Bound
Movement: L - T - R L - T - R L - T - R L - T - R
------------|---------------||---------------||---------------||---------------|
Control: Stop Sign Stop Sign Uncontrolled Uncontrolled
Rights: Include Include Include Include
Lanes: 0 0 0 0 0 0 0 0 0 1 0 0 2 0 0 0 0 1 1 0
------------|---------------||---------------||---------------||---------------|
Volume Module:
Base Vol: 0 0 0 0 0 368 0 1680 0 0 1518 74
Growth Adj: 1.00 1.00 1.00 1.00 1.00 1.00 1.00 1.00 1.00 1.00 1.00 1.00
Initial Bse: 0 0 0 0 0 368 0 1680 0 0 1518 74
Added Vol: 0 0 0 0 0 4 0 0 0 0 0 0
PasserByVol: 0 0 0 0 0 0 0 0 0 0 0 0
Initial Fut: 0 0 0 0 0 372 0 1680 0 0 1518 74
User Adj: 1.00 1.00 1.00 1.00 1.00 1.00 1.00 1.00 1.00 1.00 1.00 1.00
PHF Adj: 1.00 1.00 1.00 1.00 1.00 1.00 1.00 1.00 1.00 1.00 1.00 1.00
PHF Volume: 0 0 0 0 0 372 0 1680 0 0 1518 74
Reduct Vol: 0 0 0 0 0 0 0 0 0 0 0 0
FinalVolume: 0 0 0 0 0 372 0 1680 0 0 1518 74
------------|---------------||---------------||---------------||---------------|
Critical Gap Module:
Critical Gp:xxxxx xxxx xxxxx xxxxx xxxx 6.9 xxxxx xxxx xxxxx xxxxx xxxx xxxxx
FollowUpTim:xxxxx xxxx xxxxx xxxxx xxxx 3.3 xxxxx xxxx xxxxx xxxxx xxxx xxxxx
------------|---------------||---------------||---------------||---------------|
Capacity Module:
Cnflict Vol: xxxx xxxx xxxxx xxxx xxxx 796 xxxx xxxx xxxxx xxxx xxxx xxxxx
Potent Cap.: xxxx xxxx xxxxx xxxx xxxx 334 xxxx xxxx xxxxx xxxx xxxx xxxxx
Move Cap.: xxxx xxxx xxxxx xxxx xxxx 334 xxxx xxxx xxxxx xxxx xxxx xxxxx
Volume/Cap: xxxx xxxx xxxx xxxx xxxx 1.11 xxxx xxxx xxxx xxxx xxxx xxxx
------------|---------------||---------------||---------------||---------------|
Level Of Service Module:
2Way95thQ: xxxx xxxx xxxxx xxxx xxxx 14.4 xxxx xxxx xxxxx xxxx xxxx xxxxx
Control Del:xxxxx xxxx xxxxx xxxxx xxxx 118.9 xxxxx xxxx xxxxx xxxxx xxxx xxxxx
LOS by Move: * * * * * F * * * * * *
Movement: LT - LTR - RT LT - LTR - RT LT - LTR - RT LT - LTR - RT
Shared Cap.: xxxx xxxx xxxxx xxxx xxxx xxxxx xxxx xxxx xxxxx xxxx xxxx xxxxx
SharedQueue:xxxxx xxxx xxxxx xxxxx xxxx xxxxx xxxxx xxxx xxxxx xxxxx xxxx xxxxx
Shrd ConDel:xxxxx xxxx xxxxx xxxxx xxxx xxxxx xxxxx xxxx xxxxx xxxxx xxxx xxxxx
Shared LOS: * * * * * * * * * * * *
ApproachDel: xxxxxx 118.9 xxxxxx xxxxxx
ApproachLOS: * F * *
********************************************************************************
Note: Queue reported is the number of cars per lane.
********************************************************************************
Traffix 7.9.0415 (c) 2007 Dowling Assoc. Licensed to W-TRANS, Santa Rosa, CA
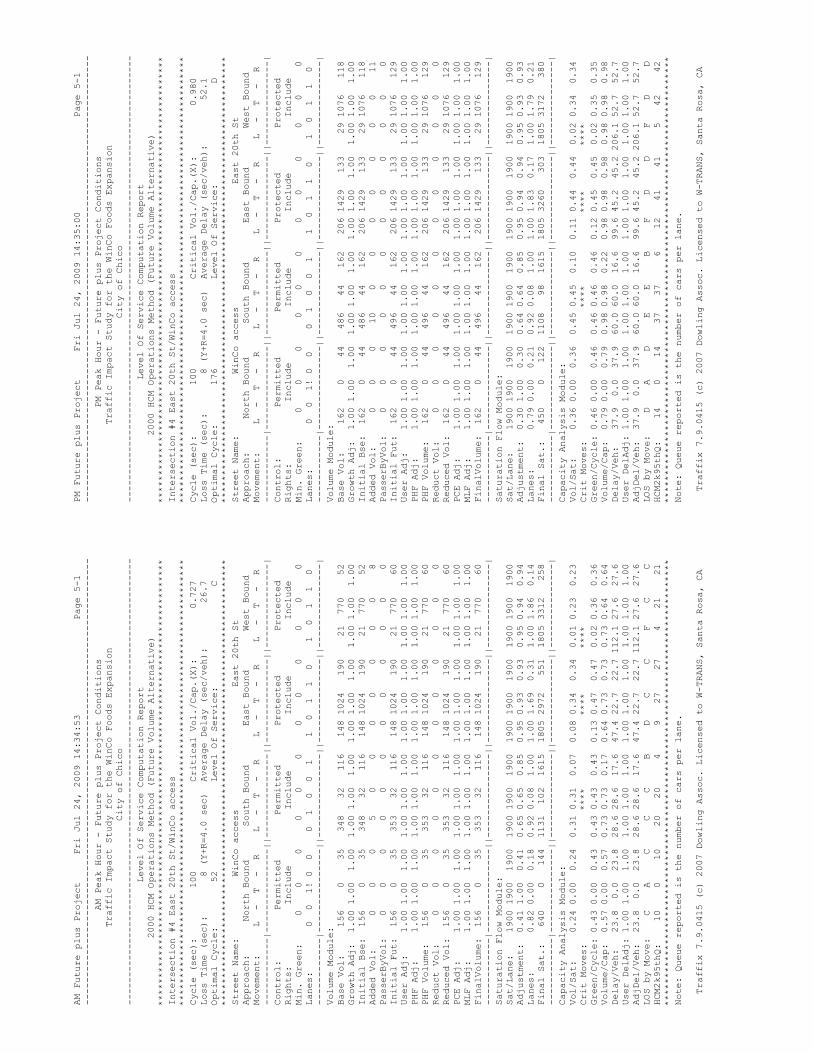
AM Future plus Project Fri Jul 24, 2009 14:34:53 Page 5-1
--------------------------------------------------------------------------------
AM Peak Hour - Future plus Project Conditions
Traffic Impact Study for the WinCo Foods Expansion
City of Chico
--------------------------------------------------------------------------------
Level Of Service Computation Report
2000 HCM Operations Method (Future Volume Alternative)
********************************************************************************
Intersection #4 East 20th St/WinCo access
********************************************************************************
Cycle (sec): 100 Critical Vol./Cap.(X): 0.727
Loss Time (sec): 8 (Y+R=4.0 sec) Average Delay (sec/veh): 26.7
Optimal Cycle: 52 Level Of Service: C
********************************************************************************
Street Name: WinCo access East 20th St
Approach: North Bound South Bound East Bound West Bound
Movement: L - T - R L - T - R L - T - R L - T - R
------------|---------------||---------------||---------------||---------------|
Control: Permitted Permitted Protected Protected
Rights: Include Include Include Include
Min. Green: 0 0 0 0 0 0 0 0 0 0 0 0
Lanes: 0 0 1! 0 0 0 1 0 0 1 1 0 1 1 0 1 0 1 1 0
------------|---------------||---------------||---------------||---------------|
Volume Module:
Base Vol: 156 0 35 348 32 116 148 1024 190 21 770 52
Growth Adj: 1.00 1.00 1.00 1.00 1.00 1.00 1.00 1.00 1.00 1.00 1.00 1.00
Initial Bse: 156 0 35 348 32 116 148 1024 190 21 770 52
Added Vol: 0 0 0 5 0 0 0 0 0 0 0 8
PasserByVol: 0 0 0 0 0 0 0 0 0 0 0 0
Initial Fut: 156 0 35 353 32 116 148 1024 190 21 770 60
User Adj: 1.00 1.00 1.00 1.00 1.00 1.00 1.00 1.00 1.00 1.00 1.00 1.00
PHF Adj: 1.00 1.00 1.00 1.00 1.00 1.00 1.00 1.00 1.00 1.00 1.00 1.00
PHF Volume: 156 0 35 353 32 116 148 1024 190 21 770 60
Reduct Vol: 0 0 0 0 0 0 0 0 0 0 0 0
Reduced Vol: 156 0 35 353 32 116 148 1024 190 21 770 60
PCE Adj: 1.00 1.00 1.00 1.00 1.00 1.00 1.00 1.00 1.00 1.00 1.00 1.00
MLF Adj: 1.00 1.00 1.00 1.00 1.00 1.00 1.00 1.00 1.00 1.00 1.00 1.00
FinalVolume: 156 0 35 353 32 116 148 1024 190 21 770 60
------------|---------------||---------------||---------------||---------------|
Saturation Flow Module:
Sat/Lane: 1900 1900 1900 1900 1900 1900 1900 1900 1900 1900 1900 1900
Adjustment: 0.41 1.00 0.41 0.65 0.65 0.85 0.95 0.93 0.93 0.95 0.94 0.94
Lanes: 0.82 0.00 0.18 0.92 0.08 1.00 1.00 1.69 0.31 1.00 1.86 0.14
Final Sat.: 640 0 144 1131 102 1615 1805 2972 551 1805 3312 258
------------|---------------||---------------||---------------||---------------|
Capacity Analysis Module:
Vol/Sat: 0.24 0.00 0.24 0.31 0.31 0.07 0.08 0.34 0.34 0.01 0.23 0.23
Crit Moves: **** **** ****
Green/Cycle: 0.43 0.00 0.43 0.43 0.43 0.43 0.13 0.47 0.47 0.02 0.36 0.36
Volume/Cap: 0.57 0.00 0.57 0.73 0.73 0.17 0.64 0.73 0.73 0.73 0.64 0.64
Delay/Veh: 23.8 0.0 23.8 28.6 28.6 17.6 47.4 22.7 22.7 112.1 27.6 27.6
User DelAdj: 1.00 1.00 1.00 1.00 1.00 1.00 1.00 1.00 1.00 1.00 1.00 1.00
AdjDel/Veh: 23.8 0.0 23.8 28.6 28.6 17.6 47.4 22.7 22.7 112.1 27.6 27.6
LOS by Move: C A C C C B D C C F C C
HCM2k95thQ: 10 0 10 20 20 4 9 27 27 4 21 21
********************************************************************************
Note: Queue reported is the number of cars per lane.
Traffix 7.9.0415 (c) 2007 Dowling Assoc. Licensed to W-TRANS, Santa Rosa, CA
PM Future plus Project Fri Jul 24, 2009 14:35:00 Page 5-1
--------------------------------------------------------------------------------
PM Peak Hour - Future plus Project Conditions
Traffic Impact Study for the WinCo Foods Expansion
City of Chico
--------------------------------------------------------------------------------
Level Of Service Computation Report
2000 HCM Operations Method (Future Volume Alternative)
********************************************************************************
Intersection #4 East 20th St/WinCo access
********************************************************************************
Cycle (sec): 100 Critical Vol./Cap.(X): 0.980
Loss Time (sec): 8 (Y+R=4.0 sec) Average Delay (sec/veh): 52.1
Optimal Cycle: 176 Level Of Service: D
********************************************************************************
Street Name: WinCo access East 20th St
Approach: North Bound South Bound East Bound West Bound
Movement: L - T - R L - T - R L - T - R L - T - R
------------|---------------||---------------||---------------||---------------|
Control: Permitted Permitted Protected Protected
Rights: Include Include Include Include
Min. Green: 0 0 0 0 0 0 0 0 0 0 0 0
Lanes: 0 0 1! 0 0 0 1 0 0 1 1 0 1 1 0 1 0 1 1 0
------------|---------------||---------------||---------------||---------------|
Volume Module:
Base Vol: 162 0 44 486 44 162 206 1429 133 29 1076 118
Growth Adj: 1.00 1.00 1.00 1.00 1.00 1.00 1.00 1.00 1.00 1.00 1.00 1.00
Initial Bse: 162 0 44 486 44 162 206 1429 133 29 1076 118
Added Vol: 0 0 0 10 0 0 0 0 0 0 0 11
PasserByVol: 0 0 0 0 0 0 0 0 0 0 0 0
Initial Fut: 162 0 44 496 44 162 206 1429 133 29 1076 129
User Adj: 1.00 1.00 1.00 1.00 1.00 1.00 1.00 1.00 1.00 1.00 1.00 1.00
PHF Adj: 1.00 1.00 1.00 1.00 1.00 1.00 1.00 1.00 1.00 1.00 1.00 1.00
PHF Volume: 162 0 44 496 44 162 206 1429 133 29 1076 129
Reduct Vol: 0 0 0 0 0 0 0 0 0 0 0 0
Reduced Vol: 162 0 44 496 44 162 206 1429 133 29 1076 129
PCE Adj: 1.00 1.00 1.00 1.00 1.00 1.00 1.00 1.00 1.00 1.00 1.00 1.00
MLF Adj: 1.00 1.00 1.00 1.00 1.00 1.00 1.00 1.00 1.00 1.00 1.00 1.00
FinalVolume: 162 0 44 496 44 162 206 1429 133 29 1076 129
------------|---------------||---------------||---------------||---------------|
Saturation Flow Module:
Sat/Lane: 1900 1900 1900 1900 1900 1900 1900 1900 1900 1900 1900 1900
Adjustment: 0.30 1.00 0.30 0.64 0.64 0.85 0.95 0.94 0.94 0.95 0.93 0.93
Lanes: 0.79 0.00 0.21 0.92 0.08 1.00 1.00 1.83 0.17 1.00 1.79 0.21
Final Sat.: 450 0 122 1108 98 1615 1805 3260 303 1805 3172 380
------------|---------------||---------------||---------------||---------------|
Capacity Analysis Module:
Vol/Sat: 0.36 0.00 0.36 0.45 0.45 0.10 0.11 0.44 0.44 0.02 0.34 0.34
Crit Moves: **** **** ****
Green/Cycle: 0.46 0.00 0.46 0.46 0.46 0.46 0.12 0.45 0.45 0.02 0.35 0.35
Volume/Cap: 0.79 0.00 0.79 0.98 0.98 0.22 0.98 0.98 0.98 0.98 0.98 0.98
Delay/Veh: 37.9 0.0 37.9 60.0 60.0 16.6 99.6 45.2 45.2 206.1 52.7 52.7
User DelAdj: 1.00 1.00 1.00 1.00 1.00 1.00 1.00 1.00 1.00 1.00 1.00 1.00
AdjDel/Veh: 37.9 0.0 37.9 60.0 60.0 16.6 99.6 45.2 45.2 206.1 52.7 52.7
LOS by Move: D A D E E B F D D F D D
HCM2k95thQ: 14 0 14 37 37 6 12 41 41 5 42 42
********************************************************************************
Note: Queue reported is the number of cars per lane.
Traffix 7.9.0415 (c) 2007 Dowling Assoc. Licensed to W-TRANS, Santa Rosa, CA

Traffic Impact Study for WinCo Foods Expansion in the City of Chico August 2009
Appendix B
Signal Warrant Calculations

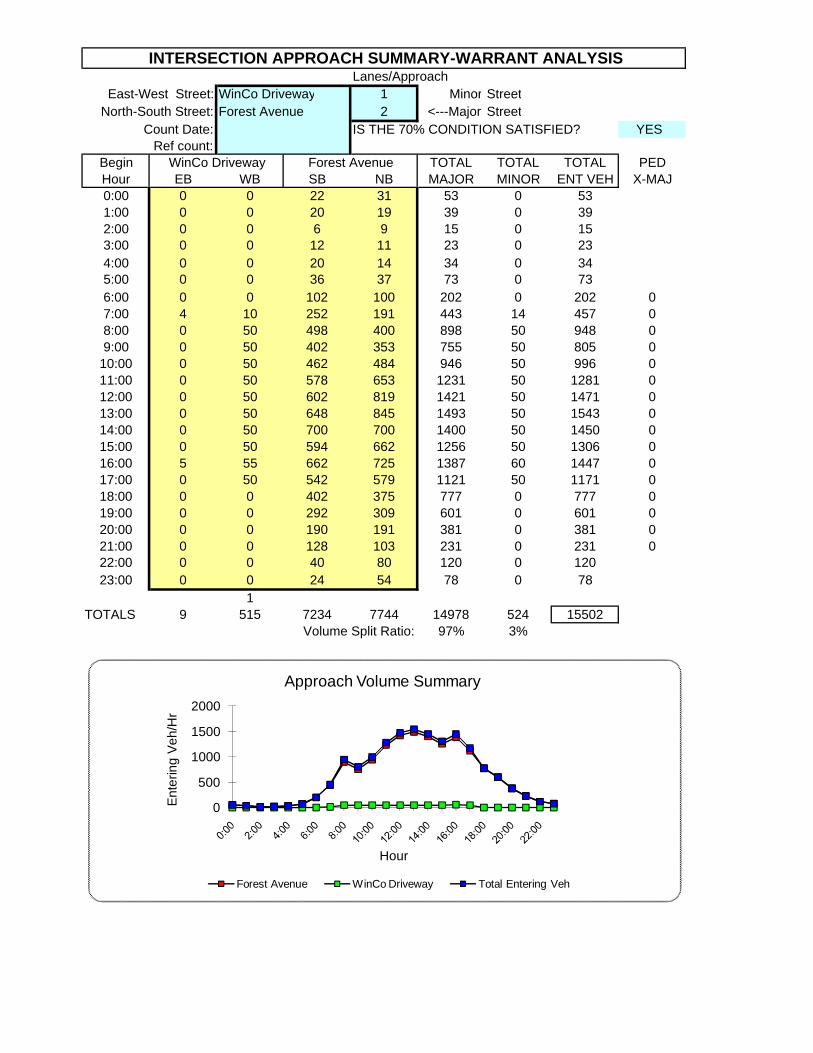
Lanes/ApproachEast-West Street: WinCo Driveway 1 Minor Street
North-South Street: Forest Avenue 2 <---Major StreetCount Date: IS THE 70% CONDITION SATISFIED? YES
Ref count:Begin TOTAL TOTAL TOTAL PEDHour EB WB SB NB MAJOR MINOR ENT VEH X-MAJ0:00 0 0 22 31 53 0 531:00 0 0 20 19 39 0 392:00 0 0 6 9 15 0 153:00 0 0 12 11 23 0 234:00 0 0 20 14 34 0 345:00 0 0 36 37 73 0 736:00 0 0 102 100 202 0 202 07:00 4 10 252 191 443 14 457 08:00 0 50 498 400 898 50 948 09:00 0 50 402 353 755 50 805 0
10:00 0 50 462 484 946 50 996 011:00 0 50 578 653 1231 50 1281 012:00 0 50 602 819 1421 50 1471 013:00 0 50 648 845 1493 50 1543 014:00 0 50 700 700 1400 50 1450 015:00 0 50 594 662 1256 50 1306 016:00 5 55 662 725 1387 60 1447 017:00 0 50 542 579 1121 50 1171 018:00 0 0 402 375 777 0 777 019:00 0 0 292 309 601 0 601 020:00 0 0 190 191 381 0 381 021:00 0 0 128 103 231 0 231 022:00 0 0 40 80 120 0 12023:00 0 0 24 54 78 0 78
1TOTALS 9 515 7234 7744 14978 524 15502
Volume Split Ratio: 97% 3%
WinCo Driveway Forest Avenue
INTERSECTION APPROACH SUMMARY-WARRANT ANALYSIS
0
500
1000
1500
2000
Ente
ring
Veh/
Hr
Hour
Approach Volume Summary
Forest Avenue WinCo Driveway Total Entering Veh
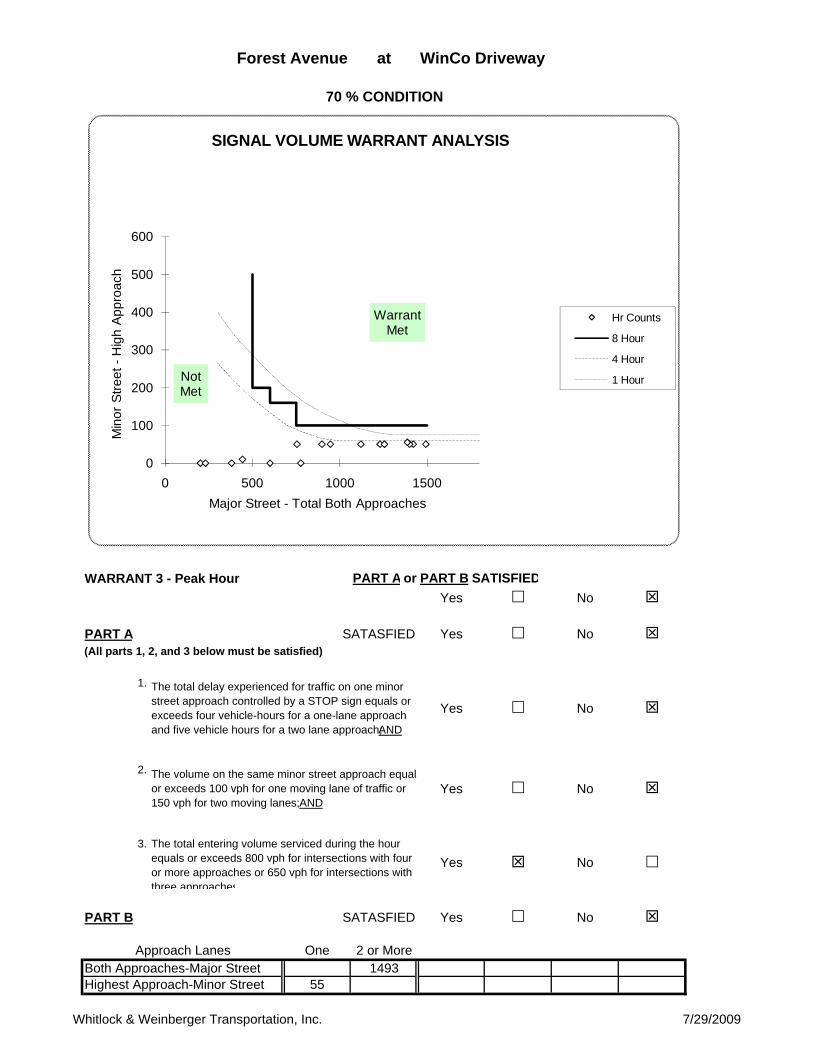
Forest Avenue at WinCo Driveway
70 % CONDITION
WARRANT 3 - Peak Hour PART A or PART B SATISFIEDYes No
PART A Yes No(All parts 1, 2, and 3 below must be satisfied)
1.
2.
3.
PART B Yes No
One 2 or More 1493
55
SATASFIED
Approach LanesBoth Approaches-Major StreetHighest Approach-Minor Street
The volume on the same minor street approach equalsor exceeds 100 vph for one moving lane of traffic or 150 vph for two moving lanes; AND
Yes No
The total entering volume serviced during the hour equals or exceeds 800 vph for intersections with four or more approaches or 650 vph for intersections with three approaches
Yes No
SATASFIED
The total delay experienced for traffic on one minor street approach controlled by a STOP sign equals or exceeds four vehicle-hours for a one-lane approach and five vehicle hours for a two lane approach; AND
Yes No
0
100
200
300
400
500
600
0 500 1000 1500
Min
or S
treet
-H
igh
Appr
oach
Major Street - Total Both Approaches
SIGNAL VOLUME WARRANT ANALYSIS
Hr Counts
8 Hour
4 Hour
1 Hour
WarrantMet
NotMet
Whitlock & Weinberger Transportation, Inc. 7/29/2009