Embed Size (px)
Citation preview

FEDERAL BOULEVARD (5TH AVENUE TO HOWARD PLACE)
PLANNING ENVIRONMENTAL LINKAGE STUDY
TRAFFIC REPORT
Prepared for:
City and County of Denver
201 West Colfax Avenue, Department 509 Denver, CO 80202
Colorado Department of Transportation
Region 6 2000 S. Holly Street Denver, CO 80222
Federal Highway Administration
12300 West Dakota Avenue, Suite 180 Lakewood, CO 80228
Prepared by:
Felsburg Holt & Ullevig 6300 South Syracuse Way, Suite 600
Centennial, CO 80111 303/721-1440
FHU Reference No. 08-171 June 2009


FFEELLSSBBUURRGG HHOOLLTT && UULLLLEEVVIIGG
Traffic Report Table of Contents 1.0 Introduction ........................................................................................................... 1
1.1 Purpose of Report .........................................................................................1 1.2 Additional Traffic Evaluations........................................................................1
2.0 Existing Conditions ............................................................................................... 2 2.1 Existing Roadway Network ...........................................................................2 2.2 Existing Traffic Volumes................................................................................2 2.3 Capacity Analysis..........................................................................................2
2.3.1 Methodology .....................................................................................2 2.3.2 Public Transportation Services .........................................................5 2.3.3 Study Intersections ...........................................................................8 2.3.4 Level of Service ................................................................................8
3.0 Assessment of Future Conditions ....................................................................... 10 3.1 Traffic Forecasting ......................................................................................10
3.1.1 Forecasting Process .......................................................................10 3.1.2 Baseline Roadway Network............................................................10 3.1.3 Traffic Forecasts .............................................................................10
3.2 Year 2035 No-Action Capacity Analysis .....................................................12 3.2.1 Level of Service ..............................................................................12
4.0 Analysis of Proposed Action Scenario ................................................................ 15 4.1 Definition of Proposed Action Scenario.......................................................15 4.2 Traffic Volume Forecasts ............................................................................15 4.3 Level of Service Analysis of Proposed Action Scenario..............................15
4.3.1 Proposed Action Scenario ..............................................................15 4.3.2 Level of Service Summary..............................................................18
5.0 Summary .....................................................................................................19 Appendices
Appendix A Level of Service Criteria and Threshold Values.............................................A Appendix B Existing Conditions Level of Service Worksheets..........................................B Appendix C Year 2035 No-Action System Alternative Level of Service Worksheets....... C Appendix D Year 2035 Build Out Scenario Level of Service Worksheets ....................... D
FFEELLSSBBUURRGG HHOOLLTT && UULLLLEEVVIIGG
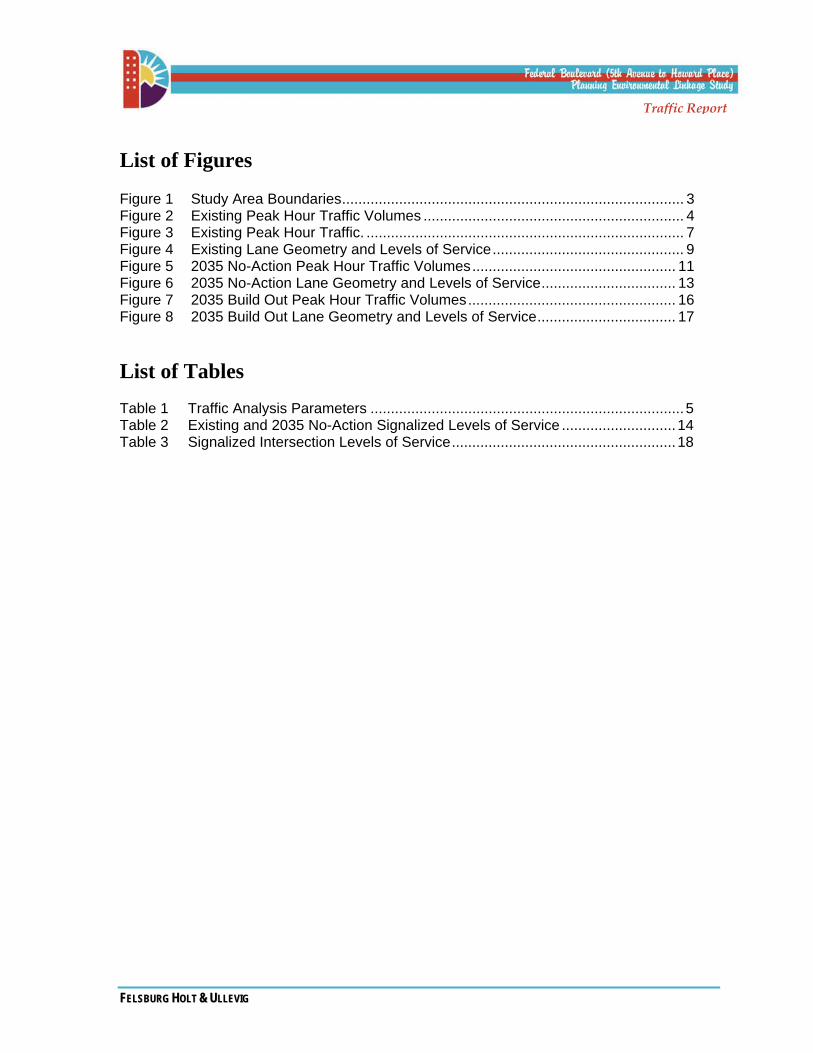
Traffic Report List of Figures Figure 1 Study Area Boundaries.................................................................................... 3 Figure 2 Existing Peak Hour Traffic Volumes ................................................................ 4 Figure 3 Existing Peak Hour Traffic. .............................................................................. 7 Figure 4 Existing Lane Geometry and Levels of Service............................................... 9 Figure 5 2035 No-Action Peak Hour Traffic Volumes.................................................. 11 Figure 6 2035 No-Action Lane Geometry and Levels of Service................................. 13 Figure 7 2035 Build Out Peak Hour Traffic Volumes................................................... 16 Figure 8 2035 Build Out Lane Geometry and Levels of Service.................................. 17 List of Tables Table 1 Traffic Analysis Parameters .............................................................................5 Table 2 Existing and 2035 No-Action Signalized Levels of Service ............................14 Table 3 Signalized Intersection Levels of Service.......................................................18

FFEELLSSBBUURRGG HHOOLLTT && UULLLLEEVVIIGG
Traffic Report
List of Abbreviated Terms AM morning CatEx Categorical Exclusion CCD City and County of Denver CDOT Colorado Department of Transportation DRCOG Denver Regional Council of Governments HCM Highway Capacity Manual LOS Level of Service mph miles per hour NHS National Highway System PEL Planning Environmental Linkage study PM afternoon and evening TWLTL two way left turn lane US 6 US Highway 6 / 6th Avenue vpd vehicles per day


FFEELLSSBBUURRGG HHOOLLTT && UULLLLEEVVIIGG Page 1
Traffic Report
1.0 Introduction
1.1 Purpose of Report This Traffic Report is a technical report intended to present findings of the evaluations of existing and future traffic operations for the Federal Boulevard (5th Avenue to Howard Place) Planning Environmental Linkage (PEL) Study. The report is organized in the following sections:
• Section 1 provides an introduction, with statements about the purpose of the report in the PEL development process.
• Section 2 provides an evaluation of existing traffic operational conditions. • Section 3 presents year 2035 traffic forecasts and evaluates operational conditions in
2035 with the No-Action scenario. • Section 4 provides level of service (LOS) evaluations of intersection operations in the
year 2035 with the Proposed Action scenario. • Section 5 provides a summary of results of the traffic study. The traffic forecasts that are presented and evaluated in this report are Year 2035 forecasts, using the Denver Regional Council of Governments (DRCOG) 2035 regional travel demand forecasting model as a basis.
There are three primary purposes for the preparation of this Traffic Report:
• It provides an opportunity for stakeholders to review analyses in detail to inform ongoing discussions about the PEL improvements.
• It provides detailed information supporting the PEL traffic analysis beyond what may be included in the PEL final report, which is intended to be a more concise summary of important traffic analysis results and conclusions.
• The traffic forecasts and level of service findings presented provide a basis for preliminary analyses of other resources, including air quality and noise.
1.2 Additional Traffic Evaluations Another related technical report that is being developed is the Safety Report. This report provides an analysis of the accident history in the study area. The results of the Traffic Report and the Safety Report will be refined and incorporated in the Transportation Impacts section of the forthcoming PEL.

FFEELLSSBBUURRGG HHOOLLTT && UULLLLEEVVIIGG Page 2
Traffic Report
2.0 Existing Conditions
2.1 Existing Roadway Network The study area designated for the Federal Boulevard PEL process is depicted on Figure 1. Federal Boulevard is an arterial roadway with three lanes southbound and two lanes northbound between 5th Avenue and 10th Avenue, and three lanes southbound and northbound between 10th Avenue and Holden Place. This section of Federal Boulevard is a segment of State Highway 88 (SH 88) within the City and County of Denver (CCD). The study includes the portion of Federal Boulevard between 5th Avenue (MP 1.12) and south of Howard Place (MP 0.17). This section of SH 88 is designated on the National Highway System (NHS). The speed limit along this section of Federal Boulevard is 35 mph.
2.2 Existing Traffic Volumes Existing daily and peak hour traffic volume information is summarized on Figure 2. The average weekday daily traffic volumes on Federal Boulevard are approximately 40,000 vehicles per day (vpd) between 6th and 8th Avenues and 41,400 vpd between 8th and Colfax Avenues. These volumes were obtained from the average annual traffic volumes contained in the Colorado Department of Transportation (CDOT) data base, adjusted up by 6% to convert to a weekday traffic equivalent based on CDOT data.
Existing peak hour traffic count data were developed from counts taken for the Baseline Traffic Analysis Report - Existing and 2030 No-Action Conditions report completed in July 2006 for the Environmental Assessment of Federal Boulevard from Alameda to 5th Avenue and counts performed for this PEL study in August and September 2008.
Traffic count data were evaluated to determine the directional split and percents of daily traffic occurring during peak hours. The northbound direction experienced 47% of traffic while the southbound direction experienced 53% of traffic. This disparity is likely due to the lane difference created by two northbound lanes and three southbound lanes. Percentages of traffic occurring in the peak hours are approximately 7% and 9% for the AM and PM hours, respectively. Traffic flows remain heavy over long periods of the day.
2.3 Capacity Analysis
2.3.1 Methodology The analysis of traffic operations in the study area utilized methods documented in the Highway Capacity Manual (HCM), Transportation Research Board, 2000 Edition. The result of such an analysis is a level of service (LOS) rating, which is a qualitative assessment of the traffic flow for a given roadway facility. Level of service is described by a letter designation ranging from “A” to “F”, with LOS A representing essentially uninterrupted flow, and LOS F representing a breakdown of traffic flow and excessive congestion and delay. For analysis of a signalized intersection, a LOS rating is calculated for an intersection as a whole. Level of service analysis of an unsignalized intersection yields a LOS rating for each critical vehicle movement. The Synchro software analysis package and methodology was utilized to calculate LOS ratings for signalized intersections throughout the study area.
The traffic parameters shown in Table 1 were used as the basis for the operational analyses. Level of service delay parameters are included in Appendix A.

Study Area BoundariesFigure 1
Federal Boulevard CATEX 08-171 1/27/09
NORTH
FELSBURGH O L T &U L L E V I G
MATCHLINE
MATCHLINE
= Signalized Intersection
LEGEND
Holden Pl.
Howard Pl.
12th Ave.
11th Ave.
10th Ave.
9th Ave.
Barberry Pl.
8th Ave.
Severn Pl.
7th Ave.
6th Ave. WB On-Ramp
5th Ave.
6th Ave. EB Off-Ramp
6th Ave.
FEDE
RAL
BOUL
EVAR
D
FEDE
RAL
BOUL
EVAR
D
88
88
p

Existing Traffic VolumesFigure 2
Federal Boulevard CATEX 08-171 11/17/08
NORTH
FELSBURGH O L T &U L L E V I G
Holden Pl.
12th Ave.
11th Ave.
10th Ave.
9th Ave.
Barberry Pl.
8th Ave.
Severn Pl.
7th Ave.
6th Ave. WB On-Ramp
5th Ave.
6th Ave. EB Off-Ramp
6th Ave.
Fed
eral
Bou
leva
rd
22(31)22(81)27(99)
113(92)75(31)49(70)
31(1
10)
1349
(168
5)29
(25)
44(7
4)11
18(1
573
)41
(36
)
12(35)0(0)3(13)
2(4)4(1)
42(21)
8(1
3)
1358
(177
3)
21(1
4)
15(2
1)11
42(1
635)
44
(32)
78(156)121(436)144(449)
36(114)43(181)152(289)
100(53)276(70)
20(41)
31(1
05)
1208
(156
4)89
(30
)
22(4
5)93
0(1
462)
211(
80)
1548
(181
3)
148
(47)
1396
(184
4)15
1(16
)
6(2
9)
1570
(184
2)
33(106)8(56)
29(130)4(6)
12(16)16(32)
1024
(179
5)50
(38
)
1033
(171
7)18
8(1
8)
1276
(201
3)
1219
(144
7)
139
(374
)11
90(1
733
)
227(176)147(250)
271(
211)
1163
(143
4)1320
(20
62)
53(1
6)
18(66)7(32)
1158
(151
8)
33(2
3)
14(4
1)10
35(1
827)
1372
(20
64)
1(2)
5(22)0(2)
1167
(157
2)1(
5)
= AM(PM) Peak Hour Traffic Volumes
= Average Weekday Daily Traffic
LEGEND
XXX(XXX)
XXXX
41,4
0040
,000
88

FFEELLSSBBUURRGG HHOOLLTT && UULLLLEEVVIIGG Page 5
Traffic Report Table 1 Traffic Analysis Parameters
Input Parameter Value
Base Saturation Flow Rate 1,800
Lane Width (ft) 9-16*
Peak Hour Factor (PHF) 0.90 – 0.98*
Heavy Vehicle (%) 2-8*
Controller Type Actuated-Coordinated
Cycle Length 100 seconds
Yellow Time 3 seconds
Red Time 2 seconds
Bus Blockages (#/hr) 0-10* *Varies by location.

FFEELLSSBBUURRGG HHOOLLTT && UULLLLEEVVIIGG Page 6
Traffic Report
2.3.2 Public Transportation Services The Regional Transportation District (RTD) operates several bus routes that service Federal Boulevard. Federal Boulevard is a heavily used transit corridor. There are four routes that provide services along Federal Boulevard within this project area: Route 30 South Federal, 30L South Federal Limited, 36L Fort Logan Limited, and 49 North Lowell.
Figure 3 shows the locations of the bus stops and each route that services it in the study area.
Route 30 South Federal. This route is the primary service provider along Federal Boulevard and provides all day service between the Wadsworth-Hampden Park-N-Ride and downtown Denver. Service is provided every 10 minutes in each direction during the peak hours, every 15 minutes in each direction during the off-peak hours, and every 30 minutes in each direction during the late-night hours.
Route 30L South Federal Limited. This route provides additional service during both the AM and PM peak periods between the Wadsworth-Hampden Park-N-Ride and downtown Denver. Service includes four northbound and one southbound trip during the morning period, and one northbound and four southbound trips during the evening period.
Route 36L Fort Logan Limited. This route provides additional service during both the AM and PM peak periods between the Littleton/Downtown Station and downtown Denver. Service includes six northbound and four southbound trips during the morning period, and six northbound and nine southbound trips during the evening period.
Route 49 North Lowell. This route provides service during both the AM and PM peak periods between the Colfax-Federal Transfer Center and 46th Avenue/Wolff Street. Service includes three northbound and three southbound trips during the morning period, and three northbound and three southbound trips during the evening period.
The impact of these bus routes on Federal Boulevard traffic was observed during a site visit. The primary problem occurred when a bus approached a stop and blocked the right lane along Federal Boulevard causing all traffic behind also to stop. Many cars did not wait until the bus started again, but instead abruptly turned into the adjacent lane. This problem is most pronounced in the northbound direction where there are only two lanes and it was harder for vehicles to avoid the bus blocked lane. The effect of bus stops along the corridor was included in the Synchro modeling for all analyses.

RTD Bus Stop LocationsFigure 3
Federal Boulevard CATEX 08-171 10/28/08
NORTH
FELSBURGH O L T &U L L E V I G
= 36L (N-S thru corridor)= 30 (N-S thru corridor)= 30L (N-S thru corridor)= 49 (E on 10th, N onto Federal thru corridor)= Bus Stops
LEGEND
RouteHolden Pl.
12th Ave.
11th Ave.
10th Ave.
9th Ave.
Barberry Pl.
8th Ave.
Severn Pl.
7th Ave.
6th Ave. WB On-Ramp
5th Ave.
6th Ave. EB Off-Ramp
6th Ave.
Fed
eral
Bou
leva
rd
NOTE: Route 9 servicesEB 10th Avenue every 15 min. in AM 30 min. in PMWB 10th Avenue every 30 min. in AM 20 min. in PM
30, 30L, 36L, 49
30, 30L, 36L
30
30
30
49
30, 30L, 36L, 49
30, 30L, 36L, 49
30
30
30
88

FFEELLSSBBUURRGG HHOOLLTT && UULLLLEEVVIIGG Page 8
Traffic Report
2.3.3 Study Intersections A description of the ten study corridor intersections with Federal Boulevard is provided below. The lane geometry for each of the intersections is depicted in Figure 4.
• Holden Place. Holden Place is signalized with permitted left turn phasing in the southbound direction. Holden Place is a tee intersection to the east and is a two-way two-lane local street. The posted speed limit for this cross street is 30 mph.
• 12th Avenue. 12th Avenue is an unsignalized tee-intersection. Federal Boulevard includes a painted median two way left turn lane. 12th Avenue is a tee intersection to the west and is a two-way two-lane local street. The posted speed limit for this cross street is 25 mph.
• 11th Avenue. 11th Avenue is an unsignalized tee-intersection. Federal Boulevard includes a painted median two way left turn lane. 11th Avenue is a tee intersection to the east and is a two-way two-lane driveway into the Denver Health Westside Family Health Center.
• 10th Avenue. 10th Avenue is signalized with permitted left turn phasing in the northbound and southbound direction. 10th Avenue is a two-way two-lane collector street. The posted speed limit for this cross street is 30 mph and on street parking is available.
• 9th Avenue. 9th Avenue is an unsignalized intersection with the eastbound and westbound legs slightly offset from one another. 9th Avenue is a two-way local street. The posted speed limit for this cross street is 30 mph.
• 8th Avenue. 8th Avenue is signalized with permitted left turn phasing in the northbound and southbound directions. 8th Avenue is a two-way arterial street east of Federal Boulevard and a collector street west of Federal Boulevard. The posted speed limit for this cross street is 35 mph.
• Severn Place. Severn Place is an unsignalized tee-intersection. Federal Boulevard includes a painted median two way left turn lane. Severn Place is a tee intersection to the east and is a two-way two-lane local street.
• 7th Avenue. 7th Avenue is an unsignalized tee-intersection. Federal Boulevard includes a painted median two way left turn lane. 7th Avenue is a tee intersection to the east and is a two-way two-lane local street.
• 6th Avenue Westbound Ramp. The 6th Avenue Westbound ramp is a signalized intersection with protected-permissive left turn phasing in the northbound direction. The 6th Avenue Westbound Ramp is a one-way street that serves as an access to and from westbound 6th Avenue (US 6).
• 6th Avenue Eastbound Ramp. The 6th Avenue Eastbound ramp is a signalized intersection. The 6th Avenue Eastbound Ramp is a one-way street that serves as an access from eastbound 6th Avenue (US 6).
2.3.4 Level of Service Figure 4 shows the existing AM and PM peak hour LOS calculated for the study intersections along Federal Boulevard. The signalized intersections are delineated by upper-case lettering while the unsignalized intersections are marked by lower-case letters. A total of 5 signalized intersections were analyzed, with all intersections operating at acceptable levels of service except 8th Avenue which operates at LOS F during the PM peak hour.
LOS worksheets for existing conditions are included in Appendix B.

Existing Lane Geometryand Levels of Service
Figure 4
Federal Boulevard Logical Termini White Paper 08-171 04/23/09
NORTH
FELSBURGH O L T &U L L E V I G
= AM/PM Peak Hour Signalized Intersection Level of Service
= AM/PM Peak Hour Unsignalized Intersection Level of Service
= Stop Sign
= Traffic Signal
LEGEND
X/X
x/x
Holden Pl.
12th Ave.
11th Ave.
10th Ave.
9th Ave.
Barberry Pl.
8th Ave.
Severn Pl.
7th Ave.
6th Ave. WB On-Ramp
5th Ave.
6th Ave. EB Off-Ramp
6th Ave.
Fed
eral
Bou
leva
rd
88
b/c
b/c
b/b
b/b
b/b
b/b
c/c
b/b
b/c
b/b
b/b
b/b
A/B
B/B
C/F
B/B
B/B
FFEELLSSBBUURRGG HHOOLLTT && UULLLLEEVVIIGG Page 10
Traffic Report
3.0 Assessment of Future Conditions
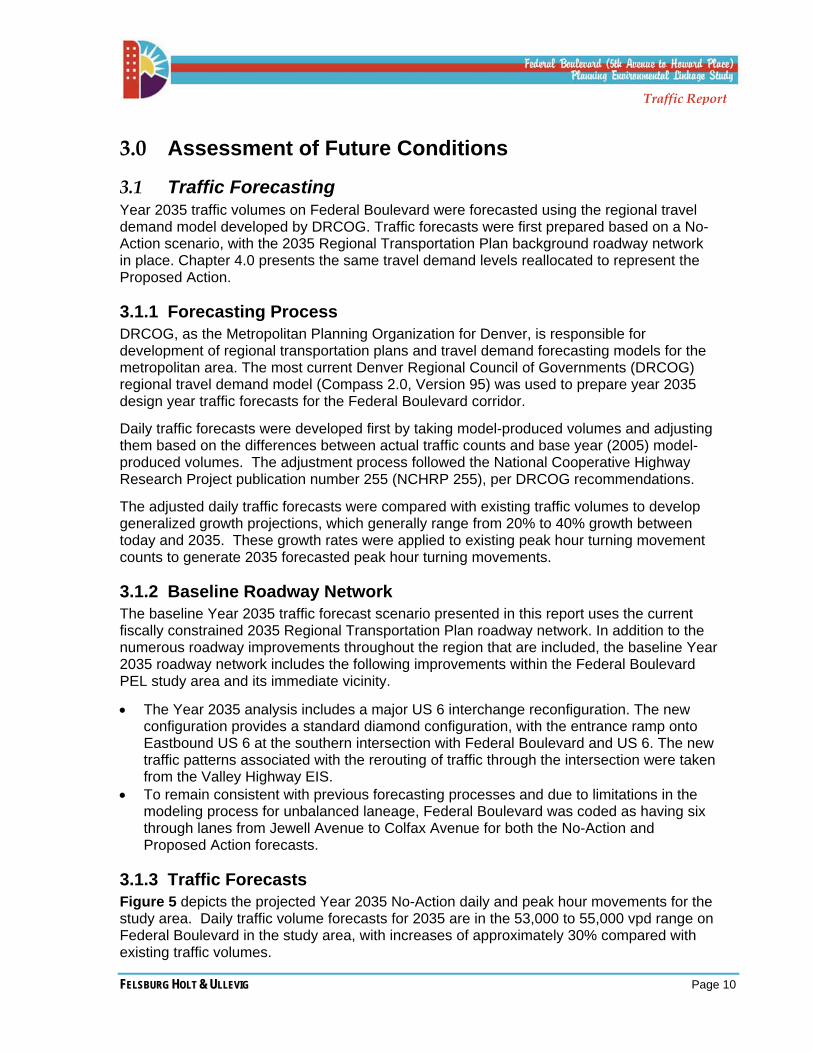
3.1 Traffic Forecasting Year 2035 traffic volumes on Federal Boulevard were forecasted using the regional travel demand model developed by DRCOG. Traffic forecasts were first prepared based on a No-Action scenario, with the 2035 Regional Transportation Plan background roadway network in place. Chapter 4.0 presents the same travel demand levels reallocated to represent the Proposed Action.
3.1.1 Forecasting Process DRCOG, as the Metropolitan Planning Organization for Denver, is responsible for development of regional transportation plans and travel demand forecasting models for the metropolitan area. The most current Denver Regional Council of Governments (DRCOG) regional travel demand model (Compass 2.0, Version 95) was used to prepare year 2035 design year traffic forecasts for the Federal Boulevard corridor.
Daily traffic forecasts were developed first by taking model-produced volumes and adjusting them based on the differences between actual traffic counts and base year (2005) model-produced volumes. The adjustment process followed the National Cooperative Highway Research Project publication number 255 (NCHRP 255), per DRCOG recommendations.
The adjusted daily traffic forecasts were compared with existing traffic volumes to develop generalized growth projections, which generally range from 20% to 40% growth between today and 2035. These growth rates were applied to existing peak hour turning movement counts to generate 2035 forecasted peak hour turning movements.
3.1.2 Baseline Roadway Network The baseline Year 2035 traffic forecast scenario presented in this report uses the current fiscally constrained 2035 Regional Transportation Plan roadway network. In addition to the numerous roadway improvements throughout the region that are included, the baseline Year 2035 roadway network includes the following improvements within the Federal Boulevard PEL study area and its immediate vicinity.
• The Year 2035 analysis includes a major US 6 interchange reconfiguration. The new configuration provides a standard diamond configuration, with the entrance ramp onto Eastbound US 6 at the southern intersection with Federal Boulevard and US 6. The new traffic patterns associated with the rerouting of traffic through the intersection were taken from the Valley Highway EIS.
• To remain consistent with previous forecasting processes and due to limitations in the modeling process for unbalanced laneage, Federal Boulevard was coded as having six through lanes from Jewell Avenue to Colfax Avenue for both the No-Action and Proposed Action forecasts.
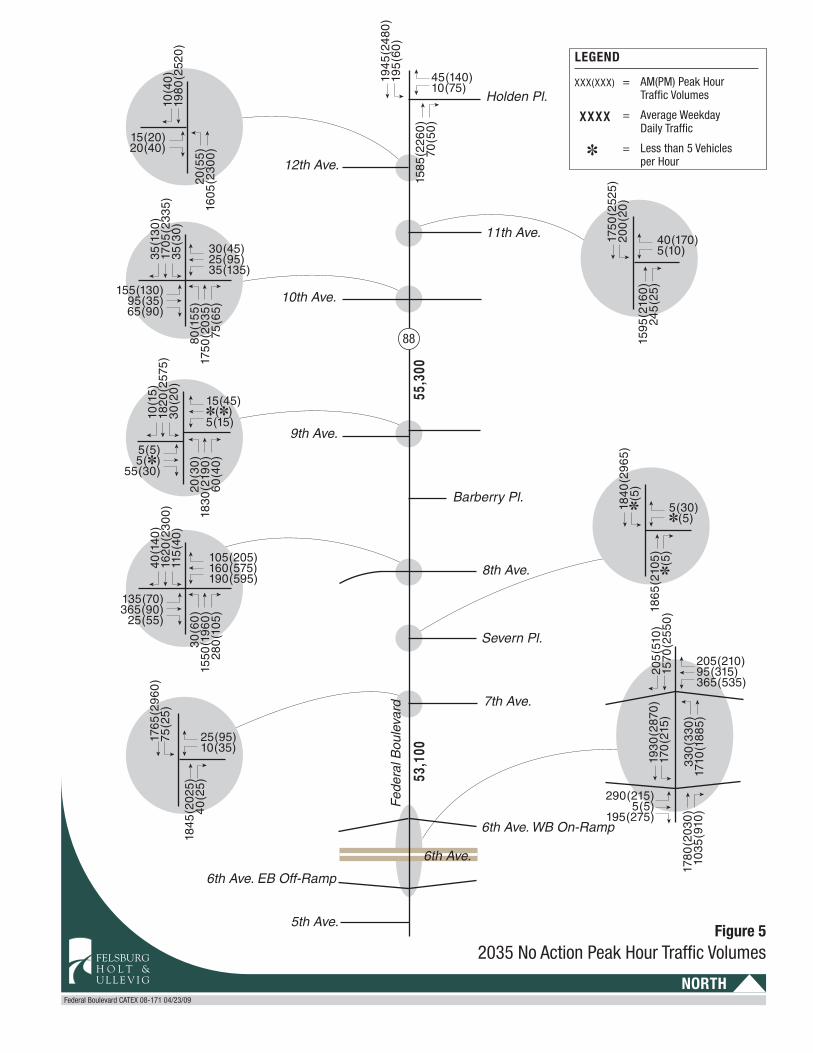
3.1.3 Traffic Forecasts Figure 5 depicts the projected Year 2035 No-Action daily and peak hour movements for the study area. Daily traffic volume forecasts for 2035 are in the 53,000 to 55,000 vpd range on Federal Boulevard in the study area, with increases of approximately 30% compared with existing traffic volumes.
2035 No Action Peak Hour Traffic VolumesFigure 5
Federal Boulevard CATEX 08-171 04/23/09
NORTH
FELSBURGH O L T &U L L E V I G
Holden Pl.
12th Ave.
11th Ave.
10th Ave.
9th Ave.
Barberry Pl.
8th Ave.
Severn Pl.
7th Ave.
6th Ave. WB On-Ramp
5th Ave.
6th Ave. EB Off-Ramp
6th Ave.
Fed
eral
Bou
leva
rd
30(45)25(95)35(135)
155(130)95(35)65(90)
35(1
30)
1705
(233
5)35
(30
)
80(1
55)
1750
(203
5)75
(65)
15(45)�(�)5(15)
5(5)5(�)
55(30)
10(1
5)18
20(2
575)
30
(20
)
20(3
0)
1830
(219
0)
60(4
0)
105(205)160(575)190(595)
205(210)95(315)365(535)
135(70)365(90)
25(55)
40(1
40)
1620
(230
0)
115
(40
)
30(6
0)
1550
(196
0)
280
(105
)
1945
(248
0)
195
(60
)
1750
(252
5)20
0(2
0)
10(4
0)
1980
(252
0)
45(140)10(75)
40(170)5(10)
15(20)20(40)
1585
(226
0)
70(5
0)
1595
(216
0)
245
(25)
1780
(203
0)
1035
(910
)
205
(510
)15
70(2
550
)
330
(330
)17
10(1
885)
1765
(296
0)
75(2
5)
25(95)10(35)
1845
(202
5)40
(25)
20(5
5)16
05(2
300
)
1840
(296
5)�
(5)
5(30)�(5)
1865
(210
5)�
(5)
290(215)5(5)
195(275)
1930
(287
0)
170
(215
)
= AM(PM) Peak Hour Traffic Volumes
= Average Weekday Daily Traffic
= Less than 5 Vehicles per Hour
LEGEND
XXX(XXX)
�
XXXX
55,3
0053
,100
88

FFEELLSSBBUURRGG HHOOLLTT && UULLLLEEVVIIGG Page 12
Traffic Report
3.2 Year 2035 No-Action Capacity Analysis
3.2.1 Level of Service As with the existing conditions operational assessment, analysis of forecasted Year 2035 traffic operations in the study area utilized methods documented in the HCM. Again, these forecasts and the operational analyses are based on the adopted Regional Transportation Plan network. The LOS results are depicted graphically on Figure 6.
The analysis of projected Year 2035 traffic conditions at each of the intersections along Federal Boulevard reflects a general pattern of worsened operational conditions. Two of the five analyzed signalized intersections are expected to operate at LOS F during peak hours, including 10th Avenue/Federal Boulevard with LOS F during the PM peak hour and 8th Avenue/Federal Boulevard with LOS F during both the AM and PM peak hours. Table 2 summarizes the 2035 No-Action signalized intersection results along with existing conditions. The average intersection delay calculated by the HCM methodology is shown in parenthesis for intersections shown to operate at LOS F.
LOS worksheets for the Year 2035 No-Action scenario are included in Appendix C.

2035 No Action Lane Geometryand Levels of Service
Figure 6
Federal Boulevard Logical Termini White Paper 08-171 04/23/09
NORTH
FELSBURGH O L T &U L L E V I G
= AM/PM Peak Hour Signalized Intersection Level of Service
= AM/PM Peak Hour Unsignalized Intersection Level of Service
= Stop Sign
= Traffic Signal
LEGEND
X/X
x/x
Holden Pl.
12th Ave.
11th Ave.
10th Ave.
9th Ave.
Barberry Pl.
8th Ave.
Severn Pl.
7th Ave.
6th Ave. WB On-Ramp
5th Ave.
6th Ave. EB Off-Ramp
6th Ave.
Fed
eral
Bou
leva
rd
B/E
C/D
88
c/d
e/c
c/d
c/c
c/c
b/c
d/d
b/c
c/e
b/b
b/b
b/c
A/C
D/F
F/F

FFEELLSSBBUURRGG HHOOLLTT && UULLLLEEVVIIGG Page 14
Traffic Report Table 2 Existing and 2035 No-Action Signalized Levels of Service
Level of Service (Average Delay per vehicle in seconds for LOS F Intersections)
Existing 2035 No-Action
Intersection
AM PM AM PM
Holden Place A B A C
10th Avenue B B D F (92)
8th Avenue C F (83) F (122) F (164)
US 6 Westbound Ramp B B B E
US 6 Eastbound Ramp B B C D

FFEELLSSBBUURRGG HHOOLLTT && UULLLLEEVVIIGG Page 15
Traffic Report
4.0 Analysis of Proposed Action Scenario
4.1 Definition of Proposed Action Scenario The Proposed Action defines the improved Federal Boulevard cross-section. This scenario represents the expansion of the remaining two-lane northbound portion within the study area into a full three lanes. Through lanes would be widened to a standard 11 foot width. Two northbound and southbound left turn lanes are provided at the interchange with US 6 for an eventual 10 lane overpass at this interchange.
In addition, this scenario removes the existing two way left turn lane and replaces it with a raised curb median with dedicated left turn lanes. In addition, the access to Severn Place and Barberry Place would be reduced to right-in-right-out movements with new raised curb median barriers. Also, the access to 7th Avenue, 11th Avenue, and 12th Avenue were reduced to ¾ movements, with left-turns permitted from Federal Boulevard onto the cross-street but not permitted from the cross-street onto Federal Boulevard.
The signal timing was adjusted for the southbound left turn lanes at Holden Place and northbound and southbound movements at 10th Avenue to include protected/permitted phasing. The signal timing was adjusted for the northbound and southbound left turn lanes at 8th Avenue and northbound and southbound movements at 6th Avenue to include protected only phasing.
The operational analyses of all the intersections were performed assuming a “baseline” set of lane geometry assumptions. The baseline laneage for each alternative represents an initial configuration based on preliminary design assumptions.
4.2 Traffic Volume Forecasts Year 2035 traffic volume forecasts were developed for the Build Out scenario by modifying the No-Action scenario discussed in Section 3.1 of this report. The changes include rerouting traffic that is no longer able to make specific movements due to the raised curb median installation.
As was mentioned earlier, the major reconfiguration of access onto Eastbound US 6 by including a through movement at the existing off ramp means significant changes to the existing roadway geometry. Details of this change can be found in the Valley Highway EIS.
4.3 Level of Service Analysis of Proposed Action Scenario
4.3.1 Proposed Action Scenario Year 2035 peak hour traffic volumes with the Proposed Action are depicted on Figure 7, 2035 Build Out Peak Hour Traffic Volumes.
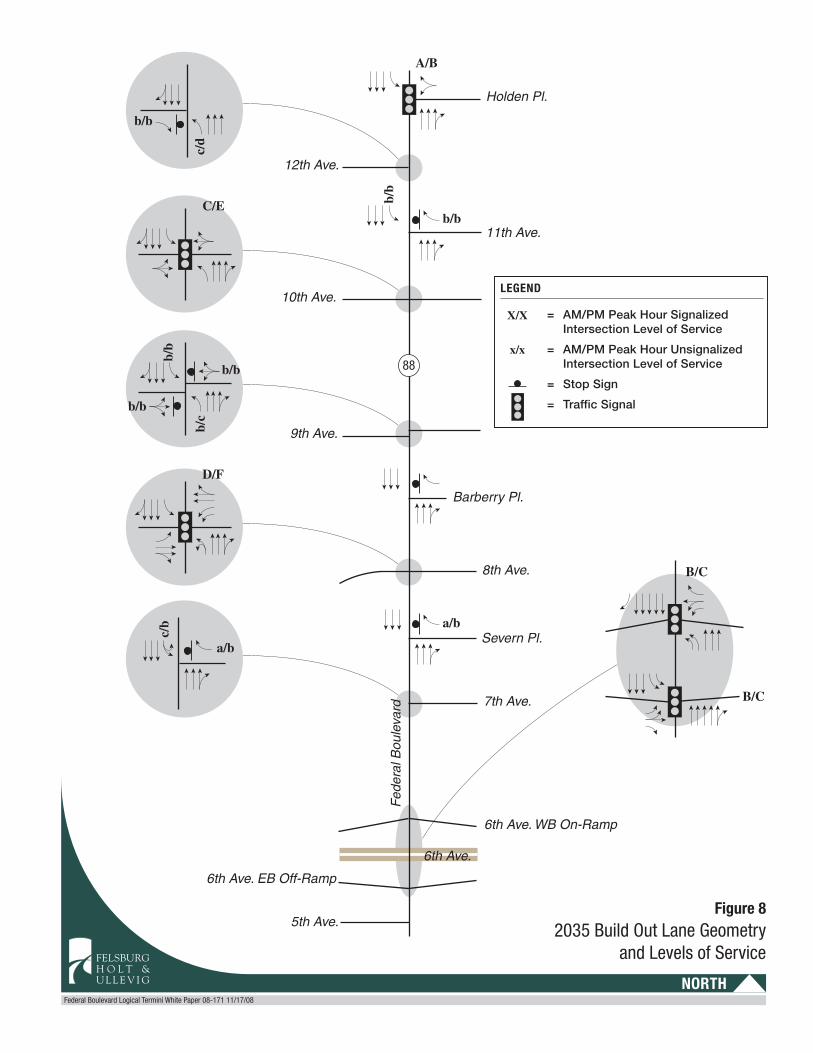
The AM and PM peak hour LOS results at each intersection with the Proposed Action are shown graphically in Figure 8 LOS worksheets for the Build Out scenario and are included in Appendix D. Proposed Action analyses show that the only projected peak hour LOS F conditions would occur at the 8th Avenue/Federal Boulevard intersection in the PM peak hour. Other LOS F conditions projected at the 10th Avenue and the 8th Avenue intersections with the No-Action scenario would be improved by the Proposed Action.

2035 Build Out Peak Hour Traffic VolumesFigure 7
Federal Boulevard CATEX 08-171 04/23/09
NORTH
FELSBURGH O L T &U L L E V I G
Holden Pl.
12th Ave.
11th Ave.
10th Ave.
9th Ave.
Barberry Pl.
8th Ave.
Severn Pl.
7th Ave.
6th Ave. WB On-Ramp
5th Ave.
6th Ave. EB Off-Ramp
6th Ave.
Fed
eral
Bou
leva
rd
30(45)25(95)35(135)
170(150)95(35)65(90)
35(1
30)
1705
(233
5)35
(30
)
80(1
55)
1750
(203
5)75
(65)
15(45)�(�)5(15)
5(5)5(�)
55(30)
10(1
5)18
20(2
575)
30
(20
)
20(3
0)
1830
(219
0)
60(4
0)
105(205)160(575)190(595)
135(70)365(90)
25(55)
40(1
40)
1620
(230
0)
115
(40
)
10(4
0)
30(6
0)
1550
(196
0)
280
(105
)
1945
(248
0)
195
(60
)
1755
(253
0)
200
(20
)
10(4
0)
1985
(252
5)
45(140)15(85)
40(170)
20(40)
1585
(226
0)
70(5
0)
1610
(218
5)24
5(2
5)
1775
(299
5)75
(25)
�(5
)
35(130)
1845
(202
5)40
(25)
20(5
5)16
20(2
320
)
1850
(301
0)
10(30)
1870
(214
5)�
(10
)205(210)95(315)365(535)
1780
(203
0)
1035
(910
)
205
(510
)15
70(2
550
)
330
(330
)17
10(1
885)
290(215)5(5)
195(275)
1930
(287
0)
170
(215
)
= AM(PM) Peak Hour Traffic Volumes
= Less than 5 Vehicles per Hour
LEGEND
XXX(XXX)
�
88
2035 Build Out Lane Geometryand Levels of Service
Figure 8
Federal Boulevard Logical Termini White Paper 08-171 11/17/08
NORTH
FELSBURGH O L T &U L L E V I G
= AM/PM Peak Hour Signalized Intersection Level of Service
= AM/PM Peak Hour Unsignalized Intersection Level of Service
= Stop Sign
= Traffic Signal
LEGEND
X/X
x/x
Holden Pl.
12th Ave.
11th Ave.
10th Ave.
9th Ave.
Barberry Pl.
8th Ave.
Severn Pl.
7th Ave.
6th Ave. WB On-Ramp
5th Ave.
6th Ave. EB Off-Ramp
6th Ave.
Fed
eral
Bou
leva
rd
88
c/d
b/b
b/b
c/b
b/c
b/b
b/b
b/b
a/b
b/b
a/b
A/B
C/E
D/F
B/C
B/C
FFEELLSSBBUURRGG HHOOLLTT && UULLLLEEVVIIGG Page 18
Traffic Report
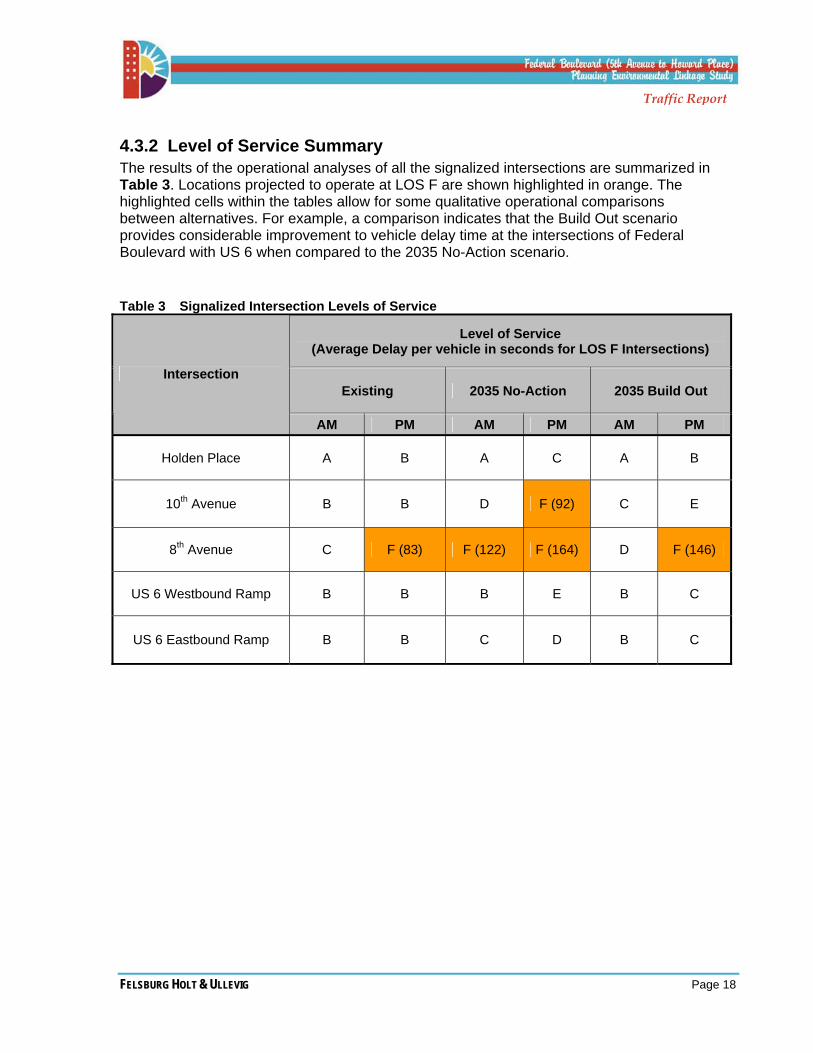
4.3.2 Level of Service Summary The results of the operational analyses of all the signalized intersections are summarized in Table 3. Locations projected to operate at LOS F are shown highlighted in orange. The highlighted cells within the tables allow for some qualitative operational comparisons between alternatives. For example, a comparison indicates that the Build Out scenario provides considerable improvement to vehicle delay time at the intersections of Federal Boulevard with US 6 when compared to the 2035 No-Action scenario.
Table 3 Signalized Intersection Levels of Service
Level of Service (Average Delay per vehicle in seconds for LOS F Intersections)
Existing 2035 No-Action 2035 Build Out Intersection
AM PM AM PM AM PM
Holden Place A B A C A B
10th Avenue B B D F (92) C E
8th Avenue C F (83) F (122) F (164) D F (146)
US 6 Westbound Ramp B B B E B C
US 6 Eastbound Ramp B B C D B C
FFEELLSSBBUURRGG HHOOLLTT && UULLLLEEVVIIGG Page 19
Traffic Report
5.0 Summary The evaluation of the No-Action scenario described in Section 3.0 as well as the Proposed Action scenario described in Section 4.0 included a description of operations based on level of service analyses. Each scenario included the reconfiguration of Eastbound US 6, allowing for the evaluation of the impacts of each scenario compared to the forecasted conditions for Year 2035.
This analysis finds significant benefit to operational performance by widening the roadway to include three lanes in the northbound direction, as already exists for the southbound direction. The addition of the third northbound lane would be most significant during times when a bus must stop for boarding or alighting of passengers. By providing drivers an additional lane, some would avoid the right lane when a bus is ahead, reducing congestion and quick lane changes throughout the corridor.
Traffic operations and safety will be enhanced by widening existing sub-standard lanes to standard 11 foot widths. In addition, the installation of a raised curb median throughout the corridor would help to control access to individual driveways throughout the segment reducing the potential vehicular conflicts throughout the study corridor.


FFEELLSSBBUURRGG HHOOLLTT && UULLLLEEVVIIGG Appendix A
Traffic Report
Appendix A
Level of Service Criteria and Threshold Values
Tabulation of roadway section types and Level of Service Thresholds
Type of Roadway Configuration and LOS Criteria Measure
Signalized Intersections
Unsignalized Intersections
Level of Service
Delay (Seconds/Vehicle)
Delay (Seconds/Vehicle)
A ≤ 10 ≤ 10
B > 10 and ≤ 20 > 10 and ≤ 15
C > 20 and ≤ 35 > 15 and ≤ 25
D > 35 and ≤ 55 > 25 and ≤ 35
E > 55 and ≤ 80 > 35 and ≤ 50
F >80 >50


FFEELLSSBBUURRGG HHOOLLTT && UULLLLEEVVIIGG Appendix B
Traffic Report
Appendix B
Existing Conditions Level of Service Worksheets


File Name : #4 HOLDEN&FEDERALAMSite Code : 00000000Start Date : 8/5/2008Page No : 1
Groups Printed- UnshiftedFEDERAL AVE
SouthboundHOLDEN
WestboundFEDERAL AVE
NorthboundHOLDEN
EastboundStart Time Left Thru Right Peds Left Thru Right Peds Left Thru Right Peds Left Thru Right Peds Int. Total
07:00 AM 25 208 0 0 1 0 4 0 0 167 3 0 0 0 0 0 40807:15 AM 35 233 0 0 2 0 11 0 0 209 12 0 0 0 0 0 50207:30 AM 31 261 0 0 1 0 7 0 0 228 12 0 0 0 0 0 54007:45 AM 50 277 0 0 2 0 6 0 0 198 13 0 0 0 0 0 546
Total 141 979 0 0 6 0 28 0 0 802 40 0 0 0 0 0 1996
08:00 AM 32 247 0 0 3 0 9 0 0 201 13 0 0 0 0 0 50508:15 AM 24 240 0 0 6 0 8 0 0 176 20 0 0 0 0 0 47408:30 AM 20 198 0 0 5 0 9 0 0 225 20 0 0 0 0 0 47708:45 AM 23 231 0 0 8 0 22 0 0 211 15 0 0 0 0 0 510
Total 99 916 0 0 22 0 48 0 0 813 68 0 0 0 0 0 1966
Grand Total 240 1895 0 0 28 0 76 0 0 1615 108 0 0 0 0 0 3962Apprch % 11.2 88.8 0 0 26.9 0 73.1 0 0 93.7 6.3 0 0 0 0 0
Total % 6.1 47.8 0 0 0.7 0 1.9 0 0 40.8 2.7 0 0 0 0 0
FEDERAL AVE
HO
LDE
N H
OLD
EN
FEDERAL AVE
Right0
Thru1895
Left240
Peds0
InOut Total1691 2135 3826
Right 76
Thru 0 Left 28
Peds 0
Out
TotalIn
348 104
452
Left0
Thru1615
Right108
Peds0
Out TotalIn1923 1723 3646
Left0
Thru
0 R
ight0
Peds
0
Tota
lO
utIn
0 0
0
8/5/2008 07:00 AM8/5/2008 08:45 AM Unshifted
North

File Name : #4 HOLDEN&FEDERALAMSite Code : 00000000Start Date : 8/5/2008Page No : 2
FEDERAL AVESouthbound
HOLDENWestbound
FEDERAL AVENorthbound
HOLDENEastbound
Start Time Left Thru Right Peds App. Total Left Thru Right Peds App. Total Left Thru Right Peds App. Total Left Thru Right Peds App. Total Int. Total
Peak Hour Analysis From 07:00 AM to 08:45 AM - Peak 1 of 1Peak Hour for Entire Intersection Begins at 07:15 AM
07:15 AM 35 233 0 0 268 2 0 11 0 13 0 209 12 0 221 0 0 0 0 0 50207:30 AM 31 261 0 0 292 1 0 7 0 8 0 228 12 0 240 0 0 0 0 0 54007:45 AM 50 277 0 0 327 2 0 6 0 8 0 198 13 0 211 0 0 0 0 0 54608:00 AM 32 247 0 0 279 3 0 9 0 12 0 201 13 0 214 0 0 0 0 0 505Total Volume 148 1018 0 0 1166 8 0 33 0 41 0 836 50 0 886 0 0 0 0 0 2093% App. Total 12.7 87.3 0 0 19.5 0 80.5 0 0 94.4 5.6 0 0 0 0 0
PHF .740 .919 .000 .000 .891 .667 .000 .750 .000 .788 .000 .917 .962 .000 .923 .000 .000 .000 .000 .000 .958
FEDERAL AVE
HO
LDE
N H
OLD
EN
FEDERAL AVE
Right0
Thru1018
Left148
Peds0
InOut Total869 1166 2035
Right 33
Thru 0 Left 8
Peds 0
Out
TotalIn
198 41
239
Left0
Thru836
Right50
Peds0
Out TotalIn1026 886 1912
Left0
Thru
0 R
ight0
Ped
s0
Tota
lO
utIn
0 0
0
Peak Hour Begins at 07:15 AM Unshifted
Peak Hour Data
North

File Name : #4 HOLDEN&FEDERALPMSite Code : 00000000Start Date : 8/5/2008Page No : 1
Groups Printed- UnshiftedFEDERAL AVE
SouthboundHOLDEN
WestboundFEDERAL AVE
NorthboundHOLDEN
EastboundStart Time Left Thru Right Peds Left Thru Right Peds Left Thru Right Peds Left Thru Right Peds Int. Total
04:00 PM 15 267 0 0 6 0 42 0 0 372 14 0 0 0 0 0 71604:15 PM 11 345 0 0 22 0 44 0 0 342 10 0 0 0 0 0 77404:30 PM 13 302 0 0 19 0 36 0 0 378 8 0 0 0 0 0 75604:45 PM 13 322 0 0 13 0 35 0 0 348 7 0 0 0 0 0 738
Total 52 1236 0 0 60 0 157 0 0 1440 39 0 0 0 0 0 2984
05:00 PM 11 347 0 0 15 0 19 0 0 433 9 0 0 0 0 0 83405:15 PM 10 372 0 0 9 0 16 0 0 401 14 0 0 0 0 0 82205:30 PM 13 312 0 0 8 0 19 0 0 379 5 0 0 0 0 0 73605:45 PM 11 294 0 0 13 0 19 0 0 311 11 0 0 0 0 0 659
Total 45 1325 0 0 45 0 73 0 0 1524 39 0 0 0 0 0 3051
Grand Total 97 2561 0 0 105 0 230 0 0 2964 78 0 0 0 0 0 6035Apprch % 3.6 96.4 0 0 31.3 0 68.7 0 0 97.4 2.6 0 0 0 0 0
Total % 1.6 42.4 0 0 1.7 0 3.8 0 0 49.1 1.3 0 0 0 0 0
FEDERAL AVE
HO
LDE
N H
OLD
EN
FEDERAL AVE
Right0
Thru2561
Left97
Peds0
InOut Total3194 2658 5852
Right230
Thru 0 Left105
Peds 0
Out
TotalIn
175 335
510
Left0
Thru2964
Right78
Peds0
Out TotalIn2666 3042 5708
Left0
Thru
0 R
ight0
Peds
0
Tota
lO
utIn
0 0
0
8/5/2008 04:00 PM8/5/2008 05:45 PM Unshifted
North

File Name : #4 HOLDEN&FEDERALPMSite Code : 00000000Start Date : 8/5/2008Page No : 2
FEDERAL AVESouthbound
HOLDENWestbound
FEDERAL AVENorthbound
HOLDENEastbound
Start Time Left Thru Right Peds App. Total Left Thru Right Peds App. Total Left Thru Right Peds App. Total Left Thru Right Peds App. Total Int. Total
Peak Hour Analysis From 04:00 PM to 05:45 PM - Peak 1 of 1Peak Hour for Entire Intersection Begins at 04:30 PM
04:30 PM 13 302 0 0 315 19 0 36 0 55 0 378 8 0 386 0 0 0 0 0 75604:45 PM 13 322 0 0 335 13 0 35 0 48 0 348 7 0 355 0 0 0 0 0 73805:00 PM 11 347 0 0 358 15 0 19 0 34 0 433 9 0 442 0 0 0 0 0 83405:15 PM 10 372 0 0 382 9 0 16 0 25 0 401 14 0 415 0 0 0 0 0 822Total Volume 47 1343 0 0 1390 56 0 106 0 162 0 1560 38 0 1598 0 0 0 0 0 3150% App. Total 3.4 96.6 0 0 34.6 0 65.4 0 0 97.6 2.4 0 0 0 0 0
PHF .904 .903 .000 .000 .910 .737 .000 .736 .000 .736 .000 .901 .679 .000 .904 .000 .000 .000 .000 .000 .944
FEDERAL AVE
HO
LDE
N H
OLD
EN
FEDERAL AVE
Right0
Thru1343
Left47
Peds0
InOut Total1666 1390 3056
Right106
Thru 0 Left 56
Peds 0
Out
TotalIn
85 162
247
Left0
Thru1560
Right38
Peds0
Out TotalIn1399 1598 2997
Left0
Thru
0 R
ight0
Ped
s0
Tota
lO
utIn
0 0
0
Peak Hour Begins at 04:30 PM Unshifted
Peak Hour Data
North

File Name : #3 12TH&FEDERALAMSite Code : 00000000Start Date : 8/5/2008Page No : 1
Groups Printed- UnshiftedFEDERAL AVE
Southbound12TH AVE
WestboundFEDERAL AVE
Northbound12TH AVEEastbound
Start Time Left Thru Right Peds Left Thru Right Peds Left Thru Right Peds Left Thru Right Peds Int. Total07:00 AM 0 205 2 0 0 0 0 0 1 176 0 0 2 0 3 0 38907:15 AM 0 231 4 0 0 0 0 0 2 212 0 0 4 0 6 0 45907:30 AM 0 262 0 0 0 0 0 0 1 224 0 0 3 0 1 0 49107:45 AM 0 310 2 0 0 0 0 0 5 208 0 0 3 0 6 0 534
Total 0 1008 8 0 0 0 0 0 9 820 0 0 12 0 16 0 1873
08:00 AM 0 237 0 0 0 0 0 0 6 203 0 0 2 0 3 0 45108:15 AM 0 236 1 0 0 0 0 0 5 193 0 0 2 0 0 0 43708:30 AM 0 235 4 0 0 0 0 0 6 238 0 0 0 0 4 0 48708:45 AM 0 222 4 0 0 0 0 0 7 239 0 0 3 0 1 0 476
Total 0 930 9 0 0 0 0 0 24 873 0 0 7 0 8 0 1851
Grand Total 0 1938 17 0 0 0 0 0 33 1693 0 0 19 0 24 0 3724Apprch % 0 99.1 0.9 0 0 0 0 0 1.9 98.1 0 0 44.2 0 55.8 0
Total % 0 52 0.5 0 0 0 0 0 0.9 45.5 0 0 0.5 0 0.6 0
FEDERAL AVE
12T
H A
VE
12TH A
VE
FEDERAL AVE
Right17
Thru1938
Left0
Peds0
InOut Total1712 1955 3667
Right 0
Thru 0 Left 0
Peds 0
Out
TotalIn
0 0
0
Left33
Thru1693
Right0
Peds0
Out TotalIn1962 1726 3688
Left19
Th
ru0
Rig
ht24
Peds
0
Tota
lO
utIn
50
43
93
8/5/2008 07:00 AM8/5/2008 08:45 AM Unshifted
North

File Name : #3 12TH&FEDERALAMSite Code : 00000000Start Date : 8/5/2008Page No : 2
FEDERAL AVESouthbound
12TH AVEWestbound
FEDERAL AVENorthbound
12TH AVEEastbound
Start Time Left Thru Right Peds App. Total Left Thru Right Peds App. Total Left Thru Right Peds App. Total Left Thru Right Peds App. Total Int. Total
Peak Hour Analysis From 07:00 AM to 08:45 AM - Peak 1 of 1Peak Hour for Entire Intersection Begins at 07:15 AM
07:15 AM 0 231 4 0 235 0 0 0 0 0 2 212 0 0 214 4 0 6 0 10 45907:30 AM 0 262 0 0 262 0 0 0 0 0 1 224 0 0 225 3 0 1 0 4 49107:45 AM 0 310 2 0 312 0 0 0 0 0 5 208 0 0 213 3 0 6 0 9 53408:00 AM 0 237 0 0 237 0 0 0 0 0 6 203 0 0 209 2 0 3 0 5 451Total Volume 0 1040 6 0 1046 0 0 0 0 0 14 847 0 0 861 12 0 16 0 28 1935% App. Total 0 99.4 0.6 0 0 0 0 0 1.6 98.4 0 0 42.9 0 57.1 0
PHF .000 .839 .375 .000 .838 .000 .000 .000 .000 .000 .583 .945 .000 .000 .957 .750 .000 .667 .000 .700 .906
FEDERAL AVE
12T
H A
VE 12TH
AV
E
FEDERAL AVE
Right6
Thru1040
Left0
Peds0
InOut Total859 1046 1905
Right 0
Thru 0 Left 0
Peds 0
Out
TotalIn
0 0
0
Left14
Thru847
Right0
Peds0
Out TotalIn1056 861 1917
Left12
Th
ru0
Rig
ht16
Ped
s0
Tota
lO
utIn
20
28
48
Peak Hour Begins at 07:15 AM Unshifted
Peak Hour Data
North

File Name : #3 12TH&FEDERALPMSite Code : 00000000Start Date : 8/5/2008Page No : 1
Groups Printed- UnshiftedFEDERAL AVE
Southbound12TH AVE
WestboundFEDERAL AVE
Northbound12TH AVEEastbound
Start Time Left Thru Right Peds Left Thru Right Peds Left Thru Right Peds Left Thru Right Peds Int. Total04:00 PM 0 289 4 0 0 0 0 0 7 380 0 0 3 0 5 0 68804:15 PM 0 309 8 0 0 0 0 0 8 348 0 0 3 0 7 0 68304:30 PM 0 303 10 0 0 0 0 0 9 386 0 0 4 0 10 0 72204:45 PM 0 331 6 0 0 0 0 0 8 355 0 0 2 0 9 0 711
Total 0 1232 28 0 0 0 0 0 32 1469 0 0 12 0 31 0 2804
05:00 PM 0 352 11 0 0 0 0 0 12 441 0 0 7 0 5 0 82805:15 PM 0 360 7 0 0 0 0 0 12 409 0 0 5 0 13 0 80605:30 PM 0 329 5 0 0 0 0 0 9 387 0 0 2 0 5 0 73705:45 PM 0 303 8 0 0 0 0 0 7 317 0 0 4 0 5 0 644
Total 0 1344 31 0 0 0 0 0 40 1554 0 0 18 0 28 0 3015
Grand Total 0 2576 59 0 0 0 0 0 72 3023 0 0 30 0 59 0 5819Apprch % 0 97.8 2.2 0 0 0 0 0 2.3 97.7 0 0 33.7 0 66.3 0
Total % 0 44.3 1 0 0 0 0 0 1.2 52 0 0 0.5 0 1 0

File Name : #3 12TH&FEDERALPMSite Code : 00000000Start Date : 8/5/2008Page No : 2
FEDERAL AVESouthbound
12TH AVEWestbound
FEDERAL AVENorthbound
12TH AVEEastbound
Start Time Left Thru Right Peds App. Total Left Thru Right Peds App. Total Left Thru Right Peds App. Total Left Thru Right Peds App. Total Int. Total
Peak Hour Analysis From 04:00 PM to 05:45 PM - Peak 1 of 1Peak Hour for Entire Intersection Begins at 04:45 PM
04:45 PM 0 331 6 0 337 0 0 0 0 0 8 355 0 0 363 2 0 9 0 11 71105:00 PM 0 352 11 0 363 0 0 0 0 0 12 441 0 0 453 7 0 5 0 12 82805:15 PM 0 360 7 0 367 0 0 0 0 0 12 409 0 0 421 5 0 13 0 18 80605:30 PM 0 329 5 0 334 0 0 0 0 0 9 387 0 0 396 2 0 5 0 7 737Total Volume 0 1372 29 0 1401 0 0 0 0 0 41 1592 0 0 1633 16 0 32 0 48 3082% App. Total 0 97.9 2.1 0 0 0 0 0 2.5 97.5 0 0 33.3 0 66.7 0
PHF .000 .953 .659 .000 .954 .000 .000 .000 .000 .000 .854 .902 .000 .000 .901 .571 .000 .615 .000 .667 .931
FEDERAL AVE
12T
H A
VE 12TH
AVE
FEDERAL AVE
Right29
Thru1372
Left0
Peds0
InOut Total1608 1401 3009
Right 0
Thru 0 Left 0
Peds 0
Out
TotalIn
0 0
0
Left41
Thru1592
Right0
Peds0
Out TotalIn1404 1633 3037
Left16
Th
ru0
Rig
ht32
Ped
s0
Tota
lO
utIn
70
48
118
Peak Hour Begins at 04:45 PM Unshifted
Peak Hour Data
North

File Name : #2 11TH&FEDERALAMSite Code : 00000000Start Date : 8/5/2008Page No : 1
Groups Printed- UnshiftedFEDERAL AVE
Southbound11TH AVE
WestboundFEDERAL AVE
Northbound11TH AVEEastbound
Start Time Left Thru Right Peds Left Thru Right Peds Left Thru Right Peds Left Thru Right Peds Int. Total07:00 AM 28 191 0 0 2 0 3 0 0 163 37 0 0 0 0 0 42407:15 AM 27 201 0 0 0 0 2 1 0 212 32 0 0 0 0 0 47507:30 AM 32 225 0 0 0 0 5 0 0 232 27 0 0 0 0 0 52107:45 AM 44 221 0 0 1 0 0 0 0 208 59 0 0 0 0 0 533
Total 131 838 0 0 3 0 10 1 0 815 155 0 0 0 0 0 1953
08:00 AM 33 224 0 0 0 0 7 0 0 205 43 0 0 0 0 0 51208:15 AM 41 213 0 0 2 0 6 0 0 186 53 0 0 0 0 0 50108:30 AM 33 208 0 0 1 0 16 0 0 246 33 0 0 0 0 0 53708:45 AM 30 201 0 0 1 0 11 0 0 220 39 0 0 0 0 0 502
Total 137 846 0 0 4 0 40 0 0 857 168 0 0 0 0 0 2052
Grand Total 268 1684 0 0 7 0 50 1 0 1672 323 0 0 0 0 0 4005Apprch % 13.7 86.3 0 0 12.1 0 86.2 1.7 0 83.8 16.2 0 0 0 0 0
Total % 6.7 42 0 0 0.2 0 1.2 0 0 41.7 8.1 0 0 0 0 0
FEDERAL AVE
11T
H A
VE
11TH A
VE
FEDERAL AVE
Right0
Thru1684
Left268
Peds0
InOut Total1722 1952 3674
Right 50
Thru 0 Left 7
Peds 1
Out
TotalIn
591 58
649
Left0
Thru1672
Right323
Peds0
Out TotalIn1691 1995 3686
Left0
Thru
0 R
ight0
Peds
0
Tota
lO
utIn
0 0
0
8/5/2008 07:00 AM8/5/2008 08:45 AM Unshifted
North

File Name : #2 11TH&FEDERALAMSite Code : 00000000Start Date : 8/5/2008Page No : 2
FEDERAL AVESouthbound
11TH AVEWestbound
FEDERAL AVENorthbound
11TH AVEEastbound
Start Time Left Thru Right Peds App. Total Left Thru Right Peds App. Total Left Thru Right Peds App. Total Left Thru Right Peds App. Total Int. Total
Peak Hour Analysis From 07:00 AM to 08:45 AM - Peak 1 of 1Peak Hour for Entire Intersection Begins at 07:45 AM
07:45 AM 44 221 0 0 265 1 0 0 0 1 0 208 59 0 267 0 0 0 0 0 53308:00 AM 33 224 0 0 257 0 0 7 0 7 0 205 43 0 248 0 0 0 0 0 51208:15 AM 41 213 0 0 254 2 0 6 0 8 0 186 53 0 239 0 0 0 0 0 50108:30 AM 33 208 0 0 241 1 0 16 0 17 0 246 33 0 279 0 0 0 0 0 537Total Volume 151 866 0 0 1017 4 0 29 0 33 0 845 188 0 1033 0 0 0 0 0 2083% App. Total 14.8 85.2 0 0 12.1 0 87.9 0 0 81.8 18.2 0 0 0 0 0
PHF .858 .967 .000 .000 .959 .500 .000 .453 .000 .485 .000 .859 .797 .000 .926 .000 .000 .000 .000 .000 .970
FEDERAL AVE
11T
H A
VE 11TH
AV
E
FEDERAL AVE
Right0
Thru866
Left151
Peds0
InOut Total874 1017 1891
Right 29
Thru 0 Left 4
Peds 0
Out
TotalIn
339 33
372
Left0
Thru845
Right188
Peds0
Out TotalIn870 1033 1903
Left0
Thru
0 R
ight0
Ped
s0
Tota
lO
utIn
0 0
0
Peak Hour Begins at 07:45 AM Unshifted
Peak Hour Data
North

File Name : #2 11TH&FEDERALPMSite Code : 00000000Start Date : 8/5/2008Page No : 1
Groups Printed- UnshiftedFEDERAL AVE
Southbound11TH AVE
WestboundFEDERAL AVE
Northbound11TH AVEEastbound
Start Time Left Thru Right Peds Left Thru Right Peds Left Thru Right Peds Left Thru Right Peds Int. Total04:00 PM 8 276 0 0 3 0 49 0 0 311 16 0 0 0 0 0 66304:15 PM 5 314 0 0 4 0 28 0 0 327 24 0 0 0 0 0 70204:30 PM 8 307 0 0 2 0 54 1 0 316 14 0 0 0 0 0 70204:45 PM 6 319 0 0 2 0 35 0 0 332 5 0 0 0 0 0 699
Total 27 1216 0 0 11 0 166 1 0 1286 59 0 0 0 0 0 2766
05:00 PM 3 359 0 0 3 0 47 0 0 387 8 0 0 0 0 0 80705:15 PM 6 363 0 0 1 0 21 0 0 406 3 0 0 0 0 0 80005:30 PM 1 333 0 0 0 0 27 0 0 357 2 0 0 0 0 0 72005:45 PM 2 296 0 0 0 0 19 0 0 319 0 0 0 0 0 0 636
Total 12 1351 0 0 4 0 114 0 0 1469 13 0 0 0 0 0 2963
Grand Total 39 2567 0 0 15 0 280 1 0 2755 72 0 0 0 0 0 5729Apprch % 1.5 98.5 0 0 5.1 0 94.6 0.3 0 97.5 2.5 0 0 0 0 0
Total % 0.7 44.8 0 0 0.3 0 4.9 0 0 48.1 1.3 0 0 0 0 0

File Name : #2 11TH&FEDERALPMSite Code : 00000000Start Date : 8/5/2008Page No : 2
FEDERAL AVESouthbound
11TH AVEWestbound
FEDERAL AVENorthbound
11TH AVEEastbound
Start Time Left Thru Right Peds App. Total Left Thru Right Peds App. Total Left Thru Right Peds App. Total Left Thru Right Peds App. Total Int. Total
Peak Hour Analysis From 04:00 PM to 05:45 PM - Peak 1 of 1Peak Hour for Entire Intersection Begins at 04:45 PM
04:45 PM 6 319 0 0 325 2 0 35 0 37 0 332 5 0 337 0 0 0 0 0 69905:00 PM 3 359 0 0 362 3 0 47 0 50 0 387 8 0 395 0 0 0 0 0 80705:15 PM 6 363 0 0 369 1 0 21 0 22 0 406 3 0 409 0 0 0 0 0 80005:30 PM 1 333 0 0 334 0 0 27 0 27 0 357 2 0 359 0 0 0 0 0 720Total Volume 16 1374 0 0 1390 6 0 130 0 136 0 1482 18 0 1500 0 0 0 0 0 3026% App. Total 1.2 98.8 0 0 4.4 0 95.6 0 0 98.8 1.2 0 0 0 0 0
PHF .667 .946 .000 .000 .942 .500 .000 .691 .000 .680 .000 .913 .563 .000 .917 .000 .000 .000 .000 .000 .937
FEDERAL AVE
11T
H A
VE 11TH
AV
E
FEDERAL AVE
Right0
Thru1374
Left16
Peds0
InOut Total1612 1390 3002
Right130
Thru 0 Left 6
Peds 0
Out
TotalIn
34 136
170
Left0
Thru1482
Right18
Peds0
Out TotalIn1380 1500 2880
Left0
Thru
0 R
ight0
Ped
s0
Tota
lO
utIn
0 0
0
Peak Hour Begins at 04:45 PM Unshifted
Peak Hour Data
North

File Name : #1 10TH&FEDERALAMSite Code : 00000000Start Date : 8/5/2008Page No : 1
Groups Printed- UnshiftedFEDERAL AVE
Southbound10TH AVE
WestboundFEDERAL AVE
Northbound10TH AVEEastbound
Start Time Left Thru Right Peds Left Thru Right Peds Left Thru Right Peds Left Thru Right Peds Int. Total07:00 AM 2 186 7 0 5 8 2 0 7 183 8 0 21 9 12 1 45107:15 AM 4 199 3 0 5 6 4 0 5 224 6 0 21 9 10 0 49607:30 AM 4 208 4 0 10 4 2 0 3 252 6 0 22 13 4 0 53207:45 AM 12 208 6 0 7 2 4 0 5 235 4 0 31 17 11 0 542
Total 22 801 20 0 27 20 12 0 20 894 24 0 95 48 37 1 2021
08:00 AM 8 203 5 0 11 10 7 2 3 219 7 0 18 9 5 0 50708:15 AM 5 186 3 0 8 7 0 0 2 219 8 0 21 5 11 0 47508:30 AM 3 195 8 0 15 4 2 0 6 243 6 0 23 9 8 0 52208:45 AM 5 208 6 0 10 4 7 0 7 206 4 0 26 11 11 0 505
Total 21 792 22 0 44 25 16 2 18 887 25 0 88 34 35 0 2009
Grand Total 43 1593 42 0 71 45 28 2 38 1781 49 0 183 82 72 1 4030Apprch % 2.6 94.9 2.5 0 48.6 30.8 19.2 1.4 2 95.3 2.6 0 54.1 24.3 21.3 0.3
Total % 1.1 39.5 1 0 1.8 1.1 0.7 0 0.9 44.2 1.2 0 4.5 2 1.8 0

File Name : #1 10TH&FEDERALAMSite Code : 00000000Start Date : 8/5/2008Page No : 2
FEDERAL AVESouthbound
10TH AVEWestbound
FEDERAL AVENorthbound
10TH AVEEastbound
Start Time Left Thru Right Peds App. Total Left Thru Right Peds App. Total Left Thru Right Peds App. Total Left Thru Right Peds App. Total Int. Total
Peak Hour Analysis From 07:00 AM to 08:45 AM - Peak 1 of 1Peak Hour for Entire Intersection Begins at 07:15 AM
07:15 AM 4 199 3 0 206 5 6 4 0 15 5 224 6 0 235 21 9 10 0 40 49607:30 AM 4 208 4 0 216 10 4 2 0 16 3 252 6 0 261 22 13 4 0 39 53207:45 AM 12 208 6 0 226 7 2 4 0 13 5 235 4 0 244 31 17 11 0 59 54208:00 AM 8 203 5 0 216 11 10 7 2 30 3 219 7 0 229 18 9 5 0 32 507Total Volume 28 818 18 0 864 33 22 17 2 74 16 930 23 0 969 92 48 30 0 170 2077% App. Total 3.2 94.7 2.1 0 44.6 29.7 23 2.7 1.7 96 2.4 0 54.1 28.2 17.6 0
PHF .583 .983 .750 .000 .956 .750 .550 .607 .250 .617 .800 .923 .821 .000 .928 .742 .706 .682 .000 .720 .958
FEDERAL AVE
10T
H A
VE 10TH
AV
E
FEDERAL AVE
Right18
Thru818
Left28
Peds0
InOut Total1039 864 1903
Right 17
Thru 22 Left 33
Peds 2
Out
TotalIn
99 74
173
Left16
Thru930
Right23
Peds0
Out TotalIn881 969 1850
Left92
Th
ru48
Rig
ht30
Ped
s0
Tota
lO
utIn
56
170
226
Peak Hour Begins at 07:15 AM Unshifted
Peak Hour Data
North

File Name : #1 10TH&FEDERALPMSite Code : 00000000Start Date : 8/5/2008Page No : 1
Groups Printed- UnshiftedFEDERAL AVE
Southbound10TH AVE
WestboundFEDERAL AVE
Northbound10TH AVEEastbound
Start Time Left Thru Right Peds Left Thru Right Peds Left Thru Right Peds Left Thru Right Peds Int. Total04:00 PM 7 271 22 0 36 21 2 0 17 321 4 0 16 8 7 0 73204:15 PM 10 282 24 0 25 13 9 0 15 338 6 0 18 5 9 0 75404:30 PM 7 293 20 0 37 14 11 0 17 305 4 0 18 9 12 0 74704:45 PM 7 295 18 0 30 14 2 0 11 297 5 0 16 8 14 0 717
Total 31 1141 84 0 128 62 24 0 60 1261 19 0 68 30 42 0 2950
05:00 PM 8 311 17 0 40 18 2 0 25 349 3 0 23 10 14 1 82105:15 PM 7 316 23 0 26 25 10 0 20 387 5 0 28 7 11 0 86505:30 PM 4 299 23 0 22 10 8 0 27 305 4 0 16 8 12 0 73805:45 PM 4 280 11 0 24 13 3 0 20 278 4 0 26 6 16 0 685
Total 23 1206 74 0 112 66 23 0 92 1319 16 0 93 31 53 1 3109
Grand Total 54 2347 158 0 240 128 47 0 152 2580 35 0 161 61 95 1 6059Apprch % 2.1 91.7 6.2 0 57.8 30.8 11.3 0 5.5 93.2 1.3 0 50.6 19.2 29.9 0.3
Total % 0.9 38.7 2.6 0 4 2.1 0.8 0 2.5 42.6 0.6 0 2.7 1 1.6 0
FEDERAL AVE
10T
H A
VE
10TH A
VE
FEDERAL AVE
Right158
Thru2347
Left54
Peds0
InOut Total2788 2559 5347
Right 47
Thru128
Left240
Peds 0
Out
TotalIn
150 415
565
Left152
Thru2580
Right35
Peds0
Out TotalIn2682 2767 5449
Left161
Thru61
R
ight95
Pe
ds1
Tota
lO
utIn
438
318
756
8/5/2008 04:00 PM8/5/2008 05:45 PM Unshifted
North

File Name : #1 10TH&FEDERALPMSite Code : 00000000Start Date : 8/5/2008Page No : 2
FEDERAL AVESouthbound
10TH AVEWestbound
FEDERAL AVENorthbound
10TH AVEEastbound
Start Time Left Thru Right Peds App. Total Left Thru Right Peds App. Total Left Thru Right Peds App. Total Left Thru Right Peds App. Total Int. Total
Peak Hour Analysis From 04:00 PM to 05:45 PM - Peak 1 of 1Peak Hour for Entire Intersection Begins at 04:30 PM
04:30 PM 7 293 20 0 320 37 14 11 0 62 17 305 4 0 326 18 9 12 0 39 74704:45 PM 7 295 18 0 320 30 14 2 0 46 11 297 5 0 313 16 8 14 0 38 71705:00 PM 8 311 17 0 336 40 18 2 0 60 25 349 3 0 377 23 10 14 1 48 82105:15 PM 7 316 23 0 346 26 25 10 0 61 20 387 5 0 412 28 7 11 0 46 865Total Volume 29 1215 78 0 1322 133 71 25 0 229 73 1338 17 0 1428 85 34 51 1 171 3150% App. Total 2.2 91.9 5.9 0 58.1 31 10.9 0 5.1 93.7 1.2 0 49.7 19.9 29.8 0.6
PHF .906 .961 .848 .000 .955 .831 .710 .568 .000 .923 .730 .864 .850 .000 .867 .759 .850 .911 .250 .891 .910
FEDERAL AVE
10T
H A
VE 10TH
AV
E
FEDERAL AVE
Right78
Thru1215
Left29
Peds0
InOut Total1448 1322 2770
Right 25
Thru 71 Left133
Peds 0
Out
TotalIn
80 229
309
Left73
Thru1338
Right17
Peds0
Out TotalIn1399 1428 2827
Left85
Th
ru34
Rig
ht51
Ped
s1
Tota
lO
utIn
222
171
393
Peak Hour Begins at 04:30 PM Unshifted
Peak Hour Data
North

File Name : AM_6909 9TH&FEDERALSite Code : 00000000Start Date : 9/4/2008Page No : 1
Groups Printed- UnshiftedFEDERAL AVE
Southbound9TH AVE
WestboundFEDERAL AVE
Northbound9TH AVE
EastboundStart Time Left Thru Right Peds Left Thru Right Peds Left Thru Right Peds Left Thru Right Peds Int. Total
07:00 AM 2 0 1 0 0 0 3 0 2 0 3 0 0 0 6 0 1707:15 AM 2 0 1 0 1 0 3 0 4 0 8 0 1 1 7 0 2807:30 AM 4 0 2 0 0 0 2 0 3 0 7 0 0 2 13 0 3307:45 AM 11 0 2 0 0 0 3 0 3 0 14 0 0 0 6 0 39
Total 19 0 6 0 1 0 11 0 12 0 32 0 1 3 32 0 117
08:00 AM 4 0 3 0 2 0 4 0 5 0 15 0 1 1 16 0 5108:15 AM 5 0 1 0 0 0 2 0 3 0 3 0 1 0 6 0 2108:30 AM 4 0 3 0 1 0 4 0 8 0 2 0 1 0 8 0 3108:45 AM 4 0 1 0 1 0 2 0 2 0 8 0 1 0 3 0 22
Total 17 0 8 0 4 0 12 0 18 0 28 0 4 1 33 0 125
Grand Total 36 0 14 0 5 0 23 0 30 0 60 0 5 4 65 0 242Apprch % 72 0 28 0 17.9 0 82.1 0 33.3 0 66.7 0 6.8 5.4 87.8 0
Total % 14.9 0 5.8 0 2.1 0 9.5 0 12.4 0 24.8 0 2.1 1.7 26.9 0
FEDERAL AVE
9TH
AV
E 9TH
AV
E
FEDERAL AVE
Right14
Thru0
Left36
Peds0
InOut Total28 50 78
Right 23
Thru 0 Left 5
Peds 0
Out
TotalIn
100 28
128
Left30
Thru0
Right60
Peds0
Out TotalIn70 90 160
Left5
Thru
4 R
ight65
Pe
ds0
Tota
lO
utIn
44
74
118
9/4/2008 07:00 AM9/4/2008 08:45 AM Unshifted
North

File Name : AM_6909 9TH&FEDERALSite Code : 00000000Start Date : 9/4/2008Page No : 2
FEDERAL AVESouthbound
9TH AVEWestbound
FEDERAL AVENorthbound
9TH AVEEastbound
Start Time Left Thru Right Peds App. Total Left Thru Right Peds App. Total Left Thru Right Peds App. Total Left Thru Right Peds App. Total Int. Total
Peak Hour Analysis From 07:00 AM to 08:45 AM - Peak 1 of 1Peak Hour for Entire Intersection Begins at 07:15 AM
07:15 AM 2 0 1 0 3 1 0 3 0 4 4 0 8 0 12 1 1 7 0 9 2807:30 AM 4 0 2 0 6 0 0 2 0 2 3 0 7 0 10 0 2 13 0 15 3307:45 AM 11 0 2 0 13 0 0 3 0 3 3 0 14 0 17 0 0 6 0 6 3908:00 AM 4 0 3 0 7 2 0 4 0 6 5 0 15 0 20 1 1 16 0 18 51Total Volume 21 0 8 0 29 3 0 12 0 15 15 0 44 0 59 2 4 42 0 48 151% App. Total 72.4 0 27.6 0 20 0 80 0 25.4 0 74.6 0 4.2 8.3 87.5 0
PHF .477 .000 .667 .000 .558 .375 .000 .750 .000 .625 .750 .000 .733 .000 .738 .500 .500 .656 .000 .667 .740
FEDERAL AVE
9TH
AV
E 9TH
AV
E
FEDERAL AVE
Right8
Thru0
Left21
Peds0
InOut Total14 29 43
Right 12
Thru 0 Left 3
Peds 0
Out
TotalIn
69 15
84
Left15
Thru0
Right44
Peds0
Out TotalIn45 59 104
Left2
Thru
4 R
ight42
P
eds0
Tota
lO
utIn
23
48
71
Peak Hour Begins at 07:15 AM Unshifted
Peak Hour Data
North

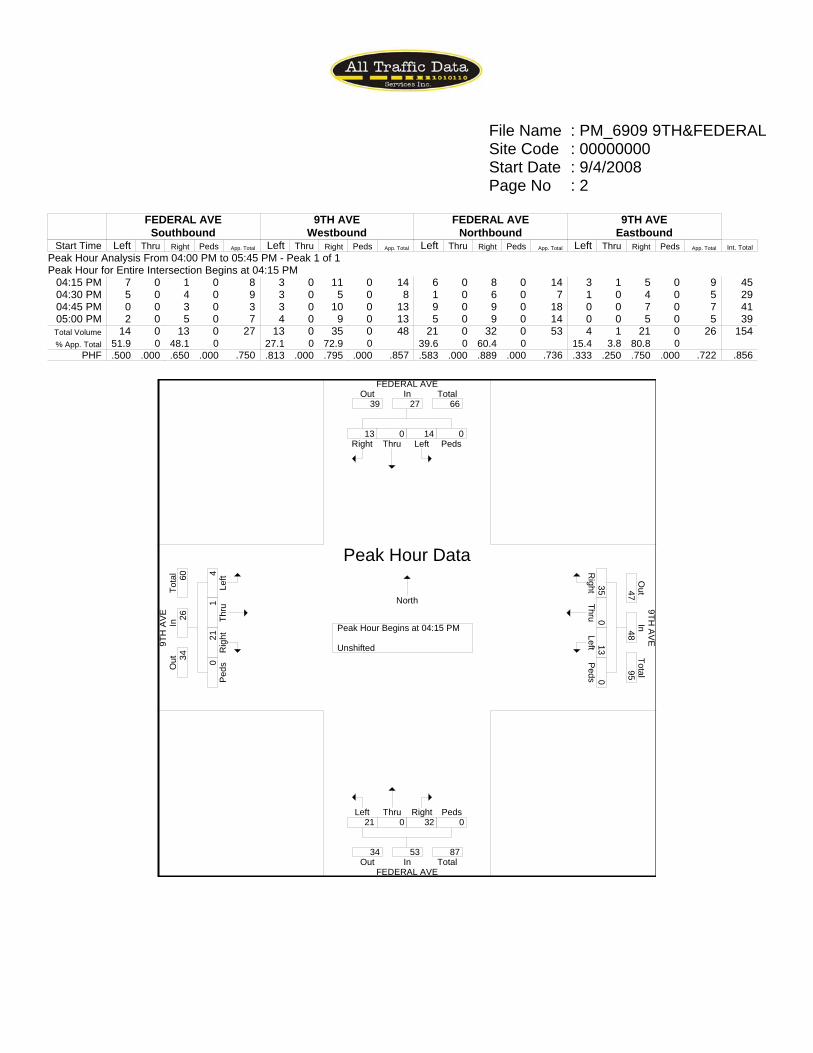
File Name : PM_6909 9TH&FEDERALSite Code : 00000000Start Date : 9/4/2008Page No : 1
Groups Printed- UnshiftedFEDERAL AVE
Southbound9TH AVE
WestboundFEDERAL AVE
Northbound9TH AVE
EastboundStart Time Left Thru Right Peds Left Thru Right Peds Left Thru Right Peds Left Thru Right Peds Int. Total
04:00 PM 3 0 2 0 2 0 6 0 7 0 7 0 1 0 4 0 3204:15 PM 7 0 1 0 3 0 11 0 6 0 8 0 3 1 5 0 4504:30 PM 5 0 4 0 3 0 5 0 1 0 6 0 1 0 4 0 2904:45 PM 0 0 3 0 3 0 10 0 9 0 9 0 0 0 7 0 41
Total 15 0 10 0 11 0 32 0 23 0 30 0 5 1 20 0 147
05:00 PM 2 0 5 0 4 0 9 0 5 0 9 0 0 0 5 0 3905:15 PM 3 0 2 0 3 0 8 0 9 0 4 0 2 0 4 0 3505:30 PM 3 0 0 0 3 0 11 0 5 0 6 0 1 0 9 0 3805:45 PM 1 0 3 0 0 0 2 0 10 0 1 0 2 1 2 0 22
Total 9 0 10 0 10 0 30 0 29 0 20 0 5 1 20 0 134
Grand Total 24 0 20 0 21 0 62 0 52 0 50 0 10 2 40 0 281Apprch % 54.5 0 45.5 0 25.3 0 74.7 0 51 0 49 0 19.2 3.8 76.9 0
Total % 8.5 0 7.1 0 7.5 0 22.1 0 18.5 0 17.8 0 3.6 0.7 14.2 0
FEDERAL AVE
9TH
AV
E 9TH
AV
E
FEDERAL AVE
Right20
Thru0
Left24
Peds0
InOut Total72 44 116
Right 62
Thru 0 Left 21
Peds 0
Out
TotalIn
76 83
159
Left52
Thru0
Right50
Peds0
Out TotalIn61 102 163
Left10
Th
ru2
Rig
ht40
Peds
0
Tota
lO
utIn
72
52
124
9/4/2008 04:00 PM9/4/2008 05:45 PM Unshifted
North
File Name : PM_6909 9TH&FEDERALSite Code : 00000000Start Date : 9/4/2008Page No : 2
FEDERAL AVESouthbound
9TH AVEWestbound
FEDERAL AVENorthbound
9TH AVEEastbound
Start Time Left Thru Right Peds App. Total Left Thru Right Peds App. Total Left Thru Right Peds App. Total Left Thru Right Peds App. Total Int. Total
Peak Hour Analysis From 04:00 PM to 05:45 PM - Peak 1 of 1Peak Hour for Entire Intersection Begins at 04:15 PM
04:15 PM 7 0 1 0 8 3 0 11 0 14 6 0 8 0 14 3 1 5 0 9 4504:30 PM 5 0 4 0 9 3 0 5 0 8 1 0 6 0 7 1 0 4 0 5 2904:45 PM 0 0 3 0 3 3 0 10 0 13 9 0 9 0 18 0 0 7 0 7 4105:00 PM 2 0 5 0 7 4 0 9 0 13 5 0 9 0 14 0 0 5 0 5 39Total Volume 14 0 13 0 27 13 0 35 0 48 21 0 32 0 53 4 1 21 0 26 154% App. Total 51.9 0 48.1 0 27.1 0 72.9 0 39.6 0 60.4 0 15.4 3.8 80.8 0
PHF .500 .000 .650 .000 .750 .813 .000 .795 .000 .857 .583 .000 .889 .000 .736 .333 .250 .750 .000 .722 .856
FEDERAL AVE
9TH
AV
E 9TH
AV
E
FEDERAL AVE
Right13
Thru0
Left14
Peds0
InOut Total39 27 66
Right 35
Thru 0 Left 13
Peds 0
Out
TotalIn
47 48
95
Left21
Thru0
Right32
Peds0
Out TotalIn34 53 87
Left4
Thru
1 R
ight21
P
eds0
Tota
lO
utIn
34
26
60
Peak Hour Begins at 04:15 PM Unshifted
Peak Hour Data
North

File Name : AM_6910 SEVERN&FEDERALSite Code : 00000000Start Date : 9/4/2008Page No : 1
Groups Printed- UnshiftedFEDERAL AVE
SouthboundSEVERN PLWestbound
FEDERAL AVENorthbound
SEVERN PLEastbound
Start Time Left Thru Right Peds Left Thru Right Peds Left Thru Right Peds Left Thru Right Peds Int. Total07:00 AM 3 227 0 0 0 0 1 0 0 243 2 0 0 0 0 0 47607:15 AM 0 235 0 0 0 0 0 0 0 315 1 0 0 0 0 0 55107:30 AM 0 308 0 0 0 0 1 0 0 331 0 0 0 0 0 0 64007:45 AM 1 325 0 0 0 0 4 0 0 350 0 0 0 0 0 0 680
Total 4 1095 0 0 0 0 6 0 0 1239 3 0 0 0 0 0 2347
08:00 AM 0 305 0 0 0 0 0 0 0 338 0 0 0 0 0 0 64308:15 AM 1 277 0 0 0 0 1 0 0 250 2 0 0 0 0 0 53108:30 AM 1 250 0 0 0 0 1 0 0 276 1 0 0 0 0 0 52908:45 AM 0 237 0 0 1 0 2 0 0 269 1 0 0 0 0 0 510
Total 2 1069 0 0 1 0 4 0 0 1133 4 0 0 0 0 0 2213
Grand Total 6 2164 0 0 1 0 10 0 0 2372 7 0 0 0 0 0 4560Apprch % 0.3 99.7 0 0 9.1 0 90.9 0 0 99.7 0.3 0 0 0 0 0
Total % 0.1 47.5 0 0 0 0 0.2 0 0 52 0.2 0 0 0 0 0
FEDERAL AVE
SE
VE
RN
PL
SE
VE
RN
PL
FEDERAL AVE
Right0
Thru2164
Left6
Peds0
InOut Total2382 2170 4552
Right 10
Thru 0 Left 1
Peds 0
Out
TotalIn
13 11
24
Left0
Thru2372
Right7
Peds0
Out TotalIn2165 2379 4544
Left0
Thru
0 R
ight0
Peds
0
Tota
lO
utIn
0 0
0
9/4/2008 07:00 AM9/4/2008 08:45 AM Unshifted
North

File Name : AM_6910 SEVERN&FEDERALSite Code : 00000000Start Date : 9/4/2008Page No : 2
FEDERAL AVESouthbound
SEVERN PLWestbound
FEDERAL AVENorthbound
SEVERN PLEastbound
Start Time Left Thru Right Peds App. Total Left Thru Right Peds App. Total Left Thru Right Peds App. Total Left Thru Right Peds App. Total Int. Total
Peak Hour Analysis From 07:00 AM to 08:45 AM - Peak 1 of 1Peak Hour for Entire Intersection Begins at 07:15 AM
07:15 AM 0 235 0 0 235 0 0 0 0 0 0 315 1 0 316 0 0 0 0 0 55107:30 AM 0 308 0 0 308 0 0 1 0 1 0 331 0 0 331 0 0 0 0 0 64007:45 AM 1 325 0 0 326 0 0 4 0 4 0 350 0 0 350 0 0 0 0 0 68008:00 AM 0 305 0 0 305 0 0 0 0 0 0 338 0 0 338 0 0 0 0 0 643Total Volume 1 1173 0 0 1174 0 0 5 0 5 0 1334 1 0 1335 0 0 0 0 0 2514% App. Total 0.1 99.9 0 0 0 0 100 0 0 99.9 0.1 0 0 0 0 0
PHF .250 .902 .000 .000 .900 .000 .000 .313 .000 .313 .000 .953 .250 .000 .954 .000 .000 .000 .000 .000 .924
FEDERAL AVE
SE
VE
RN
PL
SE
VE
RN
PL
FEDERAL AVE
Right0
Thru1173
Left1
Peds0
InOut Total1339 1174 2513
Right 5
Thru 0 Left 0
Peds 0
Out
TotalIn
2 5
7
Left0
Thru1334
Right1
Peds0
Out TotalIn1173 1335 2508
Left0
Thru
0 R
ight0
Ped
s0
Tota
lO
utIn
0 0
0
Peak Hour Begins at 07:15 AM Unshifted
Peak Hour Data
North

File Name : PM_6910 SEVERN&FEDERALSite Code : 00000000Start Date : 9/4/2008Page No : 1
Groups Printed- UnshiftedFEDERAL AVE
SouthboundSEVERN PLWestbound
FEDERAL AVENorthbound
SEVERN PLEastbound
Start Time Left Thru Right Peds Left Thru Right Peds Left Thru Right Peds Left Thru Right Peds Int. Total04:00 PM 1 437 0 0 0 0 7 0 0 392 0 0 0 0 0 0 83704:15 PM 1 446 0 0 1 0 4 0 0 344 1 0 0 0 0 0 79704:30 PM 1 455 0 0 1 0 6 0 0 407 2 0 0 0 0 0 87204:45 PM 1 454 0 0 1 0 2 0 0 458 1 0 0 0 0 0 917
Total 4 1792 0 0 3 0 19 0 0 1601 4 0 0 0 0 0 3423
05:00 PM 1 516 0 0 0 0 7 0 0 515 2 0 0 0 0 0 104105:15 PM 0 533 0 0 0 0 5 0 0 462 1 0 0 0 0 0 100105:30 PM 0 450 0 0 1 0 8 0 0 461 1 0 0 0 0 0 92105:45 PM 0 394 0 0 0 0 3 0 0 323 1 0 0 0 0 0 721
Total 1 1893 0 0 1 0 23 0 0 1761 5 0 0 0 0 0 3684
Grand Total 5 3685 0 0 4 0 42 0 0 3362 9 0 0 0 0 0 7107Apprch % 0.1 99.9 0 0 8.7 0 91.3 0 0 99.7 0.3 0 0 0 0 0
Total % 0.1 51.9 0 0 0.1 0 0.6 0 0 47.3 0.1 0 0 0 0 0
FEDERAL AVE
SE
VE
RN
PL
SE
VE
RN
PL
FEDERAL AVE
Right0
Thru3685
Left5
Peds0
InOut Total3404 3690 7094
Right 42
Thru 0 Left 4
Peds 0
Out
TotalIn
14 46
60
Left0
Thru3362
Right9
Peds0
Out TotalIn3689 3371 7060
Left0
Thru
0 R
ight0
Peds
0
Tota
lO
utIn
0 0
0
9/4/2008 04:00 PM9/4/2008 05:45 PM Unshifted
North

File Name : PM_6910 SEVERN&FEDERALSite Code : 00000000Start Date : 9/4/2008Page No : 2
FEDERAL AVESouthbound
SEVERN PLWestbound
FEDERAL AVENorthbound
SEVERN PLEastbound
Start Time Left Thru Right Peds App. Total Left Thru Right Peds App. Total Left Thru Right Peds App. Total Left Thru Right Peds App. Total Int. Total
Peak Hour Analysis From 04:00 PM to 05:45 PM - Peak 1 of 1Peak Hour for Entire Intersection Begins at 04:45 PM
04:45 PM 1 454 0 0 455 1 0 2 0 3 0 458 1 0 459 0 0 0 0 0 91705:00 PM 1 516 0 0 517 0 0 7 0 7 0 515 2 0 517 0 0 0 0 0 104105:15 PM 0 533 0 0 533 0 0 5 0 5 0 462 1 0 463 0 0 0 0 0 100105:30 PM 0 450 0 0 450 1 0 8 0 9 0 461 1 0 462 0 0 0 0 0 921Total Volume 2 1953 0 0 1955 2 0 22 0 24 0 1896 5 0 1901 0 0 0 0 0 3880% App. Total 0.1 99.9 0 0 8.3 0 91.7 0 0 99.7 0.3 0 0 0 0 0
PHF .500 .916 .000 .000 .917 .500 .000 .688 .000 .667 .000 .920 .625 .000 .919 .000 .000 .000 .000 .000 .932
FEDERAL AVE
SE
VE
RN
PL
SE
VE
RN
PL
FEDERAL AVE
Right0
Thru1953
Left2
Peds0
InOut Total1918 1955 3873
Right 22
Thru 0 Left 2
Peds 0
Out
TotalIn
7 24
31
Left0
Thru1896
Right5
Peds0
Out TotalIn1955 1901 3856
Left0
Thru
0 R
ight0
Ped
s0
Tota
lO
utIn
0 0
0
Peak Hour Begins at 04:45 PM Unshifted
Peak Hour Data
North
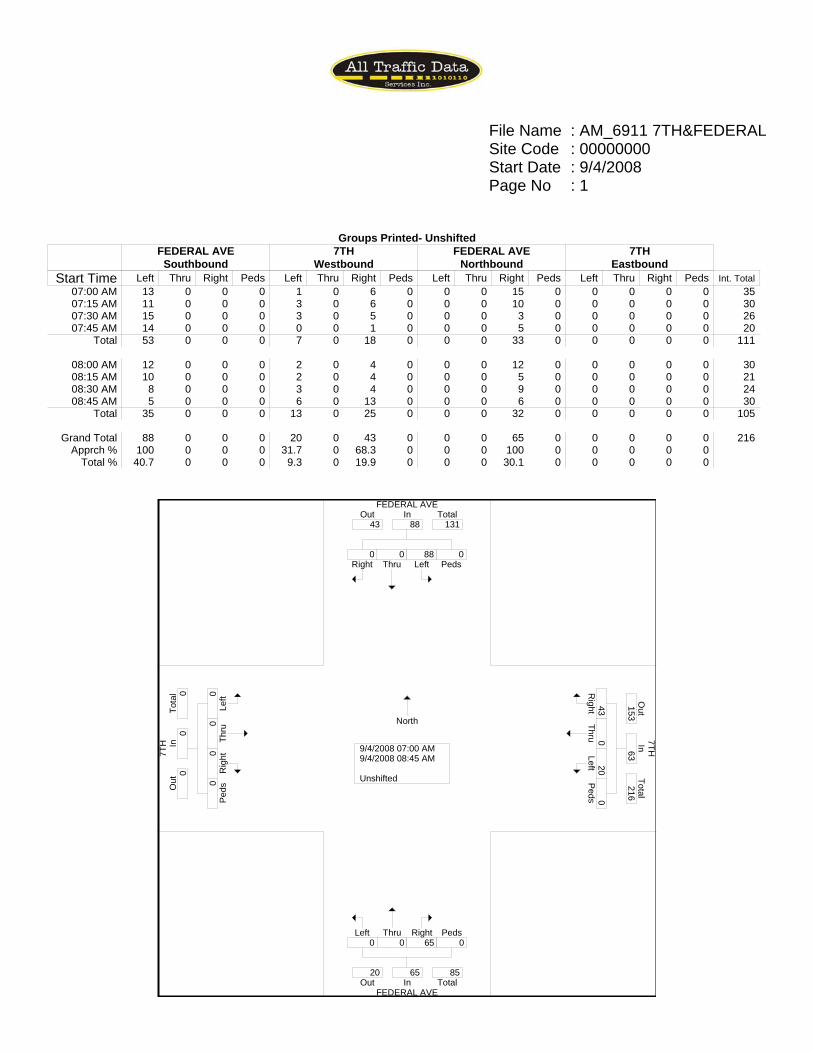
File Name : AM_6911 7TH&FEDERALSite Code : 00000000Start Date : 9/4/2008Page No : 1
Groups Printed- UnshiftedFEDERAL AVE
Southbound7TH
WestboundFEDERAL AVE
Northbound7TH
EastboundStart Time Left Thru Right Peds Left Thru Right Peds Left Thru Right Peds Left Thru Right Peds Int. Total
07:00 AM 13 0 0 0 1 0 6 0 0 0 15 0 0 0 0 0 3507:15 AM 11 0 0 0 3 0 6 0 0 0 10 0 0 0 0 0 3007:30 AM 15 0 0 0 3 0 5 0 0 0 3 0 0 0 0 0 2607:45 AM 14 0 0 0 0 0 1 0 0 0 5 0 0 0 0 0 20
Total 53 0 0 0 7 0 18 0 0 0 33 0 0 0 0 0 111
08:00 AM 12 0 0 0 2 0 4 0 0 0 12 0 0 0 0 0 3008:15 AM 10 0 0 0 2 0 4 0 0 0 5 0 0 0 0 0 2108:30 AM 8 0 0 0 3 0 4 0 0 0 9 0 0 0 0 0 2408:45 AM 5 0 0 0 6 0 13 0 0 0 6 0 0 0 0 0 30
Total 35 0 0 0 13 0 25 0 0 0 32 0 0 0 0 0 105
Grand Total 88 0 0 0 20 0 43 0 0 0 65 0 0 0 0 0 216Apprch % 100 0 0 0 31.7 0 68.3 0 0 0 100 0 0 0 0 0
Total % 40.7 0 0 0 9.3 0 19.9 0 0 0 30.1 0 0 0 0 0
FEDERAL AVE
7TH
7TH
FEDERAL AVE
Right0
Thru0
Left88
Peds0
InOut Total43 88 131
Right 43
Thru 0 Left 20
Peds 0
Out
TotalIn
153 63
216
Left0
Thru0
Right65
Peds0
Out TotalIn20 65 85
Left0
Thru
0 R
ight0
Peds
0
Tota
lO
utIn
0 0
0
9/4/2008 07:00 AM9/4/2008 08:45 AM Unshifted
North

File Name : AM_6911 7TH&FEDERALSite Code : 00000000Start Date : 9/4/2008Page No : 2
FEDERAL AVESouthbound
7THWestbound
FEDERAL AVENorthbound
7THEastbound
Start Time Left Thru Right Peds App. Total Left Thru Right Peds App. Total Left Thru Right Peds App. Total Left Thru Right Peds App. Total Int. Total
Peak Hour Analysis From 07:00 AM to 08:45 AM - Peak 1 of 1Peak Hour for Entire Intersection Begins at 07:00 AM
07:00 AM 13 0 0 0 13 1 0 6 0 7 0 0 15 0 15 0 0 0 0 0 3507:15 AM 11 0 0 0 11 3 0 6 0 9 0 0 10 0 10 0 0 0 0 0 3007:30 AM 15 0 0 0 15 3 0 5 0 8 0 0 3 0 3 0 0 0 0 0 2607:45 AM 14 0 0 0 14 0 0 1 0 1 0 0 5 0 5 0 0 0 0 0 20Total Volume 53 0 0 0 53 7 0 18 0 25 0 0 33 0 33 0 0 0 0 0 111% App. Total 100 0 0 0 28 0 72 0 0 0 100 0 0 0 0 0
PHF .883 .000 .000 .000 .883 .583 .000 .750 .000 .694 .000 .000 .550 .000 .550 .000 .000 .000 .000 .000 .793
FEDERAL AVE
7TH
7TH
FEDERAL AVE
Right0
Thru0
Left53
Peds0
InOut Total18 53 71
Right 18
Thru 0 Left 7
Peds 0
Out
TotalIn
86 25
111
Left0
Thru0
Right33
Peds0
Out TotalIn7 33 40
Left0
Thru
0 R
ight0
Ped
s0
Tota
lO
utIn
0 0
0
Peak Hour Begins at 07:00 AM Unshifted
Peak Hour Data
North

File Name : PM_6911 7TH&FEDERALSite Code : 00000000Start Date : 9/4/2008Page No : 1
Groups Printed- UnshiftedFEDERAL AVE
Southbound7TH
WestboundFEDERAL AVE
Northbound7TH
EastboundStart Time Left Thru Right Peds Left Thru Right Peds Left Thru Right Peds Left Thru Right Peds Int. Total
04:00 PM 5 0 0 0 4 0 12 0 0 0 12 0 0 0 0 0 3304:15 PM 5 0 0 0 6 0 9 0 0 0 8 0 0 0 0 0 2804:30 PM 4 0 0 0 3 0 8 0 0 0 8 0 0 0 0 0 2304:45 PM 9 0 0 0 4 1 22 0 0 0 8 0 0 0 0 0 44
Total 23 0 0 0 17 1 51 0 0 0 36 0 0 0 0 0 128
05:00 PM 3 0 0 0 11 0 17 0 0 0 5 0 0 0 0 0 3605:15 PM 2 0 0 0 13 1 15 0 0 0 4 0 0 0 0 0 3505:30 PM 2 0 0 0 4 0 12 0 0 0 6 0 0 0 0 0 2405:45 PM 1 0 0 0 1 0 5 0 1 0 3 0 0 0 0 0 11
Total 8 0 0 0 29 1 49 0 1 0 18 0 0 0 0 0 106
Grand Total 31 0 0 0 46 2 100 0 1 0 54 0 0 0 0 0 234Apprch % 100 0 0 0 31.1 1.4 67.6 0 1.8 0 98.2 0 0 0 0 0
Total % 13.2 0 0 0 19.7 0.9 42.7 0 0.4 0 23.1 0 0 0 0 0
FEDERAL AVE
7TH
7TH
FEDERAL AVE
Right0
Thru0
Left31
Peds0
InOut Total100 31 131
Right100
Thru 2 Left 46
Peds 0
Out
TotalIn
85 148
233
Left1
Thru0
Right54
Peds0
Out TotalIn46 55 101
Left0
Thru
0 R
ight0
Peds
0
Tota
lO
utIn
3 0
3
9/4/2008 04:00 PM9/4/2008 05:45 PM Unshifted
North

File Name : PM_6911 7TH&FEDERALSite Code : 00000000Start Date : 9/4/2008Page No : 2
FEDERAL AVESouthbound
7THWestbound
FEDERAL AVENorthbound
7THEastbound
Start Time Left Thru Right Peds App. Total Left Thru Right Peds App. Total Left Thru Right Peds App. Total Left Thru Right Peds App. Total Int. Total
Peak Hour Analysis From 04:00 PM to 05:45 PM - Peak 1 of 1Peak Hour for Entire Intersection Begins at 04:45 PM
04:45 PM 9 0 0 0 9 4 1 22 0 27 0 0 8 0 8 0 0 0 0 0 4405:00 PM 3 0 0 0 3 11 0 17 0 28 0 0 5 0 5 0 0 0 0 0 3605:15 PM 2 0 0 0 2 13 1 15 0 29 0 0 4 0 4 0 0 0 0 0 3505:30 PM 2 0 0 0 2 4 0 12 0 16 0 0 6 0 6 0 0 0 0 0 24Total Volume 16 0 0 0 16 32 2 66 0 100 0 0 23 0 23 0 0 0 0 0 139% App. Total 100 0 0 0 32 2 66 0 0 0 100 0 0 0 0 0
PHF .444 .000 .000 .000 .444 .615 .500 .750 .000 .862 .000 .000 .719 .000 .719 .000 .000 .000 .000 .000 .790
FEDERAL AVE
7TH
7TH
FEDERAL AVE
Right0
Thru0
Left16
Peds0
InOut Total66 16 82
Right 66
Thru 2 Left 32
Peds 0
Out
TotalIn
39 100
139
Left0
Thru0
Right23
Peds0
Out TotalIn32 23 55
Left0
Thru
0 R
ight0
Ped
s0
Tota
lO
utIn
2 0
2
Peak Hour Begins at 04:45 PM Unshifted
Peak Hour Data
North

HCM Signalized Intersection Capacity Analysis1: Holden Pl & Federal 10/28/2008
K:\08171\Transportation\Synchro\Existing_AM.syn Synchro 7 - ReportFelsburg Holt & Ullevig Page 1
Movement WBL WBR NBT NBR SBL SBTLane ConfigurationsVolume (vph) 8 33 1024 50 148 1548Ideal Flow (vphpl) 1800 1800 1800 1800 1800 1800Lane Width 11 11 10 10 9 10Total Lost time (s) 5.0 5.0 5.0 5.0 5.0Lane Util. Factor 1.00 0.95 1.00 1.00 0.91Frpb, ped/bikes 0.96 1.00 0.95 1.00 1.00Flpb, ped/bikes 1.00 1.00 1.00 0.99 1.00Frt 0.89 1.00 0.85 1.00 1.00Flt Protected 0.99 1.00 1.00 0.95 1.00Satd. Flow (prot) 1440 3040 1326 1499 4275Flt Permitted 0.99 1.00 1.00 0.26 1.00Satd. Flow (perm) 1440 3040 1326 415 4275Peak-hour factor, PHF 0.96 0.96 0.96 0.96 0.96 0.96Adj. Flow (vph) 8 34 1067 52 154 1612RTOR Reduction (vph) 32 0 0 8 0 0Lane Group Flow (vph) 10 0 1067 44 154 1612Confl. Peds. (#/hr) 10 10 10 10Confl. Bikes (#/hr) 5 5Heavy Vehicles (%) 2% 2% 5% 2% 2% 6%Bus Blockages (#/hr) 0 0 0 0 0 9Turn Type Perm PermProtected Phases 4 2 2Permitted Phases 2 2Actuated Green, G (s) 4.6 85.4 85.4 85.4 85.4Effective Green, g (s) 4.6 85.4 85.4 85.4 85.4Actuated g/C Ratio 0.05 0.85 0.85 0.85 0.85Clearance Time (s) 5.0 5.0 5.0 5.0 5.0Vehicle Extension (s) 3.0 3.0 3.0 3.0 3.0Lane Grp Cap (vph) 66 2596 1132 354 3651v/s Ratio Prot c0.01 0.35 c0.38v/s Ratio Perm 0.03 0.37v/c Ratio 0.14 0.41 0.04 0.44 0.44Uniform Delay, d1 45.8 1.6 1.1 1.7 1.7Progression Factor 1.00 0.99 1.92 1.00 1.00Incremental Delay, d2 1.0 0.4 0.1 3.9 0.4Delay (s) 46.8 2.0 2.2 5.6 2.1Level of Service D A A A AApproach Delay (s) 46.8 2.0 2.4Approach LOS D A A
Intersection SummaryHCM Average Control Delay 2.9 HCM Level of Service AHCM Volume to Capacity ratio 0.43Actuated Cycle Length (s) 100.0 Sum of lost time (s) 10.0Intersection Capacity Utilization 57.3% ICU Level of Service BAnalysis Period (min) 15c Critical Lane Group

HCM Unsignalized Intersection Capacity Analysis2: 12th Ave & Federal 10/28/2008
K:\08171\Transportation\Synchro\Existing_AM.syn Synchro 7 - ReportFelsburg Holt & Ullevig Page 2
Movement EBL EBR NBL NBT SBT SBRLane ConfigurationsVolume (veh/h) 12 16 14 1035 1570 6Sign Control Stop Free FreeGrade 0% 0% 0%Peak Hour Factor 0.91 0.91 0.91 0.91 0.91 0.91Hourly flow rate (vph) 13 18 15 1137 1725 7Pedestrians 10 10 10Lane Width (ft) 12.0 10.0 10.0Walking Speed (ft/s) 4.0 4.0 4.0Percent Blockage 1 1 1Right turn flare (veh)Median type TWLTL TWLTLMedian storage veh) 2 2Upstream signal (ft) 660 340pX, platoon unblocked 0.92 0.92 0.92vC, conflicting volume 2158 598 1742vC1, stage 1 conf vol 1739vC2, stage 2 conf vol 420vCu, unblocked vol 1967 279 1516tC, single (s) 6.8 6.9 4.1tC, 2 stage (s) 5.8tF (s) 3.5 3.3 2.2p0 queue free % 91 97 96cM capacity (veh/h) 148 654 400
Direction, Lane # EB 1 NB 1 NB 2 NB 3 NB 4 SB 1 SB 2 SB 3Volume Total 31 15 379 379 379 690 690 352Volume Left 13 15 0 0 0 0 0 0Volume Right 18 0 0 0 0 0 0 7cSH 265 400 1700 1700 1700 1700 1700 1700Volume to Capacity 0.12 0.04 0.22 0.22 0.22 0.41 0.41 0.21Queue Length 95th (ft) 10 3 0 0 0 0 0 0Control Delay (s) 20.4 14.4 0.0 0.0 0.0 0.0 0.0 0.0Lane LOS C BApproach Delay (s) 20.4 0.2 0.0Approach LOS C
Intersection SummaryAverage Delay 0.3Intersection Capacity Utilization 45.0% ICU Level of Service AAnalysis Period (min) 15

HCM Unsignalized Intersection Capacity Analysis3: 11th Ave & Federal 10/28/2008
K:\08171\Transportation\Synchro\Existing_AM.syn Synchro 7 - ReportFelsburg Holt & Ullevig Page 3
Movement WBL WBR NBT NBR SBL SBTLane ConfigurationsVolume (veh/h) 4 29 1033 188 151 1396Sign Control Stop Free FreeGrade 0% 0% 0%Peak Hour Factor 0.97 0.97 0.97 0.97 0.97 0.97Hourly flow rate (vph) 4 30 1065 194 156 1439Pedestrians 10 10 10Lane Width (ft) 12.0 10.0 10.0Walking Speed (ft/s) 4.0 4.0 4.0Percent Blockage 1 1 1Right turn flare (veh)Median type TWLTL TWLTLMedian storage veh) 2 2Upstream signal (ft) 330 670pX, platoon unblocked 0.98vC, conflicting volume 1973 472 1269vC1, stage 1 conf vol 1172vC2, stage 2 conf vol 801vCu, unblocked vol 1927 472 1269tC, single (s) 6.8 6.9 4.1tC, 2 stage (s) 5.8tF (s) 3.5 3.3 2.2p0 queue free % 98 94 71cM capacity (veh/h) 192 530 539
Direction, Lane # WB 1 NB 1 NB 2 NB 3 SB 1 SB 2 SB 3 SB 4Volume Total 34 426 426 407 156 480 480 480Volume Left 4 0 0 0 156 0 0 0Volume Right 30 0 0 194 0 0 0 0cSH 437 1700 1700 1700 539 1700 1700 1700Volume to Capacity 0.08 0.25 0.25 0.24 0.29 0.28 0.28 0.28Queue Length 95th (ft) 6 0 0 0 30 0 0 0Control Delay (s) 13.9 0.0 0.0 0.0 14.4 0.0 0.0 0.0Lane LOS B BApproach Delay (s) 13.9 0.0 1.4Approach LOS B
Intersection SummaryAverage Delay 0.9Intersection Capacity Utilization 50.6% ICU Level of Service AAnalysis Period (min) 15

HCM Signalized Intersection Capacity Analysis4: 10th Ave & Federal 10/28/2008
K:\08171\Transportation\Synchro\Existing_AM.syn Synchro 7 - ReportFelsburg Holt & Ullevig Page 4
Movement EBL EBT EBR WBL WBT WBR NBL NBT NBR SBL SBT SBRLane ConfigurationsVolume (vph) 113 75 49 27 22 22 44 1118 41 29 1349 31Ideal Flow (vphpl) 1800 1800 1800 1800 1800 1800 1800 1800 1800 1800 1800 1800Lane Width 12 12 12 12 12 12 9 10 10 9 10 10Total Lost time (s) 5.0 5.0 5.0 5.0 5.0 5.0Lane Util. Factor 1.00 1.00 1.00 0.95 1.00 0.91Frpb, ped/bikes 0.99 0.99 1.00 1.00 1.00 1.00Flpb, ped/bikes 0.99 1.00 1.00 1.00 1.00 1.00Frt 0.97 0.96 1.00 0.99 1.00 1.00Flt Protected 0.98 0.98 0.95 1.00 0.95 1.00Satd. Flow (prot) 1624 1616 1475 2953 1474 4263Flt Permitted 0.83 0.81 0.15 1.00 0.19 1.00Satd. Flow (perm) 1383 1341 236 2953 297 4263Peak-hour factor, PHF 0.95 0.95 0.95 0.95 0.95 0.95 0.95 0.95 0.95 0.95 0.95 0.95Adj. Flow (vph) 119 79 52 28 23 23 46 1177 43 31 1420 33RTOR Reduction (vph) 0 10 0 0 17 0 0 2 0 0 2 0Lane Group Flow (vph) 0 240 0 0 57 0 46 1218 0 31 1451 0Confl. Peds. (#/hr) 10 10 10 10 10 10 10 10Confl. Bikes (#/hr) 5 5 5 5Heavy Vehicles (%) 2% 2% 2% 2% 2% 2% 4% 5% 4% 4% 6% 4%Bus Blockages (#/hr) 4 4 4 3 3 3 0 11 11 0 8 8Turn Type Perm Perm Perm PermProtected Phases 4 4 2 2Permitted Phases 4 4 2 2Actuated Green, G (s) 20.2 20.2 69.8 69.8 69.8 69.8Effective Green, g (s) 20.2 20.2 69.8 69.8 69.8 69.8Actuated g/C Ratio 0.20 0.20 0.70 0.70 0.70 0.70Clearance Time (s) 5.0 5.0 5.0 5.0 5.0 5.0Vehicle Extension (s) 3.0 3.0 3.0 3.0 3.0 3.0Lane Grp Cap (vph) 279 271 165 2061 207 2976v/s Ratio Prot c0.41 0.34v/s Ratio Perm c0.17 0.04 0.20 0.10v/c Ratio 0.86 0.21 0.28 0.59 0.15 0.49Uniform Delay, d1 38.6 33.3 5.7 7.8 5.1 6.9Progression Factor 1.00 1.00 1.18 0.91 1.56 1.52Incremental Delay, d2 22.8 0.4 3.4 1.0 1.4 0.5Delay (s) 61.4 33.7 10.0 8.1 9.4 11.0Level of Service E C B A A BApproach Delay (s) 61.4 33.7 8.2 11.0Approach LOS E C A B
Intersection SummaryHCM Average Control Delay 14.5 HCM Level of Service BHCM Volume to Capacity ratio 0.65Actuated Cycle Length (s) 100.0 Sum of lost time (s) 10.0Intersection Capacity Utilization 67.0% ICU Level of Service CAnalysis Period (min) 15c Critical Lane Group

HCM Unsignalized Intersection Capacity Analysis5: 9th Ave & Federal 10/28/2008
K:\08171\Transportation\Synchro\Existing_AM.syn Synchro 7 - ReportFelsburg Holt & Ullevig Page 5
Movement EBL EBT EBR WBL WBT WBR NBL NBT NBR SBL SBT SBRLane ConfigurationsVolume (veh/h) 2 4 42 3 0 12 15 1142 44 21 1358 8Sign Control Stop Stop Free FreeGrade 0% 0% 0% 0%Peak Hour Factor 0.94 0.94 0.94 0.94 0.94 0.94 0.94 0.94 0.94 0.94 0.94 0.94Hourly flow rate (vph) 2 4 45 3 0 13 16 1215 47 22 1445 9Pedestrians 10 10 10 10Lane Width (ft) 12.0 12.0 10.0 10.0Walking Speed (ft/s) 4.0 4.0 4.0 4.0Percent Blockage 1 1 1 1Right turn flare (veh)Median type TWLTL TWLTLMedian storage veh) 2 2Upstream signal (ft) 690 650pX, platoon unblocked 0.83 0.83 0.88 0.83 0.83 0.77 0.88 0.77vC, conflicting volume 2166 2807 506 1863 2788 651 1463 1272vC1, stage 1 conf vol 1504 1504 1280 1280vC2, stage 2 conf vol 662 1304 583 1508vCu, unblocked vol 1119 1888 0 757 1865 0 1039 766tC, single (s) 7.5 6.5 6.9 7.5 6.5 6.9 4.1 4.1tC, 2 stage (s) 6.5 5.5 6.5 5.5tF (s) 3.5 4.0 3.3 3.5 4.0 3.3 2.2 2.2p0 queue free % 99 98 95 99 100 98 97 97cM capacity (veh/h) 189 184 937 259 185 826 579 647
Direction, Lane # EB 1 WB 1 NB 1 NB 2 NB 3 SB 1 SB 2 SB 3 SB 4Volume Total 51 16 16 810 452 22 578 578 297Volume Left 2 3 16 0 0 22 0 0 0Volume Right 45 13 0 0 47 0 0 0 9cSH 622 574 579 1700 1700 647 1700 1700 1700Volume to Capacity 0.08 0.03 0.03 0.48 0.27 0.03 0.34 0.34 0.17Queue Length 95th (ft) 7 2 2 0 0 3 0 0 0Control Delay (s) 11.3 11.4 11.4 0.0 0.0 10.8 0.0 0.0 0.0Lane LOS B B B BApproach Delay (s) 11.3 11.4 0.1 0.2Approach LOS B B
Intersection SummaryAverage Delay 0.4Intersection Capacity Utilization 48.3% ICU Level of Service AAnalysis Period (min) 15

HCM Signalized Intersection Capacity Analysis7: 8th Ave & Federal 10/28/2008
K:\08171\Transportation\Synchro\Existing_AM.syn Synchro 7 - ReportFelsburg Holt & Ullevig Page 6
Movement EBL EBT EBR WBL WBT WBR NBL NBT NBR SBL SBT SBRLane ConfigurationsVolume (vph) 100 276 20 144 121 78 22 930 211 89 1208 31Ideal Flow (vphpl) 1800 1800 1800 1800 1800 1800 1800 1800 1800 1800 1800 1800Lane Width 10 10 10 10 10 10 9 10 10 9 10 10Total Lost time (s) 5.0 5.0 5.0 5.0 5.0 5.0 5.0 5.0Lane Util. Factor 1.00 0.95 0.97 0.95 1.00 0.95 1.00 0.91Frpb, ped/bikes 1.00 1.00 1.00 0.99 1.00 0.99 1.00 1.00Flpb, ped/bikes 1.00 1.00 1.00 1.00 1.00 1.00 1.00 1.00Frt 1.00 0.99 1.00 0.94 1.00 0.97 1.00 1.00Flt Protected 0.95 1.00 0.95 1.00 0.95 1.00 0.95 1.00Satd. Flow (prot) 1565 3089 3036 2901 1477 2908 1480 4275Flt Permitted 0.95 1.00 0.95 1.00 0.16 1.00 0.16 1.00Satd. Flow (perm) 1565 3089 3036 2901 252 2908 253 4275Peak-hour factor, PHF 0.93 0.93 0.93 0.93 0.93 0.93 0.93 0.93 0.93 0.93 0.93 0.93Adj. Flow (vph) 108 297 22 155 130 84 24 1000 227 96 1299 33RTOR Reduction (vph) 0 6 0 0 72 0 0 18 0 0 2 0Lane Group Flow (vph) 108 313 0 155 142 0 24 1209 0 96 1330 0Confl. Peds. (#/hr) 10 10 10 10 10 10 10 10Confl. Bikes (#/hr) 5 5 5 5Heavy Vehicles (%) 2% 2% 2% 2% 2% 2% 4% 5% 4% 4% 6% 4%Bus Blockages (#/hr) 0 0 0 0 0 0 0 6 6 0 6 6Turn Type Prot Prot Perm PermProtected Phases 3 8 7 4 6 2Permitted Phases 6 2Actuated Green, G (s) 10.7 14.8 10.1 14.2 60.1 60.1 60.1 60.1Effective Green, g (s) 10.7 14.8 10.1 14.2 60.1 60.1 60.1 60.1Actuated g/C Ratio 0.11 0.15 0.10 0.14 0.60 0.60 0.60 0.60Clearance Time (s) 5.0 5.0 5.0 5.0 5.0 5.0 5.0 5.0Vehicle Extension (s) 3.0 3.0 3.0 3.0 3.0 3.0 3.0 3.0Lane Grp Cap (vph) 167 457 307 412 151 1748 152 2569v/s Ratio Prot c0.07 c0.10 0.05 0.05 c0.42 0.31v/s Ratio Perm 0.10 0.38v/c Ratio 0.65 0.68 0.50 0.34 0.16 0.69 0.63 0.52Uniform Delay, d1 42.8 40.4 42.6 38.7 8.8 13.6 12.8 11.6Progression Factor 1.00 1.00 1.00 1.00 1.61 1.81 0.48 0.44Incremental Delay, d2 8.3 4.2 1.3 0.5 1.9 1.9 16.5 0.7Delay (s) 51.2 44.6 43.9 39.2 16.1 26.6 22.6 5.7Level of Service D D D D B C C AApproach Delay (s) 46.3 41.2 26.4 6.9Approach LOS D D C A
Intersection SummaryHCM Average Control Delay 22.4 HCM Level of Service CHCM Volume to Capacity ratio 0.65Actuated Cycle Length (s) 100.0 Sum of lost time (s) 10.0Intersection Capacity Utilization 70.7% ICU Level of Service CAnalysis Period (min) 15c Critical Lane Group

HCM Unsignalized Intersection Capacity Analysis8: Severn Pl & Federal 10/28/2008
K:\08171\Transportation\Synchro\Existing_AM.syn Synchro 7 - ReportFelsburg Holt & Ullevig Page 7
Movement WBL WBR NBT NBR SBL SBTLane ConfigurationsVolume (veh/h) 0 5 1167 1 1 1372Sign Control Stop Free FreeGrade 0% 0% 0%Peak Hour Factor 0.92 0.92 0.92 0.92 0.92 0.92Hourly flow rate (vph) 0 5 1268 1 1 1491Pedestrians 10 10 10Lane Width (ft) 9.0 10.0 10.0Walking Speed (ft/s) 4.0 4.0 4.0Percent Blockage 1 1 1Right turn flare (veh)Median type TWLTL TWLTLMedian storage veh) 2 2Upstream signal (ft) 890 340pX, platoon unblocked 0.91 0.85 0.85vC, conflicting volume 1788 655 1280vC1, stage 1 conf vol 1279vC2, stage 2 conf vol 509vCu, unblocked vol 670 252 984tC, single (s) 6.8 6.9 4.1tC, 2 stage (s) 5.8tF (s) 3.5 3.3 2.2p0 queue free % 100 99 100cM capacity (veh/h) 269 630 592
Direction, Lane # WB 1 NB 1 NB 2 SB 1 SB 2 SB 3 SB 4Volume Total 5 846 424 1 497 497 497Volume Left 0 0 0 1 0 0 0Volume Right 5 0 1 0 0 0 0cSH 630 1700 1700 592 1700 1700 1700Volume to Capacity 0.01 0.50 0.25 0.00 0.29 0.29 0.29Queue Length 95th (ft) 1 0 0 0 0 0 0Control Delay (s) 10.8 0.0 0.0 11.1 0.0 0.0 0.0Lane LOS B BApproach Delay (s) 10.8 0.0 0.0Approach LOS B
Intersection SummaryAverage Delay 0.0Intersection Capacity Utilization 46.9% ICU Level of Service AAnalysis Period (min) 15

HCM Unsignalized Intersection Capacity Analysis9: 7th Ave & Federal 10/28/2008
K:\08171\Transportation\Synchro\Existing_AM.syn Synchro 7 - ReportFelsburg Holt & Ullevig Page 8
Movement WBL WBR NBT NBR SBL SBTLane ConfigurationsVolume (veh/h) 7 18 1158 33 53 1320Sign Control Stop Free FreeGrade 0% 0% 0%Peak Hour Factor 0.92 0.92 0.92 0.92 0.92 0.92Hourly flow rate (vph) 8 20 1259 36 58 1435Pedestrians 10 10 10Lane Width (ft) 12.0 10.0 10.0Walking Speed (ft/s) 4.0 4.0 4.0Percent Blockage 1 1 1Right turn flare (veh)Median type TWLTL TWLTLMedian storage veh) 2 2Upstream signal (ft) 570 660pX, platoon unblocked 0.91 0.83 0.83vC, conflicting volume 1890 667 1305vC1, stage 1 conf vol 1287vC2, stage 2 conf vol 603vCu, unblocked vol 818 205 969tC, single (s) 6.8 6.9 4.1tC, 2 stage (s) 5.8tF (s) 3.5 3.3 2.2p0 queue free % 97 97 90cM capacity (veh/h) 273 659 585
Direction, Lane # WB 1 NB 1 NB 2 SB 1 SB 2 SB 3 SB 4Volume Total 27 839 455 58 478 478 478Volume Left 8 0 0 58 0 0 0Volume Right 20 0 36 0 0 0 0cSH 472 1700 1700 585 1700 1700 1700Volume to Capacity 0.06 0.49 0.27 0.10 0.28 0.28 0.28Queue Length 95th (ft) 5 0 0 8 0 0 0Control Delay (s) 13.1 0.0 0.0 11.8 0.0 0.0 0.0Lane LOS B BApproach Delay (s) 13.1 0.0 0.5Approach LOS B
Intersection SummaryAverage Delay 0.4Intersection Capacity Utilization 54.4% ICU Level of Service AAnalysis Period (min) 15

HCM Signalized Intersection Capacity Analysis10: WB 6th Ave Ramp & Federal 10/28/2008
K:\08171\Transportation\Synchro\Existing_AM.syn Synchro 7 - ReportFelsburg Holt & Ullevig Page 9
Movement EBL EBT EBR WBL WBT WBR NBL NBT NBR SBL SBT SBRLane ConfigurationsVolume (vph) 0 0 0 152 43 36 271 1163 0 0 1190 139Ideal Flow (vphpl) 1800 1800 1800 1800 1800 1800 1800 1800 1800 1800 1800 1800Lane Width 10 10 10 9 9 9 9 9 9 10 10 10Total Lost time (s) 5.0 5.0 5.0 5.0 5.0 5.0 4.0Lane Util. Factor 0.95 0.95 1.00 1.00 0.95 0.91 1.00Frpb, ped/bikes 1.00 1.00 0.96 1.00 1.00 1.00 0.98Flpb, ped/bikes 0.98 0.99 1.00 1.00 1.00 1.00 1.00Frt 1.00 1.00 0.85 1.00 1.00 1.00 0.85Flt Protected 0.95 0.97 1.00 0.95 1.00 1.00 1.00Satd. Flow (prot) 1379 1424 1242 1479 2896 4327 1351Flt Permitted 0.95 0.97 1.00 0.18 1.00 1.00 1.00Satd. Flow (perm) 1379 1424 1242 278 2896 4327 1351Peak-hour factor, PHF 0.91 0.91 0.91 0.91 0.91 0.91 0.91 0.91 0.91 0.91 0.91 0.91Adj. Flow (vph) 0 0 0 167 47 40 298 1278 0 0 1308 153RTOR Reduction (vph) 0 0 0 0 0 35 0 0 0 0 0 0Lane Group Flow (vph) 0 0 0 105 109 5 298 1278 0 0 1308 153Confl. Peds. (#/hr) 10 10 10 10 10 10 10 10Confl. Bikes (#/hr) 5 5 5 5Heavy Vehicles (%) 2% 2% 2% 4% 4% 4% 4% 5% 2% 2% 6% 4%Bus Blockages (#/hr) 0 0 0 0 0 6 0 6 0 0 0 0Turn Type Perm Perm pm+pt FreeProtected Phases 4 1 6 2Permitted Phases 4 4 6 FreeActuated Green, G (s) 12.9 12.9 12.9 77.1 77.1 66.1 100.0Effective Green, g (s) 12.9 12.9 12.9 77.1 77.1 66.1 100.0Actuated g/C Ratio 0.13 0.13 0.13 0.77 0.77 0.66 1.00Clearance Time (s) 5.0 5.0 5.0 5.0 5.0 5.0Vehicle Extension (s) 3.0 3.0 3.0 3.0 3.0 3.0Lane Grp Cap (vph) 178 184 160 286 2233 2860 1351v/s Ratio Prot c0.06 0.44 0.30v/s Ratio Perm 0.08 0.08 0.00 c0.74 0.11v/c Ratio 0.59 0.59 0.03 1.04 0.57 0.46 0.11Uniform Delay, d1 41.1 41.1 38.1 15.3 4.7 8.2 0.0Progression Factor 1.00 1.00 1.00 0.88 0.55 0.46 1.00Incremental Delay, d2 4.9 5.0 0.1 58.6 0.8 0.5 0.2Delay (s) 46.0 46.1 38.2 72.0 3.4 4.3 0.2Level of Service D D D E A A AApproach Delay (s) 0.0 44.8 16.4 3.8Approach LOS A D B A
Intersection SummaryHCM Average Control Delay 13.0 HCM Level of Service BHCM Volume to Capacity ratio 0.95Actuated Cycle Length (s) 100.0 Sum of lost time (s) 10.0Intersection Capacity Utilization 60.4% ICU Level of Service BAnalysis Period (min) 15c Critical Lane Group
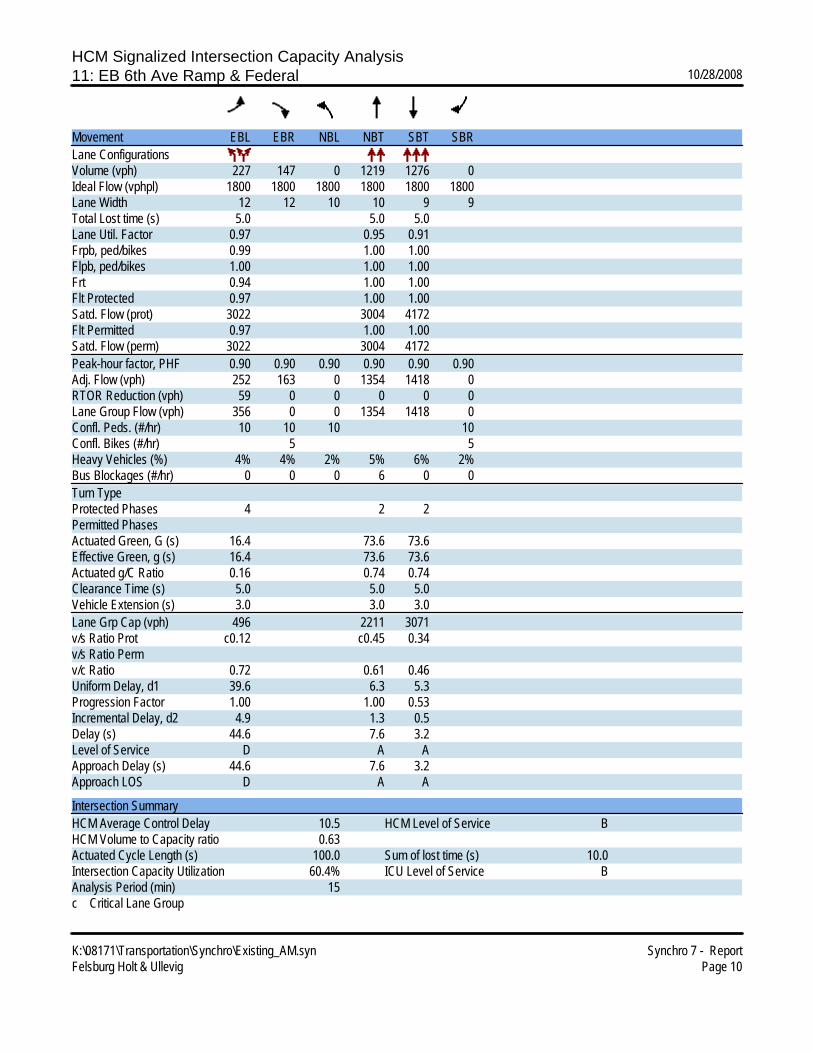
HCM Signalized Intersection Capacity Analysis11: EB 6th Ave Ramp & Federal 10/28/2008
K:\08171\Transportation\Synchro\Existing_AM.syn Synchro 7 - ReportFelsburg Holt & Ullevig Page 10
Movement EBL EBR NBL NBT SBT SBRLane ConfigurationsVolume (vph) 227 147 0 1219 1276 0Ideal Flow (vphpl) 1800 1800 1800 1800 1800 1800Lane Width 12 12 10 10 9 9Total Lost time (s) 5.0 5.0 5.0Lane Util. Factor 0.97 0.95 0.91Frpb, ped/bikes 0.99 1.00 1.00Flpb, ped/bikes 1.00 1.00 1.00Frt 0.94 1.00 1.00Flt Protected 0.97 1.00 1.00Satd. Flow (prot) 3022 3004 4172Flt Permitted 0.97 1.00 1.00Satd. Flow (perm) 3022 3004 4172Peak-hour factor, PHF 0.90 0.90 0.90 0.90 0.90 0.90Adj. Flow (vph) 252 163 0 1354 1418 0RTOR Reduction (vph) 59 0 0 0 0 0Lane Group Flow (vph) 356 0 0 1354 1418 0Confl. Peds. (#/hr) 10 10 10 10Confl. Bikes (#/hr) 5 5Heavy Vehicles (%) 4% 4% 2% 5% 6% 2%Bus Blockages (#/hr) 0 0 0 6 0 0Turn TypeProtected Phases 4 2 2Permitted PhasesActuated Green, G (s) 16.4 73.6 73.6Effective Green, g (s) 16.4 73.6 73.6Actuated g/C Ratio 0.16 0.74 0.74Clearance Time (s) 5.0 5.0 5.0Vehicle Extension (s) 3.0 3.0 3.0Lane Grp Cap (vph) 496 2211 3071v/s Ratio Prot c0.12 c0.45 0.34v/s Ratio Permv/c Ratio 0.72 0.61 0.46Uniform Delay, d1 39.6 6.3 5.3Progression Factor 1.00 1.00 0.53Incremental Delay, d2 4.9 1.3 0.5Delay (s) 44.6 7.6 3.2Level of Service D A AApproach Delay (s) 44.6 7.6 3.2Approach LOS D A A
Intersection SummaryHCM Average Control Delay 10.5 HCM Level of Service BHCM Volume to Capacity ratio 0.63Actuated Cycle Length (s) 100.0 Sum of lost time (s) 10.0Intersection Capacity Utilization 60.4% ICU Level of Service BAnalysis Period (min) 15c Critical Lane Group

HCM Signalized Intersection Capacity Analysis1: Holden Pl & Federal 10/28/2008
K:\08171\Transportation\Synchro\Existing_PM.syn Synchro 7 - ReportFelsburg Holt & Ullevig Page 1
Movement WBL WBR NBT NBR SBL SBTLane ConfigurationsVolume (vph) 56 106 1795 38 47 1813Ideal Flow (vphpl) 1800 1800 1800 1800 1800 1800Lane Width 11 11 10 10 9 10Total Lost time (s) 5.0 5.0 5.0 5.0 5.0Lane Util. Factor 1.00 0.95 1.00 1.00 0.91Frpb, ped/bikes 0.98 1.00 0.96 1.00 1.00Flpb, ped/bikes 1.00 1.00 1.00 1.00 1.00Frt 0.91 1.00 0.85 1.00 1.00Flt Protected 0.98 1.00 1.00 0.95 1.00Satd. Flow (prot) 1491 3040 1338 1509 4269Flt Permitted 0.98 1.00 1.00 0.07 1.00Satd. Flow (perm) 1491 3040 1338 117 4269Peak-hour factor, PHF 0.94 0.94 0.94 0.94 0.94 0.94Adj. Flow (vph) 60 113 1910 40 50 1929RTOR Reduction (vph) 22 0 0 0 0 0Lane Group Flow (vph) 151 0 1910 40 50 1929Confl. Peds. (#/hr) 10 10 10 10Confl. Bikes (#/hr) 5 5Heavy Vehicles (%) 2% 2% 5% 2% 2% 6%Bus Blockages (#/hr) 0 0 0 0 0 10Turn Type pm+ov PermProtected Phases 4 2 4 2Permitted Phases 2 2Actuated Green, G (s) 14.8 75.2 90.0 75.2 75.2Effective Green, g (s) 14.8 75.2 90.0 75.2 75.2Actuated g/C Ratio 0.15 0.75 0.90 0.75 0.75Clearance Time (s) 5.0 5.0 5.0 5.0 5.0Vehicle Extension (s) 3.0 3.0 3.0 3.0 3.0Lane Grp Cap (vph) 221 2286 1338 88 3210v/s Ratio Prot c0.10 c0.63 0.00 0.45v/s Ratio Perm 0.03 0.43v/c Ratio 0.68 0.84 0.03 0.57 0.60Uniform Delay, d1 40.4 8.3 0.5 5.4 5.6Progression Factor 1.00 1.59 1.17 1.00 1.00Incremental Delay, d2 8.4 2.8 0.0 24.0 0.8Delay (s) 48.8 15.9 0.6 29.3 6.5Level of Service D B A C AApproach Delay (s) 48.8 15.6 7.0Approach LOS D B A
Intersection SummaryHCM Average Control Delay 12.9 HCM Level of Service BHCM Volume to Capacity ratio 0.81Actuated Cycle Length (s) 100.0 Sum of lost time (s) 10.0Intersection Capacity Utilization 72.2% ICU Level of Service CAnalysis Period (min) 15c Critical Lane Group
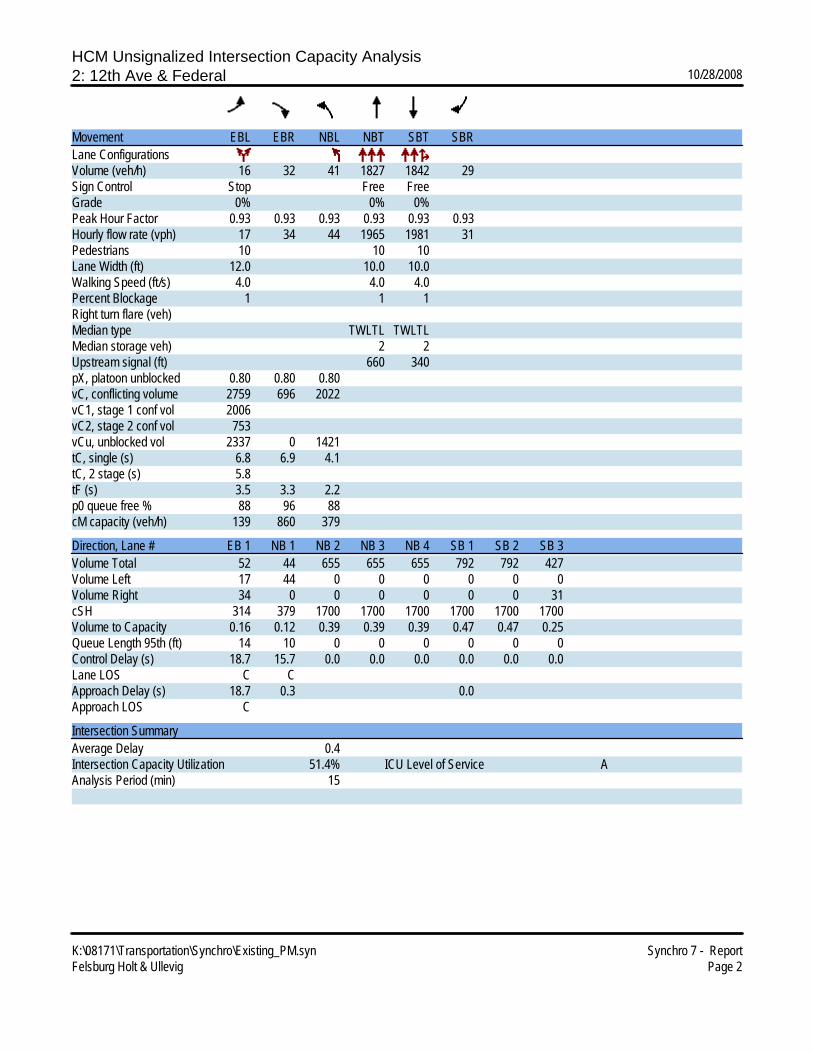
HCM Unsignalized Intersection Capacity Analysis2: 12th Ave & Federal 10/28/2008
K:\08171\Transportation\Synchro\Existing_PM.syn Synchro 7 - ReportFelsburg Holt & Ullevig Page 2
Movement EBL EBR NBL NBT SBT SBRLane ConfigurationsVolume (veh/h) 16 32 41 1827 1842 29Sign Control Stop Free FreeGrade 0% 0% 0%Peak Hour Factor 0.93 0.93 0.93 0.93 0.93 0.93Hourly flow rate (vph) 17 34 44 1965 1981 31Pedestrians 10 10 10Lane Width (ft) 12.0 10.0 10.0Walking Speed (ft/s) 4.0 4.0 4.0Percent Blockage 1 1 1Right turn flare (veh)Median type TWLTL TWLTLMedian storage veh) 2 2Upstream signal (ft) 660 340pX, platoon unblocked 0.80 0.80 0.80vC, conflicting volume 2759 696 2022vC1, stage 1 conf vol 2006vC2, stage 2 conf vol 753vCu, unblocked vol 2337 0 1421tC, single (s) 6.8 6.9 4.1tC, 2 stage (s) 5.8tF (s) 3.5 3.3 2.2p0 queue free % 88 96 88cM capacity (veh/h) 139 860 379
Direction, Lane # EB 1 NB 1 NB 2 NB 3 NB 4 SB 1 SB 2 SB 3Volume Total 52 44 655 655 655 792 792 427Volume Left 17 44 0 0 0 0 0 0Volume Right 34 0 0 0 0 0 0 31cSH 314 379 1700 1700 1700 1700 1700 1700Volume to Capacity 0.16 0.12 0.39 0.39 0.39 0.47 0.47 0.25Queue Length 95th (ft) 14 10 0 0 0 0 0 0Control Delay (s) 18.7 15.7 0.0 0.0 0.0 0.0 0.0 0.0Lane LOS C CApproach Delay (s) 18.7 0.3 0.0Approach LOS C
Intersection SummaryAverage Delay 0.4Intersection Capacity Utilization 51.4% ICU Level of Service AAnalysis Period (min) 15

HCM Unsignalized Intersection Capacity Analysis3: 11th Ave & Federal 10/28/2008
K:\08171\Transportation\Synchro\Existing_PM.syn Synchro 7 - ReportFelsburg Holt & Ullevig Page 3
Movement WBL WBR NBT NBR SBL SBTLane ConfigurationsVolume (veh/h) 6 130 1717 18 16 1844Sign Control Stop Free FreeGrade 0% 0% 0%Peak Hour Factor 0.94 0.94 0.94 0.94 0.94 0.94Hourly flow rate (vph) 6 138 1827 19 17 1962Pedestrians 10 10 10Lane Width (ft) 12.0 10.0 10.0Walking Speed (ft/s) 4.0 4.0 4.0Percent Blockage 1 1 1Right turn flare (veh)Median type TWLTL TWLTLMedian storage veh) 2 2Upstream signal (ft) 330 670pX, platoon unblocked 0.82vC, conflicting volume 2544 638 1856vC1, stage 1 conf vol 1846vC2, stage 2 conf vol 698vCu, unblocked vol 2118 638 1856tC, single (s) 6.8 6.9 4.1tC, 2 stage (s) 5.8tF (s) 3.5 3.3 2.2p0 queue free % 94 66 95cM capacity (veh/h) 106 413 320
Direction, Lane # WB 1 NB 1 NB 2 NB 3 SB 1 SB 2 SB 3 SB 4Volume Total 145 731 731 384 17 654 654 654Volume Left 6 0 0 0 17 0 0 0Volume Right 138 0 0 19 0 0 0 0cSH 366 1700 1700 1700 320 1700 1700 1700Volume to Capacity 0.40 0.43 0.43 0.23 0.05 0.38 0.38 0.38Queue Length 95th (ft) 46 0 0 0 4 0 0 0Control Delay (s) 21.1 0.0 0.0 0.0 16.9 0.0 0.0 0.0Lane LOS C CApproach Delay (s) 21.1 0.0 0.1Approach LOS C
Intersection SummaryAverage Delay 0.8Intersection Capacity Utilization 55.1% ICU Level of Service BAnalysis Period (min) 15

HCM Signalized Intersection Capacity Analysis4: 10th Ave & Federal 10/28/2008
K:\08171\Transportation\Synchro\Existing_PM.syn Synchro 7 - ReportFelsburg Holt & Ullevig Page 4
Movement EBL EBT EBR WBL WBT WBR NBL NBT NBR SBL SBT SBRLane ConfigurationsVolume (vph) 92 31 70 99 81 31 74 1573 36 25 1685 110Ideal Flow (vphpl) 1800 1800 1800 1800 1800 1800 1800 1800 1800 1800 1800 1800Lane Width 12 12 12 12 12 12 9 10 10 9 10 10Total Lost time (s) 5.0 5.0 5.0 5.0 5.0 5.0Lane Util. Factor 1.00 1.00 1.00 0.95 1.00 0.91Frpb, ped/bikes 0.99 0.99 1.00 1.00 1.00 1.00Flpb, ped/bikes 1.00 1.00 1.00 1.00 1.00 1.00Frt 0.95 0.98 1.00 1.00 1.00 0.99Flt Protected 0.98 0.98 0.95 1.00 0.95 1.00Satd. Flow (prot) 1598 1653 1478 2978 1480 4221Flt Permitted 0.70 0.72 0.09 1.00 0.10 1.00Satd. Flow (perm) 1153 1224 139 2978 150 4221Peak-hour factor, PHF 0.97 0.97 0.97 0.97 0.97 0.97 0.97 0.97 0.97 0.97 0.97 0.97Adj. Flow (vph) 95 32 72 102 84 32 76 1622 37 26 1737 113RTOR Reduction (vph) 0 21 0 0 6 0 0 2 0 0 6 0Lane Group Flow (vph) 0 178 0 0 212 0 76 1657 0 26 1844 0Confl. Peds. (#/hr) 10 10 10 10 10 10 10 10Confl. Bikes (#/hr) 5 5 5 5Heavy Vehicles (%) 2% 2% 2% 2% 2% 2% 4% 5% 4% 4% 6% 4%Bus Blockages (#/hr) 0 2 0 0 3 0 0 8 8 0 10 10Turn Type Perm Perm Perm PermProtected Phases 4 4 2 2Permitted Phases 4 4 2 2Actuated Green, G (s) 20.9 20.9 69.1 69.1 69.1 69.1Effective Green, g (s) 20.9 20.9 69.1 69.1 69.1 69.1Actuated g/C Ratio 0.21 0.21 0.69 0.69 0.69 0.69Clearance Time (s) 5.0 5.0 5.0 5.0 5.0 5.0Vehicle Extension (s) 3.0 3.0 3.0 3.0 3.0 3.0Lane Grp Cap (vph) 241 256 96 2058 104 2917v/s Ratio Prot c0.56 0.44v/s Ratio Perm 0.15 c0.17 0.55 0.17v/c Ratio 0.74 0.83 0.79 0.81 0.25 0.63Uniform Delay, d1 37.0 37.8 10.5 10.8 5.8 8.5Progression Factor 1.00 1.00 0.92 0.88 1.49 1.76Incremental Delay, d2 11.1 19.2 28.9 1.9 4.7 0.9Delay (s) 48.1 57.0 38.6 11.4 13.3 15.8Level of Service D E D B B BApproach Delay (s) 48.1 57.0 12.6 15.8Approach LOS D E B B
Intersection SummaryHCM Average Control Delay 18.2 HCM Level of Service BHCM Volume to Capacity ratio 0.81Actuated Cycle Length (s) 100.0 Sum of lost time (s) 10.0Intersection Capacity Utilization 78.5% ICU Level of Service DAnalysis Period (min) 15c Critical Lane Group
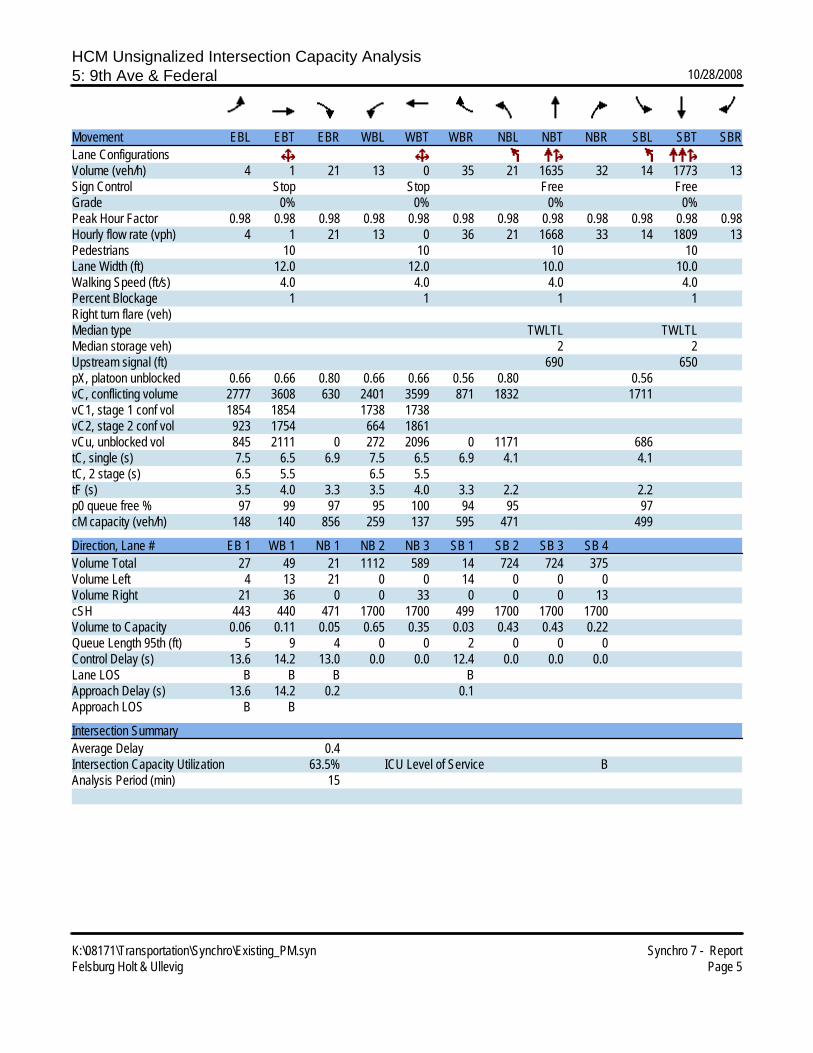
HCM Unsignalized Intersection Capacity Analysis5: 9th Ave & Federal 10/28/2008
K:\08171\Transportation\Synchro\Existing_PM.syn Synchro 7 - ReportFelsburg Holt & Ullevig Page 5
Movement EBL EBT EBR WBL WBT WBR NBL NBT NBR SBL SBT SBRLane ConfigurationsVolume (veh/h) 4 1 21 13 0 35 21 1635 32 14 1773 13Sign Control Stop Stop Free FreeGrade 0% 0% 0% 0%Peak Hour Factor 0.98 0.98 0.98 0.98 0.98 0.98 0.98 0.98 0.98 0.98 0.98 0.98Hourly flow rate (vph) 4 1 21 13 0 36 21 1668 33 14 1809 13Pedestrians 10 10 10 10Lane Width (ft) 12.0 12.0 10.0 10.0Walking Speed (ft/s) 4.0 4.0 4.0 4.0Percent Blockage 1 1 1 1Right turn flare (veh)Median type TWLTL TWLTLMedian storage veh) 2 2Upstream signal (ft) 690 650pX, platoon unblocked 0.66 0.66 0.80 0.66 0.66 0.56 0.80 0.56vC, conflicting volume 2777 3608 630 2401 3599 871 1832 1711vC1, stage 1 conf vol 1854 1854 1738 1738vC2, stage 2 conf vol 923 1754 664 1861vCu, unblocked vol 845 2111 0 272 2096 0 1171 686tC, single (s) 7.5 6.5 6.9 7.5 6.5 6.9 4.1 4.1tC, 2 stage (s) 6.5 5.5 6.5 5.5tF (s) 3.5 4.0 3.3 3.5 4.0 3.3 2.2 2.2p0 queue free % 97 99 97 95 100 94 95 97cM capacity (veh/h) 148 140 856 259 137 595 471 499
Direction, Lane # EB 1 WB 1 NB 1 NB 2 NB 3 SB 1 SB 2 SB 3 SB 4Volume Total 27 49 21 1112 589 14 724 724 375Volume Left 4 13 21 0 0 14 0 0 0Volume Right 21 36 0 0 33 0 0 0 13cSH 443 440 471 1700 1700 499 1700 1700 1700Volume to Capacity 0.06 0.11 0.05 0.65 0.35 0.03 0.43 0.43 0.22Queue Length 95th (ft) 5 9 4 0 0 2 0 0 0Control Delay (s) 13.6 14.2 13.0 0.0 0.0 12.4 0.0 0.0 0.0Lane LOS B B B BApproach Delay (s) 13.6 14.2 0.2 0.1Approach LOS B B
Intersection SummaryAverage Delay 0.4Intersection Capacity Utilization 63.5% ICU Level of Service BAnalysis Period (min) 15

HCM Signalized Intersection Capacity Analysis7: 8th Ave & Federal 10/28/2008
K:\08171\Transportation\Synchro\Existing_PM.syn Synchro 7 - ReportFelsburg Holt & Ullevig Page 6
Movement EBL EBT EBR WBL WBT WBR NBL NBT NBR SBL SBT SBRLane ConfigurationsVolume (vph) 53 70 41 449 436 156 45 1462 80 30 1564 105Ideal Flow (vphpl) 1800 1800 1800 1800 1800 1800 1800 1800 1800 1800 1800 1800Lane Width 10 10 10 10 10 10 9 10 10 9 10 10Total Lost time (s) 5.0 5.0 5.0 5.0 5.0 5.0 5.0 5.0Lane Util. Factor 1.00 0.95 0.97 0.95 1.00 0.95 1.00 0.91Frpb, ped/bikes 1.00 0.99 1.00 0.99 1.00 1.00 1.00 1.00Flpb, ped/bikes 1.00 1.00 1.00 1.00 1.00 1.00 1.00 1.00Frt 1.00 0.94 1.00 0.96 1.00 0.99 1.00 0.99Flt Protected 0.95 1.00 0.95 1.00 0.95 1.00 0.95 1.00Satd. Flow (prot) 1565 2915 3036 2978 1480 2977 1480 4248Flt Permitted 0.95 1.00 0.95 1.00 0.09 1.00 0.08 1.00Satd. Flow (perm) 1565 2915 3036 2978 146 2977 124 4248Peak-hour factor, PHF 0.98 0.98 0.98 0.98 0.98 0.98 0.98 0.98 0.98 0.98 0.98 0.98Adj. Flow (vph) 54 71 42 458 445 159 46 1492 82 31 1596 107RTOR Reduction (vph) 0 18 0 0 36 0 0 4 0 0 7 0Lane Group Flow (vph) 54 95 0 458 568 0 46 1570 0 31 1696 0Confl. Peds. (#/hr) 10 10 10 10 10 10 10 10Confl. Bikes (#/hr) 5 5 5 5Heavy Vehicles (%) 2% 2% 2% 2% 2% 2% 4% 5% 4% 4% 6% 4%Bus Blockages (#/hr) 0 0 0 0 0 0 0 6 6 0 6 6Turn Type Prot Prot Perm PermProtected Phases 3 8 7 4 6 2Permitted Phases 6 2Actuated Green, G (s) 5.6 18.8 7.0 20.2 59.2 59.2 59.2 59.2Effective Green, g (s) 5.6 18.8 7.0 20.2 59.2 59.2 59.2 59.2Actuated g/C Ratio 0.06 0.19 0.07 0.20 0.59 0.59 0.59 0.59Clearance Time (s) 5.0 5.0 5.0 5.0 5.0 5.0 5.0 5.0Vehicle Extension (s) 3.0 3.0 3.0 3.0 3.0 3.0 3.0 3.0Lane Grp Cap (vph) 88 548 213 602 86 1762 73 2515v/s Ratio Prot 0.03 0.03 c0.15 c0.19 c0.53 0.40v/s Ratio Perm 0.31 0.25v/c Ratio 0.61 0.17 2.15 0.94 0.53 0.89 0.42 0.67Uniform Delay, d1 46.1 34.1 46.5 39.3 12.2 17.6 11.1 13.9Progression Factor 1.00 1.00 1.00 1.00 1.48 1.61 0.62 0.52Incremental Delay, d2 12.0 0.2 532.9 23.5 16.7 5.6 13.5 1.1Delay (s) 58.2 34.2 579.4 62.8 34.7 34.0 20.4 8.3Level of Service E C F E C C C AApproach Delay (s) 42.0 285.6 34.1 8.5Approach LOS D F C A
Intersection SummaryHCM Average Control Delay 83.0 HCM Level of Service FHCM Volume to Capacity ratio 0.97Actuated Cycle Length (s) 100.0 Sum of lost time (s) 10.0Intersection Capacity Utilization 79.5% ICU Level of Service DAnalysis Period (min) 15c Critical Lane Group

HCM Unsignalized Intersection Capacity Analysis8: Severn Pl & Federal 10/28/2008
K:\08171\Transportation\Synchro\Existing_PM.syn Synchro 7 - ReportFelsburg Holt & Ullevig Page 7
Movement WBL WBR NBT NBR SBL SBTLane ConfigurationsVolume (veh/h) 2 22 1572 5 2 2064Sign Control Stop Free FreeGrade 0% 0% 0%Peak Hour Factor 0.98 0.98 0.98 0.98 0.98 0.98Hourly flow rate (vph) 2 22 1604 5 2 2106Pedestrians 10 10 10Lane Width (ft) 9.0 10.0 10.0Walking Speed (ft/s) 4.0 4.0 4.0Percent Blockage 1 1 1Right turn flare (veh)Median type TWLTL TWLTLMedian storage veh) 2 2Upstream signal (ft) 890 340pX, platoon unblocked 0.84 0.71 0.71vC, conflicting volume 2333 825 1619vC1, stage 1 conf vol 1617vC2, stage 2 conf vol 716vCu, unblocked vol 394 0 1065tC, single (s) 6.8 6.9 4.1tC, 2 stage (s) 5.8tF (s) 3.5 3.3 2.2p0 queue free % 100 97 100cM capacity (veh/h) 470 763 461
Direction, Lane # WB 1 NB 1 NB 2 SB 1 SB 2 SB 3 SB 4Volume Total 24 1069 540 2 702 702 702Volume Left 2 0 0 2 0 0 0Volume Right 22 0 5 0 0 0 0cSH 726 1700 1700 461 1700 1700 1700Volume to Capacity 0.03 0.63 0.32 0.00 0.41 0.41 0.41Queue Length 95th (ft) 3 0 0 0 0 0 0Control Delay (s) 10.1 0.0 0.0 12.8 0.0 0.0 0.0Lane LOS B BApproach Delay (s) 10.1 0.0 0.0Approach LOS B
Intersection SummaryAverage Delay 0.1Intersection Capacity Utilization 58.9% ICU Level of Service BAnalysis Period (min) 15

HCM Unsignalized Intersection Capacity Analysis9: 7th Ave & Federal 10/28/2008
K:\08171\Transportation\Synchro\Existing_PM.syn Synchro 7 - ReportFelsburg Holt & Ullevig Page 8
Movement WBL WBR NBT NBR SBL SBTLane ConfigurationsVolume (veh/h) 32 66 1518 23 16 2062Sign Control Stop Free FreeGrade 0% 0% 0%Peak Hour Factor 0.98 0.98 0.98 0.98 0.98 0.98Hourly flow rate (vph) 33 67 1549 23 16 2104Pedestrians 10 10 10Lane Width (ft) 12.0 10.0 10.0Walking Speed (ft/s) 4.0 4.0 4.0Percent Blockage 1 1 1Right turn flare (veh)Median type TWLTL TWLTLMedian storage veh) 2 2Upstream signal (ft) 570 660pX, platoon unblocked 0.82 0.70 0.70vC, conflicting volume 2315 806 1582vC1, stage 1 conf vol 1571vC2, stage 2 conf vol 744vCu, unblocked vol 432 0 987tC, single (s) 6.8 6.9 4.1tC, 2 stage (s) 5.8tF (s) 3.5 3.3 2.2p0 queue free % 90 91 97cM capacity (veh/h) 330 752 486
Direction, Lane # WB 1 NB 1 NB 2 SB 1 SB 2 SB 3 SB 4Volume Total 100 1033 540 16 701 701 701Volume Left 33 0 0 16 0 0 0Volume Right 67 0 23 0 0 0 0cSH 531 1700 1700 486 1700 1700 1700Volume to Capacity 0.19 0.61 0.32 0.03 0.41 0.41 0.41Queue Length 95th (ft) 17 0 0 3 0 0 0Control Delay (s) 13.4 0.0 0.0 12.7 0.0 0.0 0.0Lane LOS B BApproach Delay (s) 13.4 0.0 0.1Approach LOS B
Intersection SummaryAverage Delay 0.4Intersection Capacity Utilization 60.4% ICU Level of Service BAnalysis Period (min) 15

HCM Signalized Intersection Capacity Analysis10: WB 6th Ave Ramp & Federal 10/28/2008
K:\08171\Transportation\Synchro\Existing_PM.syn Synchro 7 - ReportFelsburg Holt & Ullevig Page 9
Movement EBL EBT EBR WBL WBT WBR NBL NBT NBR SBL SBT SBRLane ConfigurationsVolume (vph) 0 0 0 289 181 114 211 1434 0 0 1733 374Ideal Flow (vphpl) 1800 1800 1800 1800 1800 1800 1800 1800 1800 1800 1800 1800Lane Width 10 10 10 9 9 9 9 9 9 10 10 10Total Lost time (s) 5.0 5.0 5.0 5.0 5.0 5.0 4.0Lane Util. Factor 0.95 0.95 1.00 1.00 0.95 0.91 1.00Frpb, ped/bikes 1.00 1.00 0.96 1.00 1.00 1.00 0.98Flpb, ped/bikes 0.98 1.00 1.00 1.00 1.00 1.00 1.00Frt 1.00 1.00 0.85 1.00 1.00 1.00 0.85Flt Protected 0.95 0.99 1.00 0.95 1.00 1.00 1.00Satd. Flow (prot) 1379 1456 1246 1480 2896 4327 1351Flt Permitted 0.95 0.99 1.00 0.09 1.00 1.00 1.00Satd. Flow (perm) 1379 1456 1246 137 2896 4327 1351Peak-hour factor, PHF 0.98 0.98 0.98 0.98 0.98 0.98 0.98 0.98 0.98 0.98 0.98 0.98Adj. Flow (vph) 0 0 0 295 185 116 215 1463 0 0 1768 382RTOR Reduction (vph) 0 0 0 0 0 50 0 0 0 0 0 0Lane Group Flow (vph) 0 0 0 236 244 66 215 1463 0 0 1768 382Confl. Peds. (#/hr) 10 10 10 10 10 10 10 10Confl. Bikes (#/hr) 5 5 5 5Heavy Vehicles (%) 2% 2% 2% 4% 4% 4% 4% 5% 2% 2% 6% 4%Bus Blockages (#/hr) 0 0 0 0 0 6 0 6 0 0 0 0Turn Type Perm Perm pm+pt FreeProtected Phases 4 1 6 2Permitted Phases 4 4 6 FreeActuated Green, G (s) 19.7 19.7 19.7 70.3 70.3 59.3 100.0Effective Green, g (s) 19.7 19.7 19.7 70.3 70.3 59.3 100.0Actuated g/C Ratio 0.20 0.20 0.20 0.70 0.70 0.59 1.00Clearance Time (s) 5.0 5.0 5.0 5.0 5.0 5.0Vehicle Extension (s) 3.0 3.0 3.0 3.0 3.0 3.0Lane Grp Cap (vph) 272 287 245 177 2036 2566 1351v/s Ratio Prot c0.07 0.51 0.41v/s Ratio Perm c0.17 0.17 0.05 c0.78 0.28v/c Ratio 0.87 0.85 0.27 1.21 0.72 0.69 0.28Uniform Delay, d1 38.9 38.7 34.1 23.9 8.9 14.0 0.0Progression Factor 1.00 1.00 1.00 0.82 0.47 0.39 1.00Incremental Delay, d2 24.0 20.7 0.6 127.5 1.6 0.5 0.2Delay (s) 62.9 59.4 34.7 147.1 5.8 6.0 0.2Level of Service E E C F A A AApproach Delay (s) 0.0 56.0 23.9 4.9Approach LOS A E C A
Intersection SummaryHCM Average Control Delay 19.0 HCM Level of Service BHCM Volume to Capacity ratio 1.11Actuated Cycle Length (s) 100.0 Sum of lost time (s) 10.0Intersection Capacity Utilization 73.7% ICU Level of Service DAnalysis Period (min) 15c Critical Lane Group

HCM Signalized Intersection Capacity Analysis11: EB 6th Ave Ramp & Federal 10/28/2008
K:\08171\Transportation\Synchro\Existing_PM.syn Synchro 7 - ReportFelsburg Holt & Ullevig Page 10
Movement EBL EBR NBL NBT SBT SBRLane ConfigurationsVolume (vph) 176 250 0 1447 2013 0Ideal Flow (vphpl) 1800 1800 1800 1800 1800 1800Lane Width 12 12 10 10 9 9Total Lost time (s) 5.0 5.0 5.0Lane Util. Factor 0.97 0.95 0.91Frpb, ped/bikes 0.98 1.00 1.00Flpb, ped/bikes 1.00 1.00 1.00Frt 0.91 1.00 1.00Flt Protected 0.98 1.00 1.00Satd. Flow (prot) 2936 3004 4172Flt Permitted 0.98 1.00 1.00Satd. Flow (perm) 2936 3004 4172Peak-hour factor, PHF 0.97 0.97 0.97 0.97 0.97 0.97Adj. Flow (vph) 181 258 0 1492 2075 0RTOR Reduction (vph) 15 0 0 0 0 0Lane Group Flow (vph) 424 0 0 1492 2075 0Confl. Peds. (#/hr) 10 10 10 10Confl. Bikes (#/hr) 5 5Heavy Vehicles (%) 4% 4% 2% 5% 6% 2%Bus Blockages (#/hr) 0 0 0 6 0 0Turn TypeProtected Phases 4 2 2Permitted PhasesActuated Green, G (s) 18.2 71.8 71.8Effective Green, g (s) 18.2 71.8 71.8Actuated g/C Ratio 0.18 0.72 0.72Clearance Time (s) 5.0 5.0 5.0Vehicle Extension (s) 3.0 3.0 3.0Lane Grp Cap (vph) 534 2157 2995v/s Ratio Prot c0.14 0.50 c0.50v/s Ratio Permv/c Ratio 0.92dr 0.69 0.69Uniform Delay, d1 39.1 7.9 7.9Progression Factor 1.00 1.00 0.67Incremental Delay, d2 8.0 1.8 0.9Delay (s) 47.1 9.7 6.3Level of Service D A AApproach Delay (s) 47.1 9.7 6.3Approach LOS D A A
Intersection SummaryHCM Average Control Delay 12.0 HCM Level of Service BHCM Volume to Capacity ratio 0.71Actuated Cycle Length (s) 100.0 Sum of lost time (s) 10.0Intersection Capacity Utilization 73.7% ICU Level of Service DAnalysis Period (min) 15dr Defacto Right Lane. Recode with 1 though lane as a right lane.c Critical Lane Group

FFEELLSSBBUURRGG HHOOLLTT && UULLLLEEVVIIGG Appendix C
Traffic Report
Appendix C
Year 2035 No-Action System Alternative Level of Service Worksheets


HCM Signalized Intersection Capacity Analysis1: Holden Pl & Federal 11/10/2008
K:\08171\Transportation\Traffic Study\Synchro\2035_AM.syn Synchro 7 - ReportFelsburg Holt & Ullevig Page 1
Movement WBL WBR NBT NBR SBL SBTLane ConfigurationsVolume (vph) 11 43 1586 68 193 1944Ideal Flow (vphpl) 1800 1800 1800 1800 1800 1800Lane Width 11 11 10 10 9 10Total Lost time (s) 5.0 5.0 5.0 5.0 5.0Lane Util. Factor 1.00 0.95 1.00 1.00 0.91Frpb, ped/bikes 0.96 1.00 0.95 1.00 1.00Flpb, ped/bikes 1.00 1.00 1.00 1.00 1.00Frt 0.89 1.00 0.85 1.00 1.00Flt Protected 0.99 1.00 1.00 0.95 1.00Satd. Flow (prot) 1448 3040 1326 1506 4275Flt Permitted 0.99 1.00 1.00 0.13 1.00Satd. Flow (perm) 1448 3040 1326 207 4275Peak-hour factor, PHF 0.96 0.96 0.96 0.96 0.96 0.96Adj. Flow (vph) 11 45 1652 71 201 2025RTOR Reduction (vph) 42 0 0 11 0 0Lane Group Flow (vph) 14 0 1652 60 201 2025Confl. Peds. (#/hr) 10 10 10 10Confl. Bikes (#/hr) 5 5Heavy Vehicles (%) 2% 2% 5% 2% 2% 6%Bus Blockages (#/hr) 0 0 0 0 0 9Turn Type Perm PermProtected Phases 4 2 2Permitted Phases 2 2Actuated Green, G (s) 6.0 84.0 84.0 84.0 84.0Effective Green, g (s) 6.0 84.0 84.0 84.0 84.0Actuated g/C Ratio 0.06 0.84 0.84 0.84 0.84Clearance Time (s) 5.0 5.0 5.0 5.0 5.0Vehicle Extension (s) 3.0 3.0 3.0 3.0 3.0Lane Grp Cap (vph) 87 2554 1114 174 3591v/s Ratio Prot c0.01 0.54 0.47v/s Ratio Perm 0.04 c0.97v/c Ratio 0.16 0.65 0.05 1.16 0.56Uniform Delay, d1 44.6 2.8 1.3 8.0 2.4Progression Factor 1.00 0.09 0.00 1.00 1.00Incremental Delay, d2 0.8 0.4 0.0 116.1 0.6Delay (s) 45.5 0.7 0.0 124.1 3.1Level of Service D A A F AApproach Delay (s) 45.5 0.7 14.0Approach LOS D A B
Intersection SummaryHCM Average Control Delay 8.7 HCM Level of Service AHCM Volume to Capacity ratio 1.09Actuated Cycle Length (s) 100.0 Sum of lost time (s) 10.0Intersection Capacity Utilization 76.9% ICU Level of Service DAnalysis Period (min) 15c Critical Lane Group

HCM Unsignalized Intersection Capacity Analysis2: 12th Ave & Federal 11/10/2008
K:\08171\Transportation\Traffic Study\Synchro\2035_AM.syn Synchro 7 - ReportFelsburg Holt & Ullevig Page 2
Movement EBL EBR NBL NBT SBT SBRLane ConfigurationsVolume (veh/h) 16 21 18 1603 1978 8Sign Control Stop Free FreeGrade 0% 0% 0%Peak Hour Factor 0.91 0.91 0.91 0.91 0.91 0.91Hourly flow rate (vph) 18 23 20 1762 2174 9Pedestrians 10 10 10Lane Width (ft) 12.0 10.0 10.0Walking Speed (ft/s) 4.0 4.0 4.0Percent Blockage 1 1 1Right turn flare (veh)Median type TWLTL TWLTLMedian storage veh) 2 2Upstream signal (ft) 660 340pX, platoon unblocked 0.86 0.86 0.86vC, conflicting volume 2825 749 2192vC1, stage 1 conf vol 2188vC2, stage 2 conf vol 637vCu, unblocked vol 2561 159 1830tC, single (s) 6.8 6.9 4.1tC, 2 stage (s) 5.8tF (s) 3.5 3.3 2.2p0 queue free % 81 97 93cM capacity (veh/h) 93 730 283
Direction, Lane # EB 1 NB 1 NB 2 NB 3 NB 4 SB 1 SB 2 SB 3Volume Total 41 20 587 587 587 869 869 444Volume Left 18 20 0 0 0 0 0 0Volume Right 23 0 0 0 0 0 0 9cSH 184 283 1700 1700 1700 1700 1700 1700Volume to Capacity 0.22 0.07 0.35 0.35 0.35 0.51 0.51 0.26Queue Length 95th (ft) 20 6 0 0 0 0 0 0Control Delay (s) 30.0 18.7 0.0 0.0 0.0 0.0 0.0 0.0Lane LOS D CApproach Delay (s) 30.0 0.2 0.0Approach LOS D
Intersection SummaryAverage Delay 0.4Intersection Capacity Utilization 53.4% ICU Level of Service AAnalysis Period (min) 15

HCM Unsignalized Intersection Capacity Analysis3: 11th Ave & Federal 11/10/2008
K:\08171\Transportation\Traffic Study\Synchro\2035_AM.syn Synchro 7 - ReportFelsburg Holt & Ullevig Page 3
Movement WBL WBR NBT NBR SBL SBTLane ConfigurationsVolume (veh/h) 5 38 1593 246 200 1750Sign Control Stop Free FreeGrade 0% 0% 0%Peak Hour Factor 0.97 0.97 0.97 0.97 0.97 0.97Hourly flow rate (vph) 5 39 1642 254 206 1804Pedestrians 10 10 10Lane Width (ft) 12.0 10.0 10.0Walking Speed (ft/s) 4.0 4.0 4.0Percent Blockage 1 1 1Right turn flare (veh)Median type TWLTL TWLTLMedian storage veh) 2 2Upstream signal (ft) 330 670pX, platoon unblocked 0.92vC, conflicting volume 2803 694 1906vC1, stage 1 conf vol 1779vC2, stage 2 conf vol 1024vCu, unblocked vol 2657 694 1906tC, single (s) 6.8 6.9 4.1tC, 2 stage (s) 5.8tF (s) 3.5 3.3 2.2p0 queue free % 94 90 32cM capacity (veh/h) 83 379 305
Direction, Lane # WB 1 NB 1 NB 2 NB 3 SB 1 SB 2 SB 3 SB 4Volume Total 44 657 657 582 206 601 601 601Volume Left 5 0 0 0 206 0 0 0Volume Right 39 0 0 254 0 0 0 0cSH 268 1700 1700 1700 305 1700 1700 1700Volume to Capacity 0.17 0.39 0.39 0.34 0.68 0.35 0.35 0.35Queue Length 95th (ft) 15 0 0 0 114 0 0 0Control Delay (s) 21.1 0.0 0.0 0.0 38.1 0.0 0.0 0.0Lane LOS C EApproach Delay (s) 21.1 0.0 3.9Approach LOS C
Intersection SummaryAverage Delay 2.2Intersection Capacity Utilization 66.5% ICU Level of Service CAnalysis Period (min) 15

HCM Signalized Intersection Capacity Analysis4: 10th Ave & Federal 11/10/2008
K:\08171\Transportation\Traffic Study\Synchro\2035_AM.syn Synchro 7 - ReportFelsburg Holt & Ullevig Page 4
Movement EBL EBT EBR WBL WBT WBR NBL NBT NBR SBL SBT SBRLane ConfigurationsVolume (vph) 154 96 63 37 24 32 81 1751 74 34 1707 35Ideal Flow (vphpl) 1800 1800 1800 1800 1800 1800 1800 1800 1800 1800 1800 1800Lane Width 12 12 12 12 12 12 9 10 10 9 10 10Total Lost time (s) 5.0 5.0 5.0 5.0 5.0 5.0Lane Util. Factor 1.00 1.00 1.00 0.95 1.00 0.91Frpb, ped/bikes 0.99 0.99 1.00 1.00 1.00 1.00Flpb, ped/bikes 0.99 1.00 1.00 1.00 1.00 1.00Frt 0.97 0.95 1.00 0.99 1.00 1.00Flt Protected 0.98 0.98 0.95 1.00 0.95 1.00Satd. Flow (prot) 1625 1606 1480 2950 1480 4265Flt Permitted 0.80 0.77 0.07 1.00 0.07 1.00Satd. Flow (perm) 1334 1262 115 2950 115 4265Peak-hour factor, PHF 0.95 0.95 0.95 0.95 0.95 0.95 0.95 0.95 0.95 0.95 0.95 0.95Adj. Flow (vph) 162 101 66 39 25 34 85 1843 78 36 1797 37RTOR Reduction (vph) 0 9 0 0 20 0 0 3 0 0 2 0Lane Group Flow (vph) 0 320 0 0 79 0 85 1918 0 36 1832 0Confl. Peds. (#/hr) 10 10 10 10 10 10 10 10Confl. Bikes (#/hr) 5 5 5 5Heavy Vehicles (%) 2% 2% 2% 2% 2% 2% 4% 5% 4% 4% 6% 4%Bus Blockages (#/hr) 4 4 4 3 3 3 0 11 11 0 8 8Turn Type Perm Perm pm+pt pm+ptProtected Phases 4 4 5 2 1 6Permitted Phases 4 4 2 6Actuated Green, G (s) 22.0 22.0 60.6 60.6 56.5 56.5Effective Green, g (s) 22.0 22.0 60.6 60.6 56.5 56.5Actuated g/C Ratio 0.22 0.22 0.61 0.61 0.56 0.56Clearance Time (s) 5.0 5.0 5.0 5.0 5.0 5.0Vehicle Extension (s) 3.0 3.0 3.0 3.0 3.0 3.0Lane Grp Cap (vph) 293 278 158 1788 98 2410v/s Ratio Prot 0.03 c0.65 0.01 c0.43v/s Ratio Perm c0.24 0.06 0.29 0.20v/c Ratio 1.09 0.28 0.54 1.07 0.37 0.76Uniform Delay, d1 39.0 32.4 13.7 19.7 34.0 16.6Progression Factor 1.00 1.00 1.40 0.50 0.85 0.86Incremental Delay, d2 79.1 0.6 0.3 34.1 2.1 2.1Delay (s) 118.1 33.0 19.5 43.9 31.1 16.3Level of Service F C B D C BApproach Delay (s) 118.1 33.0 42.9 16.6Approach LOS F C D B
Intersection SummaryHCM Average Control Delay 37.0 HCM Level of Service DHCM Volume to Capacity ratio 1.03Actuated Cycle Length (s) 100.0 Sum of lost time (s) 10.0Intersection Capacity Utilization 94.7% ICU Level of Service FAnalysis Period (min) 15c Critical Lane Group

HCM Unsignalized Intersection Capacity Analysis5: 9th Ave & Federal 11/10/2008
K:\08171\Transportation\Traffic Study\Synchro\2035_AM.syn Synchro 7 - ReportFelsburg Holt & Ullevig Page 5
Movement EBL EBT EBR WBL WBT WBR NBL NBT NBR SBL SBT SBRLane ConfigurationsVolume (veh/h) 3 5 56 4 1 16 20 1831 58 28 1821 10Sign Control Stop Stop Free FreeGrade 0% 0% 0% 0%Peak Hour Factor 0.94 0.94 0.94 0.94 0.94 0.94 0.94 0.94 0.94 0.94 0.94 0.94Hourly flow rate (vph) 3 5 60 4 1 17 21 1948 62 30 1937 11Pedestrians 10 10 10 10Lane Width (ft) 12.0 12.0 10.0 10.0Walking Speed (ft/s) 4.0 4.0 4.0 4.0Percent Blockage 1 1 1 1Right turn flare (veh)Median type TWLTL TWLTLMedian storage veh) 2 2Upstream signal (ft) 690 650pX, platoon unblocked 0.70 0.70 0.70 0.70 0.70 0.55 0.70 0.55vC, conflicting volume 3056 4074 671 2809 4049 1025 1958 2020vC1, stage 1 conf vol 2012 2012 2031 2031vC2, stage 2 conf vol 1044 2062 778 2017vCu, unblocked vol 488 1938 0 136 1902 0 851 1219tC, single (s) 7.5 6.5 6.9 7.5 6.5 6.9 4.1 4.1tC, 2 stage (s) 6.5 5.5 6.5 5.5tF (s) 3.5 4.0 3.3 3.5 4.0 3.3 2.2 2.2p0 queue free % 98 94 92 99 99 97 96 90cM capacity (veh/h) 199 86 744 525 111 588 541 310
Direction, Lane # EB 1 WB 1 NB 1 NB 2 NB 3 SB 1 SB 2 SB 3 SB 4Volume Total 68 22 21 1299 711 30 775 775 398Volume Left 3 4 21 0 0 30 0 0 0Volume Right 60 17 0 0 62 0 0 0 11cSH 430 479 541 1700 1700 310 1700 1700 1700Volume to Capacity 0.16 0.05 0.04 0.76 0.42 0.10 0.46 0.46 0.23Queue Length 95th (ft) 14 4 3 0 0 8 0 0 0Control Delay (s) 14.9 12.9 11.9 0.0 0.0 17.8 0.0 0.0 0.0Lane LOS B B B CApproach Delay (s) 14.9 12.9 0.1 0.3Approach LOS B B
Intersection SummaryAverage Delay 0.5Intersection Capacity Utilization 69.6% ICU Level of Service CAnalysis Period (min) 15

HCM Signalized Intersection Capacity Analysis7: 8th Ave & Federal 11/10/2008
K:\08171\Transportation\Traffic Study\Synchro\2035_AM.syn Synchro 7 - ReportFelsburg Holt & Ullevig Page 6
Movement EBL EBT EBR WBL WBT WBR NBL NBT NBR SBL SBT SBRLane ConfigurationsVolume (vph) 133 363 27 191 159 103 29 1549 280 117 1621 41Ideal Flow (vphpl) 1800 1800 1800 1800 1800 1800 1800 1800 1800 1800 1800 1800Lane Width 10 10 10 10 10 10 9 10 10 9 10 10Total Lost time (s) 5.0 5.0 5.0 5.0 5.0 5.0 5.0 5.0Lane Util. Factor 1.00 0.95 0.97 0.95 1.00 0.95 1.00 0.91Frpb, ped/bikes 1.00 1.00 1.00 0.98 1.00 1.00 1.00 1.00Flpb, ped/bikes 1.00 1.00 1.00 1.00 1.00 1.00 1.00 1.00Frt 1.00 0.99 1.00 0.94 1.00 0.98 1.00 1.00Flt Protected 0.95 1.00 0.95 1.00 0.95 1.00 0.95 1.00Satd. Flow (prot) 1565 3088 3036 2899 1480 2924 1480 4275Flt Permitted 0.95 1.00 0.95 1.00 0.95 1.00 0.95 1.00Satd. Flow (perm) 1565 3088 3036 2899 1480 2924 1480 4275Peak-hour factor, PHF 0.93 0.93 0.93 0.93 0.93 0.93 0.93 0.93 0.93 0.93 0.93 0.93Adj. Flow (vph) 143 390 29 205 171 111 31 1666 301 126 1743 44RTOR Reduction (vph) 0 5 0 0 98 0 0 15 0 0 2 0Lane Group Flow (vph) 143 414 0 205 184 0 31 1952 0 126 1785 0Confl. Peds. (#/hr) 10 10 10 10 10 10 10 10Confl. Bikes (#/hr) 5 5 5 5Heavy Vehicles (%) 2% 2% 2% 2% 2% 2% 4% 5% 4% 4% 6% 4%Bus Blockages (#/hr) 0 0 0 0 0 0 0 6 6 0 6 6Turn Type Prot Prot Prot ProtProtected Phases 3 8 7 4 1 6 5 2Permitted PhasesActuated Green, G (s) 9.0 9.0 12.1 12.1 2.4 48.0 10.9 56.5Effective Green, g (s) 9.0 9.0 12.1 12.1 2.4 48.0 10.9 56.5Actuated g/C Ratio 0.09 0.09 0.12 0.12 0.02 0.48 0.11 0.56Clearance Time (s) 5.0 5.0 5.0 5.0 5.0 5.0 5.0 5.0Vehicle Extension (s) 3.0 3.0 3.0 3.0 3.0 3.0 3.0 3.0Lane Grp Cap (vph) 141 278 367 351 36 1404 161 2415v/s Ratio Prot 0.09 c0.13 c0.07 0.06 0.02 c0.67 0.09 c0.42v/s Ratio Permv/c Ratio 1.01 1.49 0.56 0.53 0.86 1.39 0.78 0.74Uniform Delay, d1 45.5 45.5 41.4 41.3 48.6 26.0 43.4 16.2Progression Factor 1.00 1.00 1.00 1.00 1.09 1.15 0.90 0.87Incremental Delay, d2 79.6 237.6 1.8 1.4 54.0 177.7 15.9 1.5Delay (s) 125.1 283.1 43.3 42.7 107.0 207.5 54.7 15.6Level of Service F F D D F F D BApproach Delay (s) 242.9 42.9 205.9 18.2Approach LOS F D F B
Intersection SummaryHCM Average Control Delay 121.7 HCM Level of Service FHCM Volume to Capacity ratio 1.21Actuated Cycle Length (s) 100.0 Sum of lost time (s) 20.0Intersection Capacity Utilization 96.1% ICU Level of Service FAnalysis Period (min) 15c Critical Lane Group

HCM Unsignalized Intersection Capacity Analysis8: Severn Pl & Federal 11/10/2008
K:\08171\Transportation\Traffic Study\Synchro\2035_AM.syn Synchro 7 - ReportFelsburg Holt & Ullevig Page 7
Movement WBL WBR NBT NBR SBL SBTLane ConfigurationsVolume (veh/h) 1 7 1864 1 1 1839Sign Control Stop Free FreeGrade 0% 0% 0%Peak Hour Factor 0.92 0.92 0.92 0.92 0.92 0.92Hourly flow rate (vph) 1 8 2026 1 1 1999Pedestrians 10 10 10Lane Width (ft) 9.0 10.0 10.0Walking Speed (ft/s) 4.0 4.0 4.0Percent Blockage 1 1 1Right turn flare (veh)Median type TWLTL TWLTLMedian storage veh) 2 2Upstream signal (ft) 890 340pX, platoon unblocked 0.58 0.43 0.43vC, conflicting volume 2715 1034 2037vC1, stage 1 conf vol 2037vC2, stage 2 conf vol 678vCu, unblocked vol 0 0 773tC, single (s) 6.8 6.9 4.1tC, 2 stage (s) 5.8tF (s) 3.5 3.3 2.2p0 queue free % 100 98 100cM capacity (veh/h) 678 463 360
Direction, Lane # WB 1 NB 1 NB 2 SB 1 SB 2 SB 3 SB 4Volume Total 9 1351 676 1 666 666 666Volume Left 1 0 0 1 0 0 0Volume Right 8 0 1 0 0 0 0cSH 482 1700 1700 360 1700 1700 1700Volume to Capacity 0.02 0.79 0.40 0.00 0.39 0.39 0.39Queue Length 95th (ft) 1 0 0 0 0 0 0Control Delay (s) 12.6 0.0 0.0 15.0 0.0 0.0 0.0Lane LOS B CApproach Delay (s) 12.6 0.0 0.0Approach LOS B
Intersection SummaryAverage Delay 0.0Intersection Capacity Utilization 67.3% ICU Level of Service CAnalysis Period (min) 15
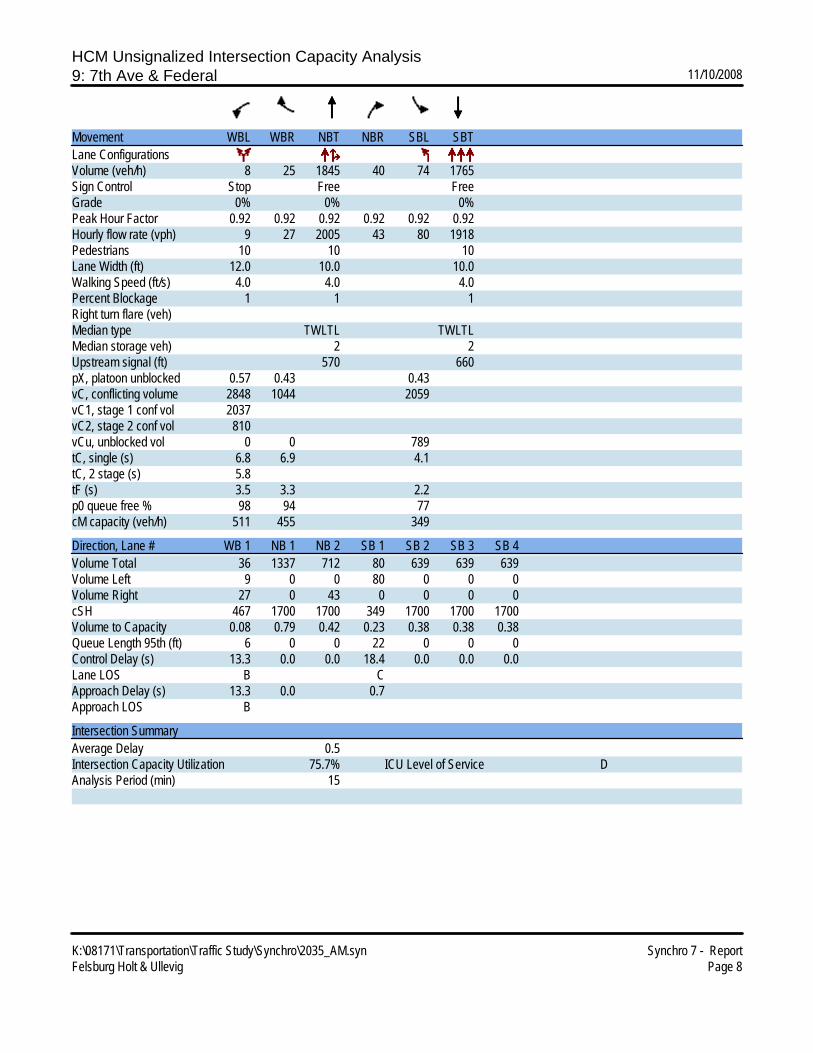
HCM Unsignalized Intersection Capacity Analysis9: 7th Ave & Federal 11/10/2008
K:\08171\Transportation\Traffic Study\Synchro\2035_AM.syn Synchro 7 - ReportFelsburg Holt & Ullevig Page 8
Movement WBL WBR NBT NBR SBL SBTLane ConfigurationsVolume (veh/h) 8 25 1845 40 74 1765Sign Control Stop Free FreeGrade 0% 0% 0%Peak Hour Factor 0.92 0.92 0.92 0.92 0.92 0.92Hourly flow rate (vph) 9 27 2005 43 80 1918Pedestrians 10 10 10Lane Width (ft) 12.0 10.0 10.0Walking Speed (ft/s) 4.0 4.0 4.0Percent Blockage 1 1 1Right turn flare (veh)Median type TWLTL TWLTLMedian storage veh) 2 2Upstream signal (ft) 570 660pX, platoon unblocked 0.57 0.43 0.43vC, conflicting volume 2848 1044 2059vC1, stage 1 conf vol 2037vC2, stage 2 conf vol 810vCu, unblocked vol 0 0 789tC, single (s) 6.8 6.9 4.1tC, 2 stage (s) 5.8tF (s) 3.5 3.3 2.2p0 queue free % 98 94 77cM capacity (veh/h) 511 455 349
Direction, Lane # WB 1 NB 1 NB 2 SB 1 SB 2 SB 3 SB 4Volume Total 36 1337 712 80 639 639 639Volume Left 9 0 0 80 0 0 0Volume Right 27 0 43 0 0 0 0cSH 467 1700 1700 349 1700 1700 1700Volume to Capacity 0.08 0.79 0.42 0.23 0.38 0.38 0.38Queue Length 95th (ft) 6 0 0 22 0 0 0Control Delay (s) 13.3 0.0 0.0 18.4 0.0 0.0 0.0Lane LOS B CApproach Delay (s) 13.3 0.0 0.7Approach LOS B
Intersection SummaryAverage Delay 0.5Intersection Capacity Utilization 75.7% ICU Level of Service DAnalysis Period (min) 15
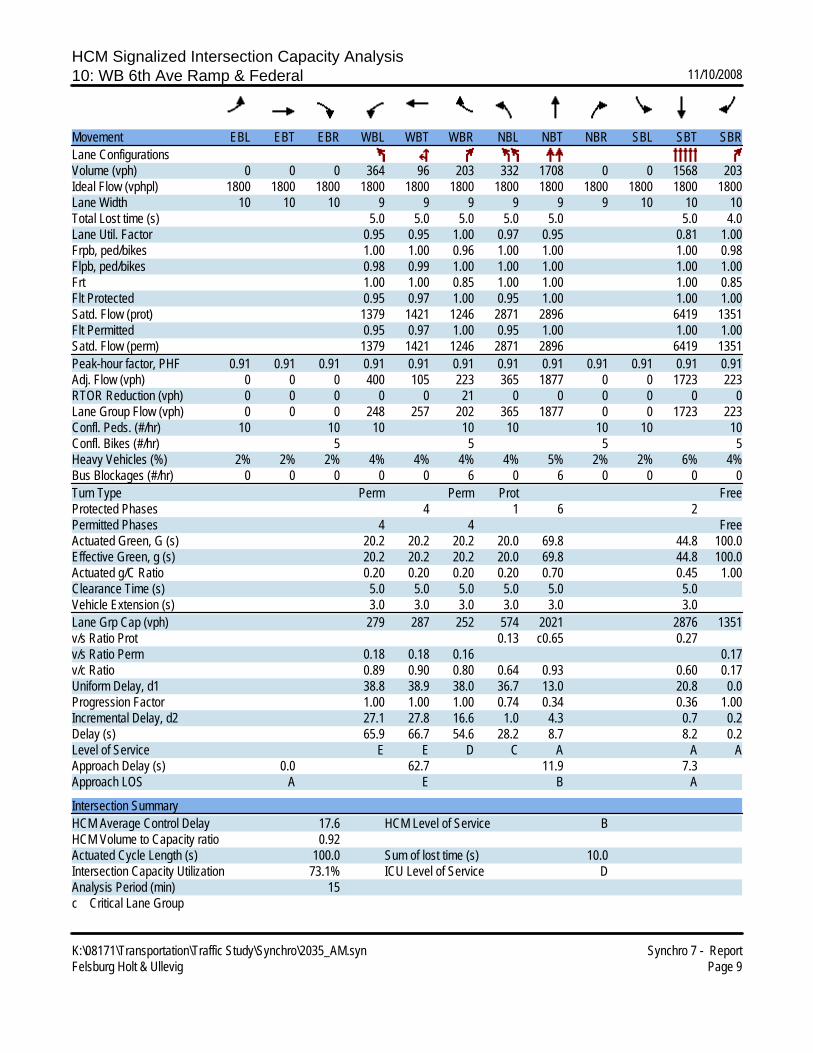
HCM Signalized Intersection Capacity Analysis10: WB 6th Ave Ramp & Federal 11/10/2008
K:\08171\Transportation\Traffic Study\Synchro\2035_AM.syn Synchro 7 - ReportFelsburg Holt & Ullevig Page 9
Movement EBL EBT EBR WBL WBT WBR NBL NBT NBR SBL SBT SBRLane ConfigurationsVolume (vph) 0 0 0 364 96 203 332 1708 0 0 1568 203Ideal Flow (vphpl) 1800 1800 1800 1800 1800 1800 1800 1800 1800 1800 1800 1800Lane Width 10 10 10 9 9 9 9 9 9 10 10 10Total Lost time (s) 5.0 5.0 5.0 5.0 5.0 5.0 4.0Lane Util. Factor 0.95 0.95 1.00 0.97 0.95 0.81 1.00Frpb, ped/bikes 1.00 1.00 0.96 1.00 1.00 1.00 0.98Flpb, ped/bikes 0.98 0.99 1.00 1.00 1.00 1.00 1.00Frt 1.00 1.00 0.85 1.00 1.00 1.00 0.85Flt Protected 0.95 0.97 1.00 0.95 1.00 1.00 1.00Satd. Flow (prot) 1379 1421 1246 2871 2896 6419 1351Flt Permitted 0.95 0.97 1.00 0.95 1.00 1.00 1.00Satd. Flow (perm) 1379 1421 1246 2871 2896 6419 1351Peak-hour factor, PHF 0.91 0.91 0.91 0.91 0.91 0.91 0.91 0.91 0.91 0.91 0.91 0.91Adj. Flow (vph) 0 0 0 400 105 223 365 1877 0 0 1723 223RTOR Reduction (vph) 0 0 0 0 0 21 0 0 0 0 0 0Lane Group Flow (vph) 0 0 0 248 257 202 365 1877 0 0 1723 223Confl. Peds. (#/hr) 10 10 10 10 10 10 10 10Confl. Bikes (#/hr) 5 5 5 5Heavy Vehicles (%) 2% 2% 2% 4% 4% 4% 4% 5% 2% 2% 6% 4%Bus Blockages (#/hr) 0 0 0 0 0 6 0 6 0 0 0 0Turn Type Perm Perm Prot FreeProtected Phases 4 1 6 2Permitted Phases 4 4 FreeActuated Green, G (s) 20.2 20.2 20.2 20.0 69.8 44.8 100.0Effective Green, g (s) 20.2 20.2 20.2 20.0 69.8 44.8 100.0Actuated g/C Ratio 0.20 0.20 0.20 0.20 0.70 0.45 1.00Clearance Time (s) 5.0 5.0 5.0 5.0 5.0 5.0Vehicle Extension (s) 3.0 3.0 3.0 3.0 3.0 3.0Lane Grp Cap (vph) 279 287 252 574 2021 2876 1351v/s Ratio Prot 0.13 c0.65 0.27v/s Ratio Perm 0.18 0.18 0.16 0.17v/c Ratio 0.89 0.90 0.80 0.64 0.93 0.60 0.17Uniform Delay, d1 38.8 38.9 38.0 36.7 13.0 20.8 0.0Progression Factor 1.00 1.00 1.00 0.74 0.34 0.36 1.00Incremental Delay, d2 27.1 27.8 16.6 1.0 4.3 0.7 0.2Delay (s) 65.9 66.7 54.6 28.2 8.7 8.2 0.2Level of Service E E D C A A AApproach Delay (s) 0.0 62.7 11.9 7.3Approach LOS A E B A
Intersection SummaryHCM Average Control Delay 17.6 HCM Level of Service BHCM Volume to Capacity ratio 0.92Actuated Cycle Length (s) 100.0 Sum of lost time (s) 10.0Intersection Capacity Utilization 73.1% ICU Level of Service DAnalysis Period (min) 15c Critical Lane Group
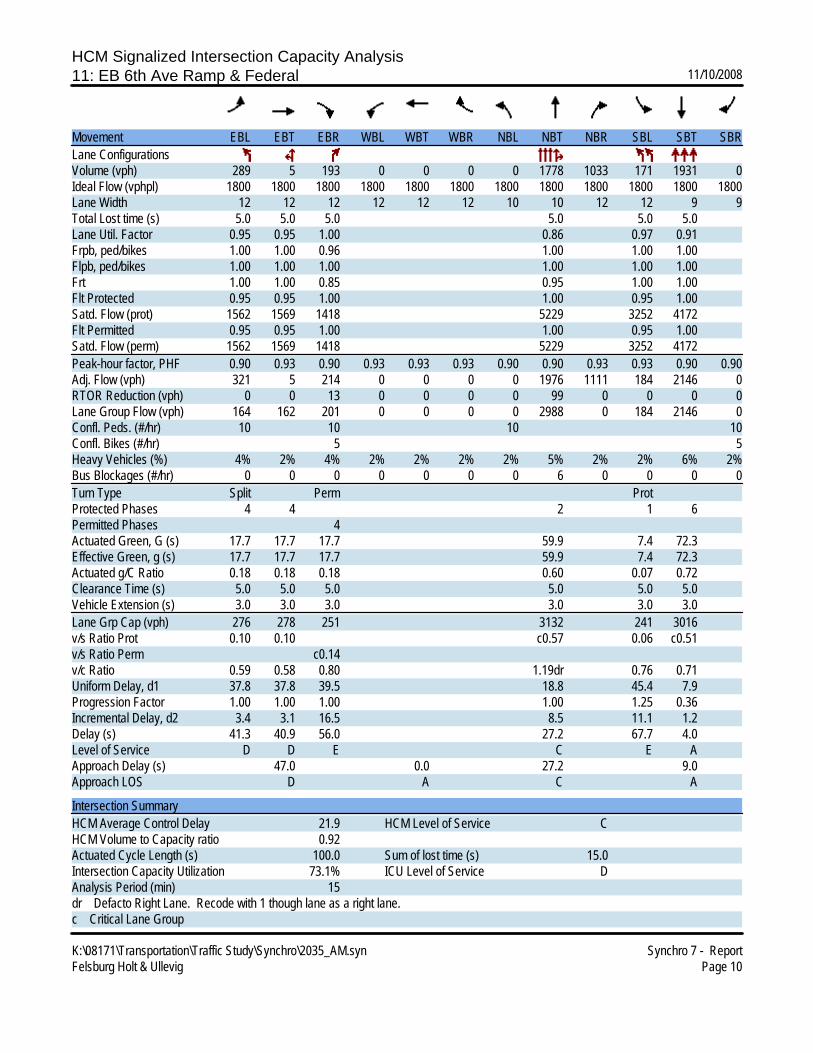
HCM Signalized Intersection Capacity Analysis11: EB 6th Ave Ramp & Federal 11/10/2008
K:\08171\Transportation\Traffic Study\Synchro\2035_AM.syn Synchro 7 - ReportFelsburg Holt & Ullevig Page 10
Movement EBL EBT EBR WBL WBT WBR NBL NBT NBR SBL SBT SBRLane ConfigurationsVolume (vph) 289 5 193 0 0 0 0 1778 1033 171 1931 0Ideal Flow (vphpl) 1800 1800 1800 1800 1800 1800 1800 1800 1800 1800 1800 1800Lane Width 12 12 12 12 12 12 10 10 12 12 9 9Total Lost time (s) 5.0 5.0 5.0 5.0 5.0 5.0Lane Util. Factor 0.95 0.95 1.00 0.86 0.97 0.91Frpb, ped/bikes 1.00 1.00 0.96 1.00 1.00 1.00Flpb, ped/bikes 1.00 1.00 1.00 1.00 1.00 1.00Frt 1.00 1.00 0.85 0.95 1.00 1.00Flt Protected 0.95 0.95 1.00 1.00 0.95 1.00Satd. Flow (prot) 1562 1569 1418 5229 3252 4172Flt Permitted 0.95 0.95 1.00 1.00 0.95 1.00Satd. Flow (perm) 1562 1569 1418 5229 3252 4172Peak-hour factor, PHF 0.90 0.93 0.90 0.93 0.93 0.93 0.90 0.90 0.93 0.93 0.90 0.90Adj. Flow (vph) 321 5 214 0 0 0 0 1976 1111 184 2146 0RTOR Reduction (vph) 0 0 13 0 0 0 0 99 0 0 0 0Lane Group Flow (vph) 164 162 201 0 0 0 0 2988 0 184 2146 0Confl. Peds. (#/hr) 10 10 10 10Confl. Bikes (#/hr) 5 5Heavy Vehicles (%) 4% 2% 4% 2% 2% 2% 2% 5% 2% 2% 6% 2%Bus Blockages (#/hr) 0 0 0 0 0 0 0 6 0 0 0 0Turn Type Split Perm ProtProtected Phases 4 4 2 1 6Permitted Phases 4Actuated Green, G (s) 17.7 17.7 17.7 59.9 7.4 72.3Effective Green, g (s) 17.7 17.7 17.7 59.9 7.4 72.3Actuated g/C Ratio 0.18 0.18 0.18 0.60 0.07 0.72Clearance Time (s) 5.0 5.0 5.0 5.0 5.0 5.0Vehicle Extension (s) 3.0 3.0 3.0 3.0 3.0 3.0Lane Grp Cap (vph) 276 278 251 3132 241 3016v/s Ratio Prot 0.10 0.10 c0.57 0.06 c0.51v/s Ratio Perm c0.14v/c Ratio 0.59 0.58 0.80 1.19dr 0.76 0.71Uniform Delay, d1 37.8 37.8 39.5 18.8 45.4 7.9Progression Factor 1.00 1.00 1.00 1.00 1.25 0.36Incremental Delay, d2 3.4 3.1 16.5 8.5 11.1 1.2Delay (s) 41.3 40.9 56.0 27.2 67.7 4.0Level of Service D D E C E AApproach Delay (s) 47.0 0.0 27.2 9.0Approach LOS D A C A
Intersection SummaryHCM Average Control Delay 21.9 HCM Level of Service CHCM Volume to Capacity ratio 0.92Actuated Cycle Length (s) 100.0 Sum of lost time (s) 15.0Intersection Capacity Utilization 73.1% ICU Level of Service DAnalysis Period (min) 15dr Defacto Right Lane. Recode with 1 though lane as a right lane.c Critical Lane Group

HCM Signalized Intersection Capacity Analysis1: Holden Pl & Federal 11/10/2008
K:\08171\Transportation\Traffic Study\Synchro\2035_PM.syn Synchro 7 - ReportFelsburg Holt & Ullevig Page 1
Movement WBL WBR NBT NBR SBL SBTLane ConfigurationsVolume (vph) 75 139 2259 51 62 2482Ideal Flow (vphpl) 1800 1800 1800 1800 1800 1800Lane Width 11 11 10 10 9 10Total Lost time (s) 5.0 5.0 5.0 5.0 5.0Lane Util. Factor 1.00 0.95 1.00 1.00 0.91Frpb, ped/bikes 0.98 1.00 0.95 1.00 1.00Flpb, ped/bikes 1.00 1.00 1.00 1.00 1.00Frt 0.91 1.00 0.85 1.00 1.00Flt Protected 0.98 1.00 1.00 0.95 1.00Satd. Flow (prot) 1493 3040 1326 1509 4275Flt Permitted 0.98 1.00 1.00 0.05 1.00Satd. Flow (perm) 1493 3040 1326 87 4275Peak-hour factor, PHF 0.96 0.96 0.96 0.96 0.96 0.96Adj. Flow (vph) 78 145 2353 53 65 2585RTOR Reduction (vph) 10 0 0 14 0 0Lane Group Flow (vph) 213 0 2353 39 65 2585Confl. Peds. (#/hr) 10 10 10 10Confl. Bikes (#/hr) 5 5Heavy Vehicles (%) 2% 2% 5% 2% 2% 6%Bus Blockages (#/hr) 0 0 0 0 0 9Turn Type Perm PermProtected Phases 4 2 2Permitted Phases 2 2Actuated Green, G (s) 16.8 73.2 73.2 73.2 73.2Effective Green, g (s) 16.8 73.2 73.2 73.2 73.2Actuated g/C Ratio 0.17 0.73 0.73 0.73 0.73Clearance Time (s) 5.0 5.0 5.0 5.0 5.0Vehicle Extension (s) 3.0 3.0 3.0 3.0 3.0Lane Grp Cap (vph) 251 2225 971 64 3129v/s Ratio Prot c0.14 c0.77 0.60v/s Ratio Perm 0.03 0.75v/c Ratio 0.85 1.06 0.04 1.02 0.83Uniform Delay, d1 40.4 13.4 3.7 13.4 9.1Progression Factor 1.00 0.81 2.09 1.00 1.00Incremental Delay, d2 22.5 29.2 0.0 116.9 2.6Delay (s) 62.9 40.1 7.8 130.3 11.7Level of Service E D A F BApproach Delay (s) 62.9 39.4 14.6Approach LOS E D B
Intersection SummaryHCM Average Control Delay 27.9 HCM Level of Service CHCM Volume to Capacity ratio 1.02Actuated Cycle Length (s) 100.0 Sum of lost time (s) 10.0Intersection Capacity Utilization 88.3% ICU Level of Service EAnalysis Period (min) 15c Critical Lane Group

HCM Unsignalized Intersection Capacity Analysis2: 12th Ave & Federal 11/10/2008
K:\08171\Transportation\Traffic Study\Synchro\2035_PM.syn Synchro 7 - ReportFelsburg Holt & Ullevig Page 2
Movement EBL EBR NBL NBT SBT SBRLane ConfigurationsVolume (veh/h) 21 42 54 2300 2519 39Sign Control Stop Free FreeGrade 0% 0% 0%Peak Hour Factor 0.91 0.91 0.91 0.91 0.91 0.91Hourly flow rate (vph) 23 46 59 2527 2768 43Pedestrians 10 10 10Lane Width (ft) 12.0 10.0 10.0Walking Speed (ft/s) 4.0 4.0 4.0Percent Blockage 1 1 1Right turn flare (veh)Median type TWLTL TWLTLMedian storage veh) 2 2Upstream signal (ft) 660 340pX, platoon unblocked 0.59 0.59 0.59vC, conflicting volume 3771 964 2821vC1, stage 1 conf vol 2800vC2, stage 2 conf vol 971vCu, unblocked vol 3255 0 1634tC, single (s) 6.8 6.9 4.1tC, 2 stage (s) 5.8tF (s) 3.5 3.3 2.2p0 queue free % 71 93 74cM capacity (veh/h) 79 626 228
Direction, Lane # EB 1 NB 1 NB 2 NB 3 NB 4 SB 1 SB 2 SB 3Volume Total 69 59 842 842 842 1107 1107 596Volume Left 23 59 0 0 0 0 0 0Volume Right 46 0 0 0 0 0 0 43cSH 189 228 1700 1700 1700 1700 1700 1700Volume to Capacity 0.37 0.26 0.50 0.50 0.50 0.65 0.65 0.35Queue Length 95th (ft) 39 25 0 0 0 0 0 0Control Delay (s) 34.7 26.2 0.0 0.0 0.0 0.0 0.0 0.0Lane LOS D DApproach Delay (s) 34.7 0.6 0.0Approach LOS D
Intersection SummaryAverage Delay 0.7Intersection Capacity Utilization 66.1% ICU Level of Service CAnalysis Period (min) 15

HCM Unsignalized Intersection Capacity Analysis3: 11th Ave & Federal 11/10/2008
K:\08171\Transportation\Traffic Study\Synchro\2035_PM.syn Synchro 7 - ReportFelsburg Holt & Ullevig Page 3
Movement WBL WBR NBT NBR SBL SBTLane ConfigurationsVolume (veh/h) 8 171 2162 24 20 2523Sign Control Stop Free FreeGrade 0% 0% 0%Peak Hour Factor 0.97 0.97 0.97 0.97 0.97 0.97Hourly flow rate (vph) 8 176 2229 25 21 2601Pedestrians 10 10 10Lane Width (ft) 12.0 10.0 10.0Walking Speed (ft/s) 4.0 4.0 4.0Percent Blockage 1 1 1Right turn flare (veh)Median type TWLTL TWLTLMedian storage veh) 2 2Upstream signal (ft) 330 670pX, platoon unblocked 0.61vC, conflicting volume 3169 775 2264vC1, stage 1 conf vol 2251vC2, stage 2 conf vol 918vCu, unblocked vol 2331 775 2264tC, single (s) 6.8 6.9 4.1tC, 2 stage (s) 5.8tF (s) 3.5 3.3 2.2p0 queue free % 87 47 91cM capacity (veh/h) 63 335 221
Direction, Lane # WB 1 NB 1 NB 2 NB 3 SB 1 SB 2 SB 3 SB 4Volume Total 185 892 892 471 21 867 867 867Volume Left 8 0 0 0 21 0 0 0Volume Right 176 0 0 25 0 0 0 0cSH 281 1700 1700 1700 221 1700 1700 1700Volume to Capacity 0.66 0.52 0.52 0.28 0.09 0.51 0.51 0.51Queue Length 95th (ft) 106 0 0 0 8 0 0 0Control Delay (s) 39.3 0.0 0.0 0.0 23.0 0.0 0.0 0.0Lane LOS E CApproach Delay (s) 39.3 0.0 0.2Approach LOS E
Intersection SummaryAverage Delay 1.5Intersection Capacity Utilization 70.9% ICU Level of Service CAnalysis Period (min) 15

HCM Signalized Intersection Capacity Analysis4: 10th Ave & Federal 11/10/2008
K:\08171\Transportation\Traffic Study\Synchro\2035_PM.syn Synchro 7 - ReportFelsburg Holt & Ullevig Page 4
Movement EBL EBT EBR WBL WBT WBR NBL NBT NBR SBL SBT SBRLane ConfigurationsVolume (vph) 129 37 88 137 94 47 155 2036 65 30 2333 130Ideal Flow (vphpl) 1800 1800 1800 1800 1800 1800 1800 1800 1800 1800 1800 1800Lane Width 12 12 12 12 12 12 9 10 10 9 10 10Total Lost time (s) 5.0 5.0 5.0 5.0 5.0 5.0Lane Util. Factor 1.00 1.00 1.00 0.95 1.00 0.91Frpb, ped/bikes 0.99 0.99 1.00 1.00 1.00 1.00Flpb, ped/bikes 1.00 1.00 1.00 1.00 1.00 1.00Frt 0.95 0.98 1.00 1.00 1.00 0.99Flt Protected 0.98 0.98 0.95 1.00 0.95 1.00Satd. Flow (prot) 1589 1647 1480 2955 1480 4239Flt Permitted 0.67 0.69 0.07 1.00 0.06 1.00Satd. Flow (perm) 1092 1167 116 2955 100 4239Peak-hour factor, PHF 0.95 0.95 0.95 0.95 0.95 0.95 0.95 0.95 0.95 0.95 0.95 0.95Adj. Flow (vph) 136 39 93 144 99 49 163 2143 68 32 2456 137RTOR Reduction (vph) 0 19 0 0 7 0 0 2 0 0 6 0Lane Group Flow (vph) 0 249 0 0 285 0 163 2209 0 32 2587 0Confl. Peds. (#/hr) 10 10 10 10 10 10 10 10Confl. Bikes (#/hr) 5 5 5 5Heavy Vehicles (%) 2% 2% 2% 2% 2% 2% 4% 5% 4% 4% 6% 4%Bus Blockages (#/hr) 4 4 4 3 3 3 0 11 11 0 8 8Turn Type Perm Perm pm+pt D.P+PProtected Phases 4 4 5 2 1 6Permitted Phases 4 4 2 2Actuated Green, G (s) 20.0 20.0 62.6 62.6 65.0 56.0Effective Green, g (s) 20.0 20.0 62.6 62.6 65.0 56.0Actuated g/C Ratio 0.20 0.20 0.63 0.63 0.65 0.56Clearance Time (s) 5.0 5.0 5.0 5.0 5.0 5.0Vehicle Extension (s) 3.0 3.0 3.0 3.0 3.0 3.0Lane Grp Cap (vph) 218 233 195 1850 98 2374v/s Ratio Prot 0.08 c0.75 0.01 c0.61v/s Ratio Perm 0.23 c0.24 0.45 0.21v/c Ratio 1.14 1.22 0.84 1.19 0.33 1.09Uniform Delay, d1 40.0 40.0 35.5 18.7 23.8 22.0Progression Factor 1.00 1.00 1.23 1.46 1.00 0.71Incremental Delay, d2 104.3 132.2 3.0 87.8 1.2 45.5Delay (s) 144.3 172.2 46.8 115.0 25.1 61.1Level of Service F F D F C EApproach Delay (s) 144.3 172.2 110.3 60.6Approach LOS F F F E
Intersection SummaryHCM Average Control Delay 91.7 HCM Level of Service FHCM Volume to Capacity ratio 1.23Actuated Cycle Length (s) 100.0 Sum of lost time (s) 15.0Intersection Capacity Utilization 97.7% ICU Level of Service FAnalysis Period (min) 15c Critical Lane Group

HCM Unsignalized Intersection Capacity Analysis5: 9th Ave & Federal 11/10/2008
K:\08171\Transportation\Traffic Study\Synchro\2035_PM.syn Synchro 7 - ReportFelsburg Holt & Ullevig Page 5
Movement EBL EBT EBR WBL WBT WBR NBL NBT NBR SBL SBT SBRLane ConfigurationsVolume (veh/h) 5 1 28 17 1 46 28 2192 42 18 2576 17Sign Control Stop Stop Free FreeGrade 0% 0% 0% 0%Peak Hour Factor 0.94 0.94 0.94 0.94 0.94 0.94 0.94 0.94 0.94 0.94 0.94 0.94Hourly flow rate (vph) 5 1 30 18 1 49 30 2332 45 19 2740 18Pedestrians 10 10 10 10Lane Width (ft) 12.0 12.0 10.0 10.0Walking Speed (ft/s) 4.0 4.0 4.0 4.0Percent Blockage 1 1 1 1Right turn flare (veh)Median type TWLTL TWLTLMedian storage veh) 2 2Upstream signal (ft) 690 650pX, platoon unblocked 0.73 0.73 0.47 0.73 0.73 0.48 0.47 0.48vC, conflicting volume 4083 5244 943 3416 5231 1208 2769 2387vC1, stage 1 conf vol 2798 2798 2424 2424vC2, stage 2 conf vol 1285 2446 992 2807vCu, unblocked vol 201 1783 0 0 1765 0 842 1718tC, single (s) 7.5 6.5 6.9 7.5 6.5 6.9 4.1 4.1tC, 2 stage (s) 6.5 5.5 6.5 5.5tF (s) 3.5 4.0 3.3 3.5 4.0 3.3 2.2 2.2p0 queue free % 99 98 94 97 98 90 92 89cM capacity (veh/h) 405 48 505 581 56 511 371 173
Direction, Lane # EB 1 WB 1 NB 1 NB 2 NB 3 SB 1 SB 2 SB 3 SB 4Volume Total 36 68 30 1555 822 19 1096 1096 566Volume Left 5 18 30 0 0 19 0 0 0Volume Right 30 49 0 0 45 0 0 0 18cSH 383 466 371 1700 1700 173 1700 1700 1700Volume to Capacity 0.09 0.15 0.08 0.91 0.48 0.11 0.64 0.64 0.33Queue Length 95th (ft) 8 13 7 0 0 9 0 0 0Control Delay (s) 15.4 14.0 15.6 0.0 0.0 28.4 0.0 0.0 0.0Lane LOS C B C DApproach Delay (s) 15.4 14.0 0.2 0.2Approach LOS C B
Intersection SummaryAverage Delay 0.5Intersection Capacity Utilization 81.3% ICU Level of Service DAnalysis Period (min) 15

HCM Signalized Intersection Capacity Analysis7: 8th Ave & Federal 11/10/2008
K:\08171\Transportation\Traffic Study\Synchro\2035_PM.syn Synchro 7 - ReportFelsburg Holt & Ullevig Page 6
Movement EBL EBT EBR WBL WBT WBR NBL NBT NBR SBL SBT SBRLane ConfigurationsVolume (vph) 70 92 55 596 573 205 60 1960 106 39 2298 139Ideal Flow (vphpl) 1800 1800 1800 1800 1800 1800 1800 1800 1800 1800 1800 1800Lane Width 10 10 10 10 10 10 9 10 10 9 10 10Total Lost time (s) 5.0 5.0 5.0 5.0 5.0 5.0 5.0 5.0Lane Util. Factor 1.00 0.95 0.97 0.95 1.00 0.95 1.00 0.91Frpb, ped/bikes 1.00 0.98 1.00 0.99 1.00 1.00 1.00 1.00Flpb, ped/bikes 1.00 1.00 1.00 1.00 1.00 1.00 1.00 1.00Frt 1.00 0.94 1.00 0.96 1.00 0.99 1.00 0.99Flt Protected 0.95 1.00 0.95 1.00 0.95 1.00 0.95 1.00Satd. Flow (prot) 1565 2907 3036 2977 1480 2977 1480 4252Flt Permitted 0.95 1.00 0.95 1.00 0.95 1.00 0.95 1.00Satd. Flow (perm) 1565 2907 3036 2977 1480 2977 1480 4252Peak-hour factor, PHF 0.93 0.93 0.93 0.93 0.93 0.93 0.93 0.93 0.93 0.93 0.93 0.93Adj. Flow (vph) 75 99 59 641 616 220 65 2108 114 42 2471 149RTOR Reduction (vph) 0 16 0 0 35 0 0 4 0 0 7 0Lane Group Flow (vph) 75 142 0 641 801 0 65 2218 0 42 2613 0Confl. Peds. (#/hr) 10 10 10 10 10 10 10 10Confl. Bikes (#/hr) 5 5 5 5Heavy Vehicles (%) 2% 2% 2% 2% 2% 2% 4% 5% 4% 4% 6% 4%Bus Blockages (#/hr) 0 0 0 0 0 0 0 6 6 0 6 6Turn Type Prot Prot Prot ProtProtected Phases 3 8 7 4 1 6 5 2Permitted PhasesActuated Green, G (s) 7.1 8.5 15.5 16.9 1.0 55.0 1.0 55.0Effective Green, g (s) 7.1 8.5 15.5 16.9 1.0 55.0 1.0 55.0Actuated g/C Ratio 0.07 0.08 0.16 0.17 0.01 0.55 0.01 0.55Clearance Time (s) 5.0 5.0 5.0 5.0 5.0 5.0 5.0 5.0Vehicle Extension (s) 3.0 3.0 3.0 3.0 3.0 3.0 3.0 3.0Lane Grp Cap (vph) 111 247 471 503 15 1637 15 2339v/s Ratio Prot 0.05 c0.05 0.21 c0.27 c0.04 c0.75 0.03 0.61v/s Ratio Permv/c Ratio 0.68 0.58 1.36 1.59 4.33 1.35 2.80 1.12Uniform Delay, d1 45.3 44.0 42.2 41.6 49.5 22.5 49.5 22.5Progression Factor 1.00 1.00 1.00 1.00 1.27 0.48 1.24 0.27Incremental Delay, d2 15.1 3.2 175.7 276.0 1513.9 160.1 826.5 53.4Delay (s) 60.4 47.3 218.0 317.5 1576.9 171.0 887.8 59.4Level of Service E D F F F F F EApproach Delay (s) 51.5 274.3 210.9 72.5Approach LOS D F F E
Intersection SummaryHCM Average Control Delay 164.1 HCM Level of Service FHCM Volume to Capacity ratio 1.30Actuated Cycle Length (s) 100.0 Sum of lost time (s) 15.0Intersection Capacity Utilization 101.3% ICU Level of Service GAnalysis Period (min) 15c Critical Lane Group

HCM Unsignalized Intersection Capacity Analysis8: Severn Pl & Federal 11/10/2008
K:\08171\Transportation\Traffic Study\Synchro\2035_PM.syn Synchro 7 - ReportFelsburg Holt & Ullevig Page 7
Movement WBL WBR NBT NBR SBL SBTLane ConfigurationsVolume (veh/h) 3 29 2107 7 3 2966Sign Control Stop Free FreeGrade 0% 0% 0%Peak Hour Factor 0.92 0.92 0.92 0.92 0.92 0.92Hourly flow rate (vph) 3 32 2290 8 3 3224Pedestrians 10 10 10Lane Width (ft) 9.0 10.0 10.0Walking Speed (ft/s) 4.0 4.0 4.0Percent Blockage 1 1 1Right turn flare (veh)Median type TWLTL TWLTLMedian storage veh) 2 2Upstream signal (ft) 890 340pX, platoon unblocked 0.70 0.43 0.43vC, conflicting volume 3395 1169 2308vC1, stage 1 conf vol 2304vC2, stage 2 conf vol 1091vCu, unblocked vol 0 0 1390tC, single (s) 6.8 6.9 4.1tC, 2 stage (s) 5.8tF (s) 3.5 3.3 2.2p0 queue free % 100 93 98cM capacity (veh/h) 691 460 209
Direction, Lane # WB 1 NB 1 NB 2 SB 1 SB 2 SB 3 SB 4Volume Total 35 1527 771 3 1075 1075 1075Volume Left 3 0 0 3 0 0 0Volume Right 32 0 8 0 0 0 0cSH 475 1700 1700 209 1700 1700 1700Volume to Capacity 0.07 0.90 0.45 0.02 0.63 0.63 0.63Queue Length 95th (ft) 6 0 0 1 0 0 0Control Delay (s) 13.2 0.0 0.0 22.5 0.0 0.0 0.0Lane LOS B CApproach Delay (s) 13.2 0.0 0.0Approach LOS B
Intersection SummaryAverage Delay 0.1Intersection Capacity Utilization 74.6% ICU Level of Service DAnalysis Period (min) 15

HCM Unsignalized Intersection Capacity Analysis9: 7th Ave & Federal 11/10/2008
K:\08171\Transportation\Traffic Study\Synchro\2035_PM.syn Synchro 7 - ReportFelsburg Holt & Ullevig Page 8
Movement WBL WBR NBT NBR SBL SBTLane ConfigurationsVolume (veh/h) 37 93 2024 26 25 2959Sign Control Stop Free FreeGrade 0% 0% 0%Peak Hour Factor 0.92 0.92 0.92 0.92 0.92 0.92Hourly flow rate (vph) 40 101 2200 28 27 3216Pedestrians 10 10 10Lane Width (ft) 12.0 10.0 10.0Walking Speed (ft/s) 4.0 4.0 4.0Percent Blockage 1 1 1Right turn flare (veh)Median type TWLTL TWLTLMedian storage veh) 2 2Upstream signal (ft) 570 660pX, platoon unblocked 0.68 0.42 0.42vC, conflicting volume 3361 1134 2238vC1, stage 1 conf vol 2224vC2, stage 2 conf vol 1136vCu, unblocked vol 0 0 1173tC, single (s) 6.8 6.9 4.1tC, 2 stage (s) 5.8tF (s) 3.5 3.3 2.2p0 queue free % 93 77 89cM capacity (veh/h) 605 445 244
Direction, Lane # WB 1 NB 1 NB 2 SB 1 SB 2 SB 3 SB 4Volume Total 141 1467 762 27 1072 1072 1072Volume Left 40 0 0 27 0 0 0Volume Right 101 0 28 0 0 0 0cSH 481 1700 1700 244 1700 1700 1700Volume to Capacity 0.29 0.86 0.45 0.11 0.63 0.63 0.63Queue Length 95th (ft) 30 0 0 9 0 0 0Control Delay (s) 15.6 0.0 0.0 21.6 0.0 0.0 0.0Lane LOS C CApproach Delay (s) 15.6 0.0 0.2Approach LOS C
Intersection SummaryAverage Delay 0.5Intersection Capacity Utilization 77.2% ICU Level of Service DAnalysis Period (min) 15

HCM Signalized Intersection Capacity Analysis10: WB 6th Ave Ramp & Federal 11/10/2008
K:\08171\Transportation\Traffic Study\Synchro\2035_PM.syn Synchro 7 - ReportFelsburg Holt & Ullevig Page 9
Movement EBL EBT EBR WBL WBT WBR NBL NBT NBR SBL SBT SBRLane ConfigurationsVolume (vph) 0 0 0 535 316 209 332 1885 0 0 2548 508Ideal Flow (vphpl) 1800 1800 1800 1800 1800 1800 1800 1800 1800 1800 1800 1800Lane Width 10 10 10 9 9 9 9 9 9 10 10 10Total Lost time (s) 5.0 5.0 5.0 5.0 5.0 5.0 4.0Lane Util. Factor 0.95 0.95 1.00 0.97 0.95 0.81 1.00Frpb, ped/bikes 1.00 1.00 0.97 1.00 1.00 1.00 0.98Flpb, ped/bikes 0.98 0.99 1.00 1.00 1.00 1.00 1.00Frt 1.00 1.00 0.85 1.00 1.00 1.00 0.85Flt Protected 0.95 0.99 1.00 0.95 1.00 1.00 1.00Satd. Flow (prot) 1379 1453 1248 2871 2896 6419 1351Flt Permitted 0.95 0.99 1.00 0.95 1.00 1.00 1.00Satd. Flow (perm) 1379 1453 1248 2871 2896 6419 1351Peak-hour factor, PHF 0.91 0.91 0.91 0.91 0.91 0.91 0.91 0.91 0.91 0.91 0.91 0.91Adj. Flow (vph) 0 0 0 588 347 230 365 2071 0 0 2800 558RTOR Reduction (vph) 0 0 0 0 0 7 0 0 0 0 0 0Lane Group Flow (vph) 0 0 0 459 476 223 365 2071 0 0 2800 558Confl. Peds. (#/hr) 10 10 10 10 10 10 10 10Confl. Bikes (#/hr) 5 5 5 5Heavy Vehicles (%) 2% 2% 2% 4% 4% 4% 4% 5% 2% 2% 6% 4%Bus Blockages (#/hr) 0 0 0 0 0 6 0 6 0 0 0 0Turn Type Perm Perm Prot FreeProtected Phases 4 1 6 2Permitted Phases 4 4 FreeActuated Green, G (s) 29.0 29.0 29.0 12.0 61.0 44.0 100.0Effective Green, g (s) 29.0 29.0 29.0 12.0 61.0 44.0 100.0Actuated g/C Ratio 0.29 0.29 0.29 0.12 0.61 0.44 1.00Clearance Time (s) 5.0 5.0 5.0 5.0 5.0 5.0Vehicle Extension (s) 3.0 3.0 3.0 3.0 3.0 3.0Lane Grp Cap (vph) 400 421 362 345 1767 2824 1351v/s Ratio Prot 0.13 c0.72 0.44v/s Ratio Perm c0.33 0.33 0.18 0.41v/c Ratio 1.15 1.13 0.62 1.06 1.17 0.99 0.41Uniform Delay, d1 35.5 35.5 30.7 44.0 19.5 27.8 0.0Progression Factor 1.00 1.00 1.00 0.72 0.36 1.00 1.00Incremental Delay, d2 91.7 84.5 3.1 42.7 79.3 3.5 0.1Delay (s) 127.2 120.0 33.8 74.2 86.4 31.2 0.1Level of Service F F C E F C AApproach Delay (s) 0.0 105.8 84.6 26.0Approach LOS A F F C
Intersection SummaryHCM Average Control Delay 59.9 HCM Level of Service EHCM Volume to Capacity ratio 1.16Actuated Cycle Length (s) 100.0 Sum of lost time (s) 10.0Intersection Capacity Utilization 87.7% ICU Level of Service EAnalysis Period (min) 15c Critical Lane Group

HCM Signalized Intersection Capacity Analysis11: EB 6th Ave Ramp & Federal 11/10/2008
K:\08171\Transportation\Traffic Study\Synchro\2035_PM.syn Synchro 7 - ReportFelsburg Holt & Ullevig Page 10
Movement EBL EBT EBR WBL WBT WBR NBL NBT NBR SBL SBT SBRLane ConfigurationsVolume (vph) 214 5 273 0 0 0 0 2029 910 214 2869 0Ideal Flow (vphpl) 1800 1800 1800 1800 1800 1800 1800 1800 1800 1800 1800 1800Lane Width 12 12 12 12 12 12 10 10 12 12 9 9Total Lost time (s) 5.0 5.0 5.0 5.0 5.0 5.0Lane Util. Factor 0.95 0.95 1.00 0.86 0.97 0.91Frpb, ped/bikes 1.00 1.00 0.96 1.00 1.00 1.00Flpb, ped/bikes 1.00 1.00 1.00 1.00 1.00 1.00Frt 1.00 1.00 0.85 0.95 1.00 1.00Flt Protected 0.95 0.95 1.00 1.00 0.95 1.00Satd. Flow (prot) 1562 1570 1419 5268 3252 4172Flt Permitted 0.95 0.95 1.00 1.00 0.95 1.00Satd. Flow (perm) 1562 1570 1419 5268 3252 4172Peak-hour factor, PHF 0.90 0.93 0.90 0.93 0.93 0.93 0.90 0.90 0.93 0.93 0.90 0.90Adj. Flow (vph) 238 5 303 0 0 0 0 2254 978 230 3188 0RTOR Reduction (vph) 0 0 2 0 0 0 0 78 0 0 0 0Lane Group Flow (vph) 121 122 301 0 0 0 0 3154 0 230 3188 0Confl. Peds. (#/hr) 10 10 10 10Confl. Bikes (#/hr) 5 5Heavy Vehicles (%) 4% 2% 4% 2% 2% 2% 2% 5% 2% 2% 6% 2%Bus Blockages (#/hr) 0 0 0 0 0 0 0 6 0 0 0 0Turn Type Split Perm ProtProtected Phases 4 4 2 1 6Permitted Phases 4Actuated Green, G (s) 20.0 20.0 20.0 58.0 7.0 70.0Effective Green, g (s) 20.0 20.0 20.0 58.0 7.0 70.0Actuated g/C Ratio 0.20 0.20 0.20 0.58 0.07 0.70Clearance Time (s) 5.0 5.0 5.0 5.0 5.0 5.0Vehicle Extension (s) 3.0 3.0 3.0 3.0 3.0 3.0Lane Grp Cap (vph) 312 314 284 3055 228 2920v/s Ratio Prot 0.08 0.08 0.60 0.07 c0.76v/s Ratio Perm c0.21v/c Ratio 0.39 0.39 1.06 1.11dr 1.01 1.09Uniform Delay, d1 34.7 34.7 40.0 21.0 46.5 15.0Progression Factor 1.00 1.00 1.00 1.00 1.22 0.75Incremental Delay, d2 0.8 0.8 70.5 25.4 20.0 42.0Delay (s) 35.5 35.5 110.5 46.4 76.8 53.2Level of Service D D F D E DApproach Delay (s) 77.1 0.0 46.4 54.8Approach LOS E A D D
Intersection SummaryHCM Average Control Delay 52.7 HCM Level of Service DHCM Volume to Capacity ratio 1.09Actuated Cycle Length (s) 100.0 Sum of lost time (s) 10.0Intersection Capacity Utilization 87.7% ICU Level of Service EAnalysis Period (min) 15dr Defacto Right Lane. Recode with 1 though lane as a right lane.c Critical Lane Group

FFEELLSSBBUURRGG HHOOLLTT && UULLLLEEVVIIGG Appendix D
Traffic Report
Appendix D
Year 2035 Build Out Scenario Level of Service Worksheets


HCM Signalized Intersection Capacity Analysis1: Holden Pl & Federal 11/10/2008
K:\08171\Transportation\Traffic Study\Synchro\2035_Action_AM.syn Synchro 7 - ReportFelsburg Holt & Ullevig Page 1
Movement WBL WBR NBT NBR SBL SBTLane ConfigurationsVolume (vph) 16 43 1586 68 193 1944Ideal Flow (vphpl) 1800 1800 1800 1800 1800 1800Total Lost time (s) 5.0 5.0 5.0 5.0Lane Util. Factor 1.00 0.91 1.00 0.91Frpb, ped/bikes 0.97 1.00 1.00 1.00Flpb, ped/bikes 1.00 1.00 1.00 1.00Frt 0.90 0.99 1.00 1.00Flt Protected 0.99 1.00 0.95 1.00Satd. Flow (prot) 1465 4491 1621 4428Flt Permitted 0.99 1.00 0.10 1.00Satd. Flow (perm) 1465 4491 163 4428Peak-hour factor, PHF 0.96 0.96 0.96 0.96 0.96 0.96Adj. Flow (vph) 17 45 1652 71 201 2025RTOR Reduction (vph) 42 0 3 0 0 0Lane Group Flow (vph) 20 0 1720 0 201 2025Confl. Peds. (#/hr) 10 10 10 10Confl. Bikes (#/hr) 5 5Heavy Vehicles (%) 2% 2% 5% 2% 2% 6%Bus Blockages (#/hr) 0 0 0 0 0 9Turn Type pm+ptProtected Phases 4 2 1 6Permitted Phases 6Actuated Green, G (s) 6.2 66.6 83.8 83.8Effective Green, g (s) 6.2 66.6 83.8 83.8Actuated g/C Ratio 0.06 0.67 0.84 0.84Clearance Time (s) 5.0 5.0 5.0 5.0Vehicle Extension (s) 3.0 3.0 3.0 3.0Lane Grp Cap (vph) 91 2991 314 3711v/s Ratio Prot c0.01 0.38 0.08 c0.46v/s Ratio Perm c0.46v/c Ratio 0.22 0.58 0.64 0.55Uniform Delay, d1 44.6 9.0 14.2 2.4Progression Factor 1.00 0.22 1.00 1.00Incremental Delay, d2 1.2 0.6 4.4 0.6Delay (s) 45.8 2.6 18.6 3.0Level of Service D A B AApproach Delay (s) 45.8 2.6 4.4Approach LOS D A A
Intersection SummaryHCM Average Control Delay 4.3 HCM Level of Service AHCM Volume to Capacity ratio 0.59Actuated Cycle Length (s) 100.0 Sum of lost time (s) 10.0Intersection Capacity Utilization 64.8% ICU Level of Service CAnalysis Period (min) 15c Critical Lane Group

HCM Unsignalized Intersection Capacity Analysis2: 12th Ave & Federal 11/10/2008
K:\08171\Transportation\Traffic Study\Synchro\2035_Action_AM.syn Synchro 7 - ReportFelsburg Holt & Ullevig Page 2
Movement EBL EBR NBL NBT SBT SBRLane ConfigurationsVolume (veh/h) 0 21 18 1619 1983 8Sign Control Stop Free FreeGrade 0% 0% 0%Peak Hour Factor 0.91 0.91 0.91 0.91 0.91 0.91Hourly flow rate (vph) 0 23 20 1779 2179 9Pedestrians 10 10 10Lane Width (ft) 11.0 11.0 11.0Walking Speed (ft/s) 4.0 4.0 4.0Percent Blockage 1 1 1Right turn flare (veh)Median type None NoneMedian storage veh)Upstream signal (ft) 660 340pX, platoon unblocked 0.80 0.87 0.87vC, conflicting volume 2836 751 2198vC1, stage 1 conf volvC2, stage 2 conf volvCu, unblocked vol 1321 190 1854tC, single (s) 6.8 6.9 4.1tC, 2 stage (s)tF (s) 3.5 3.3 2.2p0 queue free % 100 97 93cM capacity (veh/h) 108 702 279
Direction, Lane # EB 1 NB 1 NB 2 NB 3 NB 4 SB 1 SB 2 SB 3Volume Total 23 20 593 593 593 872 872 445Volume Left 0 20 0 0 0 0 0 0Volume Right 23 0 0 0 0 0 0 9cSH 702 279 1700 1700 1700 1700 1700 1700Volume to Capacity 0.03 0.07 0.35 0.35 0.35 0.51 0.51 0.26Queue Length 95th (ft) 3 6 0 0 0 0 0 0Control Delay (s) 10.3 18.9 0.0 0.0 0.0 0.0 0.0 0.0Lane LOS B CApproach Delay (s) 10.3 0.2 0.0Approach LOS B
Intersection SummaryAverage Delay 0.2Intersection Capacity Utilization 53.5% ICU Level of Service AAnalysis Period (min) 15

HCM Unsignalized Intersection Capacity Analysis3: 11th Ave & Federal 11/10/2008
K:\08171\Transportation\Traffic Study\Synchro\2035_Action_AM.syn Synchro 7 - ReportFelsburg Holt & Ullevig Page 3
Movement WBL WBR NBT NBR SBL SBTLane ConfigurationsVolume (veh/h) 0 38 1609 246 200 1755Sign Control Stop Free FreeGrade 0% 0% 0%Peak Hour Factor 0.97 0.97 0.97 0.97 0.97 0.97Hourly flow rate (vph) 0 39 1659 254 206 1809Pedestrians 10 10 10Lane Width (ft) 11.0 11.0 11.0Walking Speed (ft/s) 4.0 4.0 4.0Percent Blockage 1 1 1Right turn flare (veh)Median type None NoneMedian storage veh)Upstream signal (ft) 330 670pX, platoon unblocked 0.70 0.66 0.66vC, conflicting volume 2821 700 1922vC1, stage 1 conf volvC2, stage 2 conf volvCu, unblocked vol 1467 0 624tC, single (s) 6.8 6.9 4.1tC, 2 stage (s)tF (s) 3.5 3.3 2.2p0 queue free % 100 94 67cM capacity (veh/h) 55 710 629
Direction, Lane # WB 1 NB 1 NB 2 NB 3 SB 1 SB 2 SB 3 SB 4Volume Total 39 664 664 585 206 603 603 603Volume Left 0 0 0 0 206 0 0 0Volume Right 39 0 0 254 0 0 0 0cSH 710 1700 1700 1700 629 1700 1700 1700Volume to Capacity 0.06 0.39 0.39 0.34 0.33 0.35 0.35 0.35Queue Length 95th (ft) 4 0 0 0 36 0 0 0Control Delay (s) 10.4 0.0 0.0 0.0 13.5 0.0 0.0 0.0Lane LOS B BApproach Delay (s) 10.4 0.0 1.4Approach LOS B
Intersection SummaryAverage Delay 0.8Intersection Capacity Utilization 66.6% ICU Level of Service CAnalysis Period (min) 15

HCM Signalized Intersection Capacity Analysis4: 10th Ave & Federal 11/10/2008
K:\08171\Transportation\Traffic Study\Synchro\2035_Action_AM.syn Synchro 7 - ReportFelsburg Holt & Ullevig Page 4
Movement EBL EBT EBR WBL WBT WBR NBL NBT NBR SBL SBT SBRLane ConfigurationsVolume (vph) 170 96 63 37 24 32 81 1751 74 34 1707 35Ideal Flow (vphpl) 1800 1800 1800 1800 1800 1800 1800 1800 1800 1800 1800 1800Total Lost time (s) 5.0 5.0 5.0 5.0 5.0 5.0Lane Util. Factor 1.00 1.00 1.00 0.91 1.00 0.91Frpb, ped/bikes 0.99 0.99 1.00 1.00 1.00 1.00Flpb, ped/bikes 0.99 1.00 1.00 1.00 1.00 1.00Frt 0.97 0.95 1.00 0.99 1.00 1.00Flt Protected 0.97 0.98 0.95 1.00 0.95 1.00Satd. Flow (prot) 1571 1553 1589 4422 1589 4417Flt Permitted 0.80 0.80 0.08 1.00 0.08 1.00Satd. Flow (perm) 1287 1260 138 4422 138 4417Peak-hour factor, PHF 0.95 0.95 0.95 0.95 0.95 0.95 0.95 0.95 0.95 0.95 0.95 0.95Adj. Flow (vph) 179 101 66 39 25 34 85 1843 78 36 1797 37RTOR Reduction (vph) 0 8 0 0 20 0 0 4 0 0 2 0Lane Group Flow (vph) 0 338 0 0 78 0 85 1917 0 36 1832 0Confl. Peds. (#/hr) 10 10 10 10 10 10 10 10Confl. Bikes (#/hr) 5 5 5 5Heavy Vehicles (%) 2% 2% 2% 2% 2% 2% 4% 5% 4% 4% 6% 4%Bus Blockages (#/hr) 4 4 4 3 3 3 0 11 11 0 8 8Turn Type Perm Perm pm+pt pm+ptProtected Phases 4 4 5 2 1 6Permitted Phases 4 4 2 6Actuated Green, G (s) 29.2 29.2 53.4 53.4 50.8 50.8Effective Green, g (s) 29.2 29.2 53.4 53.4 50.8 50.8Actuated g/C Ratio 0.29 0.29 0.53 0.53 0.51 0.51Clearance Time (s) 5.0 5.0 5.0 5.0 5.0 5.0Vehicle Extension (s) 3.0 3.0 3.0 3.0 3.0 3.0Lane Grp Cap (vph) 376 368 146 2361 105 2244v/s Ratio Prot 0.03 c0.43 0.01 c0.41v/s Ratio Perm c0.26 0.06 0.28 0.17v/c Ratio 0.90 0.21 0.58 0.81 0.34 0.82Uniform Delay, d1 34.0 26.7 30.4 19.2 17.4 20.7Progression Factor 1.00 1.00 0.89 0.84 1.00 0.89Incremental Delay, d2 23.1 0.3 2.9 1.6 1.8 3.1Delay (s) 57.0 27.0 29.9 17.8 19.1 21.4Level of Service E C C B B CApproach Delay (s) 57.0 27.0 18.3 21.4Approach LOS E C B C
Intersection SummaryHCM Average Control Delay 22.9 HCM Level of Service CHCM Volume to Capacity ratio 0.82Actuated Cycle Length (s) 100.0 Sum of lost time (s) 10.0Intersection Capacity Utilization 79.5% ICU Level of Service DAnalysis Period (min) 15c Critical Lane Group

HCM Unsignalized Intersection Capacity Analysis5: 9th Ave & Federal 11/10/2008
K:\08171\Transportation\Traffic Study\Synchro\2035_Action_AM.syn Synchro 7 - ReportFelsburg Holt & Ullevig Page 5
Movement EBL EBT EBR WBL WBT WBR NBL NBT NBR SBL SBT SBRLane ConfigurationsVolume (veh/h) 3 5 56 4 1 16 20 1831 58 28 1821 10Sign Control Stop Stop Free FreeGrade 0% 0% 0% 0%Peak Hour Factor 0.94 0.94 0.94 0.94 0.94 0.94 0.94 0.94 0.94 0.94 0.94 0.94Hourly flow rate (vph) 3 5 60 4 1 17 21 1948 62 30 1937 11Pedestrians 10 10 10 10Lane Width (ft) 11.0 11.0 11.0 11.0Walking Speed (ft/s) 4.0 4.0 4.0 4.0Percent Blockage 1 1 1 1Right turn flare (veh)Median type None NoneMedian storage veh)Upstream signal (ft) 690 650pX, platoon unblocked 0.80 0.80 0.67 0.80 0.80 0.63 0.67 0.63vC, conflicting volume 2732 4074 671 2809 4049 700 1958 2020vC1, stage 1 conf volvC2, stage 2 conf volvCu, unblocked vol 0 1205 0 0 1173 0 733 581tC, single (s) 7.5 6.5 6.9 7.5 6.5 6.9 4.1 4.1tC, 2 stage (s)tF (s) 3.5 4.0 3.3 3.5 4.0 3.3 2.2 2.2p0 queue free % 100 96 92 99 99 97 96 95cM capacity (veh/h) 719 131 721 660 137 676 581 621
Direction, Lane # EB 1 WB 1 NB 1 NB 2 NB 3 NB 4 SB 1 SB 2 SB 3 SB 4Volume Total 68 22 21 779 779 451 30 775 775 398Volume Left 3 4 21 0 0 0 30 0 0 0Volume Right 60 17 0 0 0 62 0 0 0 11cSH 533 567 581 1700 1700 1700 621 1700 1700 1700Volume to Capacity 0.13 0.04 0.04 0.46 0.46 0.27 0.05 0.46 0.46 0.23Queue Length 95th (ft) 11 3 3 0 0 0 4 0 0 0Control Delay (s) 12.7 11.6 11.4 0.0 0.0 0.0 11.1 0.0 0.0 0.0Lane LOS B B B BApproach Delay (s) 12.7 11.6 0.1 0.2Approach LOS B B
Intersection SummaryAverage Delay 0.4Intersection Capacity Utilization 53.0% ICU Level of Service AAnalysis Period (min) 15

HCM Signalized Intersection Capacity Analysis7: 8th Ave & Federal 11/10/2008
K:\08171\Transportation\Traffic Study\Synchro\2035_Action_AM.syn Synchro 7 - ReportFelsburg Holt & Ullevig Page 6
Movement EBL EBT EBR WBL WBT WBR NBU NBL NBT NBR SBL SBTLane ConfigurationsVolume (vph) 133 363 27 191 159 103 9 29 1549 280 117 1621Ideal Flow (vphpl) 1800 1800 1800 1800 1800 1800 1800 1800 1800 1800 1800 1800Total Lost time (s) 5.0 5.0 5.0 5.0 5.0 5.0 5.0 5.0Lane Util. Factor 1.00 0.95 0.97 0.95 1.00 0.91 1.00 0.91Frpb, ped/bikes 1.00 1.00 1.00 0.98 1.00 0.99 1.00 1.00Flpb, ped/bikes 1.00 1.00 1.00 1.00 1.00 1.00 1.00 1.00Frt 1.00 0.99 1.00 0.94 1.00 0.98 1.00 1.00Flt Protected 0.95 1.00 0.95 1.00 0.95 1.00 0.95 1.00Satd. Flow (prot) 1621 3199 3144 3002 1597 4369 1589 4428Flt Permitted 0.95 1.00 0.95 1.00 0.95 1.00 0.95 1.00Satd. Flow (perm) 1621 3199 3144 3002 1597 4369 1589 4428Peak-hour factor, PHF 0.93 0.93 0.93 0.93 0.93 0.93 0.92 0.93 0.93 0.93 0.93 0.93Adj. Flow (vph) 143 390 29 205 171 111 10 31 1666 301 126 1743RTOR Reduction (vph) 0 6 0 0 99 0 0 0 26 0 0 3Lane Group Flow (vph) 143 413 0 205 183 0 0 41 1941 0 126 1785Confl. Peds. (#/hr) 10 10 10 10 10 10 10 10Confl. Bikes (#/hr) 5 5 5Heavy Vehicles (%) 2% 2% 2% 2% 2% 2% 2% 4% 5% 4% 4% 6%Bus Blockages (#/hr) 0 0 0 0 0 0 0 0 6 6 0 6Turn Type Prot Prot Prot Prot ProtProtected Phases 3 8 7 4 1 1 6 5 2Permitted PhasesActuated Green, G (s) 15.8 16.1 10.9 11.2 3.0 43.1 9.9 50.0Effective Green, g (s) 15.8 16.1 10.9 11.2 3.0 43.1 9.9 50.0Actuated g/C Ratio 0.16 0.16 0.11 0.11 0.03 0.43 0.10 0.50Clearance Time (s) 5.0 5.0 5.0 5.0 5.0 5.0 5.0 5.0Vehicle Extension (s) 3.0 3.0 3.0 3.0 3.0 3.0 3.0 3.0Lane Grp Cap (vph) 256 515 343 336 48 1883 157 2214v/s Ratio Prot c0.09 c0.13 0.07 0.06 0.03 c0.44 0.08 c0.40v/s Ratio Permv/c Ratio 0.56 0.80 0.60 0.55 0.85 1.03 0.80 0.81Uniform Delay, d1 38.9 40.4 42.5 42.0 48.3 28.4 44.1 20.9Progression Factor 1.00 1.00 1.00 1.00 0.88 1.00 0.67 0.44Incremental Delay, d2 2.6 8.8 2.8 1.8 66.4 27.1 17.8 2.2Delay (s) 41.5 49.2 45.3 43.8 108.9 55.6 47.4 11.5Level of Service D D D D F E D BApproach Delay (s) 47.2 44.4 56.7 13.9Approach LOS D D E B
Intersection SummaryHCM Average Control Delay 37.9 HCM Level of Service DHCM Volume to Capacity ratio 0.87Actuated Cycle Length (s) 100.0 Sum of lost time (s) 15.0Intersection Capacity Utilization 79.7% ICU Level of Service DAnalysis Period (min) 15c Critical Lane Group

HCM Signalized Intersection Capacity Analysis7: 8th Ave & Federal 11/10/2008
K:\08171\Transportation\Traffic Study\Synchro\2035_Action_AM.syn Synchro 7 - ReportFelsburg Holt & Ullevig Page 7
Movement SBRLane ConfigurationsVolume (vph) 41Ideal Flow (vphpl) 1800Total Lost time (s)Lane Util. FactorFrpb, ped/bikesFlpb, ped/bikesFrtFlt ProtectedSatd. Flow (prot)Flt PermittedSatd. Flow (perm)Peak-hour factor, PHF 0.93Adj. Flow (vph) 44RTOR Reduction (vph) 0Lane Group Flow (vph) 0Confl. Peds. (#/hr) 10Confl. Bikes (#/hr) 5Heavy Vehicles (%) 4%Bus Blockages (#/hr) 6Turn TypeProtected PhasesPermitted PhasesActuated Green, G (s)Effective Green, g (s)Actuated g/C RatioClearance Time (s)Vehicle Extension (s)Lane Grp Cap (vph)v/s Ratio Protv/s Ratio Permv/c RatioUniform Delay, d1Progression FactorIncremental Delay, d2Delay (s)Level of ServiceApproach Delay (s)Approach LOS
Intersection Summary

HCM Unsignalized Intersection Capacity Analysis8: Severn Pl & Federal 11/10/2008
K:\08171\Transportation\Traffic Study\Synchro\2035_Action_AM.syn Synchro 7 - ReportFelsburg Holt & Ullevig Page 8
Movement WBL WBR NBT NBR SBL SBTLane ConfigurationsVolume (veh/h) 0 8 1872 2 0 1849Sign Control Stop Free FreeGrade 0% 0% 0%Peak Hour Factor 0.92 0.92 0.92 0.92 0.92 0.92Hourly flow rate (vph) 0 9 2035 2 0 2010Pedestrians 10 10 10Lane Width (ft) 11.0 11.0 11.0Walking Speed (ft/s) 4.0 4.0 4.0Percent Blockage 1 1 1Right turn flare (veh)Median type None NoneMedian storage veh)Upstream signal (ft) 890 340pX, platoon unblocked 0.78 0.80 0.80vC, conflicting volume 2726 699 2047vC1, stage 1 conf volvC2, stage 2 conf volvCu, unblocked vol 448 0 1424tC, single (s) 6.8 6.9 4.1tC, 2 stage (s)tF (s) 3.5 3.3 2.2p0 queue free % 100 99 100cM capacity (veh/h) 412 852 375
Direction, Lane # WB 1 NB 1 NB 2 NB 3 SB 1 SB 2 SB 3Volume Total 9 814 814 409 670 670 670Volume Left 0 0 0 0 0 0 0Volume Right 9 0 0 2 0 0 0cSH 852 1700 1700 1700 1700 1700 1700Volume to Capacity 0.01 0.48 0.48 0.24 0.39 0.39 0.39Queue Length 95th (ft) 1 0 0 0 0 0 0Control Delay (s) 9.3 0.0 0.0 0.0 0.0 0.0 0.0Lane LOS AApproach Delay (s) 9.3 0.0 0.0Approach LOS A
Intersection SummaryAverage Delay 0.0Intersection Capacity Utilization 51.1% ICU Level of Service AAnalysis Period (min) 15

HCM Unsignalized Intersection Capacity Analysis9: 7th Ave & Federal 11/10/2008
K:\08171\Transportation\Traffic Study\Synchro\2035_Action_AM.syn Synchro 7 - ReportFelsburg Holt & Ullevig Page 9
Movement WBL WBR NBT NBR SBU SBL SBTLane ConfigurationsVolume (veh/h) 0 33 1845 40 1 74 1773Sign Control Stop Free FreeGrade 0% 0% 0%Peak Hour Factor 0.92 0.92 0.92 0.92 0.92 0.92 0.92Hourly flow rate (vph) 0 36 2005 43 0 80 1927Pedestrians 10 10 10Lane Width (ft) 11.0 11.0 11.0Walking Speed (ft/s) 4.0 4.0 4.0Percent Blockage 1 1 1Right turn flare (veh)Median type None NoneMedian storage veh)Upstream signal (ft) 570 660pX, platoon unblocked 0.80 0.78 0.00 0.78vC, conflicting volume 2850 710 0 2059vC1, stage 1 conf volvC2, stage 2 conf volvCu, unblocked vol 600 0 0 1372tC, single (s) 6.8 6.9 0.0 4.1tC, 2 stage (s)tF (s) 3.5 3.3 0.0 2.2p0 queue free % 100 96 0 79cM capacity (veh/h) 270 833 0 384
Direction, Lane # WB 1 NB 1 NB 2 NB 3 SB 1 SB 2 SB 3 SB 4Volume Total 36 802 802 445 80 642 642 642Volume Left 0 0 0 0 80 0 0 0Volume Right 36 0 0 43 0 0 0 0cSH 833 1700 1700 1700 384 1700 1700 1700Volume to Capacity 0.04 0.47 0.47 0.26 0.21 0.38 0.38 0.38Queue Length 95th (ft) 3 0 0 0 19 0 0 0Control Delay (s) 9.5 0.0 0.0 0.0 16.8 0.0 0.0 0.0Lane LOS A CApproach Delay (s) 9.5 0.0 0.7Approach LOS A
Intersection SummaryAverage Delay 0.4Intersection Capacity Utilization 59.1% ICU Level of Service BAnalysis Period (min) 15

HCM Signalized Intersection Capacity Analysis10: WB 6th Ave Ramp & Federal 11/10/2008
K:\08171\Transportation\Traffic Study\Synchro\2035_Action_AM.syn Synchro 7 - ReportFelsburg Holt & Ullevig Page 10
Movement EBL EBT EBR WBL WBT WBR NBL NBT NBR SBL SBT SBRLane ConfigurationsVolume (vph) 0 0 0 364 96 203 332 1708 0 0 1568 203Ideal Flow (vphpl) 1800 1800 1800 1800 1800 1800 1800 1800 1800 1800 1800 1800Total Lost time (s) 5.0 5.0 5.0 5.0 5.0 5.0 4.0Lane Util. Factor 0.95 0.95 1.00 0.97 0.91 0.81 1.00Frpb, ped/bikes 1.00 1.00 0.96 1.00 1.00 1.00 0.98Flpb, ped/bikes 0.98 0.99 1.00 1.00 1.00 1.00 1.00Frt 1.00 1.00 0.85 1.00 1.00 1.00 0.85Flt Protected 0.95 0.97 1.00 0.95 1.00 1.00 1.00Satd. Flow (prot) 1482 1527 1339 3083 4488 6648 1399Flt Permitted 0.95 0.97 1.00 0.95 1.00 1.00 1.00Satd. Flow (perm) 1482 1527 1339 3083 4488 6648 1399Peak-hour factor, PHF 0.91 0.91 0.91 0.91 0.91 0.91 0.91 0.91 0.91 0.91 0.91 0.91Adj. Flow (vph) 0 0 0 400 105 223 365 1877 0 0 1723 223RTOR Reduction (vph) 0 0 0 0 0 12 0 0 0 0 0 0Lane Group Flow (vph) 0 0 0 248 257 211 365 1877 0 0 1723 223Confl. Peds. (#/hr) 10 10 10 10 10 10 10 10Confl. Bikes (#/hr) 5 5 5 5Heavy Vehicles (%) 2% 2% 2% 4% 4% 4% 4% 5% 2% 2% 6% 4%Bus Blockages (#/hr) 0 0 0 0 0 6 0 6 0 0 0 0Turn Type Perm Perm Prot FreeProtected Phases 4 1 6 2Permitted Phases 4 4 FreeActuated Green, G (s) 22.8 22.8 22.8 20.0 67.2 42.2 100.0Effective Green, g (s) 22.8 22.8 22.8 20.0 67.2 42.2 100.0Actuated g/C Ratio 0.23 0.23 0.23 0.20 0.67 0.42 1.00Clearance Time (s) 5.0 5.0 5.0 5.0 5.0 5.0Vehicle Extension (s) 3.0 3.0 3.0 3.0 3.0 3.0Lane Grp Cap (vph) 338 348 305 617 3016 2805 1399v/s Ratio Prot 0.12 c0.42 0.26v/s Ratio Perm 0.17 0.17 0.16 0.16v/c Ratio 0.73 0.74 0.69 0.59 0.62 0.61 0.16Uniform Delay, d1 35.8 35.8 35.4 36.3 9.2 22.5 0.0Progression Factor 1.00 1.00 1.00 0.74 0.40 0.31 1.00Incremental Delay, d2 8.0 8.0 6.6 0.9 0.6 0.7 0.2Delay (s) 43.8 43.8 42.0 27.7 4.3 7.7 0.2Level of Service D D D C A A AApproach Delay (s) 0.0 43.2 8.1 6.8Approach LOS A D A A
Intersection SummaryHCM Average Control Delay 12.8 HCM Level of Service BHCM Volume to Capacity ratio 0.65Actuated Cycle Length (s) 100.0 Sum of lost time (s) 10.0Intersection Capacity Utilization 64.0% ICU Level of Service BAnalysis Period (min) 15c Critical Lane Group

HCM Signalized Intersection Capacity Analysis11: EB 6th Ave Ramp & Federal 11/10/2008
K:\08171\Transportation\Traffic Study\Synchro\2035_Action_AM.syn Synchro 7 - ReportFelsburg Holt & Ullevig Page 11
Movement EBL EBT EBR WBL WBT WBR NBL NBT NBR SBL SBT SBRLane ConfigurationsVolume (vph) 289 5 193 0 0 0 0 1778 1033 171 1931 0Ideal Flow (vphpl) 1800 1800 1800 1800 1800 1800 1800 1800 1800 1800 1800 1800Total Lost time (s) 5.0 5.0 5.0 5.0 5.0 5.0Lane Util. Factor 0.95 0.95 1.00 0.81 0.97 0.91Frpb, ped/bikes 1.00 1.00 0.96 1.00 1.00 1.00Flpb, ped/bikes 1.00 1.00 1.00 1.00 1.00 1.00Frt 1.00 1.00 0.85 0.95 1.00 1.00Flt Protected 0.95 0.95 1.00 1.00 0.95 1.00Satd. Flow (prot) 1510 1517 1371 6384 3144 4481Flt Permitted 0.95 0.95 1.00 1.00 0.95 1.00Satd. Flow (perm) 1510 1517 1371 6384 3144 4481Peak-hour factor, PHF 0.90 0.93 0.90 0.93 0.93 0.93 0.90 0.90 0.93 0.93 0.90 0.90Adj. Flow (vph) 321 5 214 0 0 0 0 1976 1111 184 2146 0RTOR Reduction (vph) 0 0 11 0 0 0 0 94 0 0 0 0Lane Group Flow (vph) 164 162 203 0 0 0 0 2993 0 184 2146 0Confl. Peds. (#/hr) 10 10 10 10Confl. Bikes (#/hr) 5 5Heavy Vehicles (%) 4% 2% 4% 2% 2% 2% 2% 5% 2% 2% 6% 2%Bus Blockages (#/hr) 0 0 0 0 0 0 0 6 0 0 0 0Turn Type Split Perm ProtProtected Phases 4 4 2 1 6Permitted Phases 4Actuated Green, G (s) 18.7 18.7 18.7 57.1 9.2 71.3Effective Green, g (s) 18.7 18.7 18.7 57.1 9.2 71.3Actuated g/C Ratio 0.19 0.19 0.19 0.57 0.09 0.71Clearance Time (s) 5.0 5.0 5.0 5.0 5.0 5.0Vehicle Extension (s) 3.0 3.0 3.0 3.0 3.0 3.0Lane Grp Cap (vph) 282 284 256 3645 289 3195v/s Ratio Prot 0.11 0.11 c0.47 0.06 c0.48v/s Ratio Perm c0.15v/c Ratio 0.58 0.57 0.79 1.21dr 0.64 0.67Uniform Delay, d1 37.1 37.0 38.8 17.3 43.8 7.9Progression Factor 1.00 1.00 1.00 1.00 1.28 0.46Incremental Delay, d2 3.0 2.8 15.3 2.2 3.8 1.0Delay (s) 40.1 39.7 54.1 19.5 59.9 4.6Level of Service D D D B E AApproach Delay (s) 45.5 0.0 19.5 9.0Approach LOS D A B A
Intersection SummaryHCM Average Control Delay 17.8 HCM Level of Service BHCM Volume to Capacity ratio 0.82Actuated Cycle Length (s) 100.0 Sum of lost time (s) 15.0Intersection Capacity Utilization 64.0% ICU Level of Service BAnalysis Period (min) 15dr Defacto Right Lane. Recode with 1 though lane as a right lane.c Critical Lane Group

HCM Signalized Intersection Capacity Analysis1: Holden Pl & Federal 11/10/2008
K:\08171\Transportation\Traffic Study\Synchro\2035_Action_PM.syn Synchro 7 - ReportFelsburg Holt & Ullevig Page 1
Movement WBL WBR NBT NBR SBL SBTLane ConfigurationsVolume (vph) 83 139 2259 51 62 2482Ideal Flow (vphpl) 1800 1800 1800 1800 1800 1800Total Lost time (s) 5.0 5.0 5.0 5.0Lane Util. Factor 1.00 0.91 1.00 0.91Frpb, ped/bikes 0.98 1.00 1.00 1.00Flpb, ped/bikes 1.00 1.00 1.00 1.00Frt 0.92 1.00 1.00 1.00Flt Protected 0.98 1.00 0.95 1.00Satd. Flow (prot) 1496 4507 1621 4428Flt Permitted 0.98 1.00 0.06 1.00Satd. Flow (perm) 1496 4507 95 4428Peak-hour factor, PHF 0.96 0.96 0.96 0.96 0.96 0.96Adj. Flow (vph) 86 145 2353 53 65 2585RTOR Reduction (vph) 59 0 2 0 0 0Lane Group Flow (vph) 172 0 2404 0 65 2585Confl. Peds. (#/hr) 10 10 10 10Confl. Bikes (#/hr) 5 5Heavy Vehicles (%) 2% 2% 5% 2% 2% 6%Bus Blockages (#/hr) 0 0 0 0 0 9Turn Type pm+ptProtected Phases 4 2 1 6Permitted Phases 6Actuated Green, G (s) 15.7 67.2 76.3 76.3Effective Green, g (s) 15.7 67.2 76.3 76.3Actuated g/C Ratio 0.15 0.66 0.75 0.75Clearance Time (s) 5.0 5.0 5.0 5.0Vehicle Extension (s) 3.0 3.0 3.0 3.0Lane Grp Cap (vph) 230 2969 132 3312v/s Ratio Prot c0.11 c0.53 0.02 c0.58v/s Ratio Perm 0.35v/c Ratio 0.75 0.81 0.49 0.78Uniform Delay, d1 41.3 12.7 12.0 7.8Progression Factor 1.00 1.00 1.00 1.00Incremental Delay, d2 12.4 2.5 2.9 1.9Delay (s) 53.7 15.2 14.9 9.7Level of Service D B B AApproach Delay (s) 53.7 15.2 9.8Approach LOS D B A
Intersection SummaryHCM Average Control Delay 14.2 HCM Level of Service BHCM Volume to Capacity ratio 0.82Actuated Cycle Length (s) 102.0 Sum of lost time (s) 15.0Intersection Capacity Utilization 77.2% ICU Level of Service DAnalysis Period (min) 15c Critical Lane Group

HCM Unsignalized Intersection Capacity Analysis2: 12th Ave & Federal 11/10/2008
K:\08171\Transportation\Traffic Study\Synchro\2035_Action_PM.syn Synchro 7 - ReportFelsburg Holt & Ullevig Page 2
Movement EBL EBR NBL NBT SBT SBRLane ConfigurationsVolume (veh/h) 0 42 54 2321 2527 39Sign Control Stop Free FreeGrade 0% 0% 0%Peak Hour Factor 0.91 0.91 0.91 0.91 0.91 0.91Hourly flow rate (vph) 0 46 59 2551 2777 43Pedestrians 10 10 10Lane Width (ft) 11.0 11.0 11.0Walking Speed (ft/s) 4.0 4.0 4.0Percent Blockage 1 1 1Right turn flare (veh)Median type None NoneMedian storage veh)Upstream signal (ft) 660 340pX, platoon unblocked 0.80 0.64 0.64vC, conflicting volume 3787 967 2830vC1, stage 1 conf volvC2, stage 2 conf volvCu, unblocked vol 550 0 1879tC, single (s) 6.8 6.9 4.1tC, 2 stage (s)tF (s) 3.5 3.3 2.2p0 queue free % 100 93 70cM capacity (veh/h) 258 680 200
Direction, Lane # EB 1 NB 1 NB 2 NB 3 NB 4 SB 1 SB 2 SB 3Volume Total 46 59 850 850 850 1111 1111 598Volume Left 0 59 0 0 0 0 0 0Volume Right 46 0 0 0 0 0 0 43cSH 680 200 1700 1700 1700 1700 1700 1700Volume to Capacity 0.07 0.30 0.50 0.50 0.50 0.65 0.65 0.35Queue Length 95th (ft) 5 30 0 0 0 0 0 0Control Delay (s) 10.7 30.5 0.0 0.0 0.0 0.0 0.0 0.0Lane LOS B DApproach Delay (s) 10.7 0.7 0.0Approach LOS B
Intersection SummaryAverage Delay 0.4Intersection Capacity Utilization 65.6% ICU Level of Service CAnalysis Period (min) 15

HCM Unsignalized Intersection Capacity Analysis3: 11th Ave & Federal 11/10/2008
K:\08171\Transportation\Traffic Study\Synchro\2035_Action_PM.syn Synchro 7 - ReportFelsburg Holt & Ullevig Page 3
Movement WBL WBR NBT NBR SBL SBTLane ConfigurationsVolume (veh/h) 0 171 2183 24 20 2531Sign Control Stop Free FreeGrade 0% 0% 0%Peak Hour Factor 0.97 0.97 0.97 0.97 0.97 0.97Hourly flow rate (vph) 0 176 2251 25 21 2609Pedestrians 10 10 10Lane Width (ft) 11.0 11.0 11.0Walking Speed (ft/s) 4.0 4.0 4.0Percent Blockage 1 1 1Right turn flare (veh)Median type None NoneMedian storage veh)Upstream signal (ft) 330 670pX, platoon unblocked 0.77 0.60 0.60vC, conflicting volume 3194 783 2285vC1, stage 1 conf volvC2, stage 2 conf volvCu, unblocked vol 0 0 805tC, single (s) 6.8 6.9 4.1tC, 2 stage (s)tF (s) 3.5 3.3 2.2p0 queue free % 100 72 96cM capacity (veh/h) 739 640 485
Direction, Lane # WB 1 NB 1 NB 2 NB 3 SB 1 SB 2 SB 3 SB 4Volume Total 176 900 900 475 21 870 870 870Volume Left 0 0 0 0 21 0 0 0Volume Right 176 0 0 25 0 0 0 0cSH 640 1700 1700 1700 485 1700 1700 1700Volume to Capacity 0.28 0.53 0.53 0.28 0.04 0.51 0.51 0.51Queue Length 95th (ft) 28 0 0 0 3 0 0 0Control Delay (s) 12.7 0.0 0.0 0.0 12.8 0.0 0.0 0.0Lane LOS B BApproach Delay (s) 12.7 0.0 0.1Approach LOS B
Intersection SummaryAverage Delay 0.5Intersection Capacity Utilization 64.5% ICU Level of Service CAnalysis Period (min) 15

HCM Signalized Intersection Capacity Analysis4: 10th Ave & Federal 11/10/2008
K:\08171\Transportation\Traffic Study\Synchro\2035_Action_PM.syn Synchro 7 - ReportFelsburg Holt & Ullevig Page 4
Movement EBL EBT EBR WBL WBT WBR NBL NBT NBR SBL SBT SBRLane ConfigurationsVolume (vph) 150 37 88 137 94 47 155 2036 65 30 2333 130Ideal Flow (vphpl) 1800 1800 1800 1800 1800 1800 1800 1800 1800 1800 1800 1800Total Lost time (s) 5.0 5.0 5.0 5.0 5.0 5.0Lane Util. Factor 1.00 1.00 1.00 0.91 1.00 0.91Frpb, ped/bikes 0.99 0.99 1.00 1.00 1.00 1.00Flpb, ped/bikes 1.00 1.00 1.00 1.00 1.00 1.00Frt 0.96 0.98 1.00 1.00 1.00 0.99Flt Protected 0.97 0.98 0.95 1.00 0.95 1.00Satd. Flow (prot) 1540 1592 1589 4431 1589 4390Flt Permitted 0.66 0.71 0.08 1.00 0.08 1.00Satd. Flow (perm) 1046 1153 135 4431 135 4390Peak-hour factor, PHF 0.95 0.95 0.95 0.95 0.95 0.95 0.95 0.95 0.95 0.95 0.95 0.95Adj. Flow (vph) 158 39 93 144 99 49 163 2143 68 32 2456 137RTOR Reduction (vph) 0 17 0 0 8 0 0 3 0 0 6 0Lane Group Flow (vph) 0 273 0 0 284 0 163 2208 0 32 2587 0Confl. Peds. (#/hr) 10 10 10 10 10 10 10 10Confl. Bikes (#/hr) 5 5 5 5Heavy Vehicles (%) 2% 2% 2% 2% 2% 2% 4% 5% 4% 4% 6% 4%Bus Blockages (#/hr) 4 4 4 3 3 3 0 11 11 0 8 8Turn Type Perm Perm pm+pt pm+ptProtected Phases 4 4 5 2 1 6Permitted Phases 4 4 2 6Actuated Green, G (s) 24.0 24.0 58.6 58.6 52.0 52.0Effective Green, g (s) 24.0 24.0 58.6 58.6 52.0 52.0Actuated g/C Ratio 0.24 0.24 0.59 0.59 0.52 0.52Clearance Time (s) 5.0 5.0 5.0 5.0 5.0 5.0Vehicle Extension (s) 3.0 3.0 3.0 3.0 3.0 3.0Lane Grp Cap (vph) 251 277 210 2597 105 2283v/s Ratio Prot 0.07 c0.50 0.01 c0.59v/s Ratio Perm c0.26 0.25 0.39 0.15v/c Ratio 1.09 1.03 0.78 0.85 0.30 1.13Uniform Delay, d1 38.0 38.0 39.1 17.1 18.0 24.0Progression Factor 1.00 1.00 0.41 0.31 1.00 1.00Incremental Delay, d2 82.5 61.1 4.5 1.0 1.6 66.0Delay (s) 120.5 99.1 20.6 6.2 19.6 90.0Level of Service F F C A B FApproach Delay (s) 120.5 99.1 7.2 89.1Approach LOS F F A F
Intersection SummaryHCM Average Control Delay 56.4 HCM Level of Service EHCM Volume to Capacity ratio 1.05Actuated Cycle Length (s) 100.0 Sum of lost time (s) 10.0Intersection Capacity Utilization 94.1% ICU Level of Service FAnalysis Period (min) 15c Critical Lane Group

HCM Unsignalized Intersection Capacity Analysis5: 9th Ave & Federal 11/10/2008
K:\08171\Transportation\Traffic Study\Synchro\2035_Action_PM.syn Synchro 7 - ReportFelsburg Holt & Ullevig Page 5
Movement EBL EBT EBR WBL WBT WBR NBL NBT NBR SBL SBT SBRLane ConfigurationsVolume (veh/h) 5 1 28 17 1 46 28 2192 42 18 2576 17Sign Control Stop Stop Free FreeGrade 0% 0% 0% 0%Peak Hour Factor 0.94 0.94 0.94 0.94 0.94 0.94 0.94 0.94 0.94 0.94 0.94 0.94Hourly flow rate (vph) 5 1 30 18 1 49 30 2332 45 19 2740 18Pedestrians 10 10 10 10Lane Width (ft) 11.0 11.0 11.0 11.0Walking Speed (ft/s) 4.0 4.0 4.0 4.0Percent Blockage 1 1 1 1Right turn flare (veh)Median type None NoneMedian storage veh)Upstream signal (ft) 690 650pX, platoon unblocked 0.73 0.73 0.52 0.73 0.73 0.57 0.52 0.57vC, conflicting volume 3694 5244 943 3416 5231 820 2769 2387vC1, stage 1 conf volvC2, stage 2 conf volvCu, unblocked vol 0 1525 0 0 1506 0 1146 771tC, single (s) 7.5 6.5 6.9 7.5 6.5 6.9 4.1 4.1tC, 2 stage (s)tF (s) 3.5 4.0 3.3 3.5 4.0 3.3 2.2 2.2p0 queue free % 99 99 95 97 99 92 90 96cM capacity (veh/h) 596 73 551 613 75 605 310 472
Direction, Lane # EB 1 WB 1 NB 1 NB 2 NB 3 NB 4 SB 1 SB 2 SB 3 SB 4Volume Total 36 68 30 933 933 511 19 1096 1096 566Volume Left 5 18 30 0 0 0 19 0 0 0Volume Right 30 49 0 0 0 45 0 0 0 18cSH 467 547 310 1700 1700 1700 472 1700 1700 1700Volume to Capacity 0.08 0.12 0.10 0.55 0.55 0.30 0.04 0.64 0.64 0.33Queue Length 95th (ft) 6 11 8 0 0 0 3 0 0 0Control Delay (s) 13.4 12.5 17.8 0.0 0.0 0.0 12.9 0.0 0.0 0.0Lane LOS B B C BApproach Delay (s) 13.4 12.5 0.2 0.1Approach LOS B B
Intersection SummaryAverage Delay 0.4Intersection Capacity Utilization 68.9% ICU Level of Service CAnalysis Period (min) 15

HCM Signalized Intersection Capacity Analysis7: 8th Ave & Federal 11/10/2008
K:\08171\Transportation\Traffic Study\Synchro\2035_Action_PM.syn Synchro 7 - ReportFelsburg Holt & Ullevig Page 6
Movement EBL EBT EBR WBL WBT WBR NBU NBL NBT NBR SBL SBTLane ConfigurationsVolume (vph) 70 92 55 596 573 205 40 60 1960 106 39 2298Ideal Flow (vphpl) 1800 1800 1800 1800 1800 1800 1800 1800 1800 1800 1800 1800Total Lost time (s) 5.0 5.0 5.0 5.0 5.0 5.0 5.0 5.0Lane Util. Factor 1.00 0.95 0.97 0.95 1.00 0.91 1.00 0.91Frpb, ped/bikes 1.00 0.99 1.00 0.99 1.00 1.00 1.00 1.00Flpb, ped/bikes 1.00 1.00 1.00 1.00 1.00 1.00 1.00 1.00Frt 1.00 0.94 1.00 0.96 1.00 0.99 1.00 0.99Flt Protected 0.95 1.00 0.95 1.00 0.95 1.00 0.95 1.00Satd. Flow (prot) 1621 3017 3144 3084 1602 4448 1589 4404Flt Permitted 0.95 1.00 0.95 1.00 0.95 1.00 0.95 1.00Satd. Flow (perm) 1621 3017 3144 3084 1602 4448 1589 4404Peak-hour factor, PHF 0.93 0.93 0.93 0.93 0.93 0.93 0.92 0.93 0.93 0.93 0.93 0.93Adj. Flow (vph) 75 99 59 641 616 220 43 65 2108 114 42 2471RTOR Reduction (vph) 0 16 0 0 35 0 0 0 5 0 0 7Lane Group Flow (vph) 75 142 0 641 801 0 0 108 2217 0 42 2613Confl. Peds. (#/hr) 10 10 10 10 10 10 10 10Confl. Bikes (#/hr) 5 5 5Heavy Vehicles (%) 2% 2% 2% 2% 2% 2% 2% 4% 5% 4% 4% 6%Bus Blockages (#/hr) 0 0 0 0 0 0 0 0 6 6 0 6Turn Type Prot Prot Prot Prot ProtProtected Phases 3 8 7 4 1 1 6 5 2Permitted PhasesActuated Green, G (s) 8.4 14.8 15.0 21.4 8.3 47.0 3.2 41.9Effective Green, g (s) 8.4 14.8 15.0 21.4 8.3 47.0 3.2 41.9Actuated g/C Ratio 0.08 0.15 0.15 0.21 0.08 0.47 0.03 0.42Clearance Time (s) 5.0 5.0 5.0 5.0 5.0 5.0 5.0 5.0Vehicle Extension (s) 3.0 3.0 3.0 3.0 3.0 3.0 3.0 3.0Lane Grp Cap (vph) 136 447 472 660 133 2091 51 1845v/s Ratio Prot c0.05 0.05 0.20 c0.26 0.07 c0.50 0.03 c0.59v/s Ratio Permv/c Ratio 0.55 0.32 1.36 1.21 0.81 1.06 0.82 1.42Uniform Delay, d1 44.0 38.1 42.5 39.3 45.1 26.5 48.1 29.0Progression Factor 1.00 1.00 1.00 1.00 1.02 0.71 1.03 1.05Incremental Delay, d2 4.8 0.4 174.5 109.5 22.5 35.2 9.4 187.6Delay (s) 48.8 38.5 217.0 148.8 68.3 54.2 59.0 218.1Level of Service D D F F E D E FApproach Delay (s) 41.8 178.4 54.8 215.6Approach LOS D F D F
Intersection SummaryHCM Average Control Delay 145.4 HCM Level of Service FHCM Volume to Capacity ratio 1.27Actuated Cycle Length (s) 100.0 Sum of lost time (s) 20.0Intersection Capacity Utilization 100.7% ICU Level of Service GAnalysis Period (min) 15c Critical Lane Group
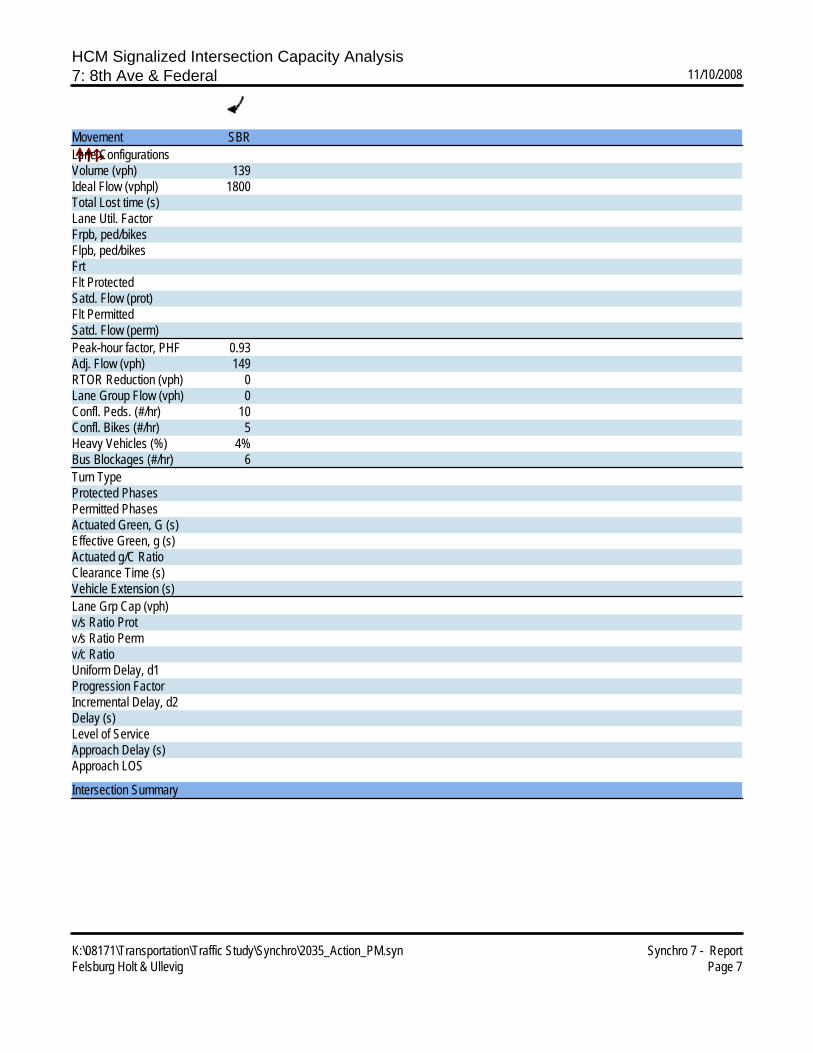
HCM Signalized Intersection Capacity Analysis7: 8th Ave & Federal 11/10/2008
K:\08171\Transportation\Traffic Study\Synchro\2035_Action_PM.syn Synchro 7 - ReportFelsburg Holt & Ullevig Page 7
Movement SBRLane ConfigurationsVolume (vph) 139Ideal Flow (vphpl) 1800Total Lost time (s)Lane Util. FactorFrpb, ped/bikesFlpb, ped/bikesFrtFlt ProtectedSatd. Flow (prot)Flt PermittedSatd. Flow (perm)Peak-hour factor, PHF 0.93Adj. Flow (vph) 149RTOR Reduction (vph) 0Lane Group Flow (vph) 0Confl. Peds. (#/hr) 10Confl. Bikes (#/hr) 5Heavy Vehicles (%) 4%Bus Blockages (#/hr) 6Turn TypeProtected PhasesPermitted PhasesActuated Green, G (s)Effective Green, g (s)Actuated g/C RatioClearance Time (s)Vehicle Extension (s)Lane Grp Cap (vph)v/s Ratio Protv/s Ratio Permv/c RatioUniform Delay, d1Progression FactorIncremental Delay, d2Delay (s)Level of ServiceApproach Delay (s)Approach LOS
Intersection Summary

HCM Unsignalized Intersection Capacity Analysis8: Severn Pl & Federal 11/10/2008
K:\08171\Transportation\Traffic Study\Synchro\2035_Action_PM.syn Synchro 7 - ReportFelsburg Holt & Ullevig Page 8
Movement WBL WBR NBT NBR SBL SBTLane ConfigurationsVolume (veh/h) 0 32 2144 10 0 3009Sign Control Stop Free FreeGrade 0% 0% 0%Peak Hour Factor 0.92 0.92 0.92 0.92 0.92 0.92Hourly flow rate (vph) 0 35 2330 11 0 3271Pedestrians 10 10 10Lane Width (ft) 11.0 11.0 11.0Walking Speed (ft/s) 4.0 4.0 4.0Percent Blockage 1 1 1Right turn flare (veh)Median type None NoneMedian storage veh)Upstream signal (ft) 890 340pX, platoon unblocked 0.76 0.67 0.67vC, conflicting volume 3446 802 2351vC1, stage 1 conf volvC2, stage 2 conf volvCu, unblocked vol 239 0 1310tC, single (s) 6.8 6.9 4.1tC, 2 stage (s)tF (s) 3.5 3.3 2.2p0 queue free % 100 95 100cM capacity (veh/h) 548 719 350
Direction, Lane # WB 1 NB 1 NB 2 NB 3 SB 1 SB 2 SB 3Volume Total 35 932 932 477 1090 1090 1090Volume Left 0 0 0 0 0 0 0Volume Right 35 0 0 11 0 0 0cSH 719 1700 1700 1700 1700 1700 1700Volume to Capacity 0.05 0.55 0.55 0.28 0.64 0.64 0.64Queue Length 95th (ft) 4 0 0 0 0 0 0Control Delay (s) 10.3 0.0 0.0 0.0 0.0 0.0 0.0Lane LOS BApproach Delay (s) 10.3 0.0 0.0Approach LOS B
Intersection SummaryAverage Delay 0.1Intersection Capacity Utilization 74.2% ICU Level of Service DAnalysis Period (min) 15

HCM Unsignalized Intersection Capacity Analysis9: 7th Ave & Federal 11/10/2008
K:\08171\Transportation\Traffic Study\Synchro\2035_Action_PM.syn Synchro 7 - ReportFelsburg Holt & Ullevig Page 9
Movement WBL WBR NBT NBR SBU SBL SBTLane ConfigurationsVolume (veh/h) 0 130 2024 26 3 25 2996Sign Control Stop Free FreeGrade 0% 0% 0%Peak Hour Factor 0.92 0.92 0.92 0.92 0.92 0.92 0.92Hourly flow rate (vph) 0 141 2200 28 0 27 3257Pedestrians 10 10 10Lane Width (ft) 11.0 11.0 11.0Walking Speed (ft/s) 4.0 4.0 4.0Percent Blockage 1 1 1Right turn flare (veh)Median type None NoneMedian storage veh)Upstream signal (ft) 570 660pX, platoon unblocked 0.79 0.66 0.00 0.66vC, conflicting volume 3374 767 0 2238vC1, stage 1 conf volvC2, stage 2 conf volvCu, unblocked vol 165 0 0 1083tC, single (s) 6.8 6.9 0.0 4.1tC, 2 stage (s)tF (s) 3.5 3.3 0.0 2.2p0 queue free % 100 80 0 94cM capacity (veh/h) 586 707 0 420
Direction, Lane # WB 1 NB 1 NB 2 NB 3 SB 1 SB 2 SB 3 SB 4Volume Total 141 880 880 468 27 1086 1086 1086Volume Left 0 0 0 0 27 0 0 0Volume Right 141 0 0 28 0 0 0 0cSH 707 1700 1700 1700 420 1700 1700 1700Volume to Capacity 0.20 0.52 0.52 0.28 0.06 0.64 0.64 0.64Queue Length 95th (ft) 19 0 0 0 5 0 0 0Control Delay (s) 11.4 0.0 0.0 0.0 14.2 0.0 0.0 0.0Lane LOS B BApproach Delay (s) 11.4 0.0 0.1Approach LOS B
Intersection SummaryAverage Delay 0.4Intersection Capacity Utilization 73.9% ICU Level of Service DAnalysis Period (min) 15

HCM Signalized Intersection Capacity Analysis10: WB 6th Ave Ramp & Federal 11/10/2008
K:\08171\Transportation\Traffic Study\Synchro\2035_Action_PM.syn Synchro 7 - ReportFelsburg Holt & Ullevig Page 10
Movement EBL EBT EBR WBL WBT WBR NBL NBT NBR SBL SBT SBRLane ConfigurationsVolume (vph) 0 0 0 535 316 209 332 1885 0 0 2548 508Ideal Flow (vphpl) 1800 1800 1800 1800 1800 1800 1800 1800 1800 1800 1800 1800Total Lost time (s) 5.0 5.0 5.0 5.0 5.0 5.0 4.0Lane Util. Factor 0.95 0.95 1.00 0.97 0.91 0.81 1.00Frpb, ped/bikes 1.00 1.00 0.97 1.00 1.00 1.00 0.98Flpb, ped/bikes 0.98 0.99 1.00 1.00 1.00 1.00 1.00Frt 1.00 1.00 0.85 1.00 1.00 1.00 0.85Flt Protected 0.95 0.99 1.00 0.95 1.00 1.00 1.00Satd. Flow (prot) 1482 1560 1341 3083 4488 6648 1399Flt Permitted 0.95 0.99 1.00 0.95 1.00 1.00 1.00Satd. Flow (perm) 1482 1560 1341 3083 4488 6648 1399Peak-hour factor, PHF 0.91 0.91 0.91 0.91 0.91 0.91 0.91 0.91 0.91 0.91 0.91 0.91Adj. Flow (vph) 0 0 0 588 347 230 365 2071 0 0 2800 558RTOR Reduction (vph) 0 0 0 0 0 6 0 0 0 0 0 0Lane Group Flow (vph) 0 0 0 459 476 224 365 2071 0 0 2800 558Confl. Peds. (#/hr) 10 10 10 10 10 10 10 10Confl. Bikes (#/hr) 5 5 5 5Heavy Vehicles (%) 2% 2% 2% 4% 4% 4% 4% 5% 2% 2% 6% 4%Bus Blockages (#/hr) 0 0 0 0 0 6 0 6 0 0 0 0Turn Type Perm Perm Prot FreeProtected Phases 4 1 6 2Permitted Phases 4 4 FreeActuated Green, G (s) 31.0 31.0 31.0 12.0 59.0 42.0 100.0Effective Green, g (s) 31.0 31.0 31.0 12.0 59.0 42.0 100.0Actuated g/C Ratio 0.31 0.31 0.31 0.12 0.59 0.42 1.00Clearance Time (s) 5.0 5.0 5.0 5.0 5.0 5.0Vehicle Extension (s) 3.0 3.0 3.0 3.0 3.0 3.0Lane Grp Cap (vph) 459 484 416 370 2648 2792 1399v/s Ratio Prot c0.12 0.46 c0.42v/s Ratio Perm c0.31 0.31 0.17 0.40v/c Ratio 1.00 0.98 0.54 0.99 0.78 1.00 0.40Uniform Delay, d1 34.5 34.2 28.6 43.9 15.6 29.0 0.0Progression Factor 1.00 1.00 1.00 0.68 0.27 0.54 1.00Incremental Delay, d2 42.0 36.4 1.4 29.0 1.2 5.8 0.1Delay (s) 76.5 70.6 29.9 58.8 5.4 21.3 0.1Level of Service E E C E A C AApproach Delay (s) 0.0 64.9 13.4 17.8Approach LOS A E B B
Intersection SummaryHCM Average Control Delay 24.2 HCM Level of Service CHCM Volume to Capacity ratio 1.00Actuated Cycle Length (s) 100.0 Sum of lost time (s) 15.0Intersection Capacity Utilization 85.7% ICU Level of Service EAnalysis Period (min) 15c Critical Lane Group

HCM Signalized Intersection Capacity Analysis11: EB 6th Ave Ramp & Federal 11/10/2008
K:\08171\Transportation\Traffic Study\Synchro\2035_Action_PM.syn Synchro 7 - ReportFelsburg Holt & Ullevig Page 11
Movement EBL EBT EBR WBL WBT WBR NBL NBT NBR SBL SBT SBRLane ConfigurationsVolume (vph) 214 5 273 0 0 0 0 2029 910 214 2869 0Ideal Flow (vphpl) 1800 1800 1800 1800 1800 1800 1800 1800 1800 1800 1800 1800Total Lost time (s) 5.0 5.0 5.0 5.0 5.0 5.0Lane Util. Factor 0.95 0.95 1.00 0.81 0.97 0.91Frpb, ped/bikes 1.00 1.00 0.96 1.00 1.00 1.00Flpb, ped/bikes 1.00 1.00 1.00 1.00 1.00 1.00Frt 1.00 1.00 0.85 0.95 1.00 1.00Flt Protected 0.95 0.95 1.00 1.00 0.95 1.00Satd. Flow (prot) 1510 1518 1372 6432 3144 4481Flt Permitted 0.95 0.95 1.00 1.00 0.95 1.00Satd. Flow (perm) 1510 1518 1372 6432 3144 4481Peak-hour factor, PHF 0.90 0.93 0.90 0.93 0.93 0.93 0.90 0.90 0.93 0.93 0.90 0.90Adj. Flow (vph) 238 5 303 0 0 0 0 2254 978 230 3188 0RTOR Reduction (vph) 0 0 2 0 0 0 0 78 0 0 0 0Lane Group Flow (vph) 121 122 301 0 0 0 0 3154 0 230 3188 0Confl. Peds. (#/hr) 10 10 10 10Confl. Bikes (#/hr) 5 5Heavy Vehicles (%) 4% 2% 4% 2% 2% 2% 2% 5% 2% 2% 6% 2%Bus Blockages (#/hr) 0 0 0 0 0 0 0 6 0 0 0 0Turn Type Split Perm ProtProtected Phases 4 4 2 1 6Permitted Phases 4Actuated Green, G (s) 21.0 21.0 21.0 54.2 9.8 69.0Effective Green, g (s) 21.0 21.0 21.0 54.2 9.8 69.0Actuated g/C Ratio 0.21 0.21 0.21 0.54 0.10 0.69Clearance Time (s) 5.0 5.0 5.0 5.0 5.0 5.0Vehicle Extension (s) 3.0 3.0 3.0 3.0 3.0 3.0Lane Grp Cap (vph) 317 319 288 3486 308 3092v/s Ratio Prot 0.08 0.08 0.49 0.07 c0.71v/s Ratio Perm c0.22v/c Ratio 0.38 0.38 1.05 1.14dr 0.75 1.03Uniform Delay, d1 33.9 33.9 39.5 20.6 43.9 15.5Progression Factor 1.00 1.00 1.00 1.00 1.24 0.83Incremental Delay, d2 0.8 0.8 65.7 4.4 2.4 17.6Delay (s) 34.7 34.7 105.2 25.0 56.8 30.6Level of Service C C F C E CApproach Delay (s) 73.8 0.0 25.0 32.3Approach LOS E A C C
Intersection SummaryHCM Average Control Delay 32.2 HCM Level of Service CHCM Volume to Capacity ratio 1.03Actuated Cycle Length (s) 100.0 Sum of lost time (s) 10.0Intersection Capacity Utilization 85.7% ICU Level of Service EAnalysis Period (min) 15dr Defacto Right Lane. Recode with 1 though lane as a right lane.c Critical Lane Group