Embed Size (px)
Citation preview
Traffic Safety Basic Facts 2013 - Main Figures
Traffic Safety Basic Facts 2015 Pedestrians
Pedestrians
Traffic Safety Basic Facts 2017

Traffic Safety Basic Facts 2017 - Pedestrians
- 2 -
In 2015, 5.435 pedestrians died in road accidents in the EU, 21%
of all road fatalities.
General In 2015, 5.435 pedestrians were killed in road accidents in the EU (excluding Lithuania), which is 21% of all road fatalities. During the decade 2006-2015, in the European Union, pedestrian fatalities were reduced by 36%, while the total number of fatalities was reduced by almost 40%. Figure 1: Number of pedestrian fatalities and all road fatalities, EU, 2006-2015
Source: CARE database, data available in May 2017
Figure 1 shows the trend of the number of pedestrian fatalities over the period 2006-2015 in comparison with the respective trend of total road fatalities over the same period.
2.000
4.000
6.000
8.000
10.000
20.000
25.000
30.000
35.000
40.000
45.000
2006 2007 2008 2009 2010 2011 2012 2013 2014 2015
Ped
estr
ian f
ata
litie
s
Tota
l ro
ad f
ata
litie
s
Total roadfatalitiesPedestrianfatalities
Traffic Safety Basic Facts 2017 - Pedestrians
- 3 -
The number of pedestrians who
were killed in road accidents decreased by 36% from 2006 to
2015.
In Latvia, Ireland, Slovenia and
Denmark the decrease was higher than 55% between 2006
and 2015.
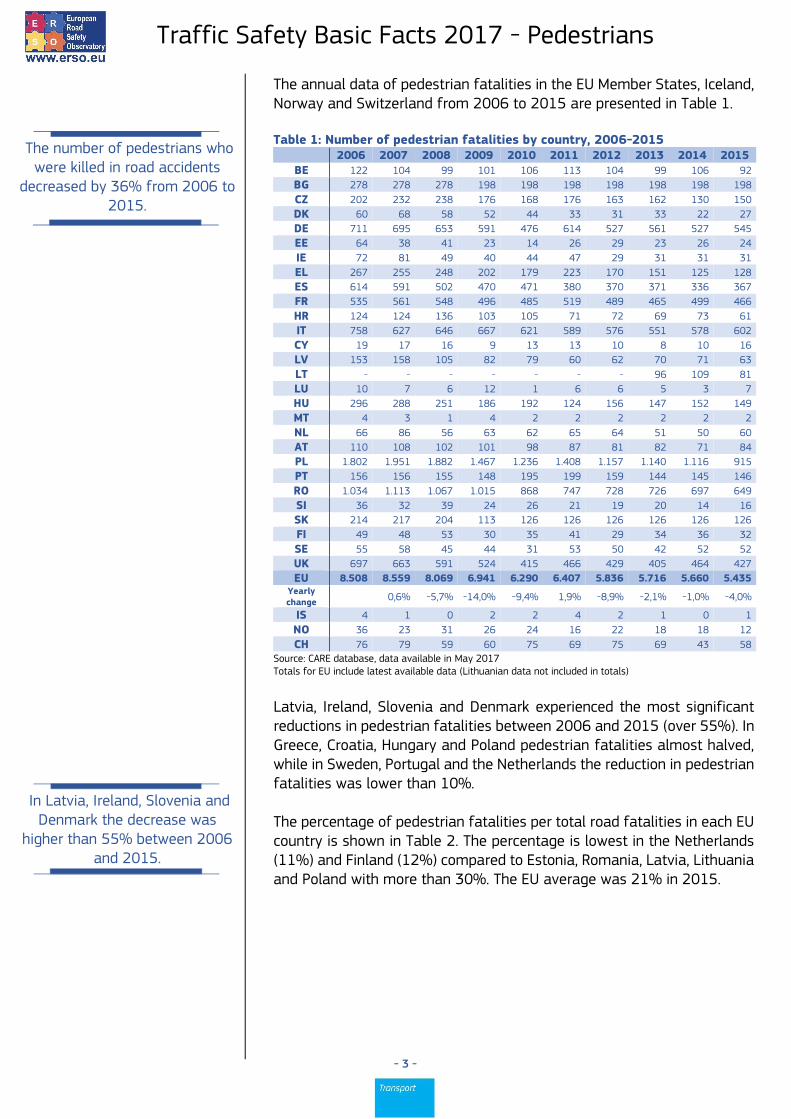
The annual data of pedestrian fatalities in the EU Member States, Iceland, Norway and Switzerland from 2006 to 2015 are presented in Table 1. Table 1: Number of pedestrian fatalities by country, 2006-2015
2006 2007 2008 2009 2010 2011 2012 2013 2014 2015
BE 122 104 99 101 106 113 104 99 106 92
BG 278 278 278 198 198 198 198 198 198 198
CZ 202 232 238 176 168 176 163 162 130 150
DK 60 68 58 52 44 33 31 33 22 27
DE 711 695 653 591 476 614 527 561 527 545
EE 64 38 41 23 14 26 29 23 26 24
IE 72 81 49 40 44 47 29 31 31 31
EL 267 255 248 202 179 223 170 151 125 128
ES 614 591 502 470 471 380 370 371 336 367
FR 535 561 548 496 485 519 489 465 499 466
HR 124 124 136 103 105 71 72 69 73 61
IT 758 627 646 667 621 589 576 551 578 602
CY 19 17 16 9 13 13 10 8 10 16
LV 153 158 105 82 79 60 62 70 71 63
LT - - - - - - - 96 109 81
LU 10 7 6 12 1 6 6 5 3 7
HU 296 288 251 186 192 124 156 147 152 149
MT 4 3 1 4 2 2 2 2 2 2
NL 66 86 56 63 62 65 64 51 50 60
AT 110 108 102 101 98 87 81 82 71 84
PL 1.802 1.951 1.882 1.467 1.236 1.408 1.157 1.140 1.116 915
PT 156 156 155 148 195 199 159 144 145 146
RO 1.034 1.113 1.067 1.015 868 747 728 726 697 649
SI 36 32 39 24 26 21 19 20 14 16
SK 214 217 204 113 126 126 126 126 126 126
FI 49 48 53 30 35 41 29 34 36 32
SE 55 58 45 44 31 53 50 42 52 52
UK 697 663 591 524 415 466 429 405 464 427
EU 8.508 8.559 8.069 6.941 6.290 6.407 5.836 5.716 5.660 5.435 Yearly change 0,6% -5,7% -14,0% -9,4% 1,9% -8,9% -2,1% -1,0% -4,0%
IS 4 1 0 2 2 4 2 1 0 1
NO 36 23 31 26 24 16 22 18 18 12
CH 76 79 59 60 75 69 75 69 43 58
Source: CARE database, data available in May 2017 Totals for EU include latest available data (Lithuanian data not included in totals)
Latvia, Ireland, Slovenia and Denmark experienced the most significant reductions in pedestrian fatalities between 2006 and 2015 (over 55%). In Greece, Croatia, Hungary and Poland pedestrian fatalities almost halved, while in Sweden, Portugal and the Netherlands the reduction in pedestrian fatalities was lower than 10%. The percentage of pedestrian fatalities per total road fatalities in each EU country is shown in Table 2. The percentage is lowest in the Netherlands (11%) and Finland (12%) compared to Estonia, Romania, Latvia, Lithuania and Poland with more than 30%. The EU average was 21% in 2015.
Traffic Safety Basic Facts 2017 - Pedestrians
- 4 -
The percentage of pedestrian fatalities of all road fatalities differs widely across Europe.
In Estonia almost 36% of all
road fatalities were pedestrians; the highest percentage among
the EU countries.
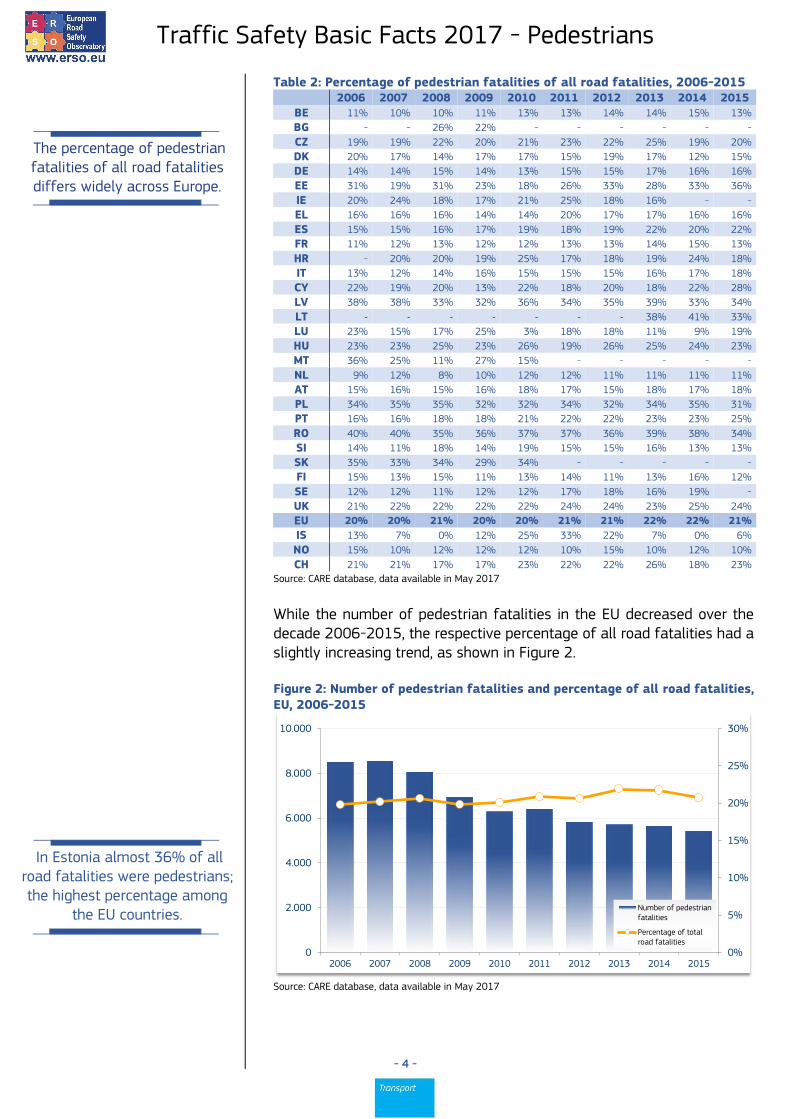
Table 2: Percentage of pedestrian fatalities of all road fatalities, 2006-2015
2006 2007 2008 2009 2010 2011 2012 2013 2014 2015
BE 11% 10% 10% 11% 13% 13% 14% 14% 15% 13%
BG - - 26% 22% - - - - - -
CZ 19% 19% 22% 20% 21% 23% 22% 25% 19% 20%
DK 20% 17% 14% 17% 17% 15% 19% 17% 12% 15%
DE 14% 14% 15% 14% 13% 15% 15% 17% 16% 16%
EE 31% 19% 31% 23% 18% 26% 33% 28% 33% 36%
IE 20% 24% 18% 17% 21% 25% 18% 16% - -
EL 16% 16% 16% 14% 14% 20% 17% 17% 16% 16%
ES 15% 15% 16% 17% 19% 18% 19% 22% 20% 22%
FR 11% 12% 13% 12% 12% 13% 13% 14% 15% 13%
HR - 20% 20% 19% 25% 17% 18% 19% 24% 18%
IT 13% 12% 14% 16% 15% 15% 15% 16% 17% 18%
CY 22% 19% 20% 13% 22% 18% 20% 18% 22% 28%
LV 38% 38% 33% 32% 36% 34% 35% 39% 33% 34%
LT - - - - - - - 38% 41% 33%
LU 23% 15% 17% 25% 3% 18% 18% 11% 9% 19%
HU 23% 23% 25% 23% 26% 19% 26% 25% 24% 23%
MT 36% 25% 11% 27% 15% - - - - -
NL 9% 12% 8% 10% 12% 12% 11% 11% 11% 11%
AT 15% 16% 15% 16% 18% 17% 15% 18% 17% 18%
PL 34% 35% 35% 32% 32% 34% 32% 34% 35% 31%
PT 16% 16% 18% 18% 21% 22% 22% 23% 23% 25%
RO 40% 40% 35% 36% 37% 37% 36% 39% 38% 34%
SI 14% 11% 18% 14% 19% 15% 15% 16% 13% 13%
SK 35% 33% 34% 29% 34% - - - - -
FI 15% 13% 15% 11% 13% 14% 11% 13% 16% 12%
SE 12% 12% 11% 12% 12% 17% 18% 16% 19% -
UK 21% 22% 22% 22% 22% 24% 24% 23% 25% 24%
EU 20% 20% 21% 20% 20% 21% 21% 22% 22% 21%
IS 13% 7% 0% 12% 25% 33% 22% 7% 0% 6%
NO 15% 10% 12% 12% 12% 10% 15% 10% 12% 10%
CH 21% 21% 17% 17% 23% 22% 22% 26% 18% 23%
Source: CARE database, data available in May 2017
While the number of pedestrian fatalities in the EU decreased over the decade 2006-2015, the respective percentage of all road fatalities had a slightly increasing trend, as shown in Figure 2. Figure 2: Number of pedestrian fatalities and percentage of all road fatalities, EU, 2006-2015
Source: CARE database, data available in May 2017
0%
5%
10%
15%
20%
25%
30%
0
2.000
4.000
6.000
8.000
10.000
2006 2007 2008 2009 2010 2011 2012 2013 2014 2015
Number of pedestrianfatalities
Percentage of totalroad fatalities

Traffic Safety Basic Facts 2017 - Pedestrians
- 5 -
The lowest pedestrian fatality
rate in 2015 was in the Netherlands (4) and the highest
rate was in Romania (33).
To compare the pedestrian fatality numbers of different countries, Table 3 takes account of the respective population size. The pedestrian fatality rates vary from 4 pedestrian fatalities per million population in the Netherlands to 33 pedestrian fatalities per million population in Romania, a rate more than 8 times higher. Table 3: Pedestrian fatality rates per million population by country, 2006-2015
2006 2007 2008 2009 2010 2011 2012 2013 2014 2015
BE 12 10 9 9 10 10 9 9 9 8
BG - - 37 27 - - - - - -
CZ 20 23 23 17 16 17 16 15 12 14
DK 11 12 11 9 8 6 6 6 4 5
DE 9 8 8 7 6 8 7 7 7 7
EE 47 28 31 17 11 20 22 17 20 18
IE 17 19 11 9 10 10 6 7 - -
EL 24 23 22 18 16 20 15 14 11 12
ES 14 13 11 10 10 8 8 8 7 8
FR 8 9 9 8 8 8 7 7 8 7
HR - 29 32 24 24 17 17 16 17 14
IT 13 11 11 11 10 10 10 9 10 10
CY 26 22 21 11 16 15 12 9 12 19
LV 69 72 48 38 37 29 30 35 35 32
LT 32 37 28
LU 21 15 12 24 2 12 11 9 5 12
HU 29 29 25 19 19 12 16 15 15 15
MT 10 7 2 10 5 - - - - -
NL 4 5 3 4 4 4 4 3 3 4
AT 13 13 12 12 12 10 10 10 8 10
PL 47 51 49 38 33 37 30 30 29 24
PT 15 15 15 14 18 19 15 14 14 14
RO 49 53 52 50 43 37 36 36 35 33
SI 18 16 19 12 13 10 9 10 7 8
SK 40 40 38 21 23 - - - - -
FI 9 9 10 6 7 8 5 6 7 6
SE 6 6 5 5 3 6 5 4 5 -
UK 11 11 10 8 7 7 7 6 7 7
EU 17 17 16 14 13 13 12 11 11 11
IS 13 3 0 6 6 13 6 3 0 3
NO 8 5 7 5 5 3 4 4 4 2
CH 10 11 8 8 10 9 9 9 5 7
Sources: CARE database (EUROSTAT for population data), data available in May 2017
Figure 3: Pedestrian fatality rates per million population by country, 2015 or latest available year
Sources: CARE database (EUROSTAT for population data), data available in May 2017
0
5
10
15
20
25
30
35
RO LV LT PL CY EE HU HR CZ PT LU EL EU IT AT BE ES SI FR DE IE UK FI SE DK NL
Traffic Safety Basic Facts 2017 - Pedestrians
- 6 -
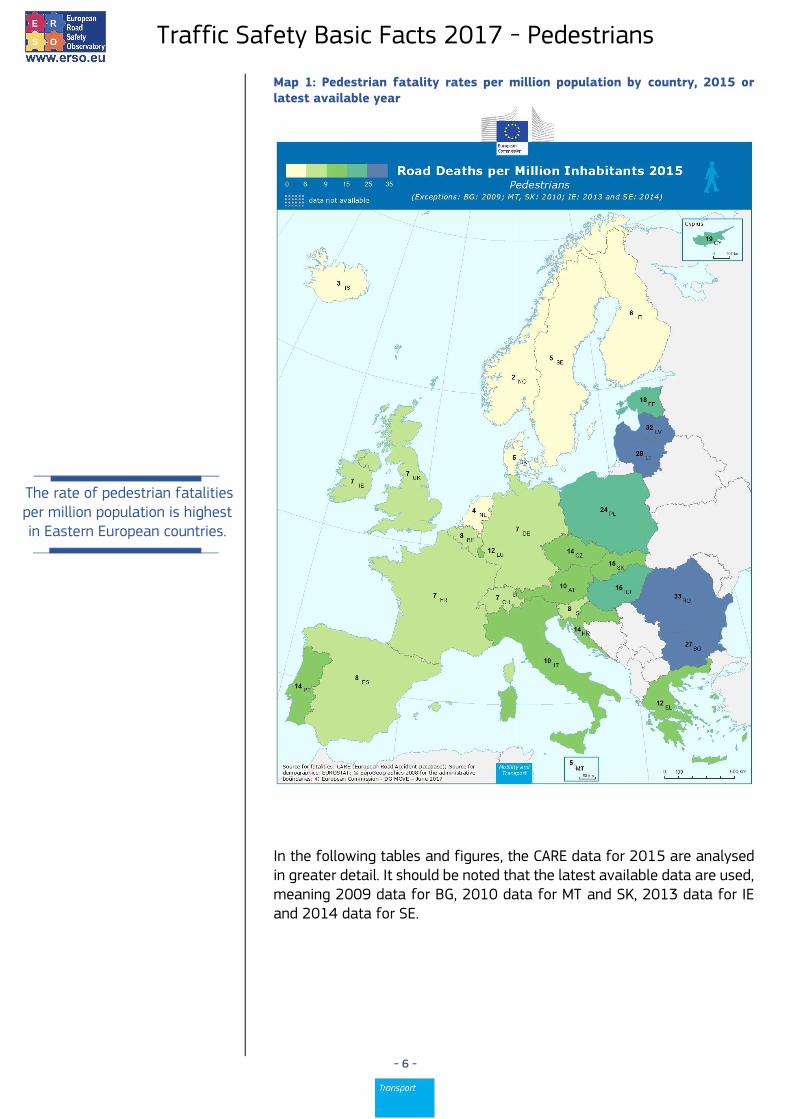
The rate of pedestrian fatalities per million population is highest in Eastern European countries.
Map 1: Pedestrian fatality rates per million population by country, 2015 or latest available year
In the following tables and figures, the CARE data for 2015 are analysed in greater detail. It should be noted that the latest available data are used, meaning 2009 data for BG, 2010 data for MT and SK, 2013 data for IE and 2014 data for SE.
Traffic Safety Basic Facts 2017 - Pedestrians
- 7 -
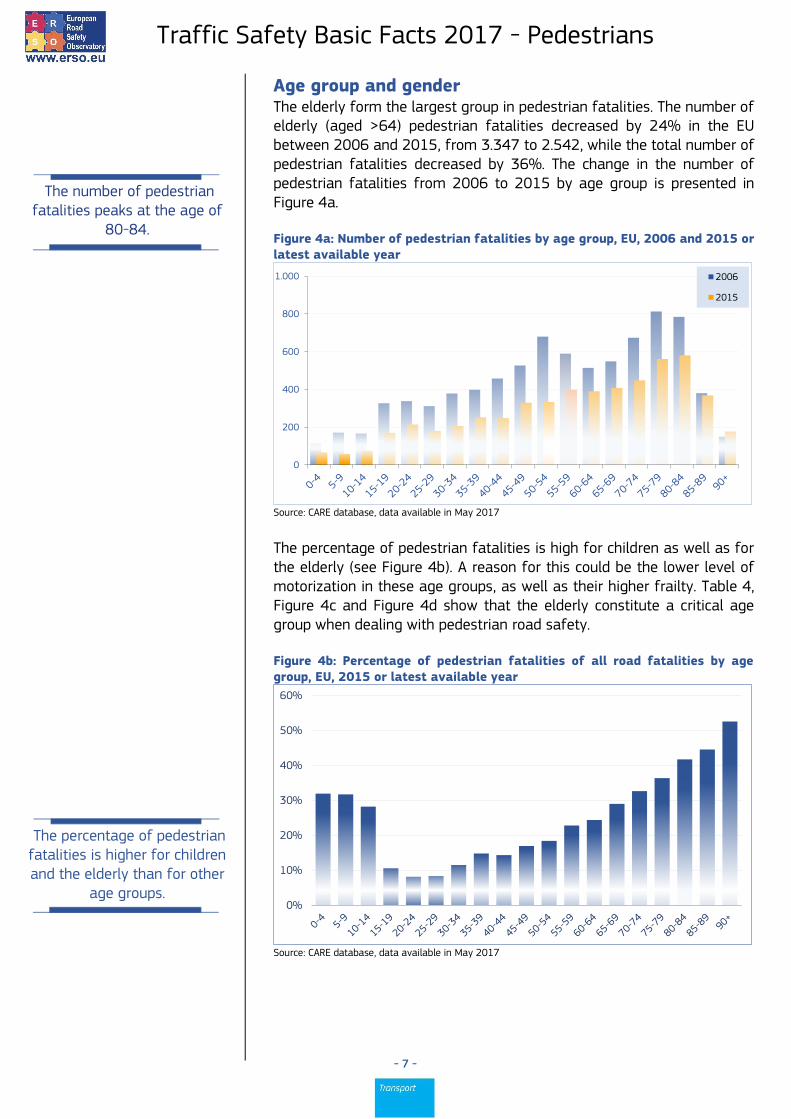
The number of pedestrian
fatalities peaks at the age of 80-84.
The percentage of pedestrian fatalities is higher for children and the elderly than for other
age groups.
Age group and gender The elderly form the largest group in pedestrian fatalities. The number of elderly (aged >64) pedestrian fatalities decreased by 24% in the EU between 2006 and 2015, from 3.347 to 2.542, while the total number of pedestrian fatalities decreased by 36%. The change in the number of pedestrian fatalities from 2006 to 2015 by age group is presented in Figure 4a. Figure 4a: Number of pedestrian fatalities by age group, EU, 2006 and 2015 or latest available year
Source: CARE database, data available in May 2017
The percentage of pedestrian fatalities is high for children as well as for the elderly (see Figure 4b). A reason for this could be the lower level of motorization in these age groups, as well as their higher frailty. Table 4, Figure 4c and Figure 4d show that the elderly constitute a critical age group when dealing with pedestrian road safety. Figure 4b: Percentage of pedestrian fatalities of all road fatalities by age group, EU, 2015 or latest available year
Source: CARE database, data available in May 2017
0
200
400
600
800
1.000 2006
2015
0%
10%
20%
30%
40%
50%
60%
Traffic Safety Basic Facts 2017 - Pedestrians
- 8 -
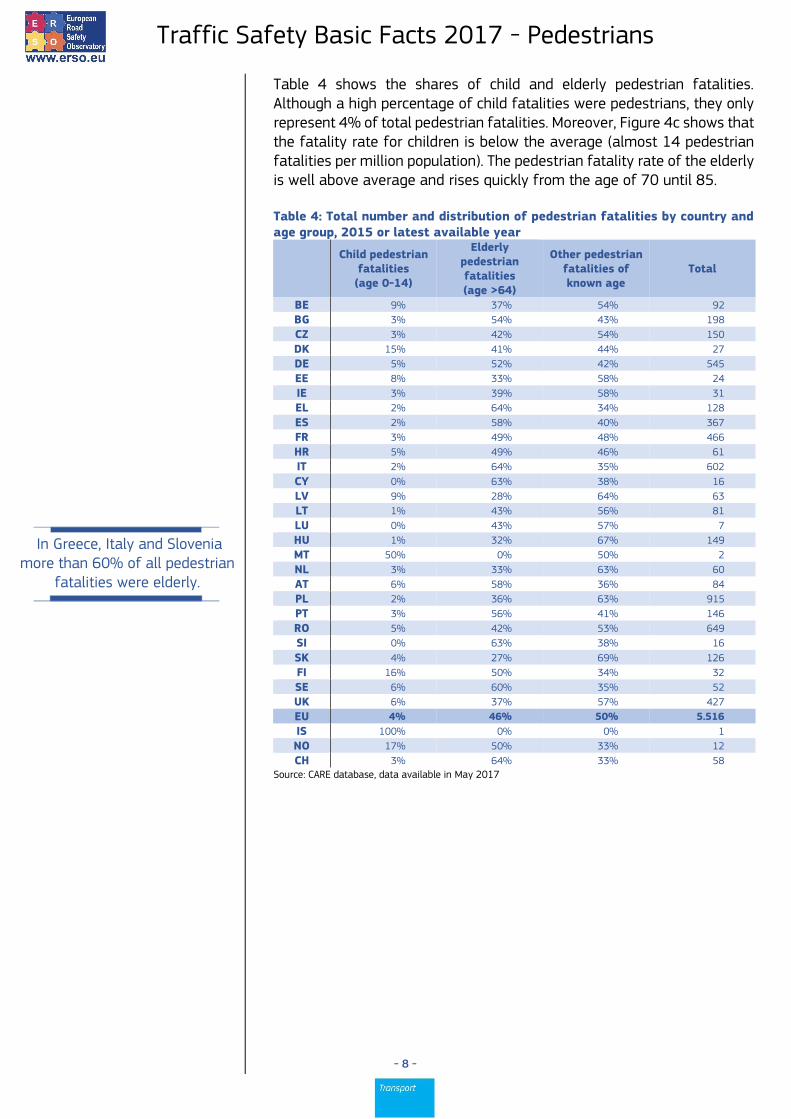
In Greece, Italy and Slovenia
more than 60% of all pedestrian fatalities were elderly.
Table 4 shows the shares of child and elderly pedestrian fatalities. Although a high percentage of child fatalities were pedestrians, they only represent 4% of total pedestrian fatalities. Moreover, Figure 4c shows that the fatality rate for children is below the average (almost 14 pedestrian fatalities per million population). The pedestrian fatality rate of the elderly is well above average and rises quickly from the age of 70 until 85. Table 4: Total number and distribution of pedestrian fatalities by country and age group, 2015 or latest available year
Child pedestrian fatalities (age 0-14)
Elderly pedestrian fatalities (age >64)
Other pedestrian fatalities of known age
Total
BE 9% 37% 54% 92
BG 3% 54% 43% 198
CZ 3% 42% 54% 150
DK 15% 41% 44% 27
DE 5% 52% 42% 545
EE 8% 33% 58% 24
IE 3% 39% 58% 31
EL 2% 64% 34% 128
ES 2% 58% 40% 367
FR 3% 49% 48% 466
HR 5% 49% 46% 61
IT 2% 64% 35% 602
CY 0% 63% 38% 16
LV 9% 28% 64% 63
LT 1% 43% 56% 81
LU 0% 43% 57% 7
HU 1% 32% 67% 149
MT 50% 0% 50% 2
NL 3% 33% 63% 60
AT 6% 58% 36% 84
PL 2% 36% 63% 915
PT 3% 56% 41% 146
RO 5% 42% 53% 649
SI 0% 63% 38% 16
SK 4% 27% 69% 126
FI 16% 50% 34% 32
SE 6% 60% 35% 52
UK 6% 37% 57% 427
EU 4% 46% 50% 5.516
IS 100% 0% 0% 1
NO 17% 50% 33% 12
CH 3% 64% 33% 58
Source: CARE database, data available in May 2017

Traffic Safety Basic Facts 2017 - Pedestrians
- 9 -
The fatality rate of pedestrians
aged at least 80 years old is more than ten times the rate of
children.
Figure 4c: Pedestrian fatality rates per million population by age group, EU, 2015 or latest available year
Sources: CARE database (EUROSTAT for population data), data available in May 2017
Figure 4d shows the variation of the percentage of elderly pedestrian fatalities between the EU countries in 2015. More than 60% of all pedestrian fatalities in Greece, Italy, Cyprus and Slovenia were elderly. Latvia had the lowest rate with 28% of pedestrian fatalities being elderly. The EU average was 47%. Figure 4d: Percentage of elderly pedestrian fatalities (age>64) of all pedestrian fatalities by country, 2015 or latest available year
Source: CARE database, data available in May 2017
Figure 4e shows that the percentage of child pedestrian fatalities varies widely among the EU countries. 16% of pedestrian fatalities in Finland and 15% in Denmark were children, compared with 1% in Hungary, and Lithuania. In Slovenia and Cyprus, no child pedestrian fatalities were recorded in 2015.
0
10
20
30
40
50
0%
10%
20%
30%
40%
50%
60%
70%
EL IT CY SI SE AT ES PT DE FI HR FR EU LU LT CZ RO DK IE UK BE PL EE NL HU LV

Traffic Safety Basic Facts 2017 - Pedestrians
- 10 -
The percentage of child
pedestrian fatalities in 2015 varies widely among the EU
countries.
More than one third of
pedestrian fatalities were female, compared with less than one quarter of all road fatalities.
Figure 4e: Percentage of child pedestrian fatalities (age 0-14) of all pedestrian fatalities by country, 2015 or latest available year
Source: CARE database, data available in May 2017
Figure 5 shows the distribution of fatalities by gender, comparing pedestrian fatalities and all fatalities. More than one third of pedestrian fatalities were female, compared with less than one quarter of all fatalities. Map 2 shows the distribution of pedestrian fatalities by gender in the different EU countries, Iceland, Norway and Switzerland. Figure 5: Distribution of pedestrian and all road fatalities by gender, EU, 2015 or latest available year
Source: CARE database, data available in May 2017
0%
2%
4%
6%
8%
10%
12%
14%
16%
18%
FI DK BE LV EE AT SE UK RO DE HR EU PT FR CZ NL IE EL ES PL IT LT HU CY LU SI
Female36%
Male64%
PEDESTRIAN FATALITIES
Female24%
Male76%
ALL ROAD FATALITIES

Traffic Safety Basic Facts 2017 - Pedestrians
- 11 -
There were more male than
female pedestrian fatalities in most EU countries.
Map 2: Distribution of pedestrian fatalities by country and gender, 2015 or latest available year
Traffic Safety Basic Facts 2017 - Pedestrians
- 12 -
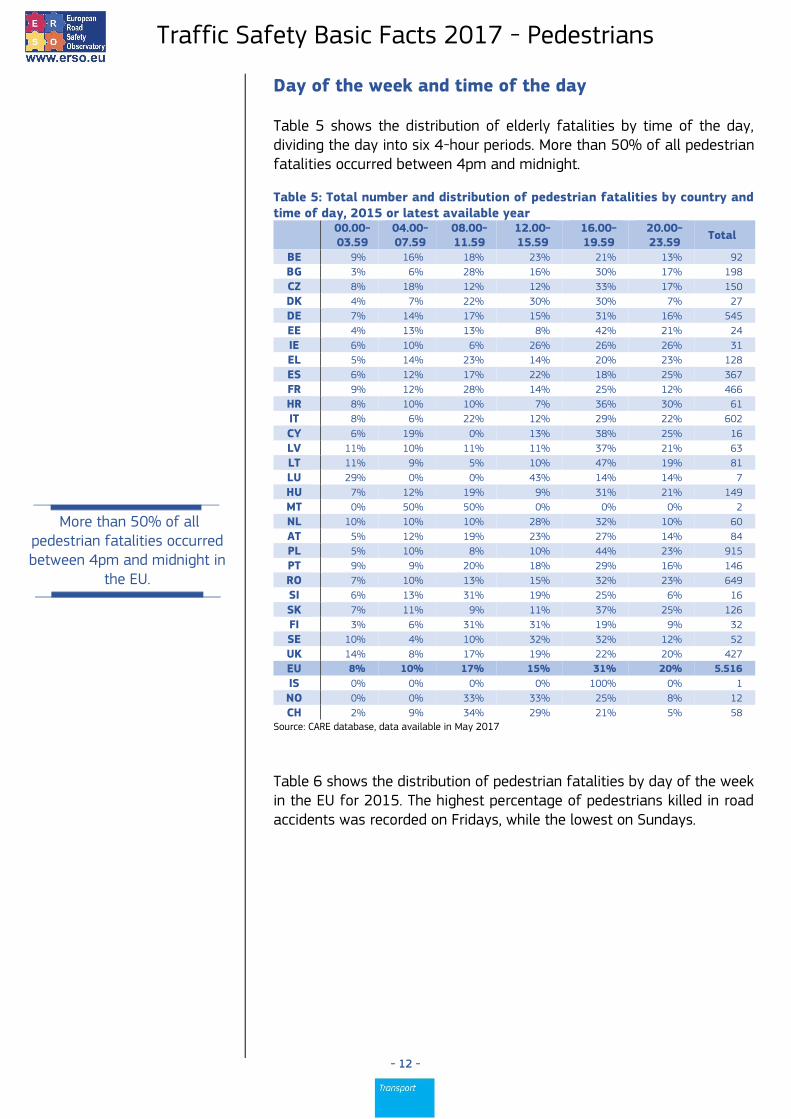
More than 50% of all
pedestrian fatalities occurred between 4pm and midnight in
the EU.
Day of the week and time of the day Table 5 shows the distribution of elderly fatalities by time of the day, dividing the day into six 4-hour periods. More than 50% of all pedestrian fatalities occurred between 4pm and midnight. Table 5: Total number and distribution of pedestrian fatalities by country and time of day, 2015 or latest available year
00.00-03.59
04.00-07.59
08.00-11.59
12.00-15.59
16.00-19.59
20.00-23.59
Total
BE 9% 16% 18% 23% 21% 13% 92
BG 3% 6% 28% 16% 30% 17% 198
CZ 8% 18% 12% 12% 33% 17% 150
DK 4% 7% 22% 30% 30% 7% 27
DE 7% 14% 17% 15% 31% 16% 545
EE 4% 13% 13% 8% 42% 21% 24
IE 6% 10% 6% 26% 26% 26% 31
EL 5% 14% 23% 14% 20% 23% 128
ES 6% 12% 17% 22% 18% 25% 367
FR 9% 12% 28% 14% 25% 12% 466
HR 8% 10% 10% 7% 36% 30% 61
IT 8% 6% 22% 12% 29% 22% 602
CY 6% 19% 0% 13% 38% 25% 16
LV 11% 10% 11% 11% 37% 21% 63
LT 11% 9% 5% 10% 47% 19% 81
LU 29% 0% 0% 43% 14% 14% 7
HU 7% 12% 19% 9% 31% 21% 149
MT 0% 50% 50% 0% 0% 0% 2
NL 10% 10% 10% 28% 32% 10% 60
AT 5% 12% 19% 23% 27% 14% 84
PL 5% 10% 8% 10% 44% 23% 915
PT 9% 9% 20% 18% 29% 16% 146
RO 7% 10% 13% 15% 32% 23% 649
SI 6% 13% 31% 19% 25% 6% 16
SK 7% 11% 9% 11% 37% 25% 126
FI 3% 6% 31% 31% 19% 9% 32
SE 10% 4% 10% 32% 32% 12% 52
UK 14% 8% 17% 19% 22% 20% 427
EU 8% 10% 17% 15% 31% 20% 5.516
IS 0% 0% 0% 0% 100% 0% 1
NO 0% 0% 33% 33% 25% 8% 12
CH 2% 9% 34% 29% 21% 5% 58
Source: CARE database, data available in May 2017
Table 6 shows the distribution of pedestrian fatalities by day of the week in the EU for 2015. The highest percentage of pedestrians killed in road accidents was recorded on Fridays, while the lowest on Sundays.
Traffic Safety Basic Facts 2017 - Pedestrians
- 13 -
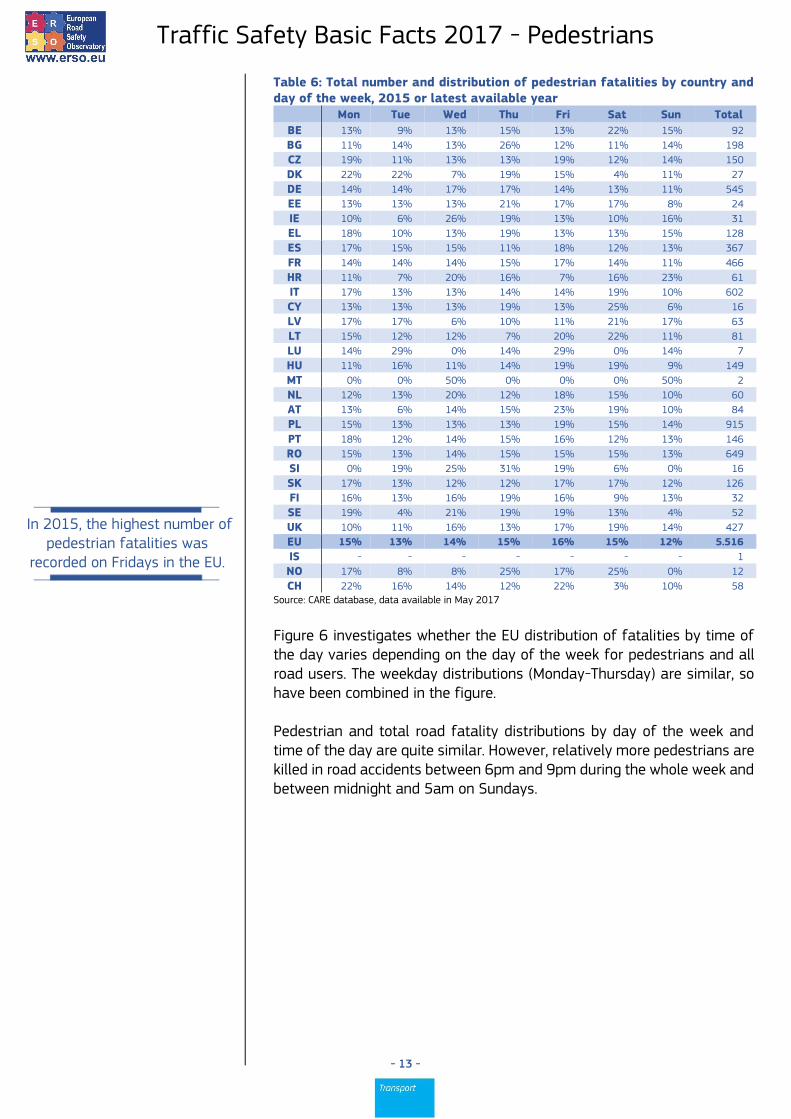
In 2015, the highest number of
pedestrian fatalities was recorded on Fridays in the EU.
Table 6: Total number and distribution of pedestrian fatalities by country and day of the week, 2015 or latest available year
Mon Tue Wed Thu Fri Sat Sun Total
BE 13% 9% 13% 15% 13% 22% 15% 92
BG 11% 14% 13% 26% 12% 11% 14% 198
CZ 19% 11% 13% 13% 19% 12% 14% 150
DK 22% 22% 7% 19% 15% 4% 11% 27
DE 14% 14% 17% 17% 14% 13% 11% 545
EE 13% 13% 13% 21% 17% 17% 8% 24
IE 10% 6% 26% 19% 13% 10% 16% 31
EL 18% 10% 13% 19% 13% 13% 15% 128
ES 17% 15% 15% 11% 18% 12% 13% 367
FR 14% 14% 14% 15% 17% 14% 11% 466
HR 11% 7% 20% 16% 7% 16% 23% 61
IT 17% 13% 13% 14% 14% 19% 10% 602
CY 13% 13% 13% 19% 13% 25% 6% 16
LV 17% 17% 6% 10% 11% 21% 17% 63
LT 15% 12% 12% 7% 20% 22% 11% 81
LU 14% 29% 0% 14% 29% 0% 14% 7
HU 11% 16% 11% 14% 19% 19% 9% 149
MT 0% 0% 50% 0% 0% 0% 50% 2
NL 12% 13% 20% 12% 18% 15% 10% 60
AT 13% 6% 14% 15% 23% 19% 10% 84
PL 15% 13% 13% 13% 19% 15% 14% 915
PT 18% 12% 14% 15% 16% 12% 13% 146
RO 15% 13% 14% 15% 15% 15% 13% 649
SI 0% 19% 25% 31% 19% 6% 0% 16
SK 17% 13% 12% 12% 17% 17% 12% 126
FI 16% 13% 16% 19% 16% 9% 13% 32
SE 19% 4% 21% 19% 19% 13% 4% 52
UK 10% 11% 16% 13% 17% 19% 14% 427
EU 15% 13% 14% 15% 16% 15% 12% 5.516
IS - - - - - - - 1
NO 17% 8% 8% 25% 17% 25% 0% 12
CH 22% 16% 14% 12% 22% 3% 10% 58
Source: CARE database, data available in May 2017
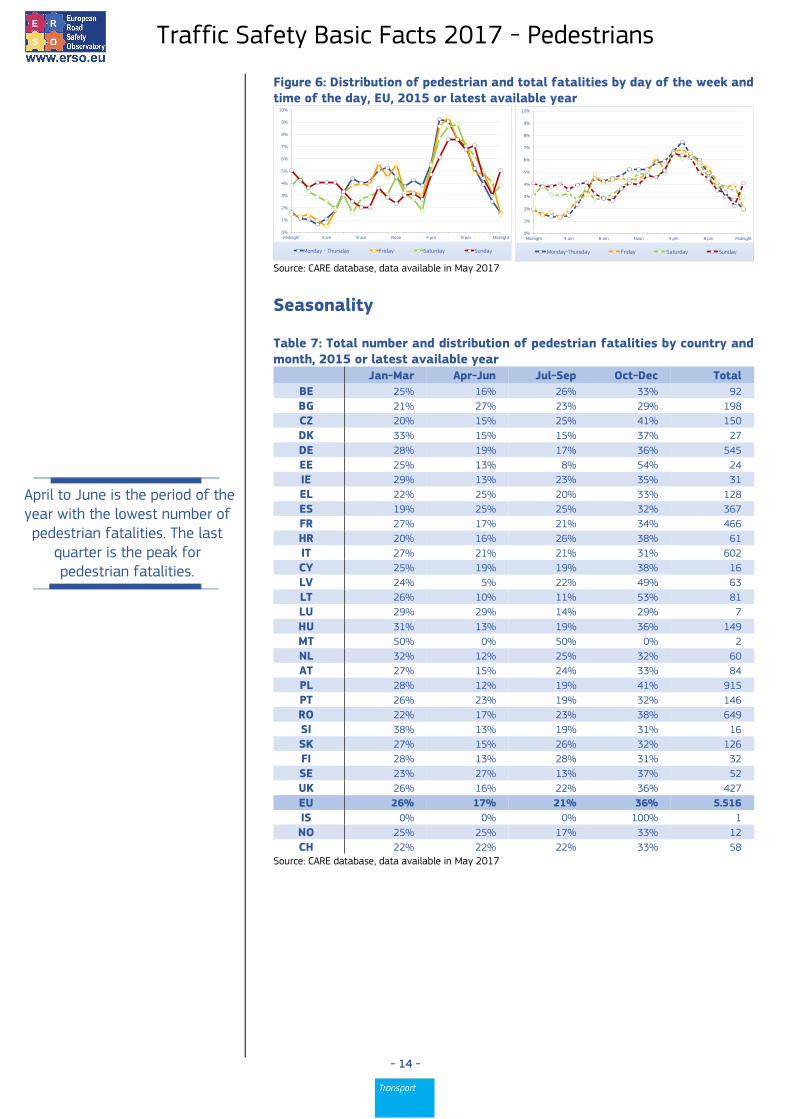
Figure 6 investigates whether the EU distribution of fatalities by time of the day varies depending on the day of the week for pedestrians and all road users. The weekday distributions (Monday-Thursday) are similar, so have been combined in the figure. Pedestrian and total road fatality distributions by day of the week and time of the day are quite similar. However, relatively more pedestrians are killed in road accidents between 6pm and 9pm during the whole week and between midnight and 5am on Sundays.
Traffic Safety Basic Facts 2017 - Pedestrians
- 14 -
April to June is the period of the year with the lowest number of pedestrian fatalities. The last
quarter is the peak for pedestrian fatalities.
Figure 6: Distribution of pedestrian and total fatalities by day of the week and time of the day, EU, 2015 or latest available year
Source: CARE database, data available in May 2017
Seasonality
Table 7: Total number and distribution of pedestrian fatalities by country and month, 2015 or latest available year
Jan-Mar Apr-Jun Jul-Sep Oct-Dec Total
BE 25% 16% 26% 33% 92
BG 21% 27% 23% 29% 198
CZ 20% 15% 25% 41% 150
DK 33% 15% 15% 37% 27
DE 28% 19% 17% 36% 545
EE 25% 13% 8% 54% 24
IE 29% 13% 23% 35% 31
EL 22% 25% 20% 33% 128
ES 19% 25% 25% 32% 367
FR 27% 17% 21% 34% 466
HR 20% 16% 26% 38% 61
IT 27% 21% 21% 31% 602
CY 25% 19% 19% 38% 16
LV 24% 5% 22% 49% 63
LT 26% 10% 11% 53% 81
LU 29% 29% 14% 29% 7
HU 31% 13% 19% 36% 149
MT 50% 0% 50% 0% 2
NL 32% 12% 25% 32% 60
AT 27% 15% 24% 33% 84
PL 28% 12% 19% 41% 915
PT 26% 23% 19% 32% 146
RO 22% 17% 23% 38% 649
SI 38% 13% 19% 31% 16
SK 27% 15% 26% 32% 126
FI 28% 13% 28% 31% 32
SE 23% 27% 13% 37% 52
UK 26% 16% 22% 36% 427
EU 26% 17% 21% 36% 5.516
IS 0% 0% 0% 100% 1
NO 25% 25% 17% 33% 12
CH 22% 22% 22% 33% 58
Source: CARE database, data available in May 2017
0%
1%
2%
3%
4%
5%
6%
7%
8%
9%
10%
Midnight 4 am 8 am Noon 4 pm 8 pm Midnight
Monday - Thursday Friday Saturday Sunday
0%
1%
2%
3%
4%
5%
6%
7%
8%
9%
10%
Midnight 4 am 8 am Noon 4 pm 8 pm Midnight
Monday-Thursday Friday Saturday Sunday
Traffic Safety Basic Facts 2017 - Pedestrians
- 15 -
The number of pedestrian
fatalities per month peaks in the winter, especially in December, whereas the overall number of fatalities peaks in the summer.
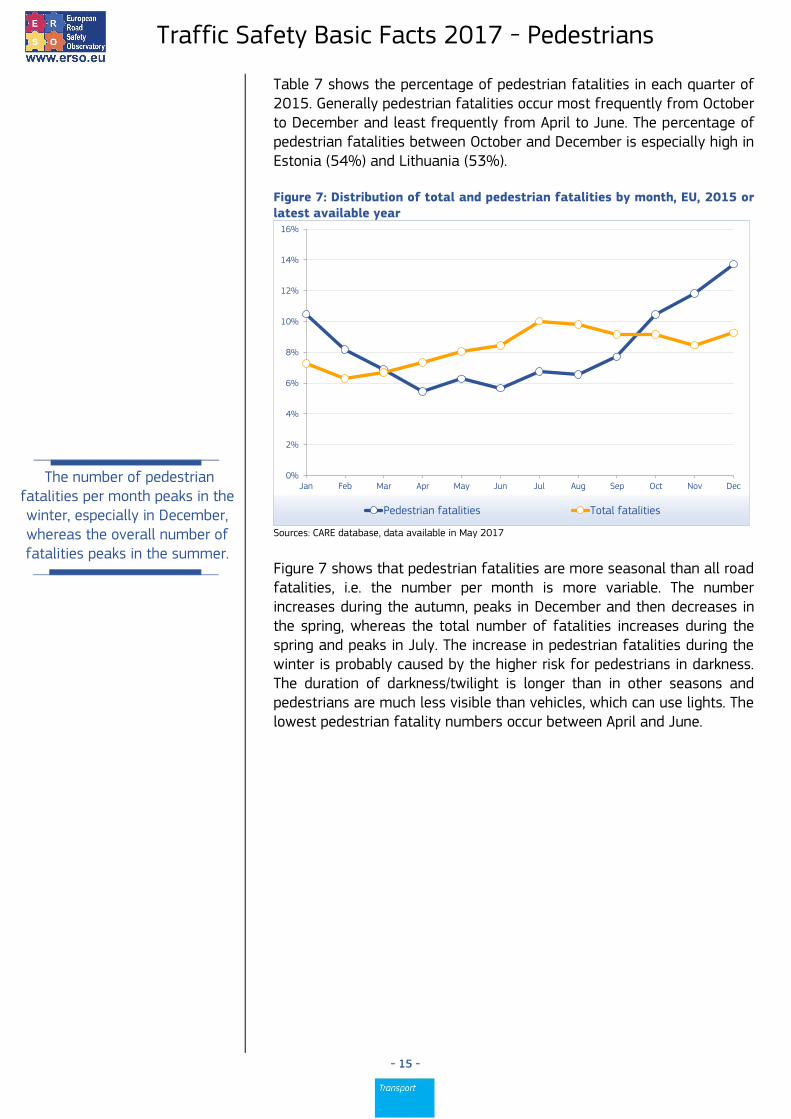
Table 7 shows the percentage of pedestrian fatalities in each quarter of 2015. Generally pedestrian fatalities occur most frequently from October to December and least frequently from April to June. The percentage of pedestrian fatalities between October and December is especially high in Estonia (54%) and Lithuania (53%). Figure 7: Distribution of total and pedestrian fatalities by month, EU, 2015 or latest available year
Sources: CARE database, data available in May 2017
Figure 7 shows that pedestrian fatalities are more seasonal than all road fatalities, i.e. the number per month is more variable. The number increases during the autumn, peaks in December and then decreases in the spring, whereas the total number of fatalities increases during the spring and peaks in July. The increase in pedestrian fatalities during the winter is probably caused by the higher risk for pedestrians in darkness. The duration of darkness/twilight is longer than in other seasons and pedestrians are much less visible than vehicles, which can use lights. The lowest pedestrian fatality numbers occur between April and June.
0%
2%
4%
6%
8%
10%
12%
14%
16%
Jan Feb Mar Apr May Jun Jul Aug Sep Oct Nov Dec
Pedestrian fatalities Total fatalities

Traffic Safety Basic Facts 2017 - Pedestrians
- 16 -
In 2015, 45% of all pedestrian fatalities in the EU occurred in
darkness.
Lighting conditions Table 8 shows the distribution of pedestrian fatalities by lighting conditions. 45% of pedestrian fatalities in the EU occurred in darkness, whilst 37% of pedestrian fatalities were recorded in daylight. In Italy, Malta and the Netherlands, lighting conditions for pedestrian fatalities were not recorded in 2015. Table 8: Total number and distribution of pedestrian fatalities by country and lighting conditions, 2015 or latest available year
Dark
ness
no s
treet
lights
Dark
ness
no s
treet
lights
or
stre
et
lights
unlit
Dark
ness
st
reet
lights
lit
Dark
ness
st
reet
lights
unknow
n
Dark
ness
st
reet
lights
unlit
Daylight
Tw
ilig
ht
Unknow
n
Tota
l
BE 0% 0% 29% 0% 7% 53% 8% 3% 92
BG 26% 0% 8% 0% 0% 61% 5% 0% 198
CZ 0% 0% 23% 0% 31% 37% 9% 0% 150
DK 22% 0% 7% 0% 0% 63% 7% 0% 27
DE 0% 0% 0% 53% 0% 43% 4% 0% 545
EE 0% 0% 63% 0% 0% 29% 0% 8% 24
IE 29% 0% 23% 0% 0% 45% 0% 3% 31
EL 9% 0% 30% 0% 5% 45% 12% 0% 128
ES 15% 0% 22% 0% 2% 50% 10% 0% 367
FR 22% 0% 15% 0% 2% 55% 6% 0% 466
HR 13% 0% 48% 0% 3% 33% 3% 0% 61
IT 0% 0% 0% 0% 0% 0% 0% 100% 602
CY 13% 0% 56% 0% 0% 31% 0% 0% 16
LV 59% 0% 11% 0% 0% 29% 2% 0% 63
LT 42% 0% 28% 0% 4% 0% 4% 22% 81
LU 29% 0% 29% 0% 0% 43% 0% 0% 7
HU 32% 0% 28% 0% 0% 37% 3% 0% 149
MT 0% 0% 0% 0% 0% 0% 0% 100% 2
NL 0% 0% 0% 0% 0% 0% 0% 100% 60
AT 0% 0% 23% 0% 25% 48% 5% 0% 84
PL 32% 0% 30% 0% 0% 27% 10% 0% 915
PT 21% 0% 23% 0% 0% 49% 7% 0% 146
RO 19% 0% 27% 0% 6% 44% 5% 0% 649
SI 0% 0% 0% 38% 0% 56% 6% 0% 16
SK 0% 0% 29% 33% 0% 33% 3% 2% 126
FI 0% 6% 9% 0% 0% 81% 3% 0% 32
SE 19% 0% 23% 8% 0% 42% 2% 6% 52
UK 17% 0% 30% 3% 1% 48% 0% 0% 427
EU 16% 0% 20% 6% 3% 37% 5% 13% 5.516
IS 0% 0% 0% 0% 0% 100% 0% 0% 1
NO 0% 0% 30% 0% 0% 70% 0% 20% 10
CH 14% 0% 10% 0% 2% 74% 0% 0% 58
Source: CARE database, data available in May 2015

Traffic Safety Basic Facts 2017 - Pedestrians
- 17 -
The percentage of pedestrian
fatalities in the darkness varies from 74% in Lithuania to 16% in
Finland.
Figure 8 shows that the percentage of pedestrian fatalities in darkness varies between countries, from 74% in Lithuania to 16% in Finland, while the EU average is 45%. Figure 8: Percentage of pedestrian fatalities during darkness of all pedestrian fatalities, EU, 2015 or latest available year
Source: CARE database, data available in May 2017
0%
10%
20%
30%
40%
50%
60%
70%
80%
90%
100%
LT LV CY HR EE PL SK HU LU CZ DE UK IE RO SE AT EU PT EL ES FR SI BE BG DK FI
Traffic Safety Basic Facts 2017 - Pedestrians
- 18 -
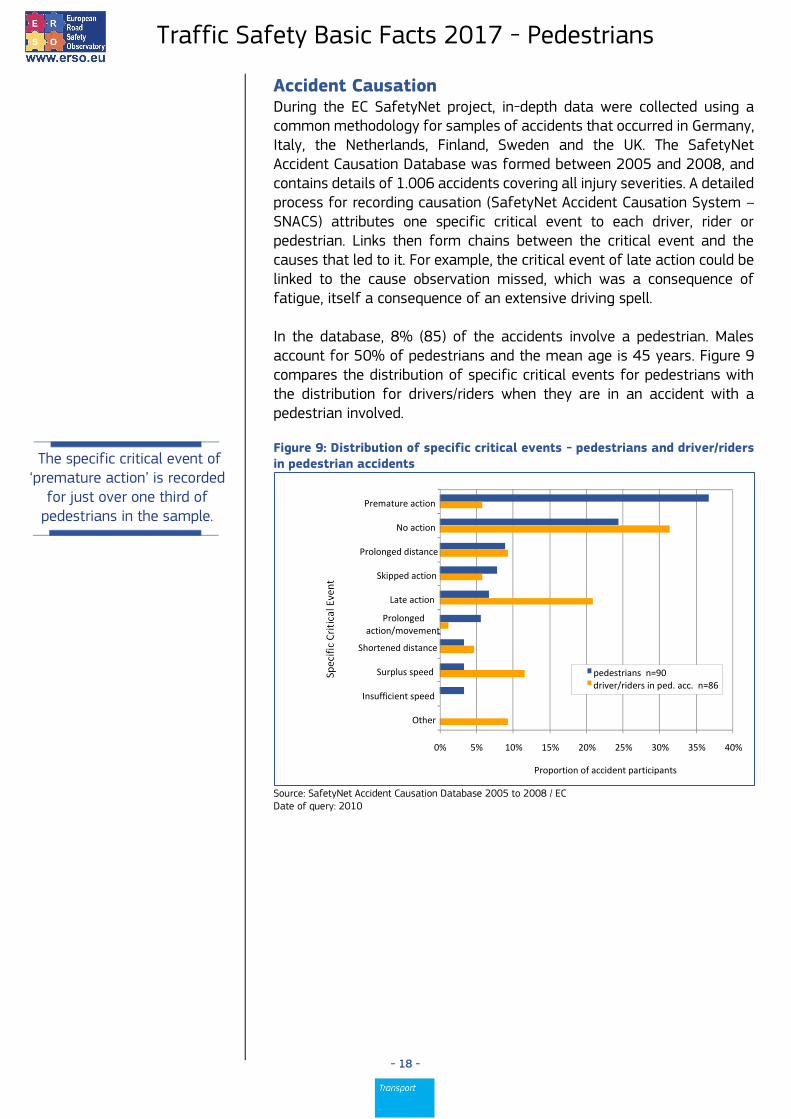
The specific critical event of ‘premature action’ is recorded
for just over one third of pedestrians in the sample.
Accident Causation During the EC SafetyNet project, in-depth data were collected using a common methodology for samples of accidents that occurred in Germany, Italy, the Netherlands, Finland, Sweden and the UK. The SafetyNet Accident Causation Database was formed between 2005 and 2008, and contains details of 1.006 accidents covering all injury severities. A detailed process for recording causation (SafetyNet Accident Causation System – SNACS) attributes one specific critical event to each driver, rider or pedestrian. Links then form chains between the critical event and the causes that led to it. For example, the critical event of late action could be linked to the cause observation missed, which was a consequence of fatigue, itself a consequence of an extensive driving spell. In the database, 8% (85) of the accidents involve a pedestrian. Males account for 50% of pedestrians and the mean age is 45 years. Figure 9 compares the distribution of specific critical events for pedestrians with the distribution for drivers/riders when they are in an accident with a pedestrian involved. Figure 9: Distribution of specific critical events - pedestrians and driver/riders in pedestrian accidents
Source: SafetyNet Accident Causation Database 2005 to 2008 / EC Date of query: 2010
0% 5% 10% 15% 20% 25% 30% 35% 40%
Premature action
No action
Prolonged distance
Skipped action
Late action
Prolonged action/movement
Shortened distance
Surplus speed
Insufficient speed
Other
Proportion of accident participants
pedestrians n=90 driver/riders in ped. acc. n=86

Traffic Safety Basic Facts 2017 - Pedestrians
- 19 -
16% of the links between causes are observed to be
between ‘faulty diagnosis’ and ‘information failure’.
Premature action is recorded far more frequently for pedestrians than the drivers/riders in the accident, whilst no action and, in particular, late action are recorded less frequently. Premature action describes a critical event with an action started too early, before a signal was given or required conditions were established. This contrast between the participant groups indicates scenarios where a pedestrian starts an action too early or without right of way and the drivers/riders react too late or no action is undertaken, or possible.
Table 9 gives the most frequent links between causes for pedestrians in the dataset. For this group there are 101 such links in total.
Table 9: Ten most frequent links between causes - pedestrians Links between causes Frequency
Faulty diagnosis - Information failure (between driver and traffic environment or driver and vehicle)
16
Observation missed - Inadequate plan 10
Observation missed - Distraction 10
Observation missed - Temporary obstruction to view 10
Inadequate plan - Psychological stress 5
Inadequate plan - Insufficient knowledge 5
Decision error - Distraction 4
Inadequate plan - Distraction 4
Inadequate plan - Under the influence of substances 4
Observation missed - Faulty diagnosis 3
Others 30
Total 101 Source: SafetyNet Accident Causation Database 2005 to 2008 / EC Date of query: 2010
Table 8 gives both an indication of the most frequently recorded causes and the most frequently recorded links between them. The numbers here are low but the links are similar to those seen for driver and rider groups in other basic fact sheets, with faulty diagnosis, observation missed and inadequate plan being the common causes. Distraction is a factor in pedestrian accidents, leading to missed observations, decision errors and inadequate plans.

Traffic Safety Basic Facts 2017 - Pedestrians
- 20 -
By 2012, thirteen Member
States routinely collected data in a sample of hospitals and contributed them to the EU
injury Database.
According to estimates based on the EU IDB more than four
million people are injured annually in road traffic
accidents, one million of whom have to be admitted to hospital.
Road Accident Health Indicators Injury data can be obtained from a wide range of sources, such as police and ambulance reports, national insurance schemes, and hospital records, each of which provides a specific but yet incomplete picture of the injuries suffered in road accidents. In order to obtain a comprehensive view of these injuries, the EU Council issued a recommendation that urges Member States to use synergies between existing data sources and to develop national injury surveillance systems rooted in the health sector. At present, thirteen member states are routinely collecting injury data in a sample of hospitals and delivering these data to the Commission. This system is called the EU Injury Database (EU IDB). Within the EU IDB “transport module” injuries suffered in road accidents are recorded by “mode of transport”, “role of injured person” and “counterpart”. These variables can complement information from police records, in particular for injury patterns and the improved assessment of injury severity. The indicators used include the percentage of casualties attending hospital who are admitted to hospital, the mean length of stay of hospital admissions, the nature and type of body part injured, and potentially also long term consequences of injuries. Figure 10: Distribution of non-fatal road accident casualties attending hospital by mode of transport
EU Injury Database (EU IDB AI) - hospital treated patients. IDB AI Transport module and place of occurrence (code 6.n [public road]); n-all = 73 600: n-admitted = 23.568 (DE, DK, LV, MT, AT, NL, SE, SI, CY, years 2005-2008).

Traffic Safety Basic Facts 2017 - Pedestrians
- 21 -
About 45% of the pedestrians
casualties who attended a hospital were admitted to the hospital; their average stay in
hospital was ten days.
Figure 10 is based on IDB data from nine countries for accidents that occurred between 2005 and 2008. Vulnerable road users (pedestrians, cyclists, motorcycles and mopeds) accounted for almost two thirds (63%) of road accident casualties attending hospital, and for over half of casualties admitted to the hospital (56%). Figure 11 shows that 45% of pedestrian casualties recorded in the IDB were admitted to hospital. Figure 12 shows that the average length of stay was almost eight days overall, and ten days for pedestrians. Figure 11: Percentage of non-fatal road accident casualties who were admitted to hospital by mode of transport
EU Injury Database (EU IDB AI) - hospital treated patients. IDB AI Transport module and place of occurrence (code 6.n [public road]); n-all = 73 600: n-admitted = 23.568 (DE, DK, LV, MT, AT, NL, SE, SI, CY, years 2005-2008).
Figure 12: Average length of stay (hospital bed days) of non-fatal road accident casualties by mode of transport
EU Injury Database (EU IDB AI) - hospital treated patients. IDB AI Transport module and place of occurrence (code 6.n [public road]); n-all = 73 600: n-admitted = 23.568 (DE, DK, LV, MT, AT, NL, SE, SI, CY, years 2005-2008).
0%
10%
20%
30%
40%
50%
Pedestrian Cars Motorcycles and Mopeds
Overall Other modes of Transport ation
Cyclists
0 2 4 6 8 10 12
Pedestrians
Other modes of Transport ation
Motorcycles and Mopeds
Overall
Cyclists
Cars
Average Hospital Bed Days
Traffic Safety Basic Facts 2017 - Pedestrians
- 22 -
.
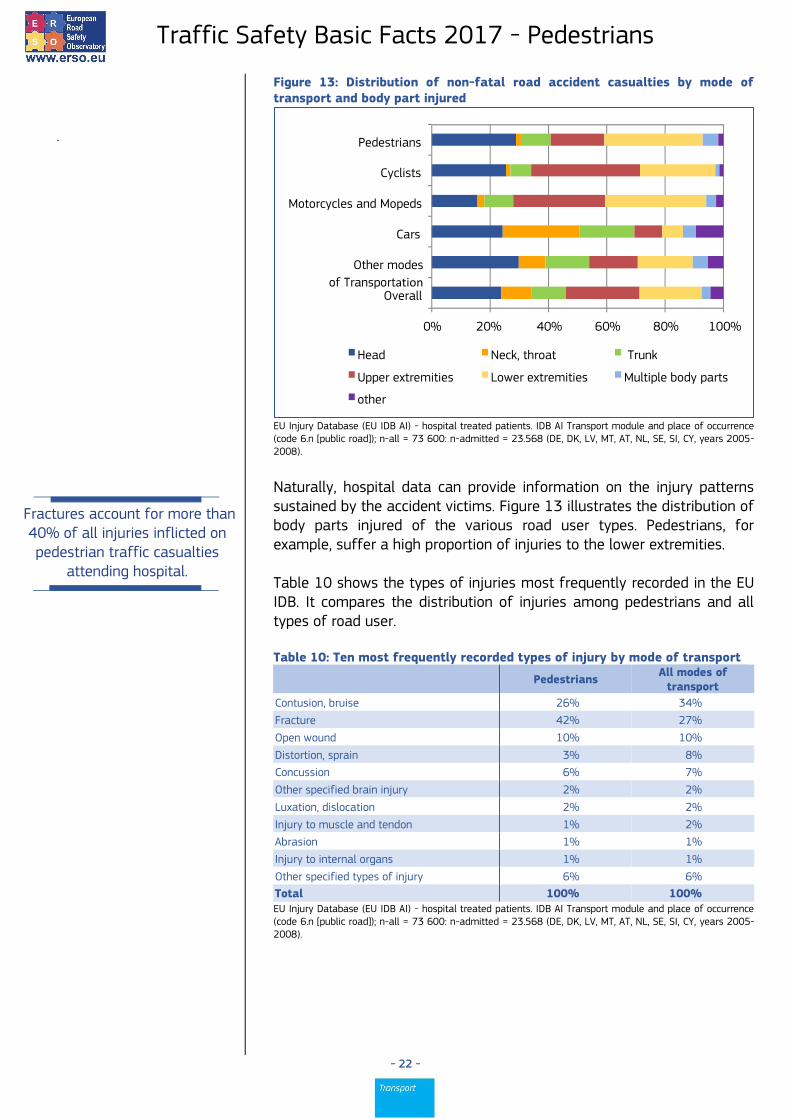
Fractures account for more than
40% of all injuries inflicted on pedestrian traffic casualties
attending hospital.
Figure 13: Distribution of non-fatal road accident casualties by mode of transport and body part injured
EU Injury Database (EU IDB AI) - hospital treated patients. IDB AI Transport module and place of occurrence (code 6.n [public road]); n-all = 73 600: n-admitted = 23.568 (DE, DK, LV, MT, AT, NL, SE, SI, CY, years 2005-2008).
Naturally, hospital data can provide information on the injury patterns sustained by the accident victims. Figure 13 illustrates the distribution of body parts injured of the various road user types. Pedestrians, for example, suffer a high proportion of injuries to the lower extremities. Table 10 shows the types of injuries most frequently recorded in the EU IDB. It compares the distribution of injuries among pedestrians and all types of road user. Table 10: Ten most frequently recorded types of injury by mode of transport
Pedestrians All modes of
transport
Contusion, bruise 26% 34%
Fracture 42% 27%
Open wound 10% 10%
Distortion, sprain 3% 8%
Concussion 6% 7%
Other specified brain injury 2% 2%
Luxation, dislocation 2% 2%
Injury to muscle and tendon 1% 2%
Abrasion 1% 1%
Injury to internal organs 1% 1%
Other specified types of injury 6% 6%
Total 100% 100% EU Injury Database (EU IDB AI) - hospital treated patients. IDB AI Transport module and place of occurrence (code 6.n [public road]); n-all = 73 600: n-admitted = 23.568 (DE, DK, LV, MT, AT, NL, SE, SI, CY, years 2005-2008).
0% 20% 40% 60% 80% 100%
Pedestrians
Cyclists
Motorcycles and Mopeds
Cars
Other modes
of Transportation
Overall
Head Neck, throat Trunk
Upper extremities Lower extremities Multiple body parts
other

Traffic Safety Basic Facts 2017 - Pedestrians
- 23 -
Notes
1. Country abbreviations
Belgium BE Italy IT Romania RO
Bulgaria BG Cyprus CY Slovenia SI
Czech Republic CZ Latvia LV Slovakia SK
Denmark DK Lithuania LT Finland FI
Germany DE Luxembourg LU Sweden SE
Estonia EE Hungary HU United Kingdom UK
Ireland IE Malta MT
Greece EL Netherlands NL Iceland IS
Spain ES Austria AT Liechtenstein LI
France FR Poland PL Norway NO
Croatia HR Portugal PT Switzerland CH
2. Sources: CARE (Community database on road accidents) The full glossary of definitions of variables used in this Report is available at: http://ec.europa.eu/transport/road_safety/pdf/statistics/cadas_glossary.pdf 3. Data available in May 2017. 4. Data refer to 2015 and when not available the latest available data are used (2009 data for BG, 2010 data for MT and SK, 2013 data for IE, and 2014 data for SE). Totals and related average percentages for EU also include latest available data. 5. Lithuanian data are not included in the totals of data comparing the years 2006-2015. 6. At the commenting of the tables and figures, countries with small figures are omitted. 7. This 2017 edition of Traffic Safety Basic Facts updates the previous versions produced within the EU co-funded research projects SafetyNet and DaCoTA. 8. Disclaimer This report has been produced by the National Technical University of Athens (NTUA), the Austrian Road Safety Board (KFV) and the European Union Road Federation (ERF) under a contract with the European Commission. Whilst every effort has been made to ensure that the matter presented in this report is relevant, accurate and up-to-date, the Partners cannot accept any liability for any error or omission, or reliance on part or all of the content in another context. Any information and views set out in this report are those of the author(s) and do not necessarily reflect the official opinion of the Commission. The Commission does not guarantee the accuracy of the data included in this study. Neither the Commission nor any person acting on the Commission’s behalf may be held responsible for the use that may be made of the information contained therein. 9. Please refer to this Report as follows: European Commission, Traffic Safety Basic Facts on Pedestrians, European Commission, Directorate General for Transport, June 2017.