Embed Size (px)
Citation preview
1
Trail Usage and Value
A Helena Case study
Jeremy L. Sage, Ph.D., Norma Nickerson, Ph.D.
1/17/2018
This is a case study of trail use and values focusing on Helena, Montana. Economic impact, characteristics of users, number of users, and community sentiment towards trails are provided.
2
Trail Usage and Value: A Helena, MT Case Study
Prepared by
Jeremy L. Sage, Ph.D., Norma Nickerson, Ph.D.
Institute for Tourism & Recreation Research
College of Forestry and Conservation The University of Montana
Missoula, MT 59812 www.itrr.umt.edu
Research Report 2018-01
1/17/2018
This study was funded by the Lodging Facility Use Tax, with additional financial and in-kind support from Bike Helena, City of Helena Parks and Recreation, Prickly Pear Land Trust
Copyright© 2018 Institute for Tourism and Recreation Research. All rights reserved.
Trail Usage and Value 2018
iii
Abstract The Mt. Ascension and Mt. Helena trail network provide a valuable outdoor recreation amenity to residence of, and visitors to, Helena. This report identifies the use and value of the trail system. Though 78 percent of trail use is by local residents, visitors to the region who used the trail system for hiking or biking spent over $4 million in the local area in the summer of 2017 (May-September).
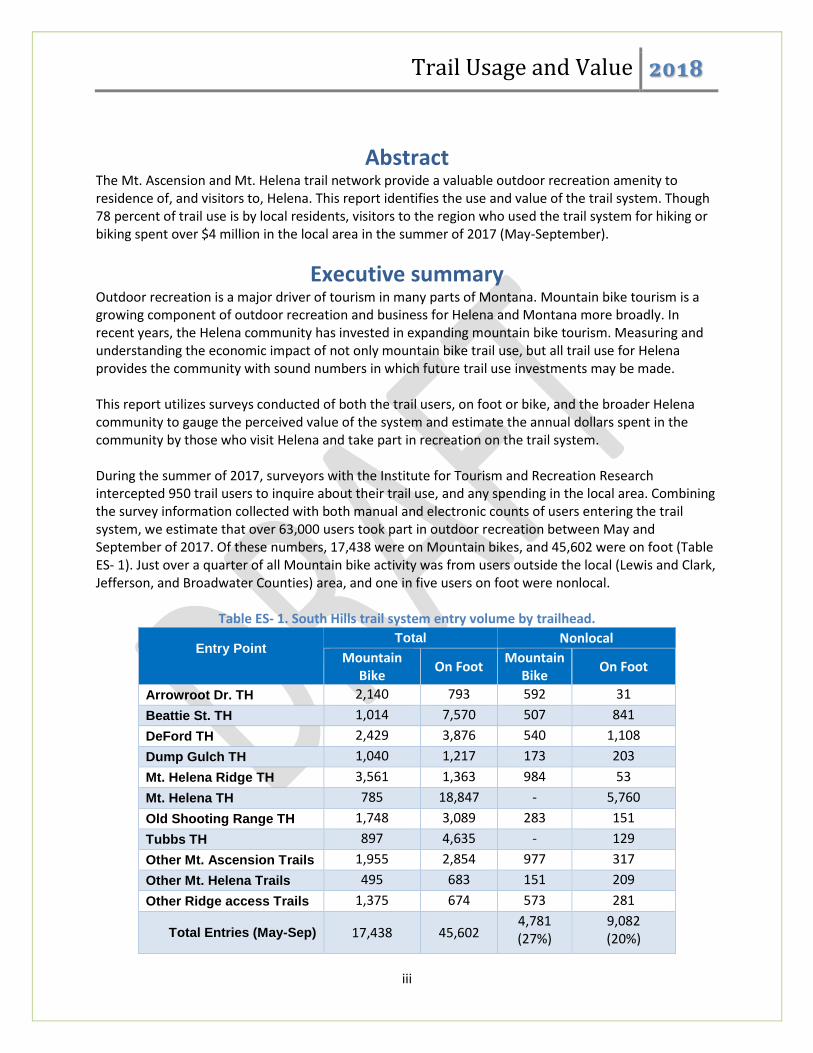
Executive summary Outdoor recreation is a major driver of tourism in many parts of Montana. Mountain bike tourism is a growing component of outdoor recreation and business for Helena and Montana more broadly. In recent years, the Helena community has invested in expanding mountain bike tourism. Measuring and understanding the economic impact of not only mountain bike trail use, but all trail use for Helena provides the community with sound numbers in which future trail use investments may be made. This report utilizes surveys conducted of both the trail users, on foot or bike, and the broader Helena community to gauge the perceived value of the system and estimate the annual dollars spent in the community by those who visit Helena and take part in recreation on the trail system. During the summer of 2017, surveyors with the Institute for Tourism and Recreation Research intercepted 950 trail users to inquire about their trail use, and any spending in the local area. Combining the survey information collected with both manual and electronic counts of users entering the trail system, we estimate that over 63,000 users took part in outdoor recreation between May and September of 2017. Of these numbers, 17,438 were on Mountain bikes, and 45,602 were on foot (Table ES- 1). Just over a quarter of all Mountain bike activity was from users outside the local (Lewis and Clark, Jefferson, and Broadwater Counties) area, and one in five users on foot were nonlocal.
Table ES- 1. South Hills trail system entry volume by trailhead.
Entry Point
Total Nonlocal
Mountain Bike
On Foot Mountain
Bike On Foot
Arrowroot Dr. TH 2,140 793 592 31
Beattie St. TH 1,014 7,570 507 841
DeFord TH 2,429 3,876 540 1,108
Dump Gulch TH 1,040 1,217 173 203
Mt. Helena Ridge TH 3,561 1,363 984 53
Mt. Helena TH 785 18,847 - 5,760
Old Shooting Range TH 1,748 3,089 283 151
Tubbs TH 897 4,635 - 129
Other Mt. Ascension Trails 1,955 2,854 977 317
Other Mt. Helena Trails 495 683 151 209
Other Ridge access Trails 1,375 674 573 281
Total Entries (May-Sep) 17,438 45,602 4,781 (27%)
9,082 (20%)
Trail Usage and Value 2018
iv
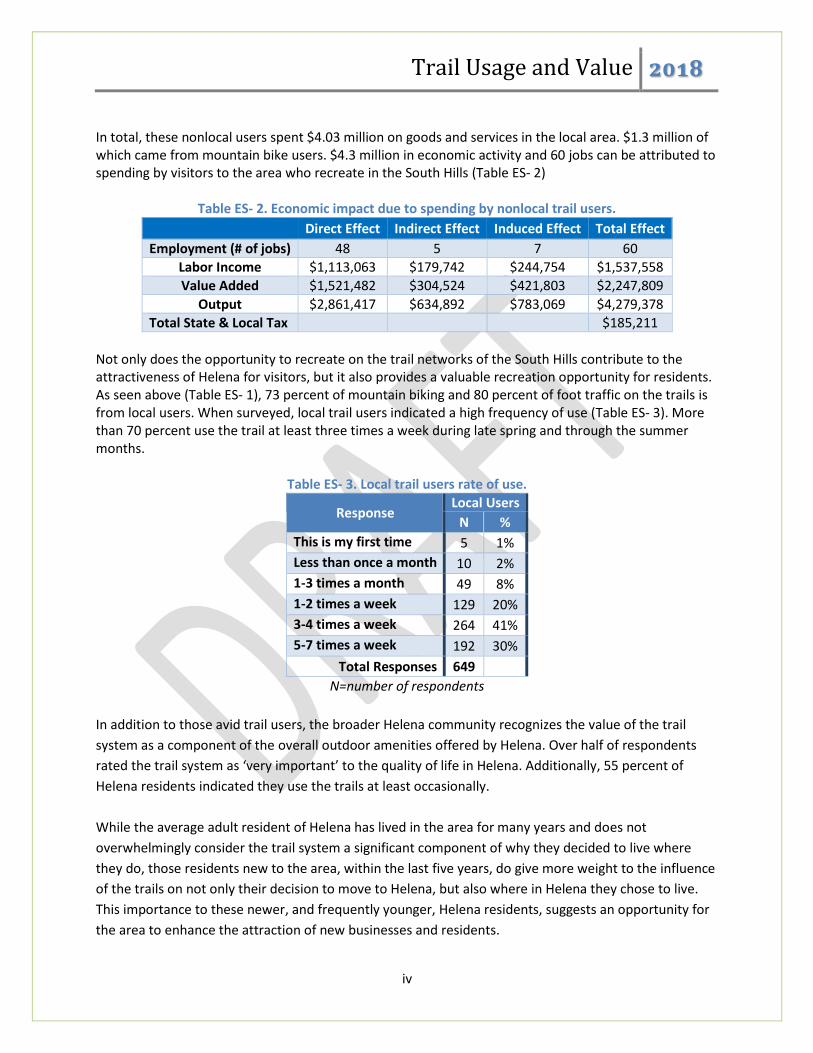
In total, these nonlocal users spent $4.03 million on goods and services in the local area. $1.3 million of which came from mountain bike users. $4.3 million in economic activity and 60 jobs can be attributed to spending by visitors to the area who recreate in the South Hills (Table ES- 2)
Table ES- 2. Economic impact due to spending by nonlocal trail users. Direct Effect Indirect Effect Induced Effect Total Effect
Employment (# of jobs) 48 5 7 60
Labor Income $1,113,063 $179,742 $244,754 $1,537,558
Value Added $1,521,482 $304,524 $421,803 $2,247,809
Output $2,861,417 $634,892 $783,069 $4,279,378
Total State & Local Tax $185,211
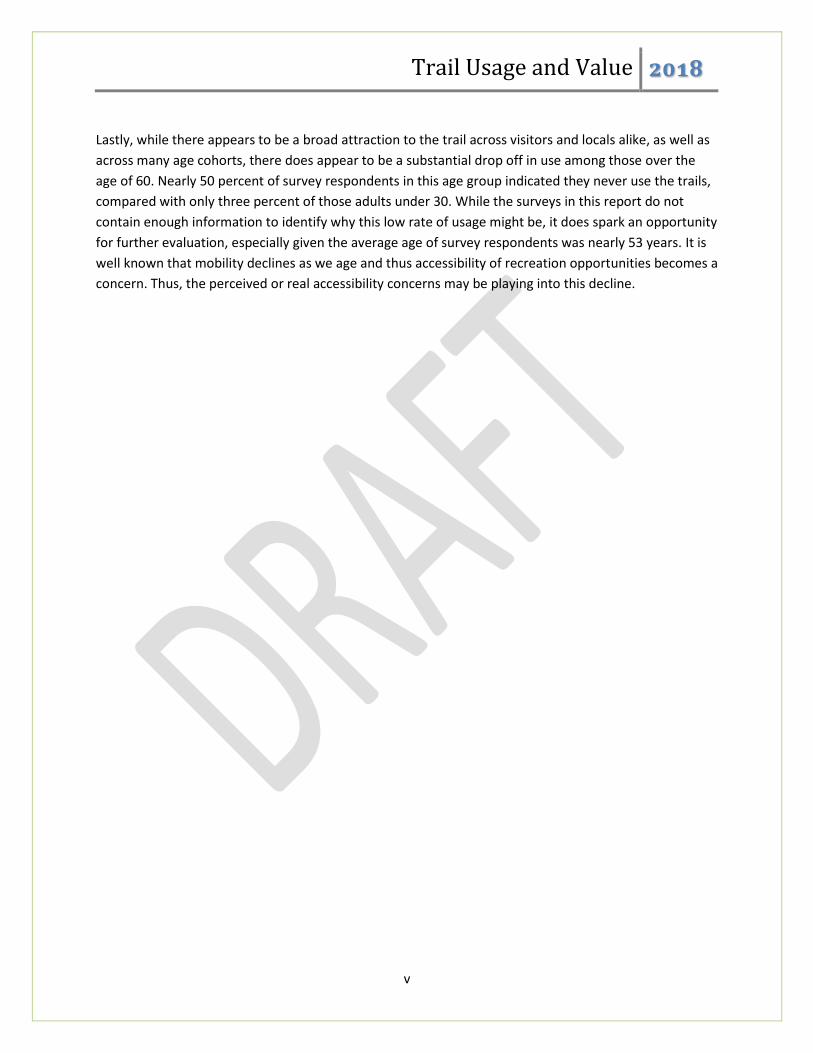
Not only does the opportunity to recreate on the trail networks of the South Hills contribute to the attractiveness of Helena for visitors, but it also provides a valuable recreation opportunity for residents. As seen above (Table ES- 1), 73 percent of mountain biking and 80 percent of foot traffic on the trails is from local users. When surveyed, local trail users indicated a high frequency of use (Table ES- 3). More than 70 percent use the trail at least three times a week during late spring and through the summer months.
Table ES- 3. Local trail users rate of use.
Response Local Users
N %
This is my first time 5 1%
Less than once a month 10 2%
1-3 times a month 49 8%
1-2 times a week 129 20%
3-4 times a week 264 41%
5-7 times a week 192 30%
Total Responses 649
N=number of respondents
In addition to those avid trail users, the broader Helena community recognizes the value of the trail
system as a component of the overall outdoor amenities offered by Helena. Over half of respondents
rated the trail system as ‘very important’ to the quality of life in Helena. Additionally, 55 percent of
Helena residents indicated they use the trails at least occasionally.
While the average adult resident of Helena has lived in the area for many years and does not
overwhelmingly consider the trail system a significant component of why they decided to live where
they do, those residents new to the area, within the last five years, do give more weight to the influence
of the trails on not only their decision to move to Helena, but also where in Helena they chose to live.
This importance to these newer, and frequently younger, Helena residents, suggests an opportunity for
the area to enhance the attraction of new businesses and residents.
Trail Usage and Value 2018
v
Lastly, while there appears to be a broad attraction to the trail across visitors and locals alike, as well as
across many age cohorts, there does appear to be a substantial drop off in use among those over the
age of 60. Nearly 50 percent of survey respondents in this age group indicated they never use the trails,
compared with only three percent of those adults under 30. While the surveys in this report do not
contain enough information to identify why this low rate of usage might be, it does spark an opportunity
for further evaluation, especially given the average age of survey respondents was nearly 53 years. It is
well known that mobility declines as we age and thus accessibility of recreation opportunities becomes a
concern. Thus, the perceived or real accessibility concerns may be playing into this decline.
Trail Usage and Value 2018
vi
Table of Contents Abstract ........................................................................................................................................................ iii
Executive summary ...................................................................................................................................... iii
Table of Contents ......................................................................................................................................... vi
List of Tables and Figures ............................................................................................................................ vii
Introduction .................................................................................................................................................. 1
Purpose ..................................................................................................................................................... 2
Section I: Trail User Intercept Survey ............................................................................................................ 3
Methods .................................................................................................................................................... 3
Intercept Strategy ................................................................................................................................. 3
Proportion Counts ................................................................................................................................. 5
Trail Counters ........................................................................................................................................ 5
User Volume Estimation ....................................................................................................................... 6
Results ....................................................................................................................................................... 8
Demographics ....................................................................................................................................... 8
User Residency ...................................................................................................................................... 8
Trip Characteristics of Nonresident Trail Users .................................................................................... 8
Trail Use Characteristics ........................................................................................................................ 8
Trail Use Volume ................................................................................................................................. 11
Trail User Spending in Helena ............................................................................................................. 15
Section II: Helena Community Surveys ....................................................................................................... 17
Methods .................................................................................................................................................. 17
Intercept Survey .................................................................................................................................. 17
Social Media ‘Push’ Survey ................................................................................................................. 18
Results ..................................................................................................................................................... 20
Geographic Distribution ...................................................................................................................... 20
Demographics ..................................................................................................................................... 20
Trail Use .............................................................................................................................................. 21
Means of Accessing the Trail System – Push Survey .......................................................................... 22
Importance of Community Amenities ................................................................................................. 22
Trail Influence on Housing .................................................................................................................. 23
Trail System Influence on Local Business – Push Survey .................................................................... 24
Conclusions & Recommendations .............................................................................................................. 26
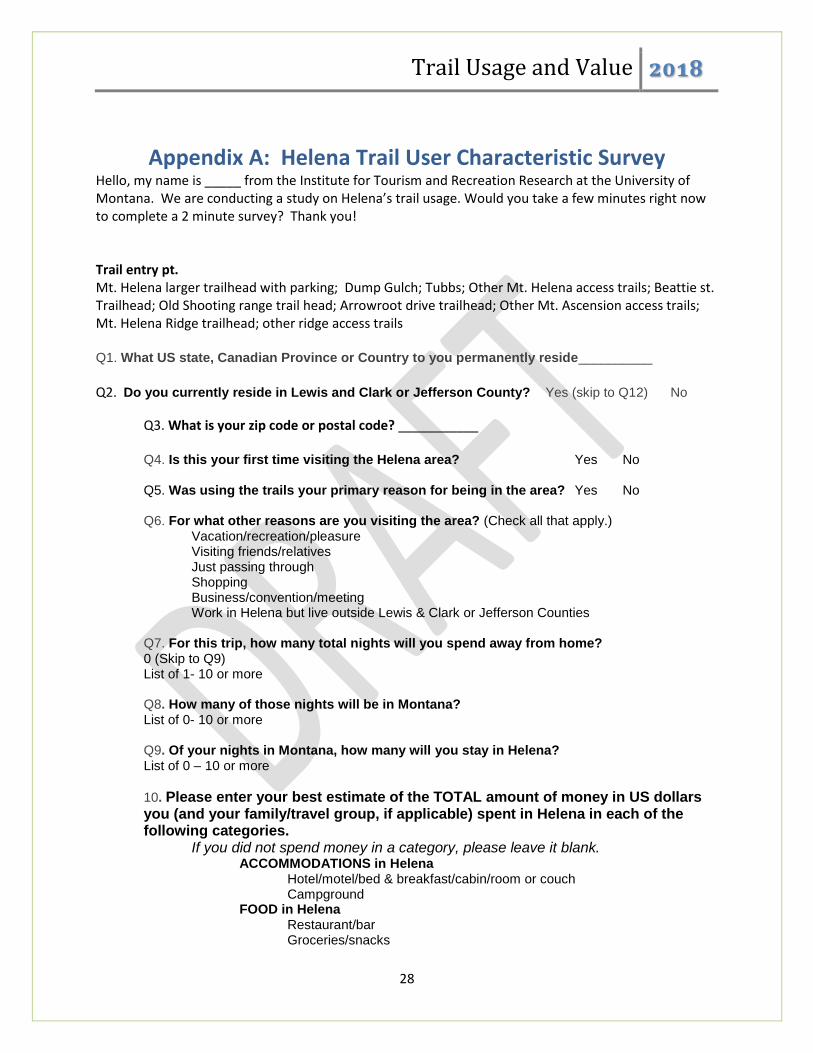
Appendix A: Helena Trail User Characteristic Survey ................................................................................ 28
Trail Usage and Value 2018
vii
Appendix B: Resident “Values of Trails and Open Space” Survey .............................................................. 31
Appendix C: “Values of Trails and Open Space” Survey ............................................................................. 32
List of Tables and Figures Table 1. Survey hours per location. .............................................................................................................. 4 Table 2. Trail specific volume estimation strategy. ...................................................................................... 7 Table 3. Respondent place of residence. ...................................................................................................... 8 Table 4. Surveyed user means of trail access.* ............................................................................................ 9 Table 5. May to October trail use frequency. ............................................................................................... 9 Table 6. November to April trail use frequency. ......................................................................................... 10 Table 7. Helena trail system entry point volume for mountain bikes. ....................................................... 12 Table 8. Helena tail system entry point volume for foot traffic. ................................................................ 12 Table 9. Trailhead usage for entry and exit. ............................................................................................... 13 Table 10. Extent to which the use of Helena trail system influenced athletic gear purchase. ................... 15 Table 11. Average visitor expenditures while in Helena area. ................................................................... 16 Table 12. Economic impact from nonlocal trail user spending in Helena. ................................................. 16 Table 13. Intercepted respondents’ frequency of local trail or path usage. .............................................. 21 Table 14. Means of access to the area trails by online respondents. ......................................................... 22 Table 15. Intercepted respondent’s rated importance of community amenities to life in Helena. ........... 23 Table 16. Intercepted respondents perceived influence of trail system on housing choices. ................... 23 Table 17. Intercepted respondents perceived influence of the trail system on housing choices, by length of residency. ................................................................................................................................................ 24 Table 18. Online respondents’ perceived influence of trails on place of work. ......................................... 25 Figure 1. South Hills overview map. .............................................................................................................. 2 Figure 2. 2017 Trail Rider Schedule Poster. .................................................................................................. 3 Figure 3. Time of day distribution of survey intercept effort. ...................................................................... 4 Figure 4. Strava user mountain bike volume, by ride log count. ................................................................ 11 Figure 5. Trail Rider weekly ridership, 2017. .............................................................................................. 14 Figure 6. Trail Rider end of summer annual comparison. ........................................................................... 14 Figure 7. Social media based survey invitation. .......................................................................................... 18 Figure 8. Resident intercept survey response count by zip code. .............................................................. 20 Figure 9. Intercepted respondents’ frequency of trail usage by age cohort. ............................................. 21
Trail Usage and Value 2018
1
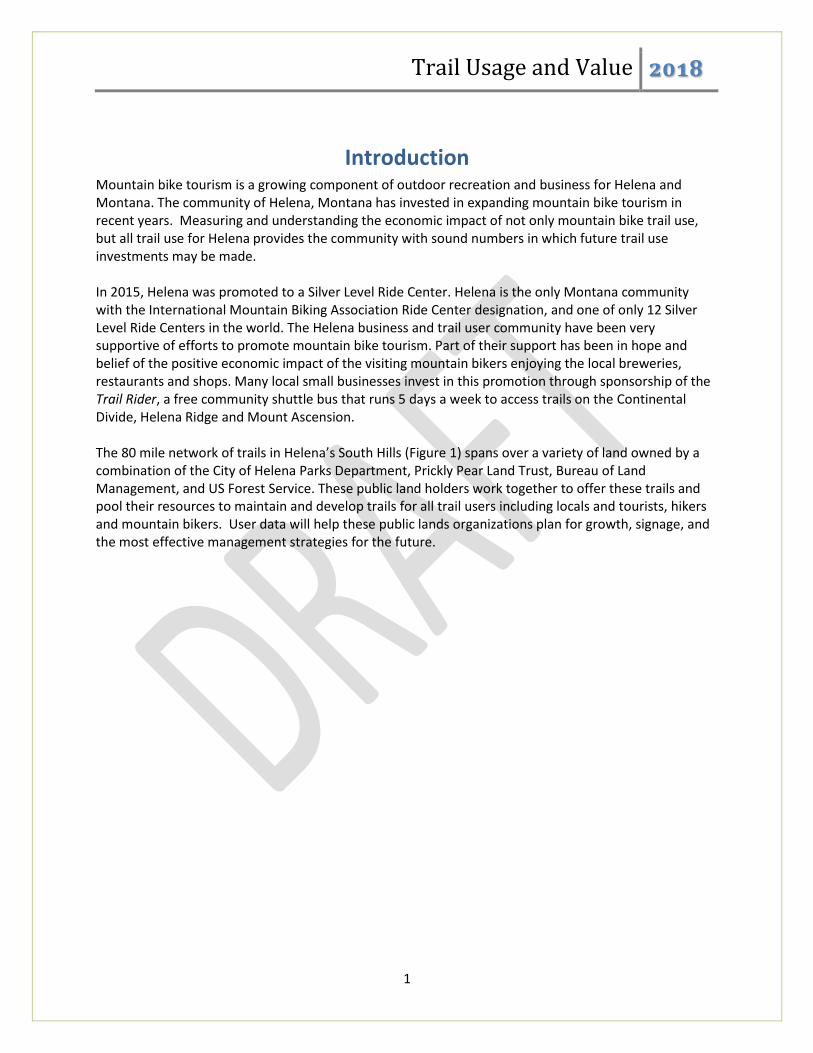
Introduction Mountain bike tourism is a growing component of outdoor recreation and business for Helena and Montana. The community of Helena, Montana has invested in expanding mountain bike tourism in recent years. Measuring and understanding the economic impact of not only mountain bike trail use, but all trail use for Helena provides the community with sound numbers in which future trail use investments may be made. In 2015, Helena was promoted to a Silver Level Ride Center. Helena is the only Montana community with the International Mountain Biking Association Ride Center designation, and one of only 12 Silver Level Ride Centers in the world. The Helena business and trail user community have been very supportive of efforts to promote mountain bike tourism. Part of their support has been in hope and belief of the positive economic impact of the visiting mountain bikers enjoying the local breweries, restaurants and shops. Many local small businesses invest in this promotion through sponsorship of the Trail Rider, a free community shuttle bus that runs 5 days a week to access trails on the Continental Divide, Helena Ridge and Mount Ascension. The 80 mile network of trails in Helena’s South Hills (Figure 1) spans over a variety of land owned by a combination of the City of Helena Parks Department, Prickly Pear Land Trust, Bureau of Land Management, and US Forest Service. These public land holders work together to offer these trails and pool their resources to maintain and develop trails for all trail users including locals and tourists, hikers and mountain bikers. User data will help these public lands organizations plan for growth, signage, and the most effective management strategies for the future.
Trail Usage and Value 2018
2
Figure 1. South Hills overview map.
Purpose
The main purpose of this study was to assess the economic impact of mountain biking and trail usage to Helena, Montana, due to attraction of mountain bikers from outside the area. In addition to understanding the economic impacts, a secondary purpose sought to assess biking and trail user characteristics including demographics, amount of trail usage, and visitor psychographics. Lastly, the majority of trail use is by Helena residents, thus the value of the trails to the Helena community was assessed, including perceived accessibility, trail utility, contribution to desire to live in Helena, and influence on quality of life and business activity. This report is broken into two, mostly independent, sections based on the population to whom the surveys were delivered. These sections are then brought back together for a final discussion. The two sections are:
Section I: Trail user intercept survey;
Section II: Helena community surveys.
Trail Usage and Value 2018
3
Section I: Trail User Intercept Survey
Methods
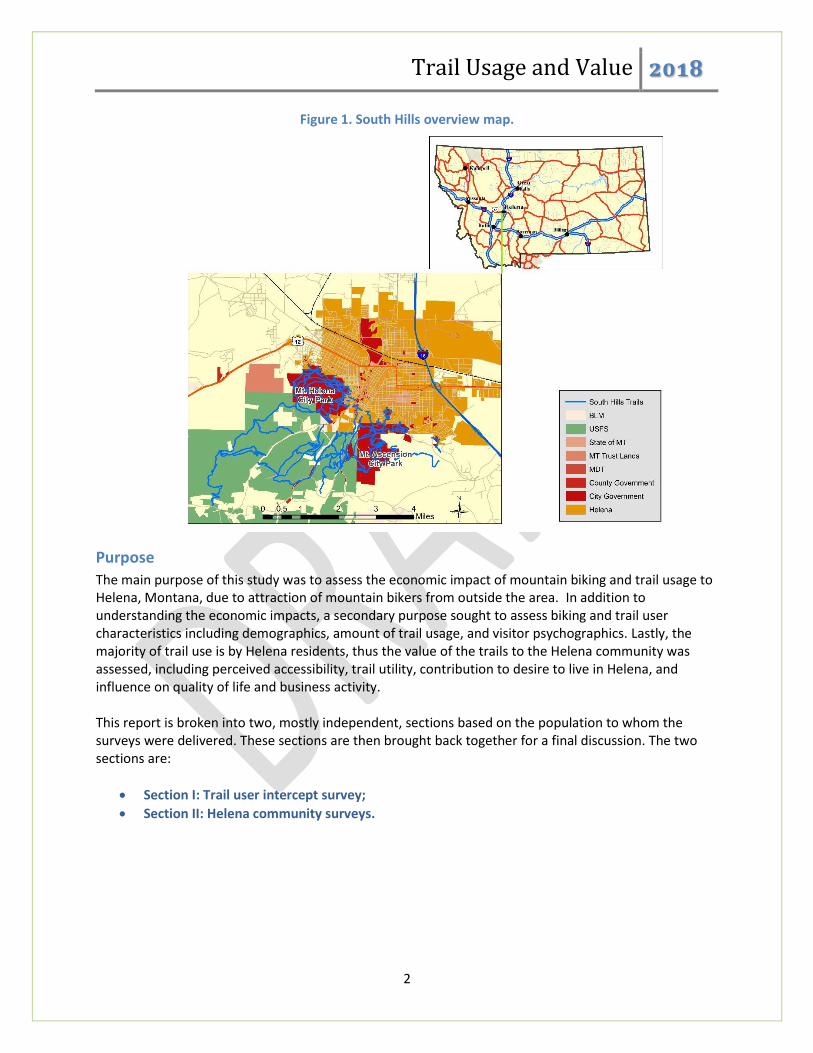
Intercept Strategy To identify the economic impact of trail usage by visitors to the Helena area, an intercept based survey was conducted at major trailheads throughout the Mt. Helena and Mt. Ascension trail system between May 15th and September 30th, 2017. In addition to trailhead surveys, surveyors were also routinely located at the primary pickup location for Helena’s free Trail Rider shuttle, the Women’s Mural in downtown Helena.1 As shown in Figure 2, the shuttle operated Wednesday through Sunday between May 19th and October 1st. The trailheads accessed, varied by day of the week.
The deployed survey schedule was based on discussions with local partners who have intimate knowledge of the trail system and in consult with previous years’ trail counter data. The trail counter data revealed typical heavy periods of use. The surveyor was stationed in two to three hour increments at locations and times that sought to both maximize the number of surveys collected and provided a suitable cross section of the trail network, days of the week, and hours of the day.
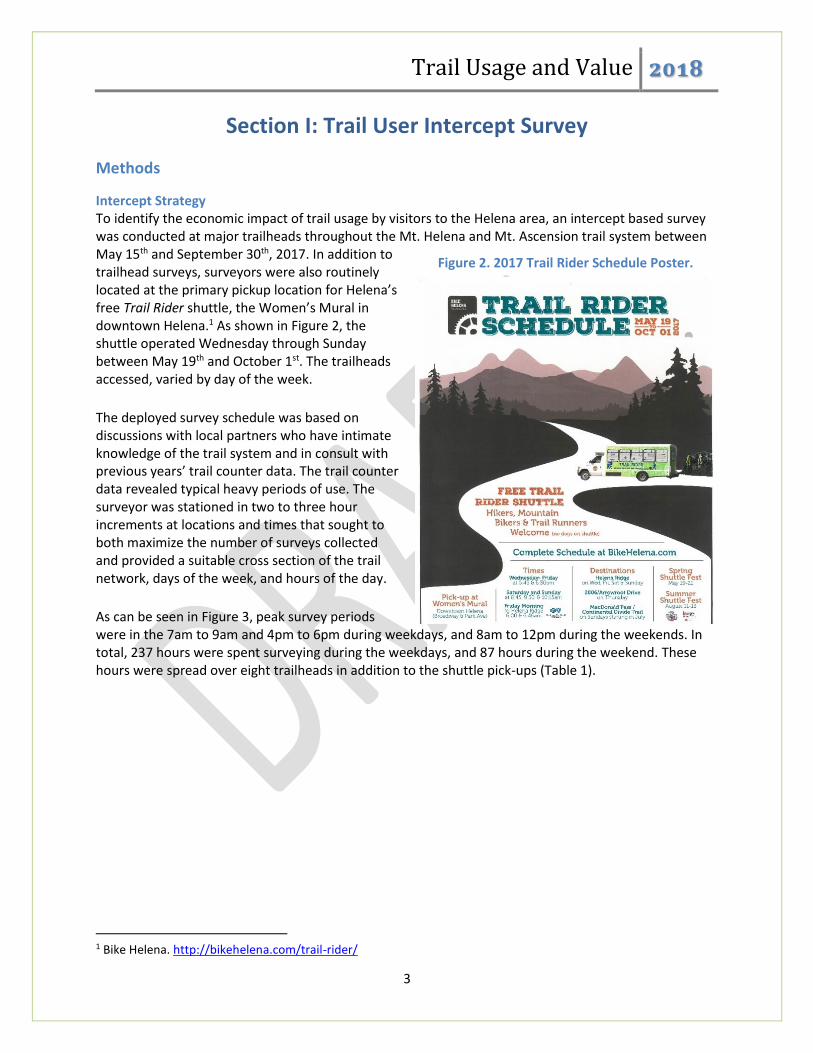
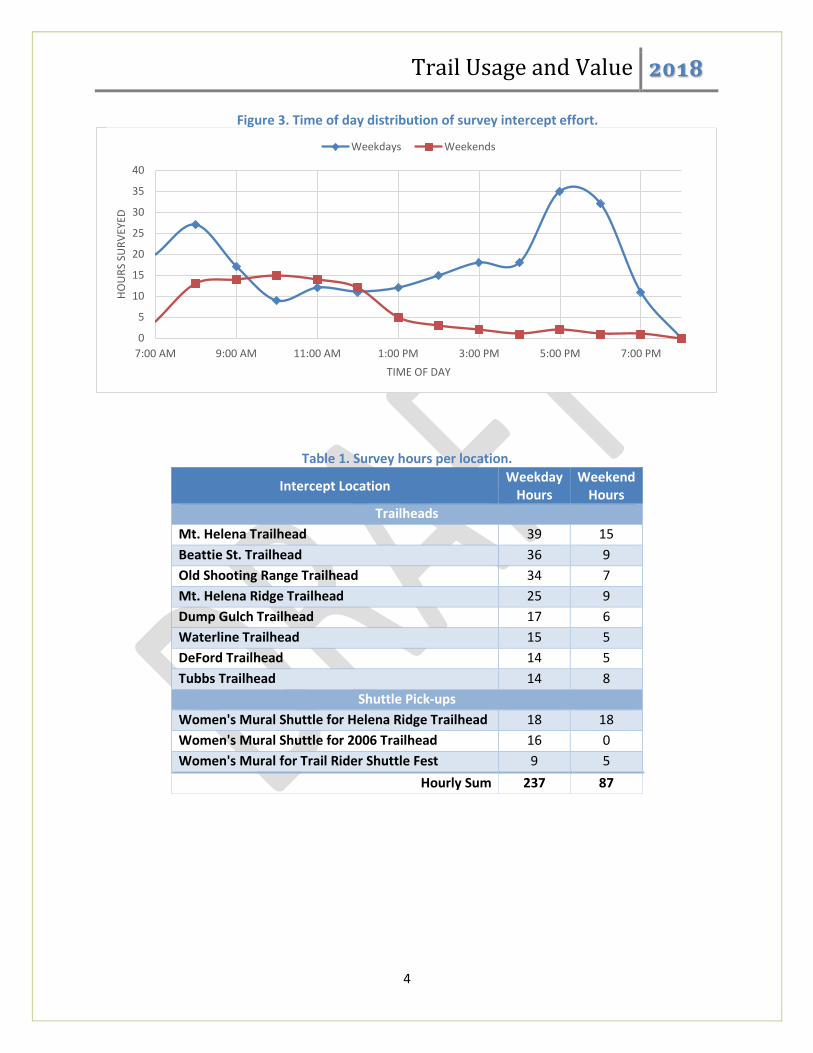
As can be seen in Figure 3, peak survey periods were in the 7am to 9am and 4pm to 6pm during weekdays, and 8am to 12pm during the weekends. In total, 237 hours were spent surveying during the weekdays, and 87 hours during the weekend. These hours were spread over eight trailheads in addition to the shuttle pick-ups (Table 1).
1 Bike Helena. http://bikehelena.com/trail-rider/
Figure 2. 2017 Trail Rider Schedule Poster.
Trail Usage and Value 2018
4
Table 1. Survey hours per location.
Intercept Location Weekday
Hours Weekend
Hours
Trailheads
Mt. Helena Trailhead 39 15
Beattie St. Trailhead 36 9
Old Shooting Range Trailhead 34 7
Mt. Helena Ridge Trailhead 25 9
Dump Gulch Trailhead 17 6
Waterline Trailhead 15 5
DeFord Trailhead 14 5
Tubbs Trailhead 14 8
Shuttle Pick-ups
Women's Mural Shuttle for Helena Ridge Trailhead 18 18
Women's Mural Shuttle for 2006 Trailhead 16 0
Women's Mural for Trail Rider Shuttle Fest 9 5
Hourly Sum 237 87
0
5
10
15
20
25
30
35
40
7:00 AM 9:00 AM 11:00 AM 1:00 PM 3:00 PM 5:00 PM 7:00 PM
HO
UR
S SU
RV
EYED
TIME OF DAY
Weekdays Weekends
Figure 3. Time of day distribution of survey intercept effort.
Trail Usage and Value 2018
5
Survey design The intercept surveys were primarily conducted via direct intercept by the surveyor with the potential respondents. Where volume was low enough, the respondents were provided an opportunity to directly input their responses into the surveyor’s iPad based iForm interface. In order to increase the number of respondents reached, identical print versions of the survey were provided along with pens and clipboards (Appendix A). The surveyor manually entered the paper forms into iForm during down periods or after the survey shift.
Limitations Though it is known that the trail system is used year-round, the survey period was limited to the high volume summer season. Use in other seasons is estimated based on survey response questions. Additionally, survey effort was primarily concentrated to those trailheads with heavy use (Table 1), and as such users accessing via small, neighborhood entry points may be underrepresented. Underrepresented use, if any, likely affects local user estimates most, given their knowledge of, and accessibility to the minor entry points.
Response rate In total, 950 individuals were approached and asked to participate in the survey. Twenty refusals were recorded by the surveyor, leaving 930 completed surveys for a response rate of 98 percent.
Proportion Counts In addition to surveying trail users, the surveyor conducted periodic, hour long proportion counts. During the proportion count periods, all users entering the trail system through the observed trailhead were asked whether they were a resident of the local area (defined as Lewis and Clark, Jefferson, and Broadwater Counties), a resident of other Montana counties, or were from out of state. Other information was visually collected to determine if children were present, group size, whether on bike or on foot, and whether the users had dogs with them.
Trail Counters TRAFx trail and mountain bike counters were placed at several heavy use trailheads to enable the generation of total volumes of users on the trail system. The counters were in place for the entirety of the summer survey period. Infrared (IR) trail counters count all users whether on bike or on foot. These counters were placed at the Beattie Street trailhead, Mt. Helena Ridge trailhead, Mt. Helena trailhead, and the Old Shooting Range trailhead. In addition to the IR counters, mountain bike (MB) specific counters were located at the Mt. Helena Ridge trailhead and Beattie Street trailhead. The mountain bike counters work off of magnetometer based technologies. The combination of both counters at a single trailhead permit the estimation of detailed bike versus on foot users when combined with the visual proportion counters by the surveyor. The counters are multidirectional and as such the manual proportion counts inform an entry versus exit estimation. In addition to the counters placed during the 2017 data collection period, additional counters were previously placed at other trailheads in 2016. Trail counts from 2016 were used to inform the distribution of user traffic throughout a day. In 2016, mountain bike counters were located at Beattie Street, Eagle Scout, Old Shooting Range, and Tubbs trailheads. IR counters were located at Beattie Street, Dump Gulch, Mt. Helena, Old Shooting Range, Show Me the Horse, and Tubbs trailheads.
Trail Usage and Value 2018
6
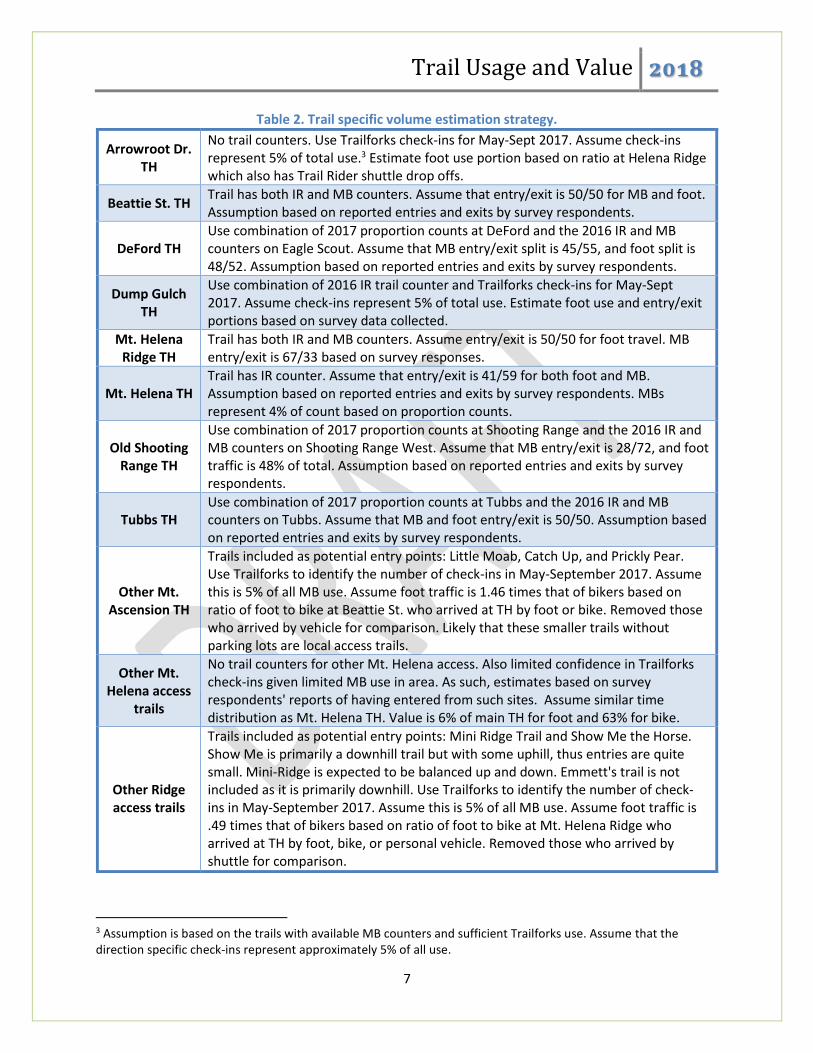
User Volume Estimation User volume on the trail network was estimated through a composite of survey responses, proportion counts, trail count data, and where necessary, Strava2 based data. We attempt to use estimation strategies for volume, based on the best available information. Major trails throughout the network have varying levels of data availability, thus require slightly differing estimation procedures. These procedures are detailed in Table 2.
2 Strava (https://www.strava.com/) is a mobile fitness app used by runners, hikers, walkers and cyclists. Detailed user data from Strava users is provided through the Trail Forks website (https://www.trailforks.com/). The website provides a trail database including user density and user type (on foot or bike). All references in this report to Strava data are from publicly available data.
Trail Usage and Value 2018
7
Table 2. Trail specific volume estimation strategy.
Arrowroot Dr. TH
No trail counters. Use Trailforks check-ins for May-Sept 2017. Assume check-ins represent 5% of total use.3 Estimate foot use portion based on ratio at Helena Ridge which also has Trail Rider shuttle drop offs.
Beattie St. TH Trail has both IR and MB counters. Assume that entry/exit is 50/50 for MB and foot. Assumption based on reported entries and exits by survey respondents.
DeFord TH Use combination of 2017 proportion counts at DeFord and the 2016 IR and MB counters on Eagle Scout. Assume that MB entry/exit split is 45/55, and foot split is 48/52. Assumption based on reported entries and exits by survey respondents.
Dump Gulch TH
Use combination of 2016 IR trail counter and Trailforks check-ins for May-Sept 2017. Assume check-ins represent 5% of total use. Estimate foot use and entry/exit portions based on survey data collected.
Mt. Helena Ridge TH
Trail has both IR and MB counters. Assume entry/exit is 50/50 for foot travel. MB entry/exit is 67/33 based on survey responses.
Mt. Helena TH Trail has IR counter. Assume that entry/exit is 41/59 for both foot and MB. Assumption based on reported entries and exits by survey respondents. MBs represent 4% of count based on proportion counts.
Old Shooting Range TH
Use combination of 2017 proportion counts at Shooting Range and the 2016 IR and MB counters on Shooting Range West. Assume that MB entry/exit is 28/72, and foot traffic is 48% of total. Assumption based on reported entries and exits by survey respondents.
Tubbs TH Use combination of 2017 proportion counts at Tubbs and the 2016 IR and MB counters on Tubbs. Assume that MB and foot entry/exit is 50/50. Assumption based on reported entries and exits by survey respondents.
Other Mt. Ascension TH
Trails included as potential entry points: Little Moab, Catch Up, and Prickly Pear. Use Trailforks to identify the number of check-ins in May-September 2017. Assume this is 5% of all MB use. Assume foot traffic is 1.46 times that of bikers based on ratio of foot to bike at Beattie St. who arrived at TH by foot or bike. Removed those who arrived by vehicle for comparison. Likely that these smaller trails without parking lots are local access trails.
Other Mt. Helena access
trails
No trail counters for other Mt. Helena access. Also limited confidence in Trailforks check-ins given limited MB use in area. As such, estimates based on survey respondents' reports of having entered from such sites. Assume similar time distribution as Mt. Helena TH. Value is 6% of main TH for foot and 63% for bike.
Other Ridge access trails
Trails included as potential entry points: Mini Ridge Trail and Show Me the Horse. Show Me is primarily a downhill trail but with some uphill, thus entries are quite small. Mini-Ridge is expected to be balanced up and down. Emmett's trail is not included as it is primarily downhill. Use Trailforks to identify the number of check-ins in May-September 2017. Assume this is 5% of all MB use. Assume foot traffic is .49 times that of bikers based on ratio of foot to bike at Mt. Helena Ridge who arrived at TH by foot, bike, or personal vehicle. Removed those who arrived by shuttle for comparison.
3 Assumption is based on the trails with available MB counters and sufficient Trailforks use. Assume that the direction specific check-ins represent approximately 5% of all use.
Trail Usage and Value 2018
8
Results
Demographics Men outweighed women, 55 to 45 percent, in trail use during the survey period. The average age was rather consistent across gender, with men averaging 45.3, and women 46.1 years old. Out of state users, 40.3 years, were markedly younger than either the local group, 46.5 years, or the other Montana county users, 45.4 years. Demographic questions pertaining to education and income were frequently left blank. Of the 452 respondents who answered the education question, 366 (81 percent) indicated their highest level of education was an undergraduate degree, the remaining 86 (19 percent) indicated a high school diploma as their highest achieved. Seventy-one percent of respondents completed the household income question, with the five middle income categories ($40,000-$59,999, $60,000-$79,999, $80,000-$99,999, $100,000-$119,999) each garnering 18 percent of the responses. Incomes above and below these categories received considerably fewer responses. The same general pattern holds whether the respondent was from the local area, elsewhere in Montana, or out of state.
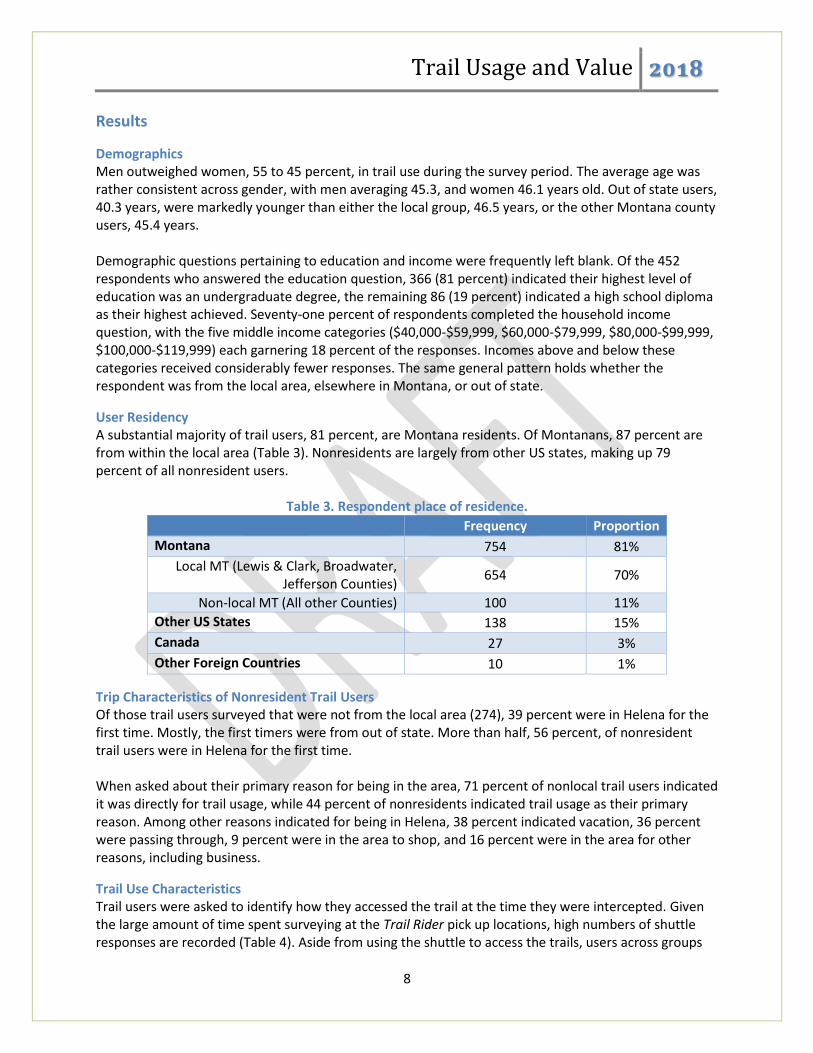
User Residency A substantial majority of trail users, 81 percent, are Montana residents. Of Montanans, 87 percent are from within the local area (Table 3). Nonresidents are largely from other US states, making up 79 percent of all nonresident users.
Table 3. Respondent place of residence. Frequency Proportion
Montana 754 81%
Local MT (Lewis & Clark, Broadwater, Jefferson Counties)
654 70%
Non-local MT (All other Counties) 100 11%
Other US States 138 15%
Canada 27 3%
Other Foreign Countries 10 1%
Trip Characteristics of Nonresident Trail Users Of those trail users surveyed that were not from the local area (274), 39 percent were in Helena for the first time. Mostly, the first timers were from out of state. More than half, 56 percent, of nonresident trail users were in Helena for the first time. When asked about their primary reason for being in the area, 71 percent of nonlocal trail users indicated it was directly for trail usage, while 44 percent of nonresidents indicated trail usage as their primary reason. Among other reasons indicated for being in Helena, 38 percent indicated vacation, 36 percent were passing through, 9 percent were in the area to shop, and 16 percent were in the area for other reasons, including business.
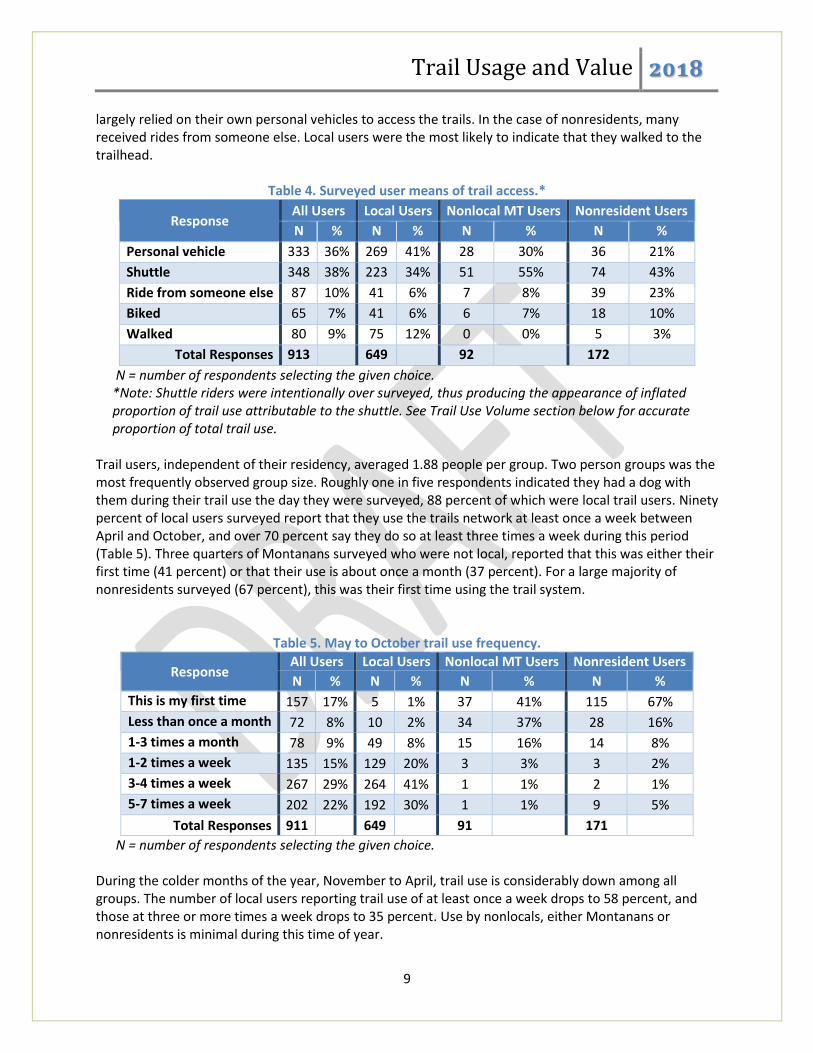
Trail Use Characteristics Trail users were asked to identify how they accessed the trail at the time they were intercepted. Given the large amount of time spent surveying at the Trail Rider pick up locations, high numbers of shuttle responses are recorded (Table 4). Aside from using the shuttle to access the trails, users across groups
Trail Usage and Value 2018
9
largely relied on their own personal vehicles to access the trails. In the case of nonresidents, many received rides from someone else. Local users were the most likely to indicate that they walked to the trailhead.
Table 4. Surveyed user means of trail access.*
Response All Users Local Users Nonlocal MT Users Nonresident Users
N % N % N % N %
Personal vehicle 333 36% 269 41% 28 30% 36 21%
Shuttle 348 38% 223 34% 51 55% 74 43%
Ride from someone else 87 10% 41 6% 7 8% 39 23%
Biked 65 7% 41 6% 6 7% 18 10%
Walked 80 9% 75 12% 0 0% 5 3%
Total Responses 913
649
92
172
N = number of respondents selecting the given choice. *Note: Shuttle riders were intentionally over surveyed, thus producing the appearance of inflated proportion of trail use attributable to the shuttle. See Trail Use Volume section below for accurate proportion of total trail use. Trail users, independent of their residency, averaged 1.88 people per group. Two person groups was the most frequently observed group size. Roughly one in five respondents indicated they had a dog with them during their trail use the day they were surveyed, 88 percent of which were local trail users. Ninety percent of local users surveyed report that they use the trails network at least once a week between April and October, and over 70 percent say they do so at least three times a week during this period (Table 5). Three quarters of Montanans surveyed who were not local, reported that this was either their first time (41 percent) or that their use is about once a month (37 percent). For a large majority of nonresidents surveyed (67 percent), this was their first time using the trail system.
Table 5. May to October trail use frequency.
Response All Users Local Users Nonlocal MT Users Nonresident Users
N % N % N % N %
This is my first time 157 17% 5 1% 37 41% 115 67%
Less than once a month 72 8% 10 2% 34 37% 28 16%
1-3 times a month 78 9% 49 8% 15 16% 14 8%
1-2 times a week 135 15% 129 20% 3 3% 3 2%
3-4 times a week 267 29% 264 41% 1 1% 2 1%
5-7 times a week 202 22% 192 30% 1 1% 9 5%
Total Responses 911 649 91 171
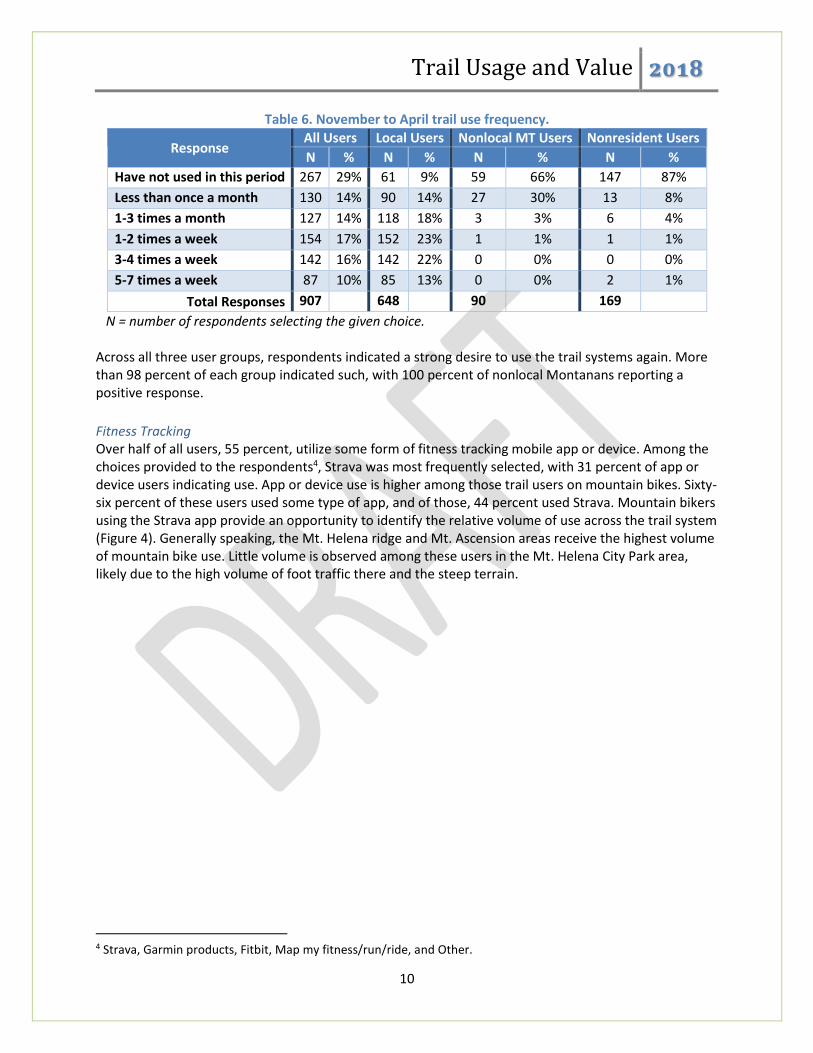
N = number of respondents selecting the given choice. During the colder months of the year, November to April, trail use is considerably down among all groups. The number of local users reporting trail use of at least once a week drops to 58 percent, and those at three or more times a week drops to 35 percent. Use by nonlocals, either Montanans or nonresidents is minimal during this time of year.
Trail Usage and Value 2018
10
Table 6. November to April trail use frequency.
Response All Users Local Users Nonlocal MT Users Nonresident Users
N % N % N % N %
Have not used in this period 267 29% 61 9% 59 66% 147 87%
Less than once a month 130 14% 90 14% 27 30% 13 8%
1-3 times a month 127 14% 118 18% 3 3% 6 4%
1-2 times a week 154 17% 152 23% 1 1% 1 1%
3-4 times a week 142 16% 142 22% 0 0% 0 0%
5-7 times a week 87 10% 85 13% 0 0% 2 1%
Total Responses 907
648
90
169
N = number of respondents selecting the given choice. Across all three user groups, respondents indicated a strong desire to use the trail systems again. More than 98 percent of each group indicated such, with 100 percent of nonlocal Montanans reporting a positive response.
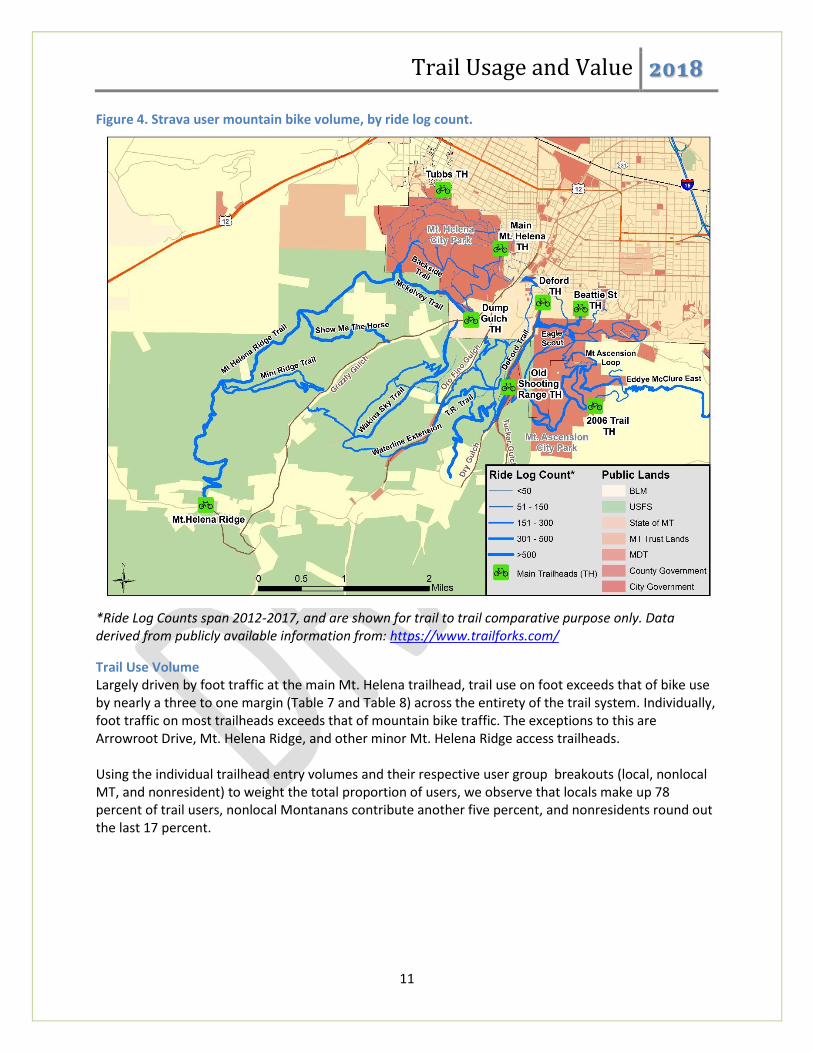
Fitness Tracking Over half of all users, 55 percent, utilize some form of fitness tracking mobile app or device. Among the choices provided to the respondents4, Strava was most frequently selected, with 31 percent of app or device users indicating use. App or device use is higher among those trail users on mountain bikes. Sixty- six percent of these users used some type of app, and of those, 44 percent used Strava. Mountain bikers using the Strava app provide an opportunity to identify the relative volume of use across the trail system (Figure 4). Generally speaking, the Mt. Helena ridge and Mt. Ascension areas receive the highest volume of mountain bike use. Little volume is observed among these users in the Mt. Helena City Park area, likely due to the high volume of foot traffic there and the steep terrain.
4 Strava, Garmin products, Fitbit, Map my fitness/run/ride, and Other.
Trail Usage and Value 2018
11
Figure 4. Strava user mountain bike volume, by ride log count.
*Ride Log Counts span 2012-2017, and are shown for trail to trail comparative purpose only. Data derived from publicly available information from: https://www.trailforks.com/
Trail Use Volume Largely driven by foot traffic at the main Mt. Helena trailhead, trail use on foot exceeds that of bike use by nearly a three to one margin (Table 7 and Table 8) across the entirety of the trail system. Individually, foot traffic on most trailheads exceeds that of mountain bike traffic. The exceptions to this are Arrowroot Drive, Mt. Helena Ridge, and other minor Mt. Helena Ridge access trailheads. Using the individual trailhead entry volumes and their respective user group breakouts (local, nonlocal MT, and nonresident) to weight the total proportion of users, we observe that locals make up 78 percent of trail users, nonlocal Montanans contribute another five percent, and nonresidents round out the last 17 percent.

Trail Usage and Value 2018
12
Table 7. Helena trail system entry point volume for mountain bikes.
Entry Point Total Local Nonlocal MT Nonresident
Arrowroot Dr. trailhead 2,140 1,548 139 452
Beattie St. trailhead 1,014 507 127 380
DeFord trailhead 2,429 1,889 - 540
Dump Gulch trailhead 1,040 867 - 173
Mt. Helena Ridge trailhead 3,561 2,576 232 753
Mt. Helena trailhead 785 785 - -
Old Shooting Range trailhead 1,748 1,464 236 47
Tubbs trailhead 897 897 - -
Other Mt. Ascension trails 1,955 977 244 733
Other Mt. Helena access trails 495 344 23 128
Other Ridge access trails 1,375 802 458 115
Total May-September Entries 17,438 12,657 1,459 3,321
Note: Volumes represent May-September 2017.
Table 8. Helena tail system entry point volume for foot traffic.
Entry Point Total Local Nonlocal MT Nonresident
Arrowroot Dr. trailhead 793 762 16 16
Beattie St. trailhead 7,570 6,729 280 561
DeFord trailhead 3,876 2,769 185 923
Dump Gulch trailhead 1,217 1,015 - 203
Mt. Helena Ridge trailhead 1,363 1,310 27 27
Mt. Helena trailhead 18,847 13,087 876 4,884
Old Shooting Range trailhead 3,089 2,938 75 75
Tubbs trailhead 4,635 4,506 129 -
Other Mt. Ascension trails 2,854 2,537 106 211
Other Mt. Helena access trails 683 474 32 177
Other Ridge access trails 674 393 225 56
Total May-September Entries 45,602 36,520 1,949 7,133
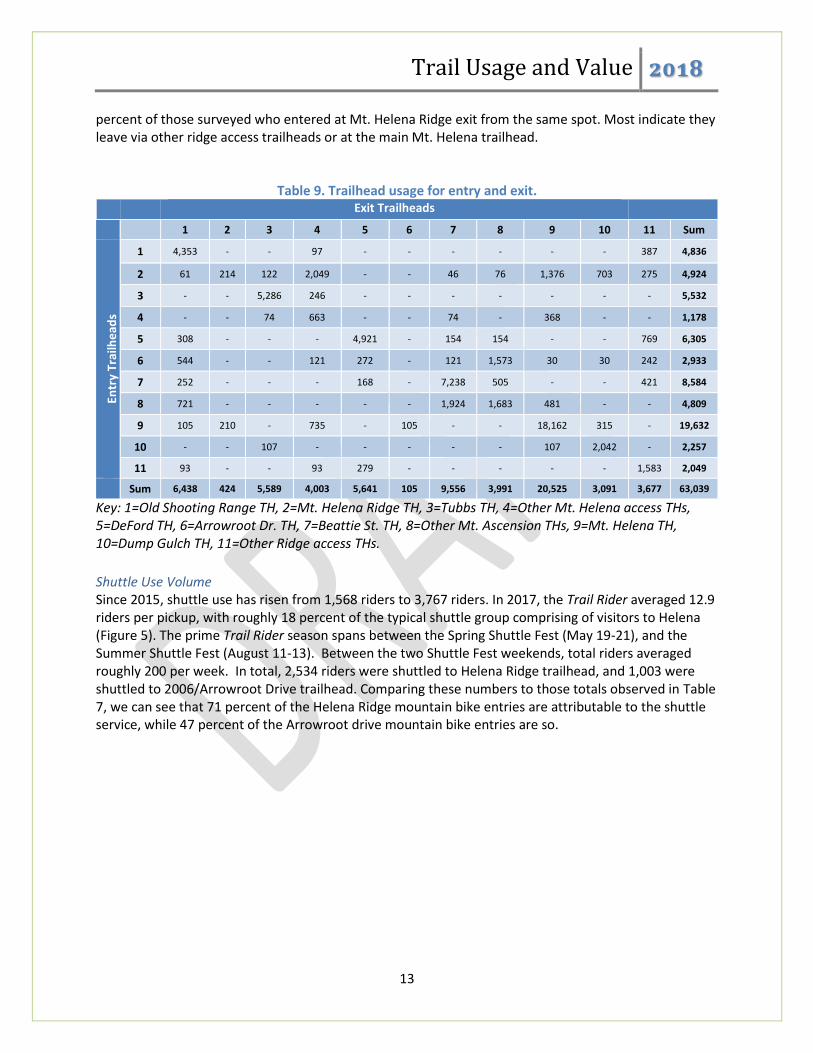
Note: Volumes represent May-September 2017. Given the large number of trail users who drive to and park at the network’s trailheads (see Table 4), it should be expected that many users will enter and exit at the same location. Table 9 demonstrates this to be largely the case across many trailheads, though not all. The rows of the table indicate where surveyed users indicated they entered the trail network on the day they were surveyed. The columns represent where they indicated they left, or planned to leave, the network. For example, we can observe that 90 percent (4,353 of 4,836) trail users who entered at the Old Shooting Range trailhead (1), left from the same location. Alternatively, the prime Trail Rider trailheads, such as Mt. Helena Ridge trailhead (2), serve primarily as entry points and users exit elsewhere from the network. Only 4.3
Trail Usage and Value 2018
13
percent of those surveyed who entered at Mt. Helena Ridge exit from the same spot. Most indicate they leave via other ridge access trailheads or at the main Mt. Helena trailhead.
Table 9. Trailhead usage for entry and exit. Exit Trailheads
1 2 3 4 5 6 7 8 9 10 11 Sum
Entr
y Tr
ailh
ead
s
1 4,353 - - 97 - - - - - - 387 4,836
2 61 214 122 2,049 - - 46 76 1,376 703 275 4,924
3 - - 5,286 246 - - - - - - - 5,532
4 - - 74 663 - - 74 - 368 - - 1,178
5 308 - - - 4,921 - 154 154 - - 769 6,305
6 544 - - 121 272 - 121 1,573 30 30 242 2,933
7 252 - - - 168 - 7,238 505 - - 421 8,584
8 721 - - - - - 1,924 1,683 481 - - 4,809
9 105 210 - 735 - 105 - - 18,162 315 - 19,632
10 - - 107 - - - - - 107 2,042 - 2,257
11 93 - - 93 279 - - - - - 1,583 2,049
Sum 6,438 424 5,589 4,003 5,641 105 9,556 3,991 20,525 3,091 3,677 63,039
Key: 1=Old Shooting Range TH, 2=Mt. Helena Ridge TH, 3=Tubbs TH, 4=Other Mt. Helena access THs, 5=DeFord TH, 6=Arrowroot Dr. TH, 7=Beattie St. TH, 8=Other Mt. Ascension THs, 9=Mt. Helena TH, 10=Dump Gulch TH, 11=Other Ridge access THs.
Shuttle Use Volume Since 2015, shuttle use has risen from 1,568 riders to 3,767 riders. In 2017, the Trail Rider averaged 12.9 riders per pickup, with roughly 18 percent of the typical shuttle group comprising of visitors to Helena (Figure 5). The prime Trail Rider season spans between the Spring Shuttle Fest (May 19-21), and the Summer Shuttle Fest (August 11-13). Between the two Shuttle Fest weekends, total riders averaged roughly 200 per week. In total, 2,534 riders were shuttled to Helena Ridge trailhead, and 1,003 were shuttled to 2006/Arrowroot Drive trailhead. Comparing these numbers to those totals observed in Table 7, we can see that 71 percent of the Helena Ridge mountain bike entries are attributable to the shuttle service, while 47 percent of the Arrowroot drive mountain bike entries are so.
Trail Usage and Value 2018
14
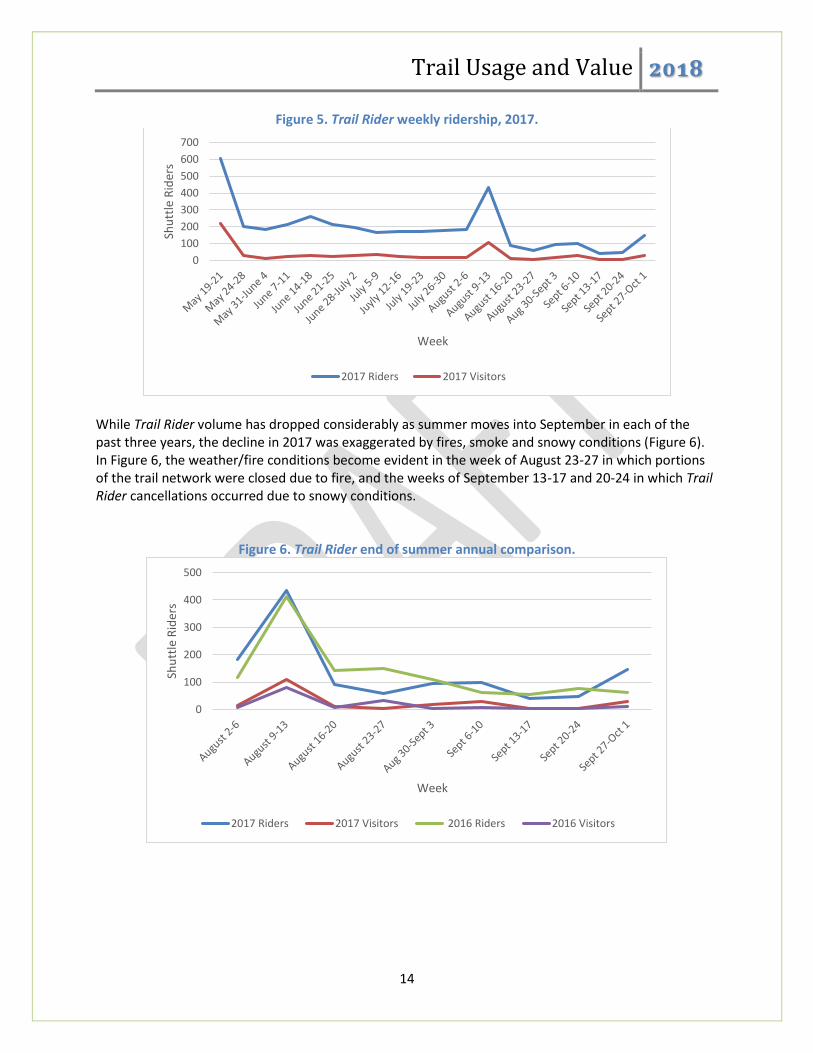
Figure 5. Trail Rider weekly ridership, 2017.
While Trail Rider volume has dropped considerably as summer moves into September in each of the past three years, the decline in 2017 was exaggerated by fires, smoke and snowy conditions (Figure 6). In Figure 6, the weather/fire conditions become evident in the week of August 23-27 in which portions of the trail network were closed due to fire, and the weeks of September 13-17 and 20-24 in which Trail Rider cancellations occurred due to snowy conditions.
Figure 6. Trail Rider end of summer annual comparison.
0
100
200
300
400
500
600
700
Shu
ttle
Rid
ers
Week
2017 Riders 2017 Visitors
0
100
200
300
400
500
Shu
ttle
Rid
ers
Week
2017 Riders 2017 Visitors 2016 Riders 2016 Visitors
Trail Usage and Value 2018
15
Trail User Spending in Helena
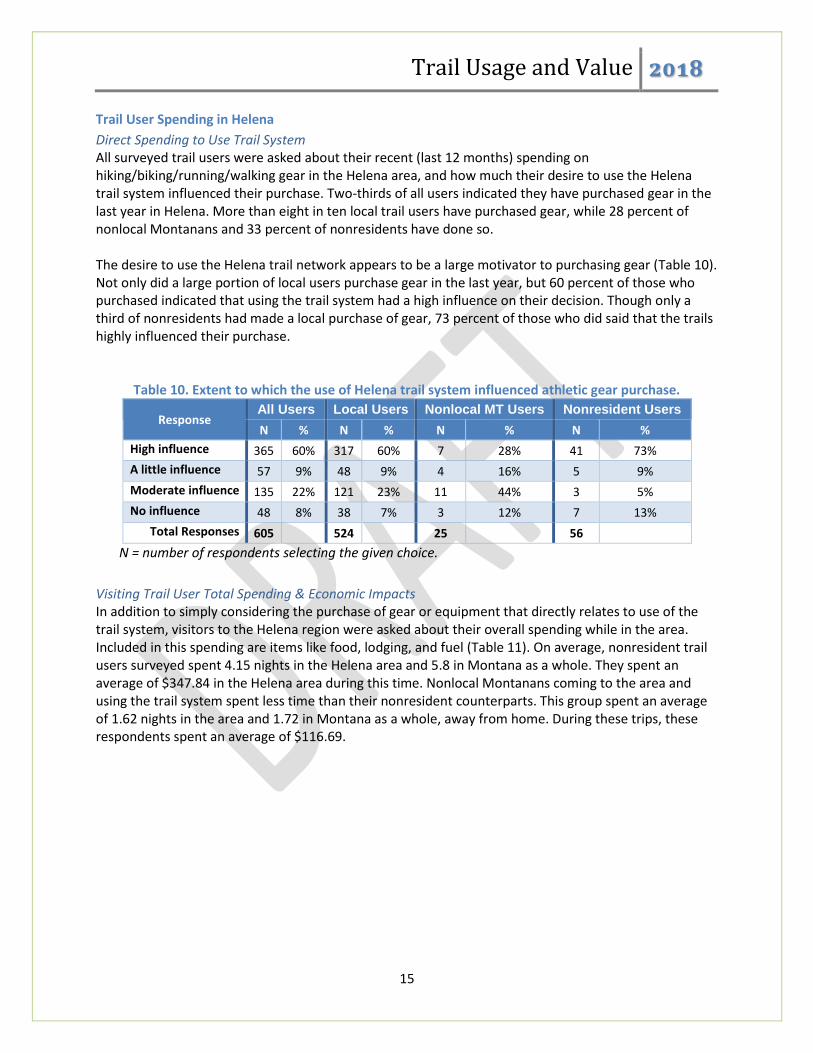
Direct Spending to Use Trail System All surveyed trail users were asked about their recent (last 12 months) spending on hiking/biking/running/walking gear in the Helena area, and how much their desire to use the Helena trail system influenced their purchase. Two-thirds of all users indicated they have purchased gear in the last year in Helena. More than eight in ten local trail users have purchased gear, while 28 percent of nonlocal Montanans and 33 percent of nonresidents have done so. The desire to use the Helena trail network appears to be a large motivator to purchasing gear (Table 10). Not only did a large portion of local users purchase gear in the last year, but 60 percent of those who purchased indicated that using the trail system had a high influence on their decision. Though only a third of nonresidents had made a local purchase of gear, 73 percent of those who did said that the trails highly influenced their purchase.
Table 10. Extent to which the use of Helena trail system influenced athletic gear purchase.
Response All Users Local Users Nonlocal MT Users Nonresident Users
N % N % N % N %
High influence 365 60% 317 60% 7 28% 41 73%
A little influence 57 9% 48 9% 4 16% 5 9%
Moderate influence 135 22% 121 23% 11 44% 3 5%
No influence 48 8% 38 7% 3 12% 7 13%
Total Responses 605 524 25 56
N = number of respondents selecting the given choice.
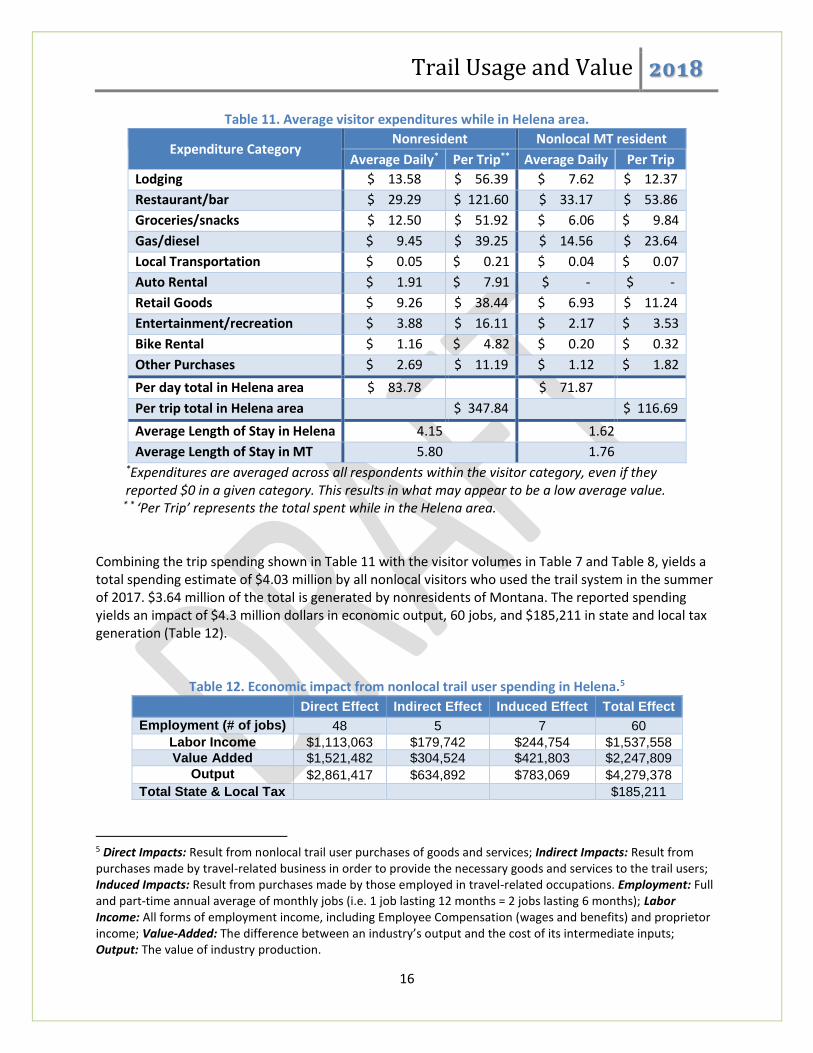
Visiting Trail User Total Spending & Economic Impacts In addition to simply considering the purchase of gear or equipment that directly relates to use of the trail system, visitors to the Helena region were asked about their overall spending while in the area. Included in this spending are items like food, lodging, and fuel (Table 11). On average, nonresident trail users surveyed spent 4.15 nights in the Helena area and 5.8 in Montana as a whole. They spent an average of $347.84 in the Helena area during this time. Nonlocal Montanans coming to the area and using the trail system spent less time than their nonresident counterparts. This group spent an average of 1.62 nights in the area and 1.72 in Montana as a whole, away from home. During these trips, these respondents spent an average of $116.69.
Trail Usage and Value 2018
16
Table 11. Average visitor expenditures while in Helena area.
Expenditure Category Nonresident Nonlocal MT resident
Average Daily* Per Trip** Average Daily Per Trip
Lodging $ 13.58 $ 56.39 $ 7.62 $ 12.37
Restaurant/bar $ 29.29 $ 121.60 $ 33.17 $ 53.86
Groceries/snacks $ 12.50 $ 51.92 $ 6.06 $ 9.84
Gas/diesel $ 9.45 $ 39.25 $ 14.56 $ 23.64
Local Transportation $ 0.05 $ 0.21 $ 0.04 $ 0.07
Auto Rental $ 1.91 $ 7.91 $ - $ -
Retail Goods $ 9.26 $ 38.44 $ 6.93 $ 11.24
Entertainment/recreation $ 3.88 $ 16.11 $ 2.17 $ 3.53
Bike Rental $ 1.16 $ 4.82 $ 0.20 $ 0.32
Other Purchases $ 2.69 $ 11.19 $ 1.12 $ 1.82
Per day total in Helena area $ 83.78
$ 71.87
Per trip total in Helena area
$ 347.84
$ 116.69
Average Length of Stay in Helena 4.15 1.62
Average Length of Stay in MT 5.80 1.76
*Expenditures are averaged across all respondents within the visitor category, even if they reported $0 in a given category. This results in what may appear to be a low average value. * * ‘Per Trip’ represents the total spent while in the Helena area. Combining the trip spending shown in Table 11 with the visitor volumes in Table 7 and Table 8, yields a total spending estimate of $4.03 million by all nonlocal visitors who used the trail system in the summer of 2017. $3.64 million of the total is generated by nonresidents of Montana. The reported spending yields an impact of $4.3 million dollars in economic output, 60 jobs, and $185,211 in state and local tax generation (Table 12).
Table 12. Economic impact from nonlocal trail user spending in Helena.5 Direct Effect Indirect Effect Induced Effect Total Effect
Employment (# of jobs) 48 5 7 60
Labor Income $1,113,063 $179,742 $244,754 $1,537,558
Value Added $1,521,482 $304,524 $421,803 $2,247,809
Output $2,861,417 $634,892 $783,069 $4,279,378
Total State & Local Tax $185,211
5 Direct Impacts: Result from nonlocal trail user purchases of goods and services; Indirect Impacts: Result from purchases made by travel-related business in order to provide the necessary goods and services to the trail users; Induced Impacts: Result from purchases made by those employed in travel-related occupations. Employment: Full and part-time annual average of monthly jobs (i.e. 1 job lasting 12 months = 2 jobs lasting 6 months); Labor Income: All forms of employment income, including Employee Compensation (wages and benefits) and proprietor income; Value-Added: The difference between an industry’s output and the cost of its intermediate inputs; Output: The value of industry production.
Trail Usage and Value 2018
17
Section II: Helena Community Surveys
Methods In order to gauge the perceptions and values of the South Hills trail system by Helena area residents, two similar surveys were developed. Each survey is detailed below. The first survey is an intercept survey, in residents are approached by the surveyor at fueling stations. From this point forward, when referring to the intercept survey, or intercepted respondents, it is this in-person survey, conducted by a surveyor, to which we are referring. We view this survey as providing a representative sample of the adult population of Helena residents. The second survey was delivered online via a social media push from several agencies in Helena. From this point forward, when referring to the push survey, or push respondents, it is this online, social media survey to which we are referring. As detailed in the next section, social media surveys possess limitations that can generate significant levels of bias. As such, we use the results of this survey sparingly and only in areas where we are not attempting to generalize to the greater Helena adult population. Further detail is provided in the Limitations section of the push survey.
Intercept Survey Helena area residents (reside within Jefferson, Broadwater or Lewis & Clark Counties) were intercepted
while at fueling stations in Helena between May 15th, 2017 and September 30th, 2017.6 Fuel stations
used were Town Pumps at the following locations:
1. 1140 Euclid Ave.
2. 2401 N MT Ave.
3. 2900 N MT Ave.
4. 3161 N Sanders St.
Town Pump locations were used based on previously established agreements with management for
ITRR’s larger nonresident survey efforts statewide. The same surveyor was used in these community
intercepts as for the trail use survey. Efforts were made to diversify the time of day and day of week in
which the surveyor was located at each fueling station so as to broaden the opportunity for Helena area
residents to be intercepted.
Survey design The survey instrument (See Appendix B) consisted of 14 questions and was delivered via an iPad tablet
held by the surveyor. The survey was designed to last no more than three minutes, such that it may be
completed in the duration of re-fueling and not further inconvenience the respondent or hold up the
pump spot.
6 For a complete discussion of ITRR intercept methodology, see: http://itrr.umt.edu/files/NonresTravelSurvey-Methods-Analysis.pdf
Trail Usage and Value 2018
18
Limitations As with all of ITRR’s intercept based surveys, fuel stations provide an opportunity to intercept a wide
cross section of the adult residents of the Helena area. Here, we consider the entire three county area
to be of the target population; however, all surveyed fuel stations are in Helena. As such, county
residents who do not routinely travel into, and purchase fuel in Helena, are likely to have had reduced
opportunity for intercept. Additionally, those residents who do not routinely drive would not have been
intercepted.
Response rate In total, 348 potential respondents were approached by the surveyor. Twenty-three individuals refused to take the survey, leaving 325 completed surveys. These completed surveys result in a response rate of 93%.
Social Media ‘Push’ Survey In addition to an intercept based survey, an online survey was developed in the Qualtrics platform and delivered via a social media ‘push’. The initial push for the survey was generated through the Bike Helena and Visit Helena Montana Facebook pages, followed by the Helena Area Chamber of Commerce. The survey appeared in the Facebook feeds of followers of the two entities. Figure 7 shows an example of the social media invitation seen on the page of followers of either page. Viewers of the invitation were able to click on the link and, if desired, share it to their own page, thus expanding the reach of the survey.
Figure 7. Social media based survey invitation.
Trail Usage and Value 2018
19
Survey design The survey instrument (See Appendix C) consisted of 17 questions and was delivered online via the
Qualtrics platform. The survey was designed such that it would supplement the intercept based survey.
Several questions directly correspond to those in the intercept such that consideration may be made as
to the representative nature of the social media based distribution. Additional questions were added
that could not be asked in the intercept survey due to time constraints.
Limitations In all of ITRR’s survey efforts, we seek to capture a representative snapshot of the target population. In
this case, the population is adult residents of the three counties around Helena (Lewis and Clark,
Broadwater, and Jefferson). The distribution mechanism used here limits who may view and thus
ultimately take the survey. With the initial invitation being distributed via a Facebook page, a Helena
area resident must have already been a follower of either Bike Helena or Visit Helena Montana in order
to see the announcement in their own Facebook feed. This creates the first level of a potential bias.
From the point of having seen the survey, to actually clicking on the notice and taking the survey,
another potential bias is introduced. It is very likely that individuals already inclined to be interested in
outdoor recreation, will respond at a higher rate than those not interested, thus creating the potential
for further bias. Given these limitations, we take care to identify below where the online survey results
are used and where feasible, how these results compare to those of the more representative intercept
survey.
Response rate The survey was active for 7 days in the summer of 2017 and reached 6,296 on Bike Helena’s page and
5,659 on Visit Helena Montana’s page. From Bike Helena, 235 viewers clicked on the survey link (3.7
percent) and 29 people shared the link. From Visit Helena Montana, 195 viewers clicked on the survey
link (3.4 percent) and 43 people shared the link. In total, 1,142 surveys were completed.7 As direct clicks
from the two pages sums to 430, numerous responses were recorded from the shares. Blocks were
established to minimize the opportunity for individuals to respond to the survey multiple times (known
as ballot stuffing).8 Incomplete surveys, 110, were removed from analysis. An additional 46 surveys were
started, but the respondent was filtered out due to not being a local resident.
7 Data from Helena Area Chamber of Commerce Facebook not available. The survey was available on their site for only the final two days of the survey. 8 By preventing ballot stuffing, a given IP address may only be used once to complete the survey in an internet browser.
Trail Usage and Value 2018
20
Results
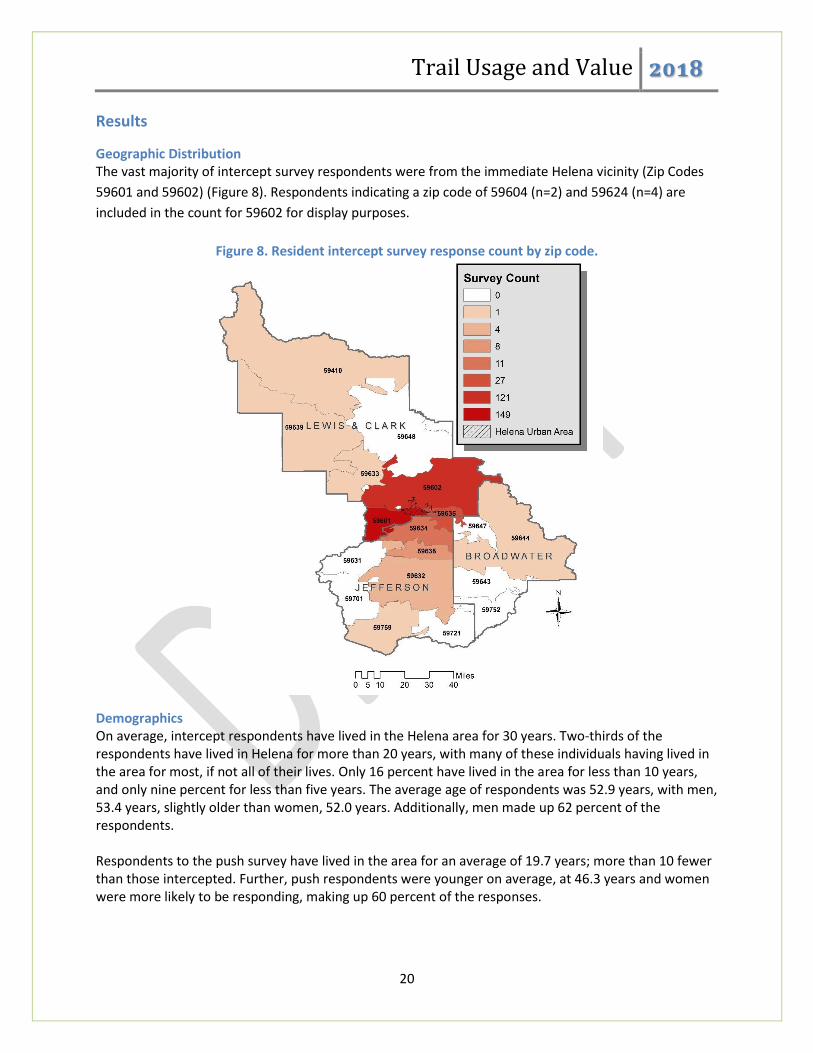
Geographic Distribution The vast majority of intercept survey respondents were from the immediate Helena vicinity (Zip Codes
59601 and 59602) (Figure 8). Respondents indicating a zip code of 59604 (n=2) and 59624 (n=4) are
included in the count for 59602 for display purposes.
Figure 8. Resident intercept survey response count by zip code.
Demographics On average, intercept respondents have lived in the Helena area for 30 years. Two-thirds of the respondents have lived in Helena for more than 20 years, with many of these individuals having lived in the area for most, if not all of their lives. Only 16 percent have lived in the area for less than 10 years, and only nine percent for less than five years. The average age of respondents was 52.9 years, with men, 53.4 years, slightly older than women, 52.0 years. Additionally, men made up 62 percent of the respondents. Respondents to the push survey have lived in the area for an average of 19.7 years; more than 10 fewer than those intercepted. Further, push respondents were younger on average, at 46.3 years and women were more likely to be responding, making up 60 percent of the responses.
Trail Usage and Value 2018
21
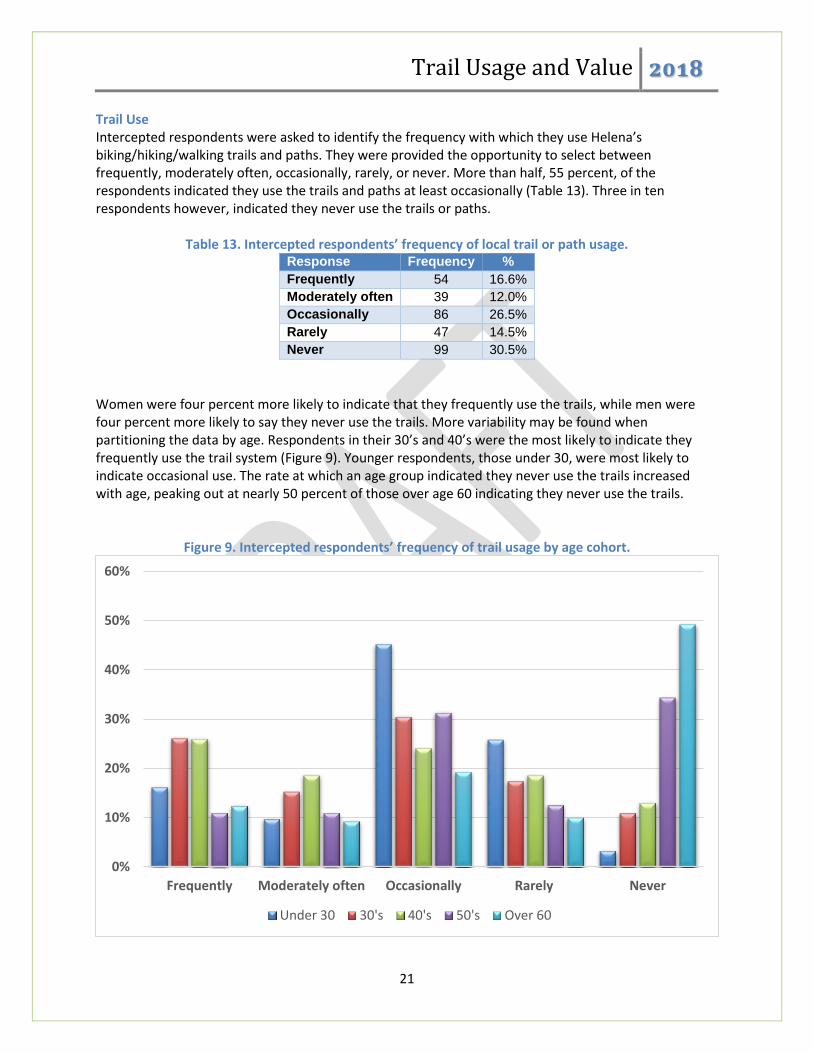
Trail Use Intercepted respondents were asked to identify the frequency with which they use Helena’s biking/hiking/walking trails and paths. They were provided the opportunity to select between frequently, moderately often, occasionally, rarely, or never. More than half, 55 percent, of the respondents indicated they use the trails and paths at least occasionally (Table 13). Three in ten respondents however, indicated they never use the trails or paths.
Table 13. Intercepted respondents’ frequency of local trail or path usage. Response Frequency %
Frequently 54 16.6%
Moderately often 39 12.0%
Occasionally 86 26.5%
Rarely 47 14.5%
Never 99 30.5%
Women were four percent more likely to indicate that they frequently use the trails, while men were four percent more likely to say they never use the trails. More variability may be found when partitioning the data by age. Respondents in their 30’s and 40’s were the most likely to indicate they frequently use the trail system (Figure 9). Younger respondents, those under 30, were most likely to indicate occasional use. The rate at which an age group indicated they never use the trails increased with age, peaking out at nearly 50 percent of those over age 60 indicating they never use the trails.
Figure 9. Intercepted respondents’ frequency of trail usage by age cohort.
0%
10%
20%
30%
40%
50%
60%
Frequently Moderately often Occasionally Rarely Never
Under 30 30's 40's 50's Over 60
Trail Usage and Value 2018
22
In comparison, and a demonstration of the bias introduced in the online survey, only three percent of online survey respondents indicated they never used the trail system, while 43 percent indicated they frequently use the trails for walking or hiking and 21 percent indicate they frequently do so for biking. This compares to the 30 percent who indicated they never use the trails, and 17 percent who used them frequently in the intercept survey (Table 13). These results suggest that those who responded to the online survey are more likely than the general Helena population to be avid trail proponents and users, thus results displayed below should be considered within such a frame.
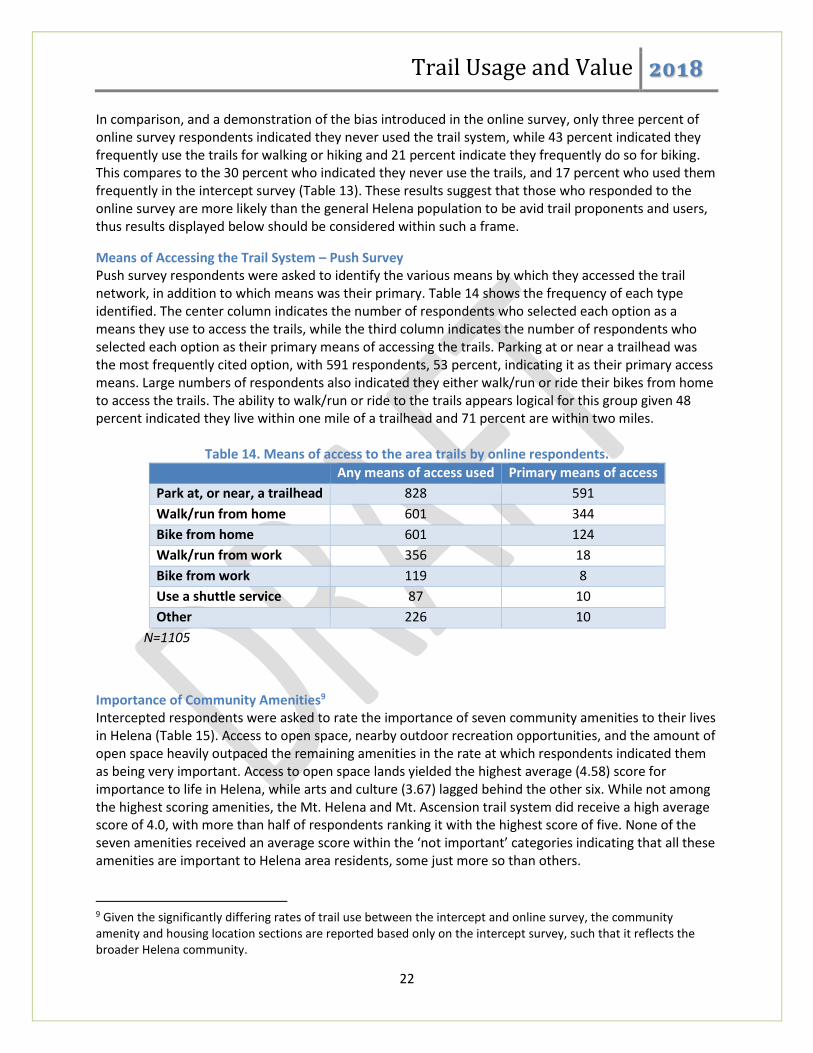
Means of Accessing the Trail System – Push Survey Push survey respondents were asked to identify the various means by which they accessed the trail network, in addition to which means was their primary. Table 14 shows the frequency of each type identified. The center column indicates the number of respondents who selected each option as a means they use to access the trails, while the third column indicates the number of respondents who selected each option as their primary means of accessing the trails. Parking at or near a trailhead was the most frequently cited option, with 591 respondents, 53 percent, indicating it as their primary access means. Large numbers of respondents also indicated they either walk/run or ride their bikes from home to access the trails. The ability to walk/run or ride to the trails appears logical for this group given 48 percent indicated they live within one mile of a trailhead and 71 percent are within two miles.
Table 14. Means of access to the area trails by online respondents. Any means of access used Primary means of access
Park at, or near, a trailhead 828 591
Walk/run from home 601 344
Bike from home 601 124
Walk/run from work 356 18
Bike from work 119 8
Use a shuttle service 87 10
Other 226 10
N=1105
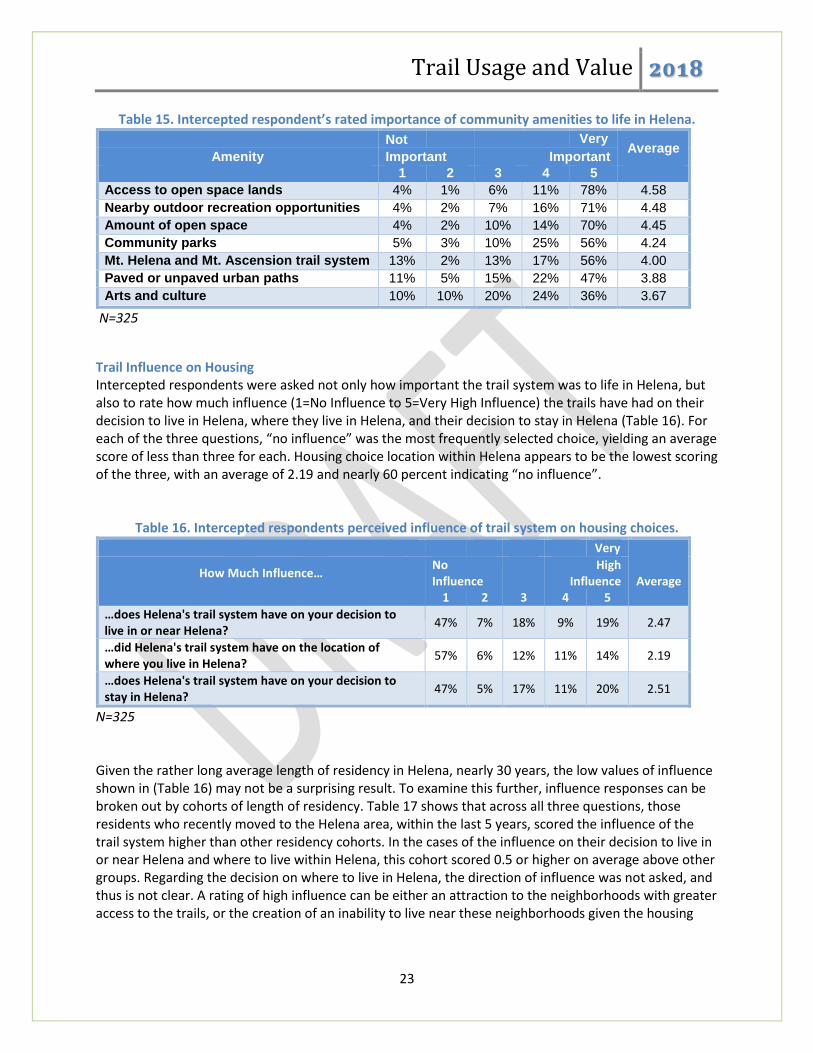
Importance of Community Amenities9 Intercepted respondents were asked to rate the importance of seven community amenities to their lives in Helena (Table 15). Access to open space, nearby outdoor recreation opportunities, and the amount of open space heavily outpaced the remaining amenities in the rate at which respondents indicated them as being very important. Access to open space lands yielded the highest average (4.58) score for importance to life in Helena, while arts and culture (3.67) lagged behind the other six. While not among the highest scoring amenities, the Mt. Helena and Mt. Ascension trail system did receive a high average score of 4.0, with more than half of respondents ranking it with the highest score of five. None of the seven amenities received an average score within the ‘not important’ categories indicating that all these amenities are important to Helena area residents, some just more so than others.
9 Given the significantly differing rates of trail use between the intercept and online survey, the community amenity and housing location sections are reported based only on the intercept survey, such that it reflects the broader Helena community.
Trail Usage and Value 2018
23
Table 15. Intercepted respondent’s rated importance of community amenities to life in Helena.
Not Very Average
Amenity Important Important
1 2 3 4 5
Access to open space lands 4% 1% 6% 11% 78% 4.58
Nearby outdoor recreation opportunities 4% 2% 7% 16% 71% 4.48
Amount of open space 4% 2% 10% 14% 70% 4.45
Community parks 5% 3% 10% 25% 56% 4.24
Mt. Helena and Mt. Ascension trail system 13% 2% 13% 17% 56% 4.00
Paved or unpaved urban paths 11% 5% 15% 22% 47% 3.88
Arts and culture 10% 10% 20% 24% 36% 3.67
N=325
Trail Influence on Housing Intercepted respondents were asked not only how important the trail system was to life in Helena, but also to rate how much influence (1=No Influence to 5=Very High Influence) the trails have had on their decision to live in Helena, where they live in Helena, and their decision to stay in Helena (Table 16). For each of the three questions, “no influence” was the most frequently selected choice, yielding an average score of less than three for each. Housing choice location within Helena appears to be the lowest scoring of the three, with an average of 2.19 and nearly 60 percent indicating “no influence”.
Table 16. Intercepted respondents perceived influence of trail system on housing choices.
Very
Average How Much Influence…
No Influence
High Influence
1 2 3 4 5
…does Helena's trail system have on your decision to live in or near Helena?
47% 7% 18% 9% 19% 2.47
…did Helena's trail system have on the location of where you live in Helena?
57% 6% 12% 11% 14% 2.19
…does Helena's trail system have on your decision to stay in Helena?
47% 5% 17% 11% 20% 2.51
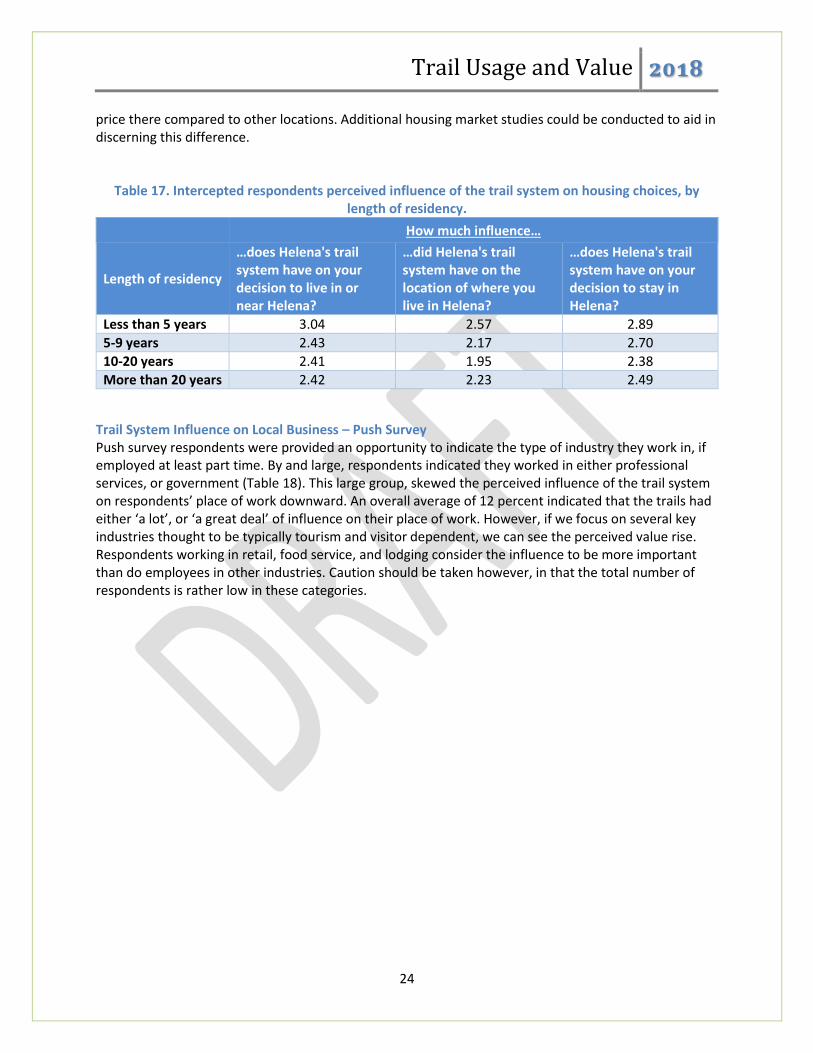
N=325 Given the rather long average length of residency in Helena, nearly 30 years, the low values of influence shown in (Table 16) may not be a surprising result. To examine this further, influence responses can be broken out by cohorts of length of residency. Table 17 shows that across all three questions, those residents who recently moved to the Helena area, within the last 5 years, scored the influence of the trail system higher than other residency cohorts. In the cases of the influence on their decision to live in or near Helena and where to live within Helena, this cohort scored 0.5 or higher on average above other groups. Regarding the decision on where to live in Helena, the direction of influence was not asked, and thus is not clear. A rating of high influence can be either an attraction to the neighborhoods with greater access to the trails, or the creation of an inability to live near these neighborhoods given the housing
Trail Usage and Value 2018
24
price there compared to other locations. Additional housing market studies could be conducted to aid in discerning this difference.
Table 17. Intercepted respondents perceived influence of the trail system on housing choices, by length of residency.
How much influence…
Length of residency
…does Helena's trail system have on your decision to live in or near Helena?
…did Helena's trail system have on the location of where you live in Helena?
…does Helena's trail system have on your decision to stay in Helena?
Less than 5 years 3.04 2.57 2.89
5-9 years 2.43 2.17 2.70
10-20 years 2.41 1.95 2.38
More than 20 years 2.42 2.23 2.49
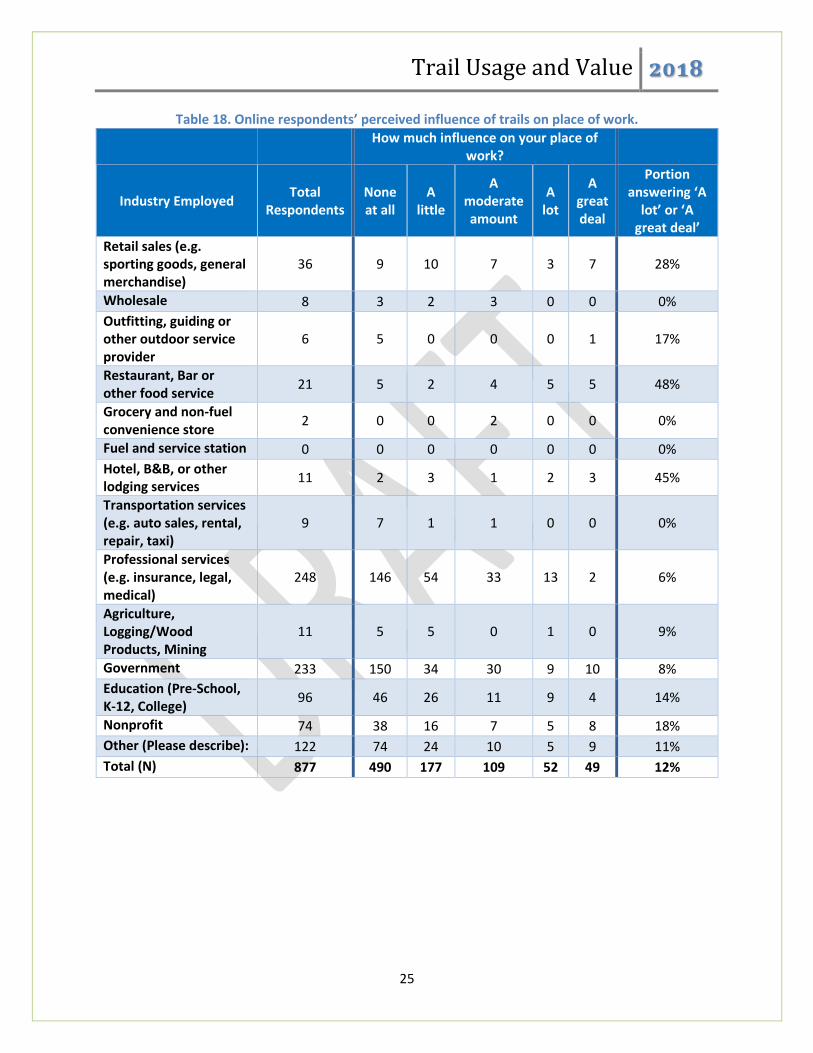
Trail System Influence on Local Business – Push Survey Push survey respondents were provided an opportunity to indicate the type of industry they work in, if employed at least part time. By and large, respondents indicated they worked in either professional services, or government (Table 18). This large group, skewed the perceived influence of the trail system on respondents’ place of work downward. An overall average of 12 percent indicated that the trails had either ‘a lot’, or ‘a great deal’ of influence on their place of work. However, if we focus on several key industries thought to be typically tourism and visitor dependent, we can see the perceived value rise. Respondents working in retail, food service, and lodging consider the influence to be more important than do employees in other industries. Caution should be taken however, in that the total number of respondents is rather low in these categories.
Trail Usage and Value 2018
25
Table 18. Online respondents’ perceived influence of trails on place of work.
How much influence on your place of
work?
Industry Employed Total
Respondents None at all
A little
A moderate amount
A lot
A great deal
Portion answering ‘A
lot’ or ‘A great deal’
Retail sales (e.g. sporting goods, general merchandise)
36 9 10 7 3 7 28%
Wholesale 8 3 2 3 0 0 0%
Outfitting, guiding or other outdoor service provider
6 5 0 0 0 1 17%
Restaurant, Bar or other food service
21 5 2 4 5 5 48%
Grocery and non-fuel convenience store
2 0 0 2 0 0 0%
Fuel and service station 0 0 0 0 0 0 0%
Hotel, B&B, or other lodging services
11 2 3 1 2 3 45%
Transportation services (e.g. auto sales, rental, repair, taxi)
9 7 1 1 0 0 0%
Professional services (e.g. insurance, legal, medical)
248 146 54 33 13 2 6%
Agriculture, Logging/Wood Products, Mining
11 5 5 0 1 0 9%
Government 233 150 34 30 9 10 8%
Education (Pre-School, K-12, College)
96 46 26 11 9 4 14%
Nonprofit 74 38 16 7 5 8 18%
Other (Please describe): 122 74 24 10 5 9 11%
Total (N) 877 490 177 109 52 49 12%
Trail Usage and Value 2018
26
Conclusions & Recommendations Outdoor recreation is a major driver of tourism in many parts of Montana. Mountain bike tourism is a growing component of business for Helena and Montana more broadly. In recent years, the community of Helena has invested in expanding mountain bike tourism. Measuring and understanding the economic impact of mountain bike tourism for Helena provides the community with sound numbers in which future biking investments may be made. This report utilized surveys conducted of both the trail users, on foot or bike, and the broader Helena community to gauge the perceived value on the system and estimate the annual dollars spent in the community by those who visit Helena and take part in recreation on the trail system. Combining the survey information collected with both manual and electronic counts of users entering the trail system, we estimate that over 63,000 users took part in outdoor recreation on these trails between May and September of 2017. Of these numbers, 17,438 were on Mountain bikes, and 45,602 were on foot. Just over a quarter of all mountain bike activity was from users outside the local area, and one in five users on foot were nonlocal. In total, these nonlocal users spent $4.03 million on goods and services in the local area, $1.3 million of which came from mountain bike users. $4.3 million in economic activity and 60 jobs can be attributed to spending by visitors to the area who recreate in the South Hills. Not only does the opportunity to recreate on the trail networks of the South Hills contribute to the attractiveness of Helena for visitors, but it also provides a valuable recreation opportunity for residents. Seventy-three percent of mountain biking and 80 percent of foot traffic on the trails is from local users. When surveyed, local trail users indicated a high frequency of use. More than 70 percent use the trail at least three times a week during late spring and through the summer months.
In addition to those avid trail users, the broader Helena community recognizes the value of the trail
system as a component of the overall outdoor amenities offered by Helena. Over half of respondents
rated the trail system as ‘very important’ to the quality of life in Helena. Additionally, 55 percent of
Helena residents indicated they use the trails at least occasionally.
While the average adult resident of Helena has lived in the area for many years and does not
overwhelmingly consider the trail system a significant component of why they decided to live where
they do (likely due to the trails and open space acquisition occurring after their choice of where to live),
those residents new to the area, within the last five years, do give more weight to the influence of the
trails on not only their decision to move to Helena, but also where in Helena they chose to live.
Lastly, while there appears to be a broad attraction to the trail across visitors and locals alike, as well as
across many age cohorts, there does appear to be a substantial drop off in use among those over the
age of 60. Nearly 50 percent of survey respondents in this age group indicated they never use the trails,
compared with only three percent of those adults under 30. While the surveys in this report do not
contain enough information to identify why this low rate of usage might be, it does spark an opportunity
Trail Usage and Value 2018
27
for further evaluation, especially given the average age of survey respondents was nearly 53 years. It is
well known that mobility declines as we age and thus accessibility of recreation opportunities becomes a
concern. Thus, the perceived or real accessibility concerns may be playing into this decline.
Studies of dispersed recreation such as trail use, are usually more difficult to conduct as well as to
analyze for a population estimate. The use of trail counters and proportion counts are a minimum
requirement for valid estimation of local vs non-local use especially if economic impact estimates are
desired. Future studies of trail usage need to incorporate these minimum requirements. Perhaps trail
counters could be made available for rent by the Montana Office of Tourism and Business Development
or by Bike Walk Montana if the local parks and recreation departments do not have their own counters.
This would allow small communities the chance to understand their local trail use. A rotation of rental
year could be designed such that each interested community could do counts every five years or so.
We found through this study that social media on-line ‘push’ surveys provide results skewed to the
interested parties. They are not random and do not reflect the population; therefore these should be
used sparingly for decision making. If organizations are interested in a certain user group, these types of
surveys will provide the data for the user group. What happens throughout the ‘research world’ is that
people and organizations misuse the data from social media surveys by not highlighting the methods
and limitations resulting in a belief that it reflects all people’s views. It is this type of data
misappropriation that bring about false claims of the data.
Trail Usage and Value 2018
28
Appendix A: Helena Trail User Characteristic Survey Hello, my name is _____ from the Institute for Tourism and Recreation Research at the University of Montana. We are conducting a study on Helena’s trail usage. Would you take a few minutes right now to complete a 2 minute survey? Thank you! Trail entry pt. Mt. Helena larger trailhead with parking; Dump Gulch; Tubbs; Other Mt. Helena access trails; Beattie st. Trailhead; Old Shooting range trail head; Arrowroot drive trailhead; Other Mt. Ascension access trails; Mt. Helena Ridge trailhead; other ridge access trails Q1. What US state, Canadian Province or Country to you permanently reside__________ Q2. Do you currently reside in Lewis and Clark or Jefferson County? Yes (skip to Q12) No
Q3. What is your zip code or postal code? ___________
Q4. Is this your first time visiting the Helena area? Yes No
Q5. Was using the trails your primary reason for being in the area? Yes No
Q6. For what other reasons are you visiting the area? (Check all that apply.) Vacation/recreation/pleasure Visiting friends/relatives Just passing through Shopping Business/convention/meeting Work in Helena but live outside Lewis & Clark or Jefferson Counties
Q7. For this trip, how many total nights will you spend away from home? 0 (Skip to Q9) List of 1- 10 or more
Q8. How many of those nights will be in Montana? List of 0- 10 or more
Q9. Of your nights in Montana, how many will you stay in Helena? List of 0 – 10 or more
10. Please enter your best estimate of the TOTAL amount of money in US dollars you (and your family/travel group, if applicable) spent in Helena in each of the following categories.
If you did not spend money in a category, please leave it blank. ACCOMMODATIONS in Helena
Hotel/motel/bed & breakfast/cabin/room or couch Campground
FOOD in Helena Restaurant/bar Groceries/snacks
Trail Usage and Value 2018
29
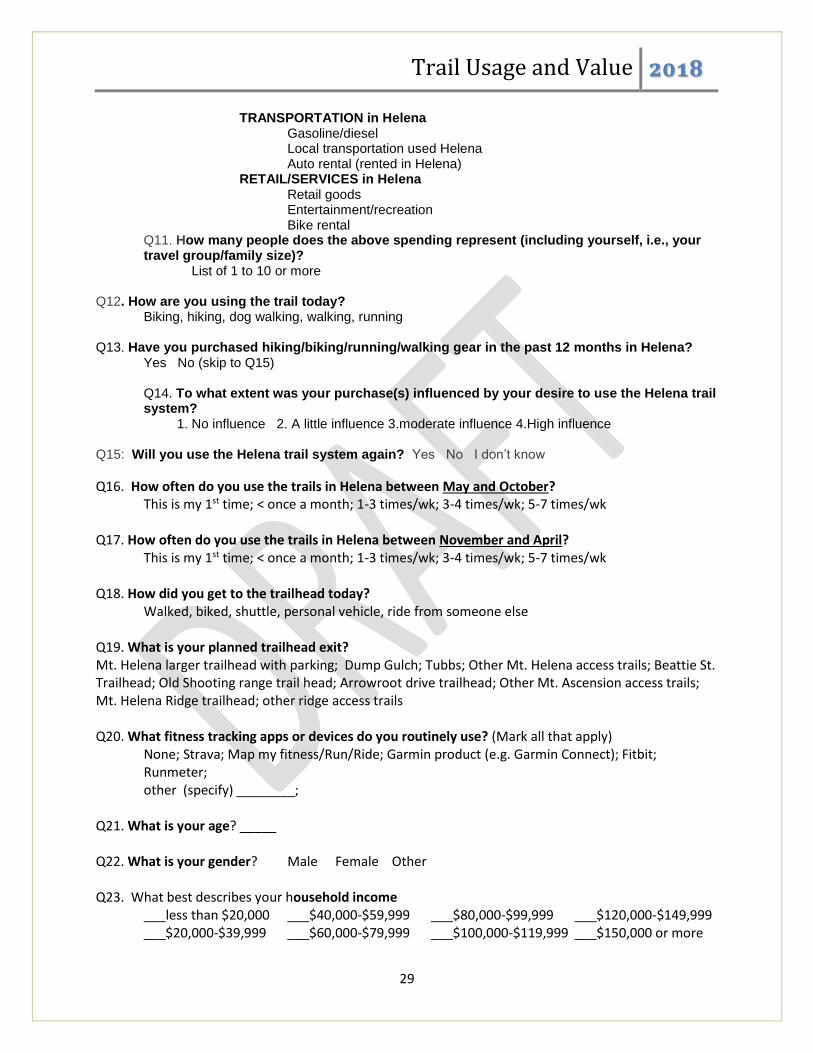
TRANSPORTATION in Helena Gasoline/diesel Local transportation used Helena Auto rental (rented in Helena)
RETAIL/SERVICES in Helena Retail goods Entertainment/recreation
Bike rental Q11. How many people does the above spending represent (including yourself, i.e., your travel group/family size)?
List of 1 to 10 or more Q12. How are you using the trail today? Biking, hiking, dog walking, walking, running Q13. Have you purchased hiking/biking/running/walking gear in the past 12 months in Helena?
Yes No (skip to Q15)
Q14. To what extent was your purchase(s) influenced by your desire to use the Helena trail system? 1. No influence 2. A little influence 3.moderate influence 4.High influence
Q15: Will you use the Helena trail system again? Yes No I don’t know
Q16. How often do you use the trails in Helena between May and October? This is my 1st time; < once a month; 1-3 times/wk; 3-4 times/wk; 5-7 times/wk Q17. How often do you use the trails in Helena between November and April? This is my 1st time; < once a month; 1-3 times/wk; 3-4 times/wk; 5-7 times/wk Q18. How did you get to the trailhead today? Walked, biked, shuttle, personal vehicle, ride from someone else Q19. What is your planned trailhead exit? Mt. Helena larger trailhead with parking; Dump Gulch; Tubbs; Other Mt. Helena access trails; Beattie St. Trailhead; Old Shooting range trail head; Arrowroot drive trailhead; Other Mt. Ascension access trails; Mt. Helena Ridge trailhead; other ridge access trails Q20. What fitness tracking apps or devices do you routinely use? (Mark all that apply)
None; Strava; Map my fitness/Run/Ride; Garmin product (e.g. Garmin Connect); Fitbit; Runmeter; other (specify) ________;
Q21. What is your age? _____ Q22. What is your gender? Male Female Other Q23. What best describes your household income
___less than $20,000 ___$40,000-$59,999 ___$80,000-$99,999 ___$120,000-$149,999 ___$20,000-$39,999 ___$60,000-$79,999 ___$100,000-$119,999 ___$150,000 or more

Trail Usage and Value 2018
30
Q24. What is your highest level of education? ___< high school ___high school degree ___technical college ___some college ___college degree ___graduate degree Q25. Please provide any further comments.
Trail Usage and Value 2018
31
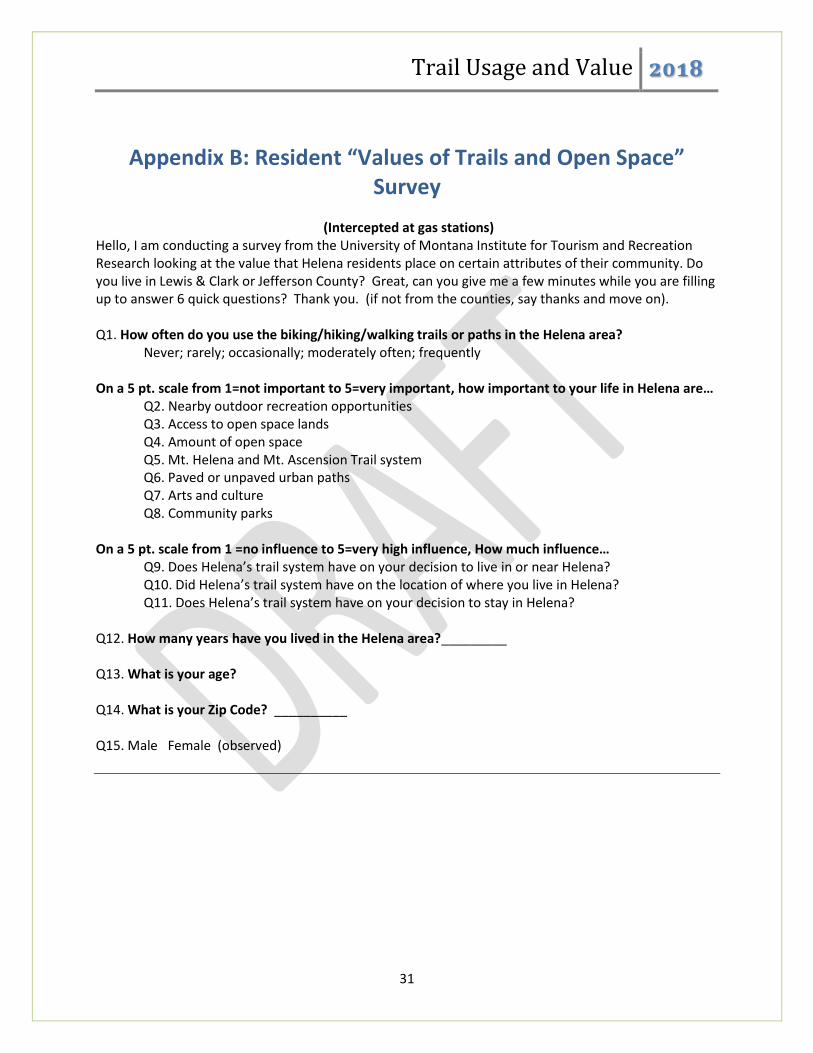
Appendix B: Resident “Values of Trails and Open Space” Survey
(Intercepted at gas stations)
Hello, I am conducting a survey from the University of Montana Institute for Tourism and Recreation Research looking at the value that Helena residents place on certain attributes of their community. Do you live in Lewis & Clark or Jefferson County? Great, can you give me a few minutes while you are filling up to answer 6 quick questions? Thank you. (if not from the counties, say thanks and move on). Q1. How often do you use the biking/hiking/walking trails or paths in the Helena area? Never; rarely; occasionally; moderately often; frequently On a 5 pt. scale from 1=not important to 5=very important, how important to your life in Helena are…
Q2. Nearby outdoor recreation opportunities Q3. Access to open space lands Q4. Amount of open space Q5. Mt. Helena and Mt. Ascension Trail system Q6. Paved or unpaved urban paths Q7. Arts and culture Q8. Community parks
On a 5 pt. scale from 1 =no influence to 5=very high influence, How much influence…
Q9. Does Helena’s trail system have on your decision to live in or near Helena? Q10. Did Helena’s trail system have on the location of where you live in Helena?
Q11. Does Helena’s trail system have on your decision to stay in Helena? Q12. How many years have you lived in the Helena area?_________ Q13. What is your age? Q14. What is your Zip Code? __________ Q15. Male Female (observed)
Trail Usage and Value 2018
32
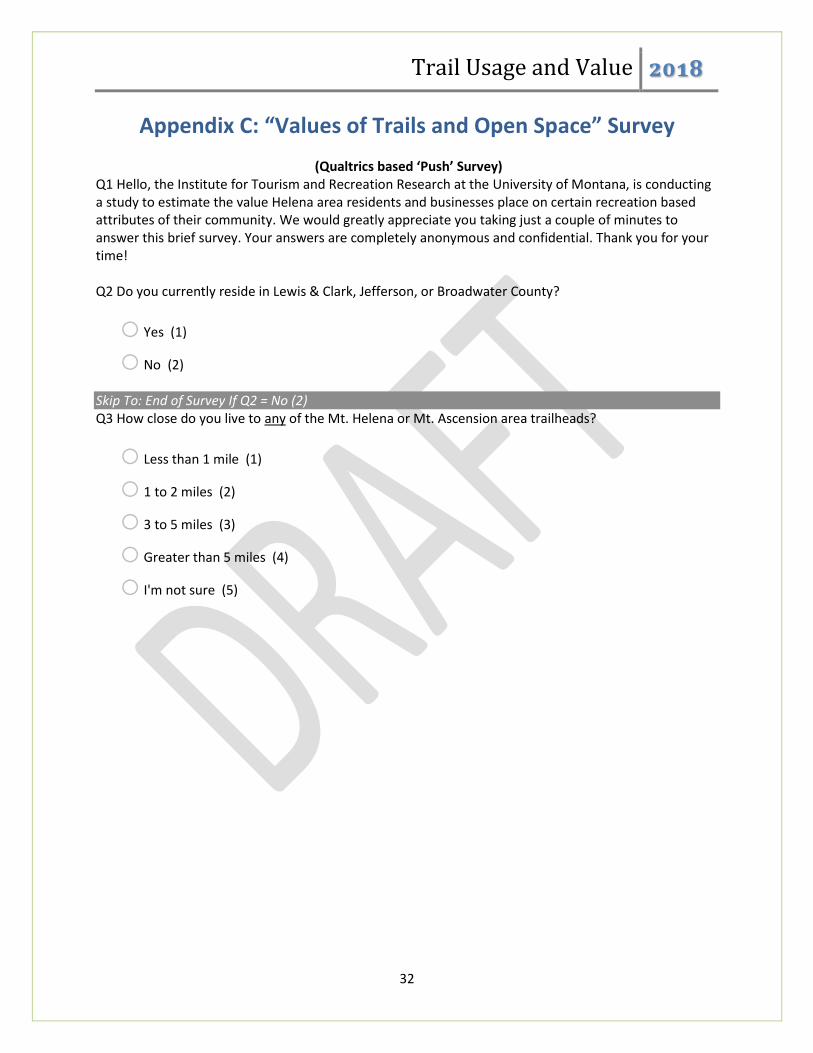
Appendix C: “Values of Trails and Open Space” Survey
(Qualtrics based ‘Push’ Survey) Q1 Hello, the Institute for Tourism and Recreation Research at the University of Montana, is conducting a study to estimate the value Helena area residents and businesses place on certain recreation based attributes of their community. We would greatly appreciate you taking just a couple of minutes to answer this brief survey. Your answers are completely anonymous and confidential. Thank you for your time! Q2 Do you currently reside in Lewis & Clark, Jefferson, or Broadwater County?
o Yes (1)
o No (2) Skip To: End of Survey If Q2 = No (2) Q3 How close do you live to any of the Mt. Helena or Mt. Ascension area trailheads?
o Less than 1 mile (1)
o 1 to 2 miles (2)
o 3 to 5 miles (3)
o Greater than 5 miles (4)
o I'm not sure (5)
Trail Usage and Value 2018
33
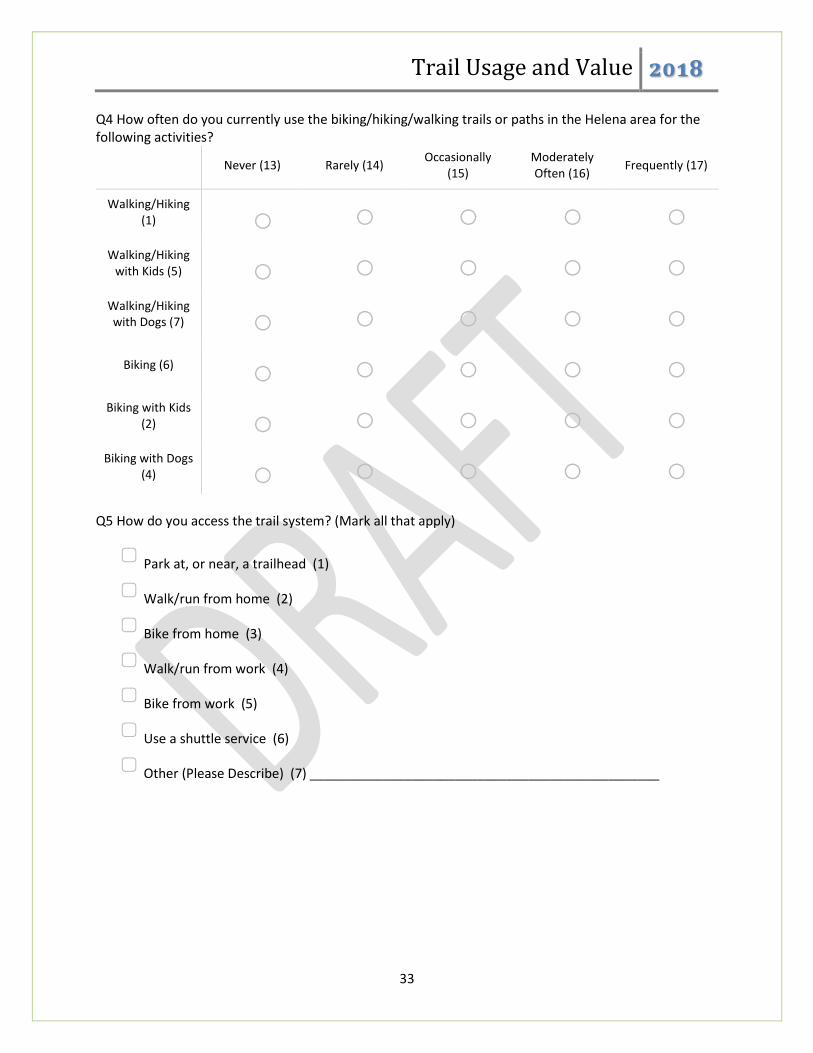
Q4 How often do you currently use the biking/hiking/walking trails or paths in the Helena area for the following activities?
Never (13) Rarely (14) Occasionally
(15) Moderately Often (16)
Frequently (17)
Walking/Hiking (1) o o o o o
Walking/Hiking with Kids (5) o o o o o
Walking/Hiking with Dogs (7) o o o o o
Biking (6) o o o o o Biking with Kids
(2) o o o o o Biking with Dogs
(4) o o o o o Q5 How do you access the trail system? (Mark all that apply)
▢ Park at, or near, a trailhead (1)
▢ Walk/run from home (2)
▢ Bike from home (3)
▢ Walk/run from work (4)
▢ Bike from work (5)
▢ Use a shuttle service (6)
▢ Other (Please Describe) (7) ________________________________________________
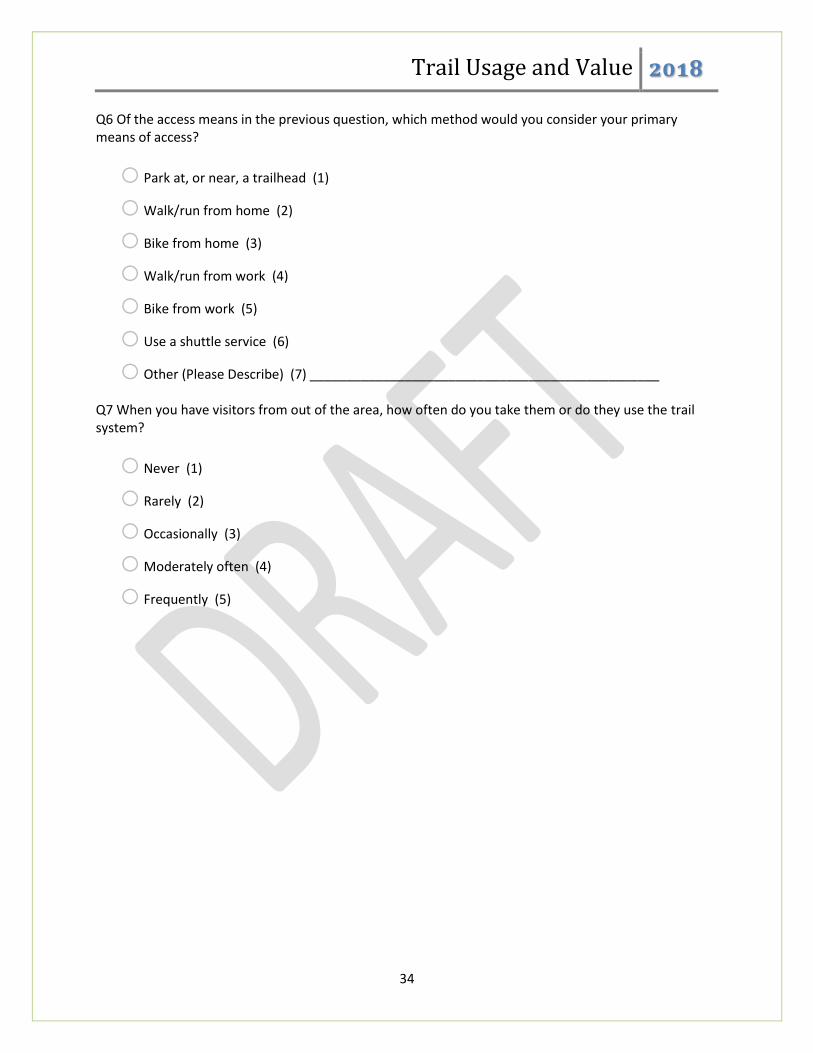
Trail Usage and Value 2018
34
Q6 Of the access means in the previous question, which method would you consider your primary means of access?
o Park at, or near, a trailhead (1)
o Walk/run from home (2)
o Bike from home (3)
o Walk/run from work (4)
o Bike from work (5)
o Use a shuttle service (6)
o Other (Please Describe) (7) ________________________________________________ Q7 When you have visitors from out of the area, how often do you take them or do they use the trail system?
o Never (1)
o Rarely (2)
o Occasionally (3)
o Moderately often (4)
o Frequently (5)
Trail Usage and Value 2018
35
Q8 On a 5 point scale from 1 being not important to 5 being very important, how important to your life in Helena are:
Not Important 1 (1)
2 (2) 3 (3) 4 (4)
Very Important 5 (5)
Nearby outdoor recreation
opportunities (1)
o o o o o
Access to open space lands (2) o o o o o
Amount of open space (3) o o o o o
Mt. Helena and Mt Ascension
Trail System (4) o o o o o Paved or
unpaved urban paths (5) o o o o o
Arts and culture (6) o o o o o
Community parks (7) o o o o o
Trail Usage and Value 2018
36
Q9 On a 5 point scale from 1 being no influence to 5 being very high influence, how much influence:
No Influence 1 (1)
2 (2) 3 (3) 4 (4)
Very High Influence
5 (5)
Does Helena's trail system
have on your decision to live
in or near Helena? (1)
o o o o o
Did Helena's trail system have on the location of
where you live in Helena? (2)
o o o o o
Does Helena's trail system
have on your decision to stay in Helena? (3)
o o o o o
Q10 How many years have you lived in the Helena area? Q11 Which statement best describes your current employment status?
o Employed full time (1)
o Employed part time (2)
o Unemployed looking for work (3)
o Unemployed not looking for work (4)
o Retired (5)
o Student (6)
o Disabled (7)
o Prefer not to answer (8)
Trail Usage and Value 2018
37
Q12 What type of business best describes your place of work?
o Retail sales (e.g. sporting goods, general merchandise) (1)
o Wholesale (2)
o Outfitting, guiding or other outdoor service provider (3)
o Restaurant, Bar or other food service (4)
o Grocery and non-fuel convenience store (5)
o Fuel and service station (6)
o Hotel, B&B, or other lodging services (7)
o Transportation services (e.g. auto sales, rental, repair, taxi) (8)
o Professional services (e.g. insurance, legal, medical) (9)
o Agriculture, Logging/Wood Products, Mining (10)
o Government (11)
o Education (Pre-School, K-12, College) (12)
o Nonprofit (13)
o Other (Please describe): (14) ________________________________________________ Q13 How much influence does Helena's trail system have on your place of work (i.e. how much business is attributed to people using the trail system)?
o None at all (1)
o A little (2)
o A moderate amount (3)
o A lot (4)
o A great deal (5)

Trail Usage and Value 2018
38
Q14 What best describes your annual household income in US dollars?
o Less than $50,000 (1)
o $50,000 to less than $75,000 (2)
o $75,000 to less than $100,000 (3)
o $100,000 to less than $150,000 (4)
o $150,000 to less than $200,000 (5)
o $200,000 or greater (6) Q15 What is your gender?
o Male (1)
o Female (2)
o Other (3)
o Prefer not to answer (4) Q16 What is your age? Q17 What is your zipcode?