Embed Size (px)
Citation preview

Trailer Washes and Other Cleaning
Strategies- Strengths and
Weaknesses
Perry A. Harms DVM, MS
SPG/ MurphyBrown LLC
Rose Hill, NC


Overview
• Strategy Formation
• Fleet Dedication Strategies
• Truck Baker
• Recycle Rinse
• Modeling Risk
• Process Validation
Sanitation Strategies
• Review the root reason for sanitation
– Aesthetics
• Public perception
• Competitive (Jones’ syndrome)
• Use pride as a motivator
• Likely concentrate on the outside of the trailer
– Function
• Safety
• Shut the gates

Sanitation Strategies
• Disease transmission/ risk control
– Across flows or farms
• Efficiency of equipment
• Contract haulers
• Emergency/ contingency
– Within flows
• Weaned pigs
• Feeder pigs
– External contact (terminal markets)

Background Sanitation Resources
• MurphyBrown East
– 600K sows NC, SC,
VA
– Centralized support
services in general
– Company and Contract
Transportation
– 10 truck washes
– ~1790 washes/wk
Truck Wash Utilization
0
100
200
300
400
500
600
700
TH WS LG RG CT GW CL RB 701 TB
Truck Wash
Wa
sh
es
/ W
ee
k

No Wash Strategy
• Site Run-out
• Back to back loads (wean to feeder to top)
• Cost savings- focus resources on high return
areas
• Creates a more complicated system to
monitor

Fleet Dedication
• Genetic
• Multiplication
– PRRS negative
– PRRS positive
• Weaned pig/ Sow
• Live haul
• Top Haul
• Disease status (TGE)

Trailer Baker (multiplication)
• Objective- decrease the risk of PRRS transmission
by transportation• Drying a key component in sanitizing a trailer
• Creates “down time” faster
• Effectively remove transportation as the scapegoat for PRRS
breaks
• Symbolic investment by management in a PRRS negative
system
• Combined with dedicated fleet, transfer stations,
and high sanitation expectations

Trailer Baker
• Risk Assessment Model
– Truck washing and disinfection were estimated to be 99.9% effective in creating a PRRS free trailer (multiplication in cleanup phase)
– Multiplication at 50K sows washed ~225 trailers a week
– That would result in 12 PRRS breaks a year attributable to transportation- Not considered a sustainable level

Multiplication Transportation
Campus

Trailer Baker
• 2 Bay AP system
• Cycle time 30-45 minutes
• Heats and hold at a minimum of 142 F for 10 minutes
• Flushes with fresh air

Trailer Baker
Rolling heat duct Heat sensors

Trailer Baker Validation
• Can’t validate entire sanitation process because the expected failure rate is so low
• Modeled surface and joints with plates
• Surface and joints negative for PRRS VI (MLV) except when joints were spiked with shavings and/or manure
• Not a substitute for good sanitation

Trailer Baker
Baker drain Can’t stop the rain

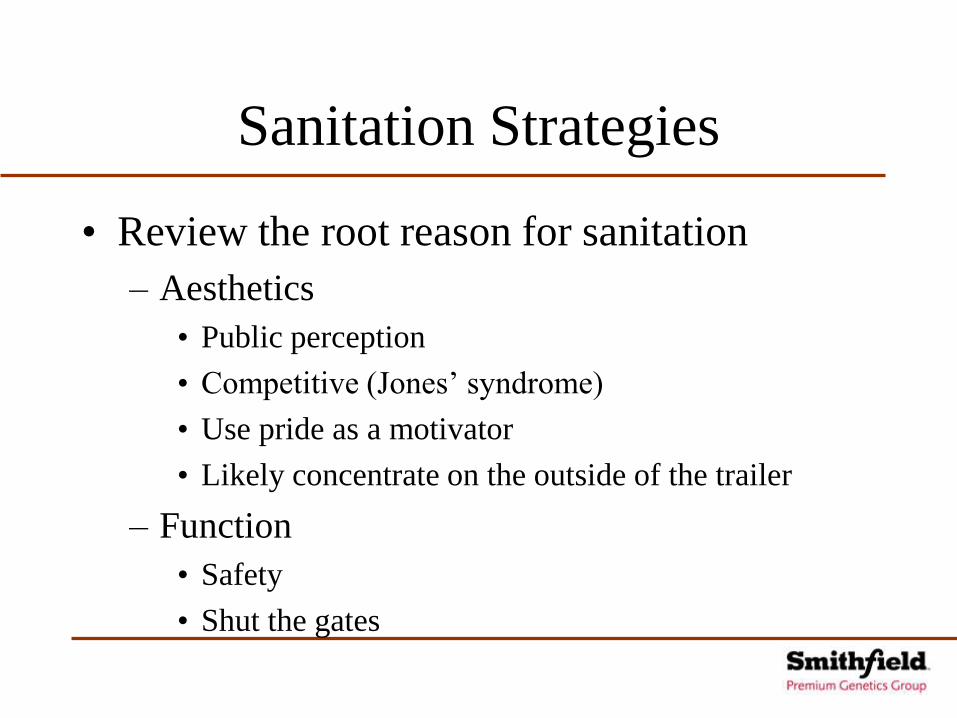
Recycle rinse???
• Why do we wash trucks?
• Is the truck cleaner with or without recycle
flush?
• What are we willing to compromise in
balance priorities?

Dirty Trailer
Recycle Flush

Flush-Tidal Wave

TGE Model
• Selected TGE model
– Very visible disease outcome
– Can often track movement of disease
– Dedicate fleet by TGE status

Model Variables
• Diagnostic lag
– Incubation, recognition, diagnosis, segregation
• Temperature
– Lagoon, wash bay
• Sanitation efficacy
– Wash, disinfection, dry, downtime, dedicated

Model Calculations
• Viral survivability
• Infected bay days
• Number of trucks exposed
• Decontamination success
• Number of infective trailers
• Relative risk vs. fresh water
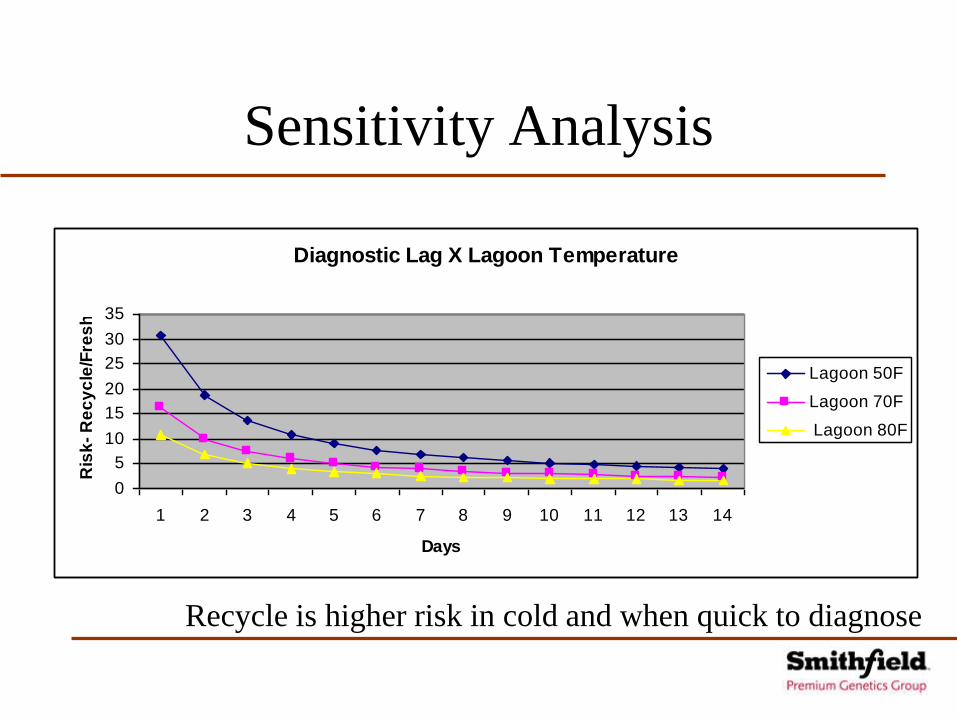
Sensitivity Analysis
Diagnostic Lag X Lagoon Temperature
0
5
10
15
20
25
30
35
1 2 3 4 5 6 7 8 9 10 11 12 13 14
Days
Ris
k-
Re
cy
cle
/Fre
sh
Lagoon 50F
Lagoon 70F
Lagoon 80F
Recycle is higher risk in cold and when quick to diagnose

Sensitivity Analysis
Cleaning Efficacy X Lagoon Temperature
0
5
10
15
20
25
30
35
40
20% 30% 40% 50% 60% 70% 80%
Efficacy
Ris
k-
Re
cy
cle
/Fre
sh
50F
70F
80F
Risk approaches zero as you approach perfect sanitation

Recycle Flush Conclusions
• Diagnostic lag (infection to fleet
segregation) is critical
• Temperature/Season drives TGE risk
• Recycle flush must improve the sanitation
efficacy 400% and be in Summer to reach
neutral risk

Which risks make sense?
“The most
consistent way
to get a trailer
clean is to start
with a clean
trailer.”

Key Lessons from TGE
• 3 nursery breaks from contaminated trailers
– 2 next load became infected, 1 twice removed
– Multiplies risk as finishers receive pigs
• One break due to truck/driver not trailer
– Hauled positive load (yet undiagnosed),
dropped trailer for clean trailer, infected the
next set of pigs
– Do an evaluation of CCP’s

Live Haul Wash Process
• Define Wash Process
• Get the Right
Equipment in Place
• Process Training
• Audit to the Process

Audit
• Audit the Process
– People
– Process
– Equipment
– Verification
• Audit Trucks and
Trailers

Audit Management

Audit Pre-Wash

Audit Equipment

Audit Wash Process

Audit Disinfection

Audit Results
• Internal QA
• Spot check trailers
• Develop quantitative
measures

“Soft” Issues
• Know what creates buy-in
– “Process development” vs. “Give me clear
direction”
– Measure and recognize effort and results
– Segment into the team levels for accountability
and feedback loop
– Involve all players into the same goal

Accident Response
Questions?


![Home [] · Testimonials Trailer Delivery Horse Trailer Blog Horse Trailer Buying Guide Horse Trailer Lingo Horse Trailer Maintenance Trailering Safety Search Inventory OR enter Trailer#:](https://img.pdfslide.net/doc/110x75/5f60b857e51db4230831ff65/home-testimonials-trailer-delivery-horse-trailer-blog-horse-trailer-buying-guide.jpg)