Embed Size (px)
Citation preview

Application of the ecosystem approach in integrated Environmental Assessments
Training Manual on Integrated Environmental Assessment and ReportingVolume 2
UNEP

UNEP Promotes environmentally sound practices globally and in its own activities. Our distribution policy aims to reduce UNEP’s carbon footprint
Published by the United Nations Environment Programme (UNEP).
UNEP Team:
Technical supervision, coordination:Graciela Metternicht, Regional Coordinator, Division of Early Warning and Assessment
Support and editing:Silvia Giada, Division of Early Warning and AssessmentJohanna Granados, Division of Early Warning and Assessment
Authors:Dolors Armenteras Pascual, PhD, associate professor, Department of Biology, Universidad Nacional de ColombiaMónica Morales Rivas, doctoral student, Department of Biology, Universidad Nacional de Colombia
Design: Rocio Milena Marmolejo CumbeCover photographs:Children: Dave Curtis.Mangroves and beach: Johanna Granados A.
Translated to English: Alan Hynds
This publication may be reproduced in whole or in part and in any form for educational or non-profit purposes without special permission from the copyright holder, provided acknowledgement of the source is made.
UNEP would appreciate receiving a copy of any publication that uses this publication as a source.
No use of this publication may be made for resale or for any other commercial purpose.
DISCLAIMERThe contents of this publication do not necessarily reflect the views or policies of UNEP, or contributory organizations concerning the legal status of any country, territory, city or area or its authorities, or concerning the delimitation of its frontiers or boundaries.
Copyright © 2010, UNEP
For further information:United Nations Environment Programme (UNEP)Regional Office for Latin America and the CaribbeanDivision of Early Warning and Assessment Avenida Morse, Edificio 103. Clayton, Ciudad del Saber - Corregimiento de AncónPanama City, PanamaP.O. Box 03590-0843Tel. (+507) 305-3100 Fax: (+507) 305-3105http://www.unep.org e-mail: [email protected]

Application of the Ecosystem Approach in Integrated Environmental Assessments (Global Environment Outlook)
GEO Training Manual i
Acknowledgements:This document was prepared by the United Nations Environment Programme (UNEP) with funding from the United Nations Development Account as part of the project titled South-South network of GEO collaborating centres for integrated environmental assessment and reporting to support policy formulation and informed decision-making processes at national, regional and global levels. The general objective of the project is to improve environmental decisions and prepare environmental policies at the regional and subregional levels.
UNEP-ROLAC Team:Technical supervision, coordination:Graciela Metternicht, Regional Coordinator, Division of Early Warning and Assessment
Support and editing:Silvia Giada, Division of Early Warning and AssessmentJohanna Granados, Division of Early Warning and Assessment
AuthorsDolors Armenteras Pascual, PhD, associate professor, Department of Biology, Universidad Nacional de ColombiaMónica Morales Rivas, doctoral student, Department of Biology, Universidad Nacional de Colombia
Professional and Scientific Review:In October 2009, a workshop of regional experts was held to review and improve the contents of the Guide for the Application of the Ecosystem Approach in Integrated Environmental Assessments. The following persons helped prepare the final document and provided comments on it:
Barbara Garea, Ministry of Science, Technology and the Environment, Cuba;Diego Martino, National Officer, UNEP, Uruguay;Carlos Welsh, National Center for Atmospheric Research (Boulder, Colorado, United States); Centro de Ciencias de la Tierra, Universidad Veracruzana (Veracruz, Mexico);Alejandra Volpedo, Centro de Estudios Transdisciplinarios del Agua, Facultad de Ciencias Veterinarias, Universidad Nacional de Buenos Aires, Argentina;Rodrigo Victor, Green Belt Biosphere Reserve, São Paulo, Brazil;Melanie Kolb, National Commission for the Knowledge and Use of Biodiversity (CONABIO), Mexico;Magally Castro, National System of Conservation Areas (SINAC), Socio-ecological Territory Management, Costa Rica;Eugenia Wo Ching, Institute on Environmental Policy, Costa Rica;Alma Ulloa, Institute for Environmental and Ecological Sciences (ICAE), Venezuela;Graciela Metternicht, Division of Early Warning and Assessment, UNEP-ROLAC, Panama;Eric Anderson, Water Center for the Humid Tropics of Latin America and the Caribbean, Panama;Silvia Giada, Division of Early Warning and Assessment, UNEP-ROLAC, Panama;Johanna Granados, Division of Early Warning and Assessment, UNEP-ROLAC, Panama.
Other expert revisers: Pedro Laterra, Instituto Nacional de Tecnología Agropecuaria (INTA), Balcarce, and Facultad de Ciencias Agrarias, Universidad Nacional de Mar del Plata (UNMdP), Argentina;Nelly Rodríguez Eraso, Department of Biology, Universidad Nacional de Colombia.

Training Manual on Integrated Environmental Assessment
GEO Training Manual
Module 10
ii
Table of Contents1. Introduction and objectives 12. Context 2 2.1 Background 2 2.2 Concepts and terms 3 2.2.1 The ecosystem concept and the ecosystem approach 3 2.2.2 Ecosystem services 53. Integration of the ecosystem approach into IEAs 8 3.1 Delimitation of the study area 10 3.2 Developing the ecosystem conceptual model 12 3.3 Delimitation of ecosystemic units of analysis 16 3.4 Data analysis tools 21 3.4.1 Non-spatial analysis 21 3.4.2 Spatial analysis 24 3.4.3 Multiscale analysis 26 3.4.4 Use of indicators 284. Considerations for the application of the ecosystem approach in future IEAs. 365. References 386. Annexes 427. Glossary of terms 51

Module 10Application of the Ecosystem Approach in Integrated Environmental Assessments (Global Environment Outlook)
GEO Training Manual iii
List of FiguresFigure 1. Simplified analytical structure for integrated environmental assessment and reporting
(adapted from Jäger and others, n.d., Training Module 1 of the IEA Training Manual.) . 3
Figure 2. Interconnections among the principles of the ecosystem approach that help answer key questions in an IEA assessment process ................................................... 8
Figure 3. Methodology for incorporating the ecosystem approach into IEAs ................................ 9
Figure 4. Example of a qualitative analysis of changes in the state of the environment and its relationship with humans .................................................................................. 22
Figure 5. Essential stages for conducting a spatial analysis in an IEA ........................................ 25
List of BoxesBox 1. Principles and operational guidelines of the ecosystem approach .................................... 4
Box 2. The “Amazonias” after the application of GEO Amazonia ................................................11
Box 3. Example and identification of environmental services in the sub-global Millennium Assessment of Colombia’s coffee-growing region (Armenteras and others, 2005) ......... 13
Box 4. Possible DPSIR conceptual framework for analysing ecosystem services for Amazonia. Adapted from the Millennium Ecosystem Assessment (2005) and UNEP (2007) ........... 14
Box 5. Example of the development of an ecosystem model and analysis of an ecosystem service ............................................................................................................................. 15
Box 6. Examples of structural ecosystemic units of analysis ...................................................... 17
Box 7. Use of remote sensors to map functional ecosystem units ............................................. 20
Box 8. Use of non-spatial data in an IEA. Example: number of species by biological group reported, per country and per Amazon region (source: GEO AMAZONIA 2009 .............. 22
Box 9. Ecosystem services of Amazonian forests: regulation of water flow and evidence of the effect of deforestation at multiple scales (Foley and others, 2007) ................................. 26
Box 10. Example of a multiscale spatial analysis to evaluate supply of and demand for an ecosystem service ........................................................................................................... 27
Box 11. Summary of the status of global indicators by thematic areas as set forth in the 2010 Biodiversity Indicators Partnership project (Biodiversity Indicators Partnership, 2010) ... 32
Training Manual on Integrated Environmental Assessment
GEO Training Manual
Module 10
iv
List of TablesTable 1. Definitions of types of goods and services related to forest and coastal/marine
ecosystems .................................................................................................................... 6
Table 2. General indicators for assessing the state of ecosystem services (Millennium Ecosystem Assessment, 2009) and a proposal for possible indicators for Amazonia ..................................................................................................................... 25
List of Acronyms and AbbreviationsACTO Amazon Cooperation Treaty Organization
BIP Biodiversity Indicators Partnership
CBD Convention on Biological Diversity
DPSIR Drivers-Pressure-State-Impact-Response
FAO Food and Agriculture Organization of the United Nations
GEO Global Environmental Outlook
GIS Geographic information systems
IEA Integrated environmental assessment
NVDI Normalized Difference Vegetation Index
ROLAC Regional Office for Latin America and the Caribbean

Module 10Application of the Ecosystem Approach in Integrated Environmental Assessments (Global Environment Outlook)
GEO Training Manual 1
1. Introduction and objectives Our modern-day society, and consequently the decision makers who represent us, increasingly needs reliable, up to date answers to questions as fundamental as some of those posed by the integrated environmental assessments (IEAs) of the United Nations Environment Programme (UNEP) since IEAs were introduced. For example: how is our environment changing? Two decades or more ago, IEAs began to provide information on this topic and to highlight some trends related to environmental changes. The new environmental challenges of this century —during which such issues as invasive species, climate change and others have emerged— are now demanding an increasingly large number of comprehensive answers as well as effective access to high-quality, objective, science-based information that will make it possible to firmly strike a balance among our societies’ diverse objectives.
On the basis of the progress outlined in Global Environmental Outlook: Environment for Development (GEO 4) (UNEP, 2007), one of the strategies adopted by the Division of Early Warning and Assessment, Regional Office for Latin America and the Caribbean (ROLAC), UNEP, is to incorporate an ecosystem approach into its IEAs. This approach and its by products (such as the ecosystem service approach) have proved highly useful for examining the state of the environment by including human well-being in the analyses. The ecosystem approach, along with its 12 principles, was first proposed by the Convention on Biological Diversity (CBD) in 2000 in Nairobi (decision V/6) as a strategy for the integrated management of land, water and natural resources along with the recognition that humans are an integral component of all of the world’s ecosystems. The fundamental unit of this approach is the ecosystem, understood as the combination of “living organisms and their non-living environment”. In addition to having an intrinsic value, ecosystems provide fundamental services to support life on Earth.
This thematic module, prepared as an addition to the Training Module of the Training Manual on Integrated Environmental Assessment and Reporting (formerly, the GEOResource Book), provides a set of basic guidelines for applying the ecosystem approach in future regional and subregional IEAs. The module will help users:
1. become familiar with the conceptual, methodological and technical aspects of the ecosystem approach and serve as a guide on how to incorporate those aspects into an IEA;
2. understand the importance of the ecosystem concept and of the services that ecosystems provide, in order to prepare this type of assessments
Throughout the sections of the module, concepts and methodologies are provided along with specific examples on using geographic information systems (GISs) and remote sensors, developing indicators, and carrying out spatial modelling and information analysis. In addition, some exercises are proposed to encourage discussion and support users with elements that will allow them to consider incorporating this approach into the stages of their IEAs that examine the state of the environment.
Training Manual on Integrated Environmental Assessment
GEO Training Manual
Module 10
2
2. Context2.1 BACkGROUND
Since 1995, UNEP has helped develop methodologies to design, plan and implement integrated environmental assessments at the global, regional, subregional, national and local levels. These processes are traditionally participatory, multidisciplinary and multisectoral and in many cases are also considered multidimensional and even multiscaled (Jäger and others, n.d., Training Module 1). Through IEAs, evaluations of the state of environment have been developed, on the basis of the Drivers-Pressure-State-Impact-Response (DPSIR) analytical framework, composed of these five main elements. This analytical framework establishes a relationship and directionality among the constituent components, and it is the reference point for assessing the direct factors (pressures) and the indirect ones (drivers) that influence the state of the environment, as well as the possible impacts of these actions, in order to sustainably manage the environment through timely responses. The use of this framework in IEA processes has helped provide answers to five fundamental questions (figure 1):
1. What is happening to the environment and why? (state, pressures, drivers)
2. What are the consequences for the environment and humanity? (impact)
3. What is being done, and how effective is it? (responses)
4. Where are we heading?
5. What actions could be taken for a more sustainable future?
The first three questions are directly related to the environmental assessment process and to the contents of this module.
4

Module 10Application of the Ecosystem Approach in Integrated Environmental Assessments (Global Environment Outlook)
GEO Training Manual 3
Figure 1. Simplified analytical structure for integrated environmental assessment and reporting (adapted from Jäger and others, n.d., Training Module 1 of the IEA Training Manual.)
2.2 CONCEPTS AND TERMS
2.2.1. ThE ECOSySTEM CONCEPT AND ThE ECOSySTEM APPROACh
Tansley devised one of the first ecosystem approaches. In 1935, he defined an ecosystem as a basic unit of nature, composed of the set of organisms and physical factors forming the environment. The ensuing discussion on the definition and application of the term (O’Neill, 2001) has been long and it can be expected to continue for many years to come. One of the most widely used definitions today is that of the CBD according to which an ecosystem is “a dynamic complex of plant, animal and micro-organism communities and their non-living environment, interacting as a functional unit”, an integral component of which are humans (Article 2, CBD). Associated with the concept of ecosystem are those of function (or functioning) and structure. Function is related to the exchange of materials and the flow of energy in an ecosystem; and structure is related to the organization and distribution of elements within it.
5
6
hUMAN SOCIETy DRIVERS
STEP 1
PRESSURES
STEP 1
RESPONSES(Interventions)
STEP 3
STEP 2
IMPACTS
STEP 1STATE
(Environmental change)ENVIRONMENTSTEP 1 What is happening to the environment and why?
STEP 2 What are the consequences for the environment and humanity?
STEP 3 What is being done, and how effective is it?

Training Manual on Integrated Environmental Assessment
GEO Training Manual
Module 10
4
Human beings and their actions are intrinsically associated with the environment and, ideally, the two should be viewed as a unit. However, in the past they were often considered as separate entities. This paradigm has been evolving as the notion of a single human-environmental unit has become more accepted and increasingly appreciated by those concerned. In 2000, therefore, the CBD took this idea to the global political level by suggesting that the “ecosystem approach” be employed as a strategy for integrated land, water and natural resources management, and that human beings be included as an integral component of all the world’s ecosystems. For this approach to be more applicable, a series of twelve complementary, interrelated principles and five operational guidelines were established (CBD, Decision V/6) (box 1).
Box 1. Principles and operational guidelines of the ecosystem approach (Convention on Biological Diversity, Decision V/6)
PRINCIPLES1. The objectives of management of land, water and living resources are a matter of societal
choice.
2. Management should be decentralized to the lowest appropriate level.
3. Ecosystem managers should consider the effects (actual or potential) of their activities on adjacent and other ecosystems.
4. Recognizing potential gains from management, there is usually a need to understand and manage the ecosystem in an economic context. Any such ecosystem-management programme should:
(a) Reduce those market distortions that adversely affect biological diversity;
(b) Align incentives to promote biodiversity conservation and sustainable use;
(c) Internalize costs and benefits in the given ecosystem to the extent feasible.
5. Conservation of ecosystem structure and functioning, in order to maintain ecosystem services, should be a priority target of the ecosystem approach.
6. Ecosystems must be managed within the limits of their functioning.
7. The ecosystem approach should be undertaken at the appropriate spatial and temporal scales.
8. In light of the varying temporal scales and lag-effects that characterize ecosystem processes, objectives for ecosystem management should be set for the long term.
9. Management must recognize that change is inevitable.
10. The ecosystem approach should seek the appropriate balance between, and integration of, conservation and use of biological diversity.
11. The ecosystem approach should consider all forms of relevant information, including scientific, indigenous and local knowledge, innovations and practices.
12. The ecosystem approach should involve all relevant sectors of society and scientific disciplines.

Module 10Application of the Ecosystem Approach in Integrated Environmental Assessments (Global Environment Outlook)
GEO Training Manual 5
2.2.2. ECOSySTEM SERVICES
The definition of ecosystem adopted by the CBD in 1993 paved the way for papers by Costanza and others (1997) to popularize a new concept —which was also the subject of debate: that of ecosystem, or ecosystemic, services. These services are understood as the benefits that persons derived from directly or indirectly using products of long-term natural, ecological and physical processes (Costanza and others, 1997). This concept has also been used to emphasize the link between the environment and human well-being. The GEO 4 report (UNEP, 2007) defined human well-being as the potential for individuals, communities and nations to make their own choices and maximize opportunities to achieve security and good health, meet material needs and maintain social relations.
People and their well-being depend on the planet’s environment. Well-being, as such, is measured by the ability of ecosystems to provide human beings with services ranging from the ability to meet basic needs such as food, energy, water and shelter, to equally important requirements such as safety and health —all of which are provided by ecosystems.
One application of the ecosystem service approach that until now has had the greatest global impact is, probably, the Millennium Ecosystem Assessment (2005), which is consistent with the mandates of the CBD and which classifies ecosystem services into the following groups:
• Provision: Products obtained from ecosystems, such as water, timber and non-timber forest products, or genetic resources
• Regulation: Benefits from the ecological processes of regulation, such as climate, food or disease control
• Cultural: Non-material benefits, such as cultural, recreational or spiritual values
• Support: Services needed to produce the other three categories, such as primary production or nutrient recycling.
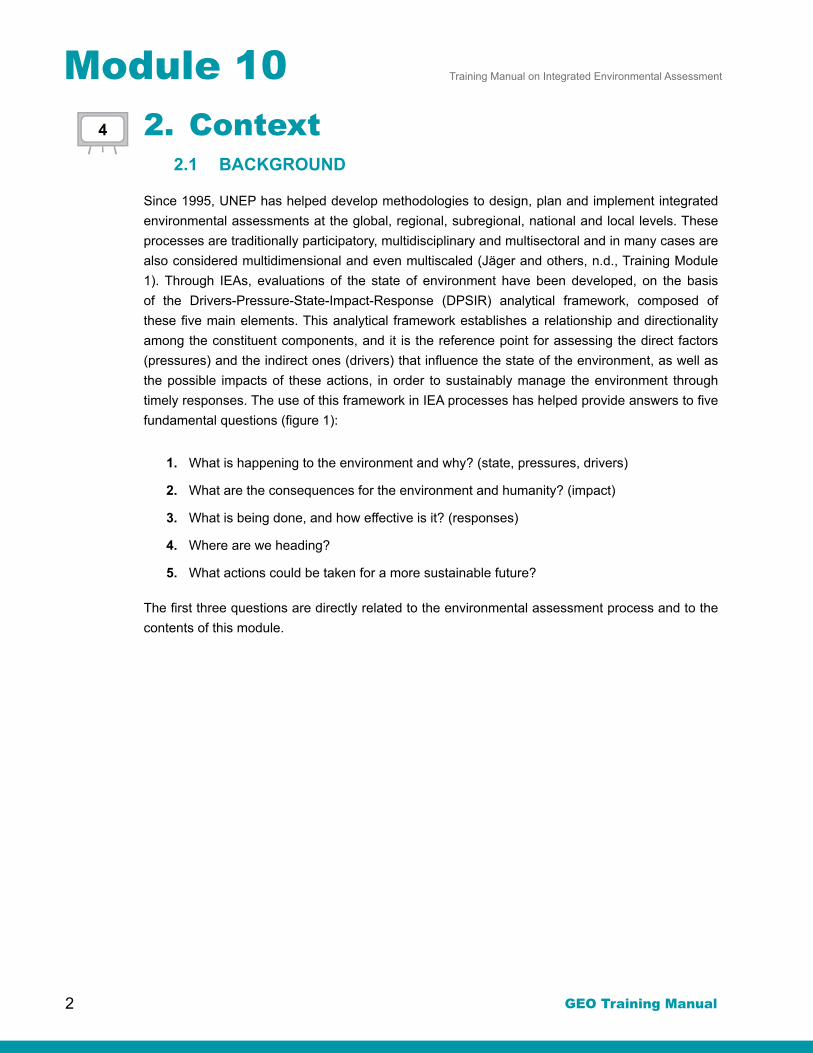
Table 1 gives a detailed description of these ecosystem services with some specific examples for forest, marine and coastal ecosystems from the most recent GEO report for Latin America and the Caribbean (PNUMA 2010, Chapter 3, Armenteras and Singh).
OPERATIONAL GUIDELINES1. Focus on the functional relationships and processes within ecosystems.
2. Enhance benefit-sharing.
3. Use adaptive management practices.
4. Carry out management actions at the scale appropriate for the issue being addressed, with decentralization to lowest level, as appropriate.
5. Ensure intersectoral cooperation.
7
9

Training Manual on Integrated Environmental Assessment
GEO Training Manual
Module 10
6
Type Good/Service Definition Examples
Provision
Food
Animals or plants for human consumption obtained from ecosystems
Food (fish or meat)
Salts, minerals and oil resources
Materials
Animal or plant by products extracted from ecosystems for multiple purposes, but not intended for human consumption
Construction materials (sand, rock, lime, wood, timber)
Biofuels, fuel wood
Non-timber forest products such as raw materials (colorants, dyes), crafts or utensils
Regulation
Gas and climatic
The balance and maintenance of the chemical composition of the atmosphere and oceans provided by forest or marine living organisms
Climate regulation
Local microclimate (shade, surface cooling, etc.)
Photosynthesis
Disturbance preventionThe dampening of environmental disturbances by biogenic structures
Regulation of floods and diseases
Biorecovery of waste
Removal of pollutants by way of storage, burying or recycling
Regulation and recycling of wastes and improvement of water quality through filtering and water recycling (through evapotranspiration, etc).
Cultural
Recreation
Stimulation of the human body and mind through interaction with living organisms in their natural environment
Vacation destinations, cruises and stay-over visitors
Ecotourism, bird watching, whale watching, hiking
Hunting
Cultural heritage and identity
Benefit of biodiversity that is of utmost significance or bears witness to multiple cultural identities from a community
Cultural heritage, sacred sites
Cognitive benefits
Cognitive development, including education and research, resulting from living organisms
Genetic resources
Medicinal plants
Pharmaceuticals
10 Table 1. Definitions of types of goods and services related to forest and coastal/marine ecosystems
Module 10Application of the Ecosystem Approach in Integrated Environmental Assessments (Global Environment Outlook)
GEO Training Manual 7
Type Good/Service Definition Examples
Support
Resilience and resistance
The extent to which ecosystems can absorb recurrent natural and human disruptions and continue to regenerate without slowly degrading or unexpectedly flipping to alternate states
Biologically mediated habitat
Habitat which is provided by living organisms
Pollinators
Nutrient cyclingStorage, cycling and maintenance of nutrients by living organisms
Carbon cycle, nitrogen cycle, etc.
Options and use Option, use valuesUnknown future use of ecosystems
Biodiversity genetic stock that has potential application for biotechnology and medicine
Source: From PNUMA 2010, Chapter 3. Adapted from Beaumont and others (2006).
In addition to the recognition of ecosystem services as essential for development and for environmental and social sustainability, the growing demand for the services provided by ecosystems (for multiple uses), as well as a concern with increasingly high valuations of those systems, means that today many assessments are taking into account characteristics of ecosystems such as their “health” (Costanza and Mageau, 1999; Ding and others, 2008). According to this view, a healthy ecosystem is understood to be resilient, that is, to have the ability to maintain its structure (organization), function and spatial configuration over time and thus to cope with external disruptions.
EXERCISE 1. Identification of ecosystem services
Use the information in the table to identify one or two ecosystems regarding which an integrated environmental assessment could potentially be carried out for the region, and specify at least two associated ecosystem services for the ecosystem or ecosystems in question..
Type Good/Service Examples
Provision
Regulation
Cultural
Support
Options and use

Training Manual on Integrated Environmental Assessment
GEO Training Manual
Module 10
8
3. Integration of the ecosystem approach into IEAs
Improvements are still being made in applying the ecosystem approach as an integrated environmental-management strategy based on the ecosystem as a unit for analysis and action. In part, this is due to the ecosystem’s underlying complexity, with its countless phenomena and relations that are not normally easily identifiable. Despite the difficulty of adapting it to an assessment format, the ecosystem approach is increasingly being used to make even more explicit the link between human beings and their environment. At least five principles of the ecosystem approach can be used to answer the main questions in an IEA process (figure 2), given that they are based on recognizing the interrelations between ecosystems and human beings and offer guidelines for designing responses to environmental changes. Also, the fact that the operational guidelines have been designed for the implementation of the ecosystem approach (box 1) —which requires stressing relations and processes within ecosystems from an intersectoral standpoint— further underscores the strength of the interrelations.
In addition to the incorporation of these principles, developing an IEA with an ecosystem approach requires conceiving of the ecosystem as a real entity —delimited in time and space— in which interventions may be carried out, so that the assessment (the purpose of this module) and the subsequent environmental decisions will serve to protect or conserve its long-term ecological integrity. Without a spatial and temporal delimitation, ecosystems cannot be classified or mapped, which makes it difficult to assess their state and much more difficult to carry out a policy or similar intervention.
Figure 2. Interconnections among the principles of the ecosystem approach that help answer key questions in an IEA assessment process
5 OF ThE 12 PRINCIPLES OF ThE ECOSySTEM APPROACh
kEy QUESTIONS IN ThE IEA PROCESS
3. Ecosystem managers should consider the effects (actual or potential) of their activities on adjacent and other ecosystems
1. What is happening to the environment?
2. Why is this happening?
3. What are the consequences of the state of the environment?
5. Conservation of ecosystem structure and functioning, in order to maintain ecosystem services, should be a priority target of the ecosystem approach
6. Ecosystems must be managed within the limits of their functioning
7. The ecosystem approach should be undertaken at the appropriate spatial and temporal scales
12
12
13

Module 10Application of the Ecosystem Approach in Integrated Environmental Assessments (Global Environment Outlook)
GEO Training Manual 9
The starting point for implementing the ecosystem approach in an IEA as proposed in this module is to use an ecosystem conceptual model, including of the ecosystem services to be assessed. However, devising the model requires first determining the IEA’s target audience (generally, decision makers), the feasibility of implementing the module with the participating institutions’ technical capacities, the needs for training and for strengthening those capacities as well as the planned time frame for preparing the IEA (Gómez and others, n.d., Training Module 2).
Figure 3. Methodology for incorporating the ecosystem approach into IEAs
Delimitation of study area
• Political-administrative• Ecosystemic
SIS
TE
MA
S D
E IN
FO
RM
AC
IÓN
ES
TR
UC
TU
RA
DO
Y A
LIM
EN
TAD
O
• Ecosystem• Ecosystem services
• Structural• Functional
• Indicators• Non-spatial analysis • Spatial analysis (models, multiscale)
• Interpretation• Responses
Development of ecosystem conceptual
model
Delimitation of ecosystemic units
of analysis
Analysis
Assessment
13
14

Training Manual on Integrated Environmental Assessment
GEO Training Manual
Module 10
10
From a methodological standpoint (figure 3), one of the most important premises to take into account in implementing this model in an IEA is that ecosystems have tangible expressions in the form of the structural or functional elements that, in some manner, must be identified and measured within a geographic space (study area) defined beforehand with political-administrative or ecological criteria.
Within this study area, the ecosystemic units of analysis will be identified, with either structural or functional criteria. The units will receive information (attributes, data and indicators) of a sufficient quantity and precision, and in a sufficiently timely manner, to carry out analyses and to provide answers to the three questions on which the IAE process is based and to interpret the answers. Importantly, a successful IEA process requires structuring, developing and implementing a (geographic and non-geographic) information system that will facilitate the collection, systematization, standardization, accessing, handling and publishing of information. This information system, the basic principles of which are set out in Training Module 4 of this Manual (Van Woerden and others, n.d.), must cut across all IEA activities.
3.1. DELIMITATION OF ThE STUDy AREA
In general, sub-global IEAs are normally conducted in territories delimited by political-administrative boundaries, such as Latin America and the Caribbean, subregional organizations (Caribbean Community, Andean Community of Nations, Central American Commission for Environment and Development, Southern Common Market), countries or specific cities. In these cases, the definition of geographic scope proves useful, given the relative stability and acceptance of the boundaries. In fact, some thematic IEAs, such as the GEO Brazil series and GEO Health, are normally governed by boundaries of this type.
However, some IEAs are conducted regarding a specific ecosystem or ecosystem service, such as food or water provision or carbon capturing. Such IAEs may rely on biogeographic criteria (as in the case of the Global Deserts Outlook or the ecological scope used in GEO Amazonia), hydrographic criteria (Amazon basin, as in the case of GEO Amazonia, see box 2) or functional criteria (classifying areas in terms of gross primary production). Although geographic discrepancies may make differentiated criteria appear unsuitable for an IEA, using such criteria may be appropriate and beneficial for some processes that can be understood only within specific boundaries. The decision to adopt one or more areas of study in an IEA should, however, be made by consensus among the participating institutions, and consideration should always be given to need to find the most suitable approach for the process.
15
Module 10Application of the Ecosystem Approach in Integrated Environmental Assessments (Global Environment Outlook)
GEO Training Manual 11
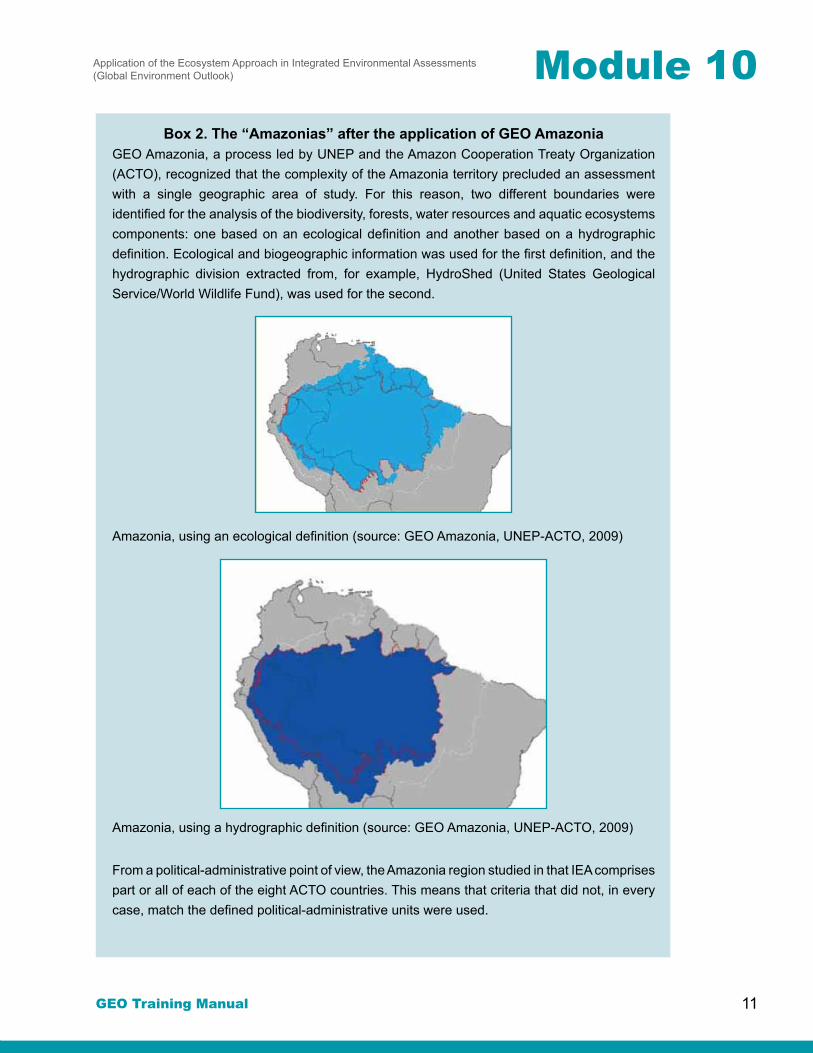
Box 2. The “Amazonias” after the application of GEO AmazoniaGEO Amazonia, a process led by UNEP and the Amazon Cooperation Treaty Organization (ACTO), recognized that the complexity of the Amazonia territory precluded an assessment with a single geographic area of study. For this reason, two different boundaries were identified for the analysis of the biodiversity, forests, water resources and aquatic ecosystems components: one based on an ecological definition and another based on a hydrographic definition. Ecological and biogeographic information was used for the first definition, and the hydrographic division extracted from, for example, HydroShed (United States Geological Service/World Wildlife Fund), was used for the second.
Amazonia, using an ecological definition (source: GEO Amazonia, UNEP-ACTO, 2009)
Amazonia, using a hydrographic definition (source: GEO Amazonia, UNEP-ACTO, 2009)
From a political-administrative point of view, the Amazonia region studied in that IEA comprises part or all of each of the eight ACTO countries. This means that criteria that did not, in every case, match the defined political-administrative units were used.
Training Manual on Integrated Environmental Assessment
GEO Training Manual
Module 10
12
Box 2 (continued)
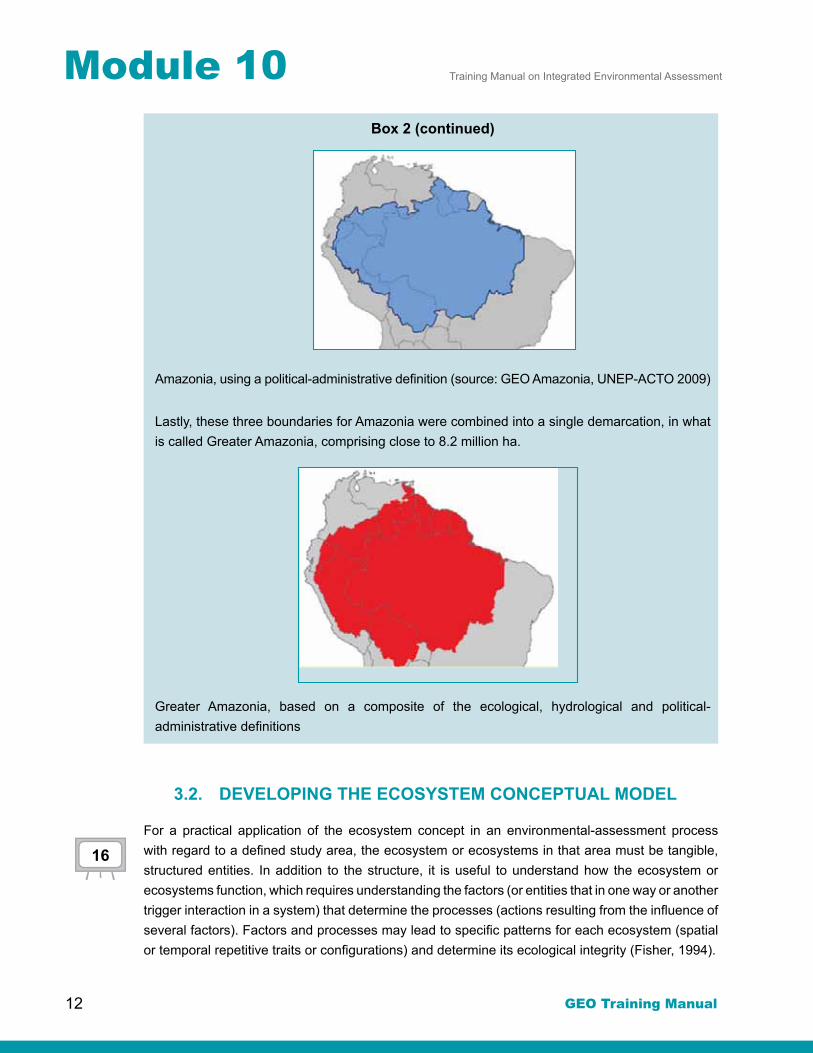
Amazonia, using a political-administrative definition (source: GEO Amazonia, UNEP-ACTO 2009)
Lastly, these three boundaries for Amazonia were combined into a single demarcation, in what is called Greater Amazonia, comprising close to 8.2 million ha.
Greater Amazonia, based on a composite of the ecological, hydrological and political-administrative definitions
3.2. DEVELOPING ThE ECOSySTEM CONCEPTUAL MODEL
For a practical application of the ecosystem concept in an environmental-assessment process with regard to a defined study area, the ecosystem or ecosystems in that area must be tangible, structured entities. In addition to the structure, it is useful to understand how the ecosystem or ecosystems function, which requires understanding the factors (or entities that in one way or another trigger interaction in a system) that determine the processes (actions resulting from the influence of several factors). Factors and processes may lead to specific patterns for each ecosystem (spatial or temporal repetitive traits or configurations) and determine its ecological integrity (Fisher, 1994).
16
Module 10Application of the Ecosystem Approach in Integrated Environmental Assessments (Global Environment Outlook)
GEO Training Manual 13
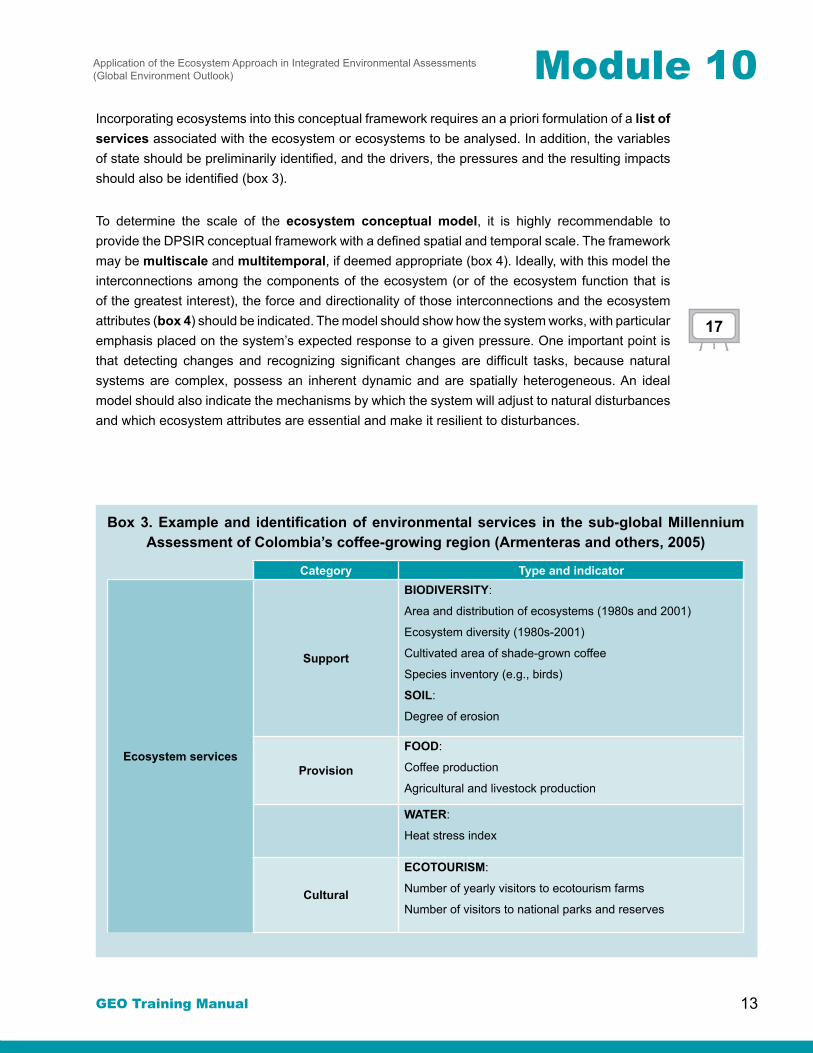
Incorporating ecosystems into this conceptual framework requires an a priori formulation of a list of services associated with the ecosystem or ecosystems to be analysed. In addition, the variables of state should be preliminarily identified, and the drivers, the pressures and the resulting impacts should also be identified (box 3).
To determine the scale of the ecosystem conceptual model, it is highly recommendable to provide the DPSIR conceptual framework with a defined spatial and temporal scale. The framework may be multiscale and multitemporal, if deemed appropriate (box 4). Ideally, with this model the interconnections among the components of the ecosystem (or of the ecosystem function that is of the greatest interest), the force and directionality of those interconnections and the ecosystem attributes (box 4) should be indicated. The model should show how the system works, with particular emphasis placed on the system’s expected response to a given pressure. One important point is that detecting changes and recognizing significant changes are difficult tasks, because natural systems are complex, possess an inherent dynamic and are spatially heterogeneous. An ideal model should also indicate the mechanisms by which the system will adjust to natural disturbances and which ecosystem attributes are essential and make it resilient to disturbances.
Box 3. Example and identification of environmental services in the sub-global Millennium Assessment of Colombia’s coffee-growing region (Armenteras and others, 2005)
Category Type and indicator
Ecosystem services
Support
BIODIVERSITy:
Area and distribution of ecosystems (1980s and 2001)
Ecosystem diversity (1980s-2001)
Cultivated area of shade-grown coffee
Species inventory (e.g., birds)
SOIL:
Degree of erosion
Provision
FOOD:
Coffee production
Agricultural and livestock production
WATER:
Heat stress index
Cultural
ECOTOURISM:
Number of yearly visitors to ecotourism farms
Number of visitors to national parks and reserves
17

Training Manual on Integrated Environmental Assessment
GEO Training Manual
Module 10
14
Category Type and indicator
Direct drivers (Pressures)
Land-use change
Phytosanitary factors
Deforestation (1980s-2001)Cover change (1980s-2001)Area affected by coffee rust (Hemileia vastatrix,fungus)Area affected by coffee berry borer (Hyphotenemus hampei, pest)
Indirect drivers
(Driving forces)
Demographic factors Number of inhabitantsRural and urban population densityPopulation growth
Economic factors
Percentage of area under coffee cultivationNumber of coffee-producing unitsAnnual coffee productionEconomic activity indexGross domestic product (national and by sector)
Social and political factors
Number of environmental associations and institutions
human well-being
(Impact)
Quality of life of the population
Economic security
Quality of life indexEducation, illiteracy ratePer capita economic activityIncome distribution and land distribution (Gini coefficients)Unmet basic needsPopulation below the poverty line
Box 4. Possible DPSIR conceptual framework for analysing ecosystem services for Amazonia. Adapted from the Millennium Ecosystem Assessment (2005) and UNEP (2007)
18 WatershedBiomes
Sub-regions by countryhUMAN SOCIETyDrivers
Demographic factors Number of inhabitants, Population density (hab/km2)Annual growth rate, Population growthEconomic factors GDP (% and rate of growth)Livestock-raising activitiesAgriculture and forestryOil productionSocial and political factorsNumber of environmental associations and institutions
Responses
ImpactQuality of lifeEducation, illiteracy rateAccess to health (water and sewerage coverage)DiseasesEconomic activity per capitaIncome distribution and land distributionPoverty indexPopulation under the poverty line
PressuresLand-use changeDeforestation and fragmentationInfrastructure development (roads and hydroelectric plants)Climate changeForest firesDroughtSolid waste and leachatesWastewaterOverfishing
State (Ecosystem services)Support:BIODIVERSITY, species diversity, loss of habit, conservation areas, rates of extinction, endangered speciesSOIL, ErosionProvision:FOOD, Agriculture, livestock and forest production and non-timber forest products, FishWATER, flowCultural, ethnic groupsRegulation, Carbon capture, climate regulation, illnesses
OutlooksRetrospective
TIME
ENVIRONMENT

Module 10Application of the Ecosystem Approach in Integrated Environmental Assessments (Global Environment Outlook)
GEO Training Manual 15
In principle, the model should aim to illustrate the acceptable thresholds or, at a minimum, the normal patterns of variation of the system components. The purpose is this is to identify fundamental ecological processes and relevant ecosystem services and to find indicators that can be predicted on the basis of the conditions of natural variation. The values observed for these indicators should be analysed in the context of the natural variation in the ecosystem model that has been established, in order to determine if their values are in fact associated with a significant change in the state of the ecosystem, rather than a natural variation in the state of a living system (Noon, 2003).
Box 5 Example of the development of an ecosystem model and analysis of an ecosystem service under the DPSIR conceptual framework: regulation of disease,
case of dengue fever.
EXERCISE 2. Ecosystem services in the DPSIR (Drivers-Pressure-State-Impact-Response) conceptual framework
AUsing the DPSIR conceptual framework shown in box 4, for one of the ecosystems identified (along with its respective services) indicate the possible associated drivers, pressures, impacts and responses.
35
19
hUMAN SOCIETy
Responses1. Implementing sustainable-development policies that prevent
population growth from adversely affecting ecosystems2. Mitigating and reducing production activities that bring about a
change in land-use (expansion of their agricultural frontier, mining, infrastructure, etc.)
3. Improving access to preventive and curative health care, especially for populations affected by war, hunger or environmental degradation
4. Increasing the availability of essential medication at affordable prices for inhabitants of developing countries
5. Assessing and tracking the health impact of development projects, policies and programs
Drivers- Demand for resources (water,
electricity, minerals, wood, food, etc.)
- Colonization
Pressures- Land-use change- Deforestation and
fragmentation- Infrastructure
developments- Climate change- Wastewater
“hEALThy” ECOSySTEM (with ecological integrity)- Regulates the life cycles of the
virus (e.g., dengue fever) and vectors (e.g., haematophagous arthropods)
- Possesses functional populations of predators of the vectors
- Its spatial disposition prevents the dispersion of the virus
“DISRUPTED” ECOSYSTEM”(without ecological integrity)- The prey-predator equilibrium is
lost- The geographic boundaries on
the distribution of the virus and the disease expand
- The population at risk of contagion increases
Impact- Altering the risk
of infectious disease for local populations
Possible response(s) to each of the other stages of the conceptual framework
3, 4, 5
2
2
#
1,2
ENVIRONMENT

Training Manual on Integrated Environmental Assessment
GEO Training Manual
Module 10
16
Ecosystem:
Service identified:Driver Pressure State Impact Response
3.3 DELIMITATION OF ECOSySTEMIC UNITS OF ANALySIS
Once an IEA’s geographic scope has been delimited, the next step should be to identify its distinguishable units. Here the ecosystem approach is highly useful. Given that ecosystems are structural and functional entities composed of physical and biotic elements and that humans are a component of these systems, delimiting ecosystems within an IEA study area might be the best strategy both for collecting and analysing information as well as for identifying actions in response to specific environmental situations.
Depending on the ecosystemic conceptual model designed, the size of the study area and its environmental complexity, the delimitation might have to include criteria that depict the territory’s ecosystemic diversity even though they do not conform to the geographic scale of analysis.
Ecosystem units based on structural criteria (climate, soils, physiognomy of the vegetation, physiography, etc.) have traditionally been the most widely used subdivisions of the IEA study area, given that the most important advances in information collection and in knowledge at the ecosystem level have occurred in these units (box 6).
The structural classification systems used in regions such as Latin America and the Caribbean focus on general environmental traits, such as biomes (Walter, 1980), on ecoregions (Dinerstein, 1995), on ecological systems (Josse and others, 2003) or on holdridge Life Zones. These models, based on ecosystems’ structural conditions, identify and delimit units according to climate criteria (latitude and precipitation regime), geologic origin and dominant soil, among others, which indicate whether the ecosystem possesses a vegetation and associated fauna of its own.
As the size of the study area diminishes, it is desirable, and often possible, to increase the scale (that is, to work in greater detail), which allows additional criteria, such as land use and cover, soil biogeography, hydrography, geomorphology, among others, to be included. In some cases, these criteria have been incorporated at a subcontinental and national scale, including in Central America (Vreugdenhil and others, 2002), Ecuador (Sierra, 1999) and Colombia (Ideam and others, 2007).
20
Module 10Application of the Ecosystem Approach in Integrated Environmental Assessments (Global Environment Outlook)
GEO Training Manual 17
Regardless of the term —ecoregions, ecological systems, ecosystems or any other— used to delimit units of analysis according to a structural criterion in a specific area and as part of an IEA, assessments and analyses will be carried out and actions in favour of ecosystem conservation and sustainable use will be planned with regard to these units.
Box 6. Examples of structural ecosystemic units of analysis
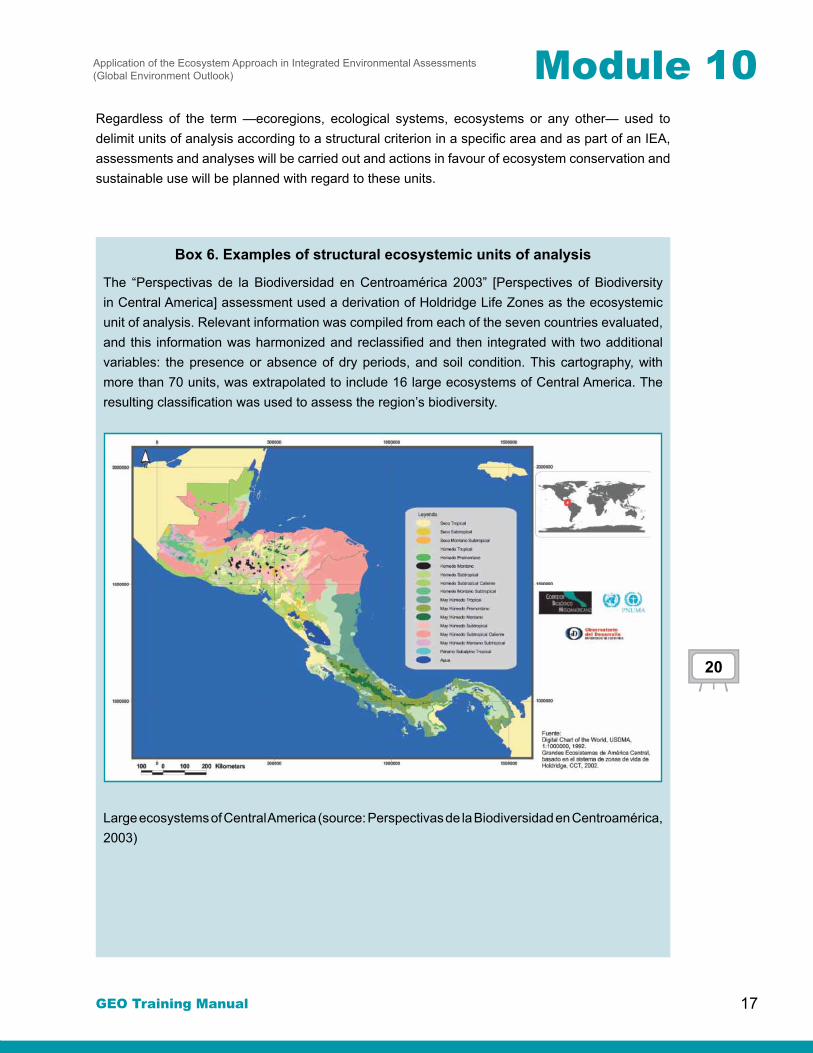
The “Perspectivas de la Biodiversidad en Centroamérica 2003” [Perspectives of Biodiversity in Central America] assessment used a derivation of Holdridge Life Zones as the ecosystemic unit of analysis. Relevant information was compiled from each of the seven countries evaluated, and this information was harmonized and reclassified and then integrated with two additional variables: the presence or absence of dry periods, and soil condition. This cartography, with more than 70 units, was extrapolated to include 16 large ecosystems of Central America. The resulting classification was used to assess the region’s biodiversity.
Large ecosystems of Central America (source: Perspectivas de la Biodiversidad en Centroamérica, 2003)
20

Training Manual on Integrated Environmental Assessment
GEO Training Manual
Module 10
18
Box 6 (continued) Examples of structural ecosystemic units of analysis
GEO Brazil: Water Resources uses another structural approach that has been implemented as a unit of analysis in IEAs and that includes some of the ecosystemic components. The classification in this assessment is by hydrographic region, understood as “a Brazilian territorial space composed of a basin or group of continuous hydrographic basins or sub-basins with homogenous natural, social or economic characteristics, in order to direct, plan or administrate water resources”. The 12 units identified were used to produce a brief analysis of water availability and use as well as water-related conflicts, mainly through a comparative evaluation of these topics at the national level.
Hydrographic regions in and political-administrative division of Brazil (source: GEO Brazil: Water Resources)
Such assessments have frequently delimited according to structural ecosystemic units of analysis according to structural criteria. However, they also should incorporate functional criteria in order to identify certain sources of variation not detected, for example, according to soil cover type. Techniques developed in the last decade, derived from the use of, among other methods, remote sensors, have made it possible to directly measure certain functional attributes such
Amazon HREast Atlantic HRWestern Northeast Atlantic HREastern Northeast Atlantic HRSoutheast Atlantic HRSouth Atlantic HR
Parnaiba HRSão Francisco HR Tocantins Araguaia HRUruguay HRParaguay HRParaná HR

Module 10Application of the Ecosystem Approach in Integrated Environmental Assessments (Global Environment Outlook)
GEO Training Manual 19
as evapotranspiration and primary productivity, which are directly associated with ecosystem services, including the regulation of the water cycle and carbon cycle. Given the growing amount of information available from remote sensors and the advances in processing and analysing that information, ecosystem functional types can now be mapped so as to incorporate some of these functional criteria into structural categories already developed for a specific area. The purpose of this is to have suitable units of analysis for the phenomenon being studied, such as an ecosystem service (Paruelo, 2001; Fernández and Piñero, 2008; Paruelo, 2008). Box 7 provides two examples of information obtained from remote sensors (in this case, vegetation and albedo indices) to the limits functional units.
To map the ecosystemic units of analysis, spatial or spatializable information must be obtained. The required information is both basic (political-administrative division, hydrography, roads, etc.) and thematic (digital terrain elevation models, climate, soil cover and use) and even includes data from remote sensors (satellite images, aerial photography). The geographic scope and time horizon of the IEA will determine if new cartographic products are necessary or if existing maps can be used, once they have been adapted or modified (Training Module 4 of this manual; Van Woerden and others, n.d.
EXERCISE 3. Units of Analysis
A. Select a unit of analysis or identify the unit of analysis that you consider the most appropriate for your region or thematic area, bearing in mind the ecosystem approach. Do you find it useful to incorporate the ecosystem approach in identifying the units? What are the disadvantages of doing so?
________________________________________________________________________________________________________________________________________________________________________________________________________________________________________________________________
B. Indicate which of the following list of units of analysis you consider should be implemented:
• Watersheds
• Biomes
• Ecoregions
• Land units according to land capability classes; agricultural activities
• Delimitation of political/administrative areas
• Area of cultural/historical homogeneity
• Priority conservation sites
________________________________________________________________________________________________________________________________________________________________________________________________

Training Manual on Integrated Environmental Assessment
GEO Training Manual
Module 10
20
C. Indicate if the unit of analysis selected in (B) is functional, structural or both.
________________________________________________________________________________________________________________________________________________________________________________________________
D. Identify possible sources of data or institutions that validate the selection of the unit of analysis.
________________________________________________________________________________________________________________________________________________________________________________________________
Box 7. Use of remote sensors to map functional ecosystem units
Paruelo and others (2001) use the Normalized Difference Vegetation Index (NVDI) to identify types of functional ecosystems in the temperate area of South America. The index, compiled from remote-sensor information, can be used to estimate the fraction of photosynthetically active radiation intercepted by vegetation. Consequently, it provides insight not only on vegetation greenness but also on its function, understood as primary productivity.
Using NOAA-AVHRR satellite image time series with a spatial resolution of 1.1 km, the authors obtained three normalized vegetation index measurements: the annual integral measurement, the relative annual range and the date of the maximum NVDI. With these measurements they established homogenous regions, which were subsequently incorporated into a structural map of the phytogeographic units of temperate South America, making it possible to obtain 19 different types of functional ecosystems.
Types of functional ecosystems for temperate South America

Module 10Application of the Ecosystem Approach in Integrated Environmental Assessments (Global Environment Outlook)
GEO Training Manual 21
The authors introduced, into the definition of functional types, a measurement of the ecosystems’ primary productivity that they obtained in a relatively simple, standardized manner. Hence, they presented a fairly expeditious way of generating ecosystemic units of analysis on the basis of structural and functional criteria for conducting an environmental assessment.
Note: NOAA-AVHRR: meteorological satellite of the National Oceanic and Atmospheric Administration, with a sensor applicable to land areas, called AVHRR, or Advanced Very High Resolution Radiometer.
NDVI: The vegetation index normally ranges from -1 to +1; the higher the result, the greater the vegetation vigour in the area in question. The critical threshold for forest cover is normally assigned a NDVI value of about 0.1; and for dense vegetation, a value of between 0.5 and 0.7 is assigned (Chuvieco, 2002)
Source: Paruelo and others, 2001
3.4 DATA ANALySIS TOOLS
3.4.1 NON-SPATIAL ANALySIS
In general, there is no single right way to analyse data or to ascertain the value for an indicator or an index, and there are multiple possible quantitative and qualitative approaches for analysing basic data as well as indicators or indices identified as having key importance for an ecosystem IEA. Qualitative information is recommended to complement numerical information successfully incorporated into an IEA, and it is especially useful for including local knowledge and perspectives that otherwise would be excluded from such assessments. In addition, non-quantifiable knowledge (or knowledge not quantified owing to technical difficulty or temporariness) can be used to include descriptive analyses of the state (based on or sustained by qualitative measurements or by observations or local viewpoints) as well as of the trends of different ecosystem services, in order to provide the first early warning elements of an IEA.
As an example of this approach and of the value added for an IEA, figure 4 illustrates how the GEO 4 report formulated a qualitative approach to shed light on the relationship between changes in the state of the aquatic environment and their impact on the environment and on humans (UNEP, 2007). The arrows point up or down, depending on the impact of the environmental change on components of human well being (an increase or decrease in resource quality or quantity), and the colors are associated with specific targets of the Millennium Development Goals. Box 8, by contrast, exemplifies some cases of numerical data that have been used for analytical purposes in IEA processes.

Training Manual on Integrated Environmental Assessment
GEO Training Manual
Module 10
22
Figure 4. Example of a qualitative analysis of changes in the state of the environment and its relationship with humans
Box 8. Use of non-spatial data in an IEA. Example: number of species by biological group reported, per country and per Amazon region (source: GEO AMAZONIA 2009
Many IEA processes can also compile quantitative data, such as national statistics, even data that do not come from a specified spatial location —that is, what are known as non-spatial data. Nearly always, these data are used when no source of spatial information is available, and they continue to contribute important information for assessing an ecosystem support service, for example, biodiversity in number of species per reported group for the countries of Amazonia. This information is not spatial, and in many cases it is not even possible to determine the number of species in the national total that would correspond to the portion of each country in Amazonia. Nonetheless, this type of data illustrates in a very simple manner each country’s biodiversity potentialities.
Aquatic ecosystems
PressuresSELECTED STATE
ChANGES
hUMAN WELL-BEING IMPACTS
human health Food security Physical
security and safety
Socioeconomic
Inland ecosystems
Rivers, streams and floodplains
• Flow regulation by damming and withdrawal Water loss by evaporation Eutrophication • Pollution
× Water residence time × Ecosystem fragmentation
× Disruption of dynamic between river and floodplain
× Disruption to fish migration
× Blue-green algal blooms
Ø Freshwater quantity
Ø Water purification and quality
Ø Inland and coastal fish stocks
× Flood protection
Ø Tourism 3
Ø Small-scale fisheries 1
× Poverty 1
Ø Livelihoods
× Incidences of some water-borne diseases
Lakes and reservoirs
• Infilling and drainage • Eutrophication • Pollution • Overfishing • Invasive species • Global warming-induced changes in physical and ecological properties
Ø Habitat × Algal blooms × Anaerobic conditions × Alien fish species × Water hyacinth
Ø Water purification and quality
Ø Inland fish stocks
Ø Small-scale fisheries 2
× Displacement of human communities 1
Ø Tourism 2
Ø Livelihoods1
Seasonal lakes, marshes and swamps, fens and mires
• Conversion through infilling and drainage • Change in flow regimes • Change in fire regimes • Overgrazing • Eutrophication • Invasive species
Ø Habitat and species Ø Flow and water quality × Algal blooms × Anaerobic conditions × Threat to indigenous species
Ø Water replenishment 1
Ø Water purification and quality
Ø Flash flood frequency and magnitude 1
Ø Mitigation of floodwaters 1
Ø Mitigation of droughts
Ø Flood, drought and flow-related buffering effects 1
Ø Livelihoods 1
21

Module 10Application of the Ecosystem Approach in Integrated Environmental Assessments (Global Environment Outlook)
GEO Training Manual 23
Number of species per group reported in the countries of Amazonia
COUNTRy PlantsMammals
Total / AmazoniaBirds
Total / AmazoniaReptiles
Total / AmazoniaAmphibians
Total / AmazoniaBolivia 20,000 / n.a. 398 / n.a. 1,400 / n.a. 266 / n.a. 204 / n.a.Brazil 55,000 / 30,000 428 / 311 1,622 / 1,300 684 / 273 814 / 232Colombia 45,000 / 5,950 456 / 85 1,875 / 868 520 / 147 733 / n.a.Ecuador 15,855 / 6249 368 / 197 1,644 / 773 390 / 165 420 / 167Guyana 8,000 / n.a. 198 / n.a. 728 / n.a. 137 / n.a. 105 / n.a.Peru 35,000 / n.a. 513/ 293 1,800/ 806 375/ 180 332/ 262Suriname 4,500 / n.a. 200 / n.a. 670 / n.a. 131 / n.a. 99 / n.a.Venezuela 21,000 / n.a. 305 / n.a. 1,296 / n.a. 246 / n.a. 183 / n.a.
N.a.: Not available for Amazonia (source: GEO AMAZONIA 2009).
Sources: Castaño (1993) [on line] (http://www.otca.org.br/publicacao/SPT-TCA-PER-31.pdf); Rueda-Almonacid and others (2004);
Mojica and others (2004); Ecociencia, Ministry of the Environment (2005); Ibisch and Mérida (2004); FAN (n.d.). Brazil: [on line] (www.
SBherpetología.org.br) (for all of Brazil); Ávila-Pires.T.C.S.Ms. Hoogmoed and Lj Vitt (2007), “Herpetofauna da Amazônia”; L.B.
Nascemento and M.E. Oliveira (ed.), Herpetología do Brasil II, Sociedade Brasileira de Herpetología: pp. 13-43. Peru: Sistema de
Información de la Diversidad Biológica y Ambiental de la Amazonia Peruana (SIAMAZONÍA) [on line] (www.siamazonia.org.pe)
Average annual Amazonian population growth rate per country (source: GEO AMAZONIA 2009) and distribution of water use by region, GEO Brazil: Water Resources.
–15 –10 –5 5
4,4
0,03,2
3,2
3,5
–105
2,9
2,8
1,4
1,4
1,4
–0,40,30,3
1,4
2,2
91,7
1,5
2,22,1
3,61,8
10 150%
Ecuador
Bolivia
Colombia
Brasil
Venezuela
Perú
Surinam
Guyana
Tasa de crecimiento promedio anual de la población amazónica por países
Am
azón
ica
Humana urbana Humana rural Industrial Irrigación Animal
10%
20%
30%
40%
50%
60%
70%
80%
90%
100%
0%
Toca
ntin
is -
A
ragu
aia
A. N
ord.
Occ
iden
tal
A. N
ord.
Orie
ntal
San
Fra
ncis
co
Atlá
ntic
o es
te
Atlá
ntic
o su
dest
e
Atlá
ntic
o su
r
Uru
guay
Par
aná
Par
agua
y
Par
naib
a

Training Manual on Integrated Environmental Assessment
GEO Training Manual
Module 10
24
EXERCISE 4. Analysis of trends and quantitative variables
A. Use the conceptual model you designed in the preceding sections to make a qualitative projection (as shown in figure 4) of what the trends would be, in terms of state and impact (direction and magnitude), if there were changes resulting from the pressures and drivers that you have identified.
________________________________________________________________________________________________________________________________________________________________________________________________
B. List the quantitative variables that you consider relevant for the ecosystem unit that you have selected, and associate them with the possible sources of data information. Can quantitative variables be identified for each element of the DPSIR model? Do you find it easy to locate up to date, accurate and reliable sources of information for each listed variable?
________________________________________________________________________________________________________________________________________________________________________________________________
3.4.2 SPATIAL ANALySIS
Today spatial data (geographic, if they are georeferenced on the surface of the Earth) are an essential information-analysis tool of any IEA. Spatial data generally describe an object’s real-world location, its shape and its relationship with other objects in space, and they may depict different phenomena and objects in the natural world and be represented through different data models. Spatial analysis is the fundamental essence of GISs (annex 1), inasmuch as it includes all transformations, manipulations and possible methods of applying the various spatial data models in order to increase their value, support decision-making and reveal patterns and irregularities that otherwise would be less evident (Longley and others, 2001).
A quantitative study of the objects and phenomena located in space requires organization and planning. In any event, the essential stages for spatial analysis entail, first, asking a question and providing the information required to answer it (figure 5). Next, it is important to determine how the study will be used and by whom. That is, it is essential that the human resources responsible for any IEA have technical capacities enabling them to manage geographic information and remote sensors, and, among other things, to understand the structure of the data and how to manipulate them (annex 1). Thus, if the analytical capacity to debate on and select the appropriate method in accordance with the urgency or the need for precise results, in order to eventually submit the study to the consideration of the target audience (figure 5), is not already in place, it must be generated.
For IEAs with an ecosystem focus, both GISs and spatial analysis techniques can be used in most stages of the process: initially, in identifying units of analysis (see box 2), then in structuring, classifying and standardizing information (see box 6) and finally in analysing interlinkages identified in the conceptual model of the ecosystem being studied (box 8).

Module 10Application of the Ecosystem Approach in Integrated Environmental Assessments (Global Environment Outlook)
GEO Training Manual 25
Figure 5. Essential stages for conducting a spatial analysis in an IEA
Most systems in nature undoubtedly have an ecological heterogeneity that is essential for the structure and dynamics of ecosystems and is characterized by a high degree of spatio-temporal variability (Levin, 1992). This variability is also associated with populations and communities, which exhibit a certain spatial pattern of distribution and aggregation of individuals, whether through patches, environmental gradients or other classes of spatial structures (Legendre and Fortin, 1989; Dutilleul, 1993), and are an important ecological attribute of ecosystems (Legendre, 1993).
One topic that has emerged in recent years is the need to integrate social and economic data in spatially explicit landscape models (Perry and Enright, 2006), taking into account the concepts of spatial and temporal scales in conjunction with abiotic and biotic variables (Merterns and Lambin, 1999; Moran and others, 2000; Read and others, 2001). Some statistical approaches seek to correlate spatial interlinkages with the drivers of direct change in ecosystems (Serneels and Lambin, 2001; Nagendra and others, 2003). Depending on the specific need, numerous methods and techniques can be used to conduct spatial analyses. For example, one subdiscipline of spatial analysis is the analysis of spatial data with commonly used visualization techniques to show spatial patterns, while spatial data exploration (Exploratory Spatial Data Analysis, ESDA) can be used to find patterns, and spatial modulation techniques are useful for explaining spatial distribution patterns. Naturally, the possible spatial analysis techniques to be used in applying spatial data can be classified in other ways (Longley and others, 2001): (a) consultation; (b) measurement; (c) transformation; (d) descriptive summaries; (e) optimization; and (f) hypothesis testing. What is important regarding the numerous spatial data analysis techniques is to recognize that they exist and to determine which is the most useful according to the specific requirements for each IEA.
In the case of IEAs, both GISs and spatial analysis techniques can be used in most stages of the process: in identifying units of analysis; in structuring, classifying and standardizing information; and in analysing interlinkages identified in the conceptual model of the ecosystem being studied.
Asking the specific question
• determines the needed information and data
• who will use or analyze information in the IEA • and how
• understanding the type of available data, objects and attributes • essential for determining the specific method to be used
• depending on the need for more or less detail, or on the required • precision or on how soon a result is needed
• once the method has been selected, the necessary steps are carried out • in a GIS• presentation of information through maps, values, tables, charts, etc.
Identifying the users in the IEA
Ensuring that the data are clear and understood
Selecting the method
Processing and interpreting the data
22

Training Manual on Integrated Environmental Assessment
GEO Training Manual
Module 10
26
3.4.3 MULTISCALE ANALySIS
A considerable number of models currently posit interrelationships between the state of the environment and anthropic elements. These models attempt to make explicit the differences among the various spatial and temporal scales (Nelson and others, 2006; Deininger and Minten, 1996; Merterns and Lambin, 1999). Hence, the models have incorporated a series of statistical approaches, in order to link the spatial aspects of ecosystems with the pressures exercised on them (Serneels and Lambin, 2001; Nagendra and others, 2003) and thus detect the anthropic variables that account for the state of the environment. And, given that these anthropic variables can operate at multiple scales, this procedure locates a link at a specific scale of the environmental variable of interest (Goldstein, 1999). Multiple-scale analysis has been undertaken through ecosystem monitoring and evaluation initiatives, such as Long-term Integrated Monitoring in Terrestrial Systems (NoLIMITS, 2000) and the Millennium Ecosystem Assessment (2005).
An ecosystem is composed of a variety of processes and elements that exist at multiple spatial scales and function at various temporal scales. For a given ecosystem, the principal ecological processes, in many cases expressed as structural or composition elements, can be mapped and measured at local and regional scales. Measurable attributes should be studied at different scales. For example, at landscape scale, forest structure can be measured in terms of the number, size and distribution of the fragments of a certain type of vegetation, and its composition and configuration fragments may vary. At the local scale, for example, structure would be measured in terms of tree-size distribution or according to the age distribution of individuals in a population characteristic or indicative of the forest in question. To give another example, information at smaller scales on the functioning of an ecosystem may be extrapolated to larger scales (box 9), or the analysis of the supply of and demand for a service may be evaluated at different scales (box 10).
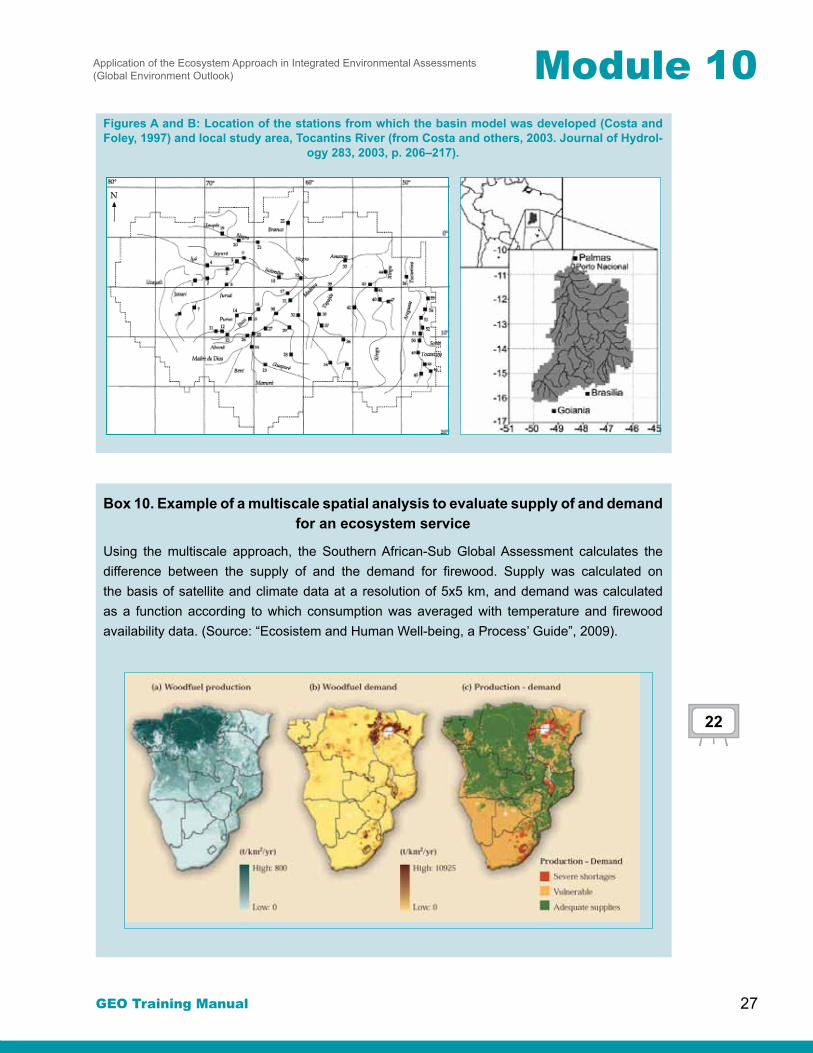
Box 9. Ecosystem services of Amazonian forests: regulation of water flow and evidence of the effect of deforestation at multiple scales (Foley and others, 2007)
Studies at the small-basin level show that when a pressure such as deforestation increases, runoff and discharges into tributaries also increase. For example, in the eastern portion of Amazonia, river discharge was found to increase by up to 25% as a result of a change in plant cover in the Tocantins River basin (figures A and B: Costa and others, 2003). At smaller scales, Costa and Foley (1997) used mathematical models to analyse the effects of deforestation on the water balance throughout the entire Amazon basin, and they showed that, on average, runoff and discharges into tributaries may be altered by up to 20%. Some individual sub-basins varied between 5% and 45%, depending on climate, water composition, basin location and original vegetation.
Module 10Application of the Ecosystem Approach in Integrated Environmental Assessments (Global Environment Outlook)
GEO Training Manual 27
Figures A and B: Location of the stations from which the basin model was developed (Costa and Foley, 1997) and local study area, Tocantins River (from Costa and others, 2003. Journal of Hydrol-
ogy 283, 2003, p. 206–217).
Box 10. Example of a multiscale spatial analysis to evaluate supply of and demand for an ecosystem service
Using the multiscale approach, the Southern African-Sub Global Assessment calculates the difference between the supply of and the demand for firewood. Supply was calculated on the basis of satellite and climate data at a resolution of 5x5 km, and demand was calculated as a function according to which consumption was averaged with temperature and firewood availability data. (Source: “Ecosistem and Human Well-being, a Process’ Guide”, 2009).
22

Training Manual on Integrated Environmental Assessment
GEO Training Manual
Module 10
28
3.4.4 USE OF INDICATORS
Conducting an IEA requires analysing data, but in many cases the data must be simplified to make complex realities more understandable as well as to facilitate the reporting of the results of an evaluation to the target audience. One way to summarize information is to use indicators, that is, variables or values derived from a set of data that provide information on a phenomenon that in many cases cannot be measured directly (OECD, 1994). In addition to being relevant within the DPSIR conceptual framework, the indicators must be simple, valid, readily available, replicable and comparable.
In this document, “ecosystem service indicators” refers to indicators that efficiently convey the characteristics and trends of ecosystem services and allow decision makers to understand the state, trend and rates of change of the services (World Resource Institute, 2009). Indicator selection should clearly reflect the underlying ecological structure and the function of the ecosystem based on a properly devised conceptual model of the ecosystem or the ecosystem service in question.
Another issue to be considered in developing indicators is that most ecosystem service indicators developed until now reflect the flow of these services, that is, the benefits that people actually receive from them. Indicators that reflect ecosystems’ capacity to provide services, or the stock of services, are much less developed and are more closely related to ecosystem integrity and health. In some cases, indicators of ecosystem health have been used with regard to the stock of an ecosystem, given that an ecosystem’s state determines its capacity to provide services (e.g., ecosystem extension) (World Resource Institute, 2009).
The most widely used indicators of the state of ecosystem services commonly include proxies when the service in question cannot be measured directly (box 11, table 2, annex 2). Any measurements or inferences (transformations data to indicators) are influenced by the temporal and spatial scale of operation of the ecosystem element or process.
Conducting a complete IEA requires analysing, in addition to the indicator of state and its trend over time, its relationship with the human context. The pressures and drivers that affect ecosystems must also be measured, and in some cases indicators that synthesize any data obtained from these factors must be used. Pressures may be both natural and anthropic disturbance events or actions, the latter of which are traditionally emphasized in the DPSIR conceptual framework. Pressures that can lead to perceptible changes in the rates of fundamental ecological processes will vary enormously, depending on the ecosystem evaluated (Pintér and others, n.d., Training Module 5, Drivers). These pressures should, however, be described with some additional attributes, such as their frequency, extent, magnitude (intensity and duration), variability and the ecosystem element that they affect (e.g., primary productivity in a forest).
23
Module 10Application of the Ecosystem Approach in Integrated Environmental Assessments (Global Environment Outlook)
GEO Training Manual 29
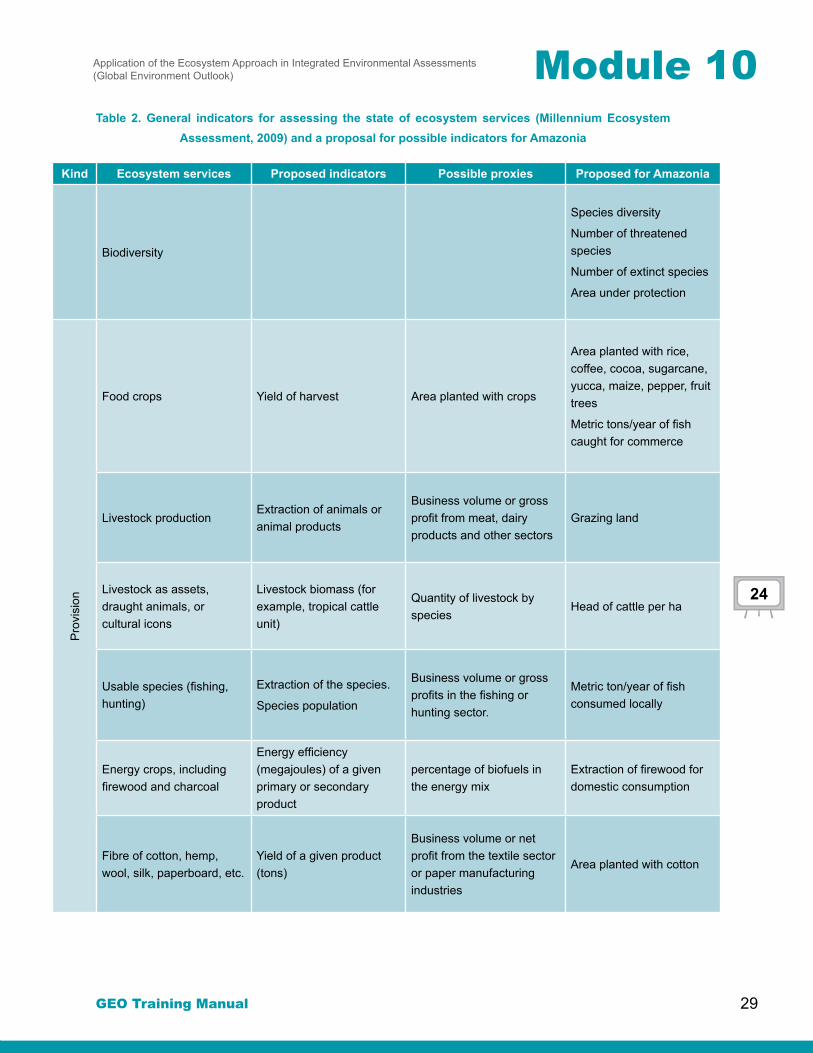
Table 2. General indicators for assessing the state of ecosystem services (Millennium Ecosystem Assessment, 2009) and a proposal for possible indicators for Amazonia
kind Ecosystem services Proposed indicators Possible proxies Proposed for Amazonia
Biodiversity
Species diversity
Number of threatened species
Number of extinct species
Area under protection
Pro
visi
on
Food crops Yield of harvest Area planted with crops
Area planted with rice, coffee, cocoa, sugarcane, yucca, maize, pepper, fruit trees
Metric tons/year of fish caught for commerce
Livestock productionExtraction of animals or animal products
Business volume or gross profit from meat, dairy products and other sectors
Grazing land
Livestock as assets, draught animals, or cultural icons
Livestock biomass (for example, tropical cattle unit)
Quantity of livestock by species
Head of cattle per ha
Usable species (fishing, hunting)
Extraction of the species.
Species population
Business volume or gross profits in the fishing or hunting sector.
Metric ton/year of fish consumed locally
Energy crops, including firewood and charcoal
Energy efficiency (megajoules) of a given primary or secondary product
percentage of biofuels in the energy mix
Extraction of firewood for domestic consumption
Fibre of cotton, hemp, wool, silk, paperboard, etc.
Yield of a given product (tons)
Business volume or net profit from the textile sector or paper manufacturing industries
Area planted with cotton
24

Training Manual on Integrated Environmental Assessment
GEO Training Manual
Module 10
30
kind Ecosystem services Proposed indicators Possible proxies Proposed for AmazoniaP
rovi
sion
Wood
Harvest, generally in m3, but also in local units, such as board feet or number of poles
Business volume or gross profit from the forest sector
Volume of wood removed
MedicationHarvesting of known medicinal species (tons or number of organisms)
Number of persons who use natural medicine
Number of known medicinal species
Number of traditionally used medicinal species
Reg
ulat
ion
CO2 sequestrationNet flow of CO2 from the atmosphere
Change of values in CNet flow of CO2 to the atmosphere
Elimination of N, P, S Denitrification, S precipitation, P fixation
Downstream NO3, PO4 and SO4
NO3, PO4, SO4, downstream
Re-accumulation of N, P, K, Ca
Waste detoxificationDifference in toxin concentration at input, and output sequence
Diseases attributable to toxins, incidence of fish deaths
Mercury measurements, mt/year
Shoreline protection
Mitigation of erosion, damages to infrastructure or resources and coastal flooding
Km of coast with vegetation intact Cost of coastal damage
Km of mangrove
Of pests, pathogens and weeds
Intensity, duration and scope of outbreaks of unwanted species
Expenditures on biocides. Area occupied by exotic species.
Number of invasive species
Number of emerging diseases and viruses
Cul
tura
l
Recreation and leisureRecreation opportunities offered
Business volume or gross profit from the tourism sector, number of visitors
Number of visitors to national parks and indigenous reserves
Esthetics Landscape area Visitor opinion surveys Sites of natural beauty
Opinion surveys
Spiritual and cultural
Presence of sites, landscape, or species with a spiritual cultural significance
Number of, or area containing, important sites with a protection status
Number of important sites
Scientific and educational
Presence of, or area containing, sites or species with a scientific or educational value
Number of school visits Number of articles published
Number of articles published
24

Module 10Application of the Ecosystem Approach in Integrated Environmental Assessments (Global Environment Outlook)
GEO Training Manual 31
kind Ecosystem services Proposed indicators Possible proxies Proposed for AmazoniaS
uppo
rt
Scientific and educational
Presence of, or area containing, sites or species with a scientific or educational value
Number of school visits
Number of articles published
Number of articles published
Energy capturing Net primary productivity NDVI Vegetation index – NDVI
Nutrient cycling
N mineralization Area of N fixing species
P mineralization Mycorrhizae, percentagePercentage mycorrhizae by soil type
Availability of cationsPercentage saturation of bases
Percentage saturation of bases
Pollinationpercentage of flowers pollinated within a species
Populations of pollinating species
Populations of pollinating species
HabitatSuitable habitat area for a given species
Areas by vegetation type
Fragmentation indices
Area, according to ecosystem
Fragmentation index
Percentage area according to ecosystem under figure protection
(Adapted from Chapter 4. Millennium Ecosystem Assessment manual
The most recent Millennium Ecosystem Assessment Training Manual (2009) summarizes the groups of pressures and drivers most often cited in the literature as important for developing a conceptual framework to analyse ecosystems services:
• Pressures (direct drivers): change in land cover and use (deforestation, habitat loss, desertification, etc.), natural resource overexploitation, invasive species, pollution and climate change
• Drivers (indirect): demographic factors (such as population change); economic, sociopolitical, cultural factors; and technological change
When ecosystem service indicators are to be measured, the known, or at least the assumed, cause and effect relationships (drivers, pressures, impacts) should be reflected. In addition, indicators should:
1. reflect the ecological process/ecosystem service being studied and be sensitive to changes in any pressures that might be exerted;
2. provide information on the state of other ecosystem elements (resources or processes) not directly measured;
3. show a natural variability that is limited or that, at a minimum, is sufficiently well-understood so as to make it possible to differentiate between non-natural changes in indicator values and those that occur within a natural range;
4. be relevant, and clearly establish the linkages or the value of the indicators for society.
26

Training Manual on Integrated Environmental Assessment
GEO Training Manual
Module 10
32
Recuadro 11. Resumen del desarrollo de indicadores globales por áreas temáticas del proyecto Biodiversity Partnership Indicators BIP 2010
Focal area Topic Indicator title State development
State and trends of the biodiversity components
Trends in extent of selected biomes, ecosystems and habitats
Extent of forests forest types
Extent of habitats
Being developed
Being developed
Trends in species abundance and distribution
Living Planet Index
Global Wild Bird Indicator
Developed
Developing
Coverage of protected areas Coverage of protected areas
Overlays with biodiversity
Effectiveness of management
Being developed
Being developed
Being developed
Change in the state of endangered species
Red List Index Developed
• Trends in genetic diversity Ex situ collections of crops
Genetic diversity of domesticated terrestrial species
Developing
Sustainable use
Areas under sustainable management
Forest area under sustainable management: certification
Forest area under sustainable management: degradation and deforestation
Agricultural-ecosystem area under sustainable management
Developed
Developing
Developing
EXERCISE 5. Indicators to assess the state of ecosystem services
Table 2 and box 11 present a series of indicators (developed and being developed) to assess the state of ecosystem services.
A. Would any of the indicators set forth in table 2 and box 11 be useful for evaluating the state of the services identified by you for your ecosystem? If not, can you identify any indicator that could be useful for this purpose?________________________________________________________________________________________________________________________________________________________________________________________________
B. Select five indicators from table 2 or box 11 that could be applied to your IEA. Discuss the relevance of those indicators, as well as the viability of estimating them on the basis of available information.________________________________________________________________________________________________________________________________________________________________________________________________________________________________________________________________25
37

Module 10Application of the Ecosystem Approach in Integrated Environmental Assessments (Global Environment Outlook)
GEO Training Manual 33
Área Focal Tema Titulo del indicadorEstado de desarrollo
Sustainable use
Proportion of products derived from sustainable use
State of traded species
Wild Commodities Index
Developed
DevelopingEcological footprint and related concepts
Ecological footprint Developing
Threats to Biodiversity
Nitrogen deposition Nitrogen deposition Partially developed
Invasive species Trends with invasive species Developed
Ecosystem integrity and ecosystem goods and
services
Marine trophic index Marine trophic index Developed
Water quality of freshwater ecosystems
Water quality indicator Developed
Trophic integrity of other ecosystems
Developing
Ecosystem fragmentation and connectivity
Forest fragmentation
River fragmentation and flow regulation
Developing
Incidence of human-induced ecosystem failures
Developing
Health and well-being of communities
Health and well-being of communities directly dependent on ecosystem goods and services
Developing
Biodiversity for food and medicine
Nutritional status of biodiversity•
Biodiversity for food and medicine
Developing
State of traditional knowledge, innovation
and practices
State of and trends in language diversity and number of persons who speak indigenous languages
State of and trends in language diversity and number of persons who speak indigenous languages
Developing
Other indicators Developing
State of access and distribution of benefits
State of access and distribution of benefits
To be defined
State of resource transfer
Resource transfer Developing
Accessed on 23 September 2009: http://www.twentyten.net/Indicators/tabid/59/Default.aspx

Training Manual on Integrated Environmental Assessment
GEO Training Manual
Module 10
34
EXERCISE 6. Understanding the indicators to assess the state of ecosystem services
The Biodiversity Indicators Partnership (BIP) has developed a series of indicators for:
• status and trends in relation to sustainable use of biological-diversity components;
• sustainable use;
• threats to biological diversity;
• integrity of ecosystems and ecosystem goods and services;
• status of knowledge, innovations and traditional practices;
• status of access to and participation in benefits;
• status of resource transfers.
Regarding INTEGRITY OF ECOSYSTEMS GOODS AND SERVICES, the BIP is composed of seven indicators, two of which have been developed: the marine trophic index and water quality of freshwater ecosystems.
The organization Sea Around Us (http://www.seaaroundus.org/) has calculated the marine trophic index for all exclusive economic zones, including that of El Salvador 1.
1 http://www.seaaroundus.org/eez/222/200.aspx

Module 10Application of the Ecosystem Approach in Integrated Environmental Assessments (Global Environment Outlook)
GEO Training Manual 35
Multiannual data of the marine trophic index for the exclusive economic zone of El Salvador
year Marine trophic index year Marine trophic index year Marine trophic index1950 3.03 1970 3.15 1990 3.081951 3.03 1971 3.18 1991 3.001952 3.05 1972 3.02 1992 3.191953 3.03 1973 2.96 1993 3.191954 3.05 1974 3.03 1994 3.161955 3.05 1975 2.94 1995 3.161956 3.04 1976 2.66 1996 3.221957 3.04 1977 2.62 1997 3.211958 3.05 1978 2.78 1998 3.211959 3.04 1979 2.72 1999 3.231960 3.01 1980 2.66 2000 3.241961 3.02 1981 2.79 2001 3.271962 3.01 1982 2.75 2002 3.141963 3.01 1983 2.93 2003 3.071964 2.99 1984 2.96 2004 3.101965 3.09 1985 2.88 2005 3.061966 3.06 1986 2.89 2006 3.161967 3.10 1987 2.871968 3.14 1988 2.931969 3.14 1989 3.07
If a decrease in the marine trophic index represents a decline in the abundance and diversity of fish species at the top of the food chain, and overfishing is occurring (at a level far above one of sustainable management), what can be inferred from the findings for this indicator for the exclusive economic zone of El Salvador from 1950 to 2006?
Forest cover is another indicator that does not appear directly associated with ecosystem services, but that offers information on the state of the forest ecosystem and on the possible consequences of a change in that state on the services that the ecosystem provides. The United Nations Food and
MARINE TROPHIC INDEX IN THE WATERS OF EL SALVADOR
Tro
ph
ic L
evel
Trophic Level
3,3
3,2
3,1
3,0
2,9
2,8
2,7
2,6
1950 1960 1970 1980 1990 2000

Training Manual on Integrated Environmental Assessment
GEO Training Manual
Module 10
36
Agriculture Organization (FAO) provides the following forest area data for the period from 1990 to 2005 (http://www.fao.org/forestry/32089/en/)
year 1990 2000 2005Natural forest area (FAO) (thousands of hectares) 369 318 292
Calculate the rate of change in the natural forest area for 1990 2005, 1990 2000 and 2000 2005, based on the formula given below, and analyse the results. Are there differences in the rates of change? What could cause these differences? What implications would this have on the ecosystem services provided by the forests in El Salvador?
4. Considerations for the application of the ecosystem approach in future IEAs.
There is no single way to conduct an integrated environmental assessment with an ecosystem approach, just as there is no single vision of how to apply the ecosystem approach to an environmental assessment. Although using these assessments has various benefits, the many limitations in applying them also need to be recognized —starting with the lack of knowledge of ecosystem functioning (which affects decisions on their management) and the population’s numerous demands on/immediate needs for ecosystem services (population well-being, and scale and timing), in addition to the complexity of appropriately evaluating the ecological, social and economic uses of biodiversity.
Nonetheless, IEAs must be based on a comprehensive overview of ecosystem components and of their interrelationship with humans, in addition to focusing on the functioning of ecosystems (including the relationships among ecosystems and ecosystems’ internal processes) and their two-way relationship with humans. Future research on environmental consequences must include the consequences on human well-being: How have ecosystem goods and services changed, and how has this change affected the well-being of the populations that depend on these goods and services? How do ecosystem changes affect human well-being, and can they help alleviate poverty among certain marginalized groups?
One limitation of IEAs is that they are based for the most part on secondary information, and compiling and analysing them depends largely on the capacities of the institutions involved. In
Rate of change =Area in time 2 – Area in time 1
Time 2 – time 1
28
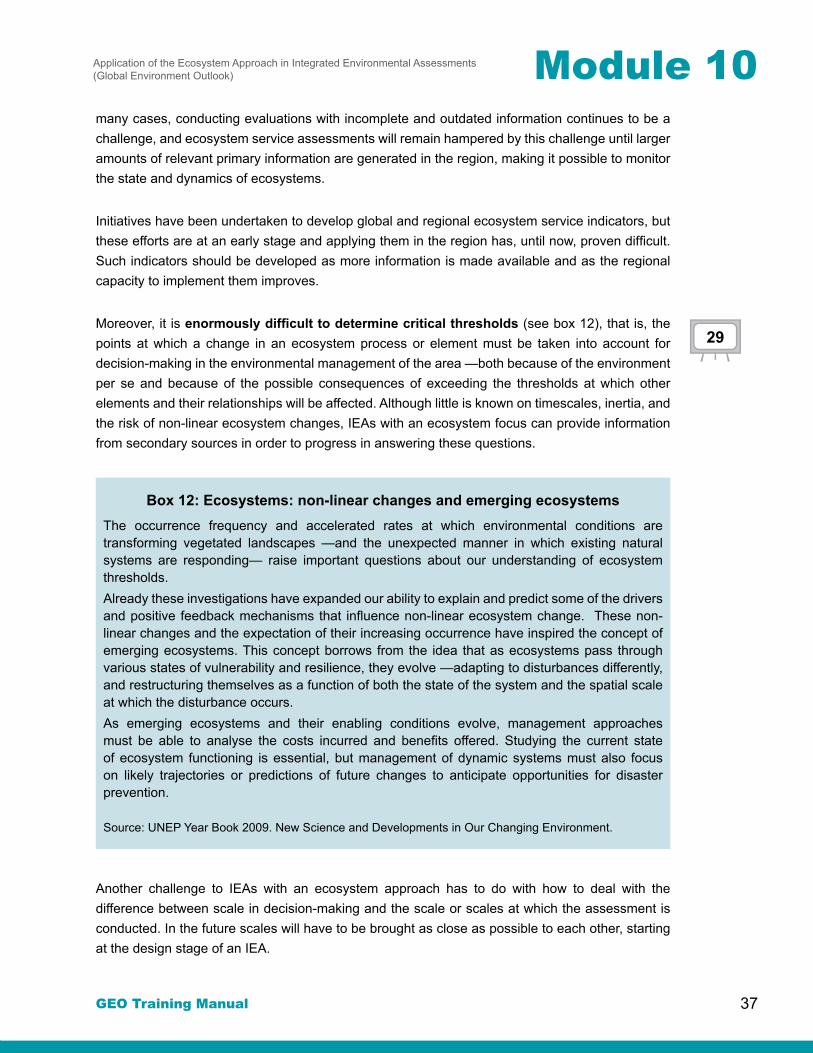
Module 10Application of the Ecosystem Approach in Integrated Environmental Assessments (Global Environment Outlook)
GEO Training Manual 37
many cases, conducting evaluations with incomplete and outdated information continues to be a challenge, and ecosystem service assessments will remain hampered by this challenge until larger amounts of relevant primary information are generated in the region, making it possible to monitor the state and dynamics of ecosystems.
Initiatives have been undertaken to develop global and regional ecosystem service indicators, but these efforts are at an early stage and applying them in the region has, until now, proven difficult. Such indicators should be developed as more information is made available and as the regional capacity to implement them improves.
Moreover, it is enormously difficult to determine critical thresholds (see box 12), that is, the points at which a change in an ecosystem process or element must be taken into account for decision-making in the environmental management of the area —both because of the environment per se and because of the possible consequences of exceeding the thresholds at which other elements and their relationships will be affected. Although little is known on timescales, inertia, and the risk of non-linear ecosystem changes, IEAs with an ecosystem focus can provide information from secondary sources in order to progress in answering these questions.
Box 12: Ecosystems: non-linear changes and emerging ecosystemsThe occurrence frequency and accelerated rates at which environmental conditions are transforming vegetated landscapes —and the unexpected manner in which existing natural systems are responding— raise important questions about our understanding of ecosystem thresholds. Already these investigations have expanded our ability to explain and predict some of the drivers and positive feedback mechanisms that influence non-linear ecosystem change. These non-linear changes and the expectation of their increasing occurrence have inspired the concept of emerging ecosystems. This concept borrows from the idea that as ecosystems pass through various states of vulnerability and resilience, they evolve —adapting to disturbances differently, and restructuring themselves as a function of both the state of the system and the spatial scale at which the disturbance occurs. As emerging ecosystems and their enabling conditions evolve, management approaches must be able to analyse the costs incurred and benefits offered. Studying the current state of ecosystem functioning is essential, but management of dynamic systems must also focus on likely trajectories or predictions of future changes to anticipate opportunities for disaster prevention.
Source: UNEP Year Book 2009. New Science and Developments in Our Changing Environment.
Another challenge to IEAs with an ecosystem approach has to do with how to deal with the difference between scale in decision-making and the scale or scales at which the assessment is conducted. In the future scales will have to be brought as close as possible to each other, starting at the design stage of an IEA.
29

Training Manual on Integrated Environmental Assessment
GEO Training Manual
Module 10
38
5. ReferencesAndrade-Pérez, A., ed. (2008) Applying the ecosystem approach in Latin America Translated by Medina, Maria Eugenia, Gland, Switzerrland, IUCN, vi + 106 pp. Originally published as Aplicación del enfoque ecosistémico en Latinoamérica. (Bogotá, Colombia. CEM-UICN, 2007).
Armenteras, D. & A. Singh. (en prensa). Capítulo 3: Relaciones entre cambios ambientales y bienestar humano en ALC. Informe GEOALC 2009. Programa de las Naciones Unidas para el Medio Ambiente – PNUMA.
Beaumont, N., M. Townsend, S. Mangi, & M.C. Austen (2006), Marine Biodiversity. An economic valuation. Building the evidence base for the Marine Bill. s.l.: Department for Environment. Food and Rural Affairs UK.
Chuvieco, E. (2002) Teledetección ambiental. Ariel Ciencia: Madrid, España.
Costanza, R. & M. Mageau (1999). What is a healthy ecosystem? Aquatic ecology 33: 105-115.
Costanza, R., R. d’Arge, R. de Groot, S. Farber, M. Grasso, B. Hannon, K. Limburg, S. Naeem, R. V. O’Neill, J. Paruelo, R.G. Raskin, P. Sutton & M. van den Belt. (1997) The value of the world’s ecosystem services and natural capital, Nature, vol. 387, no. 6630, pp. 253-260.
Deininger, K. & B. Minten (1996). Determinants of forest cover and the economics of protection: an application to Mexico. World Bank, Washington, DC, en Kaimowitz y Angelsen, 1998.
Dinerstein, E., D.M. Olsen, D.J. Graham, A.L. Webster, S.A. Primm, M.P. Book-binder & G. Ledec. (1995). A conservation assessment of the terrestrial ecoregions of Latin America and the Caribbean. World Bank, WWF. Washington D. C., USA.
Ding Y., W. Wang, X. Cheng & S. Zhao (2008). Ecosystem health assessment in inner Mongolia region based on remote sensing and GIS. The International Archives of the Photogrammetry, Remote Sensing and Spatial Information Sciences. Vol. XXXVII. Part B1. Beijing 2008. Pp: 1029-1034.
Dutilleul, P. (1993). Modifying the t test for assessing the correlation between two spatial processes. Biometrics 49, pp. 305–314.
Fernández, N. & G. Piñero. (2008). La caracterización de la heterogeneidad especial de los ecosistemas: el uso de atributos funcionales derivados de datos espectrales. Ecosistemas 17 (3): 64-78.
Fisher, S. G. (1994). Pattern, process and scale in freshwater systems: some unifying thoughts. Pages 575–591 in P. S. Giller, A. G. Hildrew, and D. G. Raffaelli (editors). Aquatic ecology: scale, pattern and process. Blackwell Scientific, Oxford, UK.

Module 10Application of the Ecosystem Approach in Integrated Environmental Assessments (Global Environment Outlook)
GEO Training Manual 39
Foley, J.A. and others (2007) Amazonia revealed: forest degradation and loss of ecosystem goods and services in the Amazon Basin. Frontiers in Ecology 2007; 5(1): 25—32. GEO Resource Book.
Goldstein, H. (1999). Multilevel Statistical Models, Available at: http://www.ats.ucla.edu/stat/examples/msm_goldstein/goldstein.pdf
Gómez, R. & E. Galarza. (2009). Guía metodológica para la elaboración de GEO Ecosistémico. Documento borrador. Lima, Mayo 2009.
Gómez, R., E. Galarza, P. Bubb, C. Mafuta, P. Rajbhandari, C. Sebukeera, K. Zahedi, B. Garea-Moreda & L. Fernández. (sf.) Manual de capacitación para evaluación ambiental integral y elaboración de informes. Módulo de capacitación 2. El diseño y la organización del proceso del EAI nacional. PNUMA, International Institute for Sustainable Development. 56p.
IDEAM, IGAC, IAvH, Invemar, I. Sinchi e IIAP. (2007). Ecosistemas continentales, costeros y marinos de Colombia. Instituto de Hidrología, Meteorología y Estudios Ambientales, Instituto Geográfico Agustín Codazzi, Instituto de Investigación de Recursos Biológicos Alexander von Humboldt, Instituto de Investigaciones Ambientales del Pacífico Jhon Von Neumann, Instituto de Investigaciones Marinas y Costeras José Benito Vives de Andreís e Instituto Amazónico de Investigaciones Científicas Sinchi. Bogotá. D.C., 276 p + 37 hojas cartográficas.
Jäger, J., M.E. Arreola, M. Chenje, L. Pintér, P. Raibhandari, B. Garea Moreda & L. Fernández. (sf). Manual de capacitación para evaluación ambiental integral y elaboración de informes. Módulo de capacitación 1. El enfoque GEO para la realización de evaluaciones ambientales integrales. PNUMA, International Institute for Sustainable Development. 34p.
Josse, C., G. Navarro, P. Comer, R. Evans, D. Faber-Langendoen, M. Fellows, G. Kittel, S. Menard, M. Pyne, M. Reid, K. Schulz, K. Snow, & J. Teague. (2003). Ecological Systems of Latin America and the Caribbean: A Working Classification of Terrestrial Systems. NatureServe, Arlington, VA. En: http://www.natureserve.org/library/LACEcologicalSystems.pdf
Legendre, P. & M.J. Fortin. (1989). Spatial pattern and ecological analysis. Vegetatio 80:107-138.
Legendre, P. (1993). Spatial Autocorrelation: Trouble or New Paradigm? Ecology 74 (6): 1659-1673.
Levin, S.A. (1992). The problem of pattern and scale in ecology. Ecology 73(6): 1943-1967.
Longley, P.A., Goodchild, M.F., Maguire, D.J. & Rhind, D.W. (2005). Geographic Information Systems and Science. 2nd Edition. Wiley.

Training Manual on Integrated Environmental Assessment
GEO Training Manual
Module 10
40
Mertens, B., Lambin, E., (1999). Modelling land cover dynamics: integration of fine scale land cover data with landscape attributes. International Journal of Applied Earth Observation and Geoinformation 1(1) 48-52.
Millenium Ecosystem Assessment, (2005). Ecosystem and Human Well-being; Synthesis. Island Press, Washington, DC.
Millennium Ecosystem Assessment. (2009). Manual chapter 4. Manual de Evaluación de Ecosistemas y Bienestar Humano: una guía del proceso”. En prensa. http://www.unep-wcmc.org/eap/ma-manual.aspx
Moran E.F., Brondizio, E.S., Tucker, J.M., Silva-Forsberg, M.C., M.McCracken, S., Falesi, I., (2000). Effects of soil fertility and land-use on foreste succession in Amazonia. Forest Ecology and Management 139 (1-3) 93-108.
Nagendra, H.Southworth, J. & Tucker, C.M., (2003). Accesibility as a Determinant of Landscape Transformation in Western Honduras: Linking Patterns and Process. Landscape Ecology 18(2): 141-158.
Nelson, G.C.,E. Bennet, A.A. Berhe, K. Cassman, R. DeFries, T. Dietz, A. Dobermann, A. Dobson, A. Janetos, M. Levy, D. Marco, N. Nakicenovic, B. O´Neill, R. Norgaard, G. Petschelheld, D. Ojima, P. Pingali, R. Watson & M. Zurek (2006). Anthropogenic drivers of ecosystem change: an overview. Ecology ans Society 11(2).
Nolimits, (2000). Networking of Long-term Integrated Monitoring in Terrrestrial Systems. Report 4.
Noon, B.R. (2003). Conceptual issues in monitoring ecological resources. In: Busch, D. E. y Trexler, J.C., eds. Monitoring ecosystems: interdisciplinary approaches for evaluating ecoregional iniciatives. Island Press, Washington, D.C. 27-72.
O’ Neill, R.V. (2001). Is It Time to Bury the Ecosystem Concept? (With Full Military Honors of Course!). Ecology 82, no. 12: 3275-84.
Organisation for Economic Cooperation and Development OECD (1994). Environmental Indicators: Environment Monographs No. 83. París.
Paruelo, J.M. (2008). La caracterización funcional de ecosistemas mediante sensores remotos. Ecosistemas 17 (3): 4-22.
Paruelo, J.M., E.G. Jobbágy & O.E. Sala. (2001). Current Distribution of Ecosystem Functional Types in Temperate South America. Ecosystems 4: 683-698.
Perry, G. & Enright, N., (2006). Spatial modelling of vegetation change in dynamic landscapes: a review of methods and applications, Progress in Physical Geography 30, 1, pp 47-72.

Module 10Application of the Ecosystem Approach in Integrated Environmental Assessments (Global Environment Outlook)
GEO Training Manual 41
Pintér, L., D. Swanson, I. Abdel-Jelil, K. Nagatani-Yoshida, A. Rahman, M. Kok, B. Garea Moreda & L. Fernández. (sf.) Manual de capacitación para evaluación ambiental integral y elaboración de informes. Módulo de capacitación 5. Análisis integral de tendencias ambientales y políticas. PNUMA, International Institute for Sustainable Development. 60p.
PNUMA - Programa de las Naciones Unidas para el Medio Ambiente. (2010). Perspectivas del Medio Ambiente: América Latina y el Caribe. GEO LAC 3.Panamericana Formas e impresos. Colombia. Ed. Novoart Panamá.
Read, J.M., Denslow, J. y Guzman S. (2001). Documenting land cover history of a huymid tropical environment in northeastern Costa Rica using time-series remotely sensed data In: A.C. Millington S.J. Walsh y P.E. Osborne (Editors), GIS and remote sensing applications in biogeography and ecology. Kluwer Academic Publishers, Boston, pp. 68-89.
Serneels, S. and & Lambin, E.F. (2001). Proximate causes of land-use change in Narok District, Kenya: a spatial statistical model. Agriculture, Ecosystems and Environment. 85 pp 65-81
Sierra, R. (ed.) (1999). Propuesta preliminar de un sistema de clasificación de Vegetación para el Ecuador continental. Proyecto Inefan/GEF-BIRD y EcoCiencia. Quito, Ecuador.
Smith R.D., Maltby, E. (2003) Using the Ecosystem Approach to Implement the Convention on Biological Diversity: Key Issues and Case Studies. IUCN, Gland, Switzerland and Cambridge, UK. x + 118 pp.
Tansley, A.G. (1935) The use and abuse of vegetational concepts and terms. Ecology 16:284–307.
UNEP – United Nations Environment Programme. (2007). Global Environment Outlook, GEO 4. Environment for development. Progress Press Ltd. Valletta, Malta.
Van Woerden, J., C. Wieler, E. Gutiérrez-Espeleta, R. Grosshans, A. Abdelrehim, P.C.L. Rajbhandari, B. Garea-Moreda & L. Fernández. (sf). Manual de capacitación para evaluación ambiental integral y elaboración de informes. Módulo de capacitación 4. Monitoreo, datos e indicadores. PNUMA, International Institute for Sustainable Development. 34p.
Vreugdenhil, D., Meerman, J., Meyrat, A., Gómez, L.D. & Graham, J. (2002). Map of Ecosystems of Central America: Final Report. World Bank, Washington, DC.
Walter, H. (1980). Vegetation of the Earth and ecological systems of the geo-biosphera. Springer-Verlag. Berlin.
World Resource Institute (2009). Measuring Nature’s Benefits: A preliminary roadmap for improving ecosystem service indicators. Working Paper. C. Layke. September 2009.

Training Manual on Integrated Environmental Assessment
GEO Training Manual
Module 10
42
6. Annexes ANNEX 1. WhAT IS A GIS?
A geographic information system contains a particular type of information. Information systems can be used to manipulate, summarize, consult, analyse, edit, visualize and, in general, work with information stored in computer databases. GISs use special information on what is on the Earth’s surface —geographically referenced spatial information that is analysed from a geographic standpoint. They may also be seen as a system to support spatial decision-making (e.g., for managers; see figure A), as a tool to conduct more efficient geographic information operations (e.g., for cartographers, planners, etc.) or to reveal patterns that otherwise would be invisible in geographic information (e.g., for scientists, researchers).
Figure A: Space Information Management Model
Structure of a Geographic Information System
GIS components are by now clearly defined (figure B), but the most fundamental component, and one that has changed how spatial data are handled, is the network, without which digital information could not be communicated, transmitted or exchanged efficiently and quickly. Just as in other scientific fields, networks (both intranets and the Internet) are essential for research and enormously facilitate searching and accessing a variety of information sources. In the case of
Grassland humidity
Soils
Topography/Digital terrain model
MeteorologyInformation
systemsVegetation types
Economic valuation
Integrated management
model
Demography-sociology
Efficient communication

Module 10Application of the Ecosystem Approach in Integrated Environmental Assessments (Global Environment Outlook)
GEO Training Manual 43
geographic information, as far back as 1993 the first interactive online maps were published on the Internet, leading to subsequent, more sophisticated commercial GIS applications. Today numerous useful GIS applications are available on the Internet.
The remaining five GIS components are the hardware, the software, the data, the people/users and the procedures (figure B). Hardware is the devices with which the user interacts directly when carrying out spatial operations by typing, pointing, clicking or saving. These devices generally display information on a screen or produce a report or sound. The most commonly used equipment is servers, printers or desktop PCs or, alternatively, more mobile equipment such as laptops, personal digital assistants (PDAs) and GPSs.
The next component of a GIS is the software. The multiple commercial alternatives include ArcGis, Ilwis, as well as freeware programs, such as Quantum GIS and GVSig, which are normally operated by users on local computers. A geographic information system program or software package is a database manager with tools for handling spatial information. These computer applications can handle two types of data: (a) spatial data: entities associated with a specific geographic location (points, lines, polygons) or with fields that represent a continuous variable; and (b) non-spatial data: tables of relations into which information on attributes not related with geographic location are entered. GISs contain and integrate both types of data. Users normally work on an internal client-server network. Software licenses may or may not be installed, either on local computers or on the network, to facilitate access to required programs and in accordance with the number of licenses that have been acquired.
Many repetitive spatial operations can be optimized through procedures with information tools based on script-type sequences or with macros written with widely used computer programs (Avenue, Visual Basic, C, etc.).
Undoubtedly, another fundamental component is the information, which consists of a digital representation of specific aspects of an area on the terrestrial surface. The representation is constructed or compiled to solve a specific problem or meet a scientific objective. Each project or research study normally has its own database, which may range in size from a few megabytes to more than a terabyte. This is another factor that makes it necessary to have system management, of which procedures and standards are an essential component, as well as the users who design, program, maintain information, and analyse and interpret the findings or in one manner or another administrate the system. These individuals are required to have basic knowledge of geographic information, such as information sources, scale, precision and management of related IT products.

Training Manual on Integrated Environmental Assessment
GEO Training Manual
Module 10
44
Figure B. Components of a GIS
A GIS is generally has of a database manager, which simultaneously coordinates and handles: (a) spatial information, which describes geographic objects or localizations and their spatial properties and which is managed with specific data models designed in accordance with the spatial objects; and (b) information on the attributes of the geographic objects or localizations, consisting of non-spatial properties collected in databases that normally follow the relational database model. Spatial analysis renders this information, stored in a database manager, useful and relevant. Hence, it is an essential part of any ecosystem assessment. Unlike with other types of data analysis, the results of spatial analysis change in response to changes in the location of the study objects (e.g., median centre, clusters, spatial correlation) and in localization: “where” is very important both in absolute terms (coordinates) and in relative terms (spatial arrangements, distance). Dependence is the norm: it is important to take into account that “everything depends on everything else, but closer things more so” (Tobler, first law of geography).
Hardware
Procedures
Data
Users
Software
Network

Module 10Application of the Ecosystem Approach in Integrated Environmental Assessments (Global Environment Outlook)
GEO Training Manual 45
Box. Types of geographic elements/phenomena in the real world and their representation in spatial data models
Each geographic element on which a spatial analysis is to be conducted has particular traits that affect the selection of the method of analysis, depending on whether the elements are discrete phenomenon (e.g., private farms, national parks, highways) or continuous phenomena (e.g., precipitation or temperature), or, in some cases, elements usually summarized in terms of a particular area (e.g., population density by department).
Geographic (real) objects can be depicted in two ways: in the vectorial model or the raster model. Any element may be represented with either data model. However, in principle, with the vectorial model, geometric objects represent real objects of a predominantly discrete nature through points and a pair of x,y coordinates (e.g., location of archaeological sites); through lines, by means of a vector; or through an ordered set of points (rivers, overhead electric power lines, road networks) and polygons or compounds, by means of an ordered vector of lines that demarcate an enclosed space (vegetation, land uses, lithology). With the raster method, the properties of spatial localizations are represented by covering the terrain with a mosaic of minimal units, called pixels or cells. The attributes of the elements may be category values, ranges, counts, quantities, proportions.
Example (a): discrete variables: occurrence of fires (points), highways (lines) and special management areas in Amazonia (polygons), represented with the vectorial model; (b): continuous variables: population density in Amazonia, represented with the raster data model; and (c): summarized variables: percentage contributions of the main Amazonian hydrographic sub basins to total basin discharge (maps from GEO Amazonia 2009).

Training Manual on Integrated Environmental Assessment
GEO Training Manual
Module 10
46
ANNEX 2. SUMMARy OF PROGRESS WITh REGIONAL MONITORING INDICATORS FOR ThE SUSTAINABLE DEVELOPMENT OF LATIN AMERICA AND THE CARIBBEAN (LATIN AMERICA AND CARIBBEAN INITIATIVE FOR SUSTAINABLE DEVELOPMENT, 2009).
This initiative makes it possible to obtain information on indicators of state, pressure and response in order to conduct an IEA.
ThEMATIC AREA INDICATOR NAME STATEEquivalence with
Millennium Development Goals (MDGs)
1. BIOLOGICAL DIVERSITY
1.1.1.1 Proportion of land area covered by forest
AGREED ON MDG 7.1 Proportion of land area covered by forest
1.2.1.1 Proportion of terrestrial and marine areas protected
AGREED ON MDG 7.6. Proportion of terrestrial and marine areas protected
1.2.1.2 Proportion of species threatened with extinction
EMERGING
1.3.1.1 Existence of national regulations, laws or decrees relating to access to genetic resources and the distribution of benefits
AGREED ON
1.3.1.2 To be determined (Indicator that incorporates management: process)
EMERGING
1.2.1.1 Proportion of terrestrial and marine areas protected
AGREED ON MDG 7.6. Proportion of terrestrial and marine areas protected
2. MANAGEMENT OF WATER RESOURCES
2.1.1.1 Proportion of total water resources used
AGREED ON MDG 7.5. Proportion of total water resources used
2.1.1.2 To be determined EMERGING
2.1.1.3 Domestic water consumption per household or dwelling
UNDER DEVELOPMENT
2.1.2.1 Water purification EMERGING
2.1.3.1 Regulatory framework, quotas for the management of ground water
EMERGING

Module 10Application of the Ecosystem Approach in Integrated Environmental Assessments (Global Environment Outlook)
GEO Training Manual 47
ThEMATIC AREA INDICATOR NAME STATEEquivalence with
Millennium Development Goals (MDGs)
2. MANAGEMENT OF WATER RESOURCES
2.2.1.1 Proportion of watersheds that have management committees
AGREED ON
2.2.1.2 Proportion of land area managed under a watershed criterion
EMERGING
2.2.1.3 Efficiency in the management of watersheds
EMERGING
2.3.1.1 Fish extraction AGREED ON 2.3.2.1 Projects or amount of money aimed at improving the management of the Caribbean Sea or the coasts
EMERGING
2.4.1.1 Percentage of effluent that is collected and treated
EMERGING
2.4.1.2 Population with access to sanitary facilities
AGREED ON MDG 7.9 Proportion of population using an improved sanitation facility
3. VULNERABILITY, HUMAN SETTLEMENTS AND SUSTAINABLE CITIES
3.1.1.1 Proportion of national territory with management plans
AGREED ON
3.1.2.1 Annual change of the different uses of land
AGREED ON
3.2.1.1 Areas affected by degradation
AGREED ON
3.3.1.2 Carbon dioxide emissions
AGREED ON MDG 7.3 Consumption of ozone-depleting substances
3.4.1.1 Population with access to drinking water
AGREED ON MDG 7.8 Proportion of population using an improved drinking water source

Training Manual on Integrated Environmental Assessment
GEO Training Manual
Module 10
48
ThEMATIC AREA INDICATOR NAME STATEEquivalence with
Millennium Development Goals (MDGs)
3. VULNERABILITY, HUMAN SETTLEMENTS AND SUSTAINABLE CITIES
3.4.1.2 Population with access to sanitary facilities
AGREED ON MDG 7.9 Proportion of population using an improved sanitation facility
3.5.1.1 Population with access to garbage collection services
AGREED ON
3.5.2.1 Collection and appropriate disposal of garbage
AGREED ON
3.6.1.1 National emergency commissions or quick-response groups
AGREED ON
3.7.1.1 Population living in high-risk areas
EMERGING
3.7.1.2 Victims or affected by natural disasters
AGREED ON MDG 7 Complementary: Occurrence of natural disasters
3.7.2.1 To be determined EMERGING
4. SOCIAL TOPICS, INCLUDING HEALTH, INEQUALITY AND POVERTY
4.1.1.1 HIV/AIDS prevalence in persons aged 15 to 49 years
AGREED ON MDG 6.1 HIV/AIDS prevalence in persons aged 15 to 49 years
4.1.2.1. Morbidity rate attributable to acute respiratory diseases
AGREED ON
4.1.2.2 Morbidity rate attributable to water-borne diseases
AGREED ON
4.1.3.1 Hectares of green urban areas in relation to urban population
UNDER DEVELOPMENT
MDG 7 Complementary: Green areas (per capita) in the main cities of Latin America and the Caribbean
4.2.1.1 Sustainable development projects or programmes and the total number of persons in these projects
EMERGING

Module 10Application of the Ecosystem Approach in Integrated Environmental Assessments (Global Environment Outlook)
GEO Training Manual 49
ThEMATIC AREA INDICATOR NAME STATEEquivalence with
Millennium Development Goals (MDGs)
4. SOCIAL TOPICS, INCLUDING HEALTH, INEQUALITY AND POVERTY
4.2.1.2 Job creation in sustainable development programmes
EMERGING
4.3.1.1. Proportion of homes in precarious settlements
AGREED ON MDG 7.10 Proportion of urban population living in slums
4.3.1.2 Population earning less than $1 (PPP) per day
AGREED ON
4.3.2.1 Growth index of the number of small companies
EMERGING
4.3.3.1 Social expenditure as a percentage of gross domestic product
AGREED ON
4.3.3.2 Environmental expenditure as a percentage of total public expenditure
EMERGING
5. ECONOMIC ASPECTS INCLUDING TRADE AND PRODUCTION AND CONSUMPTION PATTERNS
5.1.1.1 Population using combustible solids
EMERGING
5.1.1.2 Proportion of renewable energy
AGREED ON MDG 7 Renewability of energy supply
5.1.1.3 Energy use per capita and per $1 GDP (PPP)
AGREED ON MDG 7 Complementary: Energy use per capita and per $1 GDP (PPP)
5.2.1.1 Consumption of ozone-depleting chlorofluorocarbons
AGREED ON
5.2.2.2 Companies with ISO 14001 certification
AGREED ON MDG 7 Complementary: Companies with ISO 14001 certification
5.3.1.1 Economic instruments implemented by the country
AGREED ON
5.3.1.2 To be determined EMERGING

Training Manual on Integrated Environmental Assessment
GEO Training Manual
Module 10
50
ThEMATIC AREA INDICATOR NAME STATEEquivalence with
Millennium Development Goals (MDGs)
6. INSTITUTIONAL ASPECTS
6.1.1.1 Existence of formal comprehensive environmental education programmes in schools
EMERGING
6.2.1.1 Net enrolment ratio in primary education
AGREED ON
6.2.2.1 To be determined/national emergency commissions on disaster prevention, by province, canton and district
EMERGING
6.2.3.1 Hours of instruction in environmental science in primary schools
EMERGING
6.3.1.1 Reports on the state of the environment
AGREED ON
6.3.1.2 Environmental statistics system
AGREED ON
6.4.1.1Existence of national councils for sustainable development
AGREED ON

Module 10Application of the Ecosystem Approach in Integrated Environmental Assessments (Global Environment Outlook)
GEO Training Manual 51
7. Glossary of termsAbiotic factor: Non-living component that determine the physical space inhabited by living beings. Examples: water, temperature, light, pH, soil and nutrients.
Assessment: The entire social process to make an appraisal and an objective and critical analysis of data and information so as to meet the needs of users and support decision-making. Applies the criteria of experts to available knowledge in order to propose credible answers to questions of public policy and, where possible, quantify the confidence level. Source: http://www.unep.org/ieacp/regional.aspx?id=1372
Biome: A grouping of terrestrial ecosystems on a given continent that are similar in vegetation structure, physiognomy, environmental features and the characteristics of their animal communities.
Biotic factors: Relationship that exists among the living beings sharing the same environment at a given time and that conditions their existence.
Contents. Combination of two or more indicators or several data. Indices are commonly used in national and regional assessments to show higher levels of aggregation.
Data: Facts, numerical observations and statistics that describe some aspect of the environment and society, such as water quality and demographics. Data are a basic component of indicators.
Drivers: Also referred to as indirect or underlying drivers or driving forces, drivers are fundamental processes in society that drive activities with a direct impact on the environment.
Ecosystem: A dynamic complex of plant, animal and micro-organism communities and their non-living environment interacting as a functional unit.
Ecosystem services: Benefits that persons obtain from ecosystems. Examples include water, wood, food, air, climate regulation.
Environmental assessment: Process by which the significant environmental effects of a programme or project are estimated or evaluated, including ways to minimize, mitigate or eliminate those effects and even to compensate for their impact.
Environmental gradient: A gradual, continuous change in an environmental variable. This change in the characteristics of an environment, ecosystem, biome or geographic area (e.g., soil temperature, etc.) may be either sharp or smooth.

Training Manual on Integrated Environmental Assessment
GEO Training Manual
Module 10
52
Evapotranspiration: The combination of two separate processes whereby water is lost on the one hand from the soil surface by evaporation and on the other from the crop by transpiration. Source: http://www.fao.org/docrep/x0490e/x0490e04.htm#evapotranspiration%20process.
Function of an ecosystem: The manner in which materials and the flow of energy in an ecosystem are exchanged. Example: nutrient cycling.
health, or integrity, of an ecosystem: Determined by how intact a complex of plants, animals and micro-organisms is and by the robustness of the interactions that exist among them and that sustain ecosystems.
Impacts: Positive or negative influences of environmental change on human well-being, through changes in environmental services and environmental stress.
Indicator: Observed value representative of a phenomenon to be studied. Indicators point to, provide information on and describe the state of the environment with significance extending beyond that directly associated with the observation itself. Indicators generally quantify information by aggregating and synthesizing different, multiple data, thus simplifying information that can help reveal complex phenomena (Training Manual on Integrated Environmental Assessment and Reporting, 2009).
Information systems: A system that supports decision-making on a specific part of reality (the object of the system), giving decision makers access to relevant information on the object and its environment.
Patches: Non-linear geographic areas with recognized boundaries that have relatively homogenous environmental characteristics.
Pressures (or direct drivers): Social and economic factors that may be directed towards causing either a desired or an unwanted environmental change and may be subject to feedback in terms of environmental change. Can also be an intentional or unintentional by product of other human activities (e.g., pollution).
Primary productivity: Production through photosynthesis whereby green plants convert solar energy, carbon dioxide and water to glucose and plant tissue. In addition, some deep-sea bacteria can convert chemical energy to biomass through chemosynthesis. Primary production is the amount of material produced per unit of time. Productivity, or the rate of production, is influenced by various environmental factors, including the amount of solar radiation, the availability of water and mineral nutrients and temperature. Types: Gross primary productivity and net primary productivity. Source: http://www.peruecologico.com.pe/glosario_p.htm.

Module 10Application of the Ecosystem Approach in Integrated Environmental Assessments (Global Environment Outlook)
GEO Training Manual 53
Proxy indicator: A substitute measurement that provides information on the area or topic of interest when direct measurements cannot be made.
Remote sensing: Technique for obtaining information on an object, area or phenomenon through the analysis of objects observed with an instrument not in contact with the object, area or phenomena being studied (Chuvieco, 2002, [in Spanish]).
Resilience: The ecosystem’s capacity to experience shocks while retaining essentially the same function, structure, feedbacks and therefore identity.
Responses: Elements among the drivers, pressures and impacts that may be used to manage society in order to alter human-environment interactions. Drivers, pressures and impacts that can be altered by a decision maker at a given scale are called “endogenous factors”, while those that cannot are referred to as “exogenous factors”.
Scenarios: Descriptions of roads towards different possible futures. Scenarios reflect different assumptions about how current trends will unfold, how critical uncertainties will play out and what new factors will come into play.
State: Current condition of the environment (or the ecosystem) as a result of the drivers and pressures.
Structure of an ecosystem: The organization and distribution of elements within that ecosystem.
Trend: Pattern of behaviour of the elements of which an assessment (environment or ecosystem) is composed during a given period of time.

Training Manual on Integrated Environmental Assessment
GEO Training Manual
Module 10
54
www.unep.orpUnited Nations Environment Programme
(UNEP)P.O. Box 30552 Nairobi 00100, Kenya
Tel: +254-(0)20-762-1234Fax:+254-(0)20-762 3927
Email: [email protected]: www. unep.org
United Nations Environment Programme (UNEP)Regional Office for Latin America and the CaribbeanAvenida Morse, Edificio 103. Clayton, Ciudad del Saber Panama City, Panama. Apdo. Postal: 03590-0843
Tel: (+507) 305-3100 / Fax: (+507) 305-3105http://www.unep.org e-mail: [email protected] UNEP