Embed Size (px)
Citation preview
TRAINING MODULE ON RESULTS-BASED MONITORING AND EVALUATION (RBME)
FOR AGRICULTURE AND FISHERIES EXTENSIONKEY OFFICIALS AND MANAGERS
AGRICULTURAL TRAINING INSTITUTEElliptical Road, Diliman, 1100 Quezon City
2018

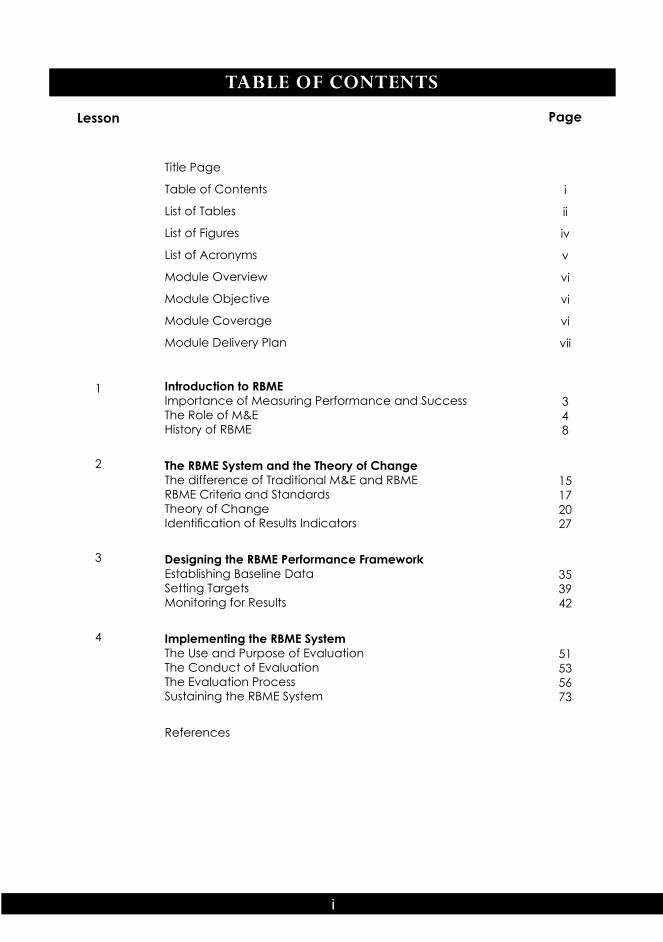
TABLE OF CONTENTS
Lesson
1
2
3
4
Page
i
ii
iv
v
vi
vi
vi
vii
348
15172027
353942
51535673
Title Page
Table of Contents
List of Tables
List of Figures
List of Acronyms
Module Overview
Module Objective
Module Coverage
Module Delivery Plan
Introduction to RBMEImportance of Measuring Performance and SuccessThe Role of M&EHistory of RBME
The RBME System and the Theory of ChangeThe difference of Traditional M&E and RBMERBME Criteria and StandardsTheory of ChangeIdentification of Results Indicators
Designing the RBME Performance FrameworkEstablishing Baseline DataSetting TargetsMonitoring for Results
Implementing the RBME SystemThe Use and Purpose of EvaluationThe Conduct of EvaluationThe Evaluation ProcessSustaining the RBME System
References
i
LIST OF TABLES
Table No.
1
2
3
4
5
6
7
8
9
10
11
12
13
14
15
16
17
18
19
20
21
22
23
24
25
26
27
28
Page
4
10
15
16
17
19
19
28
28
29
29
29
3030
36
37
39
41
41
55
52
53
54
54
56
56
57
58
Title
Differences between monitoring and evaluation
Virtues of an M&E systems.
Difference in the focus of questions between traditional M&E and RBME.
Difference in language between traditional M&E and RBME.
Questions in relation to the results chain.
Definition of results-based monitoring and results-based evaluation.
Characteristics of a results-based monitoring and results-based evaluation
Characteristics of an indicator.
Characteristics of a quantitative and qualitative indicator.
Example of results indicators for a result statement in the education sector.
Immediate/short-term result indicators of the AFE RBME system
Intermediate/mid-term result indicators of the AFE RBME system
Long term result indicators of the AFE RBME system
Pros and cons of using pre-determined indicators
Data collection and analysis plan
Advantages and disadvantages of each data collection methods
Sample baseline data with respect to result statements and indicators
Sample targets with respect to baseline data
Sample RBME performance framework template
Three (3) key criteria of a credible RBME system
Purpose and use of evaluations
Timing of evaluation
Reasons on using in-house evaluation or independent evaluation
Advantages and disadvantages of doing in-house and independent evaluation
Stages of evaluation
Characteristics of quality evaluation
Definition of the OECD-DAC criteria
Types of evaluation
ii
LIST OF TABLES
Table No.
29
30
31
32
33
34
35
36
37
38
39
40
41
42
Page
59
59
61
62
63
64
67
69
69
70
72
72
73
74
Title
Type of questions answered by evaluation
Difference of qualitative and quantitative evaluation
Sample sub-questions for the oxfam Cambodia CBDRR program
Types of evaluation design
Linkages between the evaluation question and the design
Common design for data collection
Analyzing quantitative data
Analyzing qualitative data
Sample report outline
Dimensions of reporting
Types of M&E uses
Level of evaluation uses
Personal, interpersonal, & organizational uses of M&E findings
Critical components of a RBME system
iii
LIST OF FIGURES
Figure No.
1
2
3
4
5
6
7
8
9
10
11
12
13
14
15
16
17
18
19
20
21
22
23
24
25
26
27
28
29
Page
5
6
8
9
10
16
18
21
22
23
24
25
25
26
37
39
43
43
44
45
48
51
53
55
66
67
69
71
71
Title
Hierarchy of interventions
The strategic planning process
Project cycle management
Managing for development results core values
Paris declaration on aid effectiveness principles
Elements of a results chain
Project cycle management of the european union
Projectile pathways of interventions
Elements of a results chain
AFE Theory of Change model
Dengue EP Theory of Change model
Oxfam Cambodia CBDRR Theory of Change model
EVAW Program Theory of Change model
Sample Theory of Change Model of an agriculture intervention
Data collection methods
Measuring target performance
Type of monitoring for each element of the results chain
Linking implementation monitoring to results monitoring
Sample link of means and strategies to maternal care results
Sample link of means and strategies to education results
Data quality triangle
Information evaluation provides
Illustration of “Speaking the Truth to Power”
Sample TOR format
Sample of informed consent
Using evaluation to explain performance divergence
Example of a balance between confidence and tentativeness in writing
Uses of M&E findings
Threats to evaluation findings utility
iv
LIST OF ACRONYMS
ADA
ADB
AFE
AHO
ATI
BHAG
CBDRR
CIDA
CPCRN
DAC
EVAW
HDI
M&E
MDGs
OECD
RBM
RBME
SAQs
SDGs
ToC
TOR
UMS
UNDG
UNESCO
UNICEF
VIMOGKRAPI
Austrian Development Agency
Asian Development Bank
Agriculture and Fisheries Extension
African Health Observatory
Agricultural Training Institute
Big Hairy Audacious Goals
Community Based Disaster Risk Reduction
Canadian International Development Agency
Cancer Prevention and Control Research Network
Development Assistance Committee
Ending Violence Against Women
Human Development Index
Monitoring and Evaluation
Millennium Development Goals
Organization for Economic Cooperation and Development
Results-Based Management
Results-Based Monitoring and Evaluation
Self-Assessment Questions
Sustainable Development Goals
Theory of Change
Terms of Reference
University of Mary Washington
United Nations Development Group
United Nations Educational, Scientific, and Cultural Organization
United Nations Children’s Fund
Vision, Mission, Objective, Goal, Key Results Areas, and Performance Indicators
v
MODULE OVERVIEW
The Agricultural Training Institute, the apex organization for a harmonized agriculture and fisheries extension (AFE) system, is leading the way in the development of the AFE Results-Based Monitoring and Evaluation (RBME) system that ensures the relevance and alignment of extension interventions to the goals of the agriculture and fisheries sector of the country. It takes on the perspective that the search- for real results of interventions - goes beyond the show of just being busy with day to day work but that of answering many of the “so what” and how and why questions.
This reflects on an apparent shift in the field of monitoring and evaluation, in which there is an increasing pressure from the general public for greater transparency and accountability. It moves away from the traditional M&E practice, towards a results-based approach focusing on the results of interventions provided for our clients. Being a relatively new trend, there is a need to capacitate stakeholders on RBME - for them to learn and understand how it can be related and applied in managing AFE interventions such as policies, programs, or projects.
Specifically, this module aims to discuss theoretical and practical concepts and principles on RBME, which includes the role of M&E, RBME criteria and standards, theory of change, RBME performance framework, and evaluation approaches.
MODULE OBJECTIVE
After the training, the participants should be able to demonstrate an understanding on the use of a results-based approach in relation to their planning, monitoring and evaluation functions.
MODULE COVERAGE
Lesson 1: Introduction to RBME A. Importance of Measuring Performance and Success B. The Role of M&E C. History of RBME
Lesson 2: The RBME System and the Theory of Change A. Difference of Traditional M&E and RBME B. RBME Criteria and Standards C. Theory of Change D. Identification of Results Indicators
Lesson 3: Designing the RBME Performance Framework A. Establishing Baseline Data B. Setting Targets C. Monitoring for Results
Lesson 4: Implementing the RBME System A. The Use and Purpose of Evaluation B. The Conduct of Evaluation C. The Evaluation Process D. Sustaining the RBME System
vi
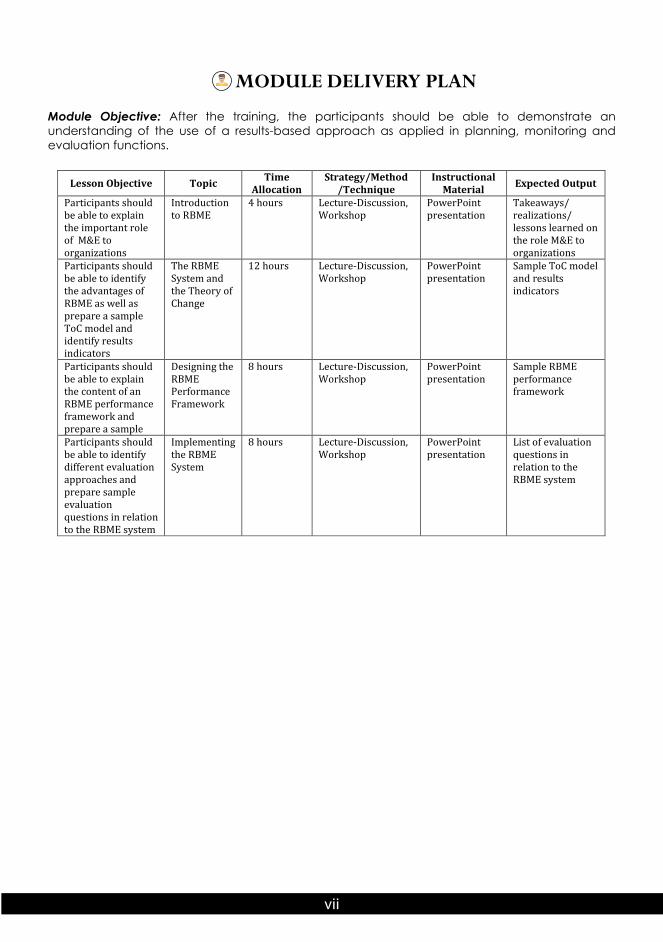
MODULE DELIVERY PLAN
Module Objective: After the training, the participants should be able to demonstrate an understanding of the use of a results-based approach as applied in planning, monitoring and evaluation functions.
Lesson Objective Topic Time Allocation
Strategy/Method /Technique
Instructional Material Expected Output
Participants should be able to explain the important role of M&E to organizations
Introduction to RBME
4 hours Lecture-Discussion, Workshop
PowerPoint presentation
Takeaways/ realizations/ lessons learned on the role M&E to organizations
Participants should be able to identify the advantages of RBME as well as prepare a sample ToC model and identify results indicators
The RBME System and the Theory of Change
12 hours Lecture-Discussion, Workshop
PowerPoint presentation
Sample ToC model and results indicators
Participants should be able to explain the content of an RBME performance framework and prepare a sample
Designing the RBME Performance Framework
8 hours Lecture-Discussion, Workshop
PowerPoint presentation
Sample RBME performance framework
Participants should be able to identify different evaluation approaches and prepare sample evaluation questions in relation to the RBME system
Implementing the RBME System
8 hours Lecture-Discussion, Workshop
PowerPoint presentation
List of evaluation questions in relation to the RBME system
vii

INTRODUCTION TO RBMELesson 1
Introduction to Results-Based Monitoring and EvaluationThis lesson seeks to provide an understanding of the importance of measuring performance and success, the role of M&E to organizations, and the history of M&E practices and trends used by other organizations and countries.
LESSON OBJECTIVES
At the end of this lesson, participants will be able to explain the important role of M&E in organizations.
Specifically, they should be able to:1. Explain the importance of measuring performance and success of organizations;2. Explain the role of M&E and its link to planning and decision making; and3. Explain the history of M&E trends used by other organizations and countries.
Time Allotment: 4 hoursMethodologies: Lecture-Discussion and WorkshopTools to Use: Laptop, projector
OPENERTitle: Explain this! “If one cannot measure, one cannot manage.”Time Allotment: 20 minutesMaterials Needed: Laptop, projector, paper and ballpen
Procedure:1. Show the PowerPoint presentation that displays the saying of Peter Drucker “If one cannot measure, one cannot
manage.”2. Instruct the participants to write down what comes to their mind about the sentence. Give them 5 minutes to answer.
They can write their answers in any piece of paper they have.3. Select at least three (3) participants to give their answers. Provide comments on their answers and identify
similarities to their answers.4. Integrate their answers and provide additional insights on what the saying suggests. 5. Relate it to the lesson to be discussed.
Processing:1. What are your answers? (Possible answers: measurement and management comes hand in hand, measurement is a tool
for management)2. Do you believe that measuring performance is an important tool in management? Why? (Possible answer: Yes, because
it shows what we accomplished and help us see are performance.)
Key Concepts:• Measuring performance is important in knowing success or failure of an organization• Measuring performance aids in proper organizational management
Connecting/Transition Statement to the Lesson:We all agree that the saying of Peter Drucker makes sense? Yes? Also, we can agree that measuring performance is an important tool in managing our organizations? Correct? However, the question is what do we mean when we say “measuring performance”? What is its use in connection to the management our organizations? In this lesson, we will try to find out the answers to these questions as well as learn about the role of M&E to organizations and what practices and trends are used by other organizations and countries in their measuring performance and success.
Importance of Measuring Performances and Success
Measurement is part our everyday life. In simple activities such as cooking, driving, taking medicine, doing the laundry, and playing sports entails measuring. In the fields of science, engineering, manufacturing, and farming, among others, measurement is one of the fundamental concepts being used. However, the question is why do we measure?
Pedhazur & Schmelkin (1991) defined measurement as “a technique in which a property of an object is determined by comparing it to a standard”. This measurement can be in terms of weight, volume, area, length, or temperature, among others. The purpose of measuring things is to see if changes and/or progress are present.
For organizations, whether from the public or private sector, measuring changes and progress are also apparent. However, what is it that organizations measure? What changes and progress do they look into? The answer is organizations measure changes and progress relative to their performance and success. Performance is defined as the accomplishment of a given task measured against present standards of accuracy, completeness, cost and speed (www.businessdictionary.com). Success, on the other hand, is defined as the correct or desired result of an attempt (www.merriam-webster.com).
Primarily, organizations want to know- whether they are performing well and have been successful in their undertakings. Was the organization able to achieve their targets or meet their quotas? Did the organization get the results they are hoping for? Knowing the answers to these questions will help decision-makers and managers to properly manage organizations and take necessary actions aimed at either further improvements or correcting issues and problems.
In relation to this, the phrase “if we cannot measure results, we cannot tell success from failure” comes to mind. It is a phrase often used by evaluation practitioners to describe the power of measuring performance and success wherein we measure performance and success because we want to know whether we are getting the results we want. It suggests that if we cannot measure performance and success, how can do we tell we are successful or not. It is connected to other phrases used by evaluation practitioners that say “if you cannot see success, you cannot reward it” and “if you cannot reward success, you are probably rewarding failure” (Kusek & Rist, 2004).
This simply means that we measure the performance or success of our organizations because it provides information that can help lead to: (1) improvement in the delivery of products and services; (2) justification of interventions and financial allocation; and (3) demonstration of accountability and transparency in the use of resources. The measurement of our performance and success especially for the public sector, justifies the use of resources because if we don’t measure-, we might just be wasting them.
In order to measure performance and success, organizations utilize a monitoring and evaluation (M&E) system. I am sure that we all have heard of the term M&E, it is a term we often hear in our respective offices. Correct? For organizations that provides interventions, M&E is a term that usually comes to mind. Let us have a quick recap of the definitions of monitoring and evaluation.
According to the Organization for Economic Cooperation and Development (2002), monitoring is the “continuous function that uses the systematic collection of data on specified indicators, to provide management and the main stakeholders of an ongoing development intervention with indications of the extent of progress and achievement of objectives and progress in the use of allocated funds.”
Basically, it is used to see changes in program performance over time. It is sometimes referred to as process evaluation, because it focuses on the implementation process (Amerasinghe, 2015).
One the other hand, evaluation is “the systematic and objective assessment of an ongoing or completed project, program, or policy, including its design, implementation, and results.” It is “aimed to determine the relevance and fulfillment of objectives, development efficiency, effectiveness, impact, and sustainability” (OECD, 2002).
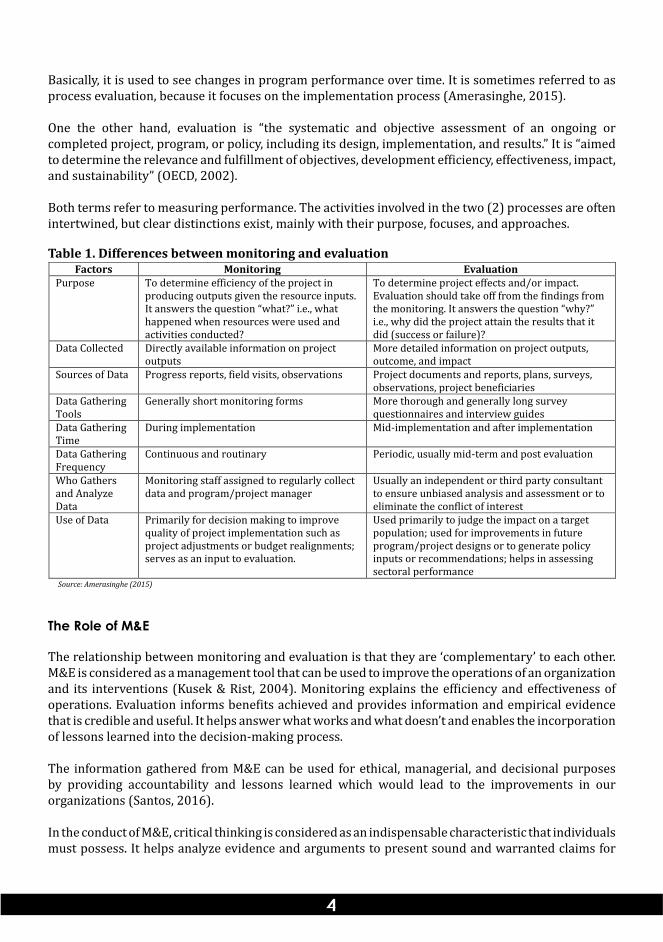
Both terms refer to measuring performance. The activities involved in the two (2) processes are often intertwined, but clear distinctions exist, mainly with their purpose, focuses, and approaches.
Table 1. Differences between monitoring and evaluation Factors Monitoring Evaluation
Purpose To determine efficiency of the project in producing outputs given the resource inputs. It answers the question “what?” i.e., what happened when resources were used and activities conducted?
To determine project effects and/or impact. Evaluation should take off from the findings from the monitoring. It answers the question “why?” i.e., why did the project attain the results that it did (success or failure)?
Data Collected Directly available information on project outputs
More detailed information on project outputs, outcome, and impact
Sources of Data Progress reports, field visits, observations Project documents and reports, plans, surveys, observations, project beneficiaries
Data Gathering Tools
Generally short monitoring forms More thorough and generally long survey questionnaires and interview guides
Data Gathering Time
During implementation Mid-implementation and after implementation
Data Gathering Frequency
Continuous and routinary Periodic, usually mid-term and post evaluation
Who Gathers and Analyze Data
Monitoring staff assigned to regularly collect data and program/project manager
Usually an independent or third party consultant to ensure unbiased analysis and assessment or to eliminate the conflict of interest
Use of Data Primarily for decision making to improve quality of project implementation such as project adjustments or budget realignments; serves as an input to evaluation.
Used primarily to judge the impact on a target population; used for improvements in future program/project designs or to generate policy inputs or recommendations; helps in assessing sectoral performance
The Role of M&E
The relationship between monitoring and evaluation is that they are ‘complementary’ to each other. M&E is considered as a management tool that can be used to improve the operations of an organization and its interventions (Kusek & Rist, 2004). Monitoring explains the efficiency and effectiveness of operations. Evaluation informs benefits achieved and provides information and empirical evidence that is credible and useful. It helps answer what works and what doesn’t and enables the incorporation of lessons learned into the decision-making process.
The information gathered from M&E can be used for ethical, managerial, and decisional purposes by providing accountability and lessons learned which would lead to the improvements in our organizations (Santos, 2016).
In the conduct of M&E, critical thinking is considered as an indispensable characteristic that individuals must possess. It helps analyze evidence and arguments to present sound and warranted claims for
Source: Amerasinghe (2015)
the value, or the lack of it, of interventions (Santos, 2016). Individuals involved in M&E must develop critical thinking skills to ensure that correct information will be gathered. This is because correct information leads to correct management of organizations.
The main role of M&E for organizations to provide feedback based on the information and data gathered (Kuster et al., 2011). M&E can have an internal and external use for organizations. The internal use of information refers to individuals within the organization using the information to ensure that targets are met, promising practices and interventions are accounted, and weaknesses are solved by taking necessary actions to correct them (Gorgens & Kusek, 2009).
On the other hand, the same information can also be used to inform outside stakeholders or the general public about the performance and accomplishments of the organization. This is especially true for government agencies and organizations where information from M&E systems can help build the trust of the general public, who are now, more than ever, looking for better products and services delivery from the government (Gorgens & Kusek, 2009).
However, more than telling the general public and outside stakeholder of the performance of the organizations, the feedbacks from an organization’s M&E system provides evidence that is instrumental in the policy-making processes. M&E systems strengthen the cause of using an evidence-based policy making wherein managers make well-informed decisions about interventions by using the best available information at the center of policy process (Davies, 1999 as cited by Segone, 2010).
Further, the role of M&E is to remove the use of opinion-based policy making which relies mostly on the selective use of evidence and untested views of influential or powerful individuals or groups (Segone, 2010). An M&E system, if well-constructed, can be used to influence reforms in policies and improve interventions.
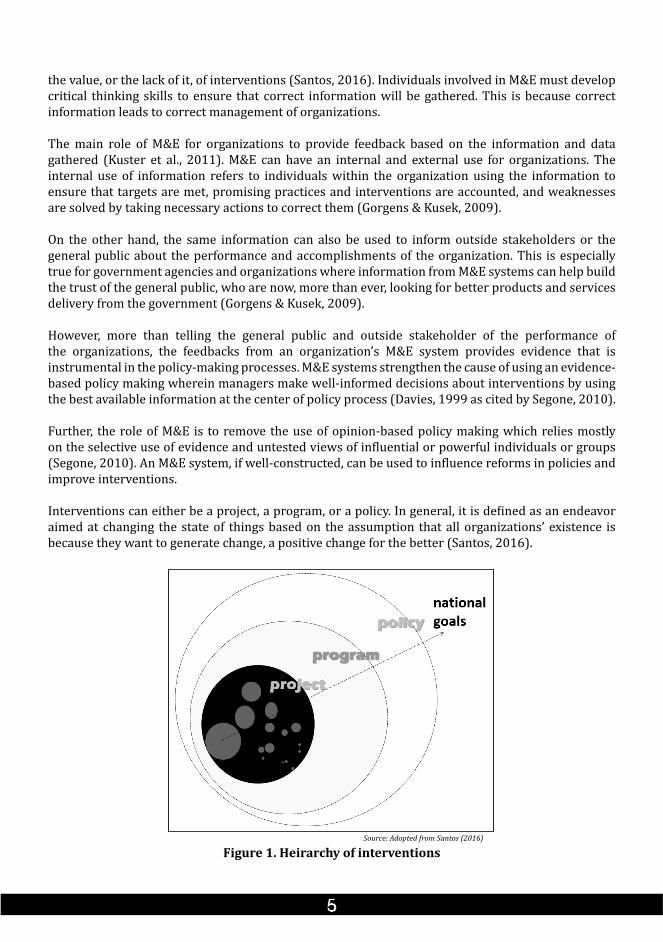
Interventions can either be a project, a program, or a policy. In general, it is defined as an endeavor aimed at changing the state of things based on the assumption that all organizations’ existence is because they want to generate change, a positive change for the better (Santos, 2016).
Figure 1. Heirarchy of interventions
Source: Adopted from Santos (2016)
In terms of the hierarchy, a project is classified as the smallest intervention while a policy is the broadest. A project may be a part of a program and a program may be a part of a policy. Thus, when we say M&E helps reforms in policies, this reform also affects the programs and projects conducted covered in the policy.
Looking at it holistically, all interventions implemented by different organizations, especially in government, are aligned and relevant to national goals such as self-sufficiency, poverty alleviation, increase employment, improve individual well-being, gender equality, and environmental sustainability, among others. These goals are geared towards nation building and further expanding through inter-country development or globalization.
However, before we think about pushing for reforms and improvements in the policies, programs, and projects of our organizations, we have to understand where these interventions are coming from. What is the basis for its design and implementation?
The existence of an organization as well as the interventions it provides is connected to its mandates and functions. These mandates and functions are translated and connected into our organization’s Big Hairy Audacious Goals (BHAG), which stands for our Vision, Mission, Objective, Goal, Key Results Areas, and Performance Indicators (some sectors call it VIMOGKRAPI).
The BHAG or VIMOGKRAPI serves as a guide for individuals within the organization because it shows a clear and compelling point of what the organization wants to achieve (Collins & Porras, 1994). It is reflected in the organization’s strategic plans. A strategic plan is a document used to communicate the BHAG / VIMOGKRAPI and what actions and steps the organization must take to achieve it (Santos, 2016).
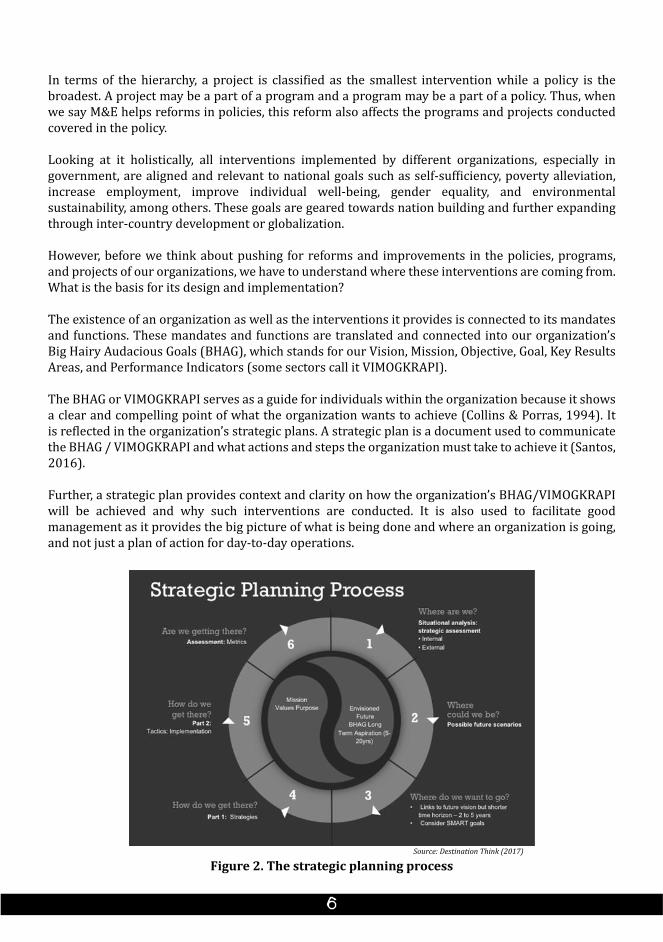
Further, a strategic plan provides context and clarity on how the organization’s BHAG/VIMOGKRAPI will be achieved and why such interventions are conducted. It is also used to facilitate good management as it provides the big picture of what is being done and where an organization is going, and not just a plan of action for day-to-day operations.
Figure 2. The strategic planning process
Source: Destination Think (2017)
The strategic plan and the BHAG/VIMOGKRAPI serve- as a core ideology, a primary driver and a catalyst for change for our organizations as well as the rationale behind our interventions (Santos, 2016). It is considered as a good reference to determine performance and success but not necessarily show the performance and success of an organization. It shows the desired results seek by organizations but does not measure whether these have been achieved. Remember, a strategic plan is just a plan, it is not a measuring tool.
In reality, a strategic plan is incomplete if it does not have a built-in mechanism for measuring performance and success of the intervention planned. This is often the case in the current practice of strategic planning. Consequently, in order to push for reforms and improvements, we need to have a measuring tool that would give evidence to do so.
As an introduction to our topic on results-based monitoring and evaluation (RBME), we have to realize the role of M&E in seeing whether we have been able to gain progress or have achieved what we are mandated to do, in our BHAG/VIMOGKRAPI. M&E plays a role in ensuring that the actions mentioned in the strategic plan are not only accomplished but whether it is on right track to achieve the positive changes it seeks.
Often, the scenario of how we do things is that: we design and conduct interventions, as specified in the strategic plan; we run them; we deliver what we are supposed to delivery, and that’s it. We forget to measure whether desired changes these intervention seeks have been achieved or not.
We keep on repeating these interventions, consuming resources, with no indication of whether it has resulted in something good or if it might just be failing. This scenario must stop. We are now seeing that there must be a link between M&E and the organizations M&E and the organization’s BHAG and strategic plan because, again, we want to see if we are moving forward towards our desired goals.
This is the simplest essence of the concept of RBME. It is contrary to the traditional management practice, in which plans are developed by managers to identify activities, designed responsibilities and go into action without seeing what happens after the action has been made.
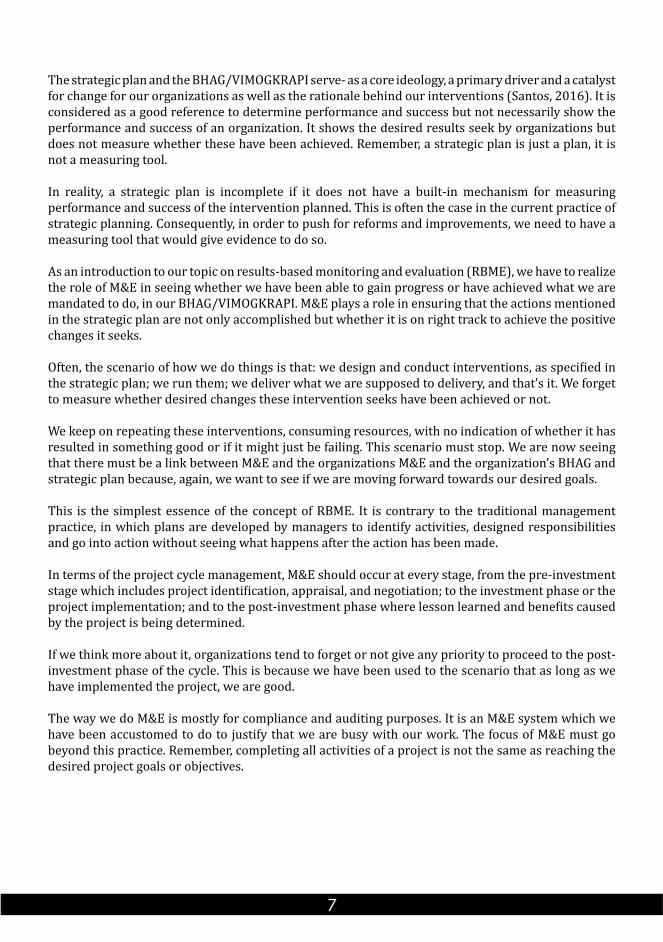
In terms of the project cycle management, M&E should occur at every stage, from the pre-investment stage which includes project identification, appraisal, and negotiation; to the investment phase or the project implementation; and to the post-investment phase where lesson learned and benefits caused by the project is being determined.
If we think more about it, organizations tend to forget or not give any priority to proceed to the post-investment phase of the cycle. This is because we have been used to the scenario that as long as we have implemented the project, we are good.
The way we do M&E is mostly for compliance and auditing purposes. It is an M&E system which we have been accustomed to do to justify that we are busy with our work. The focus of M&E must go beyond this practice. Remember, completing all activities of a project is not the same as reaching the desired project goals or objectives.
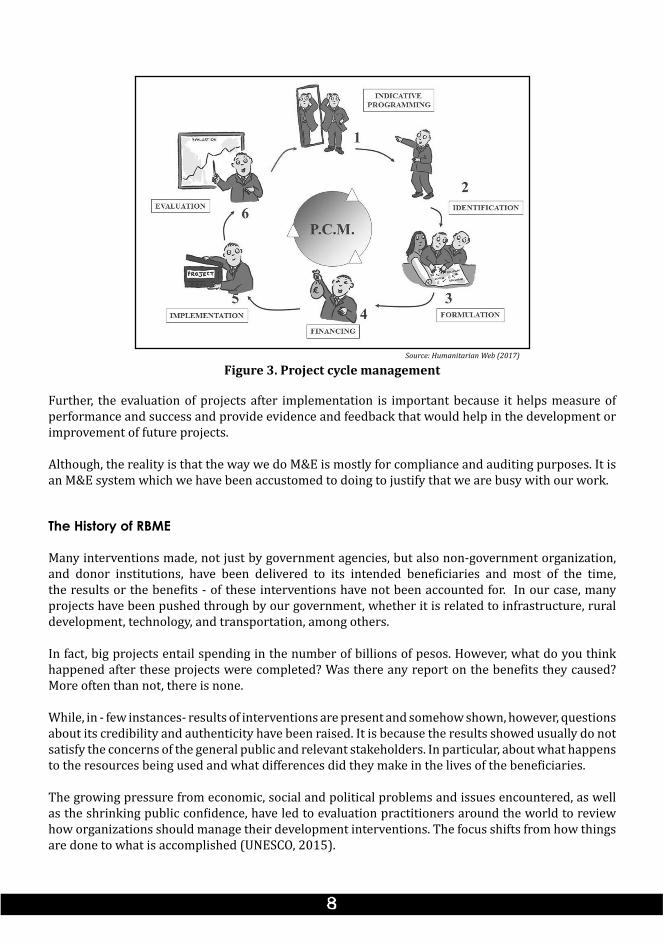
Figure 3. Project cycle management
Source: Humanitarian Web (2017)
Further, the evaluation of projects after implementation is important because it helps measure of performance and success and provide evidence and feedback that would help in the development or improvement of future projects.
Although, the reality is that the way we do M&E is mostly for compliance and auditing purposes. It is an M&E system which we have been accustomed to doing to justify that we are busy with our work.
Many interventions made, not just by government agencies, but also non-government organization, and donor institutions, have been delivered to its intended beneficiaries and most of the time, the results or the benefits - of these interventions have not been accounted for. In our case, many projects have been pushed through by our government, whether it is related to infrastructure, rural development, technology, and transportation, among others.
In fact, big projects entail spending in the number of billions of pesos. However, what do you think happened after these projects were completed? Was there any report on the benefits they caused? More often than not, there is none.
While, in - few instances- results of interventions are present and somehow shown, however, questions about its credibility and authenticity have been raised. It is because the results showed usually do not satisfy the concerns of the general public and relevant stakeholders. In particular, about what happens to the resources being used and what differences did they make in the lives of the beneficiaries.
The growing pressure from economic, social and political problems and issues encountered, as well as the shrinking public confidence, have led to evaluation practitioners around the world to review how organizations should manage their development interventions. The focus shifts from how things are done to what is accomplished (UNESCO, 2015).
The History of RBME
With this in mind, the international development community has since made various initiatives in what was called “results revolution” (ADB, 2012). The results revolution led to the following milestones:
- Millennium Declaration – Millennium Development Goals (MDGs), 2000- Monterrey Consensus on Financing for Development, 2002- Rome Declaration on Harmonization, 2003- Marrakech Memorandum on Managing for Development Results, 2004- Paris Declaration on Aid Effectiveness, 2005- Accra Agenda for Action, 2008- Busan Partnership for Effective Development Cooperation, 2011
These initiatives aimed to strengthen the understanding that there should be a focus on the management of results. The adoption of the MDGs and the commitment of countries to financing, donor harmonization, and cooperation between countries led to the use of the results-based management (RBM). Although the concept of RBM is not new - and thought to have been originated back to the 1950’s, it was through this initiative that helped it blossom and evolved into what it is today (UNESCO, 2015; ADB, 2012).
By the definition of the UNDG (2011), RBM is “a management strategy by which all actors, contributing directly or indirectly to achieving a set of results, ensure that their processes, products, and services contribute to desired results and use information and evidence on actual results to inform decision making on the design, resourcing, and delivery of program and activities as well as for accountability and reporting.”
This concept is supported by the Marrakech Memorandum and the Paris Declaration. Their core values and principles favor moving towards a results-based orientation on planning, budgeting, management, monitoring, reporting, and oversight. The core values mentioned in the Memorandum of the Marrakech on Managing for Results were: (1) focus the dialogue on results at all phases; (2) align programming, monitoring, and evaluation of results; (3) keep measurement and reporting simple; (4) manage for, not by results; and (5) use results information for learning and decision making (OECD-DAC, 2005).
Figure 4. Managing for development results core values
Source: OECD-DAC (2017)
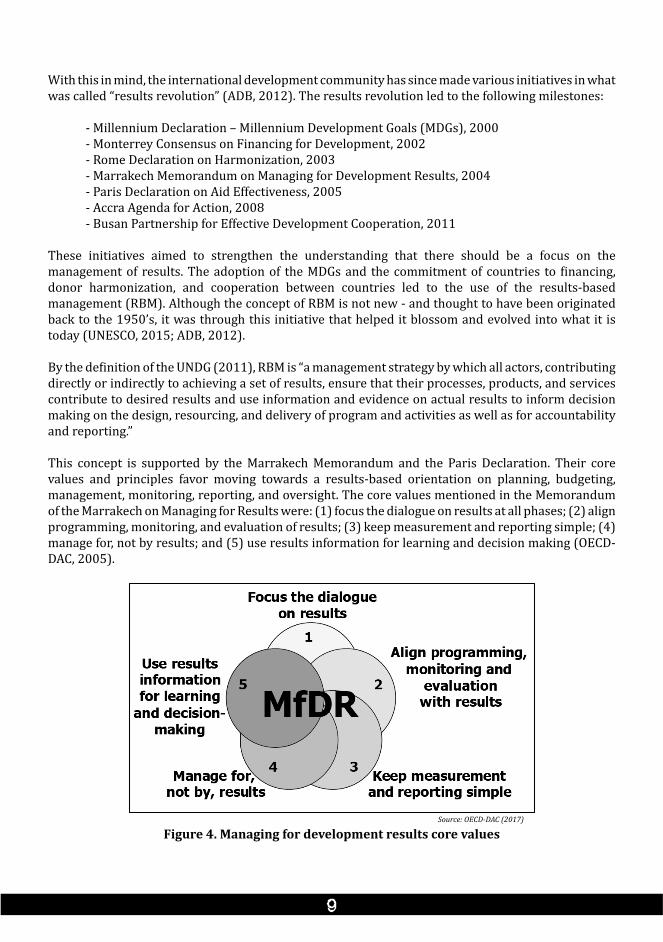
On the other hand, the Paris Declaration mentioned the commitments of organizations and countries in promoting development premised on five (5) principles of aid effectiveness namely: (1)ownership, (2)alignment, (3)harmonization, (4)managing for results, and (5)mutual accountability (AHO, 2015).
Figure 5. Paris declaration on aid effectiveness principles
Source: AHO (2015)
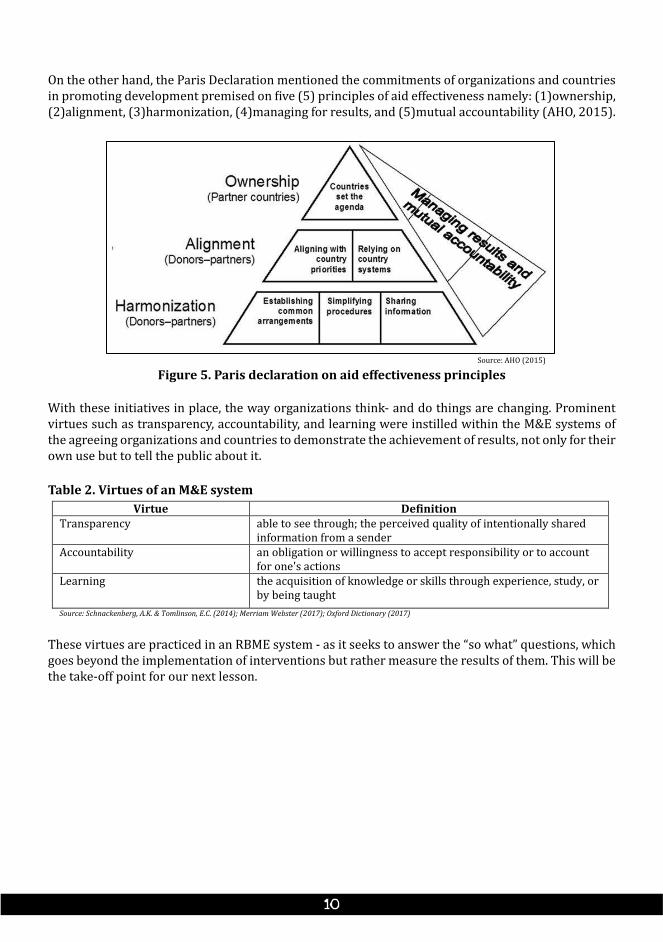
With these initiatives in place, the way organizations think- and do things are changing. Prominent virtues such as transparency, accountability, and learning were instilled within the M&E systems of the agreeing organizations and countries to demonstrate the achievement of results, not only for their own use but to tell the public about it.
Table 2. Virtues of an M&E systemVirtue Definition
Transparency able to see through; the perceived quality of intentionally shared information from a sender
Accountability an obligation or willingness to accept responsibility or to account for one's actions
Learning the acquisition of knowledge or skills through experience, study, or by being taught
Source: Schnackenberg, A.K. & Tomlinson, E.C. (2014); Merriam Webster (2017); Oxford Dictionary (2017)
These virtues are practiced in an RBME system - as it seeks to answer the “so what” questions, which goes beyond the implementation of interventions but rather measure the results of them. This will be the take-off point for our next lesson.
WORKSHOP 1Title: “Think About It”Time Allotment: 1 hour and 30 minutesMaterials Needed: Laptop, projector
Workshop Mechanics:1. Group the participants according to their host team assignment.2. Show them a slide of the instructions for the workshop saying:
“Review and analyze your organization’s context, BHAG, vision and mission statements, and strategic plan, among others. Brainstorm on the state of the current M&E system: how your organization’s measure performance and results; how is it connected to your identified goals. Provide five (5) takeaways/realizations/lessons learned that you have with regards to your organization’s current M&E system.”
1. Tell the participants that as a group, they will have to discuss among themselves the statement given and come up with an agreed answer among the groups. Give them 45 minutes to do the workshop.
2. Have each group present their outputs one by one.3. Integrate their answers and relate it to the current situation that of traditional management which lacks the
measurement of the results of interventions.
Processing based on workshop outputs:1. How do organizations measure results? (Possible answers: output-oriented, traditional way)2. Do all of us have the same observation? (Possible answer: yes)3. Do you agreed that there is a need to change the way we are doing busy? (Possible answer: yes)
Key Concepts:• Measuring for just compliance and accounting purpose is not enough• There must be a connection between organizational goals and the M&E system.• Conducting activities and achieving targets and does not necessarily mean achieving desired goals or results
SUMMARY
The growing pressure and demand for better interventions was the tipping point for development organizations to change how they do things. The old way of merely conducting interventions was not enough and that there is a need to determine the results of these interventions. In an M&E perspective, the measure of performance and success changed from what and how interventions are done from what is achieved.
Further, through this mechanism, the results gathered will be used as evidence and feedback to push for reforms or improvement in our organizations. M&E, as a management tool, links other organizational processes such as planning and budgeting. It measures whether the BHAG and the actions in the strategic plan of the organization have been achieved or, if not what is the progress made in achieving it.
ENDERTitle: “Changing for the Better”Time Allotment: 20 minutesMaterials Needed: Laptop, projector, metacards, pentel pens, masking tape, and white/black board
Procedure:1. Ask the participants to think of one word to describe why change is important for organizations? Give them 2 minutes
to answer.2. Instruct them to place their answers in the white board/ black board provided for them. (Ensure that there is a white
board/black board to be used for the training)3. Select three (3) participants to explain their answers.4. Identify the common answers of the participants and provide additional insights on why change important for
organizations.
Processing:1. What are the words often related to change? (Possible answers: improvements, growth, innovations)2. Do you agree that the only constant thing in this world is change? (Possible answer: Yes)3. Is change always positive? (Possible answer: No, because changes can be also negative.)4. Do we want positive changes for our organizations? (Possible answer: Yes)`
Key Concepts:• Organizations in order to stay relevant must adopt to the changing times.• Positive change will help organizations improve not only their performance but the provision of their products and/
or services.
Statement to End of lesson:We learned in this lesson that it is not only important that we know our desired goals but we should know how to measure whether we are achieving them. With our current M&E practice and the growing pressure from our stakeholders and the general public, there is a need to change things for the better. This can happen through RBME. However, how do we establish an RBME system? This, we will answer in our next lessons.
SELF-ASSESSMENT QUESTIONS (SAQs)
1. True or False: Monitoring is the continuous function that uses the systematic collection of data while evaluation is the systematic and objective assessment of interventions? (True)
2. What are the virtues of an M&E system (Transparency, Accountability, and Learning)3. Give one role of M&E? (Measuring performance and success; link information to evidence-based
decision making)4. What does BHAG mean? (Big Hairy Audacious Goal)5. What is the management strategy that ensures that processes, products, and services contribute
to desired results and use evidence to inform decision making? (Results-based management)
SUPPLEMENTARY READINGS
OECD. (2008). Managing for Development Results. Organization for Economic Cooperation and Development. Retrieved July 28, 2017 from www.oecd.org/development/effectiveness. Segone, M. (2009). Country-led Monitoring and Evaluation Systems: Better Evidence, Better Policies, Better Development Results. UNICEF. Retrieved May 12, 2017 from www.mymande.org.Segone, M. (2010). From Policies to Results: Developing Capacities for Country Monitoring and Evaluation System. UNICEF. Retrieved May 12, 2017 from www.mymande.org.
Lesson 2
The RBME System and theTheory of Change
The RBME System and the Theory of ChangeThis lesson seeks to provide an understanding on the concept of RBME and the Theory of Change (ToC) which focuses on measuring the results of interventions, the achievement of desired goals, and the identification of results statements and results indicators.
LESSON OBJECTIVES
At the end of this lesson, participants will be able to identify the advantages of RBME as well as prepare a ToC model and identify results indicators.
Specifically, they should be able to:1. Explain the difference between traditional M&E and RBME;2. Explain the concept of the Theory of Change; 3. Identify result statements for the Theory of Change model; and 4. Identify result indicators to measure these results statements.
Time Allotment: 12 hoursMethodologies: Lecture-Discussion and WorkshopTools to Use: Laptop, projector
OPENERTitle: “Where Are We Going?”Time Allotment: 20 minutesMaterials Needed: Laptop, projector
Procedure:1. Show the participants a clip from Dora the Explorer looking at her map. (Ensure that a video of Dora the Explorer is
downloaded and available.)2. Instruct them to observe the video and think how it is related to M&E.3. Select two (2) participants to share their thoughts.4. Provide additional insights and relate it to the lesson to be discussed.
Processing:1. What did you noticed in the video? (Possible answers: Dora looked into the map to know the way to her destination; the
map shows the correct way to the destination.)2. How do you relate this to M&E? (Possible answer: Knowing our destination will help us determine the correct way to
get there. The “correct way” may either refer to as the interventions needed to achieved desired goals or the M&E system which tells us whether we have reached our destination or not.)
Key Concepts:• Knowing organizational goals is important in measuring whether we have reach it or not.• Reaching our destination entails knowing the road or the way that will take us there.
Connecting/Transition Statement to the Lesson:Knowing the desired destination of our organizations is the important in a RBME system because it tell us what we are going to measure. RBME tells us the results of our interventions and whether we have been able to achieve our desired destination or not. It is different from the traditional way we do things. The question is how is it different? This is what we will find out on this lesson, as we discussed the concepts and principles behind RBME.
Difference of traditional M&E and RBME
The difference between traditional and results-based M&E is simply on the focus of the M&E system. Traditional M&E focuses on checking whether an intervention is well and properly implemented. It tracks whether interventions are in compliance with its targeted plans and resources. On the other hand, results-based M&E goes beyond the implementation and compliance of intervention and tracking of used resources as it E focuses on measuring the results or outcomes of the interventions implemented or completed (Kusek & Rist, 2004).
In a traditional M&E system, the performance of an organization, especially for government agencies, is equated in the completion of activities in relation to an intervention. This is because bureaucratic systems entail compliance to a set of rules and regulations as well as adherence to government protocols and processes (Amerasinghe, 2015). Thus, when an intervention has been delivered, we consider this being our performance and the results of what we have been doing.
This notion is not totally wrong. I am sure that we have all worked hard to ensure that we deliver our interventions timely and properly. However, the issue regarding this orientation is that the M&E system becomes preoccupied more with adhering to protocols and processes rather than determining the achievement of expected results of the interventions.
This, of course, is in addition to what we had discussed earlier about the increasing pressure on the public sector for greater transparency and accountability, which led to the incorporation of results-based management approaches in M&E. Because of this, organizations and managers are expected to focus more determining and achieving results.
The primary focus of RBME is the results or outcomes of the interventions we delivered. However, focusing on results does not necessarily mean we disregard the protocols and processes entailed in a bureaucracy. It also does not mean that we disregard getting information about the inputs used, activities undertaken, and outputs delivered but rather used it as a reference. This is because one emphasis given in RBME is to see what the connection of the outputs delivered to results is (Santos, 2016).
The difference between traditional M&E and RBME can also be seen in questions it answers. Traditional M&E questions are simple and can be provided by a direct response while RBME questions are more complicated as it seeks to answer the “so what?” questions (Amerasinghe, 2015).
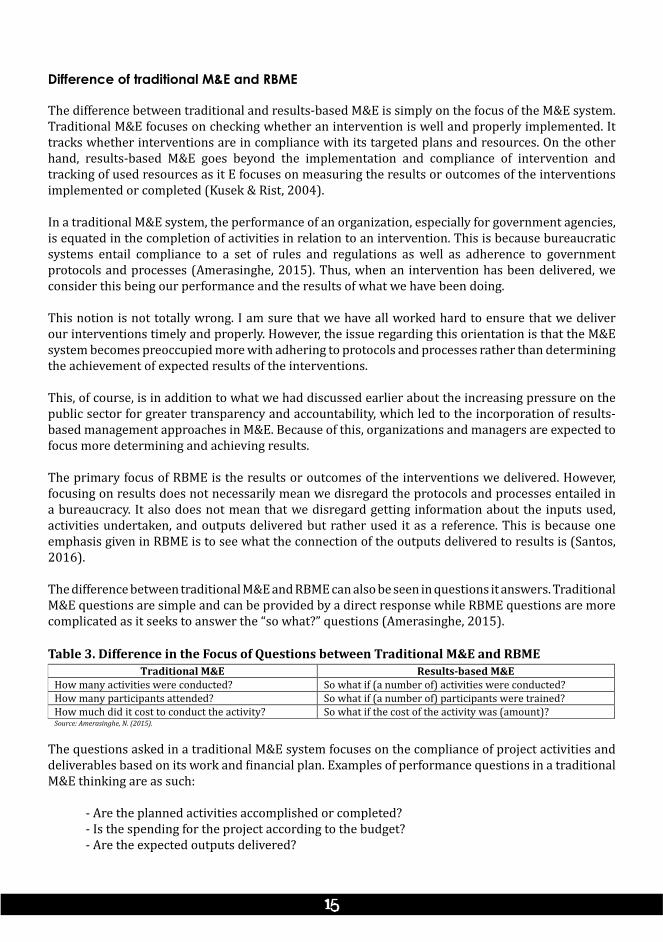
Table 3. Difference in the Focus of Questions between Traditional M&E and RBMETraditional M&E Results-based M&E
How many activities were conducted? So what if (a number of) activities were conducted? How many participants attended? So what if (a number of) participants were trained? How much did it cost to conduct the activity? So what if the cost of the activity was (amount)? Source: Amerasinghe, N. (2015).
The questions asked in a traditional M&E system focuses on the compliance of project activities and deliverables based on its work and financial plan. Examples of performance questions in a traditional M&E thinking are as such:
- Are the planned activities accomplished or completed? - Is the spending for the project according to the budget?- Are the expected outputs delivered?
The performance is measured by simply looking at what activities are conducted and how much of the budget was spent. There is little to none attention given on whether the project had an effect on its target beneficiaries or clients.
This is totally in contrast with the RBME system, in which the focus extends on the effect or intended change of the interventions to its target beneficiaries or clients. Example of performance questions in a RBME thinking are:
- What happened when the project activities were completed? - What were the effects of the project to the targeted beneficiaries or clients?- Were there improvement in the situation of the beneficiaries or clients?
Further, RBME is expressed in a change language which gives emphasis on the future condition of the clients. While, traditional M&E is expressed through action language emphasizing the point of view of the organization, or the provider of interventions (UNICEF, 2003).
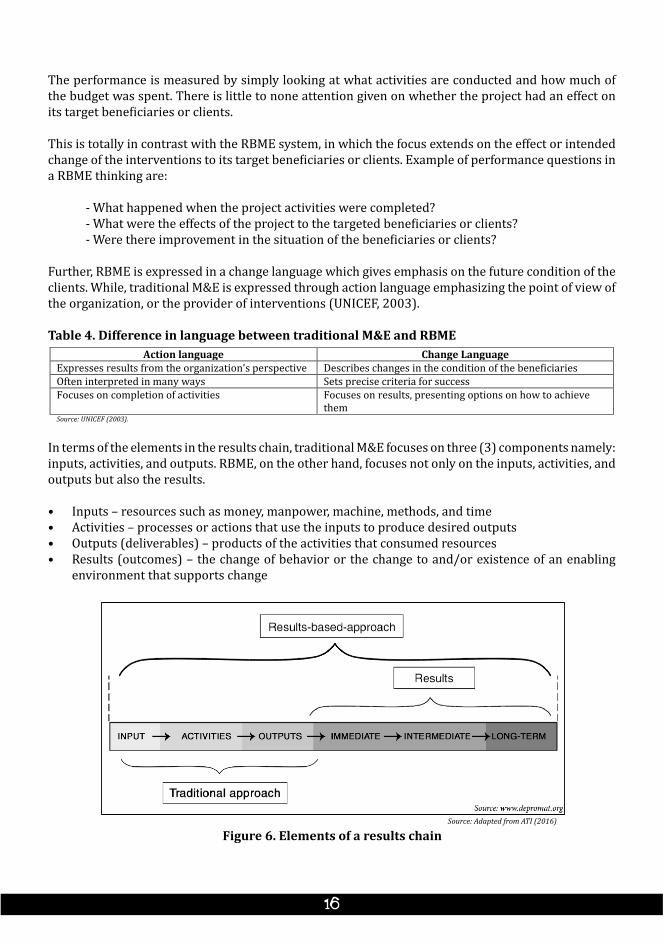
Table 4. Difference in language between traditional M&E and RBMEAction language Change Language
Expresses results from the organization’s perspective Describes changes in the condition of the beneficiaries Often interpreted in many ways Sets precise criteria for success Focuses on completion of activities Focuses on results, presenting options on how to achieve
them Source: UNICEF (2003).
In terms of the elements in the results chain, traditional M&E focuses on three (3) components namely: inputs, activities, and outputs. RBME, on the other hand, focuses not only on the inputs, activities, and outputs but also the results.
• Inputs – resources such as money, manpower, machine, methods, and time• Activities – processes or actions that use the inputs to produce desired outputs• Outputs (deliverables) – products of the activities that consumed resources• Results (outcomes) – the change of behavior or the change to and/or existence of an enabling
environment that supports change
Figure 6. Elements of a results chainSource: Adapted from ATI (2016)
Further, results can be categorized according to time essence: immediate, intermediate, and long-term results (ATI, 2016).
• Immediate (short-term) – results that are direct responses to interventions delivered• Intermediate (mid-term) – results that is expected to logically occur once one or more immediate
outcomes have been achieved• Long-term – results that are reasonably attributed to interventions delivered that are synonymous
to sectoral or societal goals
Looking at the results chain, we can see the cause and effect connection of inputs to the long-term result, or impact. Inputs are needed to undertake activities which in turn produces outputs. These outputs then generate short-term, mid-term, and long-term results.
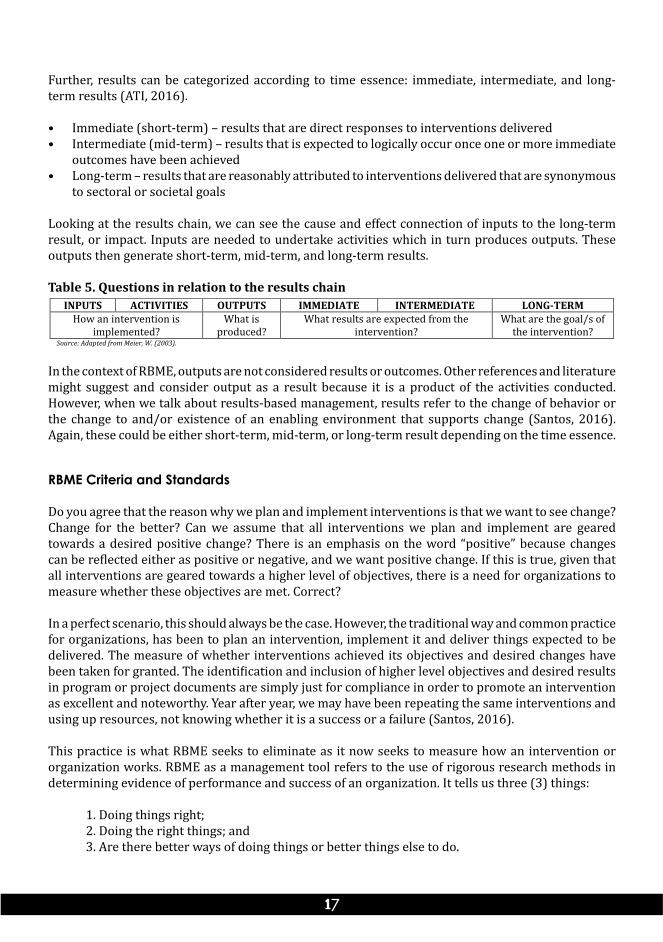
Table 5. Questions in relation to the results chainINPUTS ACTIVITIES OUTPUTS IMMEDIATE INTERMEDIATE LONG-TERM
How an intervention is implemented?
What is produced?
What results are expected from the intervention?
What are the goal/s of the intervention?
Source: Adapted from Meier, W. (2003).
In the context of RBME, outputs are not considered results or outcomes. Other references and literature might suggest and consider output as a result because it is a product of the activities conducted. However, when we talk about results-based management, results refer to the change of behavior or the change to and/or existence of an enabling environment that supports change (Santos, 2016). Again, these could be either short-term, mid-term, or long-term result depending on the time essence.
RBME Criteria and Standards
Do you agree that the reason why we plan and implement interventions is that we want to see change? Change for the better? Can we assume that all interventions we plan and implement are geared towards a desired positive change? There is an emphasis on the word “positive” because changes can be reflected either as positive or negative, and we want positive change. If this is true, given that all interventions are geared towards a higher level of objectives, there is a need for organizations to measure whether these objectives are met. Correct?
In a perfect scenario, this should always be the case. However, the traditional way and common practice for organizations, has been to plan an intervention, implement it and deliver things expected to be delivered. The measure of whether interventions achieved its objectives and desired changes have been taken for granted. The identification and inclusion of higher level objectives and desired results in program or project documents are simply just for compliance in order to promote an intervention as excellent and noteworthy. Year after year, we may have been repeating the same interventions and using up resources, not knowing whether it is a success or a failure (Santos, 2016).
This practice is what RBME seeks to eliminate as it now seeks to measure how an intervention or organization works. RBME as a management tool refers to the use of rigorous research methods in determining evidence of performance and success of an organization. It tells us three (3) things:
1. Doing things right;2. Doing the right things; and 3. Are there better ways of doing things or better things else to do.
Doing things right refers to the useful information gathered about the operations of an organization. These include the implementation and execution of interventions. Doing the right things refers to the useful information gathered on how organizations strategize and plan interventions. While are there better ways of doing things or better things else refers to the useful lessons learned applicable in both the operations and strategy development or planning (Santos, 2016). Basically, RBME changes the orientation on how organizations think, behave, and act – from the planning, implementation, and management of interventions.
Moreover, there are several benefits in using a results-based approach in M&E as mentioned by Kusek & Rist (2004) and Segone (2010), such as:
• Shows empirical evidence showing that desired objectives and/or goals are achieved;• Provides a view over time on the status of an intervention showing success more visibly and identifies failure more concretely;• Provides crucial information that can improve the performance of organizations aiding to management actions and decisions to correct the weakness• Promotes credibility and public confidence by reporting on the results of interventions imparting greater transparency and accountability; and • Supports better use of resources helping in the formulation and justification of budget requests.
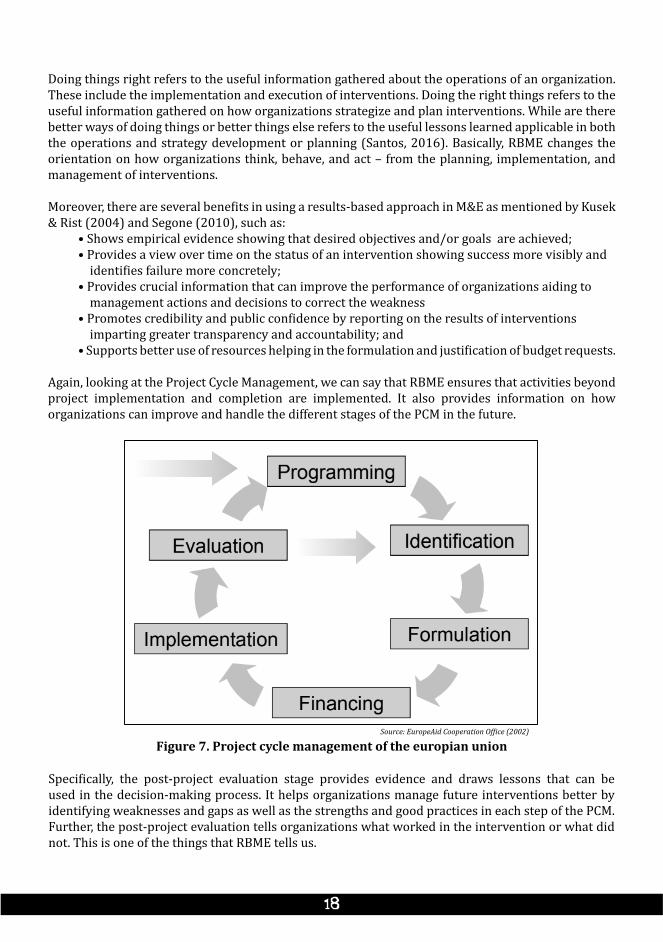
Again, looking at the Project Cycle Management, we can say that RBME ensures that activities beyond project implementation and completion are implemented. It also provides information on how organizations can improve and handle the different stages of the PCM in the future.
Figure 7. Project cycle management of the europian unionSource: EuropeAid Cooperation Office (2002)
Specifically, the post-project evaluation stage provides evidence and draws lessons that can be used in the decision-making process. It helps organizations manage future interventions better by identifying weaknesses and gaps as well as the strengths and good practices in each step of the PCM. Further, the post-project evaluation tells organizations what worked in the intervention or what did not. This is one of the things that RBME tells us.
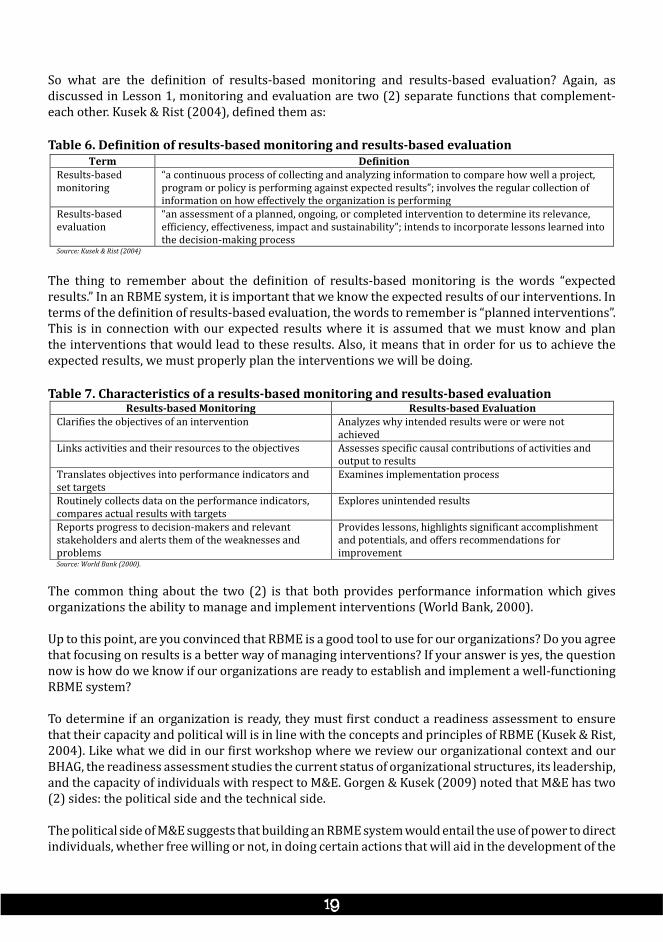
So what are the definition of results-based monitoring and results-based evaluation? Again, as discussed in Lesson 1, monitoring and evaluation are two (2) separate functions that complement- each other. Kusek & Rist (2004), defined them as:
Table 6. Definition of results-based monitoring and results-based evaluationTerm Definition
Results-based monitoring
“a continuous process of collecting and analyzing information to compare how well a project, program or policy is performing against expected results”; involves the regular collection of information on how effectively the organization is performing
Results-based evaluation
“an assessment of a planned, ongoing, or completed intervention to determine its relevance, efficiency, effectiveness, impact and sustainability”; intends to incorporate lessons learned into the decision-making process
Source: Kusek & Rist (2004)
The thing to remember about the definition of results-based monitoring is the words “expected results.” In an RBME system, it is important that we know the expected results of our interventions. In terms of the definition of results-based evaluation, the words to remember is “planned interventions”. This is in connection with our expected results where it is assumed that we must know and plan the interventions that would lead to these results. Also, it means that in order for us to achieve the expected results, we must properly plan the interventions we will be doing.
Table 7. Characteristics of a results-based monitoring and results-based evaluationResults-based Monitoring Results-based Evaluation
Clarifies the objectives of an intervention Analyzes why intended results were or were not achieved
Links activities and their resources to the objectives Assesses specific causal contributions of activities and output to results
Translates objectives into performance indicators and set targets
Examines implementation process
Routinely collects data on the performance indicators, compares actual results with targets
Explores unintended results
Reports progress to decision-makers and relevant stakeholders and alerts them of the weaknesses and problems
Provides lessons, highlights significant accomplishment and potentials, and offers recommendations for improvement
Source: World Bank (2000).
The common thing about the two (2) is that both provides performance information which gives organizations the ability to manage and implement interventions (World Bank, 2000).
Up to this point, are you convinced that RBME is a good tool to use for our organizations? Do you agree that focusing on results is a better way of managing interventions? If your answer is yes, the question now is how do we know if our organizations are ready to establish and implement a well-functioning RBME system?
To determine if an organization is ready, they must first conduct a readiness assessment to ensure that their capacity and political will is in line with the concepts and principles of RBME (Kusek & Rist, 2004). Like what we did in our first workshop where we review our organizational context and our BHAG, the readiness assessment studies the current status of organizational structures, its leadership, and the capacity of individuals with respect to M&E. Gorgen & Kusek (2009) noted that M&E has two (2) sides: the political side and the technical side.
The political side of M&E suggests that building an RBME system would entail the use of power to direct individuals, whether free willing or not, in doing certain actions that will aid in the development of the
RBME system. This includes the involvement of certain individuals in the processes and mechanisms related to the RBME system which can affect the dynamics and relationships of the organization.
The political will and the use of power by those in high positions play a key role in ensuring that an RBME system will push through. This is regardless the disagreement and opposition of some individuals and groups.
The technical side, on the other hand, refers to the capacity and skills needed by the organization in order to properly implement an RBME system. Gorgens & Kusek (2009) noted 12 technical components in order to have a functional M&E system which are:
1. Structure and organizational alignment for M&E systems2. Human capacity for M&E systems3. M&E partnerships4. M&E plans5. Costed M&E work plans6. Advocacy, communication, and culture for M&E systems7. Routine monitoring8. Periodic surveys9. Databases useful to M&E systems10. Supportive supervision and data auditing11. Evaluation and research12. Using the information to improve results
Gorgens & Kusek (2009) suggests that when organizations have these components, it means that a functional M&E system that captures results is present.
Moreover, there is a growing demand for M&E professionals as sectors are slowly recognizing its importance. However, there is a limited number of individuals with adequate understanding and skills on M&E. This means continuous capacity building in M&E is needed (Gorgens & Kuseks, 2009). Hence, training like the one we have is necessary so that we can spread the awareness and knowledge about M&E.
Furthermore, in M&E, one thing we should know is that it must follow a participatory process. Relevant stakeholders must be involved in the key stages of the intervention’s lifecycle such as the designing, planning, implementation, and the M&E of the intervention. This is to give the relevant stakeholders ownership and accountability in making sure that the intervention delivers intended outputs and results. This also ensures that different perspectives are discussed and covered in the M&E system we are trying to build.
Theory of Change (ToC)
One of the important terms we must remember when we talked about RBME is the Theory of Change (ToC). ToC is the link between the outputs delivered by an organization to its desired results. It is also called the logic of intervention because it demonstrates the causal pathway into how interventions are transformed towards achieving the desired change (ATI, 2016).
Most evaluation practitioners consider the Theory of Change as the heart of evaluation (Santos, 2016). It is simply the concept of how change happens toward achievement of the organizational goal. Thus,
organizations become more conscious of achieving their desired change scenarios or results. The concept of theory of change came from the progress and evolution of theories under the field of evaluation. Although there isn’t a clear timeline on where the term “theory of change” started, evaluation practitioners such as Huey Chen, Peter Rossi, Michael Patton, and Carol Weiss have used the term in their respective undertakings and publications. However, it was Carol Weiss who popularized the term in the mid-90s.
Carol Weiss (1995) noted that there was an issue regarding the difficulty of evaluating interventions because of the unfamiliarity or unawareness of stakeholders on how the change process will occur. This also included the lack of emphasis given to the initial results (short-term and mid-term) of interventions, even though, these results are a precursor to the attainment of long-term results or the objectives/goals of the intervention.
Because of this, she defined the theory of change as a “way to describe and explain the connection of the activities and outputs to the short-term and midterm results which further leads to the long-term results or the objectives/goals of the intervention”. It is “a theory of how and why an initiative works” (Weiss, 1995).
However, as a disclaimer, it should be noted that in practice, there are other terminologies and school of thought being used to describe the Theory of Change such as causal chain, causal logic, results in the framework, and results chain, among others. So we shouldn’t be confused when we hear these terms because it also refers to the concept of Theory of Change (Santos, 2016).
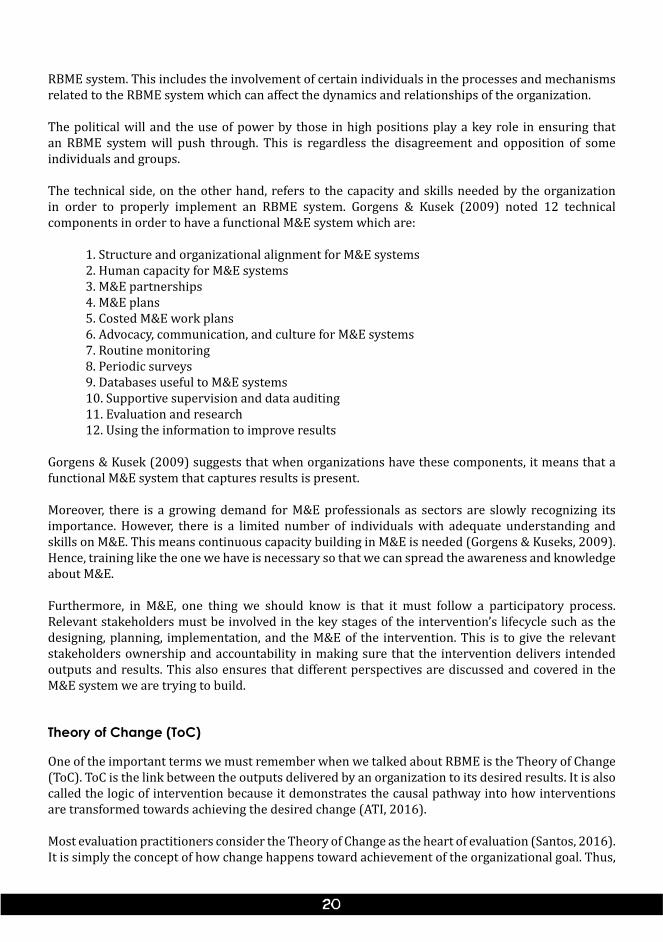
To determine the theory of change of an intervention, we should remember that all interventions are geared towards a targeted change that positively affects our target clients or beneficiaries. This targeted change is the basis of why we conduct the interventions. From this, we assume that all interventions have a projectile pathway going to its desired state or targeted changed.
From the start of an intervention to its end, there are many different possible trajectories that could lead to our desired state. Moreso, there are some trajectories that might not even reach our targeted change. However, there is always the best logical pathway going to our desired targets. It is the optimal way towards our desired results and that is the “Theory of Change” of the intervention (Santos, 2016). This pathway if traversed would mean that the intervention is sound and is on the right track towards the desired target.
Figure 8. Projectile pathways of interventionsSource: Adopted from Santos (2016)
The purpose of knowing the Theory of Change of an intervention is explained in the phrase adapted from Lewis Caroll’s Alice in Wonderland which states “if you don’t know where you’re going, any road will lead you there.” How can you achieve something that you do not know you want to achieve? This phrase suggests that the purpose of the Theory of Change is to guide organizations towards its desired goals. It is a representation of how an organization or intervention moves to achieve its desired target or change.
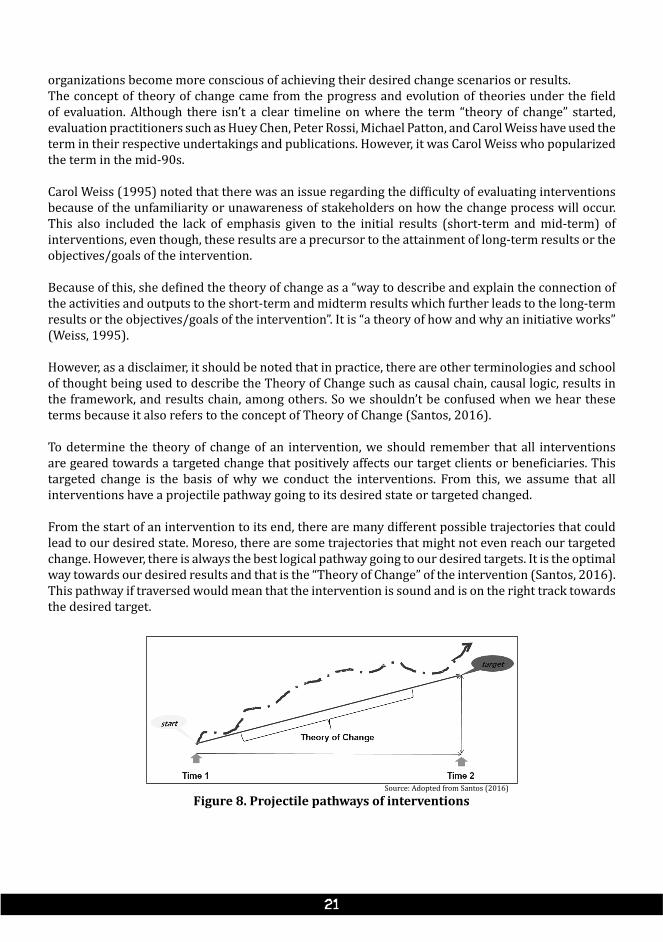
ToC is considered a phenomenon which explains the logic of interventions (ATI, 2016). It is translated into a knowledge model wherein it becomes the Theory of Change model. The ToC model details how an organization or intervention is expected to lead to the results showing each element of the results chain from inputs to the results (Santos, 2016). Specifically, it shows how inputs ‘consumed’ by activities produces outputs which then leads to the desired results.
Figure 9. Elements of a results chainSource: ATI (2016)
Now, the question is how a ToC model is created? First, we should know that the ToC model is based on key underlying assumptions of how the desired change will be achieved. Second, the ToC model includes the elements of a results chain, which are: input, activities, outputs, and results. Third, the ToC model depicts how the process of change happens in an organization or intervention.
This is done through proper articulation and arrangement of result statements which will serve as landmarks toward the achievement of the identified goal of the organization or the intervention. In general, it provides a way of modeling the causal pathway to the desired change.
Again, it should be emphasized that when creating the ToC model, all relevant stakeholders must be involved in the process to ensure that other perspectives are heard and included so that cooperation, commitment, and consensus from each stakeholder involved will be apparent.
As mentioned earlier, in creating the ToC model, we should give focus on the soundness and logic of the result chain elements. To check this, we used the if-then relationship among the elements. The soundness and logic of the ToC model must be ensured noting that the results statements should have a consistent and coherent articulation. This is because inconsistency and contradiction kill the logic of the ToC model leading to confusion and misunderstanding.
When this happens, we will probably have different interpretations on how to achieve our results and we are not following the optimal pathway. Thus, to ensure that the ToC model being created is sound and logical, the following guide questions (Cousin, 2007) should be answered:
• Is the model an accurate depiction of the organization or intervention?• Are the elements of the results chain well defined?
• Are there any gaps in the logical chain of each element?• Are the relationship of each element possible and consistent?• Is it realistic to assume that stated goals will be attained in a meaningful manner?
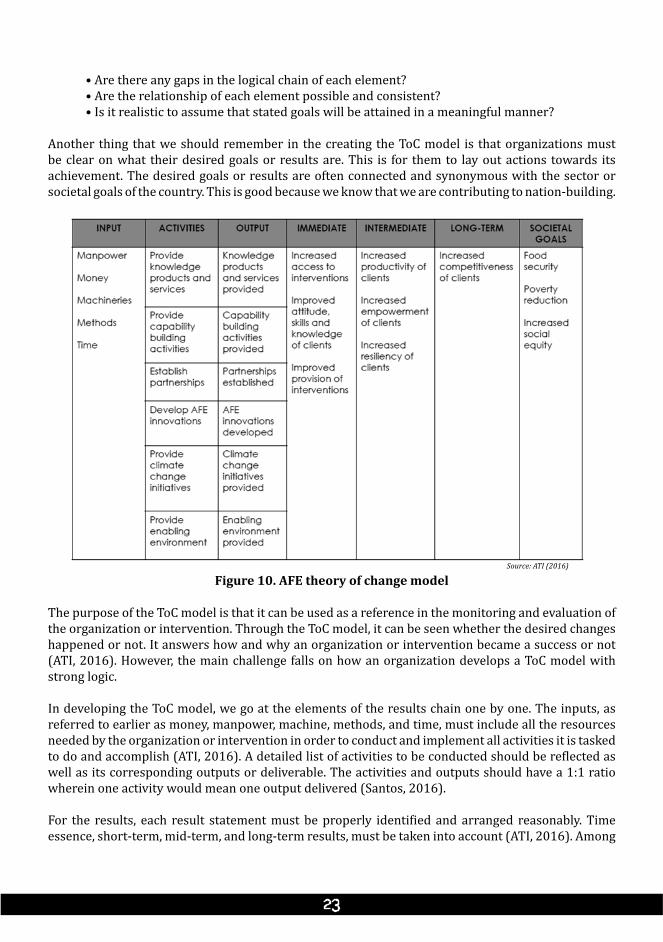
Another thing that we should remember in the creating the ToC model is that organizations must be clear on what their desired goals or results are. This is for them to lay out actions towards its achievement. The desired goals or results are often connected and synonymous with the sector or societal goals of the country. This is good because we know that we are contributing to nation-building.
Figure 10. AFE theory of change modelSource: ATI (2016)
The purpose of the ToC model is that it can be used as a reference in the monitoring and evaluation of the organization or intervention. Through the ToC model, it can be seen whether the desired changes happened or not. It answers how and why an organization or intervention became a success or not (ATI, 2016). However, the main challenge falls on how an organization develops a ToC model with strong logic.
In developing the ToC model, we go at the elements of the results chain one by one. The inputs, as referred to earlier as money, manpower, machine, methods, and time, must include all the resources needed by the organization or intervention in order to conduct and implement all activities it is tasked to do and accomplish (ATI, 2016). A detailed list of activities to be conducted should be reflected as well as its corresponding outputs or deliverable. The activities and outputs should have a 1:1 ratio wherein one activity would mean one output delivered (Santos, 2016).
For the results, each result statement must be properly identified and arranged reasonably. Time essence, short-term, mid-term, and long-term results, must be taken into account (ATI, 2016). Among
the common change processes articulated as result statements include the changes in the knowledge level, skills, and practices, attitude, awareness and values of clients or beneficiaries (UNDG, 2011).
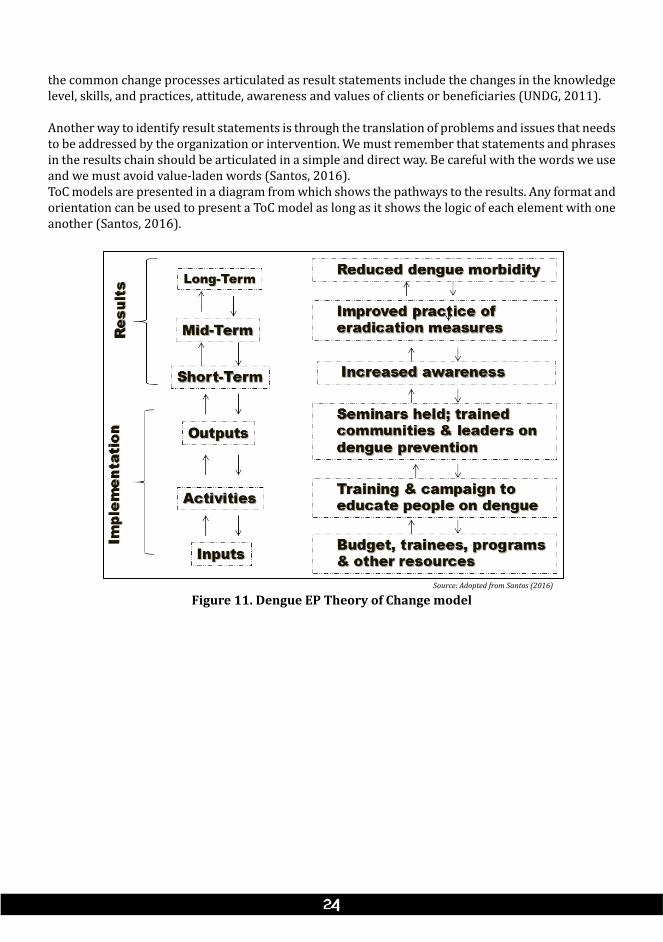
Another way to identify result statements is through the translation of problems and issues that needs to be addressed by the organization or intervention. We must remember that statements and phrases in the results chain should be articulated in a simple and direct way. Be careful with the words we use and we must avoid value-laden words (Santos, 2016). ToC models are presented in a diagram from which shows the pathways to the results. Any format and orientation can be used to present a ToC model as long as it shows the logic of each element with one another (Santos, 2016).
Figure 11. Dengue EP Theory of Change modelSource: Adopted from Santos (2016)
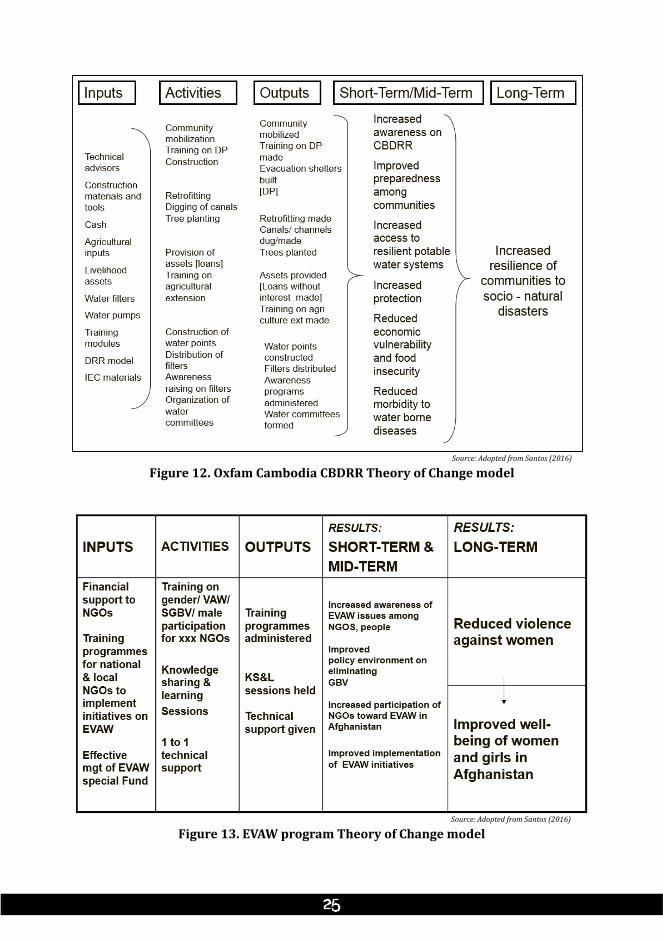
Figure 12. Oxfam Cambodia CBDRR Theory of Change modelSource: Adopted from Santos (2016)
Figure 13. EVAW program Theory of Change modelSource: Adopted from Santos (2016)
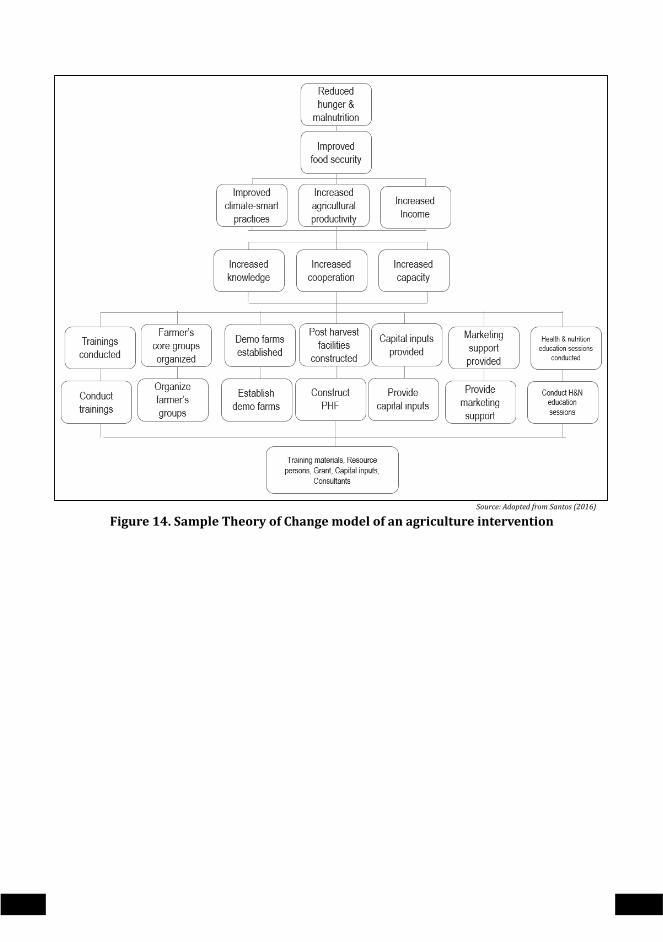
Figure 14. Sample Theory of Change model of an agriculture interventionSource: Adopted from Santos (2016)
The ToC model is an important tool to operationalize the RBME system as it serves as a guide in the identification of indicators that would measure whether each result statement was achieved or not (Santos, 2016). In order to see whether the result statements identified are correct and will be achievable, disaggregation is needed to answer the following questions (Kusek & Rist, 2004):
- For whom? - How much? - Where? - By when?
When we have answered these questions then we could say that the result statements are more or less sound. Further, these questions can be used in identifying indicators per results statements.
The results indicators provide a direct reflection and translation of the result statements (ATI, 2016). These indicators give a specific numerical measurement that tracks progress, or the lack thereof, towards achieving the results. This is the reason why we articulate result statements in a simple way and free from any value-laden words. It is the indicators that provide value to each result statements.
Identification of Results Indicators
WORKSHOP 2Title: “Create A ToC model”Time Allotment: 4 hoursMaterials Needed: Laptop, projector
Workshop Mechanics:1. Tell the participants to choose an intervention that their organizations are currently doing. Each group must decide
on what intervention that they will create a ToC model. 2. Show them a slide of the instructions for the workshop saying:
“Formulate a Theory of Change model of the intervention your group selected. Identify the inputs to be used, activities to be conducted, and outputs to be delivered. Identify and articulate the results statements that the intervention intends to produced”
3. Inform them that they will have to formulate a ToC model for their selected intervention. Give them 3 hours to do the workshop.
4. Have each group present their outputs one by one. Give them 10 minutes each to present their workshop output.5. Encourage the participants to provide comments and observations regarding the group outputs.6. Provide comments and additional insights about the formulation of a ToC model.
Processing based on workshop outputs:1. Can you say that formulating a ToC model is beneficial for organizations? Why? (Possible answer: Yes, because it
provides a clear direction for the organization and/or interventions)2. Does having a ToC model mean we can measure the results of our intervention? (Possible answer: No)3. How do we used the ToC model in measuring the achievement of results? (Possible answer: It is used as reference
for us to identify results indicators)
Key Concepts:• The ToC model is a reference for the identification of indicators that will help determine the achievement of results
or not.• Results statements must show a change language and must not include value-laden words. It is the role of indicators
to give value to the results statements.
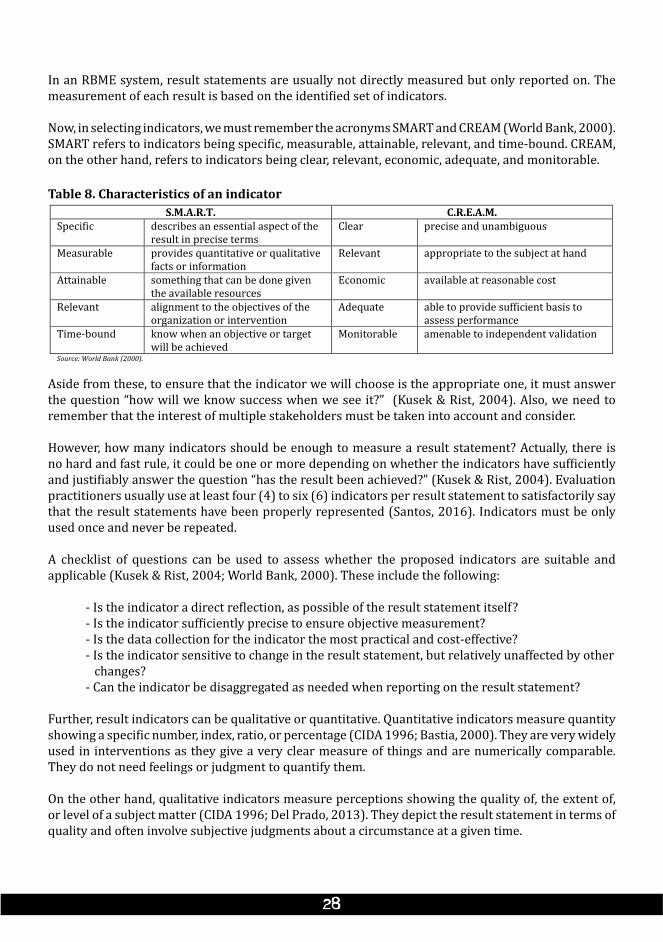
Table 8. Characteristics of an indicatorS.M.A.R.T. C.R.E.A.M.
Specific describes an essential aspect of the result in precise terms
Clear precise and unambiguous
Measurable provides quantitative or qualitative facts or information
Relevant appropriate to the subject at hand
Attainable something that can be done given the available resources
Economic available at reasonable cost
Relevant alignment to the objectives of the organization or intervention
Adequate able to provide sufficient basis to assess performance
Time-bound know when an objective or target will be achieved
Monitorable amenable to independent validation
Source: World Bank (2000).
Aside from these, to ensure that the indicator we will choose is the appropriate one, it must answer the question “how will we know success when we see it?” (Kusek & Rist, 2004). Also, we need to remember that the interest of multiple stakeholders must be taken into account and consider.
However, how many indicators should be enough to measure a result statement? Actually, there is no hard and fast rule, it could be one or more depending on whether the indicators have sufficiently and justifiably answer the question “has the result been achieved?” (Kusek & Rist, 2004). Evaluation practitioners usually use at least four (4) to six (6) indicators per result statement to satisfactorily say that the result statements have been properly represented (Santos, 2016). Indicators must be only used once and never be repeated.
A checklist of questions can be used to assess whether the proposed indicators are suitable and applicable (Kusek & Rist, 2004; World Bank, 2000). These include the following:
- Is the indicator a direct reflection, as possible of the result statement itself?- Is the indicator sufficiently precise to ensure objective measurement?- Is the data collection for the indicator the most practical and cost-effective?- Is the indicator sensitive to change in the result statement, but relatively unaffected by other changes?- Can the indicator be disaggregated as needed when reporting on the result statement?
Further, result indicators can be qualitative or quantitative. Quantitative indicators measure quantity showing a specific number, index, ratio, or percentage (CIDA 1996; Bastia, 2000). They are very widely used in interventions as they give a very clear measure of things and are numerically comparable. They do not need feelings or judgment to quantify them.
On the other hand, qualitative indicators measure perceptions showing the quality of, the extent of, or level of a subject matter (CIDA 1996; Del Prado, 2013). They depict the result statement in terms of quality and often involve subjective judgments about a circumstance at a given time.
In an RBME system, result statements are usually not directly measured but only reported on. The measurement of each result is based on the identified set of indicators.
Now, in selecting indicators, we must remember the acronyms SMART and CREAM (World Bank, 2000). SMART refers to indicators being specific, measurable, attainable, relevant, and time-bound. CREAM, on the other hand, refers to indicators being clear, relevant, economic, adequate, and monitorable.
Both indicators have their respective values and their respective importance. Qualitative indicators are often presented as being very close to the reality of the different stakeholders while quantitative data is presented as objective and distanced. However, qualitative indicators must be used with caution.
Thus, a combination of two (2) is preferred because it strengthens the information to be gathered and balances out the weaknesses of the other. Often, the qualitative data helps explain and explore the quantitative data, or vice-versa (Creswell, 2014). It verifies or rejects the data gathered from the other.
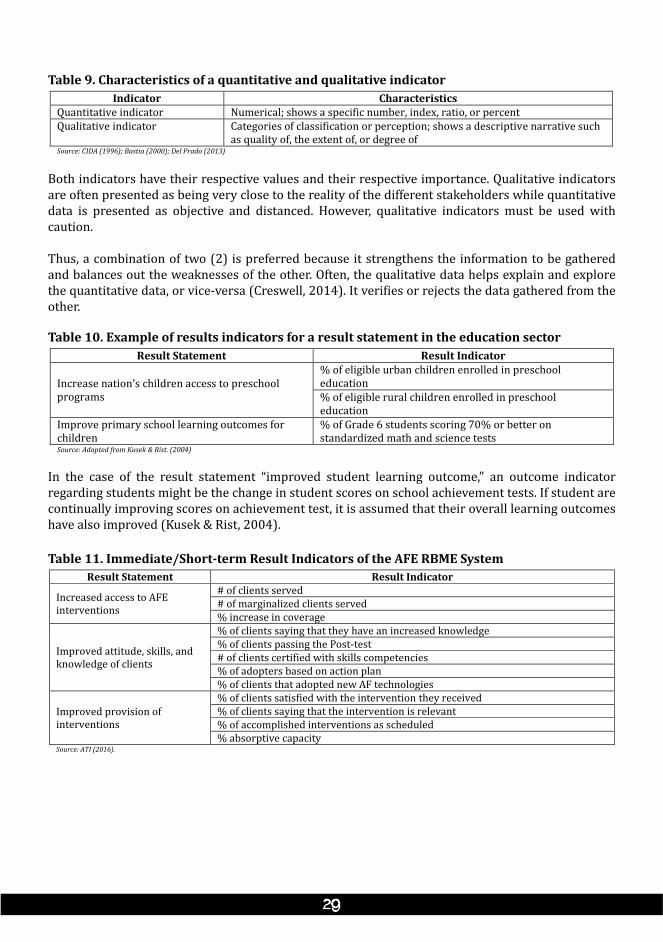
Table 10. Example of results indicators for a result statement in the education sectorResult Statement Result Indicator
Increase nation’s children access to preschool programs
% of eligible urban children enrolled in preschool education % of eligible rural children enrolled in preschool education
Improve primary school learning outcomes for children
% of Grade 6 students scoring 70% or better on standardized math and science tests
Source: Adapted from Kusek & Rist. (2004)
In the case of the result statement “improved student learning outcome,” an outcome indicator regarding students might be the change in student scores on school achievement tests. If student are continually improving scores on achievement test, it is assumed that their overall learning outcomes have also improved (Kusek & Rist, 2004).
Table 11. Immediate/Short-term Result Indicators of the AFE RBME SystemResult Statement Result Indicator
Increased access to AFE interventions
# of clients served # of marginalized clients served % increase in coverage
Improved attitude, skills, and knowledge of clients
% of clients saying that they have an increased knowledge % of clients passing the Post-test # of clients certified with skills competencies % of adopters based on action plan % of clients that adopted new AF technologies
Improved provision of interventions
% of clients satisfied with the intervention they received % of clients saying that the intervention is relevant % of accomplished interventions as scheduled % absorptive capacity
Source: ATI (2016).
Table 9. Characteristics of a quantitative and qualitative indicatorIndicator Characteristics
Quantitative indicator Numerical; shows a specific number, index, ratio, or percent Qualitative indicator Categories of classification or perception; shows a descriptive narrative such
as quality of, the extent of, or degree of Source: CIDA (1996); Bastia (2000); Del Prado (2013)
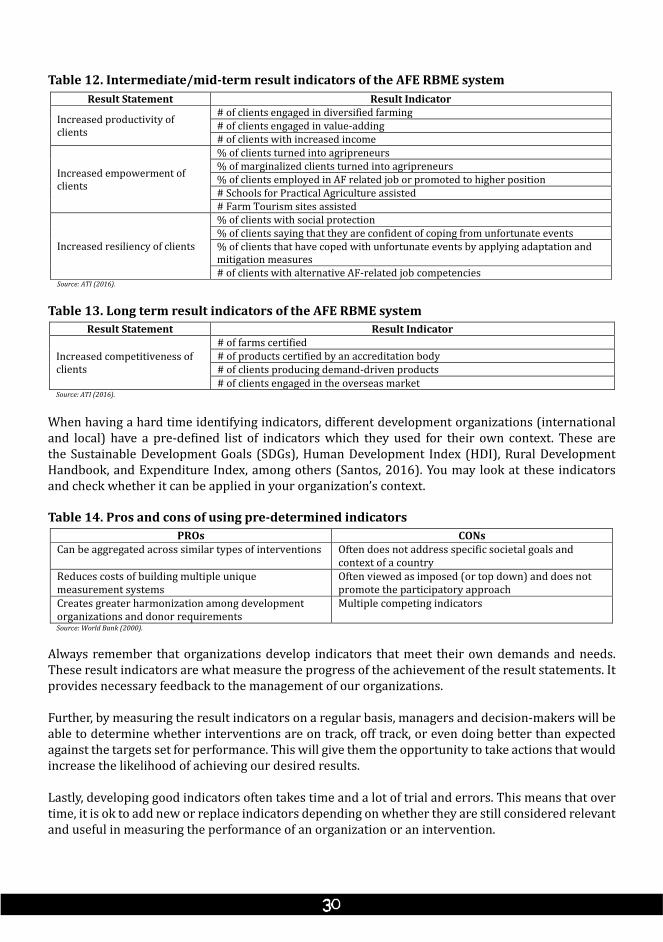
Table 13. Long term result indicators of the AFE RBME systemResult Statement Result Indicator
Increased competitiveness of clients
# of farms certified # of products certified by an accreditation body # of clients producing demand-driven products # of clients engaged in the overseas market
Source: ATI (2016).
When having a hard time identifying indicators, different development organizations (international and local) have a pre-defined list of indicators which they used for their own context. These are the Sustainable Development Goals (SDGs), Human Development Index (HDI), Rural Development Handbook, and Expenditure Index, among others (Santos, 2016). You may look at these indicators and check whether it can be applied in your organization’s context.
Table 14. Pros and cons of using pre-determined indicatorsPROs CONs
Can be aggregated across similar types of interventions Often does not address specific societal goals and context of a country
Reduces costs of building multiple unique measurement systems
Often viewed as imposed (or top down) and does not promote the participatory approach
Creates greater harmonization among development organizations and donor requirements
Multiple competing indicators
Source: World Bank (2000).
Always remember that organizations develop indicators that meet their own demands and needs. These result indicators are what measure the progress of the achievement of the result statements. It provides necessary feedback to the management of our organizations.
Further, by measuring the result indicators on a regular basis, managers and decision-makers will be able to determine whether interventions are on track, off track, or even doing better than expected against the targets set for performance. This will give them the opportunity to take actions that would increase the likelihood of achieving our desired results.
Lastly, developing good indicators often takes time and a lot of trial and errors. This means that over time, it is ok to add new or replace indicators depending on whether they are still considered relevant and useful in measuring the performance of an organization or an intervention.
Table 12. Intermediate/mid-term result indicators of the AFE RBME systemResult Statement Result Indicator
Increased productivity of clients
# of clients engaged in diversified farming # of clients engaged in value-adding # of clients with increased income
Increased empowerment of clients
% of clients turned into agripreneurs % of marginalized clients turned into agripreneurs % of clients employed in AF related job or promoted to higher position # Schools for Practical Agriculture assisted # Farm Tourism sites assisted
Increased resiliency of clients
% of clients with social protection % of clients saying that they are confident of coping from unfortunate events % of clients that have coped with unfortunate events by applying adaptation and mitigation measures # of clients with alternative AF-related job competencies
Source: ATI (2016).
WORKSHOP 3Title: “Identify Your Result Indicators”Time Allotment: 4 hoursMaterials Needed: Laptop, projector
Workshop Mechanics:1. Show the participants a slide of the instructions for the workshop saying:
“Review your ToC models. Identify the Results Indicators for each of the Results Statements in your group’s Theory of Change model.”
2. Inform them that they will revise their ToC model based on the comments and inputs during Workshop 2 and identify the appropriate results indicators for the results statements. Give them 3 hours to do the workshop.
3. Have each group present their outputs one by one. Give them 10 minutes each to present their workshop output.4. Encourage the participants to provide comments and observations regarding the group outputs.5. Provide comments and additional insights about the identification of results indicators.
Processing based on workshop outputs:1. Does having our result indicators mean that we will be able to achieve our desired results? (Possible answer:
No, because we first need to know what our current situation is, we set values we want in the future, then regularly measure if we had achieved it.)
2. How do you think we can bring value to our result indicators? (Possible answer: We will have to identify when, where, and how are we going to get the value for each indicator.)
Key Concepts:• The indicators are the direct reflection and translation of the result statements stated in the Theory of Change
model.• Results indicators measure whether the result statements were achieved or not.
RBME takes on a perspective that searches for real results that came from our interventions and helps answer the “so what” question. It is different from the traditional M&E which only focusing on capturing the inputs used, activities conducted and outputs delivered by our organizations.
The RBME system includes the Theory of Change (ToC). It is a concept that connects the outputs we delivered to the identified results that we want to achieve. It is also called the logic of intervention because it shows the causal arrangement of how our interventions are related to achieving our desired goals. The ToC is translated into a model which shows the logical arrangement of different result depending on the possible time that we can achieve it – immediate/short-term, intermediate/mid-term, and long-term. This is to acknowledge that some results can be seen immediately while others take time to be observed.
Further, to make the ToC model operational, each articulated result statement must be represented by measurable indicators. These indicators are the direct translation of the identified results that shows either a quantitative or qualitative measure of performance. These are what we measure to determine whether an identified result has been achieved or not.
SUMMARY
ENDERTitle: “Guess My Weight?”Time Allotment: 20 minutesMaterials Needed: Laptop, projector, weighing scale
Procedure:1. Look for two (2) participants that would volunteer to have their weight taken. (Ensure that the participants are
willing to have their weight taken and that a weighing scale is available.)2. Let the participants guess the weight of the two participants.3. Ask the volunteer whether they would prefer to lose or gain weight.4. Connect the activity to the importance of using the correct tools in measuring and measuring whether desired
changes were achieved or not.
Processing:1. Is it possible to determine the weight of our volunteers without the weighing scale? (Possible answer: Maybe, there is
a small probably that we can guess their weight. However, we can never be sure if it is correct or not.)2. Do you agree that having the correct tool is needed to determine the actual value for their weight? (Possible answer:
Yes)
Key Concepts:• The way on how we put value for each of the result indicators must be properly identified.• The correct value must be determined in order to properly set what change we want.
Statement to End of lesson:We learned in this lesson that our approach to M&E must be focused on achieving the desired results of our interventions. However, this approach does not mean that we disregard checking the delivering of outputs. Also, in order to measure the achievement these results, we learned to identify indicators that are direct reflection of them. We also said, in this activity that there is a need for us to clearly know how are we going to put value for each indicator. This is what we will focused on for the next lesson.
SELF-ASSESSMENT QUESTIONS (SAQs)
1. RBME answer the ___________ questions? (“So what?” questions)2. True or False: RBME disregards output level elements as it focuses more on results. (False)3. What are the classification of results? (Immediate, intermediate, and long-term)4. What does the acronym CREAM mean? (Clear, Relevant, Economic, Adequate, Monitorable)5. It is considered to be at the heart of evaluation (Theory of Change)
SUPPLEMENTARY READINGS
ATI. (2016). Excellence and Accountability in Extension: Technical Guidance Notes in the Monitoring and Evaluation of Agriculture and Fisheries Extension Program Performance. Agricultural Training Institute – Policy and Planning Division. Quezon City, Philippines.Hatry, H.P. (2014). Transforming Performance Measurement for the 21st Century. The Urban Institute. Washington, D.C.Kusek, J.Z. & Rist, R.C. (2004). Ten Steps to a Results-Based Monitoring and Evaluation System. The World Bank. Washington, D.C.
Lesson 3
Designing the RBME Performance Framework
Designing the RBME Performance FrameworkThis lesson seeks to provide an understanding on the development of the RBME performance framework which will help determine the baseline values and monitor the achievement of the target values set.
LESSON OBJECTIVES
At the end of this lesson, participants will be able to identify prepare a sample RBME performance framework.
Specifically, they should be able to:1. Identify the components of the RBME performance framework;2. Explain the process of getting baseline data for the result indicators; 3. Explain the process of setting a target value for the result indicators; and 4. Explain the concept of monitoring for results.
Time Allotment: 8 hoursMethodologies: Lecture-Discussion and WorkshopTools to Use: Laptop, projector
OPENERTitle: Think of This: Is Baseline Necessary?Time Allotment: 20 minutesMaterials Needed: Laptop, projector, dart board, darts
Procedure:1. Show the participants a PowerPoint slide that displays the question “Are baseline data necessary?”2. Ask them to think about the question and relate it to their personal experiences and involvement in doing policies,
programs, and projects.3. Select three (3) participants to share their thoughts.4. Provide additional insights and relate it to the lesson to be discussed.
Processing:1. Do you think baseline data is necessary before we start an intervention? (Possible answer: Yes.)2. Do you believe all programs and projects have baseline information? (Possible answer: No.)3. Do interventions proceed even without baseline information? (Possible answer: Yes.)4. If interventions proceed even without baseline information, how do we know whether desired results of the
interventions were achieved? (Possible answers: You can’t; through impact evaluation studies, however, findings would be limited only for the available information gathered.)
Key Concepts:• Baseline information tells us the current situation before we start an intervention.• Baseline information is necessary so that we can properly set our desired targets.• Baseline information serves as a benchmark in comparing whether progress in achieving desired targets are made.
Connecting/Transition Statement to the Lesson:Applying the RBME principles, we all agree that having baseline information is not only necessary but a requisite for us to set targets for the changes we desired. Further, baseline helps us track down the progress on whether we are really getting the results we want. However, how do we get baseline information? How do we set doable targets? This is what we will try to answer in this lesson.
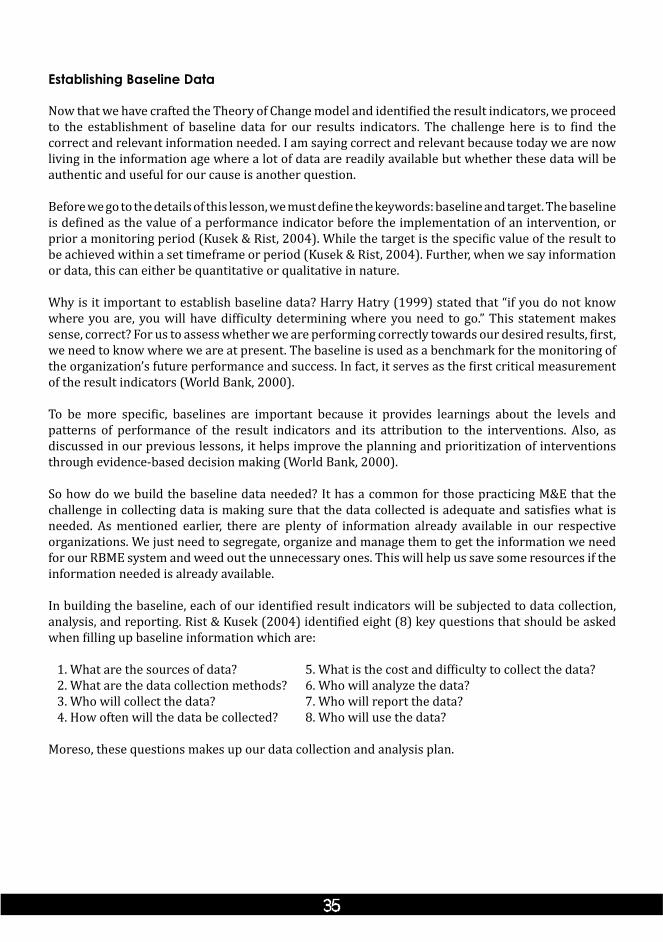
Establishing Baseline Data
Now that we have crafted the Theory of Change model and identified the result indicators, we proceed to the establishment of baseline data for our results indicators. The challenge here is to find the correct and relevant information needed. I am saying correct and relevant because today we are now living in the information age where a lot of data are readily available but whether these data will be authentic and useful for our cause is another question.
Before we go to the details of this lesson, we must define the keywords: baseline and target. The baseline is defined as the value of a performance indicator before the implementation of an intervention, or prior a monitoring period (Kusek & Rist, 2004). While the target is the specific value of the result to be achieved within a set timeframe or period (Kusek & Rist, 2004). Further, when we say information or data, this can either be quantitative or qualitative in nature.
Why is it important to establish baseline data? Harry Hatry (1999) stated that “if you do not know where you are, you will have difficulty determining where you need to go.” This statement makes sense, correct? For us to assess whether we are performing correctly towards our desired results, first, we need to know where we are at present. The baseline is used as a benchmark for the monitoring of the organization’s future performance and success. In fact, it serves as the first critical measurement of the result indicators (World Bank, 2000).
To be more specific, baselines are important because it provides learnings about the levels and patterns of performance of the result indicators and its attribution to the interventions. Also, as discussed in our previous lessons, it helps improve the planning and prioritization of interventions through evidence-based decision making (World Bank, 2000).
So how do we build the baseline data needed? It has a common for those practicing M&E that the challenge in collecting data is making sure that the data collected is adequate and satisfies what is needed. As mentioned earlier, there are plenty of information already available in our respective organizations. We just need to segregate, organize and manage them to get the information we need for our RBME system and weed out the unnecessary ones. This will help us save some resources if the information needed is already available.
In building the baseline, each of our identified result indicators will be subjected to data collection, analysis, and reporting. Rist & Kusek (2004) identified eight (8) key questions that should be asked when filling up baseline information which are:
1. What are the sources of data? 5. What is the cost and difficulty to collect the data? 2. What are the data collection methods? 6. Who will analyze the data? 3. Who will collect the data? 7. Who will report the data? 4. How often will the data be collected? 8. Who will use the data?
Moreso, these questions makes up our data collection and analysis plan.
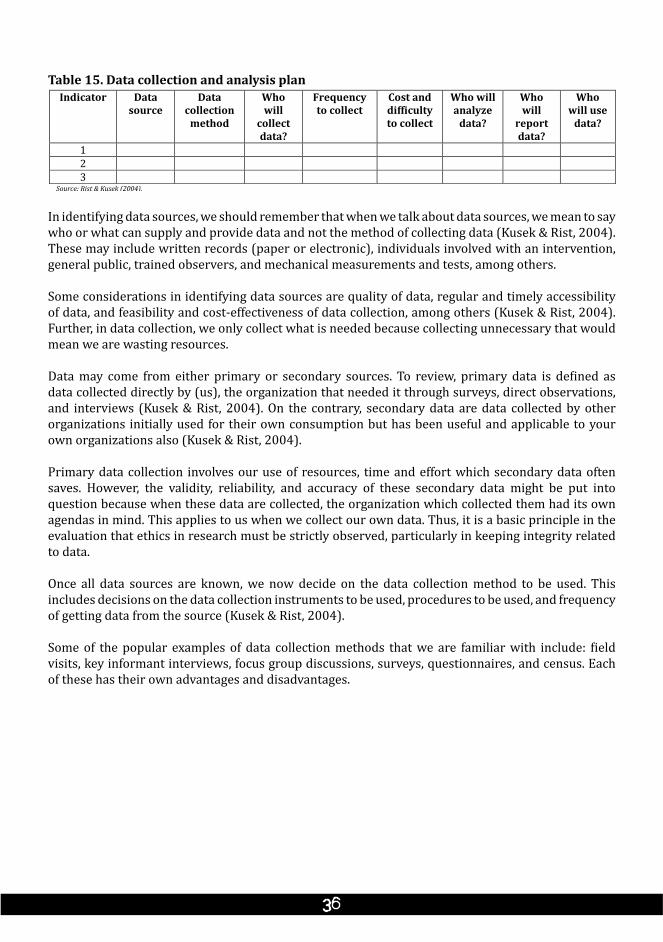
Table 15. Data collection and analysis planIndicator Data
source Data
collection method
Who will
collect data?
Frequency to collect
Cost and difficulty to collect
Who will analyze
data?
Who will
report data?
Who will use
data?
1 2 3
Source: Rist & Kusek (2004).
In identifying data sources, we should remember that when we talk about data sources, we mean to say who or what can supply and provide data and not the method of collecting data (Kusek & Rist, 2004). These may include written records (paper or electronic), individuals involved with an intervention, general public, trained observers, and mechanical measurements and tests, among others.
Some considerations in identifying data sources are quality of data, regular and timely accessibility of data, and feasibility and cost-effectiveness of data collection, among others (Kusek & Rist, 2004). Further, in data collection, we only collect what is needed because collecting unnecessary that would mean we are wasting resources.
Data may come from either primary or secondary sources. To review, primary data is defined as data collected directly by (us), the organization that needed it through surveys, direct observations, and interviews (Kusek & Rist, 2004). On the contrary, secondary data are data collected by other organizations initially used for their own consumption but has been useful and applicable to your own organizations also (Kusek & Rist, 2004).
Primary data collection involves our use of resources, time and effort which secondary data often saves. However, the validity, reliability, and accuracy of these secondary data might be put into question because when these data are collected, the organization which collected them had its own agendas in mind. This applies to us when we collect our own data. Thus, it is a basic principle in the evaluation that ethics in research must be strictly observed, particularly in keeping integrity related to data.
Once all data sources are known, we now decide on the data collection method to be used. This includes decisions on the data collection instruments to be used, procedures to be used, and frequency of getting data from the source (Kusek & Rist, 2004).
Some of the popular examples of data collection methods that we are familiar with include: field visits, key informant interviews, focus group discussions, surveys, questionnaires, and census. Each of these has their own advantages and disadvantages.
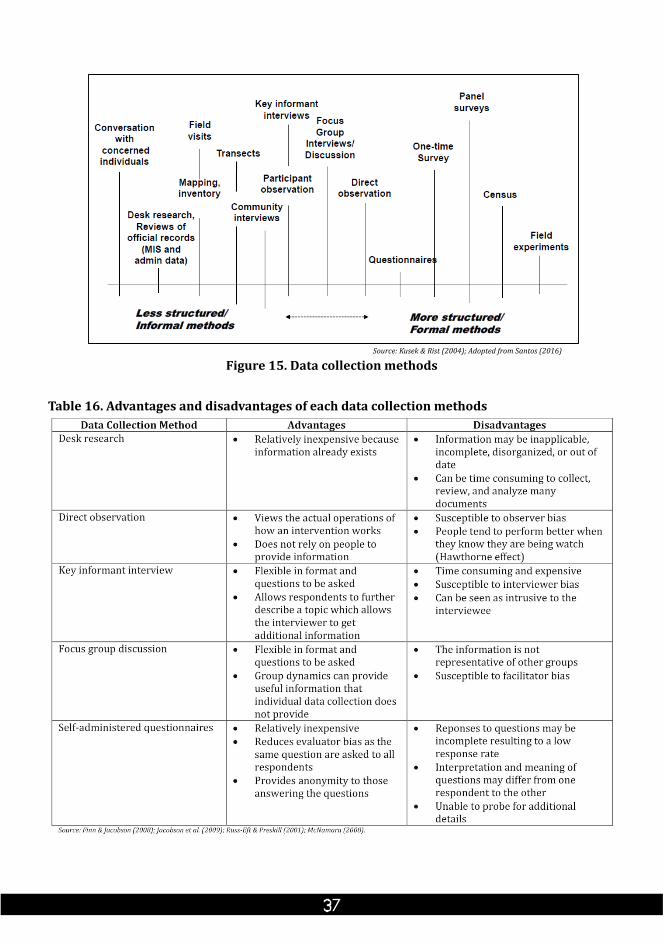
Figure 15. Data collection methodsSource: Kusek & Rist (2004); Adopted from Santos (2016)
Table 16. Advantages and disadvantages of each data collection methods
The main consideration in what data collection method can be used is again based on the organization’s available resources, access to information, needed information, and time constraints (Kusek & Rist, 2004).
Usually, a combination of any of the data collection methods is recommended because it strengthens the authenticity of the data to be collected. It could be preferable to use combinations that are less precise, a little unstructured, and inexpensive but not in a way that we compromise the quality and rigor of the data to be collected (Kusek & Rist, 2004). It is up to the organizations to determine what combinations of data collection methods will work best for them.
Also, we must note that choosing among these data collection methods will involve tradeoffs with respect to the cost, precision, credibility, and timeliness of the data to be collected. It is a given that methods that are more formal and structured tend to be more precise, costly and time consuming compared to the informal and less structured methods (Kusek & Rist, 2004).
The responsibility on who will capture the information needed depends on the stakeholders involved in the interventions. Often, it is assigned to the M&E unit of the organization where individuals have specific functions and roles assigned to them. Again, the consensus among partners and stakeholders on who will gather each information for our result indicators using the agreed data collection method is needed.
The frequency of data collection will also depend on the agreements made among partners and stakeholders involved in the interventions. It may occur regularly over short intervals, or less regularly such as semestral or annually (Kusek & Rist, 2004). The factors to consider in the frequency of data collection is again the budget allocation for data collection as well as the workload of those capturing the data (Kusek & Rist, 2004).
However, results do not happen overnight, thus, it is advisable that the interval of data collection be done on a yearly basis. Further, how we gathered baseline data must be the same way we gather succeeding information to determine progress. The analysis and reporting of the information gathered is usually done by the M&E unit of the organization or those who are in charge of the intervention such as project managers. The data analysis involves the interpretation of data which seeks to explain and describe the data to those who will use it (Kusek & Rist, 2004).
Prior to this, data processing which includes the encoding, tabulation, and cleaning of data, is conducted. This is to ensure that the information collected is truthful and error free as well as appropriate to what is being asked for in the baseline. Further, the analysis of baseline data allows us to understand the characteristics of our population and the scope and coverage of our current interventions.
In some cases, external experts are hired to provide guidance during the M&E process. These experts give advice and tips on the proper conduct of the activities related to the monitoring and evaluation of our organizations and interventions. This is highly applicable when personnel has relatively low experience in M&E.
The reporting of information may be in the form of a packaged document or through a presentation of the findings in a meeting or any fora where those who will use the data will be present. The users of the findings are usually the organization’s top management and key decision makers. Further, findings can also be presented to some steering committees, implementing partners, and primary stakeholders to ensure accountability and motivate them to take action.
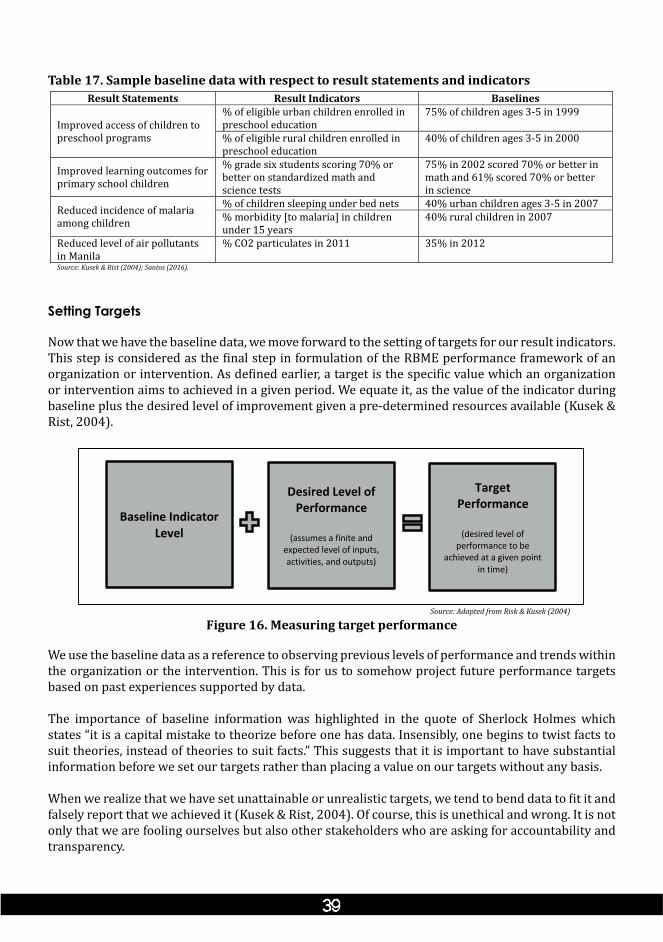
Table 17. Sample baseline data with respect to result statements and indicatorsResult Statements Result Indicators Baselines
Improved access of children to preschool programs
% of eligible urban children enrolled in preschool education
75% of children ages 3-5 in 1999
% of eligible rural children enrolled in preschool education
40% of children ages 3-5 in 2000
Improved learning outcomes for primary school children
% grade six students scoring 70% or better on standardized math and science tests
75% in 2002 scored 70% or better in math and 61% scored 70% or better in science
Reduced incidence of malaria among children
% of children sleeping under bed nets 40% urban children ages 3-5 in 2007 % morbidity [to malaria] in children under 15 years
40% rural children in 2007
Reduced level of air pollutants in Manila
% CO2 particulates in 2011 35% in 2012
Source: Kusek & Rist (2004); Santos (2016).
Setting Targets
Now that we have the baseline data, we move forward to the setting of targets for our result indicators. This step is considered as the final step in formulation of the RBME performance framework of an organization or intervention. As defined earlier, a target is the specific value which an organization or intervention aims to achieved in a given period. We equate it, as the value of the indicator during baseline plus the desired level of improvement given a pre-determined resources available (Kusek & Rist, 2004).
Baseline Indicator Level
Desired Level of Performance
(assumes a finite and
expected level of inputs, activities, and outputs)
Target Performance
(desired level of
performance to be achieved at a given point
in time)
Figure 16. Measuring target performanceSource: Adapted from Risk & Kusek (2004)
We use the baseline data as a reference to observing previous levels of performance and trends within the organization or the intervention. This is for us to somehow project future performance targets based on past experiences supported by data.
The importance of baseline information was highlighted in the quote of Sherlock Holmes which states “it is a capital mistake to theorize before one has data. Insensibly, one begins to twist facts to suit theories, instead of theories to suit facts.” This suggests that it is important to have substantial information before we set our targets rather than placing a value on our targets without any basis.
When we realize that we have set unattainable or unrealistic targets, we tend to bend data to fit it and falsely report that we achieved it (Kusek & Rist, 2004). Of course, this is unethical and wrong. It is not only that we are fooling ourselves but also other stakeholders who are asking for accountability and transparency.
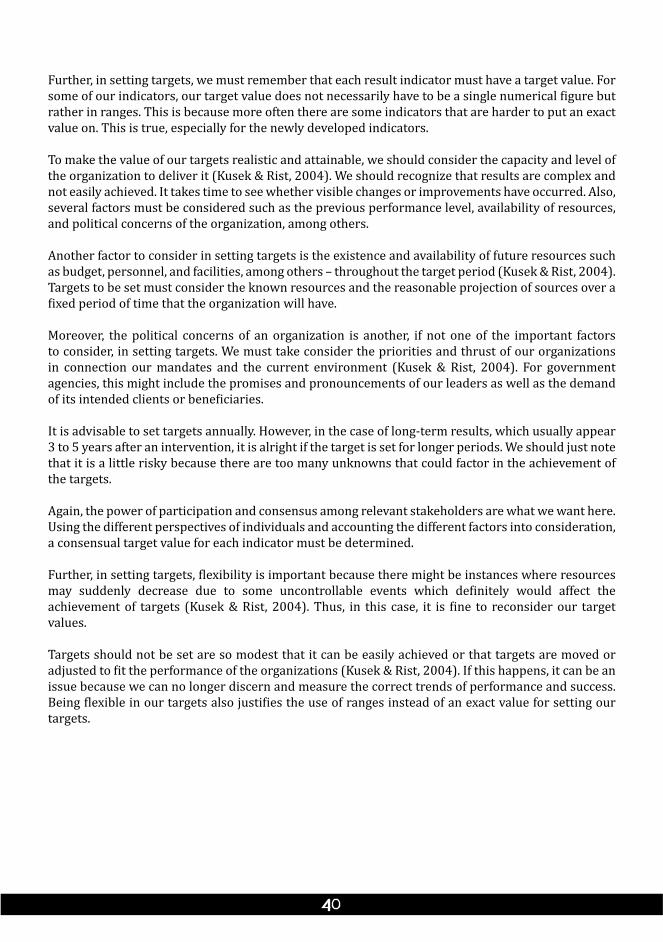
Further, in setting targets, we must remember that each result indicator must have a target value. For some of our indicators, our target value does not necessarily have to be a single numerical figure but rather in ranges. This is because more often there are some indicators that are harder to put an exact value on. This is true, especially for the newly developed indicators.
To make the value of our targets realistic and attainable, we should consider the capacity and level of the organization to deliver it (Kusek & Rist, 2004). We should recognize that results are complex and not easily achieved. It takes time to see whether visible changes or improvements have occurred. Also, several factors must be considered such as the previous performance level, availability of resources, and political concerns of the organization, among others.
Another factor to consider in setting targets is the existence and availability of future resources such as budget, personnel, and facilities, among others – throughout the target period (Kusek & Rist, 2004). Targets to be set must consider the known resources and the reasonable projection of sources over a fixed period of time that the organization will have.
Moreover, the political concerns of an organization is another, if not one of the important factors to consider, in setting targets. We must take consider the priorities and thrust of our organizations in connection our mandates and the current environment (Kusek & Rist, 2004). For government agencies, this might include the promises and pronouncements of our leaders as well as the demand of its intended clients or beneficiaries.
It is advisable to set targets annually. However, in the case of long-term results, which usually appear 3 to 5 years after an intervention, it is alright if the target is set for longer periods. We should just note that it is a little risky because there are too many unknowns that could factor in the achievement of the targets.
Again, the power of participation and consensus among relevant stakeholders are what we want here. Using the different perspectives of individuals and accounting the different factors into consideration, a consensual target value for each indicator must be determined.
Further, in setting targets, flexibility is important because there might be instances where resources may suddenly decrease due to some uncontrollable events which definitely would affect the achievement of targets (Kusek & Rist, 2004). Thus, in this case, it is fine to reconsider our target values.
Targets should not be set are so modest that it can be easily achieved or that targets are moved or adjusted to fit the performance of the organizations (Kusek & Rist, 2004). If this happens, it can be an issue because we can no longer discern and measure the correct trends of performance and success. Being flexible in our targets also justifies the use of ranges instead of an exact value for setting our targets.
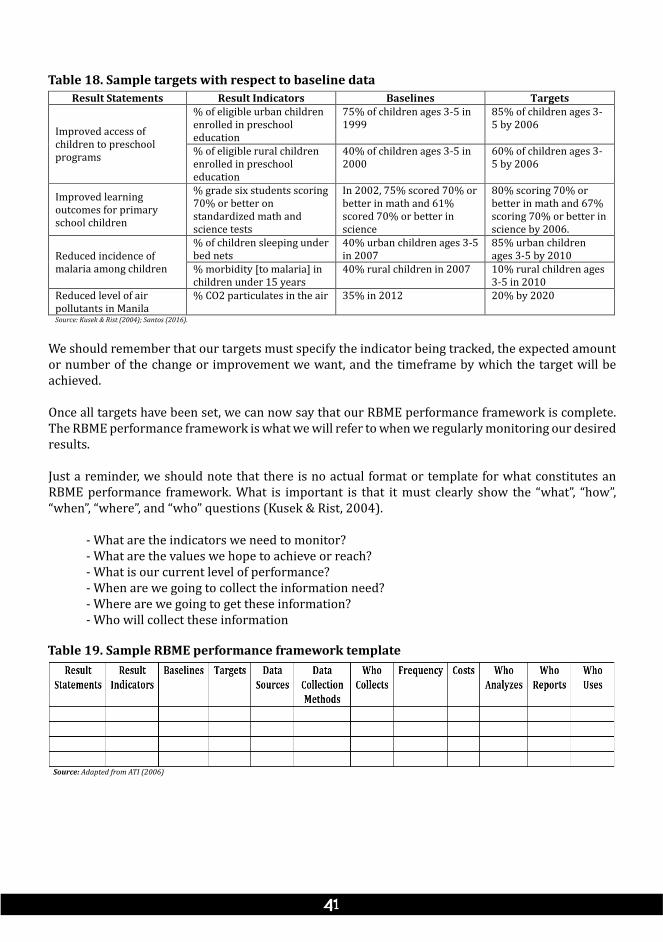
Table 18. Sample targets with respect to baseline dataResult Statements Result Indicators Baselines Targets
Improved access of children to preschool programs
% of eligible urban children enrolled in preschool education
75% of children ages 3-5 in 1999
85% of children ages 3-5 by 2006
% of eligible rural children enrolled in preschool education
40% of children ages 3-5 in 2000
60% of children ages 3-5 by 2006
Improved learning outcomes for primary school children
% grade six students scoring 70% or better on standardized math and science tests
In 2002, 75% scored 70% or better in math and 61% scored 70% or better in science
80% scoring 70% or better in math and 67% scoring 70% or better in science by 2006.
Reduced incidence of malaria among children
% of children sleeping under bed nets
40% urban children ages 3-5 in 2007
85% urban children ages 3-5 by 2010
% morbidity [to malaria] in children under 15 years
40% rural children in 2007 10% rural children ages 3-5 in 2010
Reduced level of air pollutants in Manila
% CO2 particulates in the air 35% in 2012 20% by 2020
Source: Kusek & Rist (2004); Santos (2016).
We should remember that our targets must specify the indicator being tracked, the expected amount or number of the change or improvement we want, and the timeframe by which the target will be achieved.
Once all targets have been set, we can now say that our RBME performance framework is complete. The RBME performance framework is what we will refer to when we regularly monitoring our desired results.
Just a reminder, we should note that there is no actual format or template for what constitutes an RBME performance framework. What is important is that it must clearly show the “what”, “how”, “when”, “where”, and “who” questions (Kusek & Rist, 2004).
- What are the indicators we need to monitor? - What are the values we hope to achieve or reach?- What is our current level of performance? - When are we going to collect the information need?- Where are we going to get these information?- Who will collect these information
Table 19. Sample RBME performance framework template
Source: Adapted from ATI (2006)
WORKSHOP 4Title: “Create A RBME Performance Framework”Time Allotment: 4 hoursMaterials Needed: Laptop, projector
Workshop Mechanics:1. Show the participants a slide of the instructions for the workshop saying:
“Create a RBME Performance Framework for the result indicators your group identified. Try to fill out all information required in the performance framework. In instances where the baseline information is absent and cannot be determine, it is ok to leave it blank as well as for the target values.
2. Inform them that they will have to formulate a RBME performance framework with respect to their identified result indicators. Give them 3 hours to do the workshop.
3. Have each group present their outputs. Give them 10 minutes each to present their workshop output.4. Encourage the participants to provide comments and observations regarding the group outputs.5. Provide comments and additional insights about the formulation of a ToC model.
Processing based on workshop outputs:1. Do you agree that baseline information is important before we do our interventions? (Possible answer: Yes, because
it determines our current situation and is used as reference in setting our desired targets)2. What do we do to fill out the baseline information of our RBME performance framework? (Possible answer: To
develop the data collection instruments and tools.)3. How do we ensure that our RBME performance framework is correct and doable? (Possible answer: We subject our
data collection instruments and tools to a series of pretesting to determine if we are getting the correct information needed.)
Key Concepts:• The RBME performance framework is our reference in monitoring our results.• The validity of our RBME performance framework must be tested and revised when needed.
Monitoring for Results
After completing the RBME performance framework, the next step is to develop the templates needed for data collection to monitor our results indicators. However, before we develop the tools, we must first understand the linkage between the implementation of our interventions to our desired results. What is the interaction between the means and strategies and results of our organizations?
We must know that a RBME system includes two (2) types of monitoring: implementation monitoring and results monitoring. As we discussed during our earlier lessons, the focus of RBME is the measurement of achieving results without ignoring the tracking of the inputs, activities, and outputs.
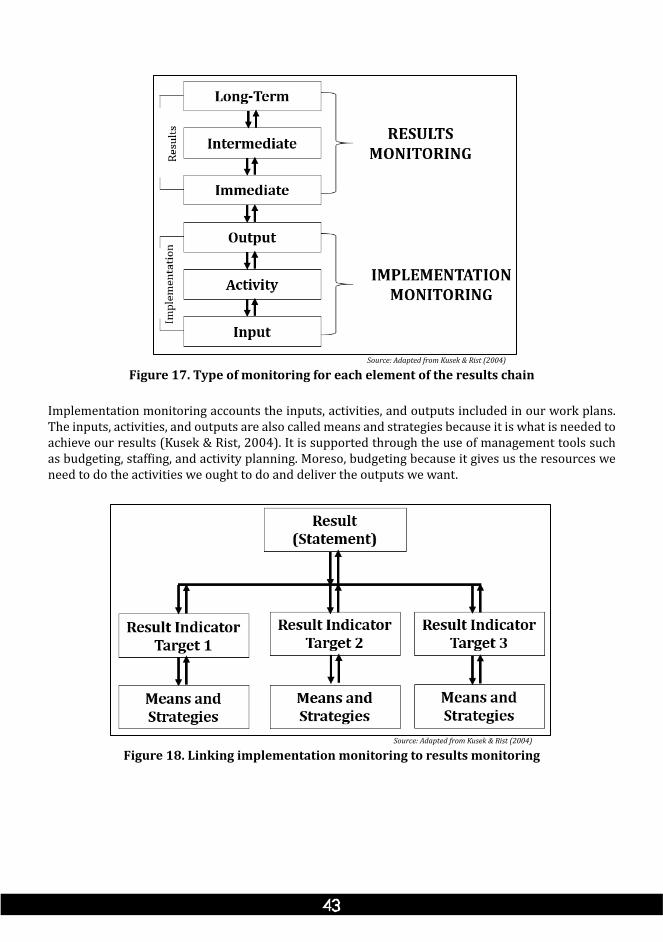
Figure 17. Type of monitoring for each element of the results chainSource: Adapted from Kusek & Rist (2004)
Implementation monitoring accounts the inputs, activities, and outputs included in our work plans. The inputs, activities, and outputs are also called means and strategies because it is what is needed to achieve our results (Kusek & Rist, 2004). It is supported through the use of management tools such as budgeting, staffing, and activity planning. Moreso, budgeting because it gives us the resources we need to do the activities we ought to do and deliver the outputs we want.
Figure 18. Linking implementation monitoring to results monitoringSource: Adapted from Kusek & Rist (2004)
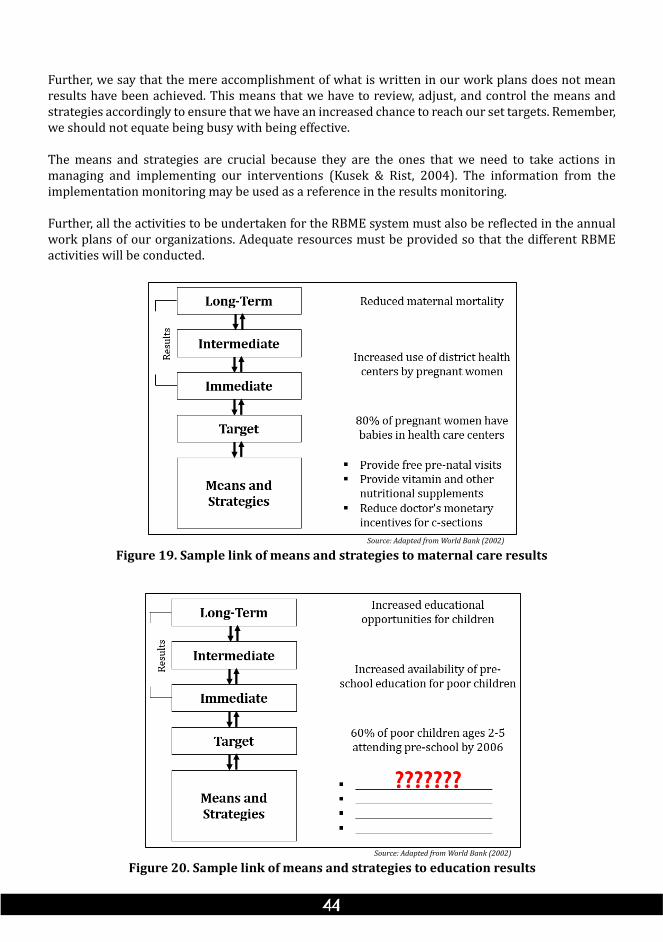
Further, we say that the mere accomplishment of what is written in our work plans does not mean results have been achieved. This means that we have to review, adjust, and control the means and strategies accordingly to ensure that we have an increased chance to reach our set targets. Remember, we should not equate being busy with being effective.
The means and strategies are crucial because they are the ones that we need to take actions in managing and implementing our interventions (Kusek & Rist, 2004). The information from the implementation monitoring may be used as a reference in the results monitoring.
Further, all the activities to be undertaken for the RBME system must also be reflected in the annual work plans of our organizations. Adequate resources must be provided so that the different RBME activities will be conducted.
Figure 19. Sample link of means and strategies to maternal care resultsSource: Adapted from World Bank (2002)
Figure 20. Sample link of means and strategies to education resultsSource: Adapted from World Bank (2002)
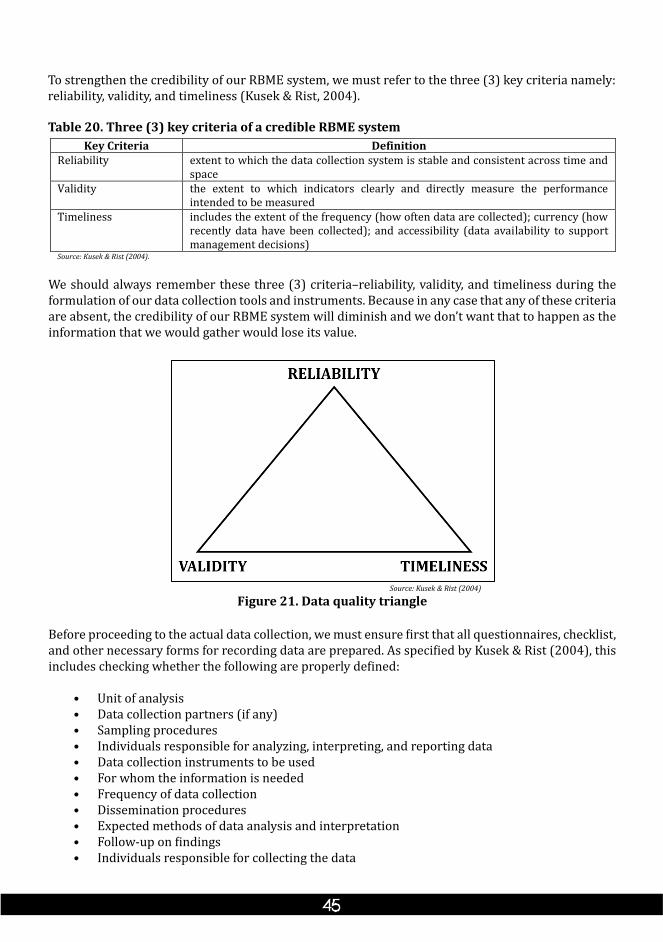
To strengthen the credibility of our RBME system, we must refer to the three (3) key criteria namely: reliability, validity, and timeliness (Kusek & Rist, 2004).
Table 20. Three (3) key criteria of a credible RBME systemKey Criteria Definition
Reliability extent to which the data collection system is stable and consistent across time and space
Validity the extent to which indicators clearly and directly measure the performance intended to be measured
Timeliness includes the extent of the frequency (how often data are collected); currency (how recently data have been collected); and accessibility (data availability to support management decisions)
Source: Kusek & Rist (2004).
We should always remember these three (3) criteria–reliability, validity, and timeliness during the formulation of our data collection tools and instruments. Because in any case that any of these criteria are absent, the credibility of our RBME system will diminish and we don’t want that to happen as the information that we would gather would lose its value.
Figure 21. Data quality triangleSource: Kusek & Rist (2004)
Before proceeding to the actual data collection, we must ensure first that all questionnaires, checklist, and other necessary forms for recording data are prepared. As specified by Kusek & Rist (2004), this includes checking whether the following are properly defined:
• Unit of analysis• Data collection partners (if any)• Sampling procedures • Individuals responsible for analyzing, interpreting, and reporting data• Data collection instruments to be used • For whom the information is needed• Frequency of data collection • Dissemination procedures• Expected methods of data analysis and interpretation • Follow-up on findings• Individuals responsible for collecting the data
Specifically, the arrangements of facilitators, enumerators, and other individuals involved in the data collection process must be known and that this personnel involved must be properly oriented and trained in order for them to understand their roles.
Coordination and collaboration among concerned personnel and units are encouraged so that data collection will be implemented smooth and organized. As a reference in monitoring for results, each person must be aware of the RBME performance framework.
Further, the responsibility of each person must be clear on:
• What data are to be collected • How will the data be interpreted• When data are to be collected • Who reports the data • How data are collected • For whom data are to be collected• Who collects what data
Other relevant information that will help us develop our data collection tools and instruments such as the formulation of evaluation questions will be discussed in the next lesson. However, assuming that we have already come up with the tools and instruments for data collection, we need to know the importance of pretesting.
Pretesting is a means of verifying whether our result indicators are valid, their information requirements are feasible, and the methods and instruments identified are appropriate (Gebremedhin et al., 2010). It is vital to ensure that we are building an effective RBME system.
Kusek and Rist (2004) identified key points on pretesting or piloting: (1) a data collection approach needs to be tested to determine if it is getting correct information; (2) pretesting improves data collection instruments; (3) not doing a pretest will probably result to a mistake, which can cost the organization valuable time and resources; and (4) pretesting will help solve some ambiguity on how data will be collected and what the data will look like.
To ensure that we will be able to properly monitoring our results, we need to have established processes that would recognize that need for results monitoring to be regular, formatted, clear and focused. Further, we must account that an RBME system includes a mechanism for information storage or knowledge management, information dissemination, and information utilization.
SUMMARY
Baseline information is used as a benchmark for us to properly set our targets and to monitor our organization’s future performance. It is necessary because it provides evidence that progress has been, or has not been, achieved.
In order to come up with the baseline data, we need to have a data collection and analysis plan which tells us the sources of data, the method to be used, who will collect it, the frequency of collection, the cost and difficulty of collecting, who interprets and reports it, and who will use it. Afterwards, we develop the instruments for data collection, pretest it, revised when necessary and proceed to the completing data collection for our baseline information.
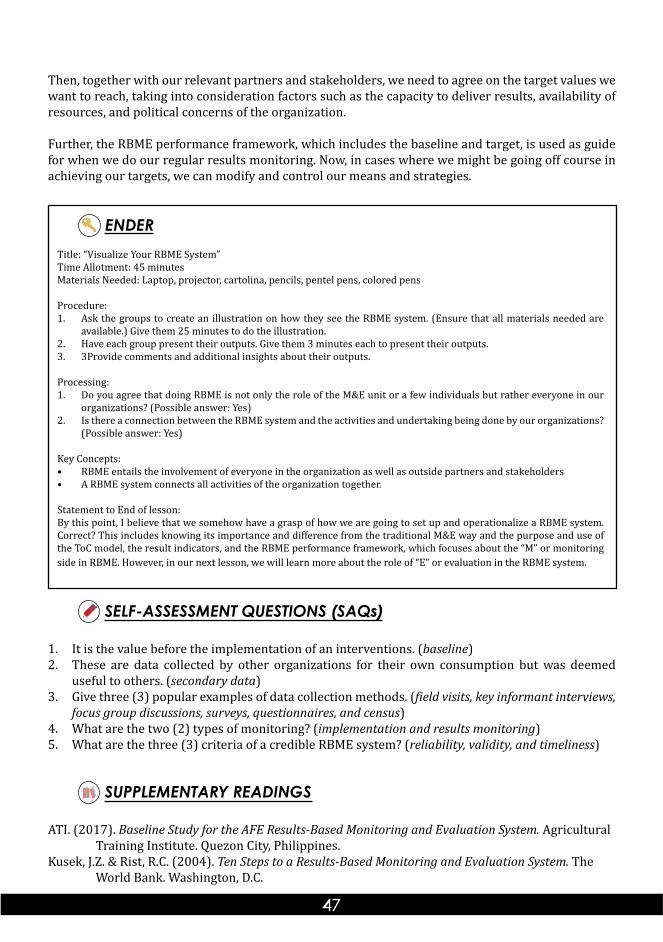
Then, together with our relevant partners and stakeholders, we need to agree on the target values we want to reach, taking into consideration factors such as the capacity to deliver results, availability of resources, and political concerns of the organization.
Further, the RBME performance framework, which includes the baseline and target, is used as guide for when we do our regular results monitoring. Now, in cases where we might be going off course in achieving our targets, we can modify and control our means and strategies.
ENDERTitle: “Visualize Your RBME System”Time Allotment: 45 minutesMaterials Needed: Laptop, projector, cartolina, pencils, pentel pens, colored pens
Procedure:1. Ask the groups to create an illustration on how they see the RBME system. (Ensure that all materials needed are
available.) Give them 25 minutes to do the illustration.2. Have each group present their outputs. Give them 3 minutes each to present their outputs.3. 3Provide comments and additional insights about their outputs.
Processing:1. Do you agree that doing RBME is not only the role of the M&E unit or a few individuals but rather everyone in our
organizations? (Possible answer: Yes)2. Is there a connection between the RBME system and the activities and undertaking being done by our organizations?
(Possible answer: Yes)
Key Concepts:• RBME entails the involvement of everyone in the organization as well as outside partners and stakeholders • A RBME system connects all activities of the organization together.
Statement to End of lesson:By this point, I believe that we somehow have a grasp of how we are going to set up and operationalize a RBME system. Correct? This includes knowing its importance and difference from the traditional M&E way and the purpose and use of the ToC model, the result indicators, and the RBME performance framework, which focuses about the “M” or monitoring side in RBME. However, in our next lesson, we will learn more about the role of “E” or evaluation in the RBME system.
SELF-ASSESSMENT QUESTIONS (SAQs)
1. It is the value before the implementation of an interventions. (baseline)2. These are data collected by other organizations for their own consumption but was deemed
useful to others. (secondary data)3. Give three (3) popular examples of data collection methods. (field visits, key informant interviews,
focus group discussions, surveys, questionnaires, and census)4. What are the two (2) types of monitoring? (implementation and results monitoring)5. What are the three (3) criteria of a credible RBME system? (reliability, validity, and timeliness)
SUPPLEMENTARY READINGS
ATI. (2017). Baseline Study for the AFE Results-Based Monitoring and Evaluation System. Agricultural Training Institute. Quezon City, Philippines.Kusek, J.Z. & Rist, R.C. (2004). Ten Steps to a Results-Based Monitoring and Evaluation System. The World Bank. Washington, D.C.
Lesson 4Implementing the RBME System
Implementing the RBME SystemThis lesson seeks to provide an understanding on the role and use of evaluation in the RBME system. This includes the concepts evaluation criteria and standards, the formulation of evaluation questions, and report writing, among others.
LESSON OBJECTIVES
At the end of this lesson, participants will be able to identify different evaluation approaches and prepare sample evaluation questions in relation to the RBME system.
Specifically, they should be able to:1. Identify the main concepts used in evaluation;2. Explain the process of formulating evaluation questions;3. Explain the difference between in-house and independent evaluations; and4. Explain the concept of sustaining the RBME system.
Time Allotment: 8 hoursMethodologies: Lecture-Discussion and WorkshopTools to Use: Laptop, projector
OPENERTitle: List It Down! “What are the Uses of Evaluations?”Time Allotment: 20 minutesMaterials Needed: Laptop, projector, metacards, pentel pens, masking tape, white/black board
Procedure:1. Ask the groups to write down their ideas on the use of evaluation. (Ensure that all materials needed are available.)2. Instruct them to write at least three (3) answers and place it on the board provided. Give them 5 minutes to answer.3. Ask each group for a volunteer to share their answers.4. Provide additional insights and relate it to the lesson to be discussed.
Processing:1. Do you agree that evaluation, just like monitoring, is an important tool in managing our organizations? (Possible
answer: Yes.)2. What do you think is the role of evaluation in our RBME system (Possible answer: It provides answers to questions
we may have in relation to our performance and the achievement of our goals.)3. How do we ensure that we are conducting a credible evaluation? (Possible answers: Making sure that evaluation
answers the correct questions; following characteristics such as impartiality, usefulness, and technical adequacy, among others.)
Key Concepts:• Evaluation explains the reason why our desired results have been achieved or not.• Evaluation entails asking the right questions in accordance to agreed evaluation criteria and standards as well as
following appropriate norms and practices.
Connecting/Transition Statement to the Lesson:The use of evaluation is to further provide information on our performance and success. It details reasons on why our interventions do work or don’t work. However, to ensure that evaluation findings are reliable, there is a need for evaluations to follow accepted research norms and practices. This is what we will learn more on this lesson as well as how we are going to sustain our RBME system.
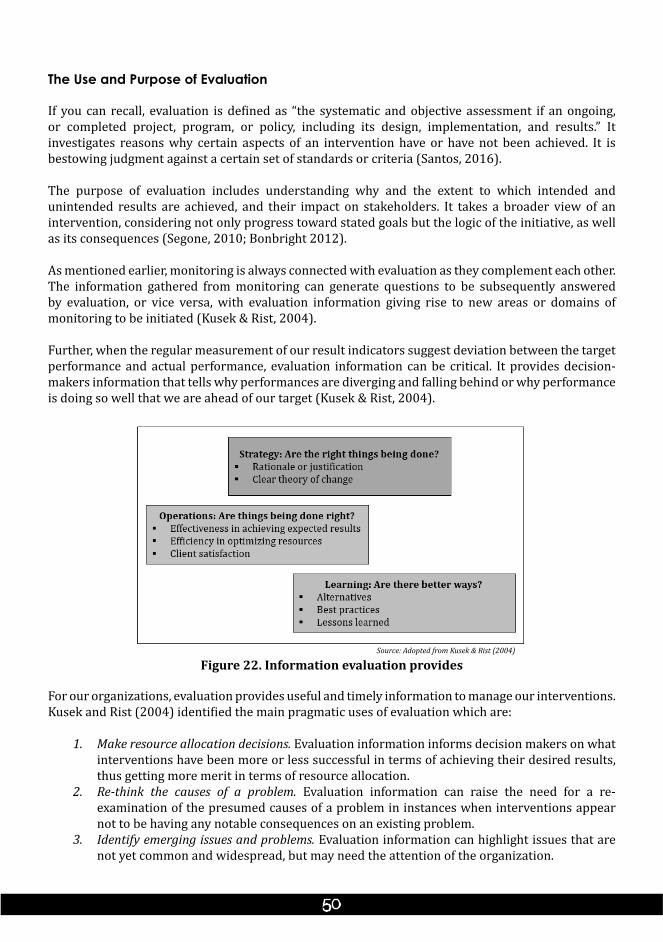
The Use and Purpose of Evaluation
If you can recall, evaluation is defined as “the systematic and objective assessment if an ongoing, or completed project, program, or policy, including its design, implementation, and results.” It investigates reasons why certain aspects of an intervention have or have not been achieved. It is bestowing judgment against a certain set of standards or criteria (Santos, 2016).
The purpose of evaluation includes understanding why and the extent to which intended and unintended results are achieved, and their impact on stakeholders. It takes a broader view of an intervention, considering not only progress toward stated goals but the logic of the initiative, as well as its consequences (Segone, 2010; Bonbright 2012).
As mentioned earlier, monitoring is always connected with evaluation as they complement each other. The information gathered from monitoring can generate questions to be subsequently answered by evaluation, or vice versa, with evaluation information giving rise to new areas or domains of monitoring to be initiated (Kusek & Rist, 2004).
Further, when the regular measurement of our result indicators suggest deviation between the target performance and actual performance, evaluation information can be critical. It provides decision-makers information that tells why performances are diverging and falling behind or why performance is doing so well that we are ahead of our target (Kusek & Rist, 2004).
Figure 22. Information evaluation providesSource: Adopted from Kusek & Rist (2004)
For our organizations, evaluation provides useful and timely information to manage our interventions. Kusek and Rist (2004) identified the main pragmatic uses of evaluation which are:
1. Make resource allocation decisions. Evaluation information informs decision makers on what interventions have been more or less successful in terms of achieving their desired results, thus getting more merit in terms of resource allocation.
2. Re-think the causes of a problem. Evaluation information can raise the need for a re-examination of the presumed causes of a problem in instances when interventions appear not to be having any notable consequences on an existing problem.
3. Identify emerging issues and problems. Evaluation information can highlight issues that are not yet common and widespread, but may need the attention of the organization.
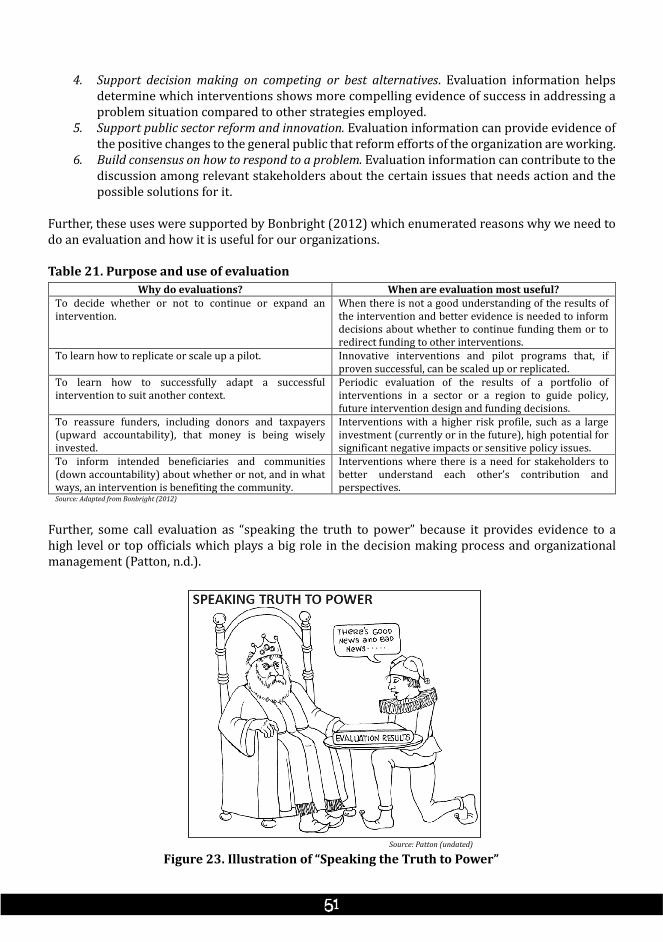
4. Support decision making on competing or best alternatives. Evaluation information helps determine which interventions shows more compelling evidence of success in addressing a problem situation compared to other strategies employed.
5. Support public sector reform and innovation. Evaluation information can provide evidence of the positive changes to the general public that reform efforts of the organization are working.
6. Build consensus on how to respond to a problem. Evaluation information can contribute to the discussion among relevant stakeholders about the certain issues that needs action and the possible solutions for it.
Further, these uses were supported by Bonbright (2012) which enumerated reasons why we need to do an evaluation and how it is useful for our organizations.
Table 21. Purpose and use of evaluationWhy do evaluations? When are evaluation most useful?
To decide whether or not to continue or expand an intervention.
When there is not a good understanding of the results of the intervention and better evidence is needed to inform decisions about whether to continue funding them or to redirect funding to other interventions.
To learn how to replicate or scale up a pilot. Innovative interventions and pilot programs that, if proven successful, can be scaled up or replicated.
To learn how to successfully adapt a successful intervention to suit another context.
Periodic evaluation of the results of a portfolio of interventions in a sector or a region to guide policy, future intervention design and funding decisions.
To reassure funders, including donors and taxpayers (upward accountability), that money is being wisely invested.
Interventions with a higher risk profile, such as a large investment (currently or in the future), high potential for significant negative impacts or sensitive policy issues.
To inform intended beneficiaries and communities (down accountability) about whether or not, and in what ways, an intervention is benefiting the community.
Interventions where there is a need for stakeholders to better understand each other’s contribution and perspectives.
Source: Adapted from Bonbright (2012)
Further, some call evaluation as “speaking the truth to power” because it provides evidence to a high level or top officials which plays a big role in the decision making process and organizational management (Patton, n.d.).
Figure 23. Illustration of “Speaking the Truth to Power”Source: Patton (undated)
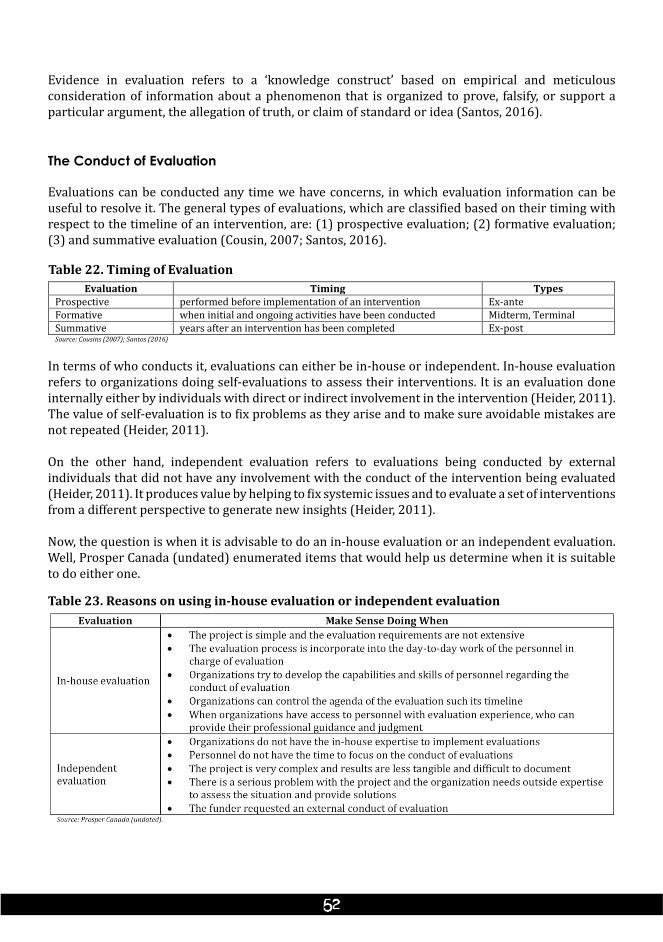
The Conduct of Evaluation
Evaluations can be conducted any time we have concerns, in which evaluation information can be useful to resolve it. The general types of evaluations, which are classified based on their timing with respect to the timeline of an intervention, are: (1) prospective evaluation; (2) formative evaluation; (3) and summative evaluation (Cousin, 2007; Santos, 2016).
Table 22. Timing of EvaluationEvaluation Timing Types
Prospective performed before implementation of an intervention Ex-ante Formative when initial and ongoing activities have been conducted Midterm, Terminal Summative years after an intervention has been completed Ex-post Source: Cousins (2007); Santos (2016)
In terms of who conducts it, evaluations can either be in-house or independent. In-house evaluation refers to organizations doing self-evaluations to assess their interventions. It is an evaluation done internally either by individuals with direct or indirect involvement in the intervention (Heider, 2011). The value of self-evaluation is to fix problems as they arise and to make sure avoidable mistakes are not repeated (Heider, 2011).
On the other hand, independent evaluation refers to evaluations being conducted by external individuals that did not have any involvement with the conduct of the intervention being evaluated (Heider, 2011). It produces value by helping to fix systemic issues and to evaluate a set of interventions from a different perspective to generate new insights (Heider, 2011).
Now, the question is when it is advisable to do an in-house evaluation or an independent evaluation. Well, Prosper Canada (undated) enumerated items that would help us determine when it is suitable to do either one.
Evidence in evaluation refers to a ‘knowledge construct’ based on empirical and meticulous consideration of information about a phenomenon that is organized to prove, falsify, or support a particular argument, the allegation of truth, or claim of standard or idea (Santos, 2016).
Table 23. Reasons on using in-house evaluation or independent evaluation
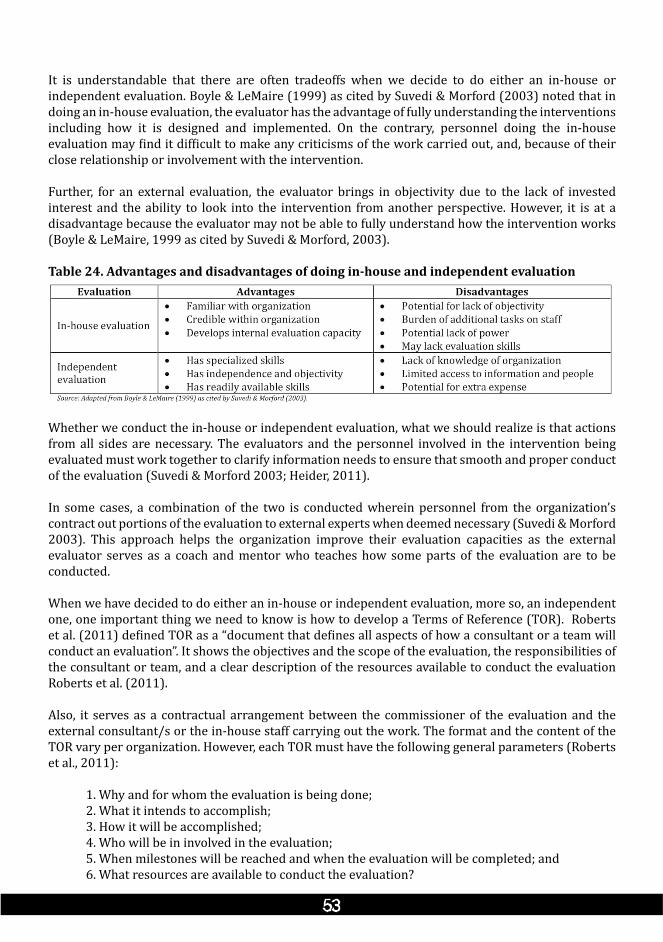
It is understandable that there are often tradeoffs when we decide to do either an in-house or independent evaluation. Boyle & LeMaire (1999) as cited by Suvedi & Morford (2003) noted that in doing an in-house evaluation, the evaluator has the advantage of fully understanding the interventions including how it is designed and implemented. On the contrary, personnel doing the in-house evaluation may find it difficult to make any criticisms of the work carried out, and, because of their close relationship or involvement with the intervention.
Further, for an external evaluation, the evaluator brings in objectivity due to the lack of invested interest and the ability to look into the intervention from another perspective. However, it is at a disadvantage because the evaluator may not be able to fully understand how the intervention works (Boyle & LeMaire, 1999 as cited by Suvedi & Morford, 2003).
Table 24. Advantages and disadvantages of doing in-house and independent evaluation
Whether we conduct the in-house or independent evaluation, what we should realize is that actions from all sides are necessary. The evaluators and the personnel involved in the intervention being evaluated must work together to clarify information needs to ensure that smooth and proper conduct of the evaluation (Suvedi & Morford 2003; Heider, 2011).
In some cases, a combination of the two is conducted wherein personnel from the organization’s contract out portions of the evaluation to external experts when deemed necessary (Suvedi & Morford 2003). This approach helps the organization improve their evaluation capacities as the external evaluator serves as a coach and mentor who teaches how some parts of the evaluation are to be conducted.
When we have decided to do either an in-house or independent evaluation, more so, an independent one, one important thing we need to know is how to develop a Terms of Reference (TOR). Roberts et al. (2011) defined TOR as a “document that defines all aspects of how a consultant or a team will conduct an evaluation”. It shows the objectives and the scope of the evaluation, the responsibilities of the consultant or team, and a clear description of the resources available to conduct the evaluation Roberts et al. (2011).
Also, it serves as a contractual arrangement between the commissioner of the evaluation and the external consultant/s or the in-house staff carrying out the work. The format and the content of the TOR vary per organization. However, each TOR must have the following general parameters (Roberts et al., 2011):
1. Why and for whom the evaluation is being done;2. What it intends to accomplish;3. How it will be accomplished;4. Who will be in involved in the evaluation;5. When milestones will be reached and when the evaluation will be completed; and 6. What resources are available to conduct the evaluation?
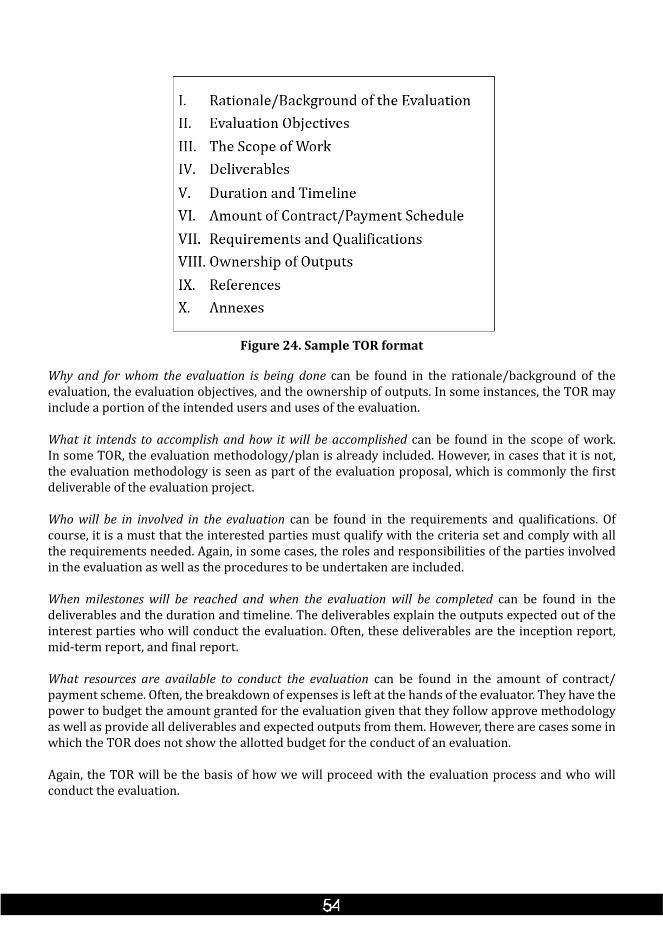
Figure 24. Sample TOR format
Why and for whom the evaluation is being done can be found in the rationale/background of the evaluation, the evaluation objectives, and the ownership of outputs. In some instances, the TOR may include a portion of the intended users and uses of the evaluation.
What it intends to accomplish and how it will be accomplished can be found in the scope of work. In some TOR, the evaluation methodology/plan is already included. However, in cases that it is not, the evaluation methodology is seen as part of the evaluation proposal, which is commonly the first deliverable of the evaluation project.
Who will be in involved in the evaluation can be found in the requirements and qualifications. Of course, it is a must that the interested parties must qualify with the criteria set and comply with all the requirements needed. Again, in some cases, the roles and responsibilities of the parties involved in the evaluation as well as the procedures to be undertaken are included.
When milestones will be reached and when the evaluation will be completed can be found in the deliverables and the duration and timeline. The deliverables explain the outputs expected out of the interest parties who will conduct the evaluation. Often, these deliverables are the inception report, mid-term report, and final report.
What resources are available to conduct the evaluation can be found in the amount of contract/payment scheme. Often, the breakdown of expenses is left at the hands of the evaluator. They have the power to budget the amount granted for the evaluation given that they follow approve methodology as well as provide all deliverables and expected outputs from them. However, there are cases some in which the TOR does not show the allotted budget for the conduct of an evaluation.
Again, the TOR will be the basis of how we will proceed with the evaluation process and who will conduct the evaluation.
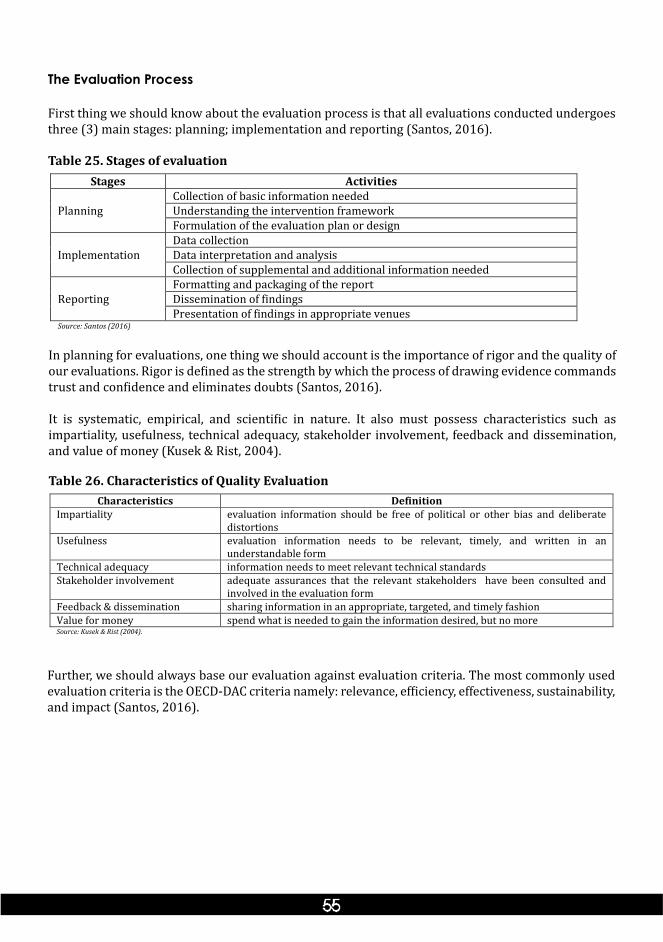
The Evaluation Process
First thing we should know about the evaluation process is that all evaluations conducted undergoes three (3) main stages: planning; implementation and reporting (Santos, 2016).
Table 25. Stages of evaluationStages Activities
Planning Collection of basic information needed Understanding the intervention framework Formulation of the evaluation plan or design
Implementation Data collection Data interpretation and analysis Collection of supplemental and additional information needed
Reporting Formatting and packaging of the report Dissemination of findings Presentation of findings in appropriate venues
Source: Santos (2016)
In planning for evaluations, one thing we should account is the importance of rigor and the quality of our evaluations. Rigor is defined as the strength by which the process of drawing evidence commands trust and confidence and eliminates doubts (Santos, 2016).
It is systematic, empirical, and scientific in nature. It also must possess characteristics such as impartiality, usefulness, technical adequacy, stakeholder involvement, feedback and dissemination, and value of money (Kusek & Rist, 2004).
Table 26. Characteristics of Quality EvaluationCharacteristics Definition
Impartiality evaluation information should be free of political or other bias and deliberate distortions
Usefulness evaluation information needs to be relevant, timely, and written in an understandable form
Technical adequacy information needs to meet relevant technical standards Stakeholder involvement adequate assurances that the relevant stakeholders have been consulted and
involved in the evaluation form Feedback & dissemination sharing information in an appropriate, targeted, and timely fashion Value for money spend what is needed to gain the information desired, but no more Source: Kusek & Rist (2004).
Criteria Definition Guide Questions
Further, we should always base our evaluation against evaluation criteria. The most commonly used evaluation criteria is the OECD-DAC criteria namely: relevance, efficiency, effectiveness, sustainability, and impact (Santos, 2016).
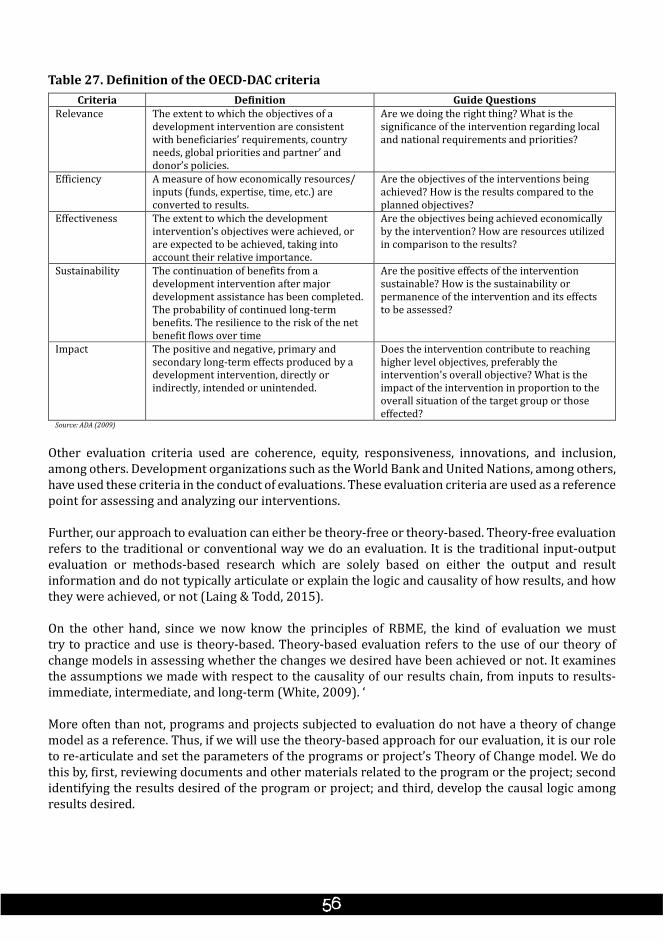
Table 27. Definition of the OECD-DAC criteriaCriteria Definition Guide Questions
Relevance The extent to which the objectives of a development intervention are consistent with beneficiaries’ requirements, country needs, global priorities and partner’ and donor’s policies.
Are we doing the right thing? What is the significance of the intervention regarding local and national requirements and priorities?
Efficiency A measure of how economically resources/ inputs (funds, expertise, time, etc.) are converted to results.
Are the objectives of the interventions being achieved? How is the results compared to the planned objectives?
Effectiveness The extent to which the development intervention’s objectives were achieved, or are expected to be achieved, taking into account their relative importance.
Are the objectives being achieved economically by the intervention? How are resources utilized in comparison to the results?
Sustainability The continuation of benefits from a development intervention after major development assistance has been completed. The probability of continued long-term benefits. The resilience to the risk of the net benefit flows over time
Are the positive effects of the intervention sustainable? How is the sustainability or permanence of the intervention and its effects to be assessed?
Impact The positive and negative, primary and secondary long-term effects produced by a development intervention, directly or indirectly, intended or unintended.
Does the intervention contribute to reaching higher level objectives, preferably the intervention's overall objective? What is the impact of the intervention in proportion to the overall situation of the target group or those effected?
Source: ADA (2009)
Other evaluation criteria used are coherence, equity, responsiveness, innovations, and inclusion, among others. Development organizations such as the World Bank and United Nations, among others, have used these criteria in the conduct of evaluations. These evaluation criteria are used as a reference point for assessing and analyzing our interventions.
Further, our approach to evaluation can either be theory-free or theory-based. Theory-free evaluation refers to the traditional or conventional way we do an evaluation. It is the traditional input-output evaluation or methods-based research which are solely based on either the output and result information and do not typically articulate or explain the logic and causality of how results, and how they were achieved, or not (Laing & Todd, 2015).
On the other hand, since we now know the principles of RBME, the kind of evaluation we must try to practice and use is theory-based. Theory-based evaluation refers to the use of our theory of change models in assessing whether the changes we desired have been achieved or not. It examines the assumptions we made with respect to the causality of our results chain, from inputs to results-immediate, intermediate, and long-term (White, 2009). ‘
More often than not, programs and projects subjected to evaluation do not have a theory of change model as a reference. Thus, if we will use the theory-based approach for our evaluation, it is our role to re-articulate and set the parameters of the programs or project’s Theory of Change model. We do this by, first, reviewing documents and other materials related to the program or the project; second identifying the results desired of the program or project; and third, develop the causal logic among results desired.
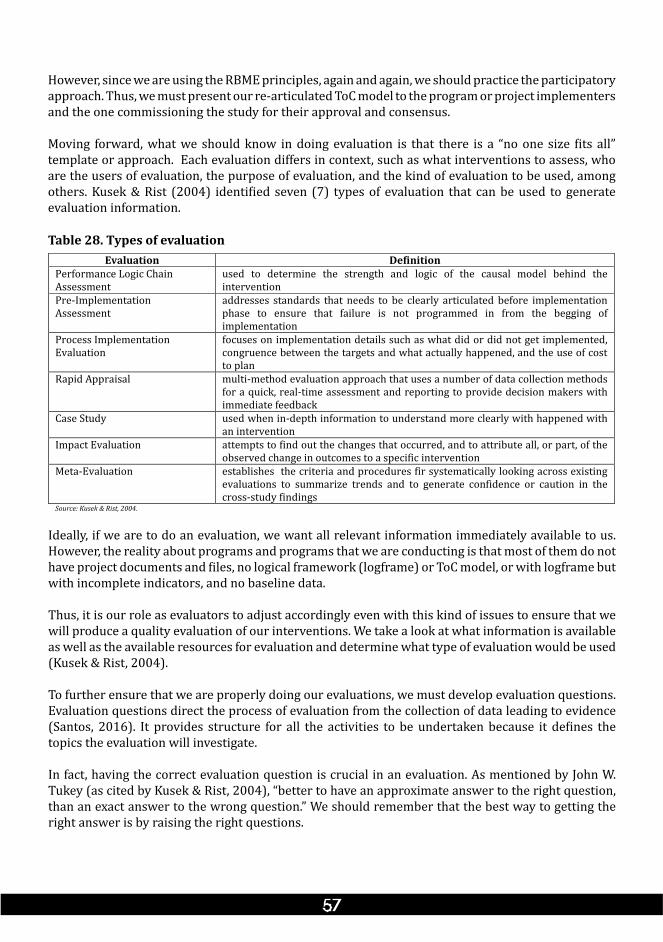
However, since we are using the RBME principles, again and again, we should practice the participatory approach. Thus, we must present our re-articulated ToC model to the program or project implementers and the one commissioning the study for their approval and consensus.
Moving forward, what we should know in doing evaluation is that there is a “no one size fits all” template or approach. Each evaluation differs in context, such as what interventions to assess, who are the users of evaluation, the purpose of evaluation, and the kind of evaluation to be used, among others. Kusek & Rist (2004) identified seven (7) types of evaluation that can be used to generate evaluation information.
Table 28. Types of evaluationEvaluation Definition
Performance Logic Chain Assessment
used to determine the strength and logic of the causal model behind the intervention
Pre-Implementation Assessment
addresses standards that needs to be clearly articulated before implementation phase to ensure that failure is not programmed in from the begging of implementation
Process Implementation Evaluation
focuses on implementation details such as what did or did not get implemented, congruence between the targets and what actually happened, and the use of cost to plan
Rapid Appraisal multi-method evaluation approach that uses a number of data collection methods for a quick, real-time assessment and reporting to provide decision makers with immediate feedback
Case Study used when in-depth information to understand more clearly with happened with an intervention
Impact Evaluation attempts to find out the changes that occurred, and to attribute all, or part, of the observed change in outcomes to a specific intervention
Meta-Evaluation establishes the criteria and procedures fir systematically looking across existing evaluations to summarize trends and to generate confidence or caution in the cross-study findings
Source: Kusek & Rist, 2004.
Ideally, if we are to do an evaluation, we want all relevant information immediately available to us. However, the reality about programs and programs that we are conducting is that most of them do not have project documents and files, no logical framework (logframe) or ToC model, or with logframe but with incomplete indicators, and no baseline data.
Thus, it is our role as evaluators to adjust accordingly even with this kind of issues to ensure that we will produce a quality evaluation of our interventions. We take a look at what information is available as well as the available resources for evaluation and determine what type of evaluation would be used (Kusek & Rist, 2004).
To further ensure that we are properly doing our evaluations, we must develop evaluation questions. Evaluation questions direct the process of evaluation from the collection of data leading to evidence (Santos, 2016). It provides structure for all the activities to be undertaken because it defines the topics the evaluation will investigate.
In fact, having the correct evaluation question is crucial in an evaluation. As mentioned by John W. Tukey (as cited by Kusek & Rist, 2004), “better to have an approximate answer to the right question, than an exact answer to the wrong question.” We should remember that the best way to getting the right answer is by raising the right questions.
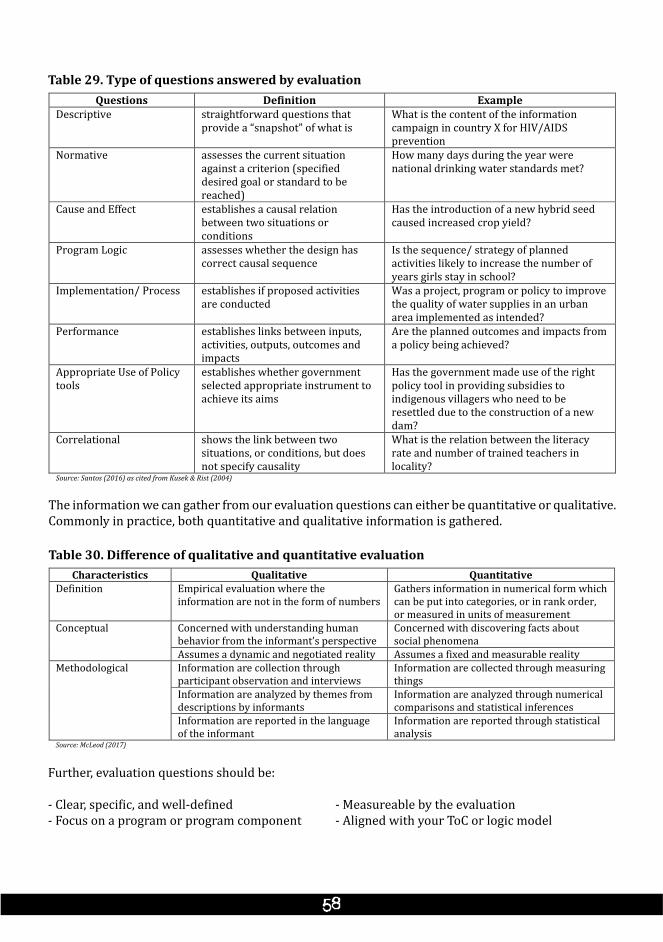
Table 29. Type of questions answered by evaluationQuestions Definition Example
Descriptive straightforward questions that provide a “snapshot” of what is
What is the content of the information campaign in country X for HIV/AIDS prevention
Normative assesses the current situation against a criterion (specified desired goal or standard to be reached)
How many days during the year were national drinking water standards met?
Cause and Effect establishes a causal relation between two situations or conditions
Has the introduction of a new hybrid seed caused increased crop yield?
Program Logic assesses whether the design has correct causal sequence
Is the sequence/ strategy of planned activities likely to increase the number of years girls stay in school?
Implementation/ Process establishes if proposed activities are conducted
Was a project, program or policy to improve the quality of water supplies in an urban area implemented as intended?
Performance establishes links between inputs, activities, outputs, outcomes and impacts
Are the planned outcomes and impacts from a policy being achieved?
Appropriate Use of Policy tools
establishes whether government selected appropriate instrument to achieve its aims
Has the government made use of the right policy tool in providing subsidies to indigenous villagers who need to be resettled due to the construction of a new dam?
Correlational shows the link between two situations, or conditions, but does not specify causality
What is the relation between the literacy rate and number of trained teachers in locality?
Source: Santos (2016) as cited from Kusek & Rist (2004)
The information we can gather from our evaluation questions can either be quantitative or qualitative. Commonly in practice, both quantitative and qualitative information is gathered.
Table 30. Difference of qualitative and quantitative evaluationCharacteristics Qualitative Quantitative
Definition Empirical evaluation where the information are not in the form of numbers
Gathers information in numerical form which can be put into categories, or in rank order, or measured in units of measurement
Conceptual Concerned with understanding human behavior from the informant’s perspective
Concerned with discovering facts about social phenomena
Assumes a dynamic and negotiated reality Assumes a fixed and measurable reality Methodological Information are collection through
participant observation and interviews Information are collected through measuring things
Information are analyzed by themes from descriptions by informants
Information are analyzed through numerical comparisons and statistical inferences
Information are reported in the language of the informant
Information are reported through statistical analysis
Source: McLeod (2017)
Further, evaluation questions should be:
- Clear, specific, and well-defined - Measureable by the evaluation- Focus on a program or program component - Aligned with your ToC or logic model
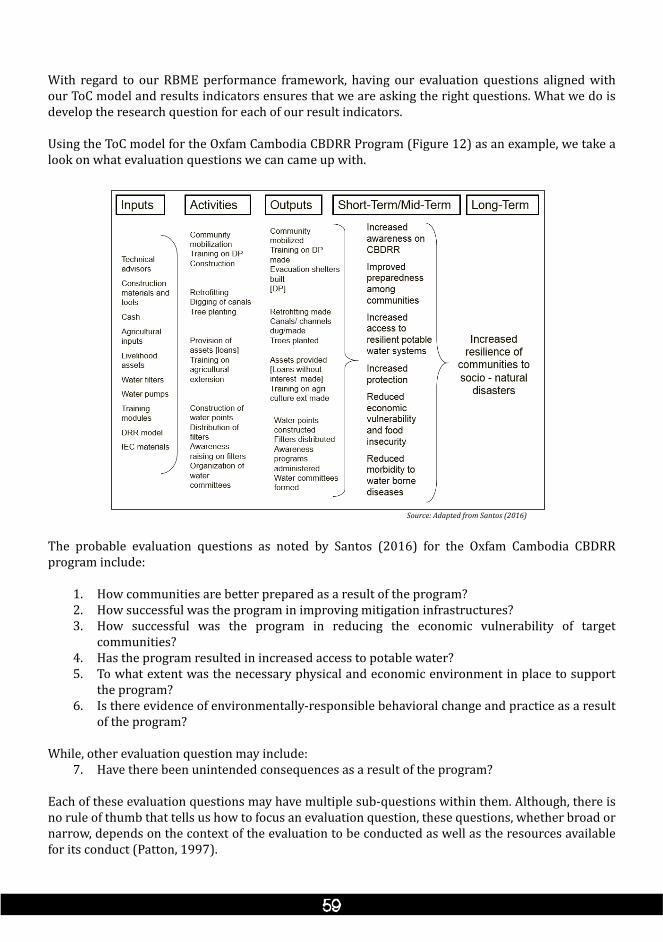
With regard to our RBME performance framework, having our evaluation questions aligned with our ToC model and results indicators ensures that we are asking the right questions. What we do is develop the research question for each of our result indicators.
Using the ToC model for the Oxfam Cambodia CBDRR Program (Figure 12) as an example, we take a look on what evaluation questions we can came up with.
Source: Adapted from Santos (2016)
The probable evaluation questions as noted by Santos (2016) for the Oxfam Cambodia CBDRR program include:
1. How communities are better prepared as a result of the program?2. How successful was the program in improving mitigation infrastructures?3. How successful was the program in reducing the economic vulnerability of target
communities?4. Has the program resulted in increased access to potable water?5. To what extent was the necessary physical and economic environment in place to support
the program?6. Is there evidence of environmentally-responsible behavioral change and practice as a result
of the program?
While, other evaluation question may include:7. Have there been unintended consequences as a result of the program?
Each of these evaluation questions may have multiple sub-questions within them. Although, there is no rule of thumb that tells us how to focus an evaluation question, these questions, whether broad or narrow, depends on the context of the evaluation to be conducted as well as the resources available for its conduct (Patton, 1997).
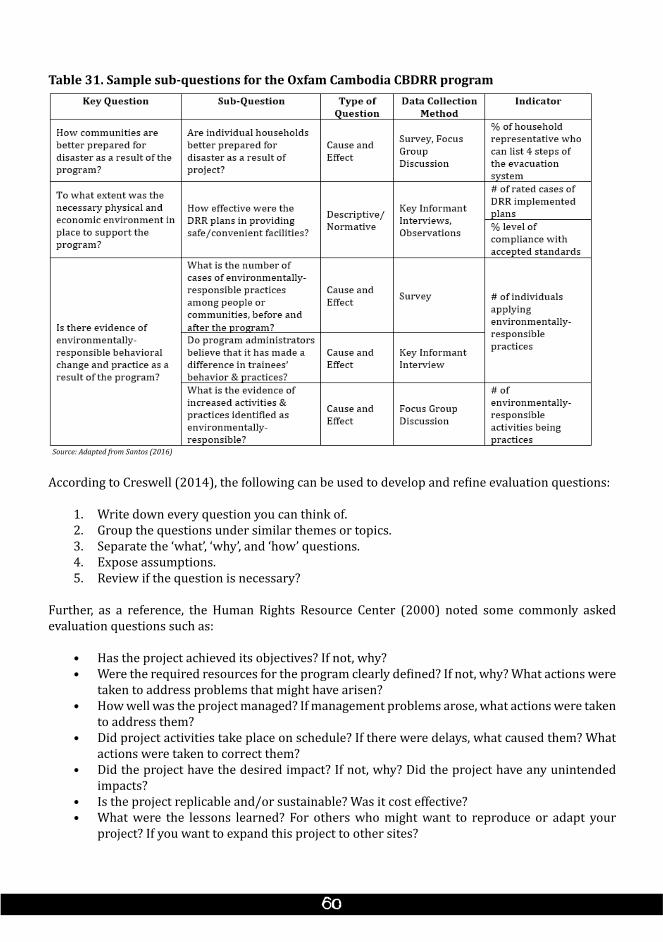
Table 31. Sample sub-questions for the Oxfam Cambodia CBDRR program
Source: Adapted from Santos (2016)
According to Creswell (2014), the following can be used to develop and refine evaluation questions:
1. Write down every question you can think of.2. Group the questions under similar themes or topics.3. Separate the ‘what’, ‘why’, and ‘how’ questions.4. Expose assumptions.5. Review if the question is necessary?
Further, as a reference, the Human Rights Resource Center (2000) noted some commonly asked evaluation questions such as:
• Has the project achieved its objectives? If not, why?• Were the required resources for the program clearly defined? If not, why? What actions were
taken to address problems that might have arisen?• How well was the project managed? If management problems arose, what actions were taken
to address them?• Did project activities take place on schedule? If there were delays, what caused them? What
actions were taken to correct them?• Did the project have the desired impact? If not, why? Did the project have any unintended
impacts?• Is the project replicable and/or sustainable? Was it cost effective?• What were the lessons learned? For others who might want to reproduce or adapt your
project? If you want to expand this project to other sites?
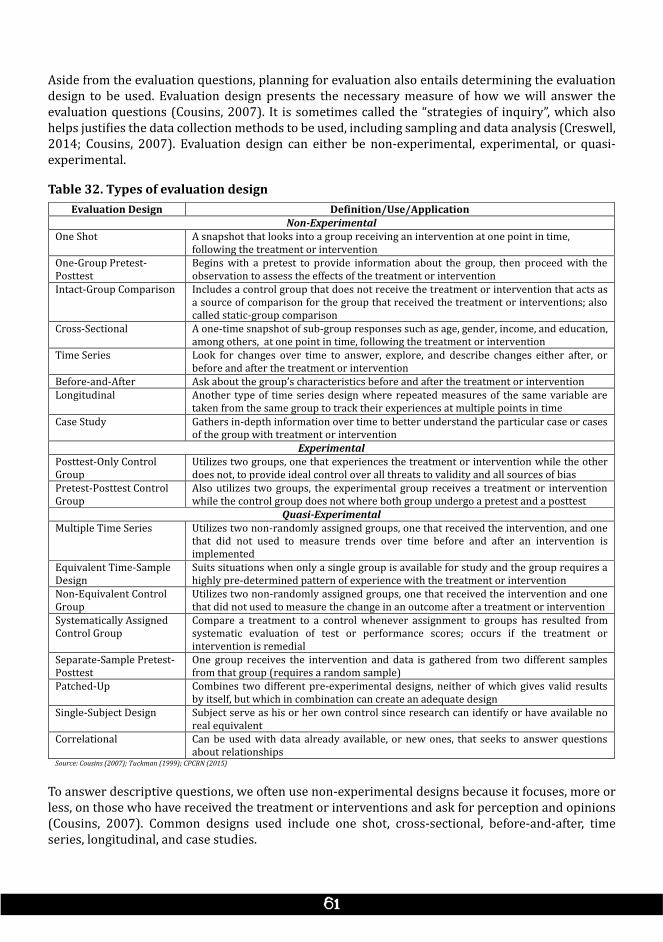
Aside from the evaluation questions, planning for evaluation also entails determining the evaluation design to be used. Evaluation design presents the necessary measure of how we will answer the evaluation questions (Cousins, 2007). It is sometimes called the “strategies of inquiry”, which also helps justifies the data collection methods to be used, including sampling and data analysis (Creswell, 2014; Cousins, 2007). Evaluation design can either be non-experimental, experimental, or quasi-experimental.
Table 32. Types of evaluation designEvaluation Design Definition/Use/Application
Non-Experimental One Shot A snapshot that looks into a group receiving an intervention at one point in time,
following the treatment or intervention One-Group Pretest-Posttest
Begins with a pretest to provide information about the group, then proceed with the observation to assess the effects of the treatment or intervention
Intact-Group Comparison Includes a control group that does not receive the treatment or intervention that acts as a source of comparison for the group that received the treatment or interventions; also called static-group comparison
Cross-Sectional A one-time snapshot of sub-group responses such as age, gender, income, and education, among others, at one point in time, following the treatment or intervention
Time Series Look for changes over time to answer, explore, and describe changes either after, or before and after the treatment or intervention
Before-and-After Ask about the group’s characteristics before and after the treatment or intervention Longitudinal Another type of time series design where repeated measures of the same variable are
taken from the same group to track their experiences at multiple points in time Case Study Gathers in-depth information over time to better understand the particular case or cases
of the group with treatment or intervention Experimental
Posttest-Only Control Group
Utilizes two groups, one that experiences the treatment or intervention while the other does not, to provide ideal control over all threats to validity and all sources of bias
Pretest-Posttest Control Group
Also utilizes two groups, the experimental group receives a treatment or intervention while the control group does not where both group undergo a pretest and a posttest
Quasi-Experimental Multiple Time Series Utilizes two non-randomly assigned groups, one that received the intervention, and one
that did not used to measure trends over time before and after an intervention is implemented
Equivalent Time-Sample Design
Suits situations when only a single group is available for study and the group requires a highly pre-determined pattern of experience with the treatment or intervention
Non-Equivalent Control Group
Utilizes two non-randomly assigned groups, one that received the intervention and one that did not used to measure the change in an outcome after a treatment or intervention
Systematically Assigned Control Group
Compare a treatment to a control whenever assignment to groups has resulted from systematic evaluation of test or performance scores; occurs if the treatment or intervention is remedial
Separate-Sample Pretest-Posttest
One group receives the intervention and data is gathered from two different samples from that group (requires a random sample)
Patched-Up Combines two different pre-experimental designs, neither of which gives valid results by itself, but which in combination can create an adequate design
Single-Subject Design Subject serve as his or her own control since research can identify or have available no real equivalent
Correlational Can be used with data already available, or new ones, that seeks to answer questions about relationships
Source: Cousins (2007); Tuckman (1999); CPCRN (2015)
To answer descriptive questions, we often use non-experimental designs because it focuses, more or less, on those who have received the treatment or interventions and ask for perception and opinions (Cousins, 2007). Common designs used include one shot, cross-sectional, before-and-after, time series, longitudinal, and case studies.
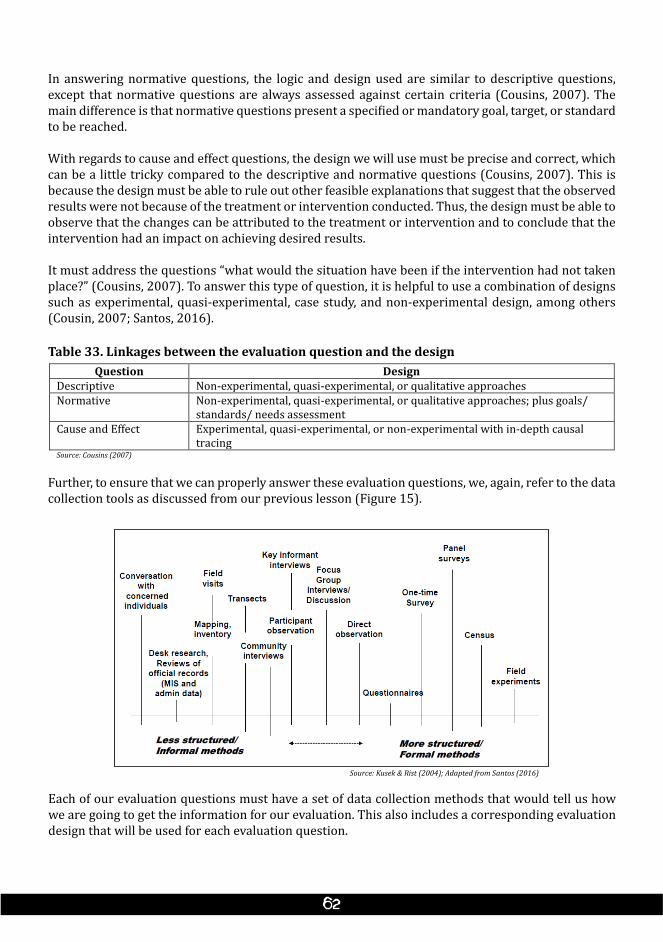
In answering normative questions, the logic and design used are similar to descriptive questions, except that normative questions are always assessed against certain criteria (Cousins, 2007). The main difference is that normative questions present a specified or mandatory goal, target, or standard to be reached.
With regards to cause and effect questions, the design we will use must be precise and correct, which can be a little tricky compared to the descriptive and normative questions (Cousins, 2007). This is because the design must be able to rule out other feasible explanations that suggest that the observed results were not because of the treatment or intervention conducted. Thus, the design must be able to observe that the changes can be attributed to the treatment or intervention and to conclude that the intervention had an impact on achieving desired results.
It must address the questions “what would the situation have been if the intervention had not taken place?” (Cousins, 2007). To answer this type of question, it is helpful to use a combination of designs such as experimental, quasi-experimental, case study, and non-experimental design, among others (Cousin, 2007; Santos, 2016).
Table 33. Linkages between the evaluation question and the designQuestion Design
Descriptive Non-experimental, quasi-experimental, or qualitative approaches Normative Non-experimental, quasi-experimental, or qualitative approaches; plus goals/
standards/ needs assessment Cause and Effect Experimental, quasi-experimental, or non-experimental with in-depth causal
tracing Source: Cousins (2007)
Further, to ensure that we can properly answer these evaluation questions, we, again, refer to the data collection tools as discussed from our previous lesson (Figure 15).
Each of our evaluation questions must have a set of data collection methods that would tell us how we are going to get the information for our evaluation. This also includes a corresponding evaluation design that will be used for each evaluation question.
Source: Kusek & Rist (2004); Adapted from Santos (2016)
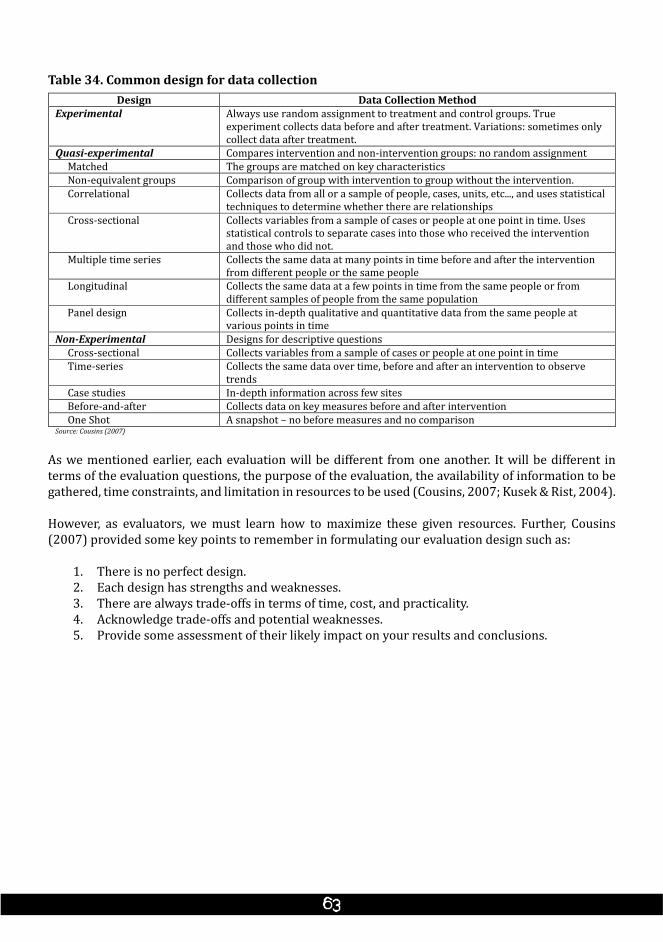
Table 34. Common design for data collectionDesign Data Collection Method
Experimental Always use random assignment to treatment and control groups. True experiment collects data before and after treatment. Variations: sometimes only collect data after treatment.
Quasi-experimental Compares intervention and non-intervention groups: no random assignment Matched The groups are matched on key characteristics Non-equivalent groups Comparison of group with intervention to group without the intervention. Correlational Collects data from all or a sample of people, cases, units, etc..., and uses statistical
techniques to determine whether there are relationships Cross-sectional Collects variables from a sample of cases or people at one point in time. Uses
statistical controls to separate cases into those who received the intervention and those who did not.
Multiple time series Collects the same data at many points in time before and after the intervention from different people or the same people
Longitudinal Collects the same data at a few points in time from the same people or from different samples of people from the same population
Panel design Collects in-depth qualitative and quantitative data from the same people at various points in time
Non-Experimental Designs for descriptive questions Cross-sectional Collects variables from a sample of cases or people at one point in time Time-series Collects the same data over time, before and after an intervention to observe
trends Case studies In-depth information across few sites Before-and-after Collects data on key measures before and after intervention One Shot A snapshot – no before measures and no comparison Source: Cousins (2007)
As we mentioned earlier, each evaluation will be different from one another. It will be different in terms of the evaluation questions, the purpose of the evaluation, the availability of information to be gathered, time constraints, and limitation in resources to be used (Cousins, 2007; Kusek & Rist, 2004).
However, as evaluators, we must learn how to maximize these given resources. Further, Cousins (2007) provided some key points to remember in formulating our evaluation design such as:
1. There is no perfect design.2. Each design has strengths and weaknesses.3. There are always trade-offs in terms of time, cost, and practicality.4. Acknowledge trade-offs and potential weaknesses.5. Provide some assessment of their likely impact on your results and conclusions.
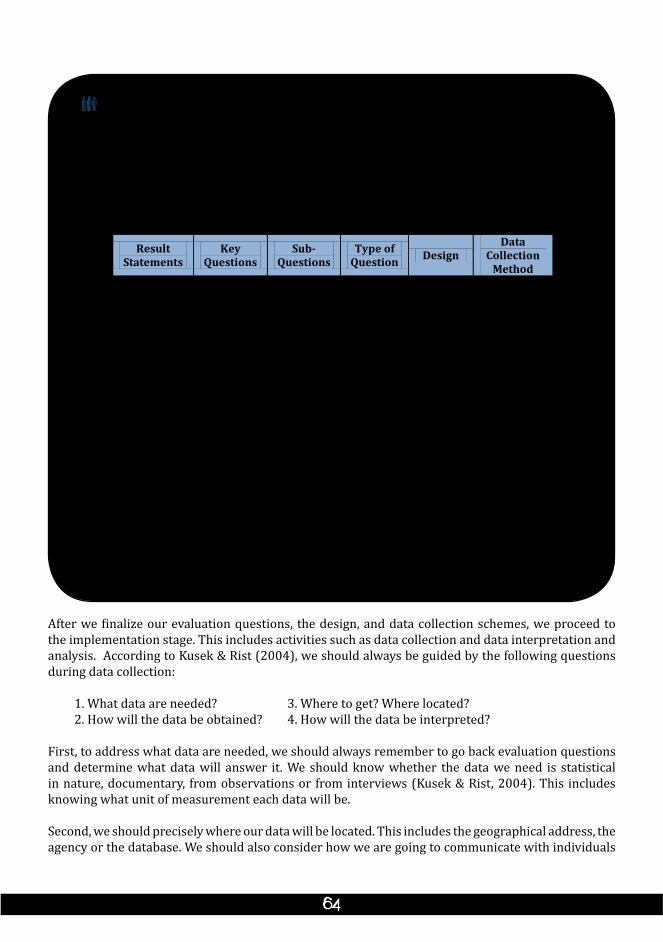
WORKSHOP 5Title: “Formulate Your Evaluation Questions”Time Allotment: 4 hoursMaterials Needed: Laptop, projector
Workshop mechanics:1. Show the participants a slide of the instructions for the workshop saying:
“Formulate your evaluation questions using the RBME performance framework as reference. Use this format.
Make sure that you identify the type of questions your group enumerated, the design, and data collection method needed to answer the evaluation questions. Remember to connect the evaluation questions to our result indicators.”
2. Inform them that they will have to formulate evaluation questions with respect to their result statements and indicators. Give them 3 hours to do the workshop.
3. Have each group present their outputs one by one. Give them 10 minutes each to present their workshop output.4. Encourage the participants to provide comments and observations regarding the group outputs.5. Provide comments and additional insights about the formulation of evaluation questions.
Processing based on workshop mechanics:1. Do you agree that evaluation questions provide structure and reflects the focus of our evaluation? (Possible answer:
Yes)2. How do we used ensure that the evaluation questions we identify are appropriate? (Possible answer: We always
refer to the context of the evaluation. This refers to the purpose of evaluation, type of evaluation, and intended users, among others.)
Key Concepts:• Evaluation questions make it easier to decide what evaluation design will be used, what data will be collected, how
to analyze and report it.• Evaluation questions must answer how our result statements came about with regards to the set evaluation criteria
used.
Result Statements
Key Questions
Sub-Questions
Type of Question Design
Data Collection
Method
After we finalize our evaluation questions, the design, and data collection schemes, we proceed to the implementation stage. This includes activities such as data collection and data interpretation and analysis. According to Kusek & Rist (2004), we should always be guided by the following questions during data collection:
1. What data are needed? 3. Where to get? Where located?2. How will the data be obtained? 4. How will the data be interpreted?
First, to address what data are needed, we should always remember to go back evaluation questions and determine what data will answer it. We should know whether the data we need is statistical in nature, documentary, from observations or from interviews (Kusek & Rist, 2004). This includes knowing what unit of measurement each data will be.
Second, we should precisely where our data will be located. This includes the geographical address, the agency or the database. We should also consider how we are going to communicate with individuals
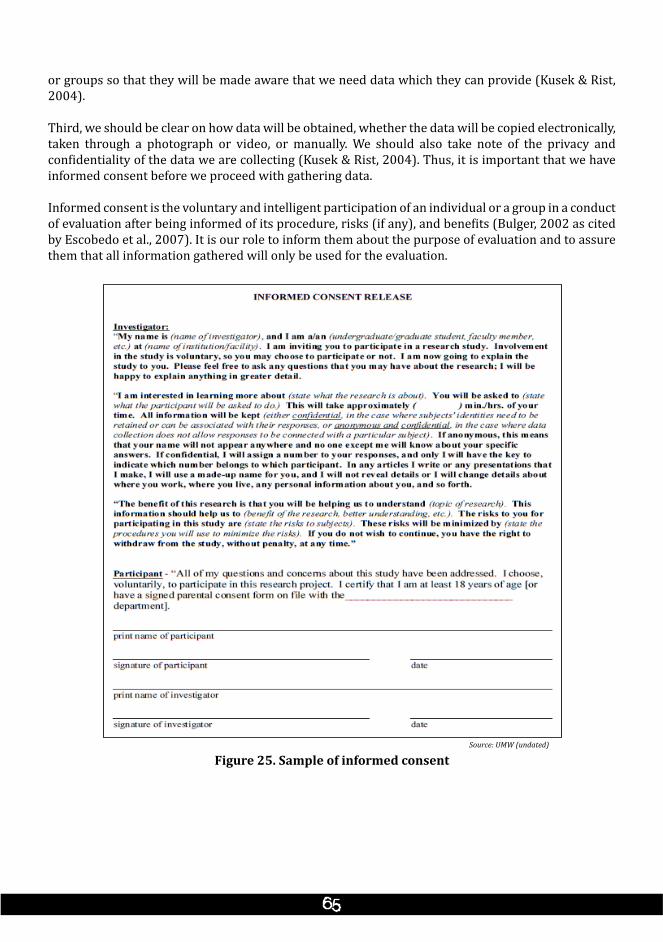
or groups so that they will be made aware that we need data which they can provide (Kusek & Rist, 2004).
Third, we should be clear on how data will be obtained, whether the data will be copied electronically, taken through a photograph or video, or manually. We should also take note of the privacy and confidentiality of the data we are collecting (Kusek & Rist, 2004). Thus, it is important that we have informed consent before we proceed with gathering data.
Informed consent is the voluntary and intelligent participation of an individual or a group in a conduct of evaluation after being informed of its procedure, risks (if any), and benefits (Bulger, 2002 as cited by Escobedo et al., 2007). It is our role to inform them about the purpose of evaluation and to assure them that all information gathered will only be used for the evaluation.
Figure 25. Sample of informed consentSource: UMW (undated)
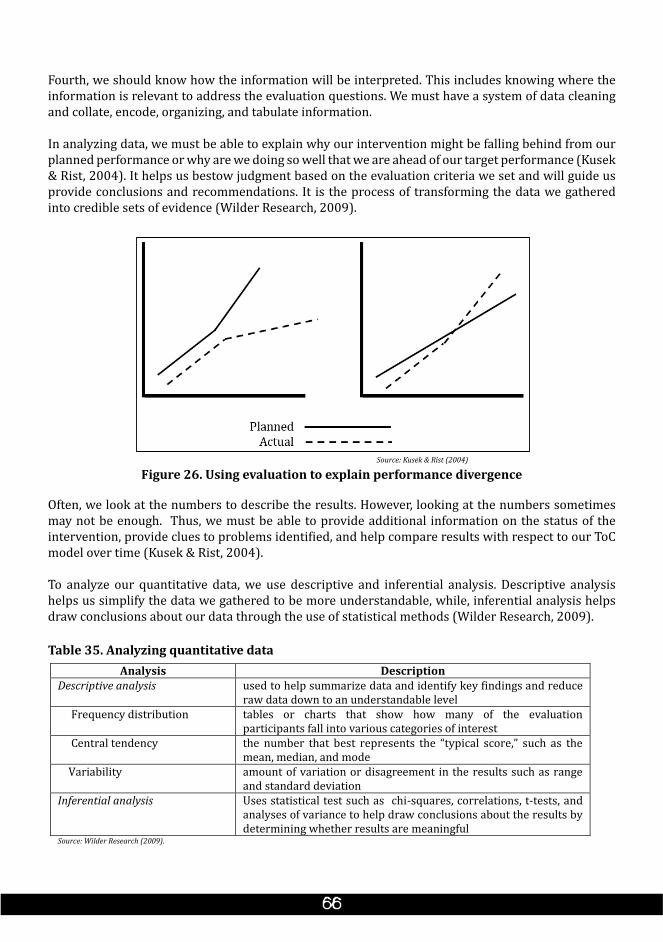
Fourth, we should know how the information will be interpreted. This includes knowing where the information is relevant to address the evaluation questions. We must have a system of data cleaning and collate, encode, organizing, and tabulate information.
In analyzing data, we must be able to explain why our intervention might be falling behind from our planned performance or why are we doing so well that we are ahead of our target performance (Kusek & Rist, 2004). It helps us bestow judgment based on the evaluation criteria we set and will guide us provide conclusions and recommendations. It is the process of transforming the data we gathered into credible sets of evidence (Wilder Research, 2009).
Figure 26. Using evaluation to explain performance divergenceSource: Kusek & Rist (2004)
Often, we look at the numbers to describe the results. However, looking at the numbers sometimes may not be enough. Thus, we must be able to provide additional information on the status of the intervention, provide clues to problems identified, and help compare results with respect to our ToC model over time (Kusek & Rist, 2004).
To analyze our quantitative data, we use descriptive and inferential analysis. Descriptive analysis helps us simplify the data we gathered to be more understandable, while, inferential analysis helps draw conclusions about our data through the use of statistical methods (Wilder Research, 2009).
Table 35. Analyzing quantitative dataAnalysis Description
Descriptive analysis used to help summarize data and identify key findings and reduce raw data down to an understandable level
Frequency distribution tables or charts that show how many of the evaluation participants fall into various categories of interest
Central tendency
the number that best represents the “typical score,” such as the mean, median, and mode
Variability amount of variation or disagreement in the results such as range and standard deviation
Inferential analysis Uses statistical test such as chi-squares, correlations, t-tests, and analyses of variance to help draw conclusions about the results by determining whether results are meaningful
Source: Wilder Research (2009).
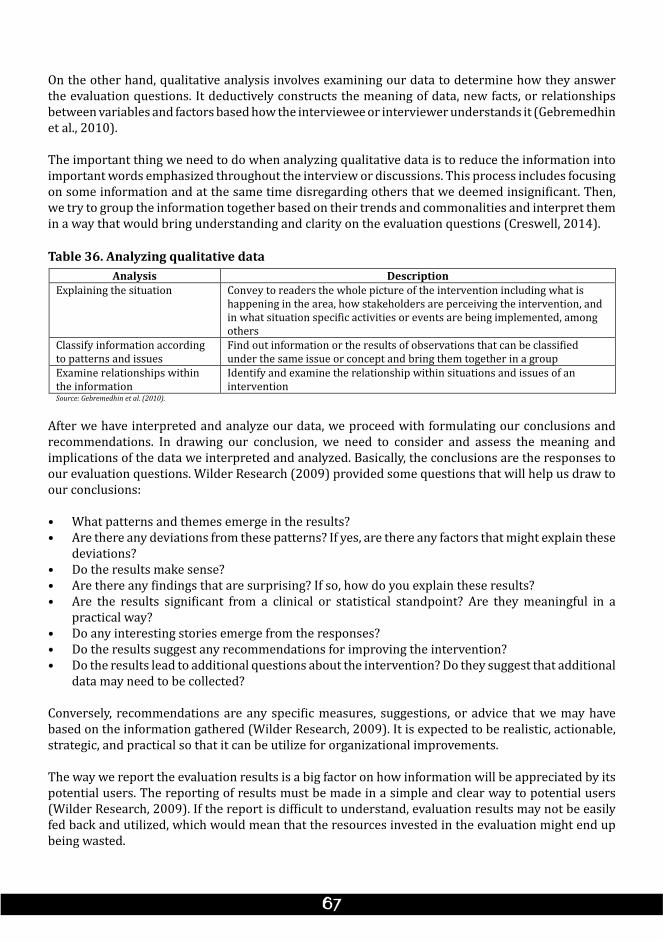
On the other hand, qualitative analysis involves examining our data to determine how they answer the evaluation questions. It deductively constructs the meaning of data, new facts, or relationships between variables and factors based how the interviewee or interviewer understands it (Gebremedhin et al., 2010).
The important thing we need to do when analyzing qualitative data is to reduce the information into important words emphasized throughout the interview or discussions. This process includes focusing on some information and at the same time disregarding others that we deemed insignificant. Then, we try to group the information together based on their trends and commonalities and interpret them in a way that would bring understanding and clarity on the evaluation questions (Creswell, 2014).
Table 36. Analyzing qualitative dataAnalysis Description
Explaining the situation Convey to readers the whole picture of the intervention including what is happening in the area, how stakeholders are perceiving the intervention, and in what situation specific activities or events are being implemented, among others
Classify information according to patterns and issues
Find out information or the results of observations that can be classified under the same issue or concept and bring them together in a group
Examine relationships within the information
Identify and examine the relationship within situations and issues of an intervention
Source: Gebremedhin et al. (2010).
After we have interpreted and analyze our data, we proceed with formulating our conclusions and recommendations. In drawing our conclusion, we need to consider and assess the meaning and implications of the data we interpreted and analyzed. Basically, the conclusions are the responses to our evaluation questions. Wilder Research (2009) provided some questions that will help us draw to our conclusions:
• What patterns and themes emerge in the results?• Are there any deviations from these patterns? If yes, are there any factors that might explain these
deviations? • Do the results make sense?• Are there any findings that are surprising? If so, how do you explain these results?• Are the results significant from a clinical or statistical standpoint? Are they meaningful in a
practical way?• Do any interesting stories emerge from the responses?• Do the results suggest any recommendations for improving the intervention?• Do the results lead to additional questions about the intervention? Do they suggest that additional
data may need to be collected?
Conversely, recommendations are any specific measures, suggestions, or advice that we may have based on the information gathered (Wilder Research, 2009). It is expected to be realistic, actionable, strategic, and practical so that it can be utilize for organizational improvements.
The way we report the evaluation results is a big factor on how information will be appreciated by its potential users. The reporting of results must be made in a simple and clear way to potential users (Wilder Research, 2009). If the report is difficult to understand, evaluation results may not be easily fed back and utilized, which would mean that the resources invested in the evaluation might end up being wasted.
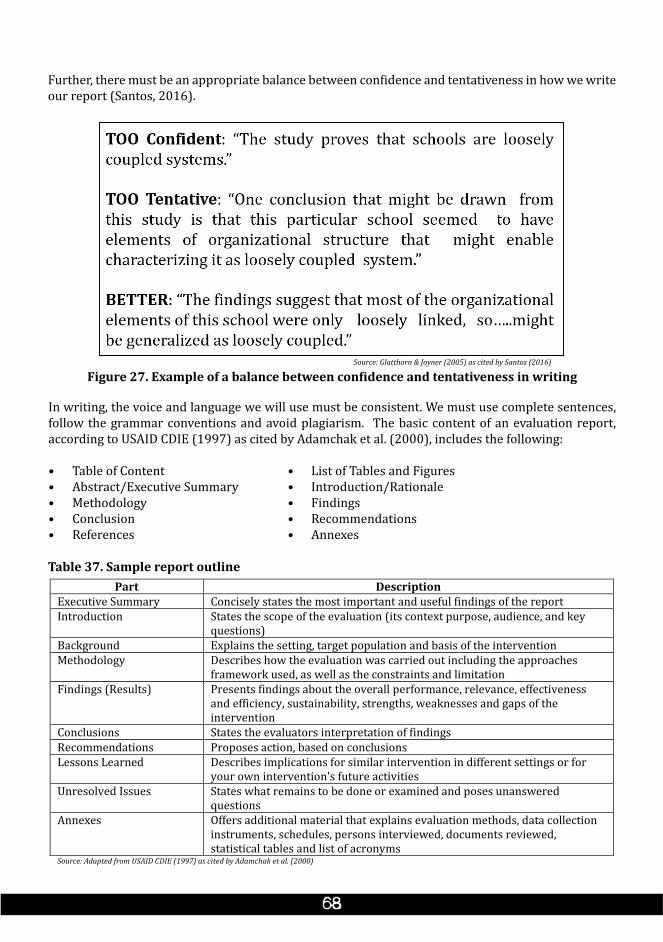
Figure 27. Example of a balance between confidence and tentativeness in writingSource: Glatthorn & Joyner (2005) as cited by Santos (2016)
In writing, the voice and language we will use must be consistent. We must use complete sentences, follow the grammar conventions and avoid plagiarism. The basic content of an evaluation report, according to USAID CDIE (1997) as cited by Adamchak et al. (2000), includes the following:
• Table of Content • List of Tables and Figures• Abstract/Executive Summary • Introduction/Rationale • Methodology • Findings• Conclusion • Recommendations• References • Annexes
Table 37. Sample report outlinePart Description
Executive Summary Concisely states the most important and useful findings of the report Introduction States the scope of the evaluation (its context purpose, audience, and key
questions) Background Explains the setting, target population and basis of the intervention Methodology Describes how the evaluation was carried out including the approaches
framework used, as well as the constraints and limitation Findings (Results) Presents findings about the overall performance, relevance, effectiveness
and efficiency, sustainability, strengths, weaknesses and gaps of the intervention
Conclusions States the evaluators interpretation of findings Recommendations Proposes action, based on conclusions Lessons Learned Describes implications for similar intervention in different settings or for
your own intervention's future activities Unresolved Issues States what remains to be done or examined and poses unanswered
questions Annexes Offers additional material that explains evaluation methods, data collection
instruments, schedules, persons interviewed, documents reviewed, statistical tables and list of acronyms
Source: Adapted from USAID CDIE (1997) as cited by Adamchak et al. (2000)
Further, there must be an appropriate balance between confidence and tentativeness in how we write our report (Santos, 2016).
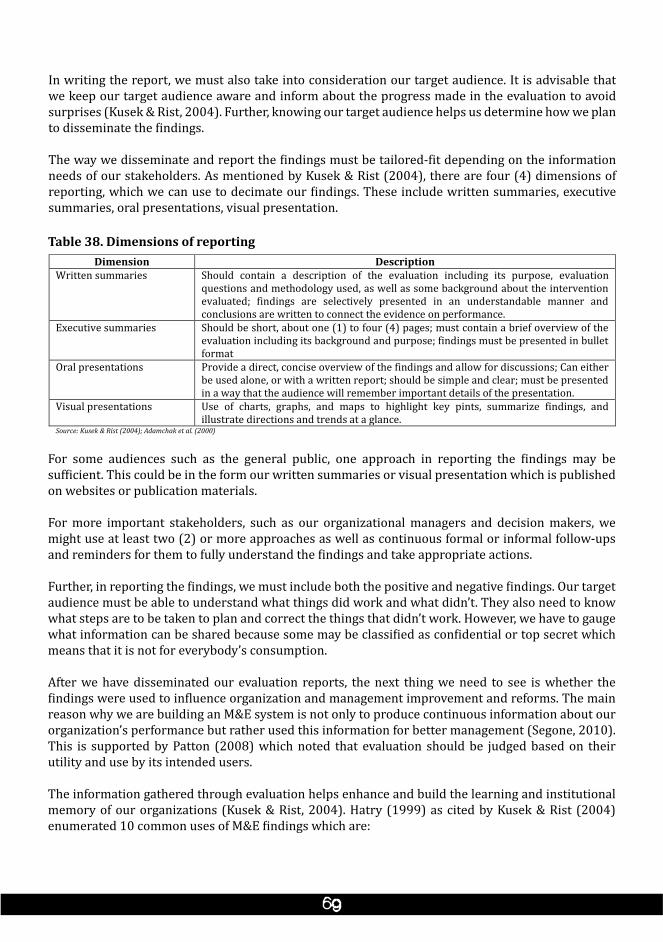
In writing the report, we must also take into consideration our target audience. It is advisable that we keep our target audience aware and inform about the progress made in the evaluation to avoid surprises (Kusek & Rist, 2004). Further, knowing our target audience helps us determine how we plan to disseminate the findings.
The way we disseminate and report the findings must be tailored-fit depending on the information needs of our stakeholders. As mentioned by Kusek & Rist (2004), there are four (4) dimensions of reporting, which we can use to decimate our findings. These include written summaries, executive summaries, oral presentations, visual presentation.
Table 38. Dimensions of reportingDimension Description
Written summaries Should contain a description of the evaluation including its purpose, evaluation questions and methodology used, as well as some background about the intervention evaluated; findings are selectively presented in an understandable manner and conclusions are written to connect the evidence on performance.
Executive summaries Should be short, about one (1) to four (4) pages; must contain a brief overview of the evaluation including its background and purpose; findings must be presented in bullet format
Oral presentations Provide a direct, concise overview of the findings and allow for discussions; Can either be used alone, or with a written report; should be simple and clear; must be presented in a way that the audience will remember important details of the presentation.
Visual presentations Use of charts, graphs, and maps to highlight key pints, summarize findings, and illustrate directions and trends at a glance.
Source: Kusek & Rist (2004); Adamchak et al. (2000)
For some audiences such as the general public, one approach in reporting the findings may be sufficient. This could be in the form our written summaries or visual presentation which is published on websites or publication materials.
For more important stakeholders, such as our organizational managers and decision makers, we might use at least two (2) or more approaches as well as continuous formal or informal follow-ups and reminders for them to fully understand the findings and take appropriate actions.
Further, in reporting the findings, we must include both the positive and negative findings. Our target audience must be able to understand what things did work and what didn’t. They also need to know what steps are to be taken to plan and correct the things that didn’t work. However, we have to gauge what information can be shared because some may be classified as confidential or top secret which means that it is not for everybody’s consumption.
After we have disseminated our evaluation reports, the next thing we need to see is whether the findings were used to influence organization and management improvement and reforms. The main reason why we are building an M&E system is not only to produce continuous information about our organization’s performance but rather used this information for better management (Segone, 2010). This is supported by Patton (2008) which noted that evaluation should be judged based on their utility and use by its intended users.
The information gathered through evaluation helps enhance and build the learning and institutional memory of our organizations (Kusek & Rist, 2004). Hatry (1999) as cited by Kusek & Rist (2004) enumerated 10 common uses of M&E findings which are:
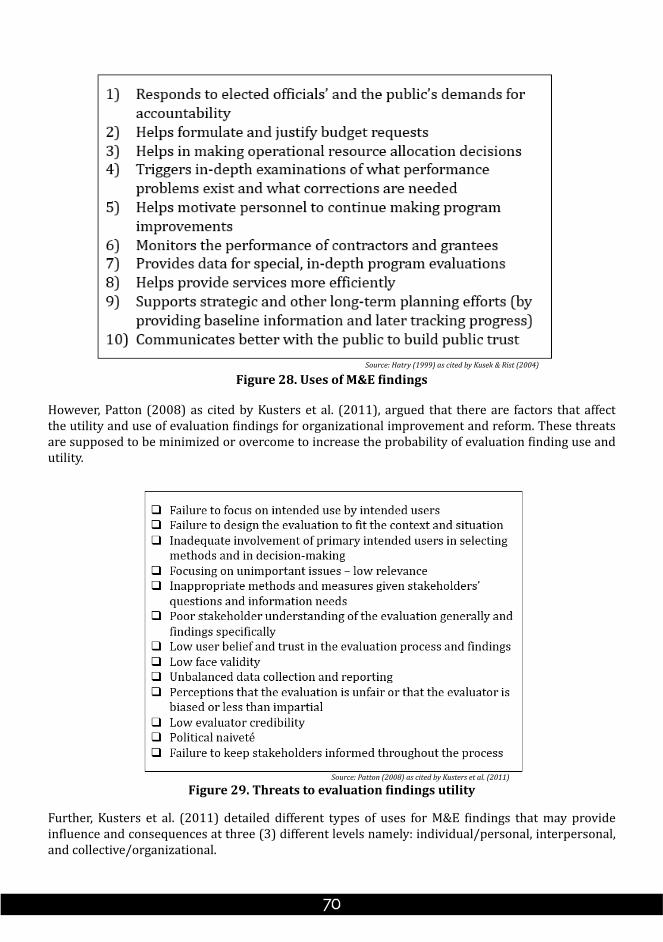
Figure 28. Uses of M&E findingsSource: Hatry (1999) as cited by Kusek & Rist (2004)
However, Patton (2008) as cited by Kusters et al. (2011), argued that there are factors that affect the utility and use of evaluation findings for organizational improvement and reform. These threats are supposed to be minimized or overcome to increase the probability of evaluation finding use and utility.
Figure 29. Threats to evaluation findings utilitySource: Patton (2008) as cited by Kusters et al. (2011)
Further, Kusters et al. (2011) detailed different types of uses for M&E findings that may provide influence and consequences at three (3) different levels namely: individual/personal, interpersonal, and collective/organizational.
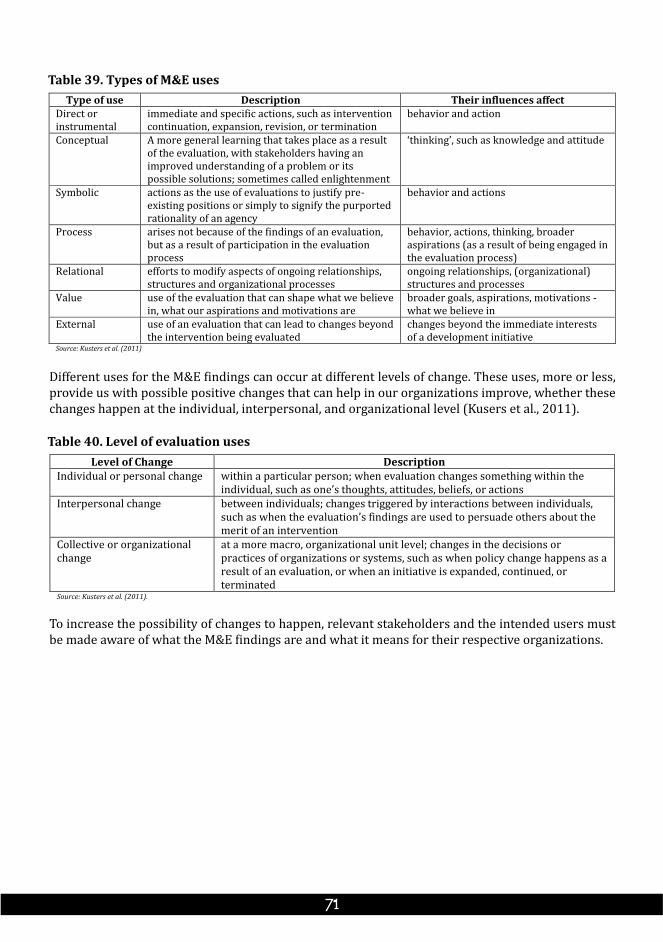
Table 39. Types of M&E usesType of use Description Their influences affect
Direct or instrumental
immediate and specific actions, such as intervention continuation, expansion, revision, or termination
behavior and action
Conceptual A more general learning that takes place as a result of the evaluation, with stakeholders having an improved understanding of a problem or its possible solutions; sometimes called enlightenment
‘thinking’, such as knowledge and attitude
Symbolic actions as the use of evaluations to justify pre-existing positions or simply to signify the purported rationality of an agency
behavior and actions
Process arises not because of the findings of an evaluation, but as a result of participation in the evaluation process
behavior, actions, thinking, broader aspirations (as a result of being engaged in the evaluation process)
Relational efforts to modify aspects of ongoing relationships, structures and organizational processes
ongoing relationships, (organizational) structures and processes
Value use of the evaluation that can shape what we believe in, what our aspirations and motivations are
broader goals, aspirations, motivations - what we believe in
External use of an evaluation that can lead to changes beyond the intervention being evaluated
changes beyond the immediate interests of a development initiative
Source: Kusters et al. (2011)
Table 40. Level of evaluation usesLevel of Change Description
Individual or personal change within a particular person; when evaluation changes something within the individual, such as one’s thoughts, attitudes, beliefs, or actions
Interpersonal change between individuals; changes triggered by interactions between individuals, such as when the evaluation’s findings are used to persuade others about the merit of an intervention
Collective or organizational change
at a more macro, organizational unit level; changes in the decisions or practices of organizations or systems, such as when policy change happens as a result of an evaluation, or when an initiative is expanded, continued, or terminated
Source: Kusters et al. (2011).
Different uses for the M&E findings can occur at different levels of change. These uses, more or less, provide us with possible positive changes that can help in our organizations improve, whether these changes happen at the individual, interpersonal, and organizational level (Kusers et al., 2011).
To increase the possibility of changes to happen, relevant stakeholders and the intended users must be made aware of what the M&E findings are and what it means for their respective organizations.
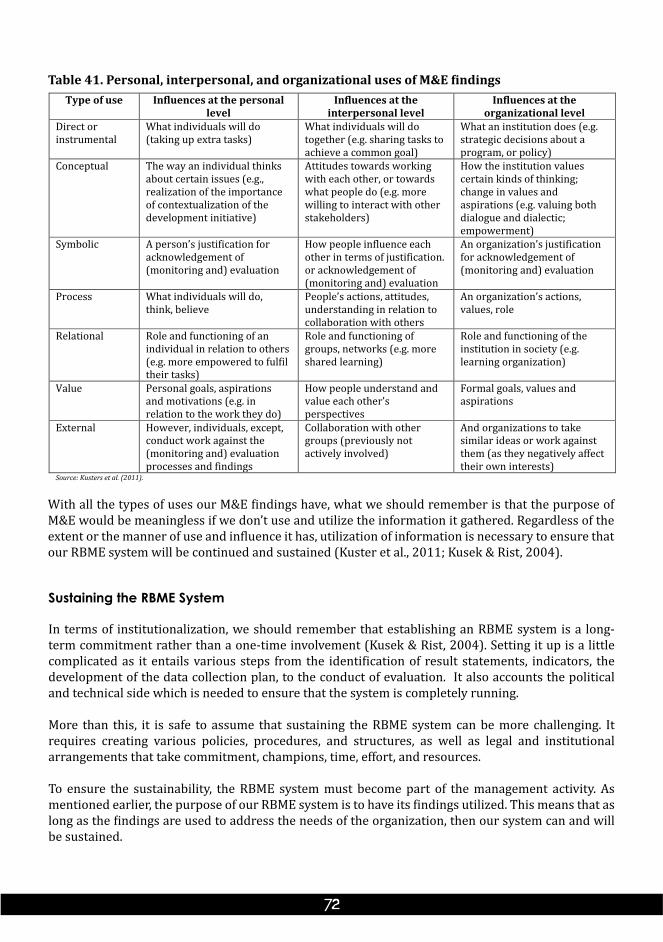
Table 41. Personal, interpersonal, and organizational uses of M&E findingsType of use Influences at the personal
level Influences at the
interpersonal level Influences at the
organizational level Direct or instrumental
What individuals will do (taking up extra tasks)
What individuals will do together (e.g. sharing tasks to achieve a common goal)
What an institution does (e.g. strategic decisions about a program, or policy)
Conceptual The way an individual thinks about certain issues (e.g., realization of the importance of contextualization of the development initiative)
Attitudes towards working with each other, or towards what people do (e.g. more willing to interact with other stakeholders)
How the institution values certain kinds of thinking; change in values and aspirations (e.g. valuing both dialogue and dialectic; empowerment)
Symbolic A person’s justification for acknowledgement of (monitoring and) evaluation
How people influence each other in terms of justification. or acknowledgement of (monitoring and) evaluation
An organization’s justification for acknowledgement of (monitoring and) evaluation
Process What individuals will do, think, believe
People’s actions, attitudes, understanding in relation to collaboration with others
An organization’s actions, values, role
Relational Role and functioning of an individual in relation to others (e.g. more empowered to fulfil their tasks)
Role and functioning of groups, networks (e.g. more shared learning)
Role and functioning of the institution in society (e.g. learning organization)
Value Personal goals, aspirations and motivations (e.g. in relation to the work they do)
How people understand and value each other’s perspectives
Formal goals, values and aspirations
External However, individuals, except, conduct work against the (monitoring and) evaluation processes and findings
Collaboration with other groups (previously not actively involved)
And organizations to take similar ideas or work against them (as they negatively affect their own interests)
Source: Kusters et al. (2011).
With all the types of uses our M&E findings have, what we should remember is that the purpose of M&E would be meaningless if we don’t use and utilize the information it gathered. Regardless of the extent or the manner of use and influence it has, utilization of information is necessary to ensure that our RBME system will be continued and sustained (Kuster et al., 2011; Kusek & Rist, 2004).
Sustaining the RBME System
In terms of institutionalization, we should remember that establishing an RBME system is a long-term commitment rather than a one-time involvement (Kusek & Rist, 2004). Setting it up is a little complicated as it entails various steps from the identification of result statements, indicators, the development of the data collection plan, to the conduct of evaluation. It also accounts the political and technical side which is needed to ensure that the system is completely running.
More than this, it is safe to assume that sustaining the RBME system can be more challenging. It requires creating various policies, procedures, and structures, as well as legal and institutional arrangements that take commitment, champions, time, effort, and resources.
To ensure the sustainability, the RBME system must become part of the management activity. As mentioned earlier, the purpose of our RBME system is to have its findings utilized. This means that as long as the findings are used to address the needs of the organization, then our system can and will be sustained.
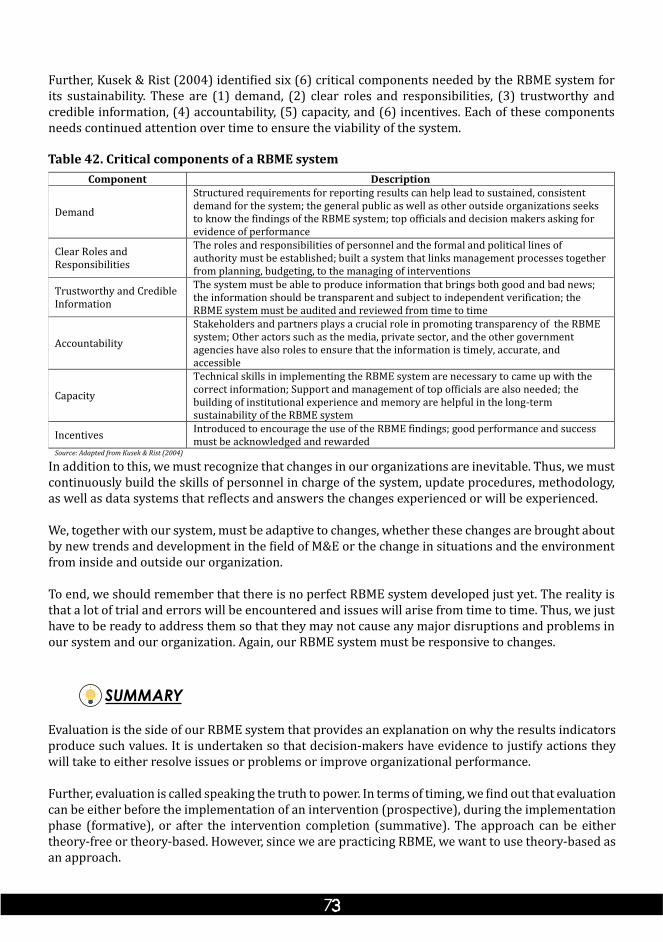
Table 42. Critical components of a RBME systemComponent Description
Demand Structured requirements for reporting results can help lead to sustained, consistent demand for the system; the general public as well as other outside organizations seeks to know the findings of the RBME system; top officials and decision makers asking for evidence of performance
Clear Roles and Responsibilities
The roles and responsibilities of personnel and the formal and political lines of authority must be established; built a system that links management processes together from planning, budgeting, to the managing of interventions
Trustworthy and Credible Information
The system must be able to produce information that brings both good and bad news; the information should be transparent and subject to independent verification; the RBME system must be audited and reviewed from time to time
Accountability Stakeholders and partners plays a crucial role in promoting transparency of the RBME system; Other actors such as the media, private sector, and the other government agencies have also roles to ensure that the information is timely, accurate, and accessible
Capacity Technical skills in implementing the RBME system are necessary to came up with the correct information; Support and management of top officials are also needed; the building of institutional experience and memory are helpful in the long-term sustainability of the RBME system
Incentives Introduced to encourage the use of the RBME findings; good performance and success must be acknowledged and rewarded
Source: Adapted from Kusek & Rist (2004)
In addition to this, we must recognize that changes in our organizations are inevitable. Thus, we must continuously build the skills of personnel in charge of the system, update procedures, methodology, as well as data systems that reflects and answers the changes experienced or will be experienced.
We, together with our system, must be adaptive to changes, whether these changes are brought about by new trends and development in the field of M&E or the change in situations and the environment from inside and outside our organization.
To end, we should remember that there is no perfect RBME system developed just yet. The reality is that a lot of trial and errors will be encountered and issues will arise from time to time. Thus, we just have to be ready to address them so that they may not cause any major disruptions and problems in our system and our organization. Again, our RBME system must be responsive to changes.
SUMMARY
Evaluation is the side of our RBME system that provides an explanation on why the results indicators produce such values. It is undertaken so that decision-makers have evidence to justify actions they will take to either resolve issues or problems or improve organizational performance.
Further, evaluation is called speaking the truth to power. In terms of timing, we find out that evaluation can be either before the implementation of an intervention (prospective), during the implementation phase (formative), or after the intervention completion (summative). The approach can be either theory-free or theory-based. However, since we are practicing RBME, we want to use theory-based as an approach.
Further, Kusek & Rist (2004) identified six (6) critical components needed by the RBME system for its sustainability. These are (1) demand, (2) clear roles and responsibilities, (3) trustworthy and credible information, (4) accountability, (5) capacity, and (6) incentives. Each of these components needs continued attention over time to ensure the viability of the system.
We also learned that evaluation undergoes three (3) main stages namely: planning, implementation, and reporting. In the planning stage, we decide on what type of evaluation we will conduct, what evaluation questions we want to answer, and what evaluation design will be used to answer each question.
The implementation stage includes the conduct of data collection as well as the data interpretation and analysis. Data interpretation and analysis can be quantitative or qualitative in nature depending on our evaluation questions. Then, in terms of the reporting, we learn that evaluation reports are formatted and packaged formally and disseminated to all its intended users as well as other stakeholders.
Another learning we had is that evaluation can be conducted either internally or externally. Internal or in-house evaluation is the evaluation handle by individuals within our organizations while external or independent evaluation refers to evaluations being conducted by commissioned individuals outside our organizations.
Lastly, we learned that the sustainability of our RBME system depends on how we use and utilize the findings we have gathered. There must be a continuous capacity building of personnel involved in the system as well as the establishment of procedures, methodology, and process to ensure smooth and proper implementation.
Further, we must be able to adapt to the changes happening not only inside our organizations but also to the outside environment. This is to ensure that our RBME system is not only a short-term periodic thing but rather a long-term mechanism embedded in how our organization works.
SELF-ASSESSMENT QUESTIONS (SAQs)
1. It refers to the knowledge constructed based on empirical and meticulous consideration of information about a phenomenon that are organized to prove, falsify, or support a particular argument, allegation of truth, or claim of standard or idea. (evidence)
2. Give three (3) types of evaluation. (performance logic chain assessment, pre-implementation assessment, process implementation evaluation, rapid appraisal, case study, impact evaluation, or meta-evaluation)
3. It directs the process of evaluation from the collection of data leading to evidence. (evaluation questions)
4. Enumerate the five (5) OECD-DAC criteria. (relevance, efficiency, effectiveness, sustainability, and impact)
5. Give the three (3) general types of evaluation design. (non-experimental, experimental, and quasi-experimental design)
SUPPLEMENTARY READINGS
Creswell, J.W. (2014). Research Design: Qualitative, Quantitative, and Mixed Methods Approaches. Fourth Edition. Sage Publications.Kusek, J.Z. & Rist, R.C. (2004). Ten Steps to a Results-Based Monitoring and Evaluation System. The World Bank. Washington, D.C.
ENDERTitle: “Share Your Lessons Learned”Time Allotment: 30 minutesMaterials Needed: Laptop, projector, metacards, pentel pens
Procedure:1. Ask the groups to write down three (3) mind blowing information they learned about RBME. (Ensure that all
materials needed are available.) Give them 15 minutes to do the activity.2. Have each group present their outputs. Give them 3 minutes each to present their outputs.3. Provide comments and additional insights about their outputs
Processing:1. Do you agree that the RBME provides a better way of measuring organizational performance rather than the
traditional way we do things? Why? (Possible answer: Yes, because it measure results rather than just mere inputs, activities, and outputs)
2. What are the topics that captured your attention? (Possible answers: difference of traditional M&E and RBME; theory of change model; identification of results indicators; crafting of evaluation questions)
Key Concepts:1. RBME is a relatively new trend that measures the results of our intervention and the real performance and success
of organizations.2. RBME is a management tool that provides evidences to help decision makers take actions for organizational
improvement or reforms.
Statement to End of lesson:With all the realization we had during this training, it is our hope that you will try to share all lessons learned here to your respective organizations and to push for the development a RBME system. Remember, RBME provides a perspective that searches for real results that came from our interventions. It goes beyond just showing off that we are busy with day to day work but rather helps answer the “so what” question. Thus, it is time that we know if all our blood, sweat and tears translated to positive some changes to our clients.
REFERENCES
Accountability. (2017). In Merriam-Webster.com. Retrieved July 27, 2017 from https://www.merriam-webster.com/dictionary/accountability.ADA. (2009). Guidelines for Project and Programme Evaluations. Evaluation Unit, Austrian Development Agency. Vienna, Austria. Retrieved August 24, 2017 from www.oecd.org/development/evaluation.Adamchak, S., Bond, K., MacLaren, L., Magnani, R., & Nelson, K. (2000). A Guide to Monitoring and Evaluating Adolescent Reproductive Health Programs. Tool Series No. 5. Washington, DC:PathfinderInternational.FOCUSonYoungAdults.ADB. (2012). Managing for Development Results – Relevance, Responsiveness, and Results Orientation.AsianDevelopmentBankIndependentEvaluationDepartment.Manila, Philippines.AHO(2015).Partnerships for Health.AfricanHealthObservatory.RetrievedJune17,2017 from https://www.aho.afro.who.int/en/blog/2015/03/24/partnerships-health. Amerasinghe, N. (2015). Design Appraisal, and Management of Sustainable Development Project. AsianInstituteofManagement.MetroManila,Philippines.ATI.(2016).Excellence and Accountability in Extension: Technical Guidance Notes in the Monitoring and Evaluation of Agriculture and Fisheries Extension Program Performance. AgriculturalTrainingInstitute–PolicyandPlanningDivision.QuezonCity,Philippines.Bastia,T.(2000).QualitativeandQuantitativeIndicatorsfortheMonitoringandEvaluationofthe ILOGenderMainstreamingStrategy.InternationalLabourOrganization.Geneva.Bonbright, D. (2012). Use of Impact Evaluation Results.InterAction.RetrievedAugust18,2017 from www.interaction.org/impact-evaluation-notes. CIDA.(1996). Guide to Gender-Sensitive Indicators.CanadianInternationalDevelopment Agency: Hull.Collins,J.&Porras,J.I.(1994).Built To Last: Successful Habits of Visionary Companies. Harper Collins Publishers.Cousins, J. B. (2007). Evaluation Report: The International Program for Development Evaluation Training.Ottawa:CentreforResearchonEducationalandCommunityServices,University ofOttawa.CPCRN. (2015) Evaluation Design, Evaluating Programs, Policy, Systems and Environmental Interventions. In Putting Public Health Evidence in Action Training Workshop. Cancer PreventionandControlResearchNetwork.RetrievedSeptember15,2017 from http://cpcrn.org/pub/evidence-in-action/.Creswell,J.W.(2014).ResearchDesign:Qualitative,Quantitative,andMixedMethods Approaches.FourthEdition.SagePublications.DelPrado,R.F.(2013).Managing for Results. Johns Hopkins Bloomberg School of Public Health.Destination Think (2017). Get Clear About Your New Year: 6 Steps to a Winning Strategic Plan. Destination Think. Retrieved June 15, 2017 from https://destinationthink.com/6-steps-to-a-winning-strategic-plan/.Drucker, P. (1954). The Practice of Management.FirstEdition.NewYork:Harper&Row.Escobedo,C.,Guerrero,J.,Lujan,G.,Ramirez,A.,&Serrano,D.(2007).Ethical Issues with Informed Consent.E-ZineJournal:YouthScientistsandtheEthicsofCurrentScience. Bio-EthicsIssue1.EuropeAidCooperationOffice.(2002).Project Cycle Management Handbook. European Commission.Freiburg,Germany.Finn,J.,&Jacobson,M.(2008).Just Practice: A Social Justice Approach to Social Work.Peosta,IL: EddieBowersPublishing.Gebremedhin,B.,Getachew,A.,&Amha,R.(2010).Results-Based Monitoring and Evaluation for Organizations Working in Agricultural Development: A Guide for Practitioners. InternationalLivestockResearchInstituteAddisAbaba,Ethiopia.
Gorgens,M.&Kusek,J.Z.(2009).Making Monitoring and Evaluation Systems Work: A Capacity Development Toolkit. World Bank. Washington, DC. Retrieved June 29, 2017 from www.worldbank.org/pdt.Hatry, H.P. (1999). Performance Measurement: Getting Results. Washington, DC: UrbanInstitutePress.Heider,C.(2016).Independent versus Self-evaluation: Is there a Place for Both?Independent EvaluationGroup,WorldBank.RetrievedSeptember26,2017 from www.ieg.worldbankgroup.org.Human Rights Resource Center. (2000). The Human Rights Education Handbook: Effective Practices for Learning, Action and Change. Human Rights Resource Center, University of Minnesota.Humanitarian Web. (2017). Project Cycle Management Using the Logical Framework Approach Training. Humanitarian Web. Retrieved September 7, 2017 from http://www.humanitarianweb.org/2017/07/20/project-cycle-management-using -the-logical-framework-approach-training/.Jacobson,M.,PruittChapin,K.,&Rugeley,C.(2009).TowardReconstructingPovertyKnowledge: AddressingFoodInsecuritythroughGrassrootsResearchDesignandImplementation. JournalofPoverty,13(1),1-19.Kusek, J.Z. & Rist, R.C. (2004). Ten Steps to a Results-Based Monitoring and Evaluation System. The World Bank. Washington, D.C.Kusters, C., Van Vugt, S., Wigboldus, S., Williams, B., Woodhill, J. (2011). Making Evaluation Matter: APracticalGuideforEvaluator.CentreforDevelopmentInnovation,Wageningen University & Research Centre, Wageningen, Netherlands. Laing, K. & Todd, L. (2015). Theory-Based Methodology: Using Theories of Change in Educational Development, Research and Evaluation. Research Centre for Learning and Teaching, NewcastleUniversity.Learning. (2017). In En.OxfordDictionaries.com. Retrieved July 27, 2017 from https://en.oxforddictionaries.com/definition/learning.McLeod, S. (2017). Qualitative vs. Quantitative. Simply Psychology. Retrieved September 19, 2017 from www.simplypsychology.org/qualitative-quantitative.html.McNamara,C.(2008).Overview of Methods to Collect Information. In Basic Guide to Program Evaluation.FreeManagementLibrary.Minneapolis,MN.Meier,W.(2003).Results-Based Management: Towards a Common Understanding among Development Cooperation Agencies.Results-BasedManagementGroup. Ottawa,Canada.OECD.(2002).Glossary of Key Terms in Evaluation and Results Based Management.Organization for Economic Cooperation and Development. Retrieved May 12, 2017 from www.oecd.org/dac/evaluation.OECD-DAC.(2005).Managing for Development Results Principles in Action: Sourcebook on Emerging Good Practice. DAC Working Party on Aid Effectiveness and Donor Practices Joint Venture on Managing for Development Results. Patton,M.Q.(undated).Trends in Evaluation.InOnlinee-LearningProgrammeonEmerging PracticesinDevelopmentEvaluations.UNICEFWebinar.RetrievedJune30,2017 from www.mymande.org.Patton,M.Q.(1997).Utilization Focused Evaluations.ThousandOaks,California:SagePublications.Patton,M.Q.(2008).Utilization Focused Evaluations.FourthEdition.ThousandOaks,California: Sage Publications.Pedhazur,E.J.&Schmelkin,L.P.(1991).Measurement, Design, and Analysis: An Integrated Approach.FirstEdition.Hillsdale,NJ:LawrenceErlbaumAssociates.Performance. (2017). In BusinessDictorinary.com.RetrievedJune13,2017 from http://www.businessdictionary.com/definition/performance.html.Prosper Canada. (undated). Preparing to Hire an Evaluation Professional.CentreforFinancial Literacy.RetrievedSeptember25,2016fromwww.prospercanada.org.Roberts, D., Khattri, N., & Wessal, A. (2011). Writing Terms of Reference for an Evaluation: A How-To Guide.IndependentEvaluationGroup,WorldBank.Washington,DC.
Russ-Eft, D., & Preskill, H. (2001). Evaluation in Organizations.NewYork:BasicBooks.Santos,R.B.(2016).10-Day Results-Based Evaluation Monitoring and Evaluation Training. PowerPointPresentation.AgriculturalTrainingInstitute,RuralDevelopmentEducation Center,QuezonCity.Schnackenberg, A.K. & Tomlinson, E.C. (2014). Organizational Transparency: A New Perspective on Managing Trust in Organization-Stakeholder Relationships. Journal of Management. Sage.Segone, M. (2010). From Policies to Results: Developing Capacities for Country Monitoring and Evaluation System.UNICEF.RetrievedMay12,2017fromwww.mymande.org.Success. (2017). In Merriam-Webster.com.RetrievedJune13,2017 from https://www.merriam-webster.com/dictionary/success.Suvedi,M.&Morford,S.(2003).Conducting Program and Project Evaluations: A Primer for Natural Resource Program Managers in British Columbia.ForestResearchandExtension Partnership. Kamloops, BC.Tuckman, B.W. (1999). Constructing Research Designs. In Conducting Educational Research.Fifth Edition.NewYork:HarcourtBraceCollegePublishers,pp.158-193.UMS. (undated). Informed Consent Release Form. University of Mary Washington. Retrieved September 20, 2017 from documents.umw.edu/document/appendix-c-informed-consent-release.UNDG.(2011).Results-Based Management Handbook: Harmonizing RBM Concepts and Approaches for Improved Development Results at Country Level. United Nations DevelopmentGroup.UNESCO.(2015).Results-Based Programming, Management, Monitoring and Reporting (RBM) Approach as Applied at UNESCO: Guiding Principles. United Nations Educational, Scientific,andCulturalOrganization.UNICEF.(2003).Understanding Results Based Programme Planning and Management: Tools to Reinforce Good Programming Practice.EvaluationOfficeandDivisionofPolicy andPlanning,UNICEF.Weiss, C. (1995). Nothing as Practical as Good Theory: Exploring Theory-Based Evaluation for Comprehensive Community Initiatives for Children and Families.InNewApproachesto EvaluatingCommunityInitiatives.AspenInstitute.White, H. (2009). Theory-Based Impact Evaluation: Principle and Practice.TheInternational InitiativeforImpactEvaluation.NewDelhi,India.Wilder Research. (2009). Analyzing and Interpreting Data. Wilder Research. Retrieved September 20, 2017 from www.evaluatod.org/assets/resources/evaluation-guides.World Bank. (2000). Designing and Building a Results-Based Monitoring and Evaluation System: A Tool for Public Sector Management.AWorkshopforGovernmentOfficialsandTheir Development Partners. World Bank. Washington, DC.